interest rate risk and the stock prices of financial ... the stock prices of financial institutions...
TRANSCRIPT

Interest Rate J3iskand the Stock Prices ofFinancial InstitutionsG. .1. Santoni
OST discussions of the effects of interest ratemovements on the portfolios of financial institutions
typically conclude that the relatively high and volatileinterest rates of the past 15 years have placed many ofthese institutions in jeopardy of failing. The consensusof many of these discussions is that institutions with“unbalanced” portfolios and low capital are partic-ularly susceptible to interest rate movements.’
The purpose of this paper is to analyze the effect ofinterest rate changes on the relative value of financialinstitutions.’ This issue is important not only to the
owners, managers and employees of financial institu-tions but to monetary policvmakers as well. Monetary
policy actions affect interest rates. If the viability offinancial institutions is particularly sensitive to interestrate changes, monetary policymakers will want to takethis effect into account.
0. J. Santoni is a senior economist at the Federal Reserve Bankof St Louis. Thomas A. Pollmann provided research assistance.
‘See, for example, Maisel and Jacobson (1978), p. 688; Kaufman(1984); Bierwag, Kaufman, and Toevs (1983); Hopewell and Kauf-man (1973); Flannery (1981); and Samuelson (1945).
‘More correctly, it is unexpected changes in the interest rate thataffect relative values. Any future change that is expected is reflectedin current prices. Long-term interest rates are important determi-nants of stock prices, and changes in these interest rates can becharacterized as unexpected (see footnote 15).
FINANCIAL INSTITUTIONS ANDINTERMEDIATION
Financial institutions intermediate many transac-
tions between borrowers and lenders. In doing so,banks and savings and loans do not act merely as creditbrokers, negotiating ct-edit transactions between bor-rowers and lenders. Rather, they borrow directly fromsome individuals and lend directly to others. Thesetransactions make up the portfolio of the financial firm.
In large part, the market value of the firm is determinedby the net present value of its portfolio of assets andliabilities. Changes in the interest rate affect the firm’smarket value because they influence the present valueof the assets and liabilities in the firm’s portfolio.
INTEREST HATE CHANGES AND THERELATIVE PRICE OF FINANCIALINSTRUMENTS
Since the interest rate is the price of the earlieravailability of dollars, a change in the interest ratemeans that this price has changed.3 For example, if the
‘Since this paper is mainly concerned with changes in the wholecomplex of interest rates (i.e., changes that leave the term structureunaltered), “the” interest rate is used as a shorthand method ofreferring to the complex of interest rates,
12

FEDERAL RESERVE BANK OF ST. LOUIS AUGUST/SEPTEMBER 1984
interest rate rises from a level of 10 percent to 12 per-cent, the price (or valuel of present dollars rises interms of future dollars. Before the change in the in-terest rate, borrowing a dollar today necessarily meant
giving up 1.10 dollars one year from now or- 1.21 dollarstwo years from now, etc. After the increase in the in-
terest rate, borrowing a dollar today requires the sac-rifice of 1.12 dollars one year from now or 1.25 dollars
two years from now, etc.
Since financial instruments represent claims to dol-lars at different points in the future, changes in theinterest rate affect the relative values of financial assetsand liabilities. A rise in the interest rate has two impoi-tant effects on financial claims. First, it reduces thepresent value of all such instruments in terms of pres-ent dollars. Second, and equally important, the presentvalues of various instruments will change in terms ofeach other; the prices of claims to dollars in the moredistant future will fall relative to the prices of claims to
dollars in the near future.
Table I presents an example that illustrates theeffect of an interest rate change on the presentvalues of four different financial instruments. Theinstruments are similar in that each promises a singlefuture dollar receipt (payment) of a given amount; theydiffer in both the amount to be received (paid) andtiming of the receipt payment). The fiist column of thetable indicates when each receipt will occur. Thesecond column shows the amount to be received. Col-umns three and four- give the present values of thevarious instruments at two different interest rates. The
last column shows the percentage change in presentvalue that occurs when the interest rate rises.
The example is constructed so that the present value
of each instrument is $100 at an interest rate of 10percent. Because each is worth $100 at this interesttate, each will exchange one-for--one in the market. Anincrease in the interest rate, however, will completelyalter this set of relative prices.
The increase in the interest rate from 10 percent to11 percent causes the present value of each instrumentthat promises future dollars to fall. Those that repre-sent earlier- claims to dollars, however, become rela-tively more valuable compared with those that promisedollars in the more distant future as indicated by thesmaller percentage reductions in the present values of
these instruments.
Interest Elasticity: ~4FundamentalMeasure of Interest Rate Risk
Discussions of the impact of an interest rate changeon the prices of financial assets have a long history ineconomic litei-ature and are typically referred to as the“elasticity of capital value with respect to the interestrate.”4
This “elasticity” is simply the percentage change inthe present value of an asset (liabilityl divided by thepercentage change in the inteiest rate. The number’that results approximates the percentage change in
4See Hicks (1939), pp. 184—88, and, more recently, Alchian (1955).
13
FEDERAL RESERVE BANK OF ST. LOUIS AUGUST/SEPTEMBER 1984
~N~’~’ ~N*-/5;: ~ , -t
VN Vt/N “~ /
/ N,
‘~ —<~V
N’
N/N N
/
VP
/ N i,~’,
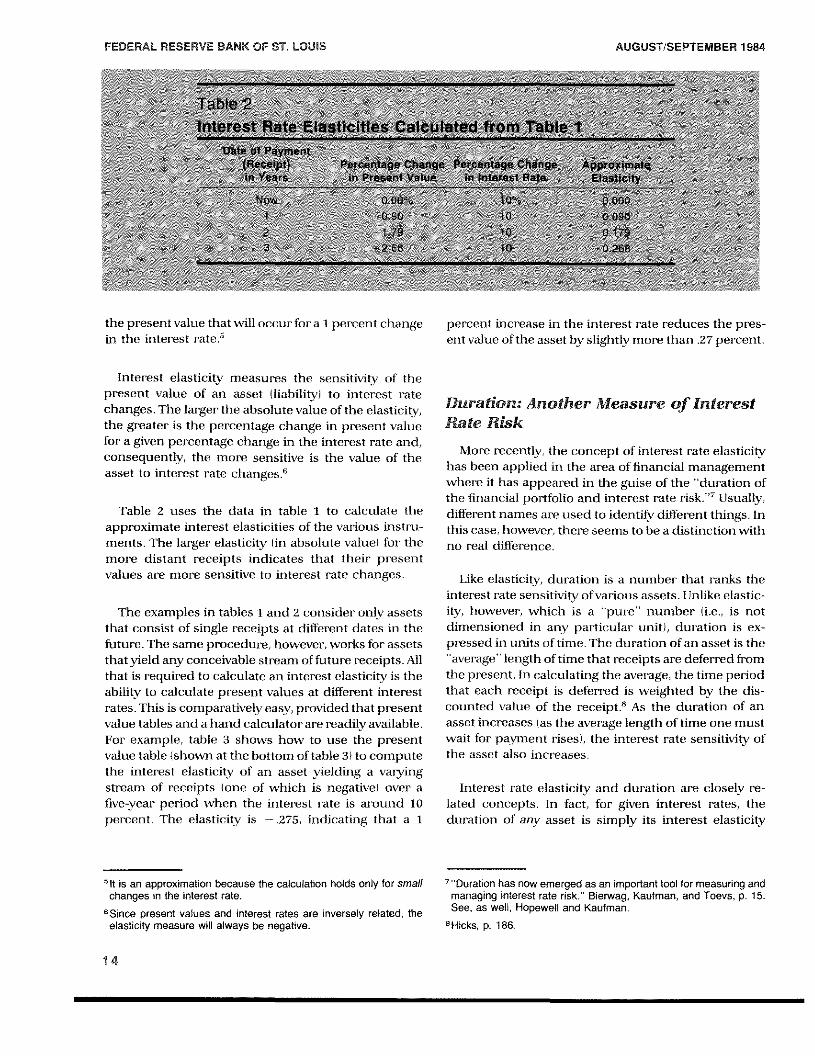
the present value that will
in the interest rate.5occur for a 1 percent change percent increase in the interest rate reduces the pres-
ent value of the asset by slightly more than .27 percent.
Interest elasticity measures the sensitivity of thepresent value of an asset (liability) to interest ratechanges. The larger the absolute value of the elasticity,
the greater is the percentage change in present valuefor a given percentage change in the interest rate and,consequently, the more sensitive is the value of the
asset to interest rate changes.”
Table 2 uses the data in table I to calculate theapproximate interest elasticities of the various instru-ments. The larger elasticity (in absolute value) for themore distant receipts indicates that their presentvalues are more sensitive to interest i-ate changes.
The examples in tables t and 2 consider’ only assetsthat consist of single receipts at different dates in the
future. The same procedure, however, works for assetsthat yield any conceivable stream of future receipts. Allthat is required to calculate an interest elasticity is theability to calculate present values at different interestrates. This is comparatively easy, provided that presentvalue tables and ahand calculator- are readily available.For’ example, table 3 shows how to use the presentvalue table (shown at the bottom of table 3) to compute
the interest elasticity of an asset yielding a varyingstream of receipts (one of which is negative) over afive-year period when the interest rate is around 10percent. The elasticity is — .275, indicating that a 1
“It is an approximation because the calculation holds only for smallchanges in the interest rate.
“Since present values and interest rates are inversely related, theelasticity measure will always be negative.
Duration: Another Measure of InterestBate Risk
More recently, the concept of interest tate elasticityhas been applied in the area of financial managementwhere it has appeared in the guise of the “duration ofthe financial portfolio and interest rate risk.”7 Usually,
different names are used to identi[v different things. Inthis case, however, there seems to be a distinction withno real difference.
Like elasticity, duration is a number that ranks theinterest rate sensitivity ofvarious assets. Unlike elastic-ity, however, which is a “pure” number (i.e., is not
dimensioned in any particular unit), duration is ex-pressed in units of time. The duration of an asset is the
“average” length of time that receipts are deferred fromthe present. In calculating the avet’age, the time periodthat each receipt is defen’ed is weighted by the dis-
counted value of the receipt.’~As the duration of anasset increases (as the average length of time one mustwait for’ payment rises), the interest rate sensitivity ofthe asset also increases.
Interest rate elasticity and duration are closely re-
lated concepts. In fact, for given interest rates. theduration of any asset is simply its interest elasticity
7”Duration has now emerged as an important tool for measuring andmanaging interest rate risk,” Bierwag, Kaufman, and Toevs, p. 15.See, as well, Hopewell and Kaufman,
8Hicks, p. 186.
14

FEDERAL RESERVE BANK OF ST. LOUIS AUGUST/SEPTEMBER 1984
/ N / ~ ‘~/N
~at N
N’// NNN’// / N -t~ N~e! / >Vt~P\,V 4cT , / Vt , ~/ ,
VPVPPt // ~ ~/ \\~1Ø~ — ~ /\ V
~co $N~\~aN, N-tie \N/
/;% N/~:/\ ~ NV’ ~V N,/ ~ / N
~ Vt*ctN/ NV N N,
VVP: ~/ N’ JEbNr# ~ :/t/ ,~j/N/N<~
~ ~ ~/N/~y~ /
/N/~ /N’// ‘VVtV/~N~/~ ‘N’ \/\ /N//N/ ~
V/~~N,N~~NZ //fl VP’V/ / / V/N~ ~pØ~~ t~ ~ N’ /~ % Nt//N’
/ // ~ // V N ;t~~’~ N,’
/N /~ N \
•íi~iit~
~ /N// _</ N,_ ~ /
jp~VP{ /N,; N ~ N/r/// N/N ~2NN’~t7:/VP-t / t~_4~%~fVptN/ t/S :/ ~ N ‘~
VPN VP ~t/ // ~ -/ N’VN,/c VP’ ~ N
/N*N ~ ~//>t/,~VPN’~~/ VP~’4V N
V~?’~tT ~ ~N
~ :N’/N/N ~ N’-tVt~4$jVP~ t/3flN’V~-t4V4~4~
multiplied by the factor — (1 + i)/i.°Consequently, theduration and interest rate elasticity produce identical
9The elasticities of the present values of various types of assets(liabilities) with respect to the interest rate are given by:
A, In thecase of asingle receipt (payment) of Adollars n years inthe future, the present value is:
AnP ~ (1±i)” and
dPidi P n(
1l)
Duration = ~ El— ajtMj _ n.
In this case, duration is equal to n, the number of years one mustwait before receipt (payment) of A.
B. In the case of a stream of receipts (payments) of variousexpected amounts, A~,at the end of each year for n years, thepresent value is:
P = ~ (lti)’
dPI/~[n. tA, /9 A1 ~ i~di~i’ [~±~(l’t.i)t/ t=1 (l+i)tj (~•,-f~’)
and Duration ~ f [— il.jL~j
rankings of assets and liabilities in terms of their in-terest rate sensitivity or risk.
lfthe interest rate elasticity ofan asset is known (andit is always relatively simple to estimate), its duration
can be immediately obtained. Forthe examples used intable 1, the approximate durations ofthe various assetsare 0.00, 0.99, 1.97 and 2.95 years, respectively. The
The duration of this instrument is measured by the term in brackets,i.e., the “average length oft/me for which the variouspayments aredeferred from the present, when the times of deferment areweighted by the discounted valuesof the payments (emphasis inthe original).” Hicks, p. 186.
C, In the case of a perpetual stream of receipts (payments) ofequal annual amounts, A, present value is:
P = ~ and
~ ~Jtt±)±~ ~ Lii±!)diP i (1+i) i di PL i
Theduration of this instrument is (1 + i)/i and the percentage changein its price is equal to the percentage change in the interest rate.Note that in each of the three cases duration is always equal to‘ ‘‘ dPi , ,interest rate elasticity, -~- ~, multiplied by — (1 + 1)/i.
15

FEDERAL RESERVE BANK OF ST. LOUIS AUGUST/SEPTEMBER 1984
approximate duration of the asset shown in table 3 is3,02 years.1°
The Effect of Interest Rate Changes on“Unbalanced” PorU’olios
Changes in the rate of interest generally will changethe present value of a firm’s assets relative to its liabili-ties. When this occurs, the market value of the firm willchange. If the firm’s shares are publicly traded, the
change in the firm’s value will be reflected by a changein the price of its shares. Thus, the market value of afirm is sensitive to interest rate changes, and this sensi-tivity generally will differ across firms.
As in the case of par-ticular- assets or liabilities, thesensitivity of the value of the flr’m to interest ratechanges can be measured by the elasticity of the pres-ent (market) value of the firm with respect to the in-terest rate.” Unlike the case for a paiticular asset orliability, however, the interest rate elasticity of the pres-ent value of the firm may be positive~negative or equalto zero. If positive, the market value of the firm will riseas interest t’ates rise and fall as interest rates fall. Ifnegative, the reverse is true; if zer’o, the net presentvalue of the firm is unaffected by interest rate changes.
Table 4 presents an example of each possibility. Inpanel A, the interest elasticity of net present value isnegative. Interest elasticity is positive in panel B andequal to zero in panel C. The example is constructed sothat the net present values are identical when theinterest rate is 10 percent. In addition, the construction
‘°Theseare approximatedurations because theelasticities computedin the tables areestimates of the trueelasticity (see footnote6)-Theexact durations are 0.00, 1.00, 2.00, 3.00 and 3.10 years (seefootnote 9).
“Let A, and C, be, respectively, the dollar value of the firm’sreceipts and thedollar value of its payments in period t. If the lifeof the firm is n years, the marketvalue of thefirm in period t, M, is:
n A, n C,M, = ~ (1+0’ ~ (1+0’
t= 1
t’A, _____
/1+0’ (1+0’di M, (14-i) A, C,
(1 ~‘0’ (I i—i)’As long as the market value of the firm is positive, i.e., thedenominator exceeds zero,
dM, i tA, tC, N
See Samuelson, p. 19.
is such that the ratio of assets to liabilities (leverage) isinitially the same for’ each firm.
An increase in the interest rate from 10 percent to 11
percent causes the net present value of the firm inpanel A to fall by $3.62, rise by $1.19 in panel B andremain unchanged in panel C. The explanation for’ thisdifferential effect is that the increase in the interest rate
lowers the present value offirm A’s assets relative to thepresent value of its liabilities, causing its net worth tofall. The reverse is true for firm B, while for firm C the
present values of assets and liabilities fall proportion-ally, leaving its net worth unchanged.
DURATION: SOMECOUNTERINTUITIVE ANOMALIES
Since the duration of an asset or liability is in terms ofunits of time, it may appear to be a more intuitivelyappealing measure of interest i-ate sensitivity than elas-ticity, which is a pure number. However, duration has
some counterintuitive qualities that emerge when it isapplied directly to the net flow ofreceipts generated bythe firm (i.e., when the firm is treated as a single asset).
There Is Less in Duration ThanMeets the Eye
While duration presumably measures the averagelength of time that receipts and payments are defer-redfrom the present, the measurement can produce sonicunusual results. This is apparent in panel A where theduration of the portfolio is approximately 8.76 years,while the durations of the asset and liability are only 5.0and 1.0 years, respectively. Intuitively, it would seemthat the duration of the portfolio should be no morethan 5.0 years. The asset will mature after five years, soa measured duration of 8.76 years is somewhat un-usual in terms of the way aver-ages (even weightedaverages) are normally computed. This odd resultoccurs because duration employs an unusual methodin weighting the streams of receipts and payments (seefootnotes 9 and 11).
As a further illustration, notice that the duration ofthe portfolio in panel B is negative. In a mechanicalsense, this result is not surprising. Duration is alwaysequal to interest elasticity multiplied by —u + U/i. Forthe firm in panel B, interest elasticity is positive and—(1 +U/i is negative. So duration, the product of thepositive and negative numbers, is negative. However, aportfolio with a negative average life is surely counter-intuitive. ‘this result indicates that duration is moreappropriately thought of as aproxy for the interest rate
16

FEDERAL RESERVE BANK OF ST. LOUIS AUGUST/SEPTEMBER 1984
N,\N/N~ N <4-/N ~ /N //N /N/// /// 4/ <c~ ~ ~///N//// ;k4-/ ‘N~/TN, ~ ~V ::~~
// ~ ~N_~ </~4-’N V / ~/t/ /\~ ~N?4-
N~~ ~ N ~/‘~ /
//>N / N//// /4-/ / N
;//~~N~ ~? ‘ / N’N’\/ V//N,cV~N’4-
V ~N,/N~ N N /,// N,~/N ~ t/ ~ ,a’ ~ N, /
/N/N’/N, / ‘/ —C ~-N’;C~ ~ / N~ /
~ ~~NN N ~ / /NN/ ~ VP ///N,N
;N~VP~~ p4-N,N~/~ N t/~ /
/\7
~~~‘ N
N
N
N’
N
, ~7N~N /~~NVPfr~’~ V ~
~4_ <~~‘e~~ ~N~cI~/:,c!~ I ~~>// N N’ ~ ~ ~N
~svt/ \ I S4~i ‘
P$N 4-N’~ t//4- 4~ NV’N N’4~%~/N,//~NN/ ~ t ~qr~pN ~ N~/N N ~ ///N N
/4-
N’, ‘~ ~ N /4- tfr~/////> //// N ‘N
~4-
N,t/N~~4$1VP’N ////t/ ~a44-/ N,t/NN~~:\N // ~ <~

FEDERAL RESERVE BANK OF ST. LOUIS AUGUST/SEPTEMBER 1984
elasticity of the portfolio rather than an indicator of theportfolio’s average life.
Thus, at best, duration produces a consistent rank-ing of assets, liabilities and portfolios in terms of in-terest rate risk. The ranking is identical to the one thatwould be obtained by calculating interest rate elastici-
ties. Calculating duration, however, requires an extracomputational step and produces a result that revealsvery little intuitive information about the average life of
the portfolio.
Leverage Affects Portfolio Duration
An increase in the firm’s leverage (an increase inliabilities relative to assets) affects the duration of theportfolio. Again, consider panel A of table 4. Supposethat the present values of these particular assets andliabilities were increased by equal amounts so that thefirm’s net worth remained constant. This increase inthe leverage of the firm would also increase the interestelasticity of the portfolio. Since duration is simply theinterest elasticity multiplied by —u + U/i and, in thiscase. interest elasticity is negative, the duration of theportfolio will increase even though the average lives ofthe assets and liabilities were not changed.
Matching Asset/Liability Duration DoesNot Eliminate Interest Rate Risk
Matching asset and liability durations will not insu-late the net worth of the firm (valued at market) againstinterest rate changes. This is particularly apparent inpanel C of table 4.The duration of the firm’s asset is oneyear, while the duration of its liability is two years.Although the firm has a mismatch of asset/liabilitydurations, a change in the interest rate leaves its netpresent value unaffected.
Insulating the firm against changes in the interestrate requires that the interest elasticity of the portfoliobe zero, If the firm’s net worth is positive, as must bethe case for any viable firm, achieving this result re-quires that the duration of the firm’s liabilities mustexceed the duration of its assets. That is, the weightedaverage length of time forwhich payments are deferredfrom the present must exceed the weighted averagelength of time for which receipts are deferred from the
present.12
“The above example considers only a single receipt and pay-ment, only a single interest rate, and only one type of asset andliability. The real world, of course, is considerably more compli-cated and, hence, the example used here may appear to be
INTEREST RATE RISK ANDFINANCIAL INSTITUTIONS
There is reason to believe that financial firms are bestcharacterized by the firm shown in panel A of table 4.Notice that in examples B and C, the finn’s asset ma-tures in one year, while its liabilities extend beyondone year-. Once the asset matures, the net present valueof the firm is negative (and will continue negativethroughout its remaining life) unless the owners rein-vest the proceeds of the matured asset.
What are the incentives for the owners to reinvest? Ifthe firm is a corporation and, hence, creditors have no
claim on the personal assets of the owners, there isrelatively little incentive. The wealth of the owners willbe greater if they simply take the proceeds of the ma-tured asset ($100) as a dividend and declare the firm
bankrupt. Their wealth will rise by the present value ofthe liabilities. The incentive to behave in this fashion isgreater the larger the liabilities are relative to assets,that is, the greater the firm’s leverage.
Financial institutions tend to be highly levered!’ Onaverage, net worth represents about 5 percent of totalassets for these firms. Under these conditions, it isunlikel that financial institutions could attract manydepositors if they maintained maturity structures ofassets and liabilities similar to those shown in panels Band C. Public trust makes up much of the capital offinancial institutions, both literally and figuratively.These institutions provide assur’ance against the kind
of behavior discussed above by maintaining asset/liability maturity structures similar to that shown inpanel A rather than those shown in panels B and C.
This implies that the interest elasticity of the presentvalue of financial institutions will be negative. Positive
changes in the interest rate will be associated withreductions in their market values, while negative
changes in the interest rate will be associated withincreases in their market values. Moreover-, the abso-lute value of the interest i-ateelasticity should be lar-ger
for savings and loan associations than for banks, be-cause they lend on a much longer-term basis than do
unrealistic, However, the same results would be obtained if amore realistic example were employed; all that would be gainedby more realism is more complexity.
‘~ example, the ratio of capital to total assets averaged .042 forthe 35 banks listed in Salomon Brothers (1983), p. 54, over themost recent five-year period. Theratio for all savings and loansis .053 over the same period (Savings and Loan Sourcebook,various years). In contrast, the ratio of capital to total assets forall manufacturing firms averaged .500 over the same period.
18

FEDERAL RESERVE BANK OF ST. LOUIS ST/SEPTEMBE 984
banks while both borrow on a short-term basis,’4 /
N ‘N N 7l’he highly levered portfolios of all financial institu- / / ‘N / / N 7 N /77~
~ :~zm~cial institutions will not only decline, but decline rela-live to the share prices of other firms when the interest N / ~
rate uses and, conversely, when the interest rate falls, ///~N/ / SN /// NN ‘NNN N / ‘N /
Because of this, the stock prices of financial institu- N / ‘N -~ ~N N / / / N
trons should exhibit gi eatcr variation around their ‘N’N~c N ~ N N-N N. N c ~ N-<-’NN- N N/N7
4-~
mean levels than firms that are less highly levered and / 4- N / NN~~~Nt: NN
that maintain more balanced portfolios. / 7N / /NN N
/ / ‘NN’N- / N4- NN N’N N N /4-N </NNN/ ‘N7 /
N NN ‘N? / N N / N 4-N>
SOME ESTIMATES OF INTEREST /#V4~/N~~4-&+ /\ ~
RATE ELASTICITIES ~ N7’N 74- /
The above discussion implies that, other things N/ / N ~
equal, the owners of financial institutions accept more N~$jj~N>N N / N’interest rate risk than the owner-s of nonfinancial firms. / r NTo what extent does an ana]ysis of share prices for > !/~N-~t’N’N N
publicly traded firms support this implication? / N
N / / 7To investigate this issue, quarterly data on the per- 7/ N N 7N 2 /
centage change in various indexes of share prices were ~ N ~ 4- N’Sregr’essed on the percentage change in the corporate N ‘
Aaa bond rate over the period from 1961 to 1983 to N-N / N N
produce estimates of the inter’est i-ate elasticities con- / / ‘
fronting different types of firms.” The share price in-dexes used are the Standard and Poor’s indexes of 7 /
share prices of 400 industrial companies, banks out- N N / / ~/NN N
sideofNewyorkCity,NewYorkCitybanks,andsavings C / N - N N ~ N
and loan holding companies. The regressions also in- 7 / /
dude the growth rate of real GNP to control for cyclical ~ N7~ ~ NN/ ‘N N’factors. rhe results are shown In tableS. ~ <>N~ N 4415 >
4-4~Ø~-/ ‘N>N-~ N
~4 7~ 4-
‘4All federally insured savings and loan associations are required by 15law to hold the bulk of their assets in the form of home mortgageloanswith remaining maturities of not less than eight years (FederalHome Loan Bank Act of 1932, sec. 2, p. 1). It was not until 1980 that 4-
N>-
t’Nc~~N~$flFIR~fIJ5~PP!II~!415The first differences of the corporate Aaa bond rate can becharacterized as representing unexpected changes in the in-terest rate. The hypothesis that the series represents white ~ N/ 4 NNN
4-~‘N
noise cannot be relected. The Chi-square statistic based on 24 N/NN4j~415S%>Slt N4-
tags is 30.22. In addition, three sets of initial regressions at- ~ /4-N
tempted to control for changes in the term structure of interest ~ N~ N / N N N N> NN4-~
rates by including the percentage change in the three-month 4- NNN -~ / / N N / 7N~N N / 47N ~j~444
T~::~~1~ ~and the percentage change in thedifference between one plus ~the three-month Treasury bill rate and the corporate Aaa bond ‘N N N N N N / N N -/47 N
rate. However, these variables proved insignificant and were N -77 4- N ~ ~ NN~ ~
dropped from subsequent regressions. / N N-N N SN 4-’N N ///7 N 5N 4- N ‘N‘61n the case of estimates 1, 2 and 4 the procedure used was 5 N - / / N
generalized-least-squares regression. Estimates 1 and 4 were N ‘N SN--N- -~—N’
N. N 4-N ~7 N/ aNN 4-N
-/7 N’1N~~NN N 4-
19

FEDERAL RESERVE BANK OF ST. LOUIS AUGUST/SEPTEMBER 1984
In each of the regressions reported, the estimatedcoefficient of the percentage change in the long-terminter-est rate (corpor-ate Aaa bond rate) — which is anestimate of the interest elasticity of the stock prices of
the firms — is both negative and statistically signifi-cant. Increases in the long-term interest rate areassociated with reductions in the capital values of bothindustrial and financial firms.
The estimated coefficient of the growth i-ate in realGNP (the proxy for cyclical factors( is positive in eachestimate. The positive sign of the coefficient indicatesthat expansions in economic activity are associatedwith increases in the stock prices of both industrialand financial firms. The coefficient is statistically sig-nificant, however’, only in estimates I and 2.
Djfferential Interest Rate Elasticities
The results in table 5, as expected, show that a givenpercentage change in the long-term interest rate pro-duces differential effects on the share prices of thedifferent types of firms. For example, a 1 pci-cent in-crease in the long-term interest rate is associated withan average reduction of 0.4 percent in the net presentvalue of industrial firms, a 0.9 percent reduction in thenet present value of banks, and a 2.41 per-cent reduc-tion in the net present value of savings and loan asso-
ciations.
Since the coefficients of the percentage change inthe long-term interest rate are estimates of interest rateelasticity, the results indicate that, on average, thestock prices of savings and loans are about two and ahalf times more sensitive to changes in the long-terminterest rate than are the stock prices of banks, andabout five times moi-e sensitive to such changes thanare the stock prices of industrial firms. These differ-ences are statistically significant.’7
The i-dative ranking of the various types of firmsindicated by these estimates of interest elasticity isconsistent with that suggested by the previous discus-sion: financial firms are more highly levered than otherfirms, and savings and loans maintain asset/liabilityportfolios that are heavily weighted by long-term assetsand short-term liabilities.
“When the ratio of the index of the prices of bank stock to theindexof theprices of industrial stockwasregressed on the sameset of right-side variables as appear in tables, the coefficient ofthe long-term interest rate was negative and statistically signifi-cant for both of the proxies for the price of bank stock, The testwas repeated using the ratio of the indexes of the prices ofsavings and loan stock to the prices of bank stockwith the sameresults, In sum, unexpected increases in the long-term interestrate cause the stockprices of savings and loan associations todecline relative to the stock prices of banks, whichdecline rela-tive to the stock prices of industrial firms.
CONCLUSIONS
The share prices of financial institutions (and thewealth of their owners) are more sensitive to interestrate changes than are the shaie prices of industrialfirms. This is true because financial institutions arehighly levered relative to other firms and because theportfolios of savings and loan associations ar-c com-posed of relatively long-term financial assets and rela-tively short-term financial liabilities. Because the mar-
ketvalue ofthese institutions is particularly sensitive tochanges in the long-term interest rate, financial finns(parlicularly savings and loan associations) are subject
to greater interest i-ate risk.
Simply matching asset and liability durations willnot insulate the firm against interest rate risk, In fact,complete insulation is probably undesirable. Interestrisk can only be eliminated if these firms wet-c to bor-row long and lend short, that is, if they were to com-pletely ieverse their traditional practices. However-,structuring portfolios in this way can be costly to finan-cial institutions iL as suggested here, it reduces thecredibility of the commitments these institutions maketo depositor’s.
REFERENCES
Alchian, Armen A. “The Rate of Interest, Fisher’s Rate OverCostand Keynes’ Internal Rate of Return,” American EconomicReview (December 1955), pp. 938—43.
Bierwag, G. 0., George G. Kaufman, and Alden Toevs, “Dura-tion: Its Development and Use in Bond Portfolio Management,”Financial Analysts Journal (July/August 1g83), pp. 15—35.
Federal Home Loan Bank Act of 1932. Public No. 304,72 Cong.,HR 12280.
Flannery, Mark J. “Market Interest Rates and Commercial BankProfitability: An Empirical Investigation,” The Journal of Fi-nance (December 1981), pp. 1085—i 02.
Hicks, J. R. Value and Capital (Oxford: Clarendon Press, 1939).
Hopewelt, Michael H., and George G. Kaufman, “Bond PriceVolatility and Term to Maturity: A Generalized Respecification,”American Economic Review (September 1973), pp. 749—53.
Kaufman, George G. “Measuring and Managing Interest RateRisk: A Primer,” Federal Reserve Bank of Chicago EconomicPerspectives (January/February 1984), pp. 16—29.
Maiset, Sherman J., and Robert Jacobson, “Interest RateChanges and Commercial Bank Revenues and Costs,” Journalof Financial and Quantitative Analysis (November 1978),pp.687—700.
Salomon Brothers, Inc. A Review of Bank Performance (1983),p. 54~
Samuelson, Paul A. ‘The Effect of Interest Rate Increases onthe Banking System” American Economic Review (March1945), pp. 16—27.
Savings and Loan Sourcebook, (United States League of Sav-ings Associations, 1982.)
20