interfacial area analysis of a non-newtonian liquid and
TRANSCRIPT

University of Rhode Island University of Rhode Island
DigitalCommons@URI DigitalCommons@URI
Open Access Master's Theses
1983
Interfacial Area Analysis of a Non-Newtonian Liquid and Air Interfacial Area Analysis of a Non-Newtonian Liquid and Air
Flowing Cocurrently up in a Bubble Column Flowing Cocurrently up in a Bubble Column
Carlos E. Trigueros University of Rhode Island
Follow this and additional works at: https://digitalcommons.uri.edu/theses
Recommended Citation Recommended Citation Trigueros, Carlos E., "Interfacial Area Analysis of a Non-Newtonian Liquid and Air Flowing Cocurrently up in a Bubble Column" (1983). Open Access Master's Theses. Paper 1507. https://digitalcommons.uri.edu/theses/1507
This Thesis is brought to you for free and open access by DigitalCommons@URI. It has been accepted for inclusion in Open Access Master's Theses by an authorized administrator of DigitalCommons@URI. For more information, please contact [email protected].

INTERF ACIAL AREA ANALYSIS OF A NON- NEWTON.TAN LI.Q!!IQ
AND AIR FLOWING COCURRENTLY UP IN A BUBBLE COLUMN
JH
CARLOS E~ TRIGUEROS
A THESIS SUB.MITTED IN PARTIAL FULFILLtlEN,I_QLTHt
EJQ~!jJMENT FOR THE DEGREE_Ql
MASTER OF SCIENf]
!M CHJ1ICAL_ENGINEERING
UNIVERSITY OF RHODE ISLAND
12.§J

MASTE OF SCIENCE THES!,~
Q_
CARLOS E. TRIGUEROS
Dean of Graduate School
UNIVE_SITY_OF __ HODE SLAN~

Gas holdup, bubble size and specific interfacial area
studies were made in a 33cm inside dia.meter bubble column
with air-carboxymethyl cellulose aqueous solution as the
system. Experiments were performed wit a fixed porous
plate gas distributor by varying super£icial gas
velocity The flow patterns of interest were bubble and
bubble-slug patterns. Gas holdup data was obtained by the
bed expansion method and bubble size distribution by taking
photographs with a boroscope at different radial and axial
pos.i tions.
Gas holdup decreased with carboxymethyl cellulose (CMC)
concentration and exhibits a maximum with
velocity. This
concentration.
maximum also diminishes
superficial
with
gas
CMC
Bubble size measured by the horoscope is smaller near
the walls and reaches its maximum at R/2. The bubble size
increases when either CMC concentration or superficial gas
v-alocit_y is increased. Ther-e is .no substantial variation of
bubble size in the axial direction foe the lower portion of
the column. A maximum for total intecfacial area was found
for all the solutions with the exception of the higher
concentcations. This maximum was found in the bubble-slug
pattern near the transition from bubble to bubble-slug
pattern. Operation under this condition is recommended.
ii

ACKNOWLEDGMENT
The aut hor would lie to express his sincere gratitude
to his major professor Or. Harold N. Knickle for his
guidance, help and encouragement throuqhout this research~
iii

DEDICATION
I would like to dedicate this thesis to my wife , Xinia.
Without her patience during the long hours I had to ignore
her to pursue the research , and without her encouragement
which helped me through difficult periods of the vork and
without her love , which made the work worthwhile, this
thesis, which I hope is a contribution worthy of dedication
to her, would never have been completed.
iv

I!~_E O CONTENTS
PAGE
ABSTRACT ii
AC KNOW LEDG MENT iii
D.E .ICATION iv
TABLE OF CONTENTS V
LIST OF TABLES vi
LIST OF FIGURES vii
NOMENCLATURE X
I INTRODUCTION 1
II. LITEfATURE REVIEW 5
III EXPE IMENTAL WORK 48
IV. DISCUSSION OF RESULTS 54
v .. CONCLUSIONS AND RECOnMENDATIONS FOR FURTHER 65 STUDIES
VI. APPENDICES 68
V.II BIBLIOG APHY 1 1 1
V

LIST_OF_TABLES
Page
Table 1: Variation of gas holdup with time 70 for a o. 25% C.MC solution
Table 2: variation of gas holdup with time 71 for a 0.501 CMC solution
Table 3: Variation of gas .ho.ldup with time 72 for a 1. 0% CMC solution
Table 4: Variation of gas holdup with time 73 for a 1.5% CMC solution
Table 5: Variation of gas holdup with time 74 for a 2 0% C.MC solution
Table 6: Mean Sauter diameter for a 0.25 75 CMC solution
Table 7: Mean Sauter diameter for a 0.50% 76 CMC solution
Table 8: Mean Sauter diameter for a 1 0% 77 CMC solution
Table 9: Mean Sauter diameter for a 1.5% 78 CMC solution
Table 10: Mean Sauter diameter for a 2. 0% 79 CMC solution
Table 11 : Physical properties for C.MC 80 solutions
vi

Figure 1:
Figure 2:
.Figure 3:
.Figure 4:
Figure 5:
Figure 6:
Figur e 7:
LIST OF .FIGURES
Two phase flo· patterns
Time dependent non-Newtonian behaviouc
Non-Newtonian behaviour
Experimental set-up
Gas holdup comparison with literature
Specific interfacial area for a 0.25% CMC solution
Speci£ic interfacial area for a 0.504 CMC solution
Figure 8: Specific interfacial area for a 1.0 % CMC solution
Figure 9 : Specific interfacial area for a 1 s~ CMC solution
Figure 10; Specific interfacial area for a 2 0 CMC solution
Figure 11: Gas disengagement for a 0.25 % CMC so.lu ·tion
Fiqure 12: Gas disengagement for a 0.50 % Ct1C soln tion
Figure 13: Gas diseng a gement for a 1.0 CMC solution
Fiqure 14: Gas disengagement for a 3.5 1 CMC solution
Fiqure 15; Gas disengagement for a 2.0 % CMC solution
Fiqure 16: Bubble size radial distribution for a 0.25 % CMC solution
Figure 17: Bubble size radial distribution for a O 25 % CMC solution
Figure 18: Bubble size r adial distribution for a 0.50 ~ CMC solution
vii
Page
8
11
13
49
56
58
59
61
62
63
81
82
83
84
85
86
87
88

Figure 19: Bubble size radial distribution for a 0.50 CMC solution
Figure 20: Bubble size radial distribution £or a 1.0% CMC solution
Figure 21: Bubble size radial distribution for a 1 0% CMC solution
Figure 22: Bubble size radial distribution for a 1.5 % CMC solution
Figure 23: Bubble size radial distribution foe a 1.5 % CMC solution
igure 24: Bubble size radial distribution for a 2.0 % CMC solution
Figure 25: Bubble size radial distribution for a 2.0 % MC solution
Figure 26: Variation of big bubble size with superficial gas velocity
Figure 27: Variation of power law index with CMC concentration
Figure 28: Variation of consistency factor with CMC concentration
Figure 29: Variation of mean Sauter diameter with superficial gas velocity for a 0.25 % CMC solution
Figure 30: Variation of mean Sauter diameter with superficial gas velocity for a
.50 CMC solution
Figure 31: Variation of mean Sauter diameter wit superficial gas velocity for a 110 % CMC solution
Figure 32: Variation of mean Sauter diameter with superficial gas velocity for a 1.5 % CMC solution
Figure 33: Variation of mean Sater diameter with superficial gas velocity for a 2.0 enc solution
Figure 34: Variation of gas holdup for a O 25% CMC solution
viii
PAGE
89
90
91
92
93
94
95
96
97
98
99
100
101
102
103
104

PAGE
Figure 35: Variation of gas .holdup for a 105 0.50% CMC solution
Figure 36: Variation of gas holdup for a 106 1. ox CMC solution
Figure 37: Variation of gas holdup for a 107 1. 5% CMC solution
Figure 38: Variation of gas holdup for a 108 2.0 % CMC solution
Figure 39. 1aximu expected for in terfacial 110 area (sketch).
ix
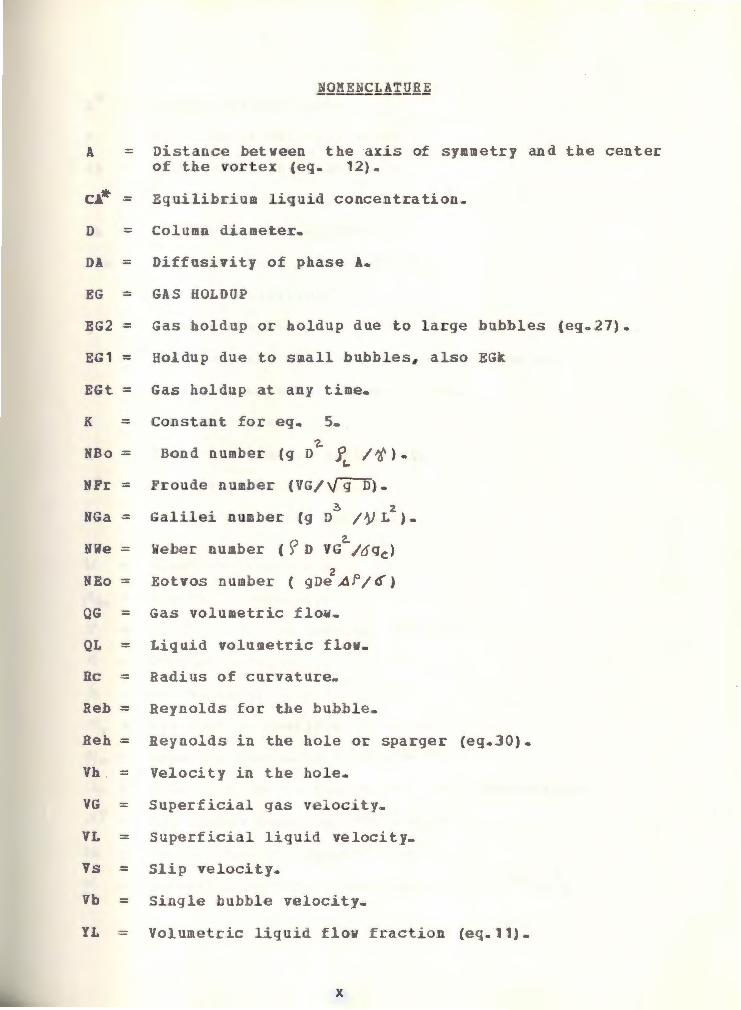
A =
NOMENCLATURE
Distance bet ween the axis of symmetry and the cen tee of t.he vortex {eq. 12) ..
cA• = Equilibrium liquid concentration.
D = Column d~ametex.
DA = Diffusivity of phase A.
EG = GAS HOLDUP
EG2 = Gas hold p or holdup due to large bubbles (eqo27).
EG1 = Holdup due to small bubbles , also EGk
EGt = Gas holdup at any time.
K = Constant for eg 5.
NBo =
NFr =
Ga=
NWe =
NEo =
D'Z- 0 B-ond number (g J. / 't). ,_
Froude number (VG/\[go) ..
~ z Galilei number (g D /1/ L ) ,.
2. Weber number ( s:> D VG /6q c )
2 Eotvos number ( gDe A f /<f)
QG = Gas volumetric flow ..
QL = Liquid volumetric flow.
Be = Radius of curvature
Reb = Reynolds for the bubble
Reh= Reynolds in the hole or sparger (eg.30).
Vh = Velocity in the hole.
VG = Superficial gas velocitya
VL = Superficial liquid velocity.
Vs = Slip velocity.
Vb = Si gle bubble velocity.
YL = Volumetric liquid flow fraction (eq.11).
X

z = Dimensionless length
a = Specific interfacial area ..
db = diameter of the bubble
de = Equivalent diameter ..
dh = Orifice or nole diameter.
DVs = Volume-surface mean diameter.
e = Enec-gy dissipation
g = Gravity constant ..
k - Reaction rate constant and constant
KL = Liquid mass trans.fer coefficient ..
m = Reaction order ..
n = Po-wer law index, constant for eg
r ll=- = Dimensionless radius.
WO = Maximum vorticity (eg. 12).
11 = Kinematic viscosity.
r'!A1>r = Apparent viscosity_
-'t = Shear rate, and constant for eq. 2
=
=
Surface tension ..
Poro us size ..
IY]0 = Apparent viscosity at dV/dy=0 ..
IYJ00 = Apparent viscosity at dV/dy= 00 •
for eq .. 2 ..
2.
= Time constant in rheological char-acterization ..
A?= Liquid-Gas densities difference
Si = Partial cross sectional area.
o< = Parameter in Ka to' s co.crela tion {= 1-eo .2. VG2
)
x1

1
INTRODUCTION
Gas bubbles have an important role in many physical and
chemical processes. In some operations the transfer of mass
between gas bubbles and the contiguous liquid phase is the
very essence of the operation (53).
The bubble column is widely used as a gas-liguid
reactor because it can he easily designed £or the use at
high pressure on account of its simple structure, with no
mov ing parts, and its easy fabrication (43)
Bubble column is of easy operating and maintenance
owing to the absence of any mechanical parts (13), also
bubble columns are not very costly and has appreciable mass
transfer possibilities besides, it is well suited for
relatively slow gas-liquid reactions with gases that are not
very soluble {67). Its ratio performance/cost is often in a
better position than its main rival, the mechanically
agitated tank ..
In practically all the gas-liquid systems, the liquid
phase mass transfer resistance is strongly
(60,65). The use of bubble columns vith their
controlling
ability to
handle high liquid rates is a field of application where the
f o rmer problem is present.
Bubble columns are used
gas-liquid reactions as in
in a larqe
lime-slurry
variety of
carbonation,
chlorination of paper stoc , and hydrogenation of vegetable
oils (6 0).
In sewage treatment they are videly used where air has

2
to be passed
sewage. Also
importance in
through porous carbon diffusers (28) into
recently,, bubble columns gained more
the area of biotechnology, especially in
fermentation and waste water treatment, because they provide
favorable mi ·xing and mass transfer properties at lov shear
stresses (13).
Perhaps, bubble columns are mostly used in coal
liquefaction processes which deal with elevated temperatures
and pressures Coal is pulverized to fine size and
dissolved in a hydrogen donor solvent. A coal slurry can be
treated as a pseudo homogeneous mixture (16).
The feature common to the above applications is the
utilization of a non-Newtonian liguid as the working medium
This is the basis of interest for the present study.
In the design of bubble columns there ace many
variables that are important:
bubble size distcibutio-n, gas
flow pattern, hubb .le size,
holdup, mass transLer
coefficient, interfacial area, column diameter, backmixing,
and vaporization of the liguid phase (57). Usually these
variables are related to each other and the variation of one
could aff<act the whole design
The bubble and bubble-sluq patterns are of interest
because there is a maximum in the interfacial area at their
trausition (19). Interfacial area is not the only
parametec used for scale up in large columns. Back mixing
takes place and is
This can be avoided
detrimental for overall performance.
with the inclusion of baffles in the
column For example, a bubble column wit ba.ffles and

3
agitation gives the same holdup values as in
stirred-agitated vessels, that as will be explained latter
will reflect in an increase in the interfacial area.
In scale up procedures many suggestions have been
presented (10.,34,39). Kastanek {37) found a very good Yay
to scale up bubble columns based on constant values of rate
of energy dissipation. This appears to be a reasonable
compromise for the majority of practical situations He
also related the energy dissipation to the interfacial area
and holdup, the most important £actors in the design.
A ita and Yoshida (2) found that a squar.e column qi ves
the same performance as a cound column with the diameter
equal to the side of t he square.

The objective
variation of b ubble
of
4
OBJECTIVES
t his study is to determine the
size along and across a bubble column
type reactor and its effect on interfacial area when a
non-Newtonian liquid is used. Air and CMC solutions
flowing cocurrent up are studied in a 33 cm I.D. bubble
column. Only the bubble and bubble-slug patterns are taken
into consideration.

FLOR PATTERNS . .•
5
1ITERATURE REV L~]!
The flow in two phase mixtures may not be characterized
merely as iaminar or as a combination of laminar and
turbulent flow, but the relative quantities and the
distribution of the phase must be considered {23 , 24).
However, the problem in two phase flow is that there is a
lack of agreement in the descrip ·tion and classification of
the flow patterns where the subjectivity of the observer is
also variable (63) .. It is a.lso neccesary to know that maps
prepared from data for one pipe size and fluids properties
are not necessarily va1id for other sizes or properties.
A good attempt at characterizing flow patterns in
bubble columns was made by Govier et al (23) consisting of a
graphic presentation of pressure drop vs .. holdup at
constant liquid velocity. This qraph has the
characteristic of two minima and a maximum and defines four
different flow patterns. Pattern I ranges from zero gas
velocity to the first minimum , pattern II is between this
minimum and the maximum~ pattern III is betveen the maximum
and the second minimum and the last pattern beyond this last
minimum. Hith visual observations on bubbles shape, they
found similar divisions. These patterns are called . . bubble, slug, froth, and annular mist. Their correlated
data applied only to water-air systems using small diameter
columns.

6
Taitel et al {63) have described flow patterns called
bubble, slug, churn and annular
A summary of the description of these patterns .is given
as follows:
Bubble flow:
The gas phase is approxima te1y unif ormily di.s ·tributed
in the form of discrete bubbles in a continuous liguid
phase.
Most of the gas is located in large spherical cap
shaped bubbles which in small bubble columns occupy almost
the whole diameter (Taylor bubbles).
Churn flow:
In this pattecn the large bubbles become narrower and
their shape is distorted and the pattern is chaotic# frothy
and disordered. The continuity of the liquid is destroyed
by a hlgh local gas concentration.
Annular flow :
This pattern is characterized by the continuity of the
gas phase along the pipe in the core. The liquid phase
moves upwards partially as wavy liquid film and partially in
the form of drops entrained in the gas core.
Subjectivity is usually inherent in visual
classifications. Taitel et al (63) used equations to
generalize the prediction of the transition boundaries ..
Lately, the most common maps for two phase flow
classification includes six di££erent patterns (41) .. .

7
bubble flow, finely dispersed bubble flow, bubble-slug flow,
slug flow , churn-slug flow a.nd annular fl ow. As can be seen
from this classification the patterns are roughly described
by former definitions and can be graphically observed in
figure 1.
Again, the main problem is how to characterize the
transition between patterns. Kamat and Knickle (35) ha ve
character~zed the transition from bubble to bubble-slug by:
I/, V L = 2. 2 V G-1 .. 1 2 8 ( g ~ SJ a/~ ) + {1)
Part e bubble-slug to slug transition Knickle and
Kirpekar (41 ) suggested the following equation:
VL = 1 79 VG-0. 286 (g D 6~ /.ft. / 2 (2)
Equatio ns (1) and {2) are related to most interesting
region as far as interfacial area is concerned. More
equations defining transitions .from one pattern to another
have been developed by some authors (35,41,63).
Some other contributions for description and definition
of two phase flow patterns were qiven by many authors
(10,56,67).
Among those attempts describing .flow patterns, one of

1 Bubble Flow
0 00 C>
1 o a
"' " 0 0
0 0
0
0 o 0
0
0 "
• 0 0
0 o o" -ooo
- 0 0 o.,o 0
0 0 0
:::·~:\:_;;:::_:; 2 Finely Dispersed Bubbly Flow
>),l .. •'
... ... ·. :: ..
.: ~ . • ; •. • I ~
::, ...
·-.~:.:.<-. : . · .. : ; ~ .....
. : -~·:· ~ ·::: i ....
3 Bubble - Slug Transition
~ ~b: 0 :w Q
oo Q 0 Oct:, 0
I)
0.,, 0-C> 0 0
Qo ~o o " Ooa,, 00 t) Q
t
4 Slug Flow 5 Churn Flow 6 Annular Flow
.
...
. . .
.·
t Increasing Gas Superficial Velocity
Figure 1. Flow Patterns In Gas - Liquid Vertical Upflow
co

9
particular interest because its use in non-Newtonian liquids
was correlated by Schumpe and Deckwer (56) They correlated
data from a 14cm. ID bubble column for a sintered plate
gas distributor using CMC solutions and presented a map in
which VG is plotted against the apparent viscosity with all
patterns represented.

1 0
jO -NEWTONIAN BEHAVIOUR:
The Newtonian behaviour in a fluid is attributed to a linear
relationship between shear stress {:,') and shear rate ( 11' or
dV/dy). Obviously, in the case of non-Newtonian liquid,
such a linear rela ·tionship does not exist.
Included as non-Newtonian fluids are time dependent ,
time independent, and viscoelastic fluids (61) The time
dependent f luids ace tho e fo which the rate of shear at a
given point is solely dependent upon the instantaneous shear
stress at t ha t point. The time dependent fluids are usually
classified into two groups : thixotropic and rheopectic
fluids, depending upon whether the shear stress decreases or
increases with time at a given shear rate and constant
temperatur e (61). The behaviour of those fluids is
presented in figure 2
As can be seen from figure 2 1 the thixotropic fluids
exhibit reversible decrease in sh e ar stress with time at a
constant rate of shear and fixed temperature. Rh eopectic
fluids which are relatively rare in occurrence exhibit a
reversible increase ins ear stress with time at a constant
rate of shear under isothermal conditions.
The viscoelastic fluids are those that show partial
elastic recovery upon the removal of a
stress. Such materials have properties of
elastic solids (61).
deforming shear
both fluid and
The time independent fluids are
shear rate is a function of both
those £or which the
the magnitude and the

L.)
I
I I
I
"
FIGJf[ 2 f'bN-NEWTOOIAN Trr-E DEPENDENT BEHAVIOR
I
I I
✓
/ /
i CSEc-l)
L.) .......
~ @ ~
11
12
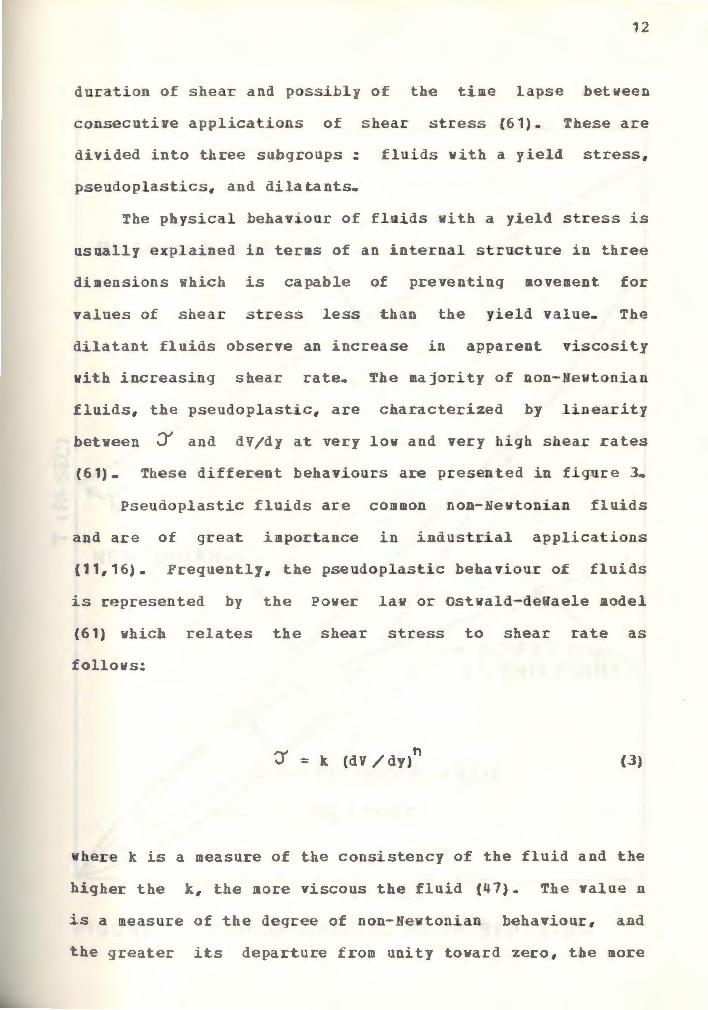
duration of shear and possibly of the time lapse between
consecutive applications of shear stress {61). These are
divided into three subgroups: fluids with a yield stress,
pseudoplastics, and dilatants.
The physical behaviour of flaids with a yield stress is
usually explained in terms of an internal structure in three
dimensions which is capable of preventing movement for
values of shear stress less than the yield value. The
dilatant fluids observe an increase in apparent viscosity
with increasing shear rate. The majority of non-Newtonian
fluids, the pseudoplastic, are characterized by .linearity
betveen J and dV/dy at very low and very high s ear rates
(61} These different behaviours are presented in figure 3.
Pseudoplastic £luids are common non-Newtonian fluid s
and are of great importance in industrial applications
{11,16). Preguently , the pseudoplastic behaviour of fluids
is represented by the Power law or Ostwald-deUaele model
(61) which relates the shear stress to shear rate as
follows:
J = k (dV /dy)"' ( .3)
where k is a measure of the consistency of the fluid and the
higher the k# the more viscous the fluid {47). The value n
is a measure of the deqree of non-Nevtonian behaviour, and
the greater its departure rom unity toward zero, the more

-u w V> . ~ -t-
BINGHAM PLASTIC
~ly
PLASTIC
,r.,_--- DIL I TANT
r < sEc- 1>
FI GURE 3 NON-NEWTONIAN FLOW BEHAVIOR
13

14
pronounced are the non-Newtonian properties of the fluid
{6)
There are other important models as Ellis. De Ha ven,
Prandt.l-Eyring, etc • (61) that will not be considered here.
.Following the definiti _on of viscosity foe Newtonian
behaviour the non-Newtonian shear stress can be written as:
= ~A (dV/dy) \'\'
{4}
Using the Power law model given by eguation 3 we can soive
for the apparent viscosity {61) by combining equations (J)
and {4}, and get
n-1 AA - k (dV/dy) l A~~
(5)
The index n is always less than unity for pseudoplastic
fluids, it is deduced that the apparent viscosity decreases
with increasing shear rate~
CMC solutions follow pseudoplastic behaviour and can be
described by the Power law model {17) although Shima and
Tsujino (59) recommend the model:

15
IY/o - IY/oo (6)
(1 +A ldV/dyj}"'
where A. is a time constant, n a material constant and
q0
, fY/..,,, the apparent viscosities at zero and infinite d V /dy
respectively.
Furthermore, Nishikawa et al (51) working with CMC
solutions in two phase systems, recommended the shear rate
calculation using the following equa tio.ns :
for VG ~ 4cm/s
and for VG~ 4cm/s
dV/dy= 50 VG
'.I .d V /d y= 1 0 0 VG 2
{7)
(8)
These equations are in agceement with other experiments(56).
When behaviour of polymer solutions or specifically CMC
solutions are compared, the same rheological properties are
not alvays reproducible since the polymers vary somewhat
with degrees of polymerization and degradation (49)

16
Gas holdup is an important property for design purposes
because of its direct influence on column size (65) and
because it is related to the gas liquid surface area and
hence to mass transfer (30). In most instances the holdup
phenomenon is measured over a cross sectional area or a
finite system volume (24). The total volume fraction of gas
phase in a system is given by
or in t erms of volumes
EG = QG QG+QL
EG = VG VG+VL
{9)
( 10)
These equations do not represent local behavio ur along the
column (22).
VARIABLES IN HOLDUP:
The gas holdup in bubble columns is primarily dependent
on gas velocity, liquid velocity, surface tension, gas and
l:iguid viscosities, temperature and pressure of the
system,roughness oft e column, diameter of the column, gas
distributor and liquid depth {23). However, due to the

17
slight differences found in the results when some of these
variabl es are varied, many investigators tend to neglect
most of these (1,10,15,29,44) Host investigators agree
upon the strong dependence of gas holdup on superficial gas
veloc ity_ Nevertheless, it is usual to find contradictions
in many of the investigations and this is mainly because the
authors have restricted themselves as far as eguipment and
systems utilized is concerned (1, 40 ,44 ,5 0).
For examp le, Akita -Yoshida (1) neglected the effect of
sparger diameter and column diameter (above 15 c. I.D.)
on gas holdup and also the liquid superficial velocity did
not show any effect on holdup with values up to 4»5 cm/s
T ey have a correlation, with a linear dependency on the
super£icial gas velocity {NFr) as follows:
( 11)
In the other hand Godbole et al (22) found that holdup
is lower for larger column diameters and also decreases with
increasing distributor plate hole diameter. They qave a
correlation for a b road range of viscosities in Ne¥tonian
liguids:
EG O.,q1h -0.0SS
= 0 319 VG fUi.. { 12)
18
and said that the equation fits most of the data with a 2.5%
error while Ak~ta-Yoshida correlation (1} gives 11 error.
Many authors (15, 18,29,32,38, 43,44) agree with the
conclusions from Akita-Yoshida (1). Others sometimes
partially agree with some 0£ their conclusions {3,64,66).
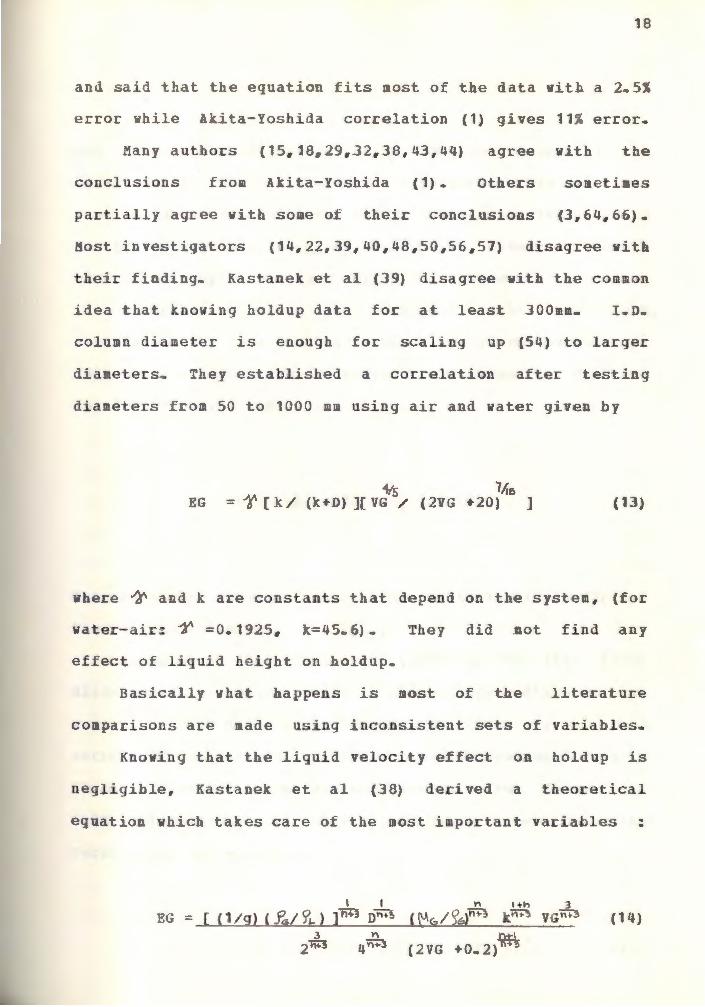
Most investiqators (14,22,39,40,48,50,56,57) disagree witb
their finding. Kastanek et al {39) disagree with the common
idea that knowing holdup data for at least 300mm. I~D
column diameter is enough for scaling up (54) to larger
diameters They established a correlation after testing
diameters from 50 to 1000 mm using air and water given by
'V5 11,e EG = t' [ k/ {k+D) ]( VG / {2VG ♦ 20) ] ( 13}
where 1" and k are constants that depend on the system, (for
water-air: --f' =0.1925. k=45 .. 6)
effect of liguid height on holdup.
They did not find any
Basically what happens is most of the literature
comparisons are made using inconsistent sets of variables.
Knowing that the liquid velocity effect on holdup is
negligible, Kastanek et al (38) derived a theoretical
equation which takes care of the most important variables . .
I I
EG = [ (1 / g) ( .Pre/ 5'1..) ],m D~ {14)
3 "' 2hTI 4~
19
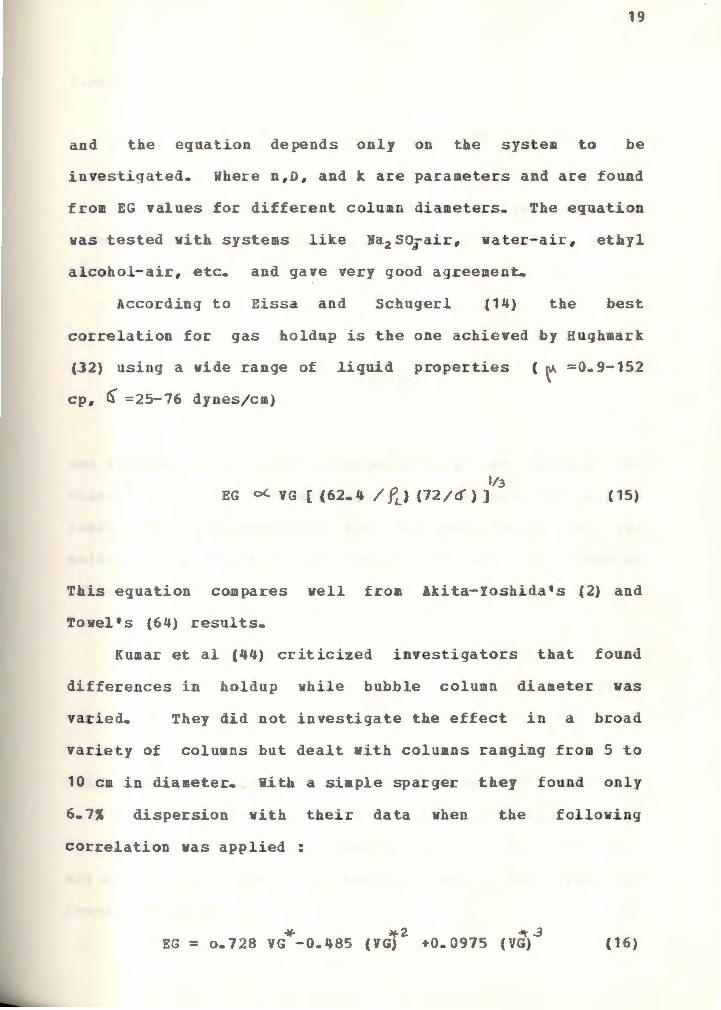
and the equation depends only on the system to be
investigated Where n,o, and k are parameters and are found
from EG va ues for different column diameters The equa·tion
wa.s tested with systems like Na2 S0 3 air, -water-air, ethyl
a .lcohol-air, etc. and gave very good agreement.
Accordinq to Eissa and Schugerl {14) the best
correlation for gas holdup is the one achieved by Hughmark
(32) using a wide range of liquid properties ( ~ =0.9-152
cp, 6 =25--76 dynes/cm}
1/3 EG o<.. VG [ {62 .. 4 / fL) (72/6) ] ( 15)
Tis equation compares well from Akita-Yoshida•s {2) and
Towel 1 s (64) results.
Kumar et al (44) criticized investigators that found
differences in holdup while bu ble column diameter was
varied They did not investigate the effect in a broad
variety of columns but dealt with columns ranging fcom 5 to
10 cm in diameter. With a simple sparger they found only
dispersion with their data when
correlation vas applied:
the following
* ~z -t\' .3 EG = o.728 VG -0 .. 485 (VG) +0.0975 {VG) (1 6)

20
where
Also using different spargers in a large diameter
columns (16in.), Towell {64) found a
correlation for holdup:
EG = VG VSb+2VG
really simple
( 17 A}
and detected only slight differences when the spa.rger was
changed. VSb in this equation is the velocity of a single
bubble that is approximately the slip velocity at low gas
holdup This equation is similar to the one found by
Calderbank (7} :
EG = VG 26.5
( 17B)
which does not correlate any effect of geometric variables.
In another attempt, taking into account a broad vaciety
of small column diameters, Hikita et al (29) did not find
any appreciable effect of this variable on the holdup and
found a correlation:

21
that also takes care of the nature of the gas used. They
checked t e a.bove correlation with an air-water system using
many qases and solutions of
non-electrolytes, and found good
electrolytes
agreement
and
Moreover,
neglecting the viscosity and density factors in (18), data
can be predicted within 15 1 error
Miller (48) f ound a relatively high effect in the
holdup from the var~ation of gas distributors in a bubble
column with a quite large diameter and some different
liquids. He found correlations that compared with others•
data gave relatively high values for holdup e.g.:
for a single nozzle: '2.
K=exp[-3. ·l.J+1 .. 689 lnZ-0 279(1.nZ) J
for perforated plates: 2
K=e.xp[-3 06•1.624 lnZ-0.237(lnZ) ]
EG = (1-YL) K
( 1.9)
(20)
{21)
\ !'1 110 -14 where Z = NRem NFrm YL and YL is the liquid volumetric flow
.fraction.
Kato et al (40) did not separate the results using
single spargers and perforated plates. They correlated
their data assumlng a EG standard at any given condit~ons

and * plotted Pe {EG/EG) vs NFr.
22
They found similar
behaviour for a large variety of experimental data with
air-water systems, using perforated plate and single nozzle
gas distributors
Yatish and Shah (57) gave a good explanation for the
varation of the holdup with the column diameter supported
observation that with larger columns random circulation of
eddies exist while in smaller ones these eddies are absent.
These results are in agreement with those of Ueyama (66}
from radial gas holdup measucement~ Also Freedman and
Davidson (19) worked with different column diameters in the
bubble flow pattern using air and water and found that the
maldistribution of gas reduces gas holdup and causes
recirculation of liquid Maldistrihutions are more likely
in large column diameters (38,58) Nevertheless, Nakoryakon
et al {50) conclude that this maldistribution especially
present in the center and near the wall will eventually
vanish if the liquid velocity is constantly increased. This
strongly disagrees with the results .by Kato-Nishiwaki (40)
and Shah et al {58). The latter authors also explain the
detrimental effects on reaction rates because o.f the
reduction in the effective concentration 0£ the species
which affects the overall driving force.
Some investigators evaluated the dispersion and
backmixing effects in bubble columns. he injection of salt
traces {14) can be detected with electrical probes or with
the help of heat transfer and sensitive thermocouples
{4.,15)m The frequent recommendation for avoiding the
23
pronounced bachmixing is t e use of large orifices in the
gas distributor plate 119). Presumably large orifices give
more uniformity in the cross sectional area (54) Also
agitation tends to give uniformi ·ty and increase the holdup
as found by Fair et al {15).
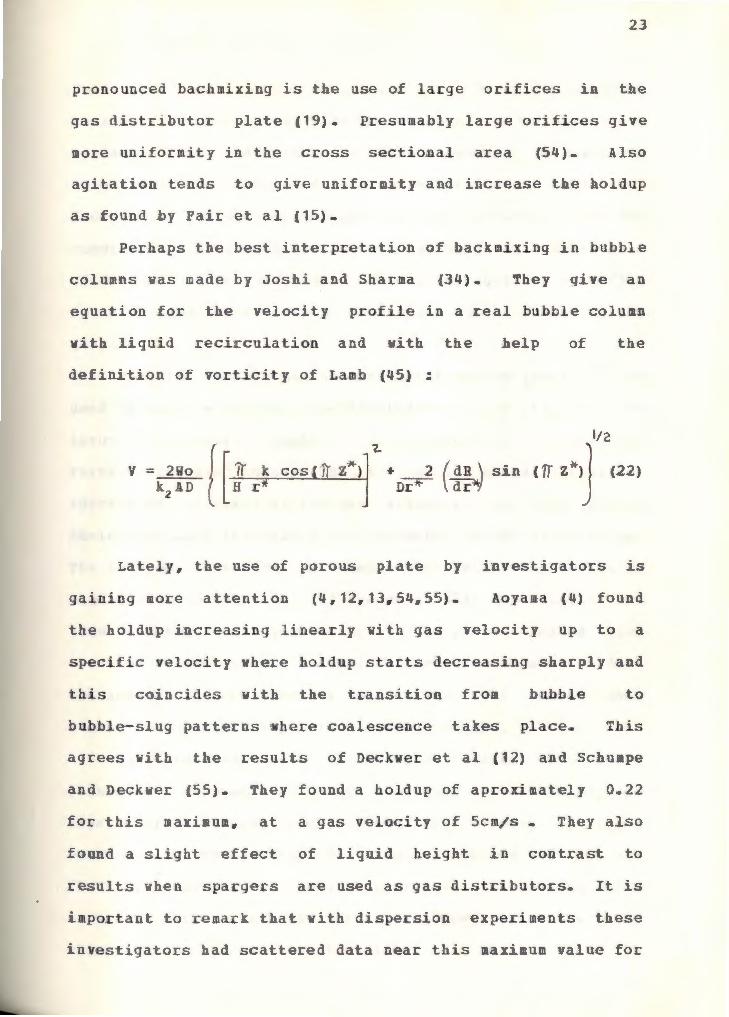
Perhaps the best interpretation of backmixing in bubble
columns was made by Joshi and Sharma {34). They qive an
equation £or the velocity profile in a real bubble column
with liquid recirculation and ¥ith the
definition of vorticity of Lamb (45) :
.help of the
[
'l. )Jt/2 [: / cos 1T z ) • nr• 2 ( ~;~ sin (ff z (22)
Lately, the use of porous plate by investigators is
gaining more attention (4,12 , 13,54,55). Aoyama (4) found
the holdup increasing linearly with gas velocity up to a
specific velocity where holdup starts decreasing sharply and
this coincides with the transition from bubb.le
bubble-slug patterns where coalescence takes place
to
This
agrees with the results of Deckwer et al {12) and Schumpe
and Deckwer {55)- They found a holdup of aproximately O 22
for this maximum, at a gas velocity of 5cm/s They also
found a slight effect of liquid height in contrast to
results vhen spacgers are used as gas distributors. It is
important to remark that with dispersion experiments these
investigators had scattered data near this maximum value for
24
hol up and minimum for dispersion (4) These observations
represent the transition from homogeneous to heterogeneous
regimes This transition is also observed
velocities when larger column diameters were
at lower qas
used ('l) ..
Except for teflon porous plates, the material used for
construction of porous plates does not have an appreciable
effect on holdup {42,47A). The unwettability of teflon
seems to give larger bubbles resulting in a lo~er holdup
{43)
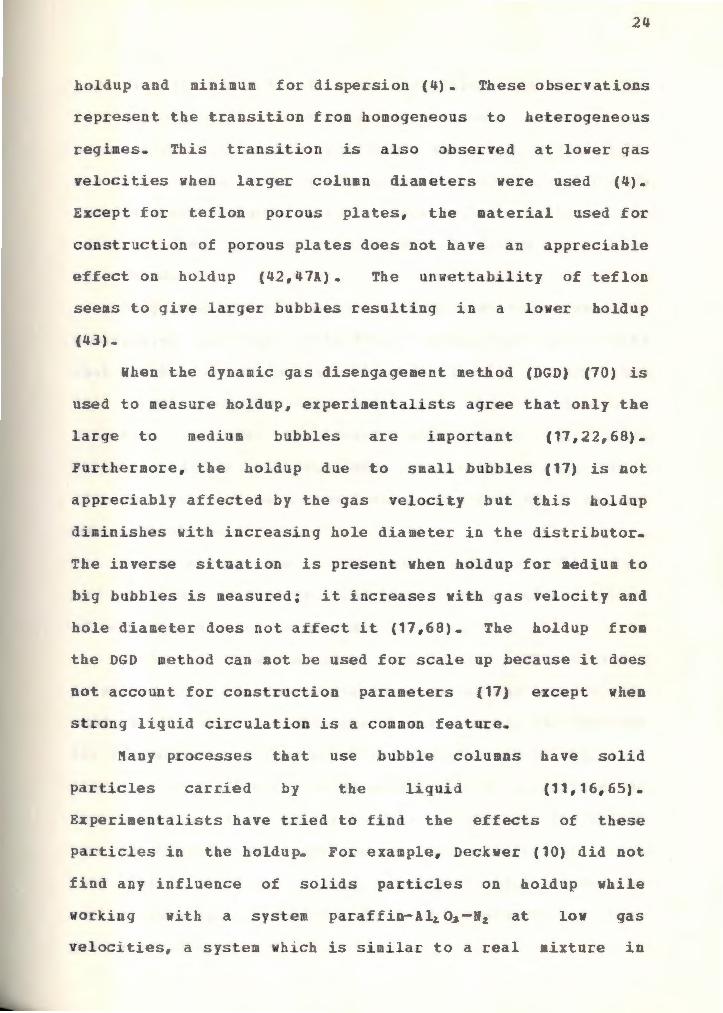
When the dynamic gas disengagement method (DGD) (70) is
used to measure holdup, experimentalists agree that only the
large to medium bubbles are important (17,22,68).
Furthermore, the oldup due to small bubbles {17) is not
apprecia b ly affected by the gas velocity but this holdup
diminishes with increasing hole diameter in the distributorQ
The inverse situation is present when holdup for medium to
big bubbles is measured; it increases with gas velocity and
hole diameter does not affect it (17,68) The holdup from
the DGD method can not be used for scale up because it does
not account for construction parameters {17j except when
stcong liquid circulation is a common feature.
Many pcocesses that use bubble columns have solid
particles carried by the liquid (11,16,65).
Experimentalists have tried to find the effects of these
particles in the holdup For example, Deckwer (10) did not
find any influence of solids particles on holdup while
working 111ith a system paraffin-A 12. 03 -N 2 at low gas
velociti e s, a system which is similar to a real mixture in

25
coal liquefaction.
to Akita-yoshida
His data is really dispersed in relation
correlation {1) without giving any
explanation. But on the other hand, Ying and Givens (70)
and Kara et al (36), also orking with low gas velocities
found the gas holdup diminishing vhen solid particles are
added. They did not detec ·t any vaciation at high
velocities.
Very good agreement exists in investigations involving
electrolyte solutions {1,13,29) Researchers have found
tat the holdup in these solutions is sliqbt.ly larger than
in non-electrolytes due mainly to the electrostatic
potential at the gas-liquid interface. For this,
Akita-Yoshida (1) suggested same correlation as in equation
(11) but with 0.25 as a coefficient instead of O 20 for
non-el e c ·trol y tes ...
Recent studies are focusing on the viscous effects in
the gas holdup (6,7,11,14,18,22,55,56) because of the nature
of real liquids used in practice (6,o5).
Eissa and Schugerl {14) worked with glycerol-water
solutions using a medium diameter column and found a more
uniform distribution of bubbles giving higher gas holdups
for viscosities up to Jcp. Tis was explained by observing
that drag forces are not large enough at low viscosities so
coalescence is less likely to happen. They plotted holdup
vs.
they
liquid viscos :ity £0:r different gas
found that gas holdup diminishes
velocities. Also
with increasing
surface tension
gas velocities.
This effect was more pronounced at high
26
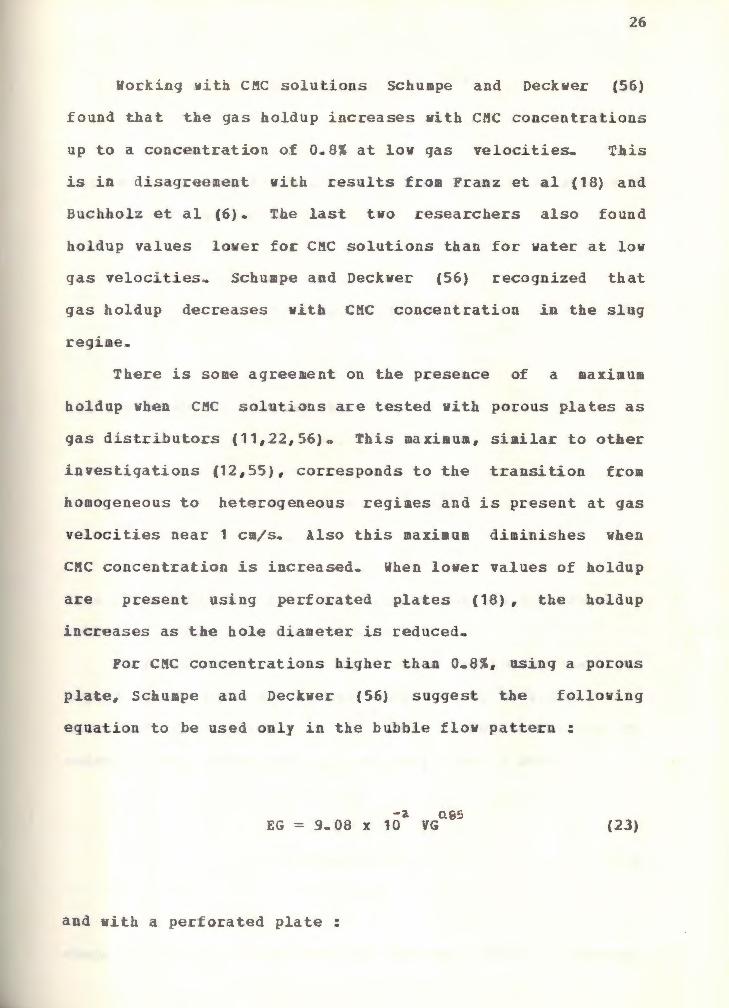
Working Mith CMC solutions Schumpe and Deckwer (56)
found that the gas holdup increases with CMC concentrations
up to a concentration of 0.8 % at low gas velocitie~ This
is in disagreement with results from Franz et al (18) and
Buchholz et al (6). The last two researchers also found
holdup values lower foe CMC solutions than for water at low
qas velocities~ Schumpe and Deckwer (56) recognized that
gas holdup decreases with CMC concentration in the slug
regime ..
There is some agreement on the presence of a maximum
holdup when CMC solutions a .re tested with porous plates as
gas distributors (11,22,56)0 This maximum, similar to other
investigations {12,55) , corresponds to the transition from
homoqeneous to heterogeneous regimes and is present at gas
velocities near 1 cm/s .. Also this maximum diminishes when
CMC concentration is increased. When lower values of holdup
are present using perforated plates (18), the holdup
increases as the hole diameter is reduced.
For CMC concentrations higher than O 8%, asing a porous
plate, Schumpe and Deckwer {56) suggest the following
equation to be used only in the b u.bble flow pattern :
-2. 0.05 EG = 9u08 x 10 VG (23)
and vith a perforated plate:

27
-2 0.87b EG = 2.58 x 10 VG (24)
and in t he slug pattern where t e holdup does not depend on
the type of distributor {18) :
-2 0,674 EG = 3.22 x 10 VG (25)
and for diameters smaller than 10 cm:
-2 ~.<o27 EG = 4.04 x 10 VG ( 2 6)
This agrees with earlier conclusions about the dependence of
holdup on column diameter (14,48,57).
Ob vi ously, in the slug flow regime the holdup does not
depend on the viscosity o.f t .he liquid phase, so knowing this
c aracteristic, Deckwer et al {11) correlate data in CMC
solutions for superficial gas velocity above 2 cm/s:
o.~z. EG = 0.0265 VG (2 7)
~here almost no difference is present using d.i:fferent
28
distributors.
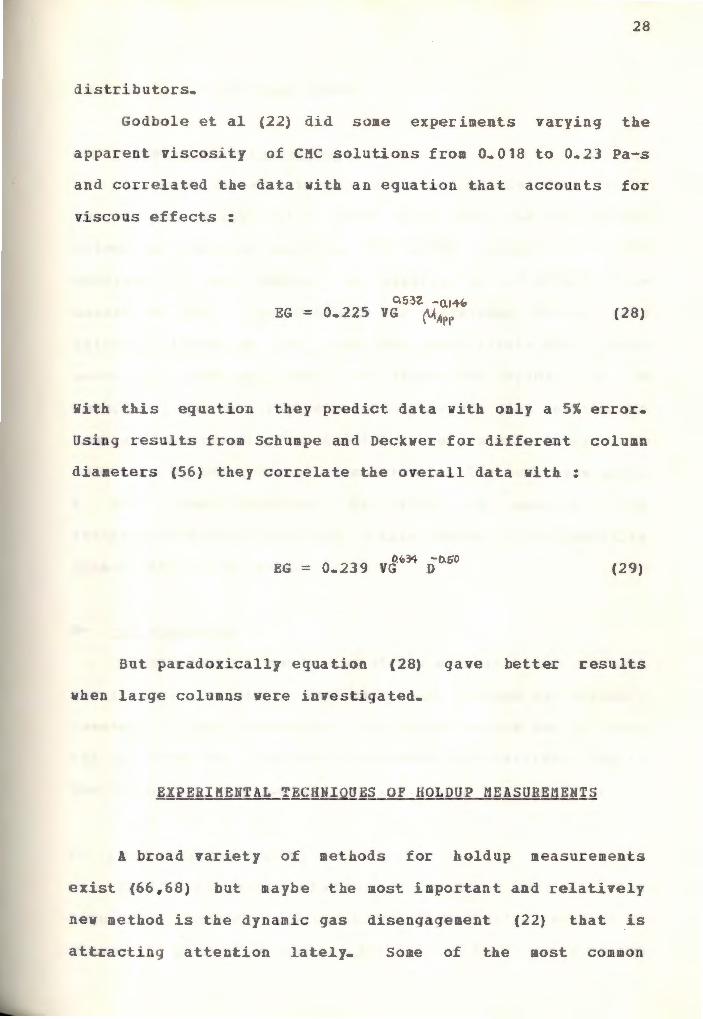
Godbole et al (22) did some experiments varying the
apparent viscosity of CMC solutions from O 018 to O 23 Pa-s
and correiated the data with an equation that accounts for
viscous effects:
0.5 ~2. 0.14'1 EG = 0.225 VG ('-iArr (28)
With this e uation they predict data with only a 5 % error.
Using results from Schumpe and Deckwer for different column
diameters (56) they correlate the overall data with:
(29)
But paradoxically eguation (28) gave better results
when large columns were investigated.
EXPE ! MENTAL ±!!fHN!QUES OF HOLDUP MEASUREMENTS
A broad vari e ty 0£ methods for holdup measurements
exist (66,68) but maybe the most important and relatively
new method is the dynamic gas disengagement (22) that ~s
attracting attention lately- Some of the most common

29
techniques are reviewed below.
A- Dynamic gas disen.9~.9g,mgg,1_:
This method cons · sts of measurement of the decline of
the aerated height with time after the gas flow to the
column has suddenly stopped. The method assumes that the
behaviour of big bubbles is similar to the steady state
conditions {68). The technigue was developed because two
different types of behaviour were noted within t.he bubbles
swarm (17). Te gas leaving the dispersion rapidly can be
considered as the instantaneous transport {68) and the gas
leaving subsequently, represented by very small bubbles is
entrained by local liquid circulation. The technique needs
a high speed response. In order to measure the
instantaneous variations {22) a film camera or resistivity
probes (68} can be used.
B- Bed expansion :
Measurement of the height of the bed with and without
gas flowing is widely used when batch systems are present.
Ho~ever , at high throughputs, the height before gas is shut
off is difficult to measure because of fluctuations (15) in
the top of the aerated bed
c- Quick closing valves . . This is the same method as bed expansion but with the
liquid also flowing so both gas and liquid valves have to be
closed at the same time and for this it is necesary to use

magnetic or solenoid valves (14).
D- Pressure drop measurements . .
30
The pressure drop in a bubble column is related to the
holdup (69} as follows:
EG = { t,. <f / f. } A h /fl Z L
(3 0)
where ..1 h/-ll Z is the pressure drop in a speci .fic column
length. Therefore, this method allows the investigator to
calcu.late the holdup at many positions along the column and
have a better estimate (29) 0£ axial variation.
R- Electrical probes . . For this method, measurements are based in t.he
differences in electrical conductivity between the two phase
within the bubble column It has been found to be accurate
because t e device can be moved both axially and radially
and detect the local holdup instead of the overall holdup as
in most of the methods {43). However, inaccuracies arise
because oft e effect of the probe on the localyzed pattern
at the probe ..

31
BUBBLE SIZE AND INTERFACIAL AREA
These two terms are closely related (65). The better
the observation of bubble dynamics# the more accurate the
interfacial area can be determined.
Bubbles swarm and sha2es:
The behaviour of
together is different
large number of bubbles crowded
from that of isolated bubbles (65).
The wakes o.f bubbles distu rb each other giv .ing rando motion
through the continuous phase (27) and the zig-zagging motion
of an isolated bubble is no longer present. The random
motion 0£ the bubbles is damped by the viscous behaviour of
the liquid at low gas velocities but not at high gas
velocities (60).
The bubble shape varies Yith the gas velocity (46) and
some specific shapes can be defined:
SE.,herical :
Bubbles are closely approximated by spheres, in this
case, interfacial tension or viscous forces are much more
important than inertia forces {8). Some oblate spheroids
are considered spherical particles if the minor to major
axis catio lies within 10% of unity (8).
Ellipsoidal :
These are oblate bubbles although most of the time they
are not a steady state shape because of their motion
SQherical ca2 _:

32
These bubbles look very similar to segments cut from
spheres or oblate spheroids of low eccentricity.
authors call them mushroomlike bubbles (25)
Some
The bubble defoz:-ma tion is primacily increased ,with gas
velocity and Grace et al (25) give a graphical correlation
for those shapes utilizing the Reynolds (liguid properties
and U,De of the bubble) and Eotvos numbers-
VARIABLES OF INTERFACIAL AREA
The effects of many variables on interfacial area in
bubble colum s have been studied by a large number of
investigators (13,32,49,64)
interfacial area depends on
It can be concluded that
. . Gas flow, height of the
bubbled liquid, physico-chemical properties of the system,
Col Ulllll diameter, gas distributor geometry, parameters
affecting the bubbles motion in the column# and the presence
of particles or traces of surface active matter as well
(38 ,65)
With the exception of a few correlations {37#44,56)
most of the investigators tend to use the known relation for
interfacial acea (65)
a = 6 EG /d ( 31)
which assumes bubbles are sphe~ical.
Most experimenters deal with the me asuremen ·t or
33
observation of bubbles shape and its relation to an averaged
bubble diameter (2 , 18 , 49 , 66). Discussion involving bubble
size should be understood as being inversely related to
interfacial area.
Kolde et al (42) found that the nature of the gas used
in bubble columns does not give any significant effect on
the behaviour of bubbles. This simplifies the scope of any
investigation as far as bubble size is concerned
Knowing that between bubble and bubble-slug patterns
(63) , the interfacial area tend to reach a maximum (31 , 56)
some authors tend to characterize this as a transition.
Specifically, Otake et al (52) found a ratio standard
deviation/average bubble size near 0.15 in this region while
far appart in the slug pattern the same ratio is
approximately 0 .. 4 Also Nakoryakon et al (50) found a
maximum wall shear rate while increasing gas velocity and
also that the maximum coincides with the transition from
bu hle to bubble-slug pa tter.ns.
The principal problem is how to approximate the bubbles
shape to an average diameter for a hypothetical bubble
Many authors have presented good approximations
(2,6,9,25,31,66) of bu ble diametec. For example , Davies
and Taylor {9) attempted to give a qood and realistic
equation for the approximation of spherical caps to spheres
taking into account the radius of curvature of the caps.
Re= 2.3 Rb (32)

34
Treybal (65) presents some empirical correlations for
estimating average bubble diameters and concludes that to
obtain very good estimates in ai.c-wa ter the
eguation is the best:
-2 d = 2 .. 344 X 10 O.lo7
{VL / 1 - EG )
fallowing
(33)
Houghton et al (31) measured the major and minor axis
of oblate spheroids in agueous solutions with air and found
the axis related by b=1 2a and recommended the use of the
equivalent diameter of the spherical bubble for the same
volume as the oblate {D = (abt)½ so
De = 1. 1 3 a {3 4 )
Where 'a' is the minor axis of the oblate spheroid.
But in the most important region of two phase flow, the
bub.bles have a broad variety of shapes and it is important
to take into account the distribution of them in order to
end up with the best estimate of interfacial area. Akita
and Yoshida (2) proposed to eliminate bubbles smaller than
0 8~m. Their contribution to oldup or interfacial area
(17,18) can be neglected. The bubbles that are not a sphere
can be approximated by an o.hlate spheroid resulting in good
35
agreement with Houghton et al (31). They found the mean
volume-surface diameters follo~ed a geometrical distribution
function and gave a good estimate of the volume-surface
diamet e r :
l/3 d Vs = 1 • 8 8 (Vo/ V g do' )
do {35)
They developed a good correlation for a broad variety
of liquids in agreement with most of authors {32,39} ..
-050 - 0 .12. dVs = 26 NBo ( NGa NFr} (36)
D
They fouod the mean diameter dVs decreased when column
diameter was increased.. With the help of the Akita-Yoshida
(1) holdup relation, equation (11), they found a correlation
for inter -acial area when holdup is below O. 14 :
0,6 0.1 1-13 aD = 1/3 NBo NGa EG (37)
It is important to emark that although all their
experiments where done with a sparger as gas distributor,
they recommend this equation for perforated plates too.

36
Particularly important are the mean dia~eter analysis
of Franz et al {17) and Ueyama et al (66). For the £armer,
the use of t he gas dynamic disengagement method (22) led to
the inclusion of two main bubble sizes, one relatively large
and another very small, {aprox.imately O. 1111m) {22); and the
calculation of the Sauter mean diameter {2,44) with the help
of the holdup for both fractions {22) :
d Vs = f L .nki dki3
+ .[ nGi dGi"3 (38)
2 2. f .Lnki dki + LnGi dGi
3 '3 Where f = (Ek .LnGi dGi} / (EG 2. nki dki ) with the mean
diameters beha ving as a normal distribution. The Sauter
diameter of sraall bubbles does not depend on gas velocity or
gas distributor while the medium to large bubbles Sauter
diameter increases with both.
eq uation for inter facial area:
They also suggested an
a= 6(Ek +EG) (39) { 1-Ek -EG ) dVs
Using liguid holdup. This improved the correlation of their
data.
However , they also calculated the interfacial area for
large and small bubbles separately making it easy to

37
determine the low contribution of small bubbles to the
overall interfacial area.
conclusions of Godbole et
suggested them not being
accuracy of scaling up
accounted for.
This is
al (22).
totally
would be
in agreement with the
Godbole et al (22)
neglected because the
improved if they are
Fran~ et al (17) using glycerol solutions found many
contradictions within their own data. The only interesting
feature they found is that 1s~ more inter£acia1 area results
by evaluating t he true surface of large bubbles as rotation
ellipsoides.
Another inter e sting way to measure the average bubble
diameter was developed by Ueyama et al (66) who used the
resistivity probe method. They div.ided the cross sectional
area ~nto multiple identical cross sectional area portions
and calculated the average Sauter diameter for the overall
cross sectional area by the eguatio.n:
<dvs) = ~ EGiASi/( L EGi ..6 Si / dVsi} (40)
They a lso calculated the arithmetic average diameter
and found t1is value 1.5 times greater than <avs) They
found the largest bub b les in the center of the column and
the smallest in diameter near the wall and both. always
increasing in diameter with gas velocity.
Th ey noted that (dVs) might be smaller than the true
]8
dV s w.he considering mass ·transfer between liquid and qas
due to the fact tat small bubbles near the wall were taken
into account and hose might be only recirculating in the
column with little contribution to overall mass transfer
{68).
Buchhol z et al {6) remark that t eir mean bubble
diameter data gave a trimodal distribution with the first
ellipsoidal shapes appearing at superficial gas velocities
near 3cm/s. Increasing ·the gas velocity, the distribution
becomes bimodal with large ad small bubbles only. They
also found that increasing the column height , the bubble
diametec incr e ases with the negative ef£ect for the
interfacial area- They took data at three different axial
positions finding almost the same size and behaviour using a
p otographic method. This axia1 behaviour agrees with
results from Towell et al {64) and Deck~er et al {12) , using
gas spargers. The former , actually did not find any
variation with gas ve locity and atributed those results to a
balance in coalescence and break-up. These latter authors
found mostly oblate sp eroides bubbles in their data and
preferred to correlate the mean diameter to the d.iameter of
a sphere of equivalent surface aream
Using a simple sparger distributor Frontini and
Williams {20) found the interfacial area given by l i near
relation with the super£icial gas velocity using the Sauter
diameter for their calculations. Kumar et al (44) found
correlations for the interfacial area related to the sparger
hole diameter and gas velocity in two different sparger

39
Reynolds
linearity:
n u.mbe r ra_nges- Also they did not .find any
100 < Reh < 2100
O.iZ5 2. I/,;. -)f- -lf 2 ,li 3 ( e.h ) (<f do1/Llfg)=13650 VG -9 .. 094 (VG) + 1.828 {VG) (41)
a.nd Reh > 2100
z 'l"'l Q4 M- ~ z it 3 a(ado /Afg)Reh = 0.0437 VG-0.0291{VG) + O.OOS(VG) (4.2)
where VG* was defined in equation {16).
Data was correlated with a maximum 17% error for some
two phase systems They also developed quite complicated
e.guations foe the calculation of Sauter diameter (17).
Schumpe and Deckwer (55) found a strong increase in the
mean Sauter diameter with increasing gas velocity but with
perfocated plates a somewhat pronounced decrease was
noticeable. At low gas velocities the perforated plates
always give higher values for mean Sauter diameter as
expected and found by same authors {56). The interesting
feature is that when high gas velocities exist, the mean
Sauter- diameter tends to level out at 3mm independent of the
sparger used consistent with Deckwer et al (12). These
authors results agree with those of Shulman and Molstad (60)
with water-co, and water-H, systems.
Many authors (J,7,26,31,36,42,54,64,67,70) conclude
40
that the presence of even traces of surface active agents
reduces coalescence of bubbles and increases their rise
velociti es . Koide et al {42) worked with and without
surf ctants and found smaller average bubble size in a
narrow range when surfactants where used Wi thou ·t the use
of them the bubble size was bigger and a really broad size
distribution was present
wit
They correlate the bubble size
( 43)
Calderbank (7) remarks hat t ere is a minimum size and
any futher addition of surfactants can not affect it.
Anderson and Quinn {3) found the sam e effect while usinq
electrolytes and larger holdups (3,70). Dec wer et al (13)
f ound the interfacial area for electrolytes five times
larqer than without them, but on the oth er hand, the mass
transfer coefficient decreased with the addition of
elect-colytes in such a way that K1a f o.r electrolytes is
1. SKLa for non-electrolytes ..
Anderson and Quinn {3) also found problems in repeating
the experiments especially holdup, even under closely
controlled situations They assumed that there is a
hysteresis effect in passing £rom one pattern to another.
Moceover , the same hysteresis effect was not repeatab e in
consecutive experiments

41
New investigations of viscous effects and bubble
behaviour {22,36,38,49,56} have been made due to the
increasing importance in industry. Houghton et al (31)
found that bubbles become mor-e spherical while viscosity is
increas-ed_, so app ica tion 0£ equation (31) is mo.ce accurate ..
Kara et al {36) however found disimilar results, when
viscous solutions were studied. They found bubble
disintegration at low viscosity and increasing babble size
and coalescence at hig viscosities. liowevec Peebles and
Garber (53) noted little ef£ect of viscosity on the bubbles
motion provided that Reb ~ 3.1 (g (\'ti /? <f~ g/ )~4 •
Kastan~k et al (38) presented a relatively good
equation for calculating interfacial area in viscous
solutions. Yhere glycerol aqueous solutions
principal syst ms:
EG / a = e / 4
de= e uivalent diameter.
with 18 % as the hiqgest error.
"Were the
( 44)
All these results were found in viscous Newtonian
solutions, but for non-Newtonian solutions the results ace
not so different. For example, Nakano and Yoshida (49)
found the bub le size decreasing with increasing
viscoelasticity They predict the Sauter diameter with a
42
Newtonian equation proposed to
-1/z -0 .12. -0.IZ dVs = 26 NBo NGa NFr (45}
ff ith the help of results from Yagi-Yoshida (69) and the
inclusion of t h e Deborah number they give a good graphical
correlation for the interfacial area as a function of mean
Sauter diameter
They conclude that the interfacial area and mass
transfer coefficients in viscoelastic fluids seem to be
smaller than in inelastic fluids. This is due to the fact
that in viscoelastic fluids large bubbles mingle with very
fine bubbles v ereas in
relatively uniform in size.
inelastic liquids they are
Godbole et al (22) did not find the bubble flow pattern
above gas velocities of 2cm/s for any CMC solution. Only
below CMC concentrations of 0.15 $ was the existence of two
bubble sizes observed. When they plotted VG /EG vs. VG a
common intercept right after 0.25 concentration appears;
this means the same bubble rise velocity* which partially
aqrees with results from Calderbank (7) * who found the
rising velocity independent of the viscosity.
Franz et al (18) found that by increasing the CMC
concentration# the Sauter diameter became larger and the
bubble size distrlbution broader for the same perforated
plate. However, the concentratlon effect is reduced if the
43
perforate.a plate hole diameter is increased.. Obviously , the
smallest hole diameter with tha least concentrated solution
has the largest inter-facial area, but at high concentrations
no differ-ences wer e .found with the variation of perforated
plate, in agreement with Schu pe and Deckwer {56).
These latter authors remar that with increasing gas
velocity, at all CrtC concentrations, the interfacial area
monotonically increases, but with increasing CMC
concentration there is a drastic decrease in interfacial
area. Using a sintered plate , a sharp maximum for
interfacia1 area is observed at VG= 0.7cm/s, and if this
amount is re qui red in the slug pattern, the gas velocity has
to be increased approximately tenfoldQ The mass transfer
coeffici e twas found almost constant ¥ith a value of
approximately n 013cm/s, which is in contradiction with
Buchholz results {6).
Maybe t e best results were presented in a graphical e,51
correlation, where plotting a vs. (VG / ~A ) a straight "f(>
line was achieved for all distributors
concentrations giving the following relation:
-2. a = 4 65 .x 10 /
0 • .51 { VG ('AAt>f)
and CMC
(46)
where ~A~ is calculated following Nishikawa et al (51)
correlations (e uations 7 and 8).
As a conclusion, Sc umpe and Deckwec (56) remar~ that

44
t e gas velocity and ef£ective viscosity ace the only
important parameters to be considered for interfacial acea
and holdup, provided that the bubble column diameter is
large enough (11)
EXP~jI!1EN AL TECHNIQUES FOR INTE ACIAL AREA DETERMIN!!!ON
Many techniques are used for determining bubble size
but only the most important ones are described
This is the most simple method. The special equipment
needed is o ly a high speed camera in order to freeze the
bubbles in their motion Usually pictures are taken at the
wall and high enough in the column to avoid entrance effects
( 7) ...
Resistivity probe:
This is a relatively simple method of size measurement~
Bubbles in their rising motion touch two vertical
sequentially positioned tips. These tips are conected to a
electrica circuit and when the dispersed phase (gas) touch
them , the electric conduction is less (66). With the time
spent by the bubble in touching both consecutive tips and
the distance between them, the bubble velocity can be

45
calculated. With the time duration of a bubble signal
recorded in one tip, the diameter of the bubble can be
calculated using its velocity
The method is likely to have error assigned in
neqlecting proper couples of small bubbles signals, so it is
possible to measure larger diameters than the true mean
dia ete {66) On the other hand, a big b bble {bigger than
the gap between the tips) is found smaller with this method.
"Chemical" method:
This method is based on specific well known two phase
chemical reactions {55). For example, a gas A is absor ed
on a liguid Band an irreversible pseudo m~ ocder reaction
takes place Measuring the absorption rate per unit volume
{R Aa) a d knowing also the kinetic proper ties of t.he
reaction, t e interfacial area can be calculated from:
( 4 7)
~
where CA is the eguilibrium li uid concentration
This is a relatively recent method of measurement (21)
Fiber optics is well known by its good light transmission
ad the method takes advantage of this property The light

46
is conveyed to the objective and if t e probe ~sin a gas of
low refractive index, the light is totally internally
reflected and returned throuqh the gu~de but, if it is
inmersed in a liquid of high refractive index, the light is
transmitted and dissipated Investigators take advantage of
the transition from one mode to the other which produces a
step change in reflected light intensity which is helpful to
detect the passage of a bubble boundary (21). This
principle is the same as that used in horoscopes. Their use
would be advantageous in bubble columns due to their easier
installation and their movabi .lity. Th us investigation of
bubbles dynamics can take place in any specific position in
the column. The bubbles motion can be seen throuqh, and
photographs can be taken.
All these methods have their own restrictions Schumpe
and Deckwer {55) say that the photographic technique in
general gives igqer values of interfacial area than the
«chemicaltt technique, and the difference increases with the
gas £low rate and is even greater when CMC solutions are
used. At very .low gas velocities both methods see.m to
agree. They also state that the photographic method
underestimates the bubble diameter especially vhen spherical
caps are present and also because of the assumption of
radial symmetry.
Many investigators found very good agreement between
photographic and "Chemical" methods (44 , 46) , photographic
and resistivity probe methods (66) and photographic with
scattering light met ods (7).
47
Buchholz gt al (6) attribute the differences between
"Chemicdl 1' and photographic methods to the fact that usually
only the superior or front portion of the bubble
participates actively in the mass transfer. Linek (46)
investigated both methods and concludes that the interfacial
area in the 11Chemical" method is dependent on the oxygen
absorption rate This is due to the shrinkage of bubbles as
a result of absorption.

48
III. EXPE INENTAL iORK
~xQerimental setup descriE!ioB_~
.Figure (4) depicts the schematic diagram of the
experimental set up.
The bubble column used is made of plexiglass and its
inside diameter is 33 3cm wit a wall thickness of 0.64 cm.
The total height of the column is 5 40, consisting of four
128cm long sections flanged together and the gas distributor
system w ic occupies 19cm of the column. A total of twelve
pressure taps were in t e column, the lowest being 12cm
above the gas distributor. The distance between the :bottom
five taps is 31cm, £or the next six taps the distance change
to 60cm and t e last one has only 35cm separation. Every
tap has a hole of aproximately O 15cm. The tappings were
all connected to a manometer board by means o.f f lexi.ble
polypropylene tubing The manometric board consists of a
glass U tube manometer containing carbon tetrachloride
{CC14
) as the manometric fluid.
Air was supplied by an existing compressor through a
filter, pressure regulator, and rotaIDeters. A control
valve was used to regulate the gas flow rate and a magnetic
valve for quickly stopping the air flow.
Aqueous CMC solutions were pumped from a tauk, 0.64m
in diameter, through a magnetic valve, filter, rotameter and
control valve. Air entered the column at the bottom,

1311 Plexiglass column
Pressure taps
Rotameter
\ompressed air \L ,
J:- \_ Regulator
Filter
Distributor plate
FIGURE 4
Liquid
BUBBLE COLUMN SCHEMA TIC
165 Gal tank
Pumps
30 Gal tank
.i:,. 1.0

so
through the gas distcibutor region consisting of a 10cm long
cylindrical section packed with 1 4cm long and 1.2cm
diameter ceramic raschig rings followed by a 28cm diameter
distributor plate. The plate is a porous plate made with a
mean pore diameter aproximately of 70 um The distributor
plate was fitted, so as to make sure air enteced the column
only through the plate and not through its sides.
Liguid entered right above the
two phase mixture flowed up the
gas distributor The
column and the liguid
returned to the tank overflowing on top of the column and
the air vented ..
Two 1/4" holes were made in the column one at 62cm and
the other 141cm above the gas distributor; these holes were
used to set a oorescope at different radial positions in the
column. The borescope is an Olympus A080 and an Olympus 0M2
Camera was adapted to the borescope in order to take
pictures of bubbles at different radial and axial positions.
Ex~erimental procedure:
All t.he experiments -were conducted with no liguid flow ..
The experiment started by filling the column vit a specific
CMC solution. In this case solutions from 0.25 to 2.01 in
weight, wLich were prepared using CMC from Sigma Chemical
Co and distilled deionized va tee with a maxi mun of 10 ppm
as equivalent sodium chloride.
Then, the air control valve was opened and the air
pressure regulator set to approximately SO psig The air
51
flow rate was adjusted to a desired value and the system was
allowed to equilibrate for about 5 min. At this moment the
air flow rate, air temperature and pressure at t e
distributor were noted The borescope was set inside the
column at 141 cm above the distributor and 2.5cm from the
wall and approximately 18 pictures taken with the focus
distance set 2mm from the tip of the borescope. Photographs
were also taken with the .horoscope located at 5cm, 7.5cm,
12.5cm and in the center line of the column~ In earlier
experiments , the borescope was switched to the lowest axial
position to see the variation in the bubbles size.
Photographs of a ruler with O 5 mm divisions were taken at
the same £ocal distance as that set in the borescope in
order to have a pattern of comparison £or the bubbles size.
The temperature 0£ the liquid was also observed.
The height of the bu .bbled bed was ·taken and tllen the
magnetic valve n th e air line closed and the air
disengagement (22) monitored at 5sec intervals after the
valve was closed. Samples of the solution were drawn at the
beginning and the end of the experime tin order to evaluate
physical properties as viscosity, surface tension and
density.
The density was measured with a hydrometer. The flo-w
curve of the solution was determined with a viscometer Haake
V-12, and the surface tension with a Fisher autotensiomat
For every solution, experiments with 8 different air
flow rates were conducted. The same procedure was repeated
for the different solutions investigated.

52
The fluctuation in the air rotameter readings were
neqligible .. But .for hiqh velocities and/or high CMC
concentrations there were fluctuations in the bubbled bed
height giving a corresponding error in average gas holdup of
7
Calculations of desired parameters:
The total gas holdup is calculated using the following
eguation:
EG = Hh-Hl Hb
( 4 8)
Where Hl represents the height of the liquid bed and Hb is
the height of the bubbled bed.
The bubble gas rising velocity is calculated by:
Vb = I! EG flt
( 49)
Whe,re the ratio A EG/A t is found as the slope in figures 11
to 15.
The interfacial area for unimodal distribution is found
with:
a = 6 EG/dVs (31)

SJ
Where dVs represents the mean Sauter diameter.
For a bimodal distribution the equation changes (see
appendix A) to
a = 6 EG1 + 6 EG2 V2 (50) dVs db V1
Where db represents th equivalent diameter of the large
bubble and V2/V1 t e rat · o of gas bubbles rising velocities
with subindex 2 forte large bubble.
54
IV~ DISCUSSION OF RESULTS
Holdup showed a maximum with superficial gas velocity
for the porous plate distritutor. This maximun is shi ted
to lower gas velocities as CMC concentration is increased.
Ho eve~, for high CMC concentrations this maximum was
obtained at the superficial Gas velocity of 1 cm/& Also,
the maximum in holdup tends to vanish with increasing CMC
concentration {see figure 38).
The holdup £or diffecent CMC concentrations at the same
gas velocity is always lower for the higher polymer
concentration in the bubble-slug pattern. See figures 34
to 38.
Gas disengagement :
From figures (11 to 15) for gas disengagement it is
important to remark that the higher the gas velocity, the
steeper the slope £or disengagement{from Oto 6 sec). This
means that the gas leaves the bubble column faster and the
average size of the bubbles present .in the column is bigger
at higher gas velocities. Also it is interesting to realize
that a constant slope throughout the gas disengagement for a
specific velocity and a specific CMC concentration,
represents a uniform bu ble size. The holdup was found to
55
be a maximum in this particular case as was expected •
. Fcanz et al (18); nave found higher values for gas
holdup, even using perforated plates.. Differences are
especially at high gas velocities with about 40 % vaciation
in most o the cases.
Using a sintered plate v.ith 0 . 2mm pore diameter,
Deckwer et al (11) found a maximum in holdup at the same gs
velocities as tis study. i.e., VG =1 cm/s. The value of
holdup is always lower than that round in my experiments.
For example using a 1. 5 CMC solution they .found EG =O. 04 as
the maximum while in this study the maximum is 0.12.
Similar differences were found by comparing my results wit
results from Buchholz et al (6) using a C.r-Ni stainless
steel porous plate with 17.5 um as the mean pore diameter.
Both experiments (6, 1) were cacried out in 14cm diameter
bubble columns and low superficial liquid velocities which
does not affect the holdup greatly (56).
In general, gas holdup values obtained from my
e.xperiments are very close to those of Schumpe and
Deckwec(56) .. Their results, results from Buchholz et al
(6) and my experiments exhibit similar curves for holdup vs.
superficial gas velocity as far as CMC concentration is
concerned. See figure (5).
Bubble Size and Interfacial Area:
Figures 16 to 25 show the radial variation for
size at differrent gas velocities and
bubble
CMC

(J) <(
u
~ - - ---- -- --- --- ----- ·- -- --(D
0
N
0
't 0
0
0 0
00.00
F:CGRE 5
WI IH THE LITERAi URE FOR
A l.00 ! CMC SOLUl ION
~ GU[HUQLZ EI AL REF. 6
t SCHUM0E-DECKWE~ REF. 56 iHIS S1UOY t
I .00 2.0C 3.00 4.00 5.00 6.00 SUPERFICIAL CAS VEL. rm/5
56 , ·
57
concentrations. In general, the bubble size is smaller near
the wall and has its peak approximately at R/2... For the
same gas velocity the bubble size increases with CMC
concentration as ~an be seen from fiqures 29 to 33~
However~ at high CMC concentrations, the data is scattered
and no specific behavior can be interpreted. Nevertheless ,
for a 1.001 CMC solution, mean Sauter diameter values are
very close to those from Franz et al {18)o
Bubble size did not vary significantly at different
axial positions in the lower portion of the column .. Two
positions one at 62cm and another at 141cm from the
distributor where tested and approximately the same bubble
size was found. However, no other higher axial position was
investigated although it Yas evident that at high
throughputs coalescence takes an important roll-
For low CMC concentrations the formation of large
bubbles starts at relatively high superficial gas velocities
(figure 26). However, with highly concentrated solutions
big bubbles are evolved with gas velocities as low as 1cm/s ,
which represents t e absence of a well defined homogeneous
£lo'W
At low gas
excluding 2 .. 0%,
velocities, for all the CMC solutions
a maximum in specific interfacial area was
maximum is achieved at a superficial gas found. This
velocity of 1cm/s foe intermediate concentrated solutions
{figures 8,9) and at relatively higher gas velocities for
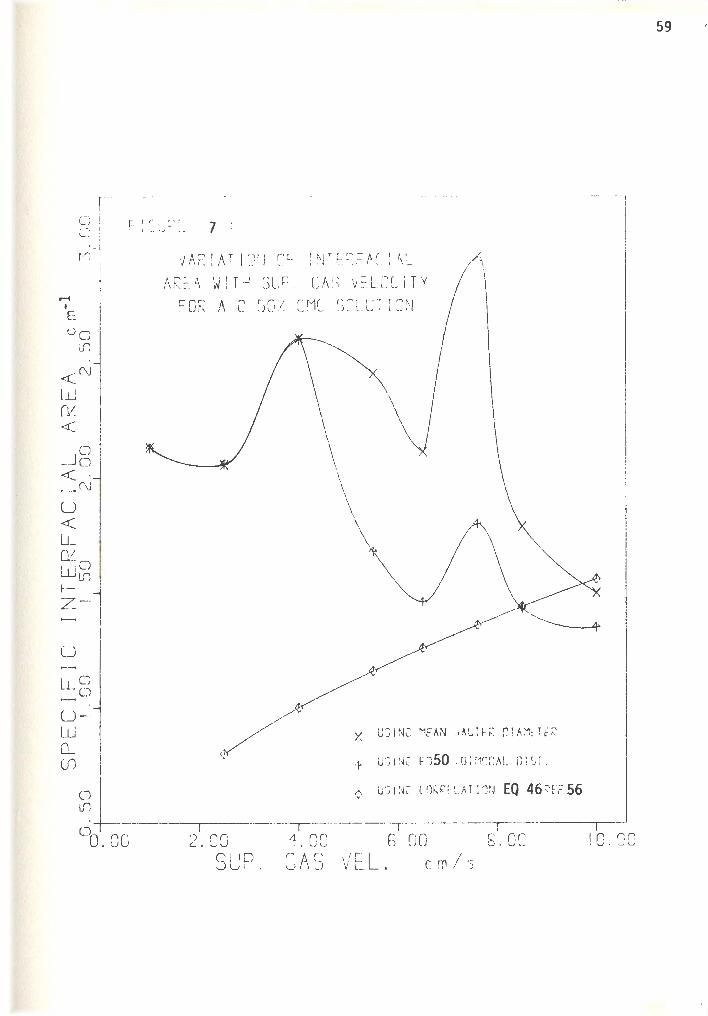
the more diluted solutions (figures 6,7). This maximum
diminishes with increasing CMC concentration and its

' - ---- --- - -- --- --- -
c j L'._I ln
..... I
E OC)
0
<~ LlJ cu <C
C) _J o <C ' ·-~')
u <C LL CUC) w 0 ~- . zc\J
u
U- · UJ (l_ CJ)
0 0
~- CJO SUP.
58
✓ AR I ,\ T I ON O ~- : ~JT r. R ~ AC I AL M~[ ,~ W ! TH SUP. CA:; VC:LOC IT Y
coR A C. 2~i/ CMC SOL.UT I CJN
·t-- u·:., NC-l i:50 G; :10D,AL cl s i .
<:· us1:~c C'.}!Sl·LAi l:.l~J r:c.46 .ls'.FF.56
·----r--5. OG 1 . 00 ~.00 ! I . 00 rAc -,r l / u ~> ~ ~ . cm s
C) r----F~t~--~: t -- -----. (_"J I , LJ "~ - 7 .
M ✓ A~!AT 10N
...... I
E
M~EA WIT w :;GF. CA'.; Vf.LOLi TY FOR A O. SO/ crvic '.;CUJT l G~J
00 Ln
<CN w O!. <C
_Jg <C . ,__,N
u <C LL 0/0 Wu1 ~- . z-
u LL o
0 ,_...
uw Q__ (f)
0 Lf l
00 . 00
I ,, n,, c.... U-.J
SUP,
X U~INC ~FAN ] AL1FR ClAM~lfR
~ U~INC FC50 .GIM~nAL DlSI .
◊ U'3 I NC COfSTL AT I rJ;J EQ 46C-FF 56
~.co s.oo s.oo CAS VEL. crn /1
59
10.GO
60
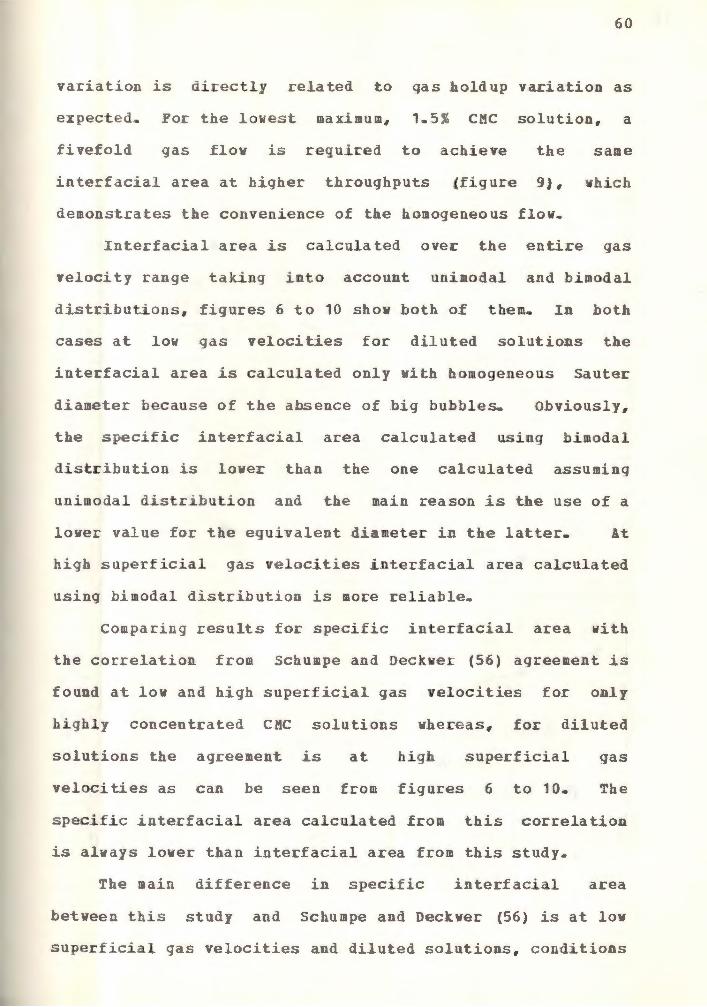
variation is directly related to qas holdup variation as
expected.
fivefold
For the lowest
gas flow is
interfacial area at higher
maximum, 1.5 % CMC solution, a
required to achieve the same
throughputs (figure 9Jr wh~ch
demonstrates the convenience of the homogeneous flow~
Interfacial area is calculated over the entire gas
velocity range taking i to account unimodal and b~modal
distributions, figures 6 to 10 show both of them. In both
cases at low gas velocities for diluted solutions the
interfacial area is calculated only with homogeneous Sauter
diameter because of the absence of big bubbles. o.bviously,
the specific interfacial area calculated using bimodal
distribution is lower than the one calculated assuming
unimodal distri.bu ·tion and the main reason is the use of a
lower value for the eguivalent d~ameter in the latter. At
high superficial gas velocities interfacial area calculated
using bimodal distribution is more reliable.
Comparing results for specific interfacial area with
the correlation from Schumpe and Deckwer (56) agreement is
found at low and high superficial gas velocities for only
h~ghly concentrated CMC solutions whereas, for diluted
solutions the agreement is at high superficial gas
velocities as can be seen from figures 6 to 10. The
specific interfacial area calculated from this correlation
is always lower than interfacial area from this study.
The main difference in specific interfacial area
between this study and Schumpe and Deckwer (56) is at low
superficial gas velocities and diluted solutions, conditions
_Jo I',
<( '
u <(
LL OL 'w'o ' (\J 1-- .
z- -
u
LLP U D w Q_ (f)
0 (\ J
0 o. co
8 :
VAR I AT l CJ~~ '=~- : tr rT~ AC I AL AREA WlT4 s~r. GAS VELOC]TY
c □ R A l . GGZ CMC SCLU Tl □ N
~ )
2 . 00 SUP.
X U~IN~ MEAN ~~UT[ ~ C!A~~TfR
·r u·:;, ;~c; rn 50 . s 1 :1'Jr.:N ... r, 1 ~: i .
,._ U,1N C CGRRFLATl'.J~J t046 -~EF56
I
1.00 6 . 00 8.00 C-~~-; VEL. c rn/ "j
10.00
61

u <:
0 0
~ -
LL Qi W C
LO 1-- . z- -
u LL8
·uo w Q_ (f)
0 0
~- --- - - - - --- ---- - -- --- - ·--• ·•-- -- -
F : CLJRE-. g : V!\RlAT iCN OF l ~~TER~ACI AL
AREA W] TLI SUP. GAS VELOCITY FOR A l :)0/ [MC ~-;ou.n l ON
\ \
x USiNC MEAN S~UTf~ D!A~~Tf R
\ ◊ US i NC CJRRFLAT ! '.J!J ::J 46 . -:'.ff 56
..
00 n(' . Uu ~.0 0 5. 00 8. 00 CAS VEL . cm/ s
62
10. 00

- ------- -- -- - -- - - --- ---- --- ---- -- ----
0 1 -- · o : . I - 1
,;: I
<Cn w Cl-'.'.'. <C
I F i Ct..;~E-. 10 :
VARI AT ION OF !~T~R~ACIAL M~ EA W l T LJ SUP . C N; Vt L CC l T Y
c □ R A 2.0 0/ CMC SOLUTION
_J~ <( . ~ (\ I
~ US i "JC CCRff LA T I '.JtJ cO 46. C::tF 56
u <C LL
CLO lJJ lD ~- . z- ·
u
LL~
uo w CL (f)
0 (]
0 n' nn :.J. \.JU 2. 00
SUP.
I
1.0 ~ G. 00 8. 0C CAS VEL. crn/ 0
:;
63
10.00

in which interfacial area presents a maximum
difference can be explained by the fact that
64
This
these
investigators correlated data found -with
distributors and most y perforated plates
generalized correlation is
plates.
principally for
different
Thus t eir
per-focated
For a 1.5 1 CMC solution using sintered plate Schumpe
-I and Deckwer (56) found approximately 0.64 cm as the maximum
for interfacial area using the chemical method ( 13) ,
coinciding with a superficial gas velocity of 1cm/s. .For
the same conditions, the interfacial area is 1.4 cm' in this
study However, if gas holdup found by Schumpe and Deckwer
(56) at those conditions and mean Sauter diameter found in
this study
results
are used, an interfacial area of 0.48 _,
cm
Then, differences i gas holdup values are the
main argument as far as interfacial area results is
concerned. It is also important to remark that the
dif ·ference in .bubble column diameter (Schumpe-Dec · wer 14cm,
this study 33cm) could make any comparison wrong because of
the coalescence effect in smaller diameters as well as t e
differences in the av~rage pore diameter in the porous
plate
65
V. CONCLUSIONS AND RECOMMENDATIONS FOR FURTHER STUDIES
Bubble size and speci£ic interfacial area studies were
made in a 33cm diameter bubble column for the carboxymethyl
cellulose (CMC) aqueous solution -air system using a 70 um
porous plate gas distributor. The ubble column vas
operated in Bubble and Bubble-Slug flo~ patterns. The
Bubble to Bubble-slug transition occurred with~n superficial
qas velocities of 1 to 5 cm/s depending upon the CMC
concentration.. The tran i tion at higher superficial gas
velocity occurred forte most diluted solution.
Gas holdup decreased with CMC concentration and
exhibited a maximum at the Bubble to Bubble-Slug transition
zone. The maximum diminishes with CMC
concen tl"ation.. Actually I this maximum appears to va1tish for
highly concentrated solutions. Results for gas holdup are
in fair agreement with those from Schumpe and Deckwer (56)
but having lar-ge di£ferences for- the maximum values.
Small bubble size was found to be smaller near the wall
and bigger at R/2 in the column and it always increased with
super£icial gas velocity or CMC concentration. Finding
bubble size distributions at igh superficial gas velocities
and/or highly concentrated CMC solutions was not succesful
due to some limitations in the photographic equipment in
determining the larger bubble sizes. Therefore , results
for specific interfacial area are no·t accurate under those
con di tion.s ..

66
For low and moderate CMC concentrations it is
recommended to work near the bubble to .bubble-slug
transition ~here the specific interfacial area exhibits a
maximu.m This maximum diminishes vith CMC concentration and
eventually vanishes at h ' ghly concentrated solutions ..
The method for evaluation of specific interfacial area
takinq into account blmodal distribution presented in this
study is more accurate than methods taking into
consideration only a mean bubble diameter (6 , 33. 17 , 55)
even if t h is average is calculated from accurate bubble size
distributions as in Buch olz et al (6) ..
RECOMMENDATIONS FOR FURTHER ST!JDTES
Bubble columns have many applications in two and three
phase flow- The effect of fluid properties and the nature
of the gas distributor on flow pattern and interfacial area
are important for the design and scale up of bubble column
reactors- In the present work the effect of pseudoplastic
properties in specific interfacial area using a porous plate
was studiedG Further work is recommended using other types
of gas distributors and different methods for
characterization of inter£acial area in order to have a
source of comparison. The use of a combination of borescope
pictures and photographs from outside the column at high gas
throughputs is also recommended. The objective of the

67
borescope can be enlarged with the use of a telex adaptor
(from Olympus co .), experiments using this device are also
suggested.
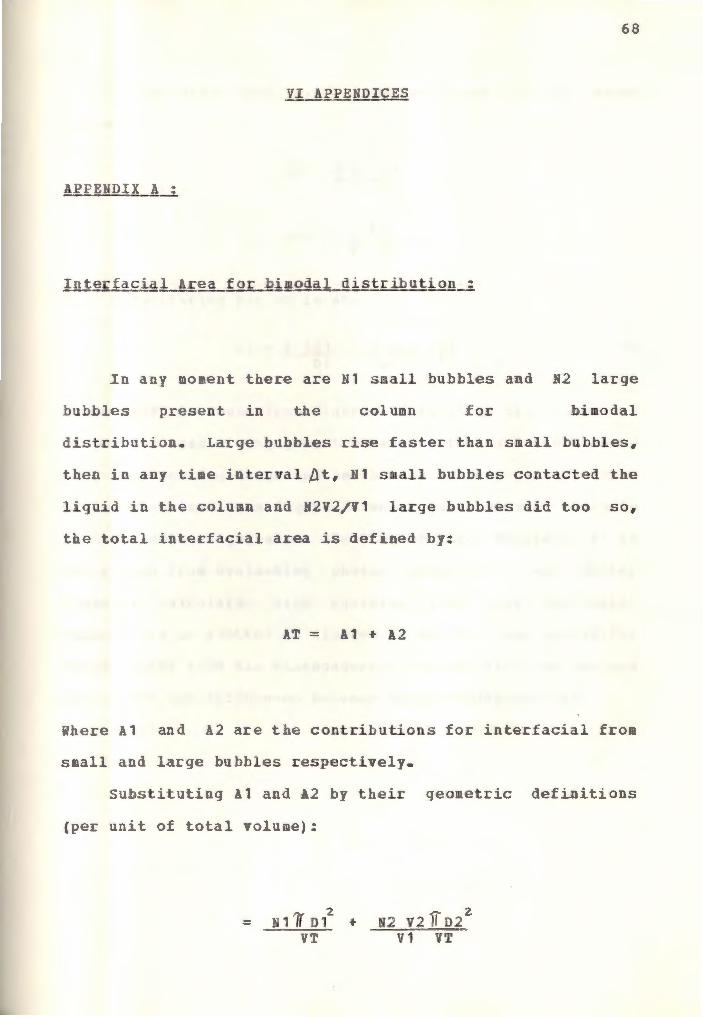
68
VI APPENDICES
APPENDIX A:
Inte facial Area for bimodal distribution:
In any moment there are N1 small bubbles and N2 large
bubbles present in t e column .for bimodal
distribution. Large bubbles rise faster than smal bubbles,
then in any time interval ~t , N1 small bubbles contacted the
liquid in the column and N2V2/V1 large bubbles did too so,
the total interfacial area is defined .b_y:
AT = A 1 + A2
Where A 1 and A2 are the contributions for interfacial from
small and large bubbles respectively.
substituting Al and A2 by their geometric definitions
(per unit of total volume):
= 111' n? + VT
,,.. z N2 V2 II D2
V1 VT

69
In the other hand, gas holdup for each of the sizes
.becomes:
3 EG1 =11D1 N1
6 VT
r.- ?, .EG2 = II D2 N2
6 VT
Substituting for VT in AT:
AT= 6 EGl Dl
+ 6 EG2 D2
V2 V1
(50)
Where V2/Yl is found fro figures 11 to 15 as the ratio of
slopes for gas Disengagement between Oto 5 sec and 5 to 60
sec, representing large and small bubbles respectively (22)
D2 is determined from figure 26 which is a visual estimate
of the average eguivalent diameter of large bubbles. 01 is
determined from evaluating photos using the mean Sauter
diameter calculated with equation {J8) only for small
bubbles and is plotted in figures 29 to 33. Gas holdup EG2
can be taken from Gas Disengagement f~gures at 5 sec and gas
holdup EG1 the difference between total holdup and EG2.

APPE.NDIX B :
~x£erimental Data:
Table 1 to table 11
Figure 11 to figure 38
TAB!dL1
Y~riation of holdup -with time
for a o. 25$ C!tC solution
t,s 6 11 16 21 VG,Cffi/S
1. 0 0 014 0 024 0 035 0 049
2.5 o .. 025 o,. 051 o ... 081 0 ... 11 .9
4. 1 0 047 0.094 0.141 0 193
5.6 o. 071 o_ 114 0 .. 157 o .. 205
6.6 0.048 0.077 o .. 116 o. 164
7.7 o. 077 0 106 o .. 140 0 .. 178
8 .. 6 0 076 0 .. 105 0.144 O. l 73
10 1 0.074 0~ 098 0 .. 157 0.186
70
60
o. 063
o. 149
o. 218
0-228
o. 194
o. 198
o. 195
0.206

71
jABLLl
Variation of holdup with time
for a o. 50% CMC solution
t,s 6 l 1 16 21 60 VG ,Cm/S
1 .. 0 0 016 o .. 025 0 039 0 068 o. 096
2 .. 5 0.026 0 057 0 076 0.097 o .. 120
4.0 o_ oso 0 084 0 .. 108 o. 125 0.139
5 5 0- 056 0.092 o. 116 0.126 0.139
6 5 o. 073 o. 109 o. 128 0 140 0 .. 148
7 6 o. 085 0 119 o. 138 o. 150 o. 158
8. 5 o. 098 0 132 o. 149 o. 159 o. 164
10. 0 0 107 0 146 0 163 0 .. 172 o. 175

72
,IAB!dLJ
Vaciation of_hold u.e_wi t :h_time
for a 1- 0% CMC sol11tion
t,s 6 11 16 21 60 VG,cm/s
1. 0 o. 013 0.021 0.036 o. 051 0 133
2 5 o. 031 o .. 055 0 065 0.075 0 109
4 0 o .. 042 0 066 0 071 0 077 o. 093
5.5 o. 063 o .. 082 0 088 0 092 o. 103
6. 5 o. 070 0 .. 095 0 .. 099 0.102 o. l 13
7 6 o .. 093 0 113 0 115 o. 119 o. 129
8 .. 5 0 102 0.121 0.126 0.130 o. 139
1 o. 0 o. 109 0 133 o. 137 0.140 o. 150
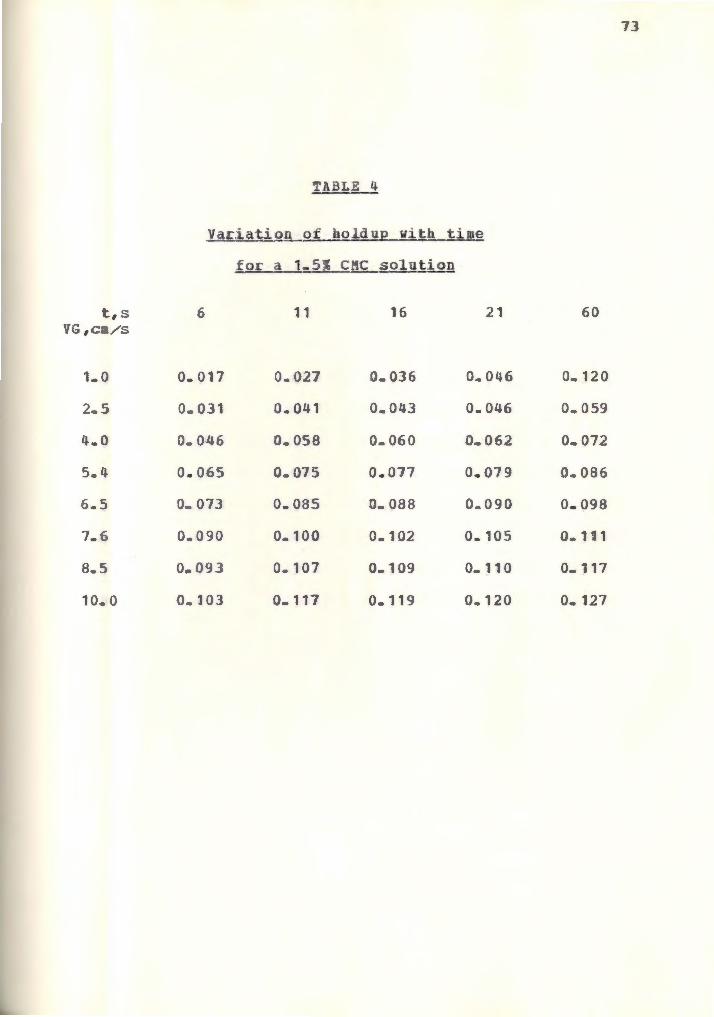
73
TABLL!!.
Variation of old up wit.h time
for a 1-51 CMC solu,t,i_2n
t,s 6 11 16 21 60 VG ,cm/s
1 0 o. 017 o .. 021 0 036 o. 046 o .. 120
2.5 o. 031 o. 041 o .. 043 0.046 o. 059
4.0 o. 0-46 o. 058 0 060 0 062 o. 072
5.4 o. 065 o. 075 0.077 o. 079 o .. 086
6 .. 5 o .. 073 o .. 085 o_ 088 0 090 o. 098
7.6 0.090 0 100 0.102 o. 105 o. 111
8. 5 o .. 093 o .. 107 0.109 o. 110 0 117
10. 0 0- l 03 0 117 o. 119 o. 120 o. 127

74
TABbL2
Variation_of holdu~it_ time
for a 2.0 % CMC solution
t,s 6 1l 16 21 60 VG,cm/ s
1. 0 o. 017 0-018 o. 018 o. 018 o. 023
2 5 o .. 031 0 037 0 038 0.038 0 045
4.0 o. 049 0.054 0 054 0 054 0.056
5 .. 4 o. 062 o .. 066 o .. 066 o .. 066 o. 067
6 4 o. 069 o .. 073 00073 0.073 o. 074
7 4 o. 077 o. 083 o .. 084 0,. 094 0 086
8 4 0.087 0 092 0 .. 093 0.093 o .. 095
9 8 o. 098 0.101 o •• 101 o .. 102 o. 103
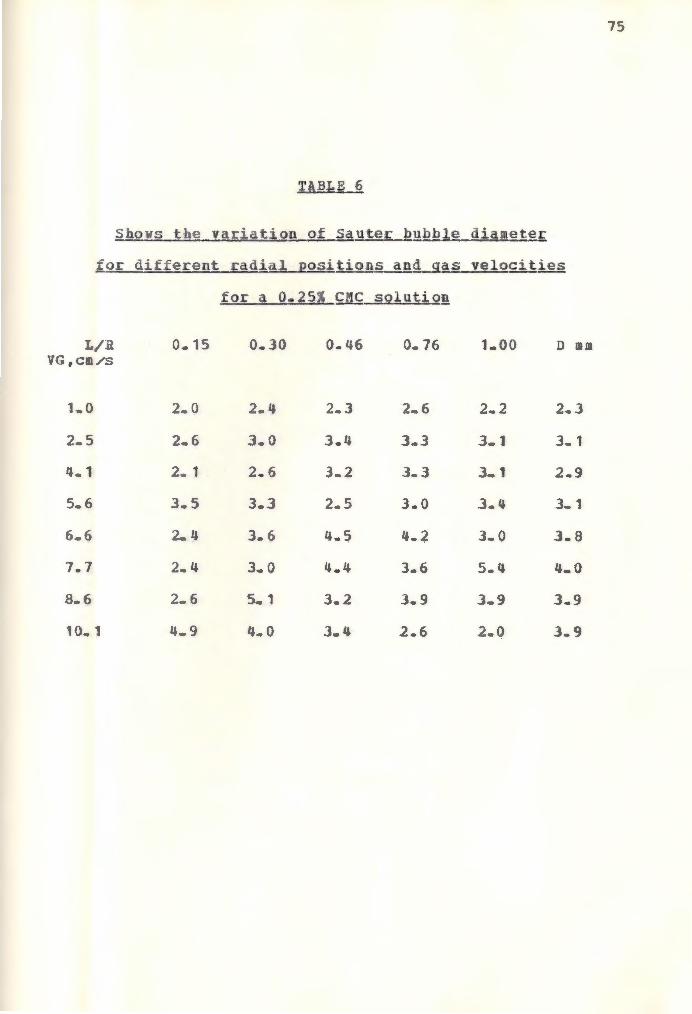
TABLE 6
Shows the variation of Sauter bubble diameter
for di£ferent radial positions and gas velocities
for a 0.25 $ CMC solution
L/ R VG ,cm/s
1 0
2 .. 5
4 1
5. 6
6.6
7.7
8.6
10 1
o,. 15
2 .. 6
2. 1
3.5
2 .. 4
2 4
2 6
4 .. 9
o .. 30
2 .. 4
3.0
2.6
3.3
3 .. 6
3 .. 0
5 1
0.46
2. 3
3.4
2.5
4.5
4.4
3. 2
3. 4
o. 76
2 6
3.3
3 .. 3
3.0
3. 6
3. 9
2.6
1 .. 00
2 .. 2
3 1
3 1
3.4
3. 0
5.4
3 9
2.0
D mm
2.3
3. 1
2.9
3 .. 1
3 8
4. 0
.3 9
3 9
75

TABLE 7
ShoW's the variation of_Sauter ·bubble diameter
-for different radial _Eositions a.ng_ggs velocities
for a 0 50% CHC solution
.L/ VG, cm/ s
1. 0
2. 5
4 .. 0
6. 5
7.6
8. 5
10 0
o .. 15
3 1
3. 3
3. 5
2 .1
3.2
3. 2
3.5
4 .. 3
0 .. 30
2. 2
3. 7
3 1
4 .. 1
4. 9
3. 1
4 ..
7. 0
0.46
2 .. 8
3. 6
2.7
3.7
IJ.5
3. 5
4. 8
2 9
0.76
2.1
3.2
2 5
3 .. 6
4. 1
5 8
4.9
1.00
2.7
3 3
3 7
3 0
3 9
2.6
3 0
D mm
2. 7
J 5
3 2
3 .. 4
4 2
3 2
4 7
5 4
76

Shows the variation of §auter bubble diameter
for dif erent radial_Eositions and gas velocities
for a 1.0% CMC solution
L/ . VG,cm / S
1. 0
2 .. 5
4. 0
5 5
6. 5
7.6
8. 5
10 0
o. 15
3. 2
4. 7
!J .. 4
] .. 4
1. 3
1 3
4 4
3 5
0.30
4 .. 5
3.2
4. 1
2. 5
2. 5
2. 4
2 .. 4
4 .. 8
0 46
4. 1
4. 4
3.8
6. 8
2 .. 8
4.2
3.6
2 .. 7
3.9
5.0
2.9
2 9
4.3
1. 7
1.5
4.5
1 .. 00
4 .. 0
4. 4
2.1
1 .. 7
4 6
3 .. 2
1.4
2 • .5
D mm
ii .. 0
4 .. 4
3.7
4.2
3.7
2.9
3. 5
3.9
77

78
TAB1t_2
Shows the variation of Sauter bubble diameter
for different radia .l EQsi:tions and g_as velocities
for a ,_ 5% CMC solution
L/ R o. 1_5 0 • . 30 o .. 46 o. 76 1.00 D mm VG,cm/s
1. 0 2,. 9 4 .. 5 6.2 5 6 4.6 5 2
2.5 4 .. 2 1 .. 9 ,_ 9 1. 8 4 .. 9 J. 7
4. 0 1. 5 5. 8 2.2 2.3 1. 2 3. 8
5 4 2 3 2. 0 1,. 7 2 .• 7 ,_ 7 2 2
6 .. 5 1. 9 2.0 2- 1 1 .. 3 1 .. 0 1. 7
7 6 2 2 1. 3 4. 8 2.5 1. 6 3 .. 1
8 .. 5 2 .. 8 1 • . 9 ,_ 8 1 .. 7 2. 7 2 • . 3
10 .. 0 1 5 4. 5 2 2 3.5 2- 1 3.2

Shows t e variation of Sauter bubble diameter
for different radial EOSitions and gas velocities
for a 2 01 CMC solutiQ~
L/R VG,cm/s
0 15 0.30 0 .46 o .. 76 1.00 D mm
, .. 0
2 .. 5
4 .. 0
6 4
7. 4
8. 4
9.8
1. 6
2.2
3. 8
,_ 9
1 8
,_ 6
,_ 7
1 3
s •. 2
2.2
1. 4
3.7
1 .. 8
o .. 8
t .. 1
1. 7
3. 1
'J 5
2. 0
0 9
,_ 1
2. 6
5.9
1.4
1. 7
4.1
2.4
s. 1
2.3
2.6
6 .. 2
2.8
2. 6
4.0
2.1
4. 0
1. 4
4. 0
2. 1
3 7
3.5
2 .. 1
3.9
1 .. 7
2 .. 9
5 .. 4
79

80
TABLE 1 1
gh_ysica.l proEerties_for different CMC
so.lutions at 22_f;
Cone S.G. Sucface tension Absorbance (dynes/cm)
0.25 1 71. 5
o. 50 1 71 .. 0 o. 15
1. 00 1 72.0 0 27
1 50 1 72 .. J 0 41
2.00 1 72 .. 3 o .. 52

0
(D
.µ ' <-!Jo w
I
Q_
=:J 0
I _ __,J - -
(J) <( (j
U)
Cl
0
! -- -·-· .
[ . r ' ,n r I • ~-l.;~'.: 11 :
V C rr:, I ,
50.CJO
I . 0
2 C . J
1. 0 c:: c:: J, J
81 '

0 ( 'J
0
lf)
+-' .
t-30 I
c_ ~
00 I ~-
o. Io
(J)
<(
lJ L0 0
0
0 0
0 ' 0.00
F:ru' iRL ''-' ,._ 12 .
·- ·-------· ----- -- ..... ________ ----- --~
f' ~ c, n , c E \ ir A , • [ Mr: \ ir ~ 0 c u n. J U I J . , ~ ~· '"I,, L. , L . ~ , "
A. n CJ{'j'/ I.,. v, . 'Mr' ('I:' UT 1nN L .. ,. .j Ul. I j j ,
X
2 l ' .J
4.0 5.5 S 5 , (' I . o
8. 5 10.0
-.........------- - ~, -- --~ :------...- 1 - -- --r-1 ~ I
!O.OG 20.QO 30.CO 40.QO SO.DO 60.00 i I rvi[ C' , •
I • IL. J C l ,
82

- -- .. . -•-·-•·-··-----···-··- ·-·- ---- ,
0
N
+-' <.!)0 w I
(L
~
~00 _ _Jo [1 ' TO --1...
([) <(
CJ ;--0
0
0 C)
00 r•'"' · . uU I
I C ' f"' !Dl , , ~-U1._ 13
A nJr:·1 ( Mf' rr;, ur , nt.1 ' l..1,' ., ~- ,) UL. 'I I ~,d
~ -- --
--,t,. __ _
S 7'M9QL_ V cm/s
C) I . Q
t 2. ~J
I 1.0 1-
X 5.5
<t> G C , J
+ 7.G
A 8.5
z 10.0 I I
10.GQ 40.00 cjO r.r: \ • , ... ,\J 50.00
83

-----··-··----·---- ·------------ . •· -- - . •·- -·-------- -- ----- ---- ---
0
(\)
(dJ LJ.J
I
()_
:J Ori ,w _ _Jo Cl . IO
(J)
< u
\j
0
0
0 Cl
0 0.00
F . r. JI;'... . '".u . - 14 :
' 10.QO - -Jt~: ~n '- '-. ,_,i,J
CAS OIS[NSAC[MlN! ~OR A 1 'r!'/ ~1v1r C'f:lLJ; 'OtJ , : .L.1, L.1 1-.... Ju . , J
X I
-n nr·: J,..,, •..J.)
l I 'vii r ·
1, it. :i er
5.5
40 nr: • J '-..J
t
" z ' ~n.oo
6.5 7.5 8.5
10.0
84
50.00

U)
0
(\]
c:'.oo w
I o_ ::J □ -~ ,w ··-'0 o. TO ~
(f) <( (j
,t ·
0
0
CJ C
,-------------·-·· ---- ---· ----- .
I
SYtvJSOL. V C ~ I :i
C) I . Q
~ 2. ~)
~-'
15 :
-------·--·-·1 I
CA(' r•,,r~ Jt A(' [-:,.1l~ •• ;:-OD \ _j ,J[ :\J \,..,r\ L\ ' L.! \ I \
A ?. CO/ CMC SOL UT l 8f~
I 4.0 + 7. 5 1-
X 5. 5 ::z 8.5
\~ 6 5 z 10.0
------- -----
! I o• O.OG IO n,, . J.J 2rJ.QO 30.00
T I ME st' (
40.00 ~jO. 00 r·o flQ (\ . J•
85

r C
E
n
0 ~ o W · f- ~')
lJJ [ <( 1--f
0 O L()
~N w f--
~ <(
(J)O 0
f:"'(_' 'r,[ 16 , I L,l_,, , [
L,
. . . -------··-•---··- ------ --- - - ---- --
p, 1 [? 1 -1 , ·" -, L [; ~ r, 1 i 1 '.i , c ·1 Q I n' 1 ; : n ~ 1 -'ULli.Ll . :) l fr : '' L.. ,,, _ u I,) ' ~ l, ' I U,~
r:-nc A ('\ )L ·1 ~MC er•\ UT I fiN ' L),'. ·" i.J . L.J, L! Ji..J~ : :J
S~'M~OL V C"-"!s
~ I . 0
l 2.'.J
+ u
X 5.5
-- --+ U--,..---- - -,-- ------- ----~-----
l J.oo 0 ?0 r <lQ n ro O 8'0 .LU ~- ~.o · . I . 00 DISTANCE FROM WALL/R
86

E E
,, ,--- ------------- --------------· l J CJ ~; CURE 11 ·
(JJ
\ \ \
GUGGLl Sill RAJIAL DlSl~IJUf lCN
FOR A 0.2~! CMC SOLUf ION
SY~80L V C "ft/ 3
'~ s J
r / , f,
l £ C - J
7 !Q.C '-
0 Do
\
oct w r=:) <( (j)O
0
\
87

[
E
Do m
I=" I [ ·n · I .l;~'.r. · 18
CQD An er; c~c r □LU•T ION I " u ' .J~. . 'I ' .J I I
" ·~~nl J ~ - u
('
,t
+ X
\ --~- I '\,_l'J/
0.20 0. 40 r. 50 0.80 DISTANCE FROM WALL/R
88
V C <n / S
I Q
n 1, 0
5. '.l
! . co
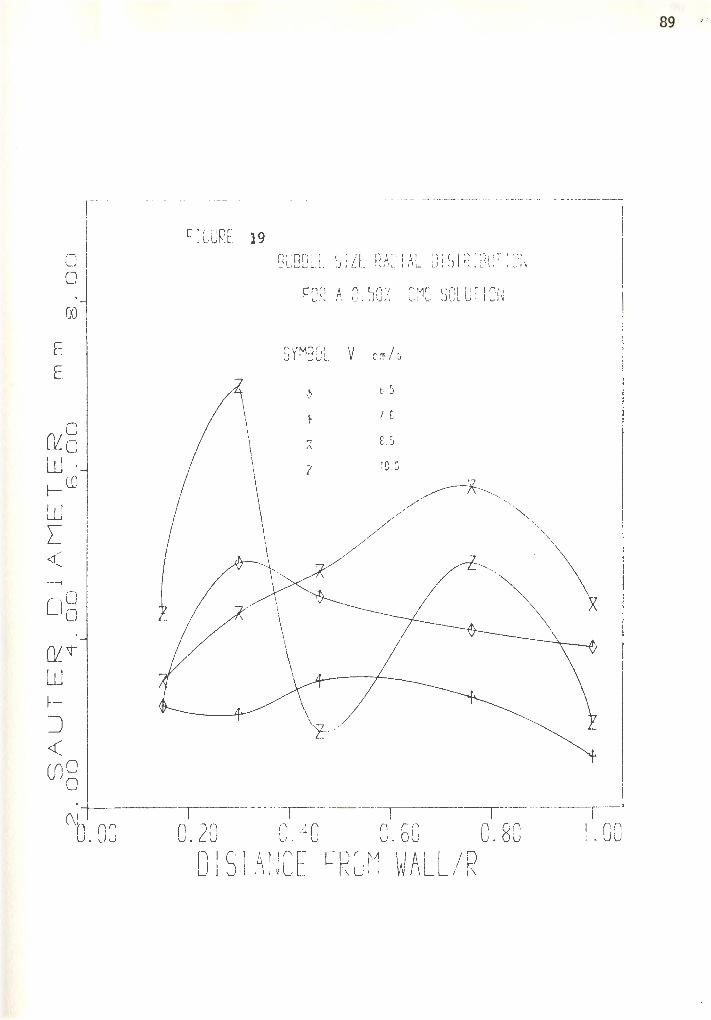
E E
0 0
co
~8 W · f- (D
w L <( ,__,
0 0 0
~t"
w ~~ <(
cno 0
(\J0.00
89
-------- - . ------------·-----
BUO□Ll Sill RAJIAL OiSlQ!BUTl~N
Fon A n, t r·/ : Mr' c-~:l U.,. i nN f\ u . Ju, . L ! L- ,) u . I I u I
SY~~OL V cmh
0.20 0. 40 0.50 0.80 l. 00 OISfANCE ~ROM WALL/R

F E
0 CJ
l'-s
~g W ·
l[) f-w [ <(
0 0 0
~n w t-:J <(
en □ 0
-0.00
90
. ·----· ·-· ·- - ---· ------- -
n: : □ f-1!_[_ lJ' j Ln __ :·; ,\ ,, ; '•., r·, l c r ;:i j qr IT Int 1 _v ...,._ [ \/1 1.., IIIL L / 1,JI \ .Jl1 1 l u ' ~
Fo~; A I nr-,-1 r ,',1f c•-:l ' l: jn,1 r, I ',.Ju/. ..._.: \...• .J1,_ .U l U l ~
S)'MSOL V cm/s
0 I . Q
! 2.5
+ 1.G
5. '.l
\
0.20 C:. 40 C.50 0.8C I . 00 0 IS.,,· 1\NLnr:--~O r :M \/ ~! L/ D
I L- . [\ u : I w /I L . [\
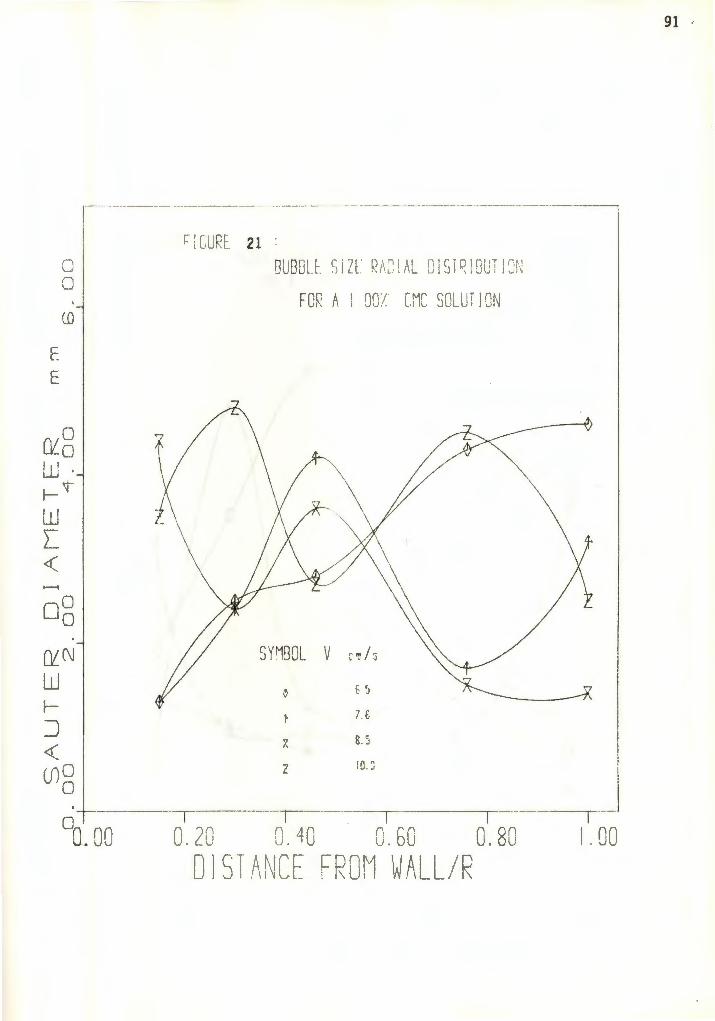
t E
C 0
(D
0 ll'.'.o LL!· f- 't
w [ <(
□g
ll'.'. ('~ w t--
:J <( (!)O
0
OQ. 00
91 ,
~iCURE 21 r;urm1 L C ·17[ P1\'1 i l! G '1 rJ'I r, '1 f<'LJT 1' n11
_, UUL.[. ,J LL ,, u ,i \ L u , u 1 ._ 1\
For A I n(: 'j ~Mr CQl'\T l · ~I 1, , 'Ju .. L.: 11... J 1 .LJ I J •~
SY1'190L V C rr,,/,s
~ ~ s / . 6
;z 8.5
z !Q_j
- r- ·-. T - ----
0. 20 8. 40 0.50 0.80 I. 00 0 l ST f1: 1CE FROM Wf1LL/R

r- - -- -·- . --- ----- - ---- -- ·--- -------- ··----- ----- ·- --
F. E
0 0
['-,_
Oi6 W · f- ~I")
w [ <(
-
!
0.00
r r ( , •rr >- I ,L' '.[ ··22 ,
n I In 1·· I [ C 1· z I r; l '': ' AL n ' ( • l () l r·· I IT ' n t '...<utJ~L. . J L. ~,:1'- I ,1 u I .; , LJL, 1 - ,;~
For; A I , r,·, r "'!r cr-l ur j m.1 ';,( I I • JJ/. l ,: k.- JL.1
• : J,~
S 1'MSDL V c rn I:,
-~ I.: I Q
!. n
·'· 1. ~
X '.i.'.l
--- -- ---- ·--i--
0.20 C. 40 C.50 0. 80 I. 00 DlSf A;1CE FROM WALL/R
92

f-. E
1]
0
(_Q
0 Ck'. 0 LlJ·
tf-lJJ [
< ,__,
□g
CUN w ~:J <( (!)O
0
oO nn • ~u
r:-1c•1f"'r 23 I ,L~:c. f<UOql 't- l. j· 7[ (;1·,: 1i . •'1C]() '[rliiT jr t: _. L,. 1,,. _ _ .J L . •\J\LJ l 1\1,_ LJ J \ WU I v i ii
Fov A I - (:'j 'Ml' ('rl' LJ1T I nt' ,, , , . J.J,. L. ,.._. J ul. , I 0,~
0.2C ~. 40 C.50 0.80 OlSTA~CE FROM ~ALL/R
93
I. 00

E E
C 0
(D
0 ~o W· f- T
w [ <( - -1
0 0 0
~N
w f-
:J <( (J)O
0
00.QO
~ ' r · '[")E 24 · I l, L f: .
For, A 2 ,-,~,' (" "11' lTlUT ION 'i\ \ . !..,:_,'. t,l !l, JJ. l
"VMnn1 ~J, , :.iiJL
~
i._,
+ X
0.20 C. 40 0. 50 0. 80 D l Sr .A1~CE FROM \~ ALL/P
94 ,
V cm/s
I . Q
2.5
1. 0
5.5
--- r ··---1. 00
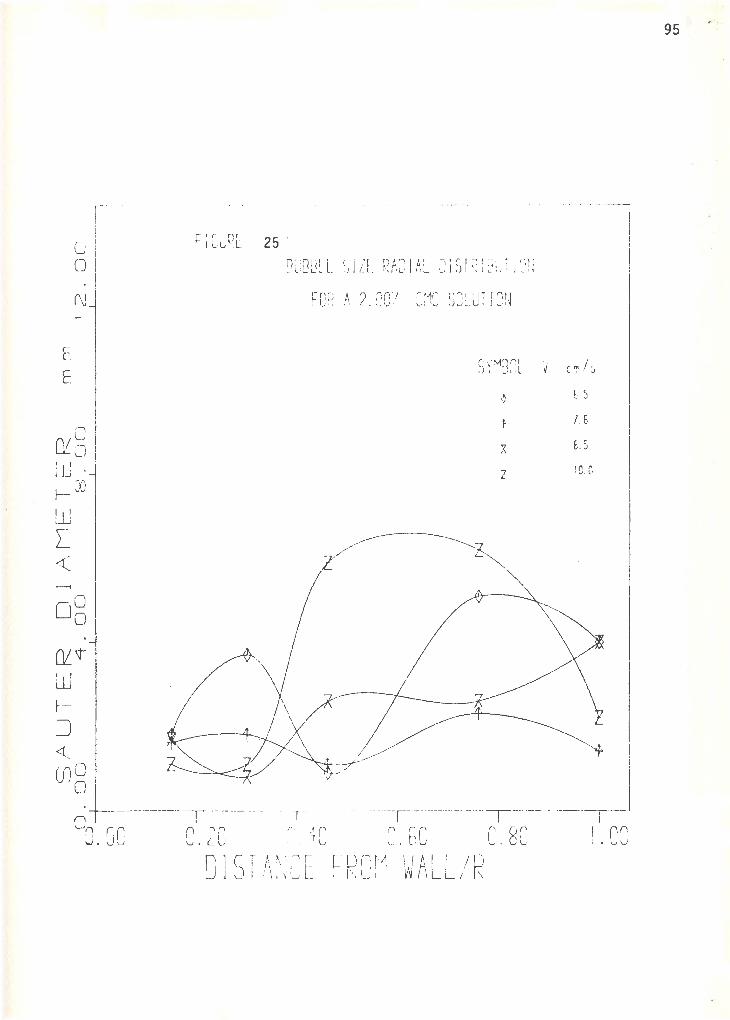
E E
0 0
(\j
(\ /0 Ll'.._Q
liJ· (jJ
f-
w [ <(
□g
Ci't w ~
:J <( (JlO
0
1-- .. - - ---
0 0.00
95
I=" i CLRt. 25 · n· 1nt··1 l ( .. ,l n1n] ,, "]C ]'"' J"°''' T ''"~I 0U0Jc . . ) I Lr. i<r,J ,'\L U J ,; JU i J _;1,
FOR A 2.00/ CMC SOLUTJQN
s~·~gm_ V c rr, I::;
,~ E 5
I- / . 6
A E.5
7 10.G L.
--, --------0 2n ~ 40, n en C 80 . U ._ . U . OU . I. 00
D l S I h , ! C E ~ RO['~ W AL L / R

F E
C)
0
0 U)
CJ 0
t.JJ 0 N r--i
(f)
w _JO
m~ mo :::J 00
m
u ~o mo
0 <:.
0 : C)
·-- ---·---•-· ----· ·- ---· - -- ·--- - · -- --- ------- , Fl Gu,E 26 ·
"Ar! Ar 1 2 ~~ ~~- G '. c m.Gfii 1 ,) 1 zt.
Wlf~ SUP. CA~ V E~ □ ri fY co~
~ coR A 0 . 2~/ C!'1C SSLUflO~ ~ !=°OR /1. 0. 5(>' CMC SSLUf I '.JtJ
X FOR .~ i . 00/ C.!'1C SSLUT I '.JtJ + FOR A I. sa:' C!'1C SSLUT I '.JiJ A c □R A 2.0G/ C!'1C SQLU!l '.J~
I
01. 00
I
3. CC· r~·J . : ~J I CO VEL.
·., nun ) . 1..J I I . 00 CLJPEPC, r · ] I. I --> - I ' I i L. I I L. C' /. C'
' I \ _) Cm/;
96 , ·

~ r ·----------------·------· ... ----••-·-· ----------·-----------------
(D
en
Xo w 0 z
CX)
300 <6 _J
O!.'. L.t.J >o ooo Q_ .
0
N I'-,
00. 00
F; Ct.J~E 27
T EM~--: 22 C
SHOWS l~E VAR!AT!:N OF
TYE POWER LAW INDEX W:TH CMC CONCfN ~AT!DN
0. 40 0. 80 : .2c 1. 50 CM C CO~✓ CE NT ~ A T I S ~~ ( ! W )
2. 00
97
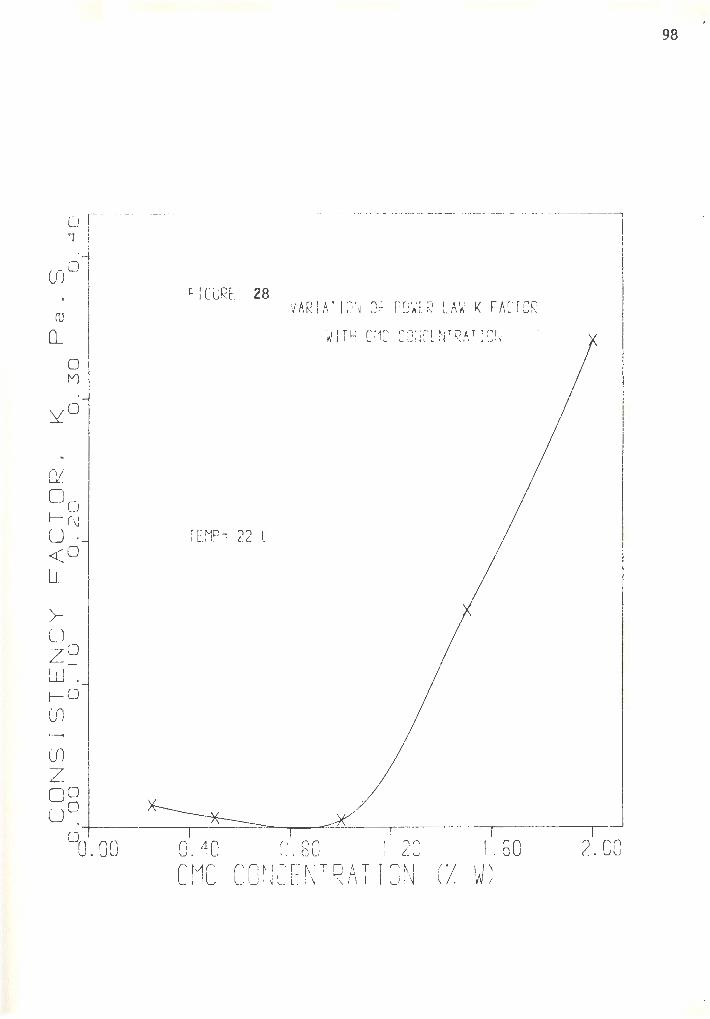
(U
o_
>u
0 st
0 f'/)
z~ LJJ. f-0 (J)
(J)
z oo u~
-- --·-- --- -------- - - - ·--- ------ --- ----- -- -
~iCuRE 28 : VARI AT ION OF PDWFR LAW K FACTOR
WI T~ ('f '1(' cr·~1c1-N7 Q AT I nN l 'I '-' 11.. J,'l .[ 1 I . ,1 , u,
TEM~--: 22 C
-+---------,--- -..=,,,... ---,-- """--'---'-- -,- --- ----,- -- -r----'
0 0.GO 0. 40 C.80 : . 20 I .50 2.00 C r1c CO~~ CE~✓ T ~AT I O ✓ ( 1/. W
98
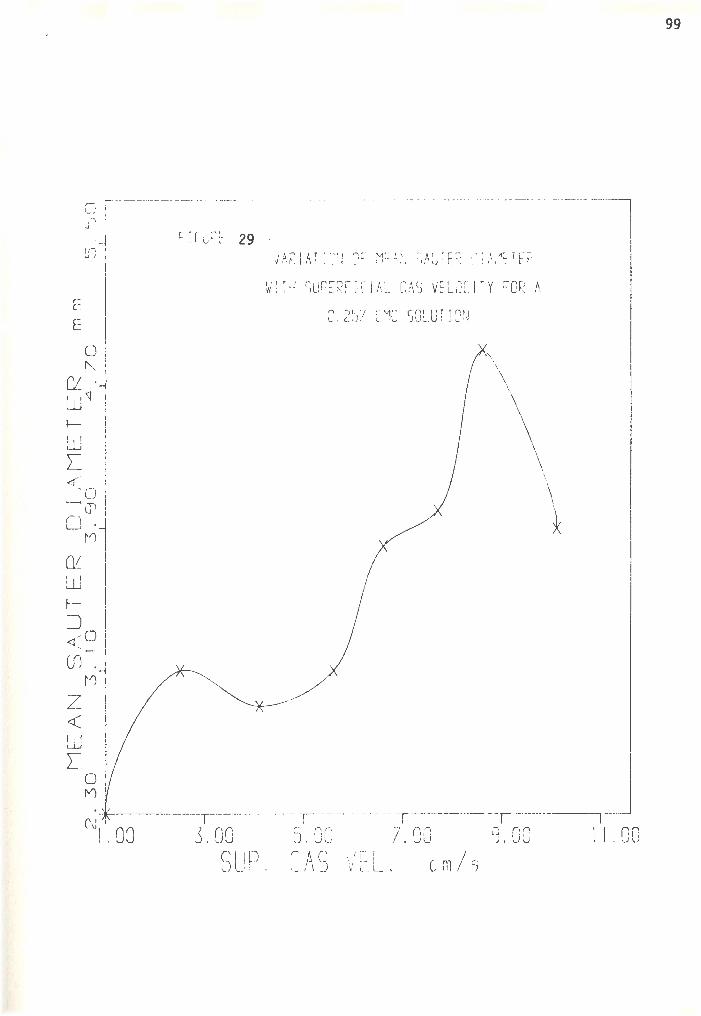
',-. u I
l[)
E
0 ~
OL . w1· f
LJJ L <( C) ,----,(r\
o. n
OL w ~=:]
<( ~ (f) .
z <(
LJJ
~')
r: Ci..,Pf-29
VARI Al l~N CF M~AN SA~TER C!A~~TE~
w: f~ SUP~RFfCIAL CAS VfLDCITY r □ R A
C. 2~! CMC SOL.UT ION
\
L J ~- --...--- - --,------ ~- ~- - 7 -
NI . 00 J. 00 S. QO 7. 00 (l 00 ! I . 00 SUP. ~;AS VEL. cm/5
99

E E
,, L , ,, , -'-·'. i 0~
0 0
C✓- . u/o f-
w L <Co t-< 0 o .
w C✓-LLJ f-
~ <(O ~o (f) '
z <(
w L
0 0
(\b.oo
F ! C.uRE 30 VARI AT IQN 0~ MEAN SAUTER ClA~ETER
W!T~ SUPERFICIAL GAS VELOCITY ~OR A
2.00 SUP.
0.50/ CMC SOLUT lJN
I
4 nJ.(: ' ' ._ u 5. 00 8.00 (' ~ s u/ 1.
1 /1! / VC L. cm s
100
10.00
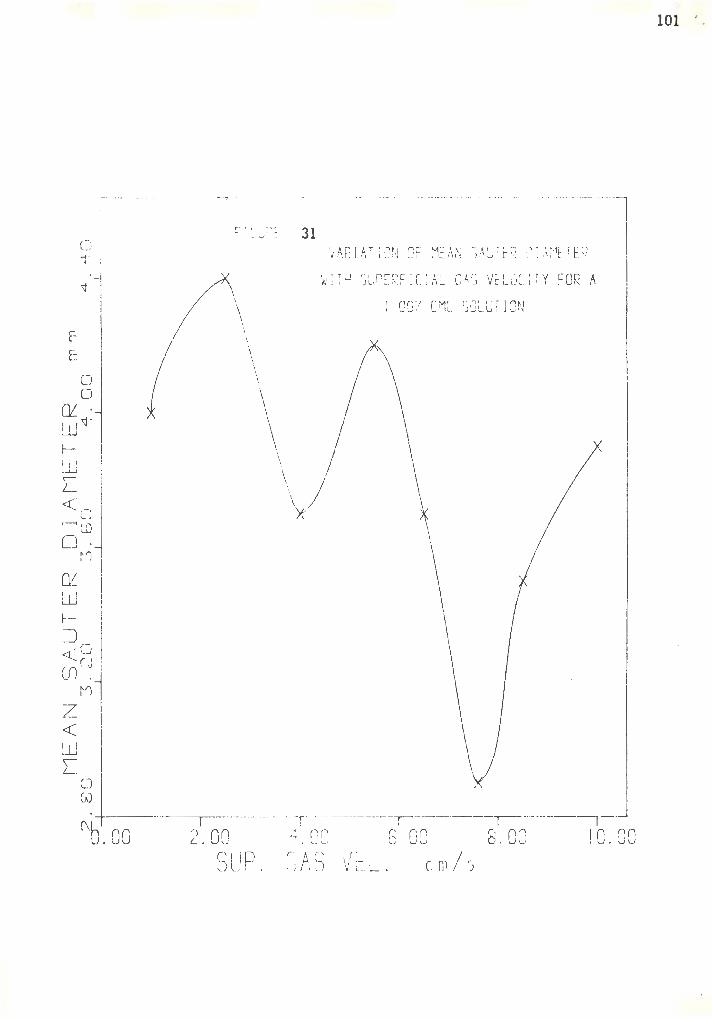
f: E
I 01 1-
0 0
Ci . w,:J· 1-(JJ
L <Co ,......, lD o.
~ lJJ f-
:=J <t"'o
u/~
z <(
lJJ L.
n
0 OJ
c·ci/'r _ 31 ·
\ \ \
\
w:rw surERF!CIAL CA~ VELOCl IY FOR A
: .GO! [MC SGLUIION
- - - -~- ------ -~- ---- ~ ----~---~ (\b.oo I
4 .00 6. 00 8. 00 10. 00 ~)AS VEL. c.rn/0
)
101 '

-- -- ··- - -- --- - -
L'1
E
1·---1 f"-
. ' o .
Ci LlJ r=:)
n
<(~ (f) .
z <(
LlJ L
N
0 ~
I ' I
- I
0. 00
FiCuRt
- - - - - -- - ·-- - - . ------ - ----·---- - -
32 · VARIATION OF M~AN SAUfER DlA~~TER
WIT~ surERFiLIAL GAS VELOCITY ~OR A
!.SO! CMC SOLUT IGN
I
't . 00 ('A0 ' 'I L u ~> V c .
I
5. oc, cm/ s
I
8. 00 -- 1-
10.00
102

------
F. E
0 ~
~ . L.LJ <;J ·
1-
L.LJ L <I ~ Cl
o. n
(\)
z <(
L.LJ L
0 ~
i
CL 00
F:GGPE 33 JARIATION OF M~AN SAUTER CIA~ETER
w;rw surERF!CJAL GAS VELOCllY CQR A
2.00/ CMC SOLUTION
I
I
2.00 SUP.
4.00 5. 00 8.00 r AC' ·,;r L / u, .J I["_ . cm)
103 -
10.00

,--------------·-··
j FI CLRt-_ 34
.,... I lJ J
(~
. /An , 1 T I n r I cc H· n: r~ l r p r: or, A V h I I\ i _,. ' I ·_; ~- u ✓ I ' ' :\
0
0 ( \)
0
o_ 7 __J
0 I ~'l __,_
0 I o
c.n <(
C) 0
0
Ul 0
n 2 l / J . J , .. ,M(' CQiLJTir:t ,I l. '. I.._, • ) ~- I I :_ ; I ~
)<
-+-- - -- ~- -- ~ ----- ~ ----- -,---- ---r--J 0
1 . 00 31
• GCJ s'. GG /. 00 9·. OC . I . 00 SUP. CAS \/EL. C r.l / '-3
104
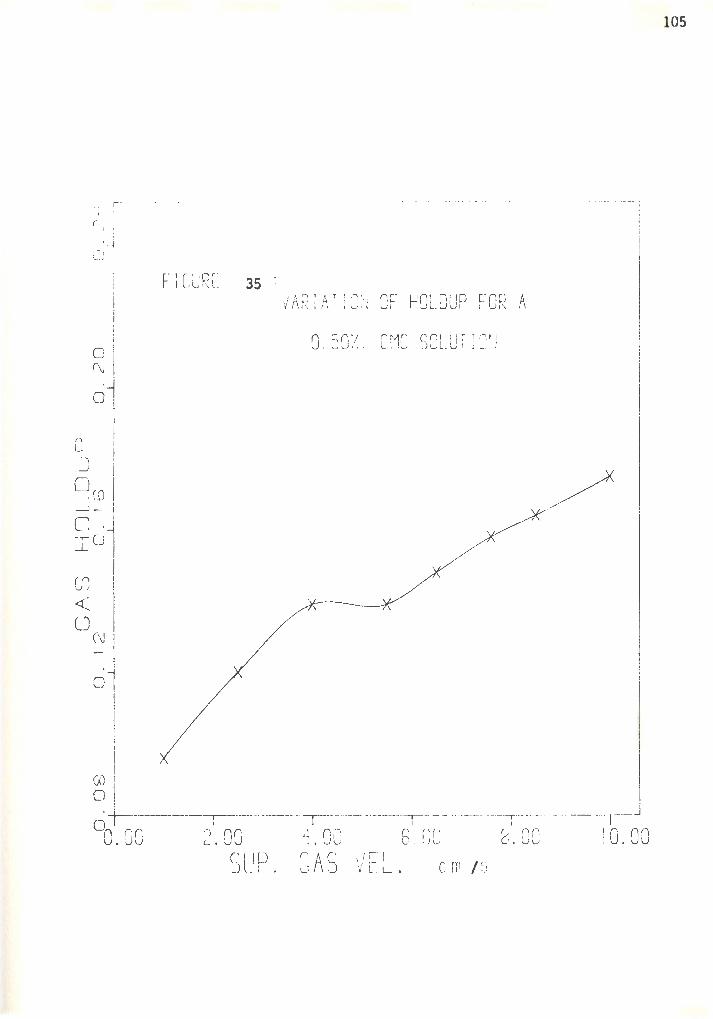
-t 1 ---- - ·r ~ i . --~
0 , I
~-1 CUR[ 35
0 (\J
0
Q_
:=i ow
I __J -
o. -,o _L
00 0
0 0.00
I
I_/ ! [) ' AT I ,,_i v/\ " : 11; I 0,~ □~- HOL.DUP ~- □ R .~
0.50! CMC SOLUT lGN
2.00 4.0C 6.00 8.00 ~.;up' Cf,S VEL. C rn r;
105
!0.00

r-· -- ---·--· ··------·-···
Q_
=:J
0
0
0 : - I
_J_ I Cl .. Io
(f) <(
lJ~j 0:
r-, I 0
0 o. GO
Fl C LJP[ - 36
2.GG SUP.
106
i' A '.JI AT I' ' ) or· 11n: !•LJF} r:oc! ,/\ I , \ 1 , • , • , , _, , r r- ..J L • ._J , , •
, _nn,J ,J __ [Mr r~luT 1n .1 -.., . '- .) ,_; . I '-;, 'I
I
~.CO 6 00 8.00 10.00 GAS \/EL. C fi / ')

(J) <( l)
' c ic: ,i;-;r 37 I I 'l,, -, [ .
I I A ~ I A T I ,, ~ I CC Hr,: r, i ! p [." n [, A f'1 v . ~ ,7. 1 ... , '.. 1 I .._J -- ~ w '-' I , -J I' , ,
0
0
"' 0
0
L0 0
0 o'. oo I
2.00 SUP.
! .50/_ CMC SOLUTIQN
I
1 . 00 r Ac ,/r l u ,J Vt .
5 00 C rn / ')
I
8. 00
107
!0 .00
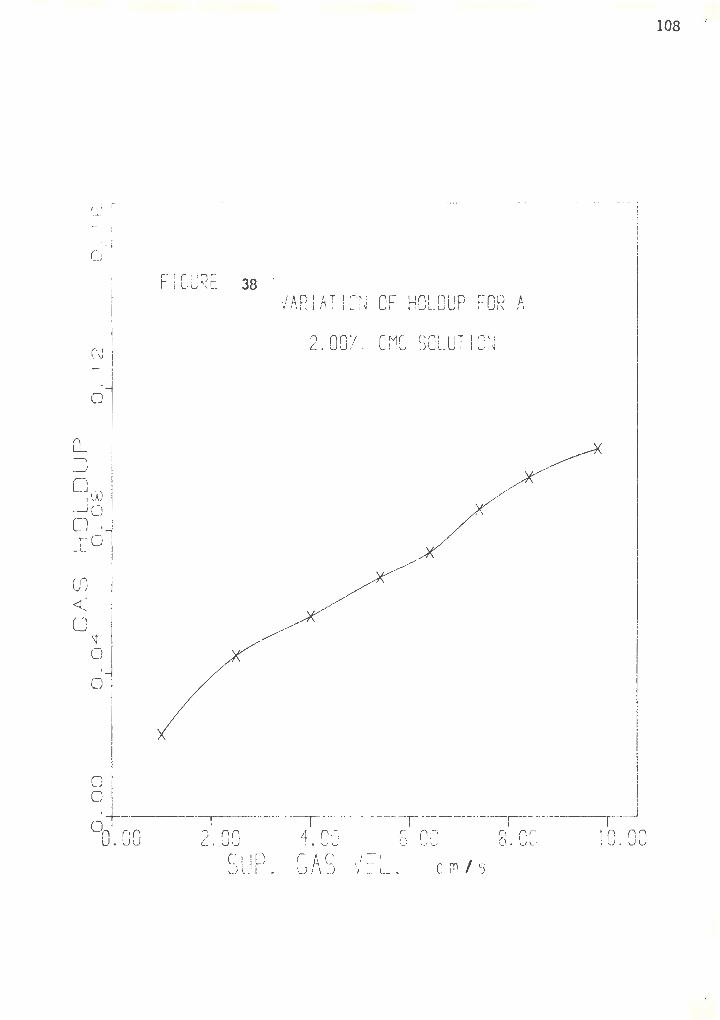
Q_
~
( r' r -- -------·-- -~) '
- · l
·-l 0 1
(' ' . \J
0
I
□ co ~ o 0, -rQ _J_
(f) <(
u t· 0
0
0 0
00
1
• 00 2.00 SUP.
VARlATION OF HOLDUP FOR A
2. 00/ . CMC ~;Cl_UT I Sf~
enc n ,_J 1' I ,~l V [_ - •
( ' (;(~ 0,~U
Cm I 5
I 8.0C
I !0.00
108

109
APPENDIX C :
~aximum in interfacial area
A major contribution of this study is the indication 0£
a maximum in interfacial area in the bubble pattern.
Interfacial area is important in determining rates of heat
and mass trarsfer.
The justification of the presence of
depicted in the sketc.he.s of figure
indicates linearly increasing bubble
tis maximum is
39. Sketch 39 (a)
diameters wit
superficial gas velocity. Gas oldup increases and reaches
a maximum as superficial gas velocity is increased. See
figure 39{b)- The exception to this, as shown, is at high
concentration of CMC. Te solution becomes viscous enough
to promote coalescence and retard break-up thus reducing gas
holdup and eliminating the maximum If we use the standard
relation , that interfacial area is directly proportional to
gas holdup and inve~sely related to bubble diameter, we
obtain a maximum in interfacial area. See sketch 39(c).
Thus, operation of bubble columns, with porous plates , in
the bubble pattern, at low enough viscosities, should result
in maximum interfacial area.

VI > -0
(a) (b) 0.2 --
===------0-;2
For 0.2 EG--------.
VI > -0 (c)
Lu .. /0
Figure 39 Sketch of maximum for interfacial a~ea expect ed in t his study.
110
111
1- Akita K.,F. Yoshida,"Gas holdup and volumetric mass transfer coef ficients in bubble columns", Ind. Eng. Proc. Des .. Dev. , 12, #1,(1973),76
2- Akita K., F. liguid phase mass Eng Chem. Proc
Yoshida, naubble size,interfacial area, and transfer coeff.. in bubble columns", Ind ..
D-es. Dev. 1 3., i 1, { 19 7 4) , 8 4
3- Anderson J. L. and J. A.. Quinn, "Bubble columns: transitions in the presence of trace contaminants", Eng. ScL. • Vol 12, (1970), 373.
Flow Chem.
4- Aoyama Y. columns", J.
et Chem.
al, En ..
"Li quid mixing in cocurrent bubble Japan, Vo 1 l, i 2 , ( 19 6 8) , 1 5 8.
5- Bryn T., Forsch Gebiete Ingenieurw, 4, #1, f1933), 27.
6- Buchholz H. et al, "Bub le swarm absorption in Non-Newtonian fluids in Chem. E g .. Sci., 33 , (1978), 1061.
behaviour sparged
and qas colum.nsn,
7- Calderban.k, P . H. , "Physical rate processes in industrial fermentetion", Trans Instn Chem. Enq 36, (1958), 443 ..
8- Clift ., J.. Grace and M.E. Weber, "Bubbles, drops and particles", Academic Press, (1978), 23.
9- Davies R.N , G.I ( 1 9 5 0) , 3 7 s ..
Taylor, Proc .. oy.
10- Deckwer w.o., et al, "Hydrodynamic Fischer- Tropsch s .lu.rry process", Ind. Eng Des .. Dev.,19, (1980), 699
Soc. A200,
properties o.f Chem.. Proc
l l- Deckwer W .. D.. et al , "Ox.igen mass transfer into aerated c~c solutions in a bubble column", Biotech. Bio. Eng., 24, (1982), 461.
12- Deckwer D., J.. Hal .lensleben and 1'1.. Popovic, "Exclusion of gas sparger influence on mass transfer in bubble columns", can. J Eng., 58, (1980), 190.
13- Deckwer D., mass transfer n 29, (1974), 2 177.
14- Eissa .SH, investigations columns",, Chem
B. Burckhart and G. Zoll, tall bubble columns", Che.m ..
11Mixing and Eng Sci ,
K.. Schuger.l, in cocurrent Eng.. Sci , 30,
"Holdup and backmix .ing and countercurrent bubble
(1975), ]251-
112
15- Pair J R. • A .. J.. Lambright and J w. Andersen, "Heat transfer and gas holdup in a sparged contactor", Ind. and Eng Chem. Proc. Des,,. Dev., 1, # 1, ( 1962) , 32 ..
16- Florez M.R. , " Rheology of Exxon Donor solvent process coal liquefaction streams", AIChE an .nual meeting, New Orleans, LA,., {1981)
17- Franz K .. , B study of the hiqhly viscuos Part I, 165.
Buchholz and K. Schuqerl 1 "Comprehensive gas holdup and bubble size distribution in liquids", Chem.. Eng Commun., 5, ( 1980),
18- Franz K., Buchholz and K .. Schugerl,"Comprehensive study of the gas holdup and bubble size distribution in highly viscuos liguidsfl, Chem Eng. Commun., 5, (1980), Part II , 1 87,.
1 - .Freedman w. ,J m F. Davidson, 11Hold up circulation in bubbie columnsfl, Trans. Inst. Vol 47, (1969), T251 ..
and Chem ..
liquid Eng .. ,
20- Frontini P.M ,R J. base-catalized Phenolic Enq Chem. Proc. Des.
Williams, "Production of resines in bubble columns 11 , Ind ..
Dev .. , 22, (1983), 3 1 ..
21- Glass D.H, H .. Mojtahedi, "Measurement of fluidized bed bubbling properties usinq a .fiber-optic light proben Chem. Eng . Res. Dev , 61, (1983), 38.
22- Godbole S P ., M F Honath structure in hi hly viscuos liquids in bubble columns", ( 1980), 119-
and Y.T. Shah, "Holdup Newt onian and Non-Newtonian Chem Enq Commun. 1 16 1
23- Govier G.W.,B.A. Radford and J.S. Dunn, "The upwards vertical .flow o:f air-watec mixtures", Can. J.. Chem.. Eng .. 1
(August 1957) , 58.
24- Govier G.W ,K. Aziz, "The flow of complex mixtures in pipes", Van Nostrand .Reinhold Co .. , ( 1972) •
25- Grace J •• , "Shapes and velocities of .bubbles rising in infinite liquids", Trans Instn. Chem. Engrs., Vol 51, {1973), 116 ..
26- Grace J. R. , -T. Wairegi and T .. H.. Nguyen, "S hapes and velocities of single drops and bubbles moving freely through in miscible liquids", Trans. Instn. Chem Enqrs. , 54, ( 197 6) , 16 7.
27- Harmathy T~J. , "Velocity of large d rops and Media of infinite or restricted extent 11, AIChE J.,
ubbles in 6, #2,

313
( J960) , 28 1 ..
28- Hatfield M. and Eng. Chem .. ,
, "Pluid f.low through porous Carbon", Ind ( Nov • 1 9 3 9 ) , 14 1 9 •
29- Hikita H. et al, 11Gas holdup in bubble columns", The Che .Eng. J , 20 , (1980), 59 ..
.30- Hills J.H , "The operation of a .bubble column at high throughputs'', Chem.. Eng.. J., 12, (1976), 89.
31- Hough ton G., A .M.. McLean and P .. D. of format.ion of gas bubble beds", Chem. { 3957), 40~
32- Hughmark GA., "Holdup and mass columns", Ind. Eng. Chem.. Proc .. ( 1 9 6 7) , 2 1 8 ..
Ritch ie, "~echanism Eng. Sci., Vol 11
transfer in Des.. Dev.,
bubble 6 , 12,
33- Joshi J.B., "Axial mixing unified correlation", Tran.s 139 ..
in I
multiphase contactors a Chem. E. , Vol 59, (1981) •
34- Joshi J.B. and ti .. M. Sharma, "Some design f ea tu res of radial baffles in sectionalized bubble columns", Can J. Chem Eng., 57, (1979). 375.
35- Kamat A-B~, H.N. studies in a bubble Angeles, AIChE meeting,
Knick le, "Gas holdup and flo-w patterns column", pape .r presented .for Los (1982)
36- Kara s., B .. G Kelkar and Y .• T. Shah, '1 iydrodynamics axia .l mixing in a three phasse bubble column 11 , Ind. Chem Proc. Des. Dev .. , 21, (1982), 584
and Eng ..
37- Kastanek F., "The ef£ect of the column diameter on the hydrodynamic parameters of bubble column with a plate as a gas distri butor 11 , Collection Czechoslov. Chem Commun , 4 2, ( 1 9 7 7) , 1 4 9 4 ..
39- Kastanek F.,v. Nyvlt and M. celation to interfacial area Collection Czechoslov. Chem~
Rylet , ttGas holdup and its in bubble type reactors",
Commun .. , 39, {1974), 528 ..
39- Kastanek F. ,M. Rylek and J.. Nyvlt, "Scaling up of bubble type reactors and the effect of reactor size on gas holdup in water-air systems", Collection Czechoslov.. Chem. Commun., 39, {1974), 3246.
40- Kato Y., A. Nishiwaki, "Longitudinal coefficient of a liguid in a bubble column", Eng., 12, #1, (1972), 182 ..
dispersion Int.. Chem
41- Knickle H .. N , Ac. Kirpekac, HA proposed flow map for

use in the reactors", {1982) ..
design of coal paper presented
ligue.faction for Or-lando,,
bubble AIChE
114
column meeting,,
42- Koide K .. J.. of Chem.
et al, "Bubbles qenerated from porous plate", Eng.. of Japan, Vol.. 1,, #1 , (1 .968), 51 ..
4 3- Koide K.. et al, "Behaviour of bu.bb :les in large scale bubble column", Journal of Chem. Eng. o:f Japan, 12, #2, (1979), 98 ..
44- Kumar A. et al, "Bubble swarm characteristics in bubble column", Can. J Chem .• Eng., 54, {1976l, 503.
45- Lamb H., 0 Hydrodynamics 11, 6th ed, Cambridge University Press, ( 1932)
46- Linek v.,v Vacek, "Chemical Enqineer.lng use of catalyzed sulfite oxidation kinetics for the determination of mass transfer characteristics of gas-liquid contactors", Chem. Eng. Sci., 36 , #11 , (1981), 1747.
4 7- Mahalingam R .. , "Two-phase as-Non-Newtonian fluid flow" ..
47A- Mikkilineni S ,T he effect of gas distributor on holdup and flow pattern in a bubble colum ,M@S. thesis, University of Rhode Island, 1983
48- Miller D.N., "Gas holdup and pressure column reactors", Ind Eng Chem. Des. 371.
drop in Dev., 19,
bubble (1980),
49- Nakanoh M,. and r. Yoshida, "Gas absorption by Newtonian and Non-Newtonian liquids in a ubble column", Ind Eng<e C.hem. Proc Des. Dev., 19, (1980)., 190.
50- Nakoryakon VE. et al, ttLocal characteristics of upward gas-liquid flow 0 , Int J. Multiphase flow , 7, (1981), 63-81
51- Nishikawa M , H. Kato and K Hashimoto , "Heat transfer in aerated tower filled with Non-Newtonian liguid", Ind. Eng Chem. Proc Des .. Dev., 16, #l , {1977)., 133 ..
52- Otake T., s. Tone and K. Sitinohara, "Gas holdup in the bubble column with cocurrent and countercurrent gas-liguid flow", Journal of Chem.. Enq. of japan , Vol 14, #4 , {198l),, 338 ...
53- Peebles F .. , H. in liguids", C em.
Garber ,"stu dies on the motion of bubbles Eng Pr og , 4 9 , ( 19 53) , 8 8
54- Rice R.G. ,J Tupperainen and R Hedge , "Dispersion and holdup in bubble columns, comparision of rigid and flexibles

spargers", Can. J. of Chem. Eng., 59, (1981), 677.
55- Schumpe A and W.D.. Deckwer, 11Comparison of photographic and the sulfite oxidation method interfacial area determination in bubble columns", Eng Commun .. , 17, (1982), 313
315
the for
Chem-
56- Schumpe A. and w.o Deckaer, "Gas holdup specific interfacial area and mass transfer coefficients of aerated carbo .ximethyl cellulose solutions in a bubble col.umn", Ind .. Eng. Chem. Proc. Des Dev., 21, (1982), 7060
5 7- Sha.h Y .. T .. , n Reaction Enqineering in direct (1981).
coal liquefaction", Addison-Wesley publishing Co.,
5 8- Shah Y .. T. ,G. J. Stiegel and M .M.. Sharma , "Bach.mixing in gas liquid reactors", AIChE J .• , 2 4,, #3, (1978) , 369.
59- Shima A ,T. Tsujino, uon the dynamics of bubbles in polymer aqueous solutions", Ap-plied Scientific Research, 38, ( 1982) , 255.
60- Shulman H.L.,M.C. gas-liquid contacting", 1058.
Molstad, Ind.. &
'Gas-bubble columns for Eng. Chem'", -42, (1950),
61- Skelland A .. H.P .. , "Non-Newtonian .flow and heat transfer", John Wiley and Sons Inc., {1967).
62- Slattery J .. C., R. B.. Bird, "NOn-Newtonian flow past a sphere", Chem .. Eng"' Sci .. , 16, (196l), 231.
63- Taitel Y ,D. Bornea and A.E. Dukler, "Modelling flow pattern transition for steady upward gas-liquid flow in vertical tubes", AICh.E J,., 26, #3, (1980), 345.
64- Towel G D.,C-P. Strand and G.H. Ackerman, "Mixing and mass transfer in large diameter bubble columns", Inst Chem. Eng .. Symp. Ser .. , #10, (1965), 91
65- Treyba .l R E .. , Book Co, III Ed.,
"Mass transfer operations", Mc Graw Hill (1980) ..
66- Ueyama K Col um Il S l1 , Ill a. 592.
et al, eng
"Behaviour Chem Proc ..
gas bubbles Des. Dev.,
in bubble 19., (1980),
67- Van Landeghem H, "Multiphase reactors: Mass transfer and modelling", Chem.,. Eng.. Sci., JS, { 1980) , 1916
68- Vermeer D and Krishna, "Hydrodynamics and mass transfer in bubble columns operating in the churn-turbulent ceg~me", Ind.. Eng. Chem.. Proc. Des. Dev., 20, #3, {1981), 475 ..

69- Yagi H.,F. Yoshida, "Gas absorption by Newtonian Non-Newtonian fluids in sparge.c agitated vesselsn, Eng ... Proc .. Des .. Dev .. , 14, #4, (1975), 488.
116
and Ind ..
70- Ying D • .H. ,E- N- Givens and H.F. Wermer, ttGas holdup in gas-liquid and gas-liquid-solid flow reactocsu, Ind. Eng. Chem ,. Proc. Des~ Dev., l9 , (1980), 635.