intergenerational pathways between child maltreatment, health and socioeconomic disadvantage
TRANSCRIPT
Intergenerational pathways between child maltreatment, health and
socioeconomic disadvantageFindings from an Australian population-based birth cohort
PhD Candidate
James Doidge, Uni. of South Australia
Supervisors Prof Leonie Segal, Uni. of South AustraliaA/Prof Paul Delfabbro, Uni. of Adelaide
ATP Collaborators
Dr Ben Edwards, AIFSProf John Toumbourou, Deakin Uni.Dr Darryl Higgins, AIFSMs Suzanne Vassallo, AIFS
BASPCAN Congress 2015
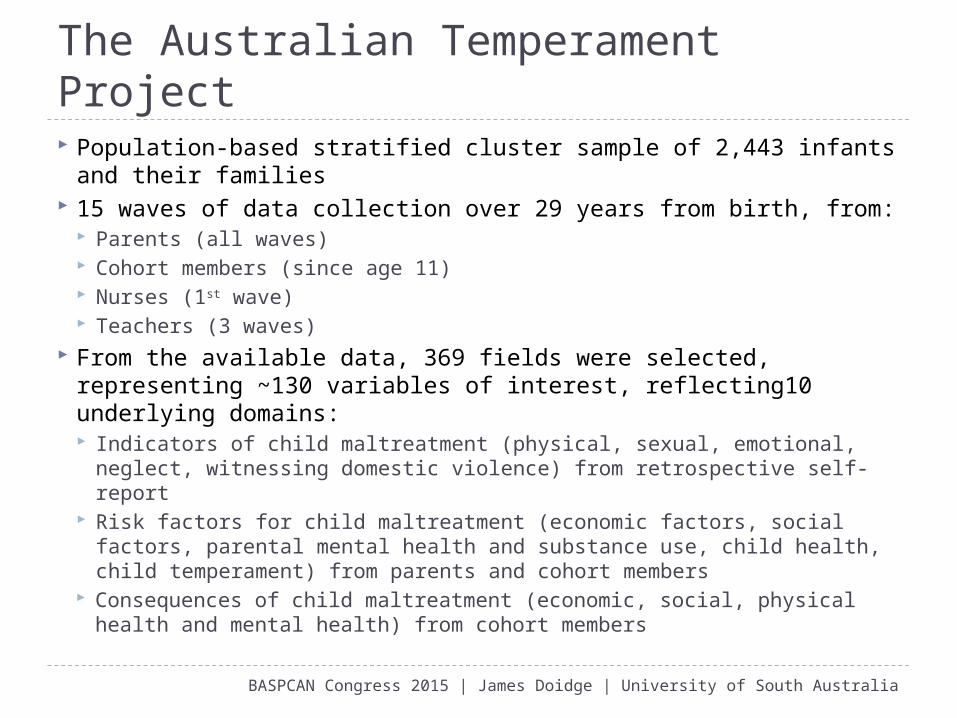
The Australian Temperament Project Population-based stratified cluster sample of 2,443 infants
and their families 15 waves of data collection over 29 years from birth, from:
Parents (all waves) Cohort members (since age 11) Nurses (1st wave) Teachers (3 waves)
From the available data, 369 fields were selected, representing ~130 variables of interest, reflecting10 underlying domains: Indicators of child maltreatment (physical, sexual, emotional,
neglect, witnessing domestic violence) from retrospective self-report Risk factors for child maltreatment (economic factors, social factors,
parental mental health and substance use, child health, child temperament) from parents and cohort members
Consequences of child maltreatment (economic, social, physical health and mental health) from cohort members
BASPCAN Congress 2015 | James Doidge | University of South Australia

BASPCAN Congress 2015 | James Doidge | University of South Australia
Conceptual model
⋯⋯ 𝐺𝑒𝑛𝑒𝑟𝑎𝑡𝑖𝑜𝑛𝑖
𝐺𝑒𝑛𝑒𝑟𝑎𝑡𝑖𝑜𝑛𝑖+1h𝐴𝑑𝑢𝑙𝑡 𝑜𝑜𝑑
h h𝐶 𝑖𝑙𝑑 𝑜𝑜𝑑 Child
maltreatment
Poor health,
psychosocial and economic outcomes
Poor health,
psychosocial and economic outcomes
Child
maltreatment
𝜆1
𝜆2
𝜆3
𝜆4
𝜆1

BASPCAN Congress 2015 | James Doidge | University of South Australia
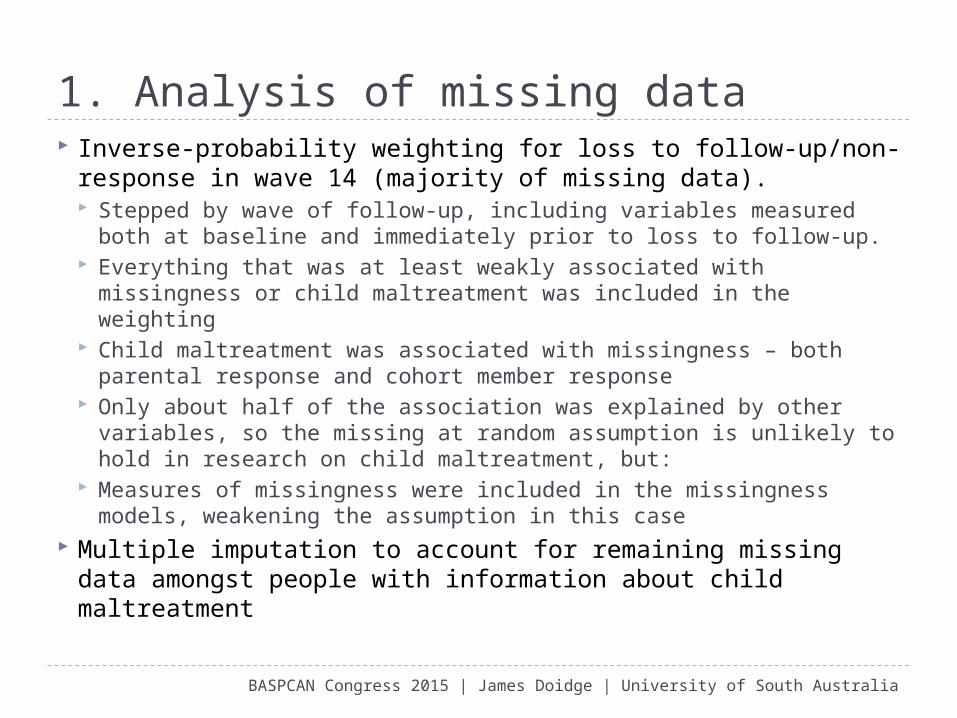
Analysis1. In-depth analysis of missing data
Stepped inverse-probability weighting and multiple imputation, incorporating measures of missingness
2. Analysis of parent and child-level risk factors for child maltreatment
Bivariate odds ratios and a series of multivariate regressions, to identify key causal risk factors
3. Analysis of outcomes of child maltreatment Bivariate odds ratios and a series of multivariate
regressions, to identify key consequences
4. Mediation analysis/path modelling
BASPCAN Congress 2015 | James Doidge | University of South Australia
1. Analysis of missing data Inverse-probability weighting for loss to follow-up/non-
response in wave 14 (majority of missing data). Stepped by wave of follow-up, including variables measured
both at baseline and immediately prior to loss to follow-up. Everything that was at least weakly associated with
missingness or child maltreatment was included in the weighting
Child maltreatment was associated with missingness – both parental response and cohort member response
Only about half of the association was explained by other variables, so the missing at random assumption is unlikely to hold in research on child maltreatment, but:
Measures of missingness were included in the missingness models, weakening the assumption in this case
Multiple imputation to account for remaining missing data amongst people with information about child maltreatment

BASPCAN Congress 2015 | James Doidge | University of South Australia
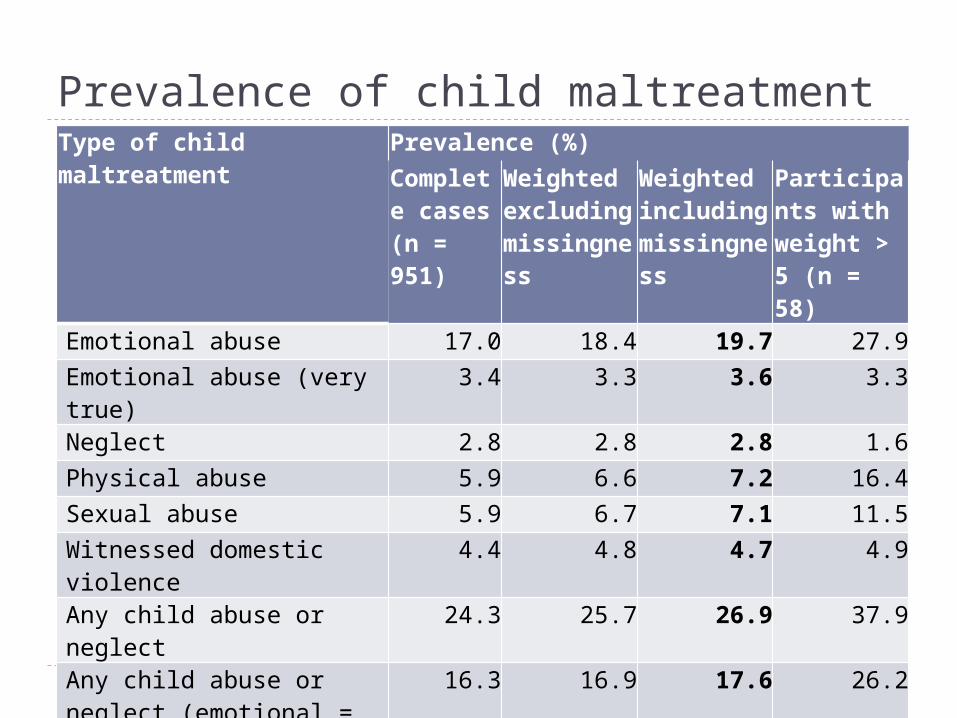
Prevalence of child maltreatmentType of child maltreatment Prevalence (%)
Complete cases(n = 951)
Weighted excluding missingness
Weighted including missingness
Participants with weight > 5 (n = 58)
Emotional abuse 17.0 18.4 19.7 27.9Emotional abuse (very true) 3.4 3.3 3.6 3.3Neglect 2.8 2.8 2.8 1.6Physical abuse 5.9 6.6 7.2 16.4Sexual abuse 5.9 6.7 7.1 11.5Witnessed domestic violence 4.4 4.8 4.7 4.9Any child abuse or neglect 23.8 25.2 26.5 36.1Any child abuse or neglect (emotional = very true)
16.3 16.9 17.6 26.2
Single type 16.0 16.7 17.1 18.6Multiple types 8.3 9.0 9.8 18.8
BASPCAN Congress 2015 | James Doidge | University of South Australia
Prevalence of child maltreatmentType of child maltreatment Prevalence (%)
Complete cases(n = 951)
Weighted excluding missingness
Weighted including missingness
Participants with weight > 5 (n = 58)
Emotional abuse 17.0 18.4 19.7 27.9Emotional abuse (very true) 3.4 3.3 3.6 3.3
Neglect 2.8 2.8 2.8 1.6Physical abuse 5.9 6.6 7.2 16.4Sexual abuse 5.9 6.7 7.1 11.5Witnessed domestic violence 4.4 4.8 4.7 4.9
Any child abuse or neglect 24.3 25.7 26.9 37.9Any child abuse or neglect (emotional = very true)
16.3 16.9 17.6 26.2
Multiple types 8.3 9.0 9.8 19.0Multiple types(emotional = very true)
4.2 4.7 4.9 6.9

BASPCAN Congress 2015 | James Doidge | University of South Australia
Multiple abuseType of maltreatment Proportion
reporting multiple types (%)
Emotional abuse 47.1Emotional abuse (very true) 68.2Neglect 70.1Physical abuse 66.1Sexual abuse 58.4Witnessed domestic violence 90.1Any child abuse or neglect 36.5Any child abuse or neglect (emotional = very true) 27.8

BASPCAN Congress 2015 | James Doidge | University of South Australia
2. Risk factors for child maltreatment Risk factor Odds ratio for maltreatment
Unadjusted
Models 1-5 Model 6 Model 7
Economic factors At least 'somewhat' poor 3.00*** 2.44*** 2.29*** 2.00***Parental unemployment 2.46*** 1.89*** 1.68** 1.85**Home ownership 2.20** 1.42 1.40 1.15
Father's education 1.42* 0.89 0.91 0.94
Father’s occupation 1.79*** 1.37 1.35 1.38Mother's education 2.00*** 1.93** 1.81** 1.70*Mother's occupation 1.39 0.73 0.76 0.77
Social factors Household mobility 1.72 0.55 0.35*Parental immigration (non-ES) 1.66** 2.04*** 1.64* 2.00**Father <22yo 1.25 1.26 0.92 2.18
Gender=male 0.97 0.96 1.12 1.15School mobility 2.76*** 2.99*** 2.81***More than 4 children in family 1.22 0.96 0.98 0.82
Mother <22yo 1.43 1.32 0.94 0.64Parental separation or divorce 2.89*** 3.04*** 2.11***
Parental mental health & substance use
Either parent smoked 1.82*** 1.60** 1.22 1.06
Father ex or heavy drinker 2.15** 1.52 1.27 1.20Mother ex or heavy drinker 4.70*** 3.59** 3.50** 5.49***Parental mental illness 2.53*** 2.17** 1.93* 1.74
Parental substance use problem 2.29** 1.72 1.35 0.99

BASPCAN Congress 2015 | James Doidge | University of South Australia
Risk factors for any child maltreatment Risk factor Odds ratio for maltreatment
Unadjusted
Models 1-5
Model 6 Model 7
Child health At least 2 investigated health problems by age 3
1.40 1.41 1.24
Below 3rd pc weight at 4-8 months 0.75 0.90 0.89 Birthweight <3rd pc 1.68 2.53* 2.98**Birthweight >97th pc 0.65 0.67 0.61Dysmature 0.32* 0.29* 0.23**Gestational age <37 weeks 0.71 0.92 0.82 Perinatal stress 0.62 0.65 0.59*Retrospective self-report of cognitive or behavioural problems while growing up
1.98** 1.76** 1.45
Retrospective self-report of physical health problems while growing up
1.85** 1.68* 1.66
Temperament Highest tertile of activity factor scale, 1983
0.79 0.77 0.71
Highest tertile of approach factor scale, 1983
1.01 0.99 0.90
Highest tertile of behaviour problems composite, 1983
1.05 1.02 1.05
Highest tertile of cooperation factor scale, 1983
0.91 0.90 0.77
Highest tertile of irritability factor scale, 1983
1.01 1.01 0.91
Highest tertile of rhymicity factor scale, 1983
0.98 0.95 0.87
Mother's overall rating more difficult 1.10 0.95 1.01Nurse's overall rating more difficult 1.43 1.54 1.54

BASPCAN Congress 2015 | James Doidge | University of South Australia
Determinants of child maltreatmentWith respect to specific type of maltreatment: Economic factors were stronger determinants of
physical abuse and domestic violence Parental mental health & substance use had greater
implications for sexual abuse and domestic violenceOverall, we estimated that 42% of child maltreatment was attributable to
economic factors 25% was attributable to social factors (largely
unmodifiable) 12% was attributable to parental mental health &
substance use (but measurement may have been poor) 35% was attributable to factors not measured in this
study

BASPCAN Congress 2015 | James Doidge | University of South Australia
Select health consequences
Very poor Poor Fair Good Excellent0%
10%
20%
30%
40%
50%
60%
Health in early adulthood by ex-posure to child maltreatment
NoneSingleMultiple
Overall rating of physical health at age 22-23 years
BASPCAN Congress 2015 | James Doidge | University of South Australia
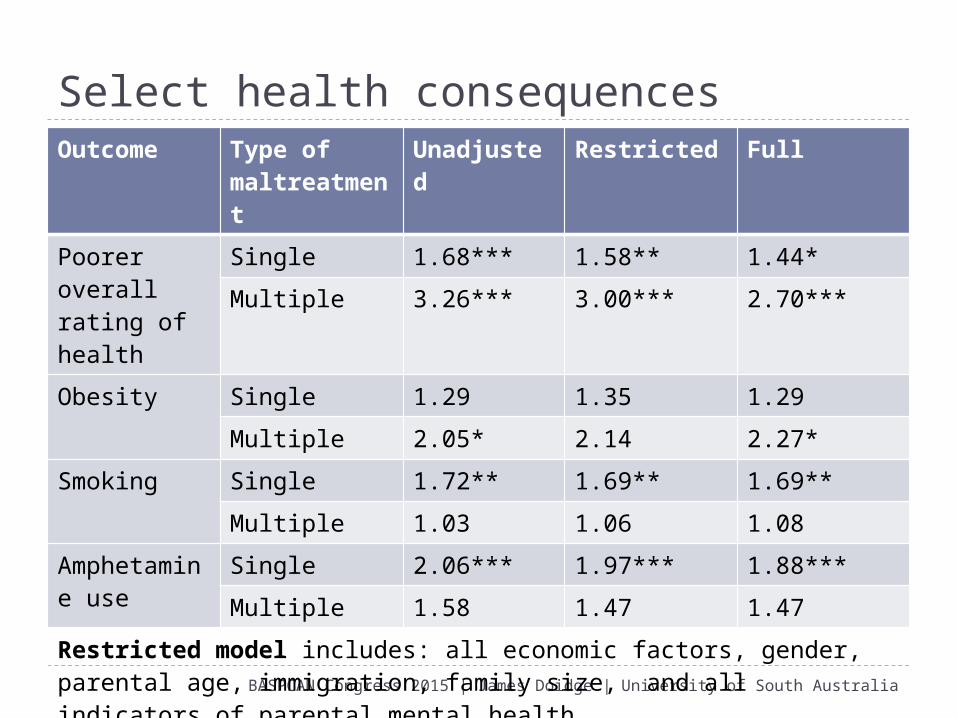
Select health consequencesOutcome Type of
maltreatment
Unadjusted
Restricted Full
Poorer overall rating of health
Single 1.68*** 1.58** 1.44*
Multiple 3.26*** 3.00*** 2.70***
Obesity Single 1.29 1.35 1.29
Multiple 2.05* 2.14 2.27*
Smoking Single 1.72** 1.69** 1.69**
Multiple 1.03 1.06 1.08
Amphetamine use
Single 2.06*** 1.97*** 1.88***
Multiple 1.58 1.47 1.47
Restricted model includes: all economic factors, gender, parental age, immigration, family size, and all indicators of parental mental healthFull model includes: all economic factors, all social factors, all indicators of parental mental health, and all indicators of child health*p < 0.10; **p < 0.05; ***p < 0.01
BASPCAN Congress 2015 | James Doidge | University of South Australia
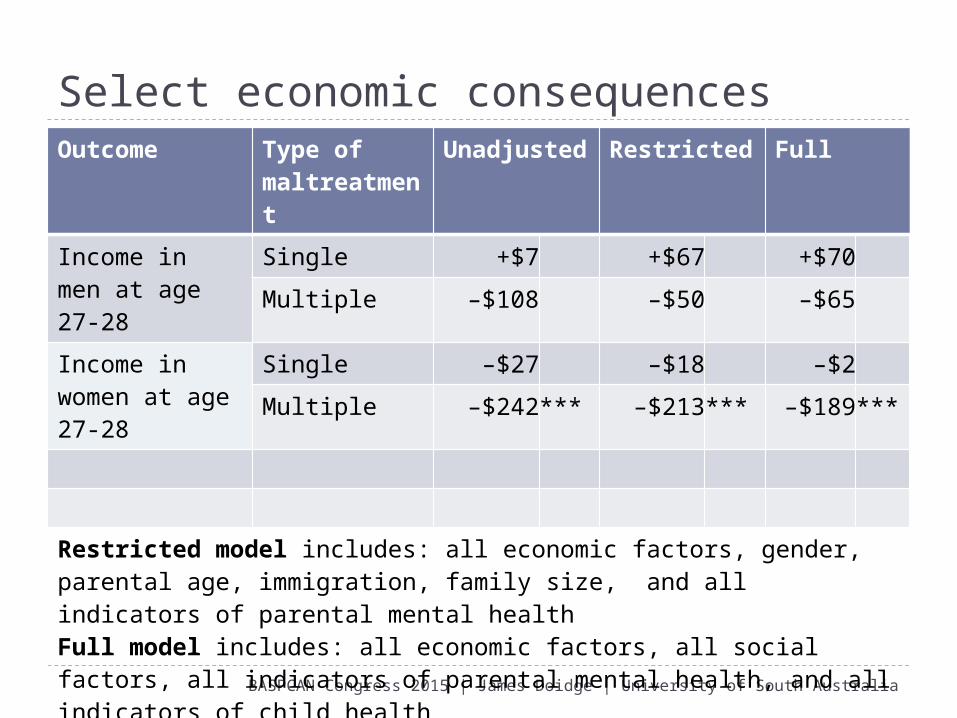
Select economic consequencesOutcome Type of
maltreatment
Unadjusted
Restricted Full
Income in men at age 27-28
Single +$7 +$67 +$70
Multiple –$108 –$50 –$65
Income in women at age 27-28
Single –$27 –$18 –$2
Multiple –$242*** –$213*** –$189***
Restricted model includes: all economic factors, gender, parental age, immigration, family size, and all indicators of parental mental healthFull model includes: all economic factors, all social factors, all indicators of parental mental health, and all indicators of child health*p < 0.10; **p < 0.05; ***p < 0.01