interim 1h16 report for personal use only - asx · for personal use only. mirvac group interim...
TRANSCRIPT

INTERIM REPORT 1H16
MIRVAC GROUPINTERIM REPORT31 DECEMBER 2015
For
per
sona
l use
onl
y

MIRVAC GROUP INTERIM REPORT FOR THE HALF YEAR ENDED 31 DECEMBER 2015
Mirvac Group
Interim ReportFor the half year ended 31 December 2015
Mirvac Group comprises Mirvac Limited (ABN 92 003 280 699) and its controlled entities (including Mirvac Property Trust (ARSN 086 780 645) and its controlled entities).
Contents Page
Directors’ report 01Operating and financial review 01Auditor’s independence declaration 07Financial statements 08Directors’ declaration 32Independent auditor’s review report to the members of Mirvac Limited 33Glossary of acronyms 35
This interim report does not include all the notes of the type normally included in an annual financial report. Accordingly, this report is to be read in conjunction with the annual report for the year ended 30 June 2015 and any public announcements made by Mirvac Group during the interim reporting period in accordance with the continuous disclosure requirements of the Corporations Act 2001.
For
per
sona
l use
onl
y

MIRVAC GROUP INTERIM REPORT FOR THE HALF YEAR ENDED 31 DECEMBER 2015 01
Directors’ report
The Directors of Mirvac Limited present their report, together with the consolidated report of Mirvac Group (“Mirvac” or “Group”) for the half year ended 31 December 2015. Mirvac comprises Mirvac Limited (“parent entity” or “company”) and its controlled entities, which includes Mirvac Property Trust (“MPT” or “Trust”) and its controlled entities.
DirectorsThe following persons were Directors of Mirvac Limited during the half year and up to the date of this report, unless otherwise stated:
— John Mulcahy— Susan Lloyd-Hurwitz— Christine Bartlett— Peter Hawkins— Samantha Mostyn— James M. Millar AM— John Peters— Elana Rubin
Operating and financial reviewThe statutory profit after tax attributable to the stapled securityholders of Mirvac for the half year ended 31 December 2015 was $472.7m (December 2014: $279.0m). The operating profit (profit before specific non-cash items and significant items) was $164.6m (December 2014: $231.2m).
Operating profit is a financial measure which is not prescribed by Australian Accounting Standards (“AAS”) and represents the profit under AAS adjusted for specific non-cash items and significant items. The Directors consider operating profit to reflect the core earnings of the Group.
The following table summarises key reconciling items between statutory profit after tax attributable to the stapled securityholders of Mirvac and operating profit. The operating profit information in the table has not been subject to any specific review procedures by the Group’s auditor but has been extracted from note 1 to the accompanying financial statements for the half year ended 31 December 2015, which have been subject to review; refer to pages 33 and 34 for the auditor’s review report on the financial statements.
31 December 31 December 2015 2014 $m $m
Profit attributable to the stapled securityholders of Mirvac 472.7 279.0
Specific non-cash itemsNet gain on fair value of investment properties and investment properties under construction (“IPUC”) (289.3) (50.8)Net gain on fair value of investment properties included in share of net profit of joint ventures and associates (“JVA”) 1 (42.2) (11.0)Net loss on fair value of derivative financial instruments and associated foreign exchange movements 2 10.4 13.4Security based payments (“SBP”) expense 3 5.2 1.8Depreciation of owner-occupied properties (“OOP”) 4 3.6 3.0Straight-lining of lease revenue 5 (5.4) (2.5)Amortisation of lease fitout incentives 4 4.5 4.7Net (gain)/loss on derivatives and other specific non-cash items included in share of net profit of JVA 1 (2.5) 2.0
Significant itemsImpairment of loans, investments and inventories — (0.1)Net gain from sale of non-aligned assets 6 (0.6) (4.4)Restructuring costs 7 1.4 —
Tax effectTax effect of non-cash and significant item adjustments 8 6.8 (3.9)
Operating profit (profit before specific non-cash and significant items) 164.6 231.2
1) Included within Share of net profit of JVA accounted for using the equity method in the consolidated statement of comprehensive income (“SoCI”).2) Total of Gain on fair value of derivative financial instruments, Foreign exchange loss and Loss on fair value of derivative financial instruments in the
consolidated SoCI.3) Included within Employee benefits expenses in the consolidated SoCI.4) Included within Depreciation and amortisation expenses in the consolidated SoCI.5) Included within Investment properties rental revenue in the consolidated SoCI.6) Included within Net gain on sale of assets in the consolidated SoCI.7) Included within Other expenses in the consolidated SoCI.8) Included in Income tax (benefit)/expense in the consolidated SoCI.
For
per
sona
l use
onl
y

MIRVAC GROUP INTERIM REPORT FOR THE HALF YEAR ENDED 31 DECEMBER 201502
Financial, Capital Management and Operational HighlightsKey financial highlights for the half year ended 31 December 2015:— profit attributable to the stapled securityholders of Mirvac
increased from $279.0m (December 2014) to $472.7m;
— operating profit of $164.6m 1 (December 2014: $231.2m), representing 4.5 cents per stapled security (“CPSS”);
— operating cash outflow of $225.9m, in line with expectations. This was due to the skew of residential settlements falling in the second half of FY16;
— gearing remained within the Group’s target range of 20.0 to 30.0 per cent at 27.6 per cent 2;
— half year distribution of $174.0m, representing 4.7 CPSS; and
— net tangible assets (“NTA”) 3 per stapled security of $1.83, up from $1.74 (June 2015).
Key capital management highlights for the half year ended 31 December 2015:— issued $194.9m (US$150.0m) of US Private Placement notes
which mature in 2025 and 2027;
— increased the Group’s syndicated bank facility by $300.0m to $1,700.0m and extended the maturity date, with tranches now maturing in September 2017, 2018, 2019 and 2020;
— held $474.9m of liquidity in cash and undrawn committed bank facilities;
— maintained a weighted average debt maturity of 4.3 years;
— reduced average borrowing costs to 4.9 per cent per annum (including margins and line fees); and
— continued to comfortably meet all debt covenants.
Outlook 4
While property markets generally continue to improve, the overall domestic economy is performing at a sub-trend pace. Despite this, Mirvac’s strategy to establish a strong and resilient business, supported by a deliberate weighting to New South Wales and Victoria, Australia’s largest and strongest performing state economies, means it is well-positioned to deliver returns across the business cycle.
Mirvac remains focused on prudently managing its capital position by monitoring and accessing diversified sources of capital, including equity, domestic and international debt and wholesale capital. This focus will help to ensure Mirvac can continue to meet its strategic objectives without increasing its overall capital management risk profile.
Mirvac will continue to enhance its capabilities as a world-class Australian property group concentrating on a secure income stream from its Investment portfolio, which underpins Group distributions, improving the return on invested capital achieved by its development activities, and positioning Mirvac for the future by investing in new projects, technology, innovation, sustainability and its people.
Divisional HighlightsInvestmentAt 31 December 2015, Investment (comprising MPT and a small number of assets held by the Company) had $7,754.6m 5 of invested capital across 59 6 direct property assets, covering the office, retail and industrial sectors, as well as investments in car parks, a hotel and other funds managed by Mirvac.
The split of invested capital across each sector was:— office: 58.0 per cent 7;— retail: 29.8 per cent 7;— industrial: 8.9 per cent; and— other: 3.3 per cent 8.
For the half year ended 31 December 2015, Investment recorded a statutory profit before tax of $569.4m (December 2014: $270.2m) and an operating profit before tax of $201.8m. The operating profit decreased by approximately five per cent on the prior corresponding period, due to the impact of asset sales in the previous financial year. Investment’s earnings continued to be secured by a strong weighted average lease expiry (“WALE”) profile of 5.6 years 9, over 98.3 per cent of rent reviews being fixed or linked to the Consumer Price Index (“CPI”), and 62.6 per cent of revenue being derived from multinational, ASX listed and government tenants.
Key operational highlights for Investment for the half year ended 31 December 2015:
— maintained high occupancy at 97.0 per cent 10;
— total investment property revaluations provided a net uplift of $365.9m 11 (or 5.0 per cent) over the previous book value;
— exchanged contracts with UrbanGrowth to acquire Australian Technology Park, Sydney NSW in a consortium with AMP Capital’s Wholesale Office Fund, AMP Capital separate account client, Sunsuper and Centuria Property Funds for a total consideration of $263.0m. Mirvac will deliver approximately 93,000 square metres of office space in addition to 3,000 square metres of amenity, including a gymnasium, retail outlets, childcare facilities and a multipurpose community space. Commonwealth Bank has signed an agreement for lease for 100 per cent of office net lettable area for a 15-year term;
— entered into a joint venture with PAYCE Consolidated to purchase a 49.9 per cent interest in East Village, Zetland, Sydney NSW for a total consideration of $154.7m. Mirvac secured management rights for this retail asset from December 2015, with settlement expected in the first half of FY17;
— entered into an agreement for a lease renewal with existing tenant, Westpac, for 58,500 square metres of office space at 275 Kent Street, Sydney NSW for a 12-year term commencing in 2018;
— reached an agreement with a subsidiary of China Investment Corporation (“CIC”) to become the asset manager of Investa Property Trust, with Morgan Stanley facilitating Mirvac’s entry into management rights contracts for a total consideration of $37.4m 12. Mirvac will also invest $25.5m in the CIC controlled trusts that are to be managed by Mirvac;
Directors’ report
1) Excludes specific non-cash items, significant items and related taxation.2) Net debt (at foreign exchange hedged rate) excluding leases/(total tangible assets – cash).3) NTA per stapled security, based on ordinary securities including Employee Incentive Scheme (“EIS”) securities.4) These future looking statements should be read in conjunction with future releases to the Australian Securities Exchange (“ASX”).5) Includes IPUC, indirect property investments and equity accounted investments.6) Excludes assets classified as held for sale and includes equity accounted investments.7) Includes IPUC.8) Includes IPUC, indirect property investments, car parks and a hotel.9) By income, includes equity accounted investments and excludes indirect property investments.10) By area, includes equity accounted investments and excludes indirect property investments.11) Includes fair value adjustments in IPUC, OOP and equity accounted investments.12) Settlement expected to occur in February 2016.
For
per
sona
l use
onl
y

MIRVAC GROUP INTERIM REPORT FOR THE HALF YEAR ENDED 31 DECEMBER 2015 03
Divisional Highlights / continued— exchanged contracts in January 2016 for the sale of
1 Woolworths Way, Bella Vista NSW for $336.4m 1, representing a yield of 6.07 per cent;
— completed 282 leasing deals over 233,544 square metres of net lettable area (16.7 per cent of portfolio net lettable area);
— proactively managed Investment’s lease expiry profile for FY16, with FY16 lease expiries reducing to 8.0 per cent from 14.9 per cent 2 as at 31 December 2014; and
— key development highlights are outlined in the Commercial highlights section in this report. Key leasing achievements for assets under development included:
> 200 George Street, Sydney NSW: this premium-grade office tower was 84.6 per cent pre-leased as at 31 December 2015, with Mirvac exercising its option for additional office space of approximately 1,100 square metres;
> 664 Collins Street, Melbourne VIC: signed an agreement for lease with professional services firm, Pitcher Partners, for over 8,600 square metres of office space, with development of the 26,000 square metre A-grade office building to commence in mid-2016;
> Orion Springfield Central, Springfield QLD: progressed with leasing for the Stage 2 expansion of approximately 32,000 square metres, with 88.0 per cent pre-leased as at 31 December 2015 (up from 75.2 per cent at 30 June 2015);
> Tramsheds, Harold Park, Sydney NSW: progressed with leasing for over 6,000 square metres of retail space, which will include a supermarket, market style food halls, boutique retailers, cafés, restaurants and a gymnasium. The project was 98.1 per cent pre-leased as at 31 December 2015 (up from 58.7 per cent at 30 June 2015); and
> Broadway Shopping Centre, Sydney NSW: progressed with leasing for the 3,300 square metre Level 2 expansion, with 67.2 per cent pre-leased as at 31 December 2015 (up from 32.0 per cent at 30 June 2015).
The Group’s focus on sustainability continued to deliver results, with key highlights including:
> a 5.1 Star NABERS (National Australian Built Environment Rating System) average energy rating across the office portfolio;
> 23 Furzer Street, Phillip ACT received the Facility Management Industry Energy Efficiency Award and was named the Best Commercial Building Energy Efficiency Project by the Energy Efficiency Council. These awards recognise 23 Furzer Street’s incredible achievement of becoming Australia’s first major property to attain a 6.0 Star NABERS Energy rating without GreenPower;
> 275 Kent Street, Sydney NSW achieved a 6.0 Star Green Star Performance rating, one of only two buildings in Australia to have achieved this;
> 20 Bond Street, Sydney NSW achieved a 5.5 Star NABERS Energy rating;
> 8 Chifley Square, Sydney NSW achieved a 5.0 Star NABERS Energy rating and 5.0 Star NABERS Water rating; and
> Broadway Shopping Centre, Sydney NSW achieved a 17.5 per cent reduction in carbon intensity from its baseline year of FY13. Through LED lighting upgrades and other operational management initiatives, the centre has reduced its electricity consumption by over one million kilowatts per hour, providing savings of over $130,000 in energy costs.
Outlook 3
Global economic activity continues to be mixed, with some improving momentum in the United States, sustained weakness in Europe and Japan and cooling growth in China. Domestically, the economy has recorded slightly sub-trend growth, impacted by some further falls in commodity prices and the wind-down of resource construction activity. However, a sizeable decline of the Australian dollar and a sustained period of low interest rates are providing support to the Australian economy. Likewise, an abundance of both domestic and offshore capital is driving strong investor demand for good quality assets in the office, retail and industrial sectors. Mirvac’s office portfolio, with high occupancy, embedded rental increases, quality tenant covenants and strong weightings to Australia’s largest and strongest performing office markets, Sydney and Melbourne CBD, continues to be well-positioned. Conditions in the retail sector have been divergent throughout Australia, with mixed levels of consumer confidence and soft household income growth. Despite these challenging conditions, Mirvac’s retail assets should continue to benefit from their exposure to solid catchments in urban markets, particularly in Sydney where approximately 67 per cent 4 of the portfolio is located. The industrial portfolio, with minimal vacancy and a long WALE of 7.2 years 5, continues to provide steady income to the Group.
Overall, the Trust remains focused on providing secure passive income to the Group, with key areas of focus including:
— extracting the benefit of the Group’s demonstrated competitive advantage in the office sector by creating innovative, collaborative and flexible workplaces for the future for tenants;
— maintaining a focus on the key markets of Sydney and Melbourne in the office and industrial sectors, and creating new product to be held for the long term; and
— focusing on quality retail assets located in key metropolitan and urban markets and unlocking value through the retail development pipeline.
Investment ManagementMirvac Investment Management (“MIM”) comprises two business activities for segment reporting purposes including third party capital management (Mirvac Capital (“Capital”)), and property asset management (Mirvac Asset Management (“MAM”)).
For the half year ended 31 December 2015, MIM recorded a statutory profit before tax of $3.5m (December 2014: $4.0m) and an operating profit before tax of $3.5m.
At 31 December 2015, Capital managed three wholesale funds: Mirvac Wholesale Residential Development Partnership; Tucker Box Hotel Group; JF Infrastructure Yield Fund; as well as one retail fund: Mirvac Development Fund – Meadow Springs.
MAM provides asset management services primarily for the MPT portfolio. MAM currently manages 67 properties.
Outlook 3
Capital remains focused on establishing investment partnerships with strategically aligned domestic and international institutional investors to co-invest alongside Mirvac in office, industrial, retail and residential assets and development projects. MAM will also continue to provide asset management services in accordance with growth in the MPT and Capital portfolios and in assets owned by third parties where there are common interests.
Directors’ report
1) As part of the transaction, Mirvac Projects will remain responsible for the delivery (including cost) of a new multi-storey carpark via a development management agreement.
2) By income, includes 8 Chifley Square, Sydney NSW and Treasury Building, Perth WA and excludes assets classified as held for sale and indirect property investments.
3) These future looking statements should be read in conjunction with future releases to the ASX.4) By book value.5) By income.
For
per
sona
l use
onl
y

MIRVAC GROUP INTERIM REPORT FOR THE HALF YEAR ENDED 31 DECEMBER 201504
Divisional Highlights / continuedDevelopmentMirvac’s Development business unit operates across national product lines consisting of Residential (comprising Master-planned Communities and Apartments) and Commercial.
At 31 December 2015, Development had $1,908.1m of invested capital.
For the half year ended 31 December 2015, Development recorded a statutory loss before tax of $15.6m (December 2014: statutory profit before tax of $60.9m) and an operating loss before tax of $15.6m. This is in line with expectations due to the significant skew of residential settlements in the second half of FY16.
ResidentialThe Residential business continued to deliver quality residential product in the Group’s core metropolitan markets, with a weighting towards Sydney and Melbourne.
Key sales highlights across Masterplanned Communities and Apartments:
Masterplanned Communities— Brighton Lakes NSW: achieved strong sales with 94.8 per cent
of released lots pre-sold (93 exchanged contracts);
— Gledswood Hills NSW: achieved strong sales, with 82.8 per cent of released lots pre-sold (63 exchanged contracts);
— Harcrest VIC: achieved strong sales with 100.0 per cent of Stage 7, Stage 9 and Stage 10 pre-sold (80 exchanged contracts);
— Woodlea VIC: achieved strong sales with 96.5 per cent of released lots pre-sold (499 exchanged contracts); and
— Tullamore VIC: achieved strong sales with 89.6 per cent of remaining lots in Stage 2 pre-sold (43 exchanged contracts) and 66.6 per cent of Stage 3 pre-sold (54 exchanged contracts); and
Apartments— Harold Park, Sydney NSW: released the final stage of the last
precinct which was 66.8 per cent pre-sold (76 exchanged contracts); and
— Stage 2, Hope Street, South Brisbane QLD: secured 75.4 per cent pre-sales (126 exchanged contracts).
In addition to the strong sales momentum, Mirvac entered into a strategic joint venture with Ping An Real Estate to develop residential projects in key cities in Australia. The first project to seed the joint venture will be The Finery, Mirvac’s apartment development in Waterloo, Sydney, with Mirvac to provide development, construction and sales management services 1.
For the half year ended 31 December 2015, Development’s residential pipeline totalled 34,182 lots which was supplemented by the acquisition of strategically aligned projects that will contribute to Development’s future pipeline, including:
— Eagle Farm, QLD: entered into a project delivery agreement (“PDA”) with Brisbane Racing Club to develop the estimated $992.2m 2 residential precinct in Eagle Farm, Brisbane. Mirvac intends to deliver over 1,000 apartments and will work closely with the Racing Club to deliver an exciting retail village; and
— Marrickville Hospital, NSW: entered into a project delivery agreement with Marrickville Council to redevelop the old Marrickville Hospital in Sydney’s inner-west. Mirvac intends to deliver around 220 apartments, a library and community hub as well as 1,200 square metres of open space.
The extensive residential development pipeline, which has the potential to deliver over 16,000 lots over the next five years, has enabled the Group to remain selective around acquiring future residential projects.
For the half year ended 31 December 2015, Development settled 748 residential lots and secured future income of $2,634.1m 3 through the exchange of pre-sales contracts.
State based lot settlements by product for the half year ended 31 December 2015 were as follows:
Masterplanned State Communities Apartments Total
NSW 290 — 290QLD 111 3 114VIC 171 17 188WA 152 4 156
Total 724 24 748
Development expects to settle over 2,900 residential lots in FY16.
CommercialMirvac’s commercial development activities include office, retail and industrial projects. For the year ended 31 December 2015, Mirvac’s active office development pipeline had an end value of $2,062.9m on a 100.0 per cent ownership basis.
Key leasing highlights for Commercial for the half year ended 31 December 2015 were outlined in the Investment highlights section of this report. Key development milestones:
— Treasury Building, Perth WA: achieved practical completion in August 2015. The A-grade office tower, located on the landmark site of the Old Treasury building, has achieved a 5.0 Star Green Star Office Design rating and is targeting a 4.5 Star NABERS Energy rating and a 5.0 Star Green Star As-Built rating;
— 200 George Street, Sydney NSW: structural works on the office tower are complete, while integrated fitout works for major tenant, EY, are well-advanced, with finishes and furniture installation commencing on the mid-rise levels. Completion is expected in FY16. The office tower has achieved a 6.0 Star Green Star Office V3 Design rating and is targeting a 5.0 Star NABERS Energy rating;
— 2 Riverside Quay, Melbourne VIC: site works are progressing well, with completion expected in FY17. A 5.0 Star NABERS Energy rating and a 5.0 Star Green Star Office Design rating are being targeted;
— Australian Technology Park, Sydney NSW: exchanged contracts with UrbanGrowth to acquire this iconic site in a consortium with AMP Capital’s Wholesale Office Fund, AMP Capital separate account client, Sunsuper and Centuria Property Funds. Mirvac will deliver approximately 93,000 square metres of office space, in addition to 3,000 square metres of amenity, including a gymnasium, retail outlets, childcare and a multipurpose community space. The office towers are targeting a 5.0 Star NABERS Energy rating and 6.0 Star Green Star rating;
1) Subject to FIRB approval.2) Represents 100 per cent of end value.3) Adjusted for Mirvac’s share of JVA and Mirvac managed funds.
Directors’ reportF
or p
erso
nal u
se o
nly

MIRVAC GROUP INTERIM REPORT FOR THE HALF YEAR ENDED 31 DECEMBER 2015 05
Divisional Highlights / continued— 664 Collins Street, Melbourne VIC: received Development
Approval with detailed design documentation now finalised. Through the construction of Mirvac’s adjoining building, 699 Bourke Street, Melbourne VIC, enabling works for 664 Collins Street have been completed. Development of the building will commence in mid-2016. A 5.0 Star NABERS Energy rating and a 5.0 Star Green Star Office Design rating are being targeted;
— Orion Springfield Central, Springfield QLD: progressed with construction on the Stage 2 expansion, which will add approximately 32,000 square metres of gross lettable area. The first phase of the development was completed during the period, which included the opening of Coles, Target, and Event Cinemas, centred around a new town square. The final stage is on track for completion in the second half of FY16;
— Tramsheds, Harold Park Sydney NSW: progressed with the construction of the 6,000 square metre boutique retail centre. Mirvac will dedicate 500 square metres of community space to Sydney Council on completion, due in late FY16; and
— Broadway Shopping Centre, Sydney NSW: commenced development works on the Level 2 expansion, which will deliver a new casual dining precinct and an enhanced fashion offering, anchored by a leading mini-major. Completion is expected in early FY17.
Outlook 1
The outlook for capital city residential markets remains divergent by location, however, an ongoing low interest rate environment should continue to support residential activity, albeit with more modest price gains in Sydney and Melbourne. All major states are recording solid levels of population growth, although this has slowed in Queensland and Western Australia. New South Wales, and Sydney in particular, is benefiting from strong job gains and a buoyant state economy. Demand for modern, higher density living supported by amenity and infrastructure is expected to continue, particularly in the south-eastern states.
Development remains focused on:
— continuing to improve key metrics including return on invested capital and gross margins;
— strategically restocking the development pipeline; and
— improving the strong levels of pre-sales to mitigate future earnings risks.
RisksAs a property group involved in real estate investment, residential and commercial development and investment management, Mirvac faces a number of risks throughout the business cycle which have the potential to affect the Group’s achievement of its targeted financial outcomes. The Group’s objective is to ensure those risks are identified and appropriate strategies are implemented to control or otherwise manage the impact of those risks. Mirvac’s risk management framework is integrated with its day-to-day business processes and is supported by a dedicated Group Risk function. Further information on the Group’s risk management framework is detailed in the Corporate Governance statement which is available on Mirvac’s website: http://www.mirvac.com/about/corporate-governance.
Group risksFor the half year ended 31 December 2015, the Group continued to review both internal and external risks which have the potential to affect the Group’s targeted financial outcomes and to implement strategies to minimise their impact. Further information on the material risks identified for each of the Investment and Development divisions is outlined below. At a Group level, Mirvac faces certain risks to achieving of its financial outcomes; these risks are the types of risks typical for a property group. These may include debt refinancing and compliance with debt covenants, compliance with health, safety and environment regulations as well as broader economic conditions.
Divisional risksAt a divisional level, the key risks faced by Investment and Development which have the potential to affect the achievement of the financial prospects for the Group include:
— Office: as detailed in the outlook section for Investment, while tenant demand for office space remains challenging in Brisbane and Perth, there has been improved demand Sydney and Melbourne, where 79.0 per cent of Mirvac’s office portfolio is located. The office portfolio metrics, comprising a long WALE of 6.1 years 2 and solid occupancy of 94.5 per cent 3, demonstrate Mirvac’s ability to maintain a strong and robust portfolio through the cycles of demand. The Group seeks to manage uncertainty around commercial office demand in a number of ways including substantial pre-letting of commercial developments in advance of construction and by partially selling down commercial developments in advance of completion;
— Retail: as detailed in the outlook section for Investment, there was a steady improvement in retail sales over 2015; however, leasing demand in the broader market is variable and a number of retailers remain under pressure. Mirvac is focused on continually refreshing its retail assets (via refurbishment, redevelopment or tenant remixing) to adapt to changing market dynamics. Furthermore, Mirvac maintains a focus on key urban and metropolitan markets and a diversified tenancy mix, where no single specialty retailer contributes greater than 1.5 per cent of the total portfolio’s gross rent;
— Industrial: as detailed in the outlook section for Investment, continuing investor demand for prime grade industrial assets in key locations is resulting in compressed capitalisation rates, weighting predominately towards the stronger markets of Sydney and Melbourne. Mirvac continues to focus on properties with long lease terms and secure cash flow profiles; and
— Residential: as detailed in the outlook section for Development, conditions in the Australian residential market vary from state to state (and within states), and while strong price growth in Sydney appears to be moderating, demand continues to be supported by low interest rates, population growth and a high level of investment in infrastructure. Mirvac carefully monitors its settlement risk with a range of risk mitigation strategies in place. As well as the requirement of a 10.0 per cent deposit from purchasers, Mirvac has a structured communication and engagement programme with its customers and lenders, and undertakes a thorough risk assessment of its exposure to foreign investment. Mirvac’s proven track record of managing its settlement risk is demonstrated by a history of low defaults, with a long-term average of less than one per cent.
1) These future looking statements should be read in conjunction with future releases to the ASX.2) By income, includes equity accounted investments and excludes indirect property investments.3) By area, includes equity accounted investments and excludes indirect property investments.
Directors’ reportF
or p
erso
nal u
se o
nly

MIRVAC GROUP INTERIM REPORT FOR THE HALF YEAR ENDED 31 DECEMBER 201506
Matters subsequent to the end of the half yearOn 18 January 2016, Mirvac exchanged contracts for the sale of 1 Woolworths Way, Bella Vista NSW for a total consideration of $336.4m, representing a yield of 6.07 per cent. The total consideration comprised $276.4m, due on settlement of the office building, and $60.0m related to the delivery (including cost) of a new multi-storey car park via a development management agreement. Settlement is expected in February 2016. At 31 December 2015, the office building was an asset classified as held for sale as it met all the conditions set out in the AASB 5 Non-current Assets Held for Sale and Discontinued Operations.
No other circumstances have arisen since the end of the half year which have significantly affected or may significantly affect the operations of Mirvac, the results of those operations, or the state of affairs of Mirvac in future years.
Auditor’s independence declarationA copy of the auditor’s independence declaration required under section 307C of the Corporations Act 2001 is set out on page 07.
Rounding of amountsMirvac is an entity of the kind referred to in Class Order 98/100 issued by the Australian Securities and Investments Commission (“ASIC”), relating to the rounding off of amounts in the Directors’ report and financial statements. Amounts in the Directors’ report and financial statements have been rounded off to the nearest tenth of a million (“m”) dollars in accordance with that Class Order.
This statement is made in accordance with a resolution of the Directors.
Susan Lloyd-HurwitzDirector
Sydney 11 February 2016
Directors’ reportF
or p
erso
nal u
se o
nly

MIRVAC GROUP INTERIM REPORT FOR THE HALF YEAR ENDED 31 DECEMBER 2015 07
Auditor’s independence declaration
As lead auditor for the review of Mirvac Limited for the half-year ended 31 December 2015, I declare that to the best of my knowledge and belief, there have been:
a) no contraventions of the auditor independence requirements of the Corporations Act 2001 in relation to the review; and
b) no contraventions of any applicable code of professional conduct in relation to the review.
This declaration is in respect of Mirvac Limited and the entities it controlled during the period.
Jane Reilly SydneyPartner 11 February 2016PricewaterhouseCoopers
PricewaterhouseCoopers, ABN 52 780 433 757 Darling Park Tower 2, 201 Sussex Street, GPO BOX 2650, SYDNEY NSW 1171 T: +61 2 8266 0000, F: +61 2 8266 9999, www.pwc.com.au
Liability limited by a scheme approved under Professional Standards Legislation
For
per
sona
l use
onl
y

MIRVAC GROUP INTERIM REPORT FOR THE HALF YEAR ENDED 31 DECEMBER 201508
Financial statements
Contents Page
Consolidated statement of comprehensive income 09Consolidated statement of financial position 10Consolidated statement of changes in equity 11Consolidated statement of cash flows 12Notes to the consolidated financial statements 13
Notes index
Basis of preparation 13
Results for the half year1 Segmental information 132 Finance costs 173 Earnings per stapled security (“EPS”) 17
Operating assets and liabilities4 Investment properties 185 Assets classified as held for sale 216 Inventories 217 Other non-financial assets and liabilities 21
Capital structure8 Borrowings 229 Fair value measurement of financial instruments 24
Group structure10 Investments in JVA 26
Equity11 Contributed equity 2712 Dividends/distributions 27
Other information13 Contingent liabilities14 Notes to the consolidated statement of cash flows 2815 Events occurring after the end of the reporting period 2816 Summary of significant accounting policies 2917 Critical accounting judgements and estimates 29
Directors’ declaration 32Independent auditor’s review report to the members of Mirvac Limited 33
For
per
sona
l use
onl
y

MIRVAC GROUP INTERIM REPORT FOR THE HALF YEAR ENDED 31 DECEMBER 2015 09
31 December 31 December 2015 2014 Note $m $m
Revenue from continuing operationsInvestment properties rental revenue 4(b) 306.2 301.9Investment management fee revenue 6.8 6.6Development and construction revenue 409.6 577.5Development management fee revenue 3.4 3.4Interest revenue 14.9 14.3Dividends/distributions revenue — 0.2Other revenue 3.6 5.1
Total revenue from continuing operations 744.5 909.0
Other incomeNet gain on fair value of investment properties and IPUC 289.3 50.8Share of net profit of JVA accounted for using the equity method 10 65.2 29.0Gain on fair value of derivative financial instruments 68.4 139.1Net gain on sale of assets 0.6 9.5
Total other income 423.5 228.4
Total revenue from continuing operations and other income 1,168.0 1,137.4
Net loss on sale of assets — 5.1Foreign exchange loss 69.7 125.6Investment properties expenses 4(b) 72.3 67.3Cost of property development and construction 379.7 438.6Employee benefits expenses 58.3 50.3Depreciation and amortisation expenses 16.6 14.8Impairment of loans, investments and inventories — (0.1)Finance costs 2 50.6 75.1Loss on fair value of derivative financial instruments 9.1 26.9Selling and marketing expenses 21.2 22.8Other expenses 24.3 25.9
Profit from continuing operations before income tax 466.2 285.1Income tax benefit/(expense) 6.5 (6.1)
Profit for the half year 472.7 279.0
Other comprehensive income for the half yearItems that may be reclassified to profit or lossExchange differences on translation of foreign operations, net of tax 2.5 7.5
Items that will not be reclassified to profit or lossIncrement on revaluation of OOP 37.1 4.6Deferred tax on SBP transactions 0.2 —
Other comprehensive income for the half year 39.8 12.1
Total comprehensive income for the half year 512.5 291.1
Profit for the half year attributable to the stapled securityholders of Mirvac 472.7 279.0
Total comprehensive income for the half year attributable to the stapled securityholders of Mirvac 512.5 291.1
EPS for profit attributable to the stapled securityholders of Mirvac Cents Cents
Basic EPS 3 12.79 7.56Diluted EPS 3 12.78 7.55
The above consolidated statement of comprehensive income (“SoCI”) should be read in conjunction with the accompanying notes.
Consolidated statement of comprehensive incomeFor the half year ended 31 December 2015
For
per
sona
l use
onl
y

MIRVAC GROUP INTERIM REPORT FOR THE HALF YEAR ENDED 31 DECEMBER 201510
31 December 30 June 2015 2015 Note $m $m
Current assetsCash and cash equivalents 14(a) 42.3 59.8Receivables 94.3 73.0Derivative financial assets 9 21.1 —Inventories 6 884.6 774.2Other financial assets at fair value through profit or loss 9 2.7 11.3Other financial assets 9 23.9 —Other assets 37.0 21.6Assets classified as held for sale 5 276.4 —
Total current assets 1,382.3 939.9
Non-current assetsReceivables 71.1 56.8Inventories 6 991.0 939.2Investments in JVA accounted for using the equity method 10 701.3 562.2Derivative financial assets 9 207.4 175.9Other financial assets 9 152.0 264.6Investment properties 4 6,915.3 6,751.1Property, plant and equipment (“PPE”) 299.7 261.9Intangible assets 7 39.0 39.0Deferred tax assets 441.7 412.9
Total non-current assets 9,818.5 9,463.6
Total assets 11,200.8 10,403.5
Current liabilitiesPayables 495.6 673.1Borrowings 8 612.9 0.2Derivative financial liabilities 9 9.9 12.4Provisions 190.5 201.5Other liabilities 0.2 0.2
Total current liabilities 1,309.1 887.4
Non-current liabilitiesPayables 132.3 113.5Borrowings 8 2,630.4 2,633.7Derivative financial liabilities 9 71.2 76.0Deferred tax liabilities 235.9 213.7Provisions 15.9 17.1
Total non-current liabilities 3,085.7 3,054.0
Total liabilities 4,394.8 3,941.4
Net assets 6,806.0 6,462.1
EquityContributed equity 11 6,809.8 6,804.3Reserves 134.2 94.5Retained earnings (138.0) (436.7)
Equity, reserves and retained earnings attributable to the stapled securityholders of Mirvac 6,806.0 6,462.1
The above consolidated statement of financial position (“SoFP”) should be read in conjunction with the accompanying notes.
Consolidated statement of financial positionAs at 31 December 2015
For
per
sona
l use
onl
y

MIRVAC GROUP INTERIM REPORT FOR THE HALF YEAR ENDED 31 DECEMBER 2015 11
Attributable to the stapled securityholders of Mirvac
Contributed Retained equity Reserves earnings Total Note $m $m $m $m
Balance 1 July 2015 6,804.3 94.5 (436.7) 6,462.1
Profit for the half year — — 472.7 472.7Other comprehensive income for the half year — 39.8 — 39.8
Total comprehensive income for the half year — 39.8 472.7 512.5
Long Term Performance Plan (“LTP”), Long Term Incentive Plan (“LTIP”) and EIS securities converted, sold, vested or forfeited 5.5 — — 5.5SBP transactions — (0.1) — (0.1)Dividends/distributions provided for or paid 12 — — (174.0) (174.0)
Total transactions with owners in their capacity as owners 5.5 (0.1) (174.0) (168.6)
Balance 31 December 2015 6,809.8 134.2 (138.0) 6,806.0
Balance 1 July 2014 6,796.8 76.9 (697.6) 6,176.1
Profit for the half year — — 279.0 279.0Other comprehensive income for the half year — 12.1 — 12.1
Total comprehensive income for the half year — 12.1 279.0 291.1
LTIP, long term incentives (“LTI”) and EIS securities converted, sold, vested or forfeited 6.2 — — 6.2SBP transactions — (2.5) — (2.5)Security based compensation — — (1.0) (1.0)Dividends/distributions provided for or paid 12 — — (166.4) (166.4)
Total transactions with owners in their capacity as owners 6.2 (2.5) (167.4) (163.7)
Balance 31 December 2014 6,803.0 86.5 (586.0) 6,303.5
The above consolidated statement of changes in equity should be read in conjunction with the accompanying notes.
Consolidated statement of changes in equityFor the half year ended 31 December 2015
For
per
sona
l use
onl
y

MIRVAC GROUP INTERIM REPORT FOR THE HALF YEAR ENDED 31 DECEMBER 201512
31 December 31 December 2015 2014 Note $m $m
Cash flows from operating activitiesReceipts from customers (inclusive of goods and services tax) 628.0 1,117.8Payments to suppliers and employees (inclusive of goods and services tax) (798.7) (795.1)
(170.7) 322.7Interest received 6.6 10.4Dividends/distributions received from JVA 13.0 14.7Dividends/distributions received — 0.2Borrowing costs paid (74.8) (72.5)
Net cash (outflows)/inflows from operating activities 14(b) (225.9) 275.5
Cash flows from investing activitiesPayments for PPE (5.5) (1.8)Payments for investment properties (160.0) (516.2)Proceeds from sale of PPE 0.1 —Proceeds from sale of investment properties 8.2 660.0Proceeds from loans to unrelated entities 0.5 8.7Contributions to JVA (1.1) (21.5)Proceeds from JVA 7.7 4.7Proceeds from sale of investments — 11.5
Net cash (outflows)/inflows from investing activities (150.1) 145.4
Cash flows from financing activitiesProceeds from borrowings 1,450.7 354.9Repayments of borrowings (911.0) (662.2)Dividends/distributions paid (181.2) (169.8)
Net cash inflows/(outflows) from financing activities 358.5 (477.1)
Net decrease in cash and cash equivalents (17.5) (56.2)Cash and cash equivalents at the beginning of the half year 59.8 97.8
Cash and cash equivalents at the end of the half year 14(a) 42.3 41.6
The above consolidated statement of cash flows should be read in conjunction with the accompanying notes.
Consolidated statement of cash flowsFor the half year ended 31 December 2015
For
per
sona
l use
onl
y

MIRVAC GROUP INTERIM REPORT FOR THE HALF YEAR ENDED 31 DECEMBER 2015 13
BASIS OF PREPARATIONThis condensed consolidated interim report for the half year reporting period ended 31 December 2015 has been prepared in accordance with AASB 134 Interim Financial Reporting and the Corporations Act 2001. The financial statements of Mirvac consist of the consolidated financial statements of Mirvac Limited (the parent entity) and its controlled entities, which include MPT and its controlled entities. A Mirvac stapled security comprises one Mirvac Limited share “stapled” to one MPT unit to create a single listed security traded on the ASX. The stapled securities cannot be traded or dealt with separately.
This condensed consolidated interim report does not include all the notes of the type normally included in an annual financial report. Accordingly, this report is to be read in conjunction with the annual report for the year ended 30 June 2015 and any public announcements made by Mirvac during the interim reporting period in accordance with the continuous disclosure requirements of the Corporations Act 2001.
a) Basis of preparationi) Consolidated financial statementsThe Group has prepared combined financial statements that have been presented in accordance with Class Order 13/1050 issued by ASIC. There are no non-controlling interests attributable to the stapled securityholders.
RESULTS FOR THE HALF YEAR1 Segmental informationa) Description of business segmentsManagement has determined the segments based on the reports reviewed by the Executive Leadership Team (“ELT”) that are used to make strategic decisions. The ELT considers the business from both a product, and within Australia, a geographic perspective. Each division prepares an executive finance report on a monthly basis; this is a detailed report that summarises the following:
— historic results of the division, using both statutory profit and operating profit;
— future forecast of the division for the remainder of the year; and
— key risks and opportunities facing the division.
The ELT assesses the performance of the segments based on a number of measures, both financial and non-financial, which include a measure of operating profit; the use of capital; and success in delivering against key performance indicators. The ELT has identified two core divisions, Investment and Development. Applying the requirements of AASB 8 Operating Segments, Mirvac has two reportable segments, and in addition one business unit, Investment Management (including MAM), which does not meet the requirements for aggregation and therefore has been shown separately:
i) InvestmentThe division is made up of MPT and a small number of assets held by the company which holds investments in properties covering the office, retail, industrial and hotel sectors throughout Australia, held for the purpose of producing rental income, predominately through the Trust, its controlled trusts and corporate entities holding investment properties. Income is also derived from investments in JVA including Mirvac 8 Chifley Trust and Tucker Box Hotel Group.
ii) Investment ManagementMIM comprises two business activities for segment reporting purposes, being capital management for listed and unlisted property funds on behalf of retail and institutional investors, and property asset management (MAM) on behalf of MPT, joint venture partners and external property owners.
iii) DevelopmentThe division’s primary operations are property development and construction of residential, office, industrial and retail development projects throughout Australia. In addition, project management fees are received from the management of development and construction projects on behalf of JVA, PDAs and residential development funds.
b) Inter-segment transfersSegment revenues, expenses and results include transfers between segments. Such transfers are on an arm’s length basis and eliminated on consolidation.
c) EliminationThe elimination segment includes adjustments to eliminate trading between segments and to transfer balances to reflect correct disclosure of items on a consolidated basis.
d) Comparative informationWhen necessary, comparative information has been reclassified to achieve consistency in disclosure in current half year amounts and other disclosures.
e) Operating profitOperating profit is a financial measure which is not prescribed by AAS and represents the profit under AAS adjusted for specific non-cash items and significant items which management considers to reflect the core earnings of the Group.
f) Segment assets and liabilitiesThe amounts provided to the ELT with respect to total assets and total liabilities are measured in a manner consistent with that of the consolidated financial statements. These assets and liabilities are allocated based on the operations of the segment and physical location of the asset. The Group’s borrowings and derivative financial instruments are not considered to be segment liabilities but rather are managed by the Mirvac Group Treasury.
g) Geographical and customer analysisMirvac operates predominately in Australia. Materially, all revenue is derived in Australia and all assets are in Australia. No single customer in the current or prior corresponding period provided more than 10 per cent of the Group’s revenue.
Notes to the consolidated financial statementsF
or p
erso
nal u
se o
nly

MIRVAC GROUP INTERIM REPORT FOR THE HALF YEAR ENDED 31 DECEMBER 201514
1 Segmental information / continued Investment Consolidated Investment Management Development Unallocated Elimination SoCI Half year ended 31 December 2015 $m $m $m $m $m $m
Revenue from continuing operationsInvestment properties rental revenue 300.9 5.3 — — — 306.2Investment management fee revenue — 6.8 — — — 6.8Development and construction revenue — — 411.4 — (1.8) 409.6Development management fee revenue — — 3.4 — — 3.4Interest revenue 11.3 0.2 2.8 0.6 — 14.9Other revenue — 2.7 0.7 0.2 — 3.6Inter-segment revenue 4.9 8.3 134.0 26.8 (174.0) —
Total revenue from continuing operations 317.1 23.3 552.3 27.6 (175.8) 744.5
Net gain on fair value of investment properties and IPUC 323.7 — — — (34.4) 289.3Share of net profit of JVA accounted for using the equity method 60.8 0.3 3.9 0.2 — 65.2Gain on fair value of derivative financial instruments — — — 68.4 — 68.4Net gain on sale of assets 0.6 — — — — 0.6
Total other income 385.1 0.3 3.9 68.6 (34.4) 423.5
Total revenue from continuing operations and other income 702.2 23.6 556.2 96.2 (210.2) 1,168.0
Foreign exchange loss 1.0 — — 68.7 — 69.7Investment properties expenses 77.1 1.6 — — (6.4) 72.3Cost of property development and construction — — 510.4 — (130.7) 379.7Employee benefits expenses — 12.8 12.3 33.2 — 58.3Depreciation and amortisation expenses 10.9 0.2 0.9 1.7 2.9 16.6Finance costs 36.2 — 17.8 26.8 (30.2) 50.6Loss on fair value of derivative financial instruments 0.6 — — 8.5 — 9.1Selling and marketing expenses — 0.4 20.5 0.3 — 21.2Other expenses 7.0 5.1 9.9 9.1 (6.8) 24.3
Profit/(loss) from continuing operations before income tax 569.4 3.5 (15.6) (52.1) (39.0) 466.2Income tax benefit 6.5
Profit attributable to the stapled securityholders of Mirvac 472.7
Notes to the consolidated financial statementsF
or p
erso
nal u
se o
nly

MIRVAC GROUP INTERIM REPORT FOR THE HALF YEAR ENDED 31 DECEMBER 2015 15
1 Segmental information / continued Investment Investment Management Development Unallocated Elimination Tax Consolidated Half year ended 31 December 2015 $m $m $m $m $m $m $m
Profit/(loss) attributable to the stapled securityholders of Mirvac 569.4 3.5 (15.6) (52.1) (39.0) 6.5 472.7
Specific non-cash itemsNet gain on fair value of investment properties and IPUC (323.7) — — — 34.4 — (289.3)Net gain on fair value of investment properties included in share of net profit of JVA 1 (42.2) — — — — — (42.2)Net loss on fair value of derivative financial instruments and associated foreign exchange movements 2 1.6 — — 8.8 — — 10.4SBP expense 3 — — — 5.2 — — 5.2Depreciation of OOP 4 — — — — 3.6 — 3.6Straight-lining of lease revenue 5 (5.4) — — — — — (5.4)Amortisation of lease fitout incentives 4 5.2 — — — (0.7) — 4.5Net gain on derivatives and other specific non-cash items included in share of net profit of JVA 1 (2.5) — — — — — (2.5)
Significant itemsNet gain from sale of non-aligned assets 6 (0.6) — — — — — (0.6)Restructuring costs 7 — — — 1.4 — — 1.4
Tax effectTax effect of non-cash and significant item adjustments 8 — — — — — 6.8 6.8
Operating profit/(loss) (profit before specific non-cash and significant items) 201.8 3.5 (15.6) (36.7) (1.7) 13.3 164.6
1) Included within Share of net profit of JVA accounted for using the equity method in the consolidated SoCI.2) Total of Gain on fair value of derivative financial instruments, Foreign exchange loss and Loss on fair value of derivative financial instruments in the
consolidated SoCI.3) Included within Employee benefits expenses in the consolidated SoCI.4) Included within Depreciation and amortisation expenses in the consolidated SoCI.5) Included within Investment properties rental revenue in the consolidated SoCI.6) Included within Net gain on sale of assets in the consolidated SoCI.7) Included within Other expenses in the consolidated SoCI.8) Included in Income tax (benefit)/expense in the consolidated SoCI.
Investment Consolidated Investment Management Development Unallocated Elimination SoCI Half year ended 31 December 2014 $m $m $m $m $m $m
Revenue from continuing operations Investment properties rental revenue 298.4 3.5 — — — 301.9Investment management fee revenue — 6.6 — — — 6.6Development and construction revenue — — 577.5 — — 577.5Development management fee revenue — — 3.4 — — 3.4Interest revenue 10.7 0.4 2.6 0.7 (0.1) 14.3Dividend and distribution revenue 0.2 — — — — 0.2Other revenue 0.8 1.9 3.1 0.1 (0.8) 5.1Inter-segment revenue 3.4 9.9 20.4 25.6 (59.3) —
Total revenue from continuing operations 313.5 22.3 607.0 26.4 (60.2) 909.0
Net gain on fair value of investment properties and IPUC 52.8 — — — (2.0) 50.8Share of net profit of JVA accounted for using the equity method 26.7 0.9 1.3 0.1 — 29.0Gain on fair value of derivative financial instruments 0.4 — — 138.7 — 139.1Net gain on sale of assets 9.5 — — — — 9.5
Total other income 89.4 0.9 1.3 138.8 (2.0) 228.4
Total revenue from continuing operations and other income 402.9 23.2 608.3 165.2 (62.2) 1,137.4
Notes to the consolidated financial statementsF
or p
erso
nal u
se o
nly

MIRVAC GROUP INTERIM REPORT FOR THE HALF YEAR ENDED 31 DECEMBER 201516
1 Segmental information / continued Investment Consolidated Investment Management Development Unallocated Elimination SoCI Half year ended 31 December 2014 $m $m $m $m $m $m
Total revenue from continuing operations and other income 402.9 23.2 608.3 165.2 (62.2) 1,137.4
Net loss on sale of assets 5.1 — — — — 5.1Foreign exchange loss 2.2 — — 123.4 — 125.6Investment properties expenses 72.2 1.1 — — (6.0) 67.3Cost of property development and construction — — 458.9 — (20.3) 438.6Employee benefits expenses — 12.9 10.6 26.8 — 50.3Depreciation and amortisation expenses 10.6 0.3 0.9 1.1 1.9 14.8Impairment of loans, investments and inventories — — — (0.1) — (0.1)Finance costs 33.3 — 42.0 25.6 (25.8) 75.1Loss on fair value of derivative financial instruments 2.3 — — 24.6 — 26.9Selling and marketing expenses — — 22.8 — — 22.8Other expenses 7.0 4.9 12.2 9.1 (7.3) 25.9
Profit/(loss) from continuing operations before income tax 270.2 4.0 60.9 (45.3) (4.7) 285.1Income tax expense (6.1)
Profit attributable to the stapled securityholders of Mirvac 279.0
Investment Investment Management Development Unallocated Elimination Tax Consolidated Half year ended 31 December 2014 $m $m $m $m $m $m $m
Profit/(loss) attributable to the stapled securityholders of Mirvac 270.2 4.0 60.9 (45.3) (4.7) (6.1) 279.0
Specific non-cash itemsNet gain on fair value of investment properties and IPUC (52.8) — — — 2.0 — (50.8)Net gain on fair value of investment properties included in share of net profit of JVA 1 (11.0) — — — — — (11.0)Net loss on fair value of derivative financial instruments and associated foreign exchange movements 2 4.1 — — 9.3 — — 13.4SBP expense 3 — — — 1.8 — — 1.8Depreciation of OOP 4 — — — — 3.0 — 3.0Straight-lining of lease revenue 5 (2.5) — — — — — (2.5)Amortisation of lease fitout incentives 4 5.8 — — — (1.1) — 4.7Net loss on derivatives and other specific non-cash items included in share of net profit of JVA 1 2.6 (0.6) — — — — 2.0
Significant itemsImpairment of loans, investments and inventories — — — (0.1) — — (0.1)Net gain from sale of non-aligned assets 6 (4.4) — — — — — (4.4)
Tax effectTax effect of non-cash and significant item adjustments 7 — — — — — (3.9) (3.9)
Operating profit/(loss) (profit before specific non-cash and significant items) 212.0 3.4 60.9 (34.3) (0.8) (10.0) 231.2
1) Included within Share of net profit of JVA accounted for using the equity method in the consolidated SoCI.2) Total of Gain on fair value of derivative financial instruments, Foreign exchange loss and Loss on fair value of derivative financial instruments in the
consolidated SoCI.3) Included within Employee benefits expenses in the consolidated SoCI.4) Included within Depreciation and amortisation expenses in the consolidated SoCI.5) Included within Investment properties rental revenue in the consolidated SoCI.6) Total of Net gain on sale of assets and Net loss on sale of assets in the consolidated SoCI.7) Included in Income tax expense in the consolidated SoCI.
Notes to the consolidated financial statementsF
or p
erso
nal u
se o
nly

MIRVAC GROUP INTERIM REPORT FOR THE HALF YEAR ENDED 31 DECEMBER 2015 17
1 Segmental information / continued Investment Consolidated Investment Management Development Unallocated Elimination SoFP/SoCI $m $m $m $m $m $m
31 December 2015Total assets 8,351.2 39.1 2,552.3 1,770.2 (1,512.0) 11,200.8Total liabilities 1,547.2 10.6 793.9 3,424.0 (1,380.9) 4,394.8Investments in JVA accounted for using the equity method 557.1 0.6 197.1 3.2 (56.7) 701.3Acquisitions of investments and PPE 268.9 0.2 1.1 5.0 — 275.2
30 June 2015Total assets 7,785.5 41.3 2,411.5 1,477.5 (1,312.3) 10,403.5Total liabilities 1,317.8 10.2 887.5 2,841.8 (1,115.9) 3,941.4Investments in JVA accounted for using the equity method 415.1 0.6 198.3 3.1 (54.9) 562.2Acquisitions of investments and PPE 1,025.5 0.8 4.7 10.7 — 1,041.7
2 Finance costs 31 December 31 December 2015 2014 $m $m
Interest and finance charges paid/payable net of provision release 67.4 65.4Amount capitalised (24.3) (19.3)Interest capitalised in current and prior years expensed this period net of provision release 6.2 27.7Borrowing costs amortised 1.3 1.3
Total finance costs 50.6 75.1
3 EPS 31 December 31 December 2015 2014 Cents Cents
Earnings per stapled securityBasic EPS 12.79 7.56Diluted EPS 1 12.78 7.55
Basic and diluted earnings $m $m
Profit attributable to the stapled securityholders of Mirvac used in calculating EPS 472.7 279.0
Number Number Weighted average number of securities used as denominator m m
Weighted average number of securities used in calculating basic EPS 3,696.2 3,692.0Adjustment for calculation of diluted EPSSecurities issued under EIS 3.3 3.7
Weighted average number of securities used in calculating diluted EPS 3,699.5 3,695.7
1) Diluted securities include securities issued under EIS, but do not include the options and rights issued under the current LTI plans as the exercise of these equity instruments is contingent on conditions during the vesting period.
Notes to the consolidated financial statementsF
or p
erso
nal u
se o
nly

MIRVAC GROUP INTERIM REPORT FOR THE HALF YEAR ENDED 31 DECEMBER 201518
OPERATING ASSETS AND LIABILITIES4 Investment propertiesInvestment properties comprised land and buildings held for long term rental yields, capital appreciation and are not occupied by the Group. Revenue from the rental yields is included in the consolidated SoCI under investment properties rental revenue. Total rental revenue for the half year was $306.2m (December 2014: $301.9m). Investment properties are carried at fair value (book value) in the following table. Refer to note 4(c)(i) for the valuation basis of the fair value measurement.
Book value Capitalisation rate Discount rate Date Last 31 Dec 30 Jun 31 Dec 30 Jun 31 Dec 30 Jun of last external Date of 2015 2015 2015 2015 2015 2015 external valuation acquisition $m $m % % % % valuation $m
1 Darling Island, Pyrmont NSW Apr 2004 203.5 195.8 6.50 6.75 7.50 8.25 Dec 2014 188.91 Woolworths Way, Bella Vista NSW 1,2 Aug 2010 — 250.2 — 7.75 — 8.50 Dec 2014 250.01-47 Percival Road, Smithfield NSW Nov 2002 40.5 35.9 7.00 7.50 8.25 8.75 Dec 2015 40.510-20 Bond Street, Sydney NSW (50% interest) 1 Dec 2009 224.8 200.0 5.88 6.38 7.50 8.00 Jun 2015 200.0101-103 Miller Street & Greenwood Plaza, North Sydney NSW (50% interest) Jun 1994 307.6 302.7 6.25 6.25-6.37 7.75-8.25 8.25-8.75 Dec 2014 300.016 Furzer Street, Phillip ACT Jul 2007 65.3 68.0 7.75 7.75 8.50 8.75 Dec 2015 65.3189 Grey Street, Southbank QLD Apr 2004 86.0 83.1 7.25 7.63 8.00 8.50 Dec 2015 86.01900-2060 Pratt Boulevard, Chicago Illinois USA Dec 2007 47.9 45.1 7.00 7.25 8.25 8.50 Dec 2015 47.923 Furzer Street, Phillip ACT Feb 2010 253.5 252.1 7.15 7.25 9.00 8.50 Dec 2015 253.5271 Lane Cove Road, North Ryde NSW Apr 2000 32.8 32.3 8.25 8.25 8.25 9.00 Jun 2014 31.4275 Kent Street, Sydney NSW (50% interest) 1 Aug 2010 470.0 435.6 5.38 6.00 7.50 8.50 Dec 2015 470.03 Rider Boulevard, Rhodes NSW 1 Dec 2009 90.4 89.0 7.75 8.00 8.00 8.75 Dec 2014 88.434-39 Anzac Avenue, Smeaton Grange NSW Jan 2015 24.9 23.3 7.75 8.00 8.50 9.00 — —340 Adelaide Street, Brisbane QLD 1 Dec 2009 52.7 55.5 8.38 8.75 8.38 8.75 Dec 2014 55.0367 Collins Street, Melbourne VIC Nov 2013 252.8 238.5 6.37 6.50 7.75 8.25 Jun 2015 238.537 Pitt Street, Sydney NSW May 2013 68.0 68.0 8.00 8.00 8.75 8.75 Jun 2014 68.0380 St Kilda Road, Oct 1995 (50%) Melbourne VIC & Apr 2001 (50%) 153.5 140.2 7.00 7.25 8.00 8.25 Jun 2015 140.239 Britton Street, Smithfield NSW Jan 2015 22.0 21.1 7.00 7.25 8.25 8.75 — —39 Herbert Street, St Leonards NSW Jan 2015 157.5 153.5 7.00 6.75 8.64 8.75 — —40 Miller Street, North Sydney NSW Mar 1998 123.2 114.1 6.50 6.75 7.75 8.50 Jun 2014 106.447-67 Westgate Drive, Altona North VIC 1 Dec 2009 18.3 18.7 8.25 9.50 8.25 9.75 Dec 2015 18.3472 Pacific Highway, St Leonards NSW Jun 2015 63.1 63.1 — — — — — —477 Collins Street, Melbourne VIC Nov 2013 77.5 72.0 7.00 7.00 8.00 8.25 Jun 2015 72.0486 Pacific Highway, St Leonards NSW Jun 2015 58.3 58.3 — — — — — —5 Rider Boulevard, Rhodes NSW Jan 2007 137.6 133.6 7.50 7.75 8.00 8.75 Dec 2014 133.051 Pitt Street, Sydney NSW May 2013 26.0 26.0 8.00 8.00 8.75 8.75 Jun 2014 26.055 Coonara Avenue, West Pennant Hills NSW 1 Aug 2010 71.8 70.0 9.50 9.50 9.75 9.75 Jun 2014 70.06-8 Underwood Street, Sydney NSW May 2013 9.5 9.5 9.00 9.00 9.00 9.00 Jun 2014 9.560 Wallgrove Road, Eastern Creek NSW Jan 2014 55.7 55.7 — 6.00-9.00 — 9.00-10.50 Jun 2014 55.165 Pirrama Road, Pyrmont NSW Jun 2001 131.0 126.6 6.50 7.00 7.50 8.25 Dec 2015 131.0699 Bourke Street, Melbourne Nov 2007 (50%) VIC (50% interest) & May 2011 (50%) 80.0 77.0 5.88 6.13 7.50 8.25 Jun 2015 77.077 St Georges Terrace, Perth WA May 2013 210.0 227.7 8.00 8.00 8.50 9.25 Jun 2014 237.08 Brabham Drive, Huntingwood NSW Jan 2015 20.7 19.7 6.75 7.00 8.25 8.75 — —90 Collins Street, Melbourne VIC May 2013 200.0 185.0 6.00 6.50 7.50 8.25 Dec 2015 200.0Birkenhead Point Outlet Centre, Drummoyne NSW Dec 2014 335.2 320.7 6.00-8.00 6.25-8.00 8.25-9.50 8.50-9.50 Jun 2015 320.7Broadway Shopping Centre, Broadway NSW (50% interest) 3 Jan 2007 324.6 292.1 5.50 6.00 8.25 8.75 Jun 2014 280.0Cherrybrook Village Shopping Centre, Cherrybrook NSW 1 Dec 2009 94.0 91.0 7.00 7.00 8.50 8.75 Jun 2015 91.0Como Centre, Cnr Toorak Road & Chapel Street, South Yarra VIC Aug 1998 187.7 179.5 7.49-8.00 7.50-8.00 8.00-12.00 8.25-12.00 Jun 2015 179.5Cooleman Court, Weston ACT 1 Dec 2009 54.0 52.4 7.25 7.50 8.50 9.00 Dec 2015 54.0Harbourside Shopping Centre, Sydney NSW Jan 2014 262.0 262.0 6.50 6.50 8.50 9.00 Dec 2014 255.0Hoxton Distribution Park, Hoxton Park NSW (50% interest) Jul 2010 139.9 131.7 5.75 6.00 7.75 8.00 Jun 2015 131.7
Notes to the consolidated financial statementsF
or p
erso
nal u
se o
nly

MIRVAC GROUP INTERIM REPORT FOR THE HALF YEAR ENDED 31 DECEMBER 2015 19
4 Investment properties / continued Book value Capitalisation rate Discount rate Date Last 31 Dec 30 Jun 31 Dec 30 Jun 31 Dec 30 Jun of last external Date of 2015 2015 2015 2015 2015 2015 external valuation acquisition $m $m % % % % valuation $m
Kawana Shoppingworld, Dec 1993 (50%) Buddina QLD & Jun 1998 (50%) 330.0 322.0 6.00 6.25 8.25 8.75 Dec 2015 330.0Moonee Ponds Central, May 2003 Moonee Ponds VIC & Feb 2008 69.5 68.6 7.75 7.75 8.75 9.00 Jun 2014 67.0Nexus Industry Park (Building 1) Lyn Parade, Prestons NSW Aug 2004 22.2 21.6 7.00 7.25 8.25 8.75 Jun 2015 21.6Nexus Industry Park (Building 2), Lyn Parade, Prestons NSW Aug 2004 15.5 14.6 7.00 7.25 8.25 8.75 Dec 2014 13.5Nexus Industry Park (Building 3), Lyn Parade, Prestons NSW Aug 2004 29.1 27.5 7.25 7.50 8.25 8.75 Jun 2015 27.5Nexus Industry Park (Building 4), Lyn Parade, Prestons NSW Aug 2004 42.9 39.7 6.75 7.25 8.25 8.75 Dec 2015 42.9Nexus Industry Park (Building 5), Lyn Parade, Prestons NSW Aug 2004 21.5 20.6 7.00 7.25 8.25 8.75 Dec 2014 19.8Orion Springfield Central, Springfield QLD Aug 2002 282.0 235.0 6.50 6.50 8.75 9.00 Dec 2014 143.0Quay West Car Park, 109-111 Harrington Street, Sydney NSW Nov 1989 32.8 30.0 7.00 7.25 9.00 9.25 Jun 2015 30.0Rhodes Waterside, Rhodes NSW (50% interest) Jan 2007 160.0 149.0 6.00 6.25 8.50 8.50 Jun 2015 149.0Riverside Quay, Southbank VIC Apr 2002 & Jul 2003 206.5 193.1 6.75 7.50 7.75 8.75 Dec 2015 206.5St Marys Village Centre, St Marys NSW Jan 2003 49.0 48.2 7.25 7.25 8.75 9.00 Dec 2014 47.0Stanhope Village, Stanhope Gardens NSW Nov 2003 126.0 116.0 6.25 7.00 8.50 9.00 Dec 2015 126.0
Total investment properties 6,620.8 6,562.2
IPUC2 Riverside Quay, Southbank VIC (50% interest) Apr 2002 38.4 23.7 6.00 6.13 8.50 8.50 — —200 George Street, Sydney NSW (50% interest) Dec 2012 220.5 133.5 5.50 6.00 7.75 8.00 Dec 2014 92.9Orion Springfield land, Springfield QLD 4,5 Aug 2002 14.1 21.6 — — — — Dec 2014 73.4Tramsheds, Harold Park NSW Dec 2010 21.5 10.1 6.75 6.75 8.75 8.75 — —
Total IPUC 294.5 188.9
Total investment properties and IPUC 6,915.3 6,751.1
1) Date of acquisition represents business combination acquisition date.2) Property transferred to held for sale during the half year.3) Included 52-60 Francis Street, Glebe NSW (50% interest).4) Portion of site disposed during the half year.5) Last external valuation includes stage two of development now included in main centre.
a) Reconciliation of carrying amounts of investment properties 31 December 30 June 2015 2015 At fair value Note $m $m
Balance 1 July 6,751.1 6,016.4Additions 172.8 328.2Acquisitions — 685.5Disposals (7.5) (401.3)Net gain on fair value of investment properties and IPUC 14(b) 289.3 140.8Net gain from foreign currency translation 2.7 8.1Assets classified as held for sale 5 (276.4) —Transfers from inventories — 4.1Amortisation of fitout incentives, leasing costs and rent incentive (16.7) (30.7)
Balance 31 December/30 June 6,915.3 6,751.1
Notes to the consolidated financial statementsF
or p
erso
nal u
se o
nly

MIRVAC GROUP INTERIM REPORT FOR THE HALF YEAR ENDED 31 DECEMBER 201520
4 Investment properties / continuedb) Amounts recognised in the consolidated SoCI for investment properties 31 December 31 December 2015 2014 $m $m
Investment properties rental revenue 306.2 301.9Investment property expenses (72.3) (67.3)
233.9 234.6
c) Fair value measurement and valuation basisi) Investment propertiesInvestment properties are carried at fair value. Valuation methods used to determine the fair value include market sales comparison, discounted cash flow (“DCF”) and capitalisation rate (“CR”). The fair value for a property may be determined by using a combination of these and other valuation methods.
Market sales comparison: The sales comparison approach utilises recent sales of comparable properties, adjusted for any differences including the nature, location and lease profile, to indicate the fair value of a property. Where there is a lack of recent sales activity, adjustments are made from previous comparable sales to reflect changes in economic conditions.
DCF: DCF projections derived from contracted rents, market rents, operating costs, lease incentives, lease fees, capital expenditure and future income on vacant space are discounted at a rate to arrive at a value. The discount rate is a market assessment of the risk associated with the cash flows, and the nature, location and tenancy profile of the property relative to returns from alternative investments, CPI rates and liquidity risk. It is assumed that the property is sold at the end of the investment period at a terminal value. The terminal value is determined by using an appropriate terminal CR. Mirvac’s terminal CR is in the range of an additional nil to 100 basis points above the respective property’s CR.
CR: An assessment is made of fully leased net income based on contracted rents, market rents, operating costs and future income on vacant space. The adopted fully leased net income is capitalised in perpetuity from the valuation date at an appropriate CR. The CR reflects the nature, location and tenancy profile of the property together with current market investment criteria, as evidenced by current sales evidence. Various adjustments, including lease incentives, capital expenditure, and reversions to market rent, are made to arrive at the property value.
ii) IPUCThere are generally no active markets for IPUC; therefore, a lack of comparable transactions for IPUC usually requires the use of estimation models. The two main estimation models used to value IPUC are residual and DCF valuations. The residual method of determining the value of a property uses the estimated total cost of the development, including construction and associated expenditures, finance costs, and an allowance for developer’s risk and profit is deducted from the end value of the completed project. The resultant figure is then adjusted back to the date of valuation to give the residual value. For details on fair value hierarchy, refer to note 9.
DCF and CR both use unobservable inputs in determining fair value; ranges of the inputs are included below:
Inputs used to measure fair value
10 year market rent compound Net market annual growth Terminal Discount Fair value Fair value income 1 rate 1 CR yield rateSector hierarchy $m $ % % % %
At 31 December 2015Office 2 Level three 3,890.0 308-1,020 0.00-3.88 5.38-9.50 6.00-10.00 7.50-9.75Industrial Level three 691.4 16-354 2.63-3.13 5.75-8.25 6.00-8.75 7.75-8.64Retail 2 Level three 2,241.4 228-1,284 2.55-4.35 5.50-8.00 5.75-8.00 8.25-9.50Other 3 Level three 92.5 — 1.88-2.50 7.00-8.00 7.50-9.00 9.00-12.00
At 30 June 2015Office 2 Level three 3,898.8 205-1,003 0.00-4.10 6.00-9.50 6.25-10.00 8.00-9.75Industrial Level three 661.0 15-345 2.33-3.30 6.00-9.50 6.25-9.75 8.00-9.75Retail 2 Level three 2,103.6 221-1,071 3.00-4.43 6.00-8.00 6.25-8.00 8.50-9.50Other 3 Level three 87.7 — 1.88-3.35 7.25-8.00 7.50-9.00 9.25-12.00
1) Per square metre.2) Includes IPUC.3) Net market income for other sector (car parks and hotel) not reported on a square metre basis.
d) Sensitivity on changes in fair value of investment propertyMovement in any of the unobservable inputs is likely to have an impact on the fair value of investment property. The higher the net market income and 10 year market rent compound annual growth rate, the higher the fair value. The higher the CR, terminal yield and discount rate, the lower the fair value.
Notes to the consolidated financial statementsF
or p
erso
nal u
se o
nly

MIRVAC GROUP INTERIM REPORT FOR THE HALF YEAR ENDED 31 DECEMBER 2015 21
4 Investment properties / continuede) Property portfolioMirvac’s property portfolio is made up as follows:
31 December 30 June 2015 2015 Note $m $m
Investment properties per consolidated SoFP 4(a) 6,915.3 6,751.1Investment properties classified as held for sale 5 276.4 —OOP classified as PPE 279.4 244.3
7,471.1 6,995.4
5 Assets classified as held for sale 31 December 30 June 2015 2015 Note $m $m
Non-current assets classified as held for sale1 Woolworths Way, Bella Vista NSW 1 4(a) 276.4 —
1) Settlement is expected in February 2016.
6 Inventories 31 December 30 June 2015 2015 $m $m
Current 1
Development projectsAcquisition costs 293.0 218.7Development costs 567.7 542.9Borrowing costs capitalised during development 72.2 46.2Provision for loss (48.3) (33.6)
Total current inventories 884.6 774.2
Non-current 1
Development projectsAcquisitions costs 586.6 661.0Development costs 411.2 293.0Borrowing costs capitalised during development 96.3 113.5Provision for loss (103.1) (128.3)
Total non-current inventories 991.0 939.2
Aggregate carrying value of inventoriesCurrent 884.6 774.2Non-current 991.0 939.2
Total inventories 1,875.6 1,713.4
1) Lower of cost and net realisable value (“NRV”).
During the half year, there was no amount (December 2014: $nil) expensed in relation to inventories that were carried in excess of the NRV.
7 Other non-financial assets and liabilitiesIntangible assets Management rights Goodwill Total $m $m $m
Balance 1 July 2015 2.6 36.4 39.0
Balance 31 December 2015 1 2.6 36.4 39.0
Balance 1 July 2014 2.6 36.4 39.0
Balance 30 June 2015 2.6 36.4 39.0
1) On 23 December 2015, the Group reached an agreement with a subsidiary of CIC to become the asset manager of Investa Property Trust, with Morgan Stanley facilitating Mirvac’s entry into management rights contracts for a total consideration of $37.4m. Payment of the consideration is scheduled on completion in February 2016. The carrying amount of intangible assets as at 31 December 2015 does not include any amount relating to this transaction.
Notes to the consolidated financial statementsF
or p
erso
nal u
se o
nly

MIRVAC GROUP INTERIM REPORT FOR THE HALF YEAR ENDED 31 DECEMBER 201522
7 Other non-financial assets and liabilities / continueda) Allocation of intangible assets by operating segmentA segment level summary of the intangible asset allocations is presented below:
Investment Investment Management Total $m $m $m
Management rights — indefinite life 1 — 2.6 2.6Goodwill 36.4 — 36.4
Balance 31 December 2015 36.4 2.6 39.0
Management rights — indefinite life 1 — 2.6 2.6Goodwill 36.4 — 36.4
Balance 30 June 2015 36.4 2.6 39.0
1) Management rights are primarily held in relation to funds established or rights established by entities acquired by Mirvac. These funds are considered to be open-ended and therefore have no expiry. The Group also holds strategic stakes in these funds in order to protect its interest.
b) Key assumptions used for value in use calculations for goodwill and management rightsThe recoverable amount of cash generating units (“CGUs”) is determined using the higher of fair value less costs to sell, and their value in use. The value in use calculation is based on financial budgets and forecasts approved by management covering a five year period. For the Investment Management CGU, cash flows beyond the five year period are extrapolated using the estimated growth rates stated below. For the Investment CGU, no forecast growth rate is assumed as the value in use calculations are based on forecast cash flows from existing projects and investment properties. The growth rate has been adjusted to reflect current market conditions and does not exceed the long term average growth rate for the business in which the CGU operates. The discount rates used are pre-tax and reflect specific risks relating to the relevant segments and the countries in which they operate. A terminal growth rate of three per cent has also been applied.
Growth rate 1 Discount rate Growth rate 1 Discount rate 31 December 31 December 30 June 30 June 2015 2015 2015 2015 CGU % pa % pa % pa % pa
Investment — 2 8.6 — 2 8.6Investment Management 1.0 13.0 1.0 13.0
1) Weighted average growth rate used to extrapolate cash flows beyond the budget period.2) The value in use calculation is based on financial budgets and forecasts approved by management covering a five year period. No forecast growth rate is
assumed as the value in use calculations are based on forecast cash flows from existing projects and investment properties.
The recoverable amount of goodwill exceeds the carrying value at 31 December 2015. Based on the information available on the key assumptions and market conditions at 31 December 2015, management has considered and assessed reasonable possible changes on the key assumptions and has not identified any instances that could cause the carrying value to exceed the recoverable amount of goodwill.
As the CGU primarily consist of investment property, assumptions considered are the unobservable inputs used in determining fair value of investment property. For further information on the impact of a significant change in an unobservable input, refer to note 4(d).
c) Impairment of goodwillThere was no impairment of goodwill during the half year (December 2014: $nil).
d) Impairment of management rightsThere was no impairment of management rights during the half year (December 2014: $nil). Management rights are primarily held in relation to funds established or rights established by entities acquired by Mirvac. These funds are considered to be open-ended and therefore have no expiry.
CAPITAL STRUCTURE8 Borrowings 31 December 30 June 2015 2015 Note $m $m
CurrentUnsecuredDomestic medium term notes (”MTN”) 8(a)(ii) 225.0 —Foreign MTN 8(a)(iii) 387.7 —SecuredLease liabilities 8(a)(iv) 0.2 0.2
612.9 0.2
Notes to the consolidated financial statementsF
or p
erso
nal u
se o
nly

MIRVAC GROUP INTERIM REPORT FOR THE HALF YEAR ENDED 31 DECEMBER 2015 23
8 Borrowings / continued 31 December 30 June 2015 2015 Note $m $m
Non-currentUnsecuredBank loans 8(a)(i) 1,267.4 920.2Domestic MTN 8(a)(ii) 400.0 625.0Foreign MTN 8(a)(iii) 963.0 1,088.4SecuredLease liabilities 8(a)(iv) — 0.1
2,630.4 2,633.7
a) Borrowingsi) Bank loansMirvac has unsecured bank facilities totalling $1,700.0m (June 2015: $1,400.0m). The facilities comprise four tranches: a $500.0m tranche maturing in September 2017, a $400.0m tranche maturing in September 2018, a $400.0m tranche maturing in September 2019 and a $400.0m tranche maturing in September 2020. Subject to compliance with the terms, each of these bank loan facilities may be drawn at any time.
ii) Domestic MTNMirvac has a total of $625.0m (June 2015: $625.0m) of domestic MTN outstanding: $225.0m maturing in September 2016, $200.0m maturing in December 2017 and $200.0m maturing in September 2020. Interest is payable either quarterly or semi-annually in arrears in accordance with the terms of the notes.
iii) Foreign MTNMirvac has a total of $1,214.7m (US$885.0m and $135.0m) (June 2015: $1,019.8m) US Private Placement notes outstanding. The notes mature as follows:
— US$275.0m and $10.0m maturing in November 2016;
— US$100.0m maturing in November 2018;
— US$160.0m and $50.0m maturing in December 2022;
— US$105.0m and $25.0m maturing in December 2024;
— US$35.0m maturing in September 2025;
— US$95.0m and $50.0m maturing in December 2025; and
— US$115.0m maturing in September 2027.
During the period, Mirvac issued a total of $194.9m in notes. Interest is payable semi-annually in arrears for all notes. Some of the notes were issued with fixed and floating rate coupons payable in US dollars and swapped back to Australian dollar floating rate coupons through cross currency swaps and interest rate swaps.
iv) Lease liabilitiesLease liabilities are effectively secured as the rights to the leased asset revert to the lessor in the event of default.
b) Financing arrangements 31 December 30 June 2015 2015 $m $m
Total facilitiesBank loans 1,700.0 1,400.0Domestic MTN 625.0 625.0Foreign MTN 1,350.7 1,088.4
3,675.7 3,113.4
Used at end of the reporting periodBank loans 1,267.4 920.2Domestic MTN 625.0 625.0Foreign MTN 1,350.7 1,088.4
3,243.1 2,633.6
Unused at end of the reporting periodBank loans 432.6 479.8Domestic MTN — —Foreign MTN — —
432.6 479.8
Notes to the consolidated financial statementsF
or p
erso
nal u
se o
nly

MIRVAC GROUP INTERIM REPORT FOR THE HALF YEAR ENDED 31 DECEMBER 201524
8 Borrowings / continuedc) Fair value Carrying amount Fair value
31 December 30 June 31 December 30 June 2015 2015 2015 2015 $m $m $m $m
Included in consolidated SoFPNon-traded financial liabilitiesBank loans 1,267.4 920.2 1,267.4 920.2Domestic MTN 625.0 625.0 654.0 664.2Foreign MTN 1,350.7 1,088.4 1,422.6 1,148.5Lease liabilities 0.2 0.3 0.2 0.3
3,243.3 2,633.9 3,344.2 2,733.2
None of the classes above is readily traded on an organised markets in standardised form.
The bank loans and lease liabilities are floating rate borrowings; therefore, their fair value represents their respective carrying values. The fair value of domestic and foreign MTN has been calculated by discounting the expected future cash flows by the current market rates applicable to the relevant term of the MTN or bond prices for traded instruments. All borrowings are disclosed as level three in the fair value measurement hierarchy. For details on fair value hierarchy, refer to note 9.
i) Included in consolidated SoFPThe fair value for borrowings less than 12 months to maturity is deemed to equal the carrying value. All other borrowings are discounted if the effect of discounting is material. The fair value of borrowings is based upon market prices where a market exists or by discounting the expected future cash flows by the current interest rates for liabilities with similar risk profiles.
9 Fair value measurement of financial instrumentsa) Fair value hierarchyThe fair value of financial assets and financial liabilities must be estimated for recognition and measurement or for disclosure purposes. AASB 13 Fair Value Measurement requires disclosure of fair value measurements by level of the following fair value measurement hierarchy:
— quoted prices (unadjusted) in active markets for identical assets or liabilities (level one);
— inputs other than quoted prices included within level one that are observable for the asset or liability, either directly (as prices) or indirectly (derived from prices) (level two); and
— inputs for the asset or liability that are not based on observable market data (unobservable inputs) (level three).
The following table presents the Group’s financial assets and financial liabilities measured and recognised at fair value at 31 December 2015 and 30 June 2015 on a recurring basis:
Level Level Level one two three Total $m $m $m $m
At 31 December 2015AssetsOther financial assets at fair value through profit or loss— unlisted securities — — 2.7 2.7Other financial assets 1 — — 175.9 175.9Derivatives used for hedging — 228.5 — 228.5
— 228.5 178.6 407.1
LiabilitiesDerivatives used for hedging — 81.1 — 81.1
At 30 June 2015AssetsOther financial assets at fair value through profit or loss— unlisted securities — — 11.3 11.3Other financial assets 1 — — 264.6 264.6Derivatives used for hedging — 175.9 — 175.9
— 175.9 275.9 451.8
LiabilitiesDerivatives used for hedging — 88.4 — 88.4
1) Relates to vendor financing arrangement with Blackstone $175.9m (June 2015: $168.9m) for the partial non-receipt of funds from sale relating to sale of non-aligned assets. June 2015 included the convertible notes associated with funding Mirvac (Old Treasury) Trust joint venture of $95.7m. The convertible notes were issued to fund the development costs of IPUC held by Mirvac (Old Treasury) Trust and were converted to equity in November 2015.
Notes to the consolidated financial statementsF
or p
erso
nal u
se o
nly

MIRVAC GROUP INTERIM REPORT FOR THE HALF YEAR ENDED 31 DECEMBER 2015 25
9 Fair value measurement of financial instruments / continuedThere were no transfers between levels one, two and three for recurring fair value measurements during the half year. The Group’s policy is to recognise transfers into and transfers out of fair value hierarchy levels as at the end of the reporting period. The Group did not measure any financial assets or financial liabilities at fair value on a non-recurring basis as at 31 December 2015.
b) Valuation techniques used to derive level one, level two and level three fair valuesLevel one: The fair value of financial instruments traded in active markets (such as publicly traded derivatives, and trading and available-for-sale securities) is based on quoted market prices at the end of the reporting period. The quoted market price used for financial assets held by the Group is the current bid price. Mirvac holds no level one financial instruments.
Level two: The fair value of financial instruments that are not traded in an active market (e.g. over-the-counter derivatives) is determined using valuation techniques. Mirvac uses a variety of methods and makes assumptions that are based on market conditions existing at the end of each reporting period. Quoted market prices or dealer quotes for similar instruments are used to estimate fair value for long term debt for disclosure purposes. Other techniques, such as estimated DCF, are used to determine fair value for the remaining financial instruments. The fair value of interest rate swaps is calculated as the present value of the estimated future cash flows. The fair value of forward exchange contracts is determined using forward exchange market rates at the end of the reporting period. These instruments are included in level two and comprise debt investments and derivative financial instruments, where the fair values have been determined based on present values and discount rates used were adjusted for counterparty or own credit or debit value adjustments.
Credit value adjustments: these are applied to mark-to-market assets based on the counterparty’s credit risk using the observable credit default swaps curve as a benchmark for credit risk.
Debit value adjustments: these are applied to mark-to-market liabilities based on Mirvac’s credit risk using Mirvac’s credit default swaps curve as a benchmark for credit risk.
Level three: If one or more of the valuation techniques for financial instruments is based on significant unobservable inputs, such instruments are included in level three. This is the case for unlisted securities and other financial assets.
c) Fair value measurements using significant unobservable inputs (level three)The following table presents the changes in level three instruments for the half year ended 31 December 2015 held by the Group:
Other Unlisted financial securities assets Total $m $m $m
Balance 1 July 2015 11.3 264.6 275.9Acquisitions — 7.0 7.0Equity conversion — (95.7) (95.7)Loss recognised in other income 1 (0.6) — (0.6)Capital distribution receivable (8.0) — (8.0)
Balance 31 December 2015 2.7 175.9 178.6
1) Unrealised loss for the half year included in gain on fair value of derivative financial instruments that relates to assets held at the end of the half year (0.6) — (0.6)
There were no transfers between the levels of the fair value hierarchy in the six months to 31 December 2015. There were also no changes made to any of the valuation techniques applied as of 30 June 2015.
The main level three inputs used by the Group in measuring the fair value of financial instruments are derived and evaluated as follows:
— unlisted securities – fair values of the security unit prices: these are determined based on the valuation of the underlying assets held by the fund. These valuations are based on discounted net cash inflows from expected future income and/or comparable sales of similar assets; and
— other financial assets – expected cash inflows: these are determined based on the development management agreement with fixed repayment terms based on fixed interest rate and agreed project costs.
Sensitivity on changes in fair value of level three financial instrumentsFor level three unlisted securities, the impact of an increase/decrease in unlisted security unit price on the Group’s profit for the half year and on equity if the unit price had been five per cent higher or lower would have been $0.1m (June 2015: $0.6m) higher or lower.
d) Fair value of other financial instrumentsThe carrying value of the other short term financial assets and financial liabilities, being receivables and payables, is considered to approximate their fair value.
Notes to the consolidated financial statementsF
or p
erso
nal u
se o
nly
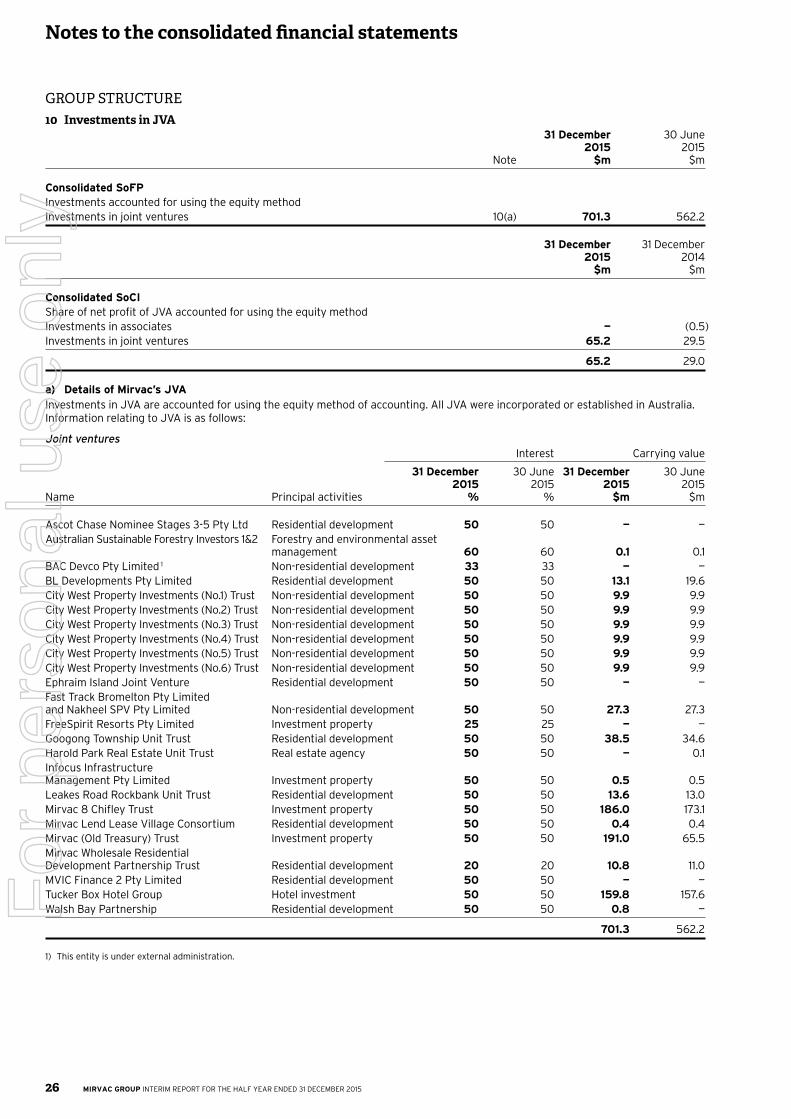
MIRVAC GROUP INTERIM REPORT FOR THE HALF YEAR ENDED 31 DECEMBER 201526
GROUP STRUCTURE10 Investments in JVA 31 December 30 June 2015 2015 Note $m $m
Consolidated SoFPInvestments accounted for using the equity methodInvestments in joint ventures 10(a) 701.3 562.2
31 December 31 December 2015 2014 $m $m
Consolidated SoCIShare of net profit of JVA accounted for using the equity methodInvestments in associates — (0.5)Investments in joint ventures 65.2 29.5
65.2 29.0
a) Details of Mirvac’s JVAInvestments in JVA are accounted for using the equity method of accounting. All JVA were incorporated or established in Australia. Information relating to JVA is as follows:
Joint ventures Interest Carrying value
31 December 30 June 31 December 30 June 2015 2015 2015 2015 Name Principal activities % % $m $m
Ascot Chase Nominee Stages 3-5 Pty Ltd Residential development 50 50 — —Australian Sustainable Forestry Investors 1&2 Forestry and environmental asset management 60 60 0.1 0.1BAC Devco Pty Limited 1 Non-residential development 33 33 — —BL Developments Pty Limited Residential development 50 50 13.1 19.6City West Property Investments (No.1) Trust Non-residential development 50 50 9.9 9.9City West Property Investments (No.2) Trust Non-residential development 50 50 9.9 9.9City West Property Investments (No.3) Trust Non-residential development 50 50 9.9 9.9City West Property Investments (No.4) Trust Non-residential development 50 50 9.9 9.9City West Property Investments (No.5) Trust Non-residential development 50 50 9.9 9.9City West Property Investments (No.6) Trust Non-residential development 50 50 9.9 9.9Ephraim Island Joint Venture Residential development 50 50 — —Fast Track Bromelton Pty Limited and Nakheel SPV Pty Limited Non-residential development 50 50 27.3 27.3FreeSpirit Resorts Pty Limited Investment property 25 25 — —Googong Township Unit Trust Residential development 50 50 38.5 34.6Harold Park Real Estate Unit Trust Real estate agency 50 50 — 0.1Infocus Infrastructure Management Pty Limited Investment property 50 50 0.5 0.5Leakes Road Rockbank Unit Trust Residential development 50 50 13.6 13.0Mirvac 8 Chifley Trust Investment property 50 50 186.0 173.1Mirvac Lend Lease Village Consortium Residential development 50 50 0.4 0.4Mirvac (Old Treasury) Trust Investment property 50 50 191.0 65.5Mirvac Wholesale Residential Development Partnership Trust Residential development 20 20 10.8 11.0MVIC Finance 2 Pty Limited Residential development 50 50 — —Tucker Box Hotel Group Hotel investment 50 50 159.8 157.6Walsh Bay Partnership Residential development 50 50 0.8 —
701.3 562.2
1) This entity is under external administration.
Notes to the consolidated financial statementsF
or p
erso
nal u
se o
nly

MIRVAC GROUP INTERIM REPORT FOR THE HALF YEAR ENDED 31 DECEMBER 2015 27
EQUITY11 Contributed equitya) Paid up equity 31 December 30 June 2015 2015 31 December 30 June Securities Securities 2015 2015 m m $m $m
Mirvac Limited — ordinary shares issued 3,698.2 3,694.3 2,072.7 2,071.9MPT — ordinary units issued 3,698.2 3,694.3 4,737.1 4,732.4
Total contributed equity 6,809.8 6,804.3
b) Movements in paid up equityMovements in paid up equity of Mirvac for the half year ended 31 December 2015 were as follows: Securities m $m
Balance 1 July 2015 3,694.3 6,804.3LTP, LTIP and EIS securities converted, sold, vested or forfeited 3.9 5.5
Balance 31 December 2015 3,698.2 6,809.8
c) Reconciliation of securities issued on the ASXUnder AAS, securities issued under the Mirvac employee LTI plans are required to be accounted for as an option and are excluded from total issued equity, until such time as the relevant employee loans are fully repaid or the employee leaves the Group. Total ordinary securities issued as detailed above are reconciled to securities issued on the ASX as follows:
31 December 30 June 2015 2015 Securities Securities m m
Total ordinary securities disclosed 3,698.2 3,694.3Securities issued under LTI plans and EIS 3.0 3.3
Total securities issued on the ASX 3,701.2 3,697.6
12 Dividends/distributions 31 December 31 December 2015 2014Ordinary stapled securities $m $m
Half yearly ordinary distributions payable/paid as follows:4.70 CPSS payable on 29 February 2016 (unfranked distribution) 174.0 —4.50 CPSS paid on 26 February 2015 (unfranked distribution) — 166.4
Total dividend/distribution 4.70 (December 2014: 4.50) CPSS 174.0 166.4
Distributions paid and payable in cash or satisfied by the issue of stapled securities under the Group’s distribution reinvestment plan are as follows: 31 December 31 December 2015 2014 $m $m
Payable in cash 174.0 166.4
Notes to the consolidated financial statementsF
or p
erso
nal u
se o
nly

MIRVAC GROUP INTERIM REPORT FOR THE HALF YEAR ENDED 31 DECEMBER 201528
OTHER INFORMATION13 Contingent liabilitiesa) Contingent liabilitiesThe Group had contingent liabilities at 31 December 2015 in respect of the following:
31 December 30 June 2015 2015 $m $m
Bank guarantees and performance bonds issued by external parties in respect of certain performance obligations granted in the normal course of business. 165.9 127.4
Claims for damages in respect of injury sustained due to health and safety issues have been made during the half year. The potential effect of these claims indicated by legal advice is that if the claims were to be successful against the Group, they would result in a liability. 0.8 1.2
As part of the ordinary course of business of the Group, disputes can arise with suppliers, customers and other third parties. Where there is a present obligation, a liability is recognised. Where there is a possible obligation, which will only be determined by a future event and it is not considered probable that a liability will arise, they are disclosed as a contingent liability. Where the possible obligation is remote, no disclosure is given. The Group does not provide details of these as to do so may prejudice the Group’s position.
b) JVAThere are no contingent liabilities relating to JVA.
14 Notes to the consolidated statement of cash flows 31 December 31 December 2015 2014 Note $m $m
a) Reconciliation of cashCash at the end of the half year as shown in the consolidated statement of cash flows is the same as the consolidated SoFP:— Cash at bank 42.3 41.4— Deposits at call — 0.2
Cash and cash equivalents 42.3 41.6
b) Reconciliation of profit attributable to the stapled securityholders of Mirvac to net cash (outflows)/inflows from operating activities
Profit attributable to the stapled securityholders of Mirvac 472.7 279.0Share of net profit of JVA not received as dividends/distributions (65.2) (29.0)Net gain on sale of assets (0.6) (4.4)Net gain on fair value of investment properties and IPUC 4(a) (289.3) (50.8)Depreciation and amortisation expenses 16.6 14.8Impairment of loans, investments and inventories — (0.1)SBP expense 5.2 1.8Net gain on fair value of derivative financial instruments (59.3) (112.2)Net loss on foreign exchange 69.7 125.6Dividends/distributions received from JVA 13.0 14.7Change in operating assets and liabilities, net of effects from purchase of controlled entities: — (Decrease)/increase in tax effected balances (6.8) 7.1— (Increase)/decrease in receivables (32.8) 20.4— Increase in inventories (388.5) (73.9)— Increase in other assets/liabilities (20.3) (9.6)— Increase in payables 63.2 91.6— (Decrease)/increase in provisions for employee benefits (3.5) 0.5
Net cash (outflows)/inflows from operating activities (225.9) 275.5
Notes to the consolidated financial statementsF
or p
erso
nal u
se o
nly

MIRVAC GROUP INTERIM REPORT FOR THE HALF YEAR ENDED 31 DECEMBER 2015 29
15 Events occurring after the end of the reporting periodOn 18 January 2016, Mirvac exchanged contracts for the sale of 1 Woolworths Way, Bella Vista NSW for a total consideration of $336.4m, representing a yield of 6.07 per cent. The total consideration comprised $276.4m, due on settlement of the office building, and $60.0m related to the delivery (including cost) of a new multi-storey car park via a development management agreement. Settlement is expected in February 2016. At 31 December 2015, the office building was an asset classified as held for sale as it met all the conditions set out in the AASB 5 Non-current Assets Held for Sale and Discontinued Operations.
No other circumstances have arisen since the end of the half year which have significantly affected or may significantly affect the operations of Mirvac, the results of those operations, or the state of affairs of Mirvac in future years.
16 Summary of significant accounting policiesThe accounting policies adopted are consistent with those of the previous financial year and corresponding interim reporting period, except as set out below:
a) New and amended standards adopted by the GroupA number of new or amended standards became applicable for the current reporting period; however, the Group did not have to change its accounting policies or make retrospective adjustments as a result of adopting these standards. There will be some changes to the disclosure in the 30 June 2016 annual report as a consequence of these amendments.
b) Impact of standards issued but not yet applied by Mirvaci) AASB 9 Financial InstrumentsThis standard addresses the classification, measurement and derecognition of financial assets and financial liabilities, and introduces new rules for hedge accounting and a new impairment model. The standard is not applicable until 1 January 2018 but is available for early adoption. Following the changes approved by the Australian Accounting Standard Board (“AASB”) in December 2014, the Group no longer expects any impact from the new classification, measurement and derecognition rules on the Group’s financial assets and financial liabilities. The Group did not undertake a detailed assessment of the debt instruments currently classified as available-for-sale financial assets and did not recognise any fair value through other comprehensive income as the Group does not hold any available-for-sale debt investments.
There will be no impact on the Group’s accounting for financial liabilities, as the new requirements only affect the accounting for financial liabilities that are designated at fair value through profit or loss and the Group does not have any such liabilities. The derecognition rules have been transferred from AASB 139 Financial Instruments: Recognition and Measurement and have not been changed.
As a general rule, it will be easier to apply hedge accounting going forward as the new standard introduces a more principles based approach. The new standard also introduces expanded disclosure requirements and changes in presentation. The new impairment model is an expected credit loss model which may result in the earlier recognition of credit losses. The Group has not yet decided when to adopt AASB 9 before its mandatory date. Based on the transitional provisions in the completed AASB 9, early adoption in phases was only permitted for annual reporting periods beginning before 1 February 2015. After that date, the new rules must be adopted in their entirety.
ii) AASB 15 Revenue from Contracts with CustomersThe AASB has issued a new standard for the recognition of revenue. This will replace AASB 118 Revenue which covers contracts for goods and services and AASB 111 Construction Contracts which covers construction contracts. The new standard is based on the principle that revenue is recognised when control of a good or service is transferred to a customer — so the notion of control replaces the existing notion of risks and rewards. The standard permits a modified retrospective approach for the adoption. Under this approach, entities will recognise transitional adjustments in retained earnings on the date of initial application (e.g. 1 July 2017) i.e. without restating the comparative period. They will only need to apply the new rules to contracts that are not completed as of the date of initial application.
The new standard will have no impact on revenue recognition within the Investment segment, as the revenue is accounted for under AASB 117 Leases. With respect to the residential development business, the new standard is unlikely to have a material impact as the performance obligation is the delivering of the completed product. The Group is in the process of assessing any implications for other segments of the business and is evaluating for an early adoption of the new standard.
iii) IFRS 16 LeasesThe International Accounting Standards Board (IASB) issued IFRS 16 Leases in January 2016. IFRS 16 will impact most Australian entities and especially those with operating leases of property, aircraft, manufacturing equipment, mining equipment and distribution and logistics services. The new standard replaces the previous leases standard, IAS 17 Leases, and related IFRS interpretations. The standard sets out the principles for the recognition, measurement, presentation and disclosure of leases for both parties to a contract, i.e. the customer (‘lessee’) and the supplier (‘lessor’). The standard is not applicable until 1 January 2019. The changes under IFRS 16 will predominantly affect lessees, with the standard eliminating the classification of leases as either operating leases or finance leases as is required by IAS 17 and, instead, introduces a single lessee accounting model i.e. almost all leases will go on the lessee’s balance sheet.
Following the changes approved by the IASB, the accounting for the Group, mainly as a lessor, will not change significantly. Accordingly, the Group will continue to classify its leases as operating leases or finance leases, and to account for those two types of leases differently. The Group may however be required to provide more transparent lease information to their lessees to facilitate their lease accounting. The same accounting will also apply to the Group as rent paying lessee.
The Group is in the process of assessing the accounting implications of the new standard.
17 Critical accounting judgements and estimatesJudgements and estimates are continually evaluated, based on historical experience and other factors, including expectations of future events that may have a financial impact and are believed to be reasonable under the circumstances.
a) Critical judgements in applying Mirvac’s accounting policies
The following are the critical judgements that management has made in the process of applying the Group’s accounting policies and that have the most significant effect on the amounts recognised in the financial statements:
Notes to the consolidated financial statementsF
or p
erso
nal u
se o
nly

MIRVAC GROUP INTERIM REPORT FOR THE HALF YEAR ENDED 31 DECEMBER 201530
17 Critical accounting judgements and estimates / continued
i) Revenue recognitionThe measurement of development revenue, which is recognised when the significant risks and rewards of ownership are transferred to the purchaser, requires management to exercise its judgement in setting selling prices, given due consideration to cost inputs and market conditions. The measurement of construction revenue, which is recognised upon construction contracts on a percentage of completion basis, requires an estimate of expenses incurred to date as a percentage of total estimated costs.
ii) Cost of goods soldInventories are expensed as cost of goods sold upon sale. Management uses its judgement in determining the apportionment of cost of goods sold, through either unit entitlement or percentage of revenue, the quantum of cost of goods sold, which includes both costs incurred to date and forecast final costs, and the nature of cost of goods sold, which may include acquisition costs, development costs, borrowing costs and those costs incurred in bringing the inventories to a saleable state.
iii) Provision for loss on inventoriesMirvac is required to carry inventories at the lower of cost and NRV. Through the use of project feasibility assessments, which are based on the most reliable evidence available at the time, and incorporate both quantitative and qualitative factors, such as estimated selling rates and costs to complete, judgement is made concerning estimated NRV, which, in some cases, has resulted in the establishment of a provision.
iv) Investment properties and OOPMirvac is required to make a judgement to determine whether a property qualifies as an investment property or PPE in the cases where part of the building is occupied by the Group. Each property is considered individually. Where more than 10 per cent of the lettable space is occupied by the Group, the property is normally treated as OOP and accounted for as part of PPE.
v) Fair value estimationWhere financial assets and liabilities are carried at fair value, the fair value is based on assumptions of future events and involves significant estimates. The basis of valuation is set out in note 9.
vi) SBP transactionsThe Group measures the cost of equity settled securities allocated to employees by reference to the fair value of the equity instruments at the date at which they are granted. The fair value is determined by an external valuer using the bionomial simulation pricing method; this method includes a number of judgements and assumptions. These judgements and assumptions relating to SBP would have no impact on the carrying amounts of assets and liabilities in the consolidated SoFP but may impact the SBP expense taken to profit or loss and equity.
vii) Recognition of deferred tax assetsThe recognition of deferred tax assets is based upon whether it is probable that sufficient and suitable taxable profits will be available in the future against which the reversal of temporary differences can be deducted. To determine the future taxable profits, reference is made to the latest available profit forecasts. Judgement is also required in assessing whether deferred tax assets and certain deferred tax liabilities are recognised on the consolidated SoFP. Deferred tax assets, including those arising from tax losses, capital losses and temporary differences, are recognised only when it is considered probable that they will be recovered. Recoverability is dependent on the generation of sufficient future taxable profits.
b) Key sources of estimation uncertaintyIn preparing the financial statements, management is required to make estimations and assumptions. The following are the key assumptions concerning the future, and other key sources of estimation uncertainty at the end of the reporting period, that have a significant risk of causing material adjustment to the carrying amounts of assets and liabilities within the next period:
i) InventoriesThe NRV of inventories is the estimated selling price in the ordinary course of business less estimated costs of completion and costs to sell. Such estimates take into consideration fluctuations of price or cost directly relating to events occurring after the end of the period, to the extent that such events confirm conditions existing at the end of the reporting period. The key assumptions require the use of management judgement and are reviewed quarterly. During the half year, Mirvac did not expense any amount (December 2014: $nil) in relation to inventories that were carried in excess of NRV.
ii) Impairment of goodwillMirvac annually tests whether goodwill has suffered any impairment. Determining whether goodwill is impaired requires an estimation of the value in use of the CGU to which goodwill has been allocated. The value in use calculation requires the Group to estimate the future cash flows expected to arise from each CGU and a suitable discount rate in order to calculate the net present value (“NPV”). The carrying amount of goodwill at the end of the reporting period was $36.4m (June 2015: $36.4m). There was no impairment loss recognised during the half year (December 2014: $nil).
iii) Estimated impairment of investments accounted for using the equity method
The investments are tested for impairment, by comparing recoverable amounts (higher of value in use, and fair value less costs to sell) with the carrying amounts, whenever there is an indication that the investment may be impaired. In determining the value in use of the investment, Mirvac estimates the present value of the estimated future cash flows expected to arise from distributions to be received from the investment and from its ultimate disposal.
iv) Fair value of investments not traded in active marketsThe fair value of investments not traded in active markets is determined by the unit price as advised by the fund manager. The unit price is determined by NPV calculations using future cash flows and an appropriate post-tax discount rate. The carrying value of investments not traded in active markets determined using the above techniques and assumptions is $2.7m (June 2015: $11.3m) and is disclosed as other financial assets at fair value through profit or loss.
Notes to the consolidated financial statementsF
or p
erso
nal u
se o
nly

MIRVAC GROUP INTERIM REPORT FOR THE HALF YEAR ENDED 31 DECEMBER 2015 31
17 Critical accounting judgements and estimates / continued
v) Valuation of investment properties and OOPMirvac uses judgement in respect of the fair values of investment properties and OOP. Investment properties and OOP are revalued by external valuers on a rotation basis with approximately one-half of the portfolio being valued annually. Investment properties which are not subject to an external valuation at the end of the reporting period are fair valued internally by management. The assumptions used in the estimations of fair values include expected future market rentals, discount rates, market prices and economic conditions. The reported fair values of investment properties and OOP reflect the market conditions at the end of the reporting period. While this represents the best estimation of fair value at the reporting date, actual sale prices achieved (should the investment properties and OOP be sold) may be higher or lower than the most recent valuation. This is particularly relevant in periods of market illiquidity or uncertainty. Major assumptions used in valuation of investment properties are disclosed in note 4. The carrying value at the end of the reporting period for investment properties was $6,915.3m (June 2015: $6,751.1m) and OOP $279.4m (June 2015: $244.3m). Details on investment properties are provided in note 4.
vi) Valuation of IPUCIPUC are valued at fair value. There are generally no active markets for IPUC and fair value is considered to be the estimated market price that would be paid for the partially completed property, reflecting the expectations of market participants of the value of the property when complete less deductions for the estimated costs to complete with appropriate adjustments for risk and profit. The fair value is determined on the basis of either residual methods or DCF. Both methods require consideration of the project risks which are relevant to the development process, including but not limited to construction and letting risks. The estimated value of future assets is based on the expected future income from the project, using current yields of similar completed properties. The net gain on fair value of IPUC was $37.1m during the period (December 2014: $1.3m). The carrying value of $294.5m (June 2015: $188.9m) at the end of the reporting period was included in investment properties (refer to note 4).
vii) Valuation of SBP transactionsValuation of SBP transactions is performed using judgements around the fair value of the equity instruments on the date at which they are granted. The fair value is determined using a Monte-Carlo simulation. Mirvac recognises a SBP over the vesting period which is based on the estimation of the number of equity instruments likely to vest. At the end of the vesting period, Mirvac will assess the total expense recognised in comparison to the number of equity instruments that ultimately vested.
viii) Valuation of derivatives and other financial instrumentsMirvac uses judgement in selecting the appropriate valuation technique for financial instruments not quoted in active markets. Valuation of derivative financial instruments involves assumptions based on quoted market rates adjusted for specific features of the instrument. The valuations of any financial instrument may change in the event of market volatility. The valuation techniques are discussed in detail at note 9 and have been developed in compliance with requirements of AASB 139 Financial Instruments: Recognition and Measurement.
ix) Estimated future taxable profitsMirvac prepares financial budgets and forecasts on a regular basis which are reviewed, covering a five year period. Budgets and forecasts are prepared on a base case and identified new projects. These forecasts and budgets form the basis of future profitability to support the carrying amount of the deferred tax asset.
Mirvac’s operating and financial performance is influenced by a variety of general economic and business conditions, which are outside the control of Mirvac, including the level of inflation, interest rates, exchange rates, commodity prices, ability to access funding, oversupply and demand conditions and government fiscal, monetary and regulatory policies. A change in any of the assumptions used in the forecasting and budgeting would have an impact on the future profitability of the Group. For example, adverse fluctuations in interest rates, to the extent that they are not hedged or forecast, may impact Mirvac’s earnings and asset values due to any impact on property markets in which Mirvac operates.
Notes to the consolidated financial statementsF
or p
erso
nal u
se o
nly

MIRVAC GROUP INTERIM REPORT FOR THE HALF YEAR ENDED 31 DECEMBER 201532
Directors’ declaration
In the Directors’ opinion:
a) the financial statements and the notes set out on pages 08 to 31 are in accordance with the Corporations Act 2001, including:
i) complying with Accounting Standards, the Corporations Regulations 2001 and other mandatory professional reporting requirements; and
ii) giving a true and fair view of the consolidated entity’s financial position at 31 December 2015 and of its performance for the financial half year ended on that date; and
b) there are reasonable grounds to believe that the company will be able to pay its debts as and when they become due and payable.
This declaration is made in accordance with a resolution of the Directors.
Susan Lloyd-HurwitzDirector
Sydney 11 February 2016
For
per
sona
l use
onl
y

MIRVAC GROUP INTERIM REPORT FOR THE HALF YEAR ENDED 31 DECEMBER 2015 33
Independent auditor’s review report
Independent auditor’s review report to the members of Mirvac Limited
Report on the Half-Year Financial ReportWe have reviewed the accompanying half-year financial report of Mirvac Limited (the Company), which comprises the consolidated statement of financial position as at 31 December 2015, the consolidated statement of comprehensive income, consolidated statement of changes in equity and consolidated statement of cash flows for the half-year ended on that date, selected explanatory notes and the directors’ declaration for Mirvac Group (the consolidated entity). The consolidated entity comprises the Company and the entities it controlled during that half-year.
Directors’ responsibility for the financial reportThe directors of the Company are responsible for the preparation of the half-year financial report that gives a true and fair view in accordance with Australian Accounting Standards (including the Australian Accounting Interpretations) and the Corporations Act 2001 and for such internal control as the directors determine is necessary to enable the preparation of the half-year financial report that is free from material misstatement whether due to fraud or error.
Auditor’s responsibilityOur responsibility is to express a conclusion on the financial report based on our review. We conducted our review in accordance with Australian Auditing Standard on Review Engagements ASRE 2410 Review of a Financial Report Performed by the Independent Auditor of the Entity, in order to state whether, on the basis of the procedures described, we have become aware of any matter that makes us believe that the financial report is not in accordance with the Corporations Act 2001 including giving a true and fair view of the consolidated entity’s financial position as at 31 December 2015 and its performance for the half-year ended on that date; and complying with Accounting Standard AASB 134 Interim Financial Reporting and the Corporations Regulations 2001. As the auditor of Mirvac Limited, ASRE 2410 requires that we comply with the ethical requirements relevant to the audit of the annual financial report.
A review of a half-year financial report consists of making enquiries, primarily of persons responsible for financial and accounting matters, and applying analytical and other review procedures. A review is substantially less in scope than an audit conducted in accordance with Australian Auditing Standards and consequently does not enable us to obtain assurance that we would become aware of all significant matters that might be identified in an audit. Accordingly, we do not express an audit opinion.
to the members of Mirvac Limited
PricewaterhouseCoopers, ABN 52 780 433 757 Darling Park Tower 2, 201 Sussex Street, GPO BOX 2650, SYDNEY NSW 1171 T: +61 2 8266 0000, F: +61 2 8266 9999, www.pwc.com.au
Liability limited by a scheme approved under Professional Standards Legislation
For
per
sona
l use
onl
y

MIRVAC GROUP INTERIM REPORT FOR THE HALF YEAR ENDED 31 DECEMBER 201534
Independent auditor’s review report
IndependenceIn conducting our review, we have complied with the independence requirements of the Corporations Act 2001.
ConclusionBased on our review, which is not an audit, we have not become aware of any matter that makes us believe that the half-year financial report of Mirvac Limited is not in accordance with the Corporations Act 2001 including:
a) giving a true and fair view of the consolidated entity’s financial position as at 31 December 2015 and of its performance for the half-year ended on that date;
b) complying with Accounting Standard AASB 134 Interim Financial Reporting and the Corporations Regulations 2001.
PricewaterhouseCoopers
Jane Reilly Sydney Partner 11 February 2016
to the members of Mirvac LimitedF
or p
erso
nal u
se o
nly

MIRVAC GROUP INTERIM REPORT FOR THE HALF YEAR ENDED 31 DECEMBER 2015 35
Glossary of acronyms
AAS Australian Accounting StandardsAASB Australian Accounting Standards BoardASIC Australian Securities and Investments CommissionASX Australian Securities ExchangeCGU Cash generating unitCIC China Investment CorporationCPI Consumer Price IndexCPSS Cents per stapled securityCR Capitalisation rateDCF Discounted cash flowEIS Employee Incentive SchemeELT Executive Leadership TeamEPS Earnings per stapled securityFY13 Year ended 30 June 2013FY16 Year ended 30 June 2016FY17 Year ended 30 June 2017IPUC Investment properties under constructionJVA Joint ventures and associatesLTI Long term incentivesLTIP Long Term Incentive PlanLTP Long Term Performance PlanMAM Mirvac Asset ManagementMIM Mirvac Investment ManagementMPT Mirvac Property TrustMTN Medium term notesNABERS National Australian Built Environment Rating SystemNPV Net present valueNRV Net realisable valueNTA Net tangible assetsOOP Owner-occupied propertiesPDA Project delivery agreementPPE Property, plant and equipmentPwC PricewaterhouseCoopersSBP Security based paymentsSoCI Statement of comprehensive incomeSoFP Statement of financial positionWALE Weighted average lease expiry
For
per
sona
l use
onl
y