interim advice note 72/06 (ian 72/06) interim advice on
TRANSCRIPT

Interim Advice Note 72/06 Advice on the upgrading of existing parapets
IAN 72/06 Page 1 of 8 Feb 2006
INTERIM ADVICE NOTE 72/06 (IAN 72/06) Interim Advice on the Upgrading of existing Parapets
SUMMARY
This Interim Advice Note provides: � Additional information and guidance on
assessing risks at existing parapet sites. � Changes to BA 37/92 ‘Priority Ranking of
Existing Parapets’.
INSTRUCTIONS FOR USE This document must be used in conjunction with the document ‘Value Management of the Structures Renewal Programme’ (to be amended to reflect the changes in this IAN) and BA37/92.

Interim Advice Note 72/06 Advice on the upgrading of existing parapets
IAN 72/06 Page 2 of 8 Feb 2006
Interim Advice on the Upgrading of Existing Parapets
CONTENTS
Section Description Page No. 1 Introduction.............................................................................................. 3
2 Changes to BA 37/92 .............................................................................. 3
3 Parapet Risk Assessment for Upgrading to H4a. ..................................... 3
4 Value Management Guidance for Parapet Upgrading to H4a. ................. 4
5 Value Management Guidance for Parapet Upgrading over railways ........ 5
6 Implementation........................................................................................ 5
Appendix A: Amendments required to BA 37/92.......................................................... 6
Appendix B: Managing the Incursion of Road Vehicles from Trunk Road Over Bridges
onto Lower Roads ................................................................................... 8

Interim Advice Note 72/06 Advice on the upgrading of existing parapets
IAN 72/06 Page 3 of 8 Feb 2006
Interim Advice on the Upgrading of Existing Parapets
1 Introduction
1.1 The current Structures Renewal Value Management Guidance section A.2.2 ‘Upgrading of Substandard parapets’ states “the need to upgrade sub-substandard parapets on motorways and other high -speed trunk roads structures where current design standards or specifications are not met”. At present BA37/92 ‘Priority Ranking of Existing Parapets’ requires parapets to be bought up to the current design standard where necessary. The current design standard is IRRRS. This document states the minimum containment level on roads with a speed of 50mph or greater is N2 but the use of a very high containment H4a parapet might be considered where the site is classed as high risk. Within this document is a table outlining what might be classed as a high-risk site. In a number of cases, sites meeting these criteria have been identified as needing H4a as the minimum design criteria. 1.2 BA37/92 allows existing parapets to be prioritised by assessing the risk at the site. This is done by comparing the existing provision with the current minimum design requirement. If the current minimum design requirement has been deemed to be H4a, then when the overall risk of parapets upgrade work is calculated, the sites are being evaluated as either medium or high risk sites. This is inconsistent with the Stage 1 road over rail risk ranking and risk assessment carried out in accordance with CHE Memo 114/02 (now withdrawn). Following the Stage 2 road-over-rail risk ranking and risk assessment (CHE 125/03), only five HA sites scoring 90 and above were identified as high risk and selected for risk mitigation. The remaining road-over-rail sites scored less than 90 and, as such, were classed as low or very-low risk, which are deemed not to require risk mitigation works. IRRRS is currently being reviewed and will be replaced with clearer guidance on the use of containment and risk in TD19/06, due to be published in August 06. In the mean time, this IAN provides changes in text to BA37/92 and provides further advice on the approval requirements for any parapets upgrade work (road over road, rail, waterway, retaining walls, etc) required to ensure that such upgrades are made following a consistent risk assessment approach.
2 Changes to BA 37/92
2.1 The changes in text shown in Appendix A (see below) must be used to replace the existing text in BA37/92.
3 Parapet Risk Assessment for Upgrading to H4a. 3.1 BA 37/92 sections 1.1, 4.4, 5.3 and 8.1 should be substituted using the text shown in Appendix A of this IAN. Section 4.1 of this IAN should also used to replace the second paragraph of Section A.2.2 of the ‘Value Management of the Structures Renewal Programme’ 3.2 If having referred to IRRRS as directed in the amended wording of BA37/92 (Appendix A of this IAN), it appears that the use of a High Containment H4a parapet needs to be considered, then Approval is required from the Technical Approval Authority BEFORE the scheme can be put forward as a proposal for upgrade. 3.3 In order for the Technical Approval Authority to justify an upgrade to H4a, the overall risks at the site need to be known. Further risk analysis will therefore be required before

Interim Advice Note 72/06 Advice on the upgrading of existing parapets
IAN 72/06 Page 4 of 8 Feb 2006
Approval can be given. The risks should be calculated using the relevant risk-ranking tool as detailed in the Table 1 below: IRRRS Use of H4a Risk Ranking Table 5-1 Group B* Appendix B - ‘Road-Road Risk Ranking Table 5-2 Group C or D DfT report ‘Managing the accidental obstruction of
the railway’, Feb 2003.
Table 1 – Risk Ranking Tools
* Please note that there is no risk ranking score sheet for assessing risks in association with Group A of Table 5-1 of IRRRS. There is also no risk score sheet for assessing single carriageway roads over dual carriageway trunk roads. If this assessment is required please seek advice from:
[email protected] [email protected]
4 Value Management Guidance for Parapet Upgrading to H4a. 4.1 When the risks have been calculated using the relevant risk-ranking tool indicated by Table 1, the following should be taken into consideration. The risks calculated using the tools from Table 1, equate to four risk bands:
� High-Risk: Ranking scores greater or equal to 100 � Medium-Risk: Ranking scores between 90 and 99 � Low-Risk: Ranking scores between 70 and 89 � Very Low-Risk: Ranking scores less than 70
Any sites with risk scores <90, are low risk sites and should not be put forward as proposals for parapet upgrade to H4a because with rare exception, they do not represent value for money. Table 2 below is an extract from the DfT report ‘Managing the accidental obstruction of the railway’ and shows indicative expenditure per site based on risk ranking scores.
Risk Ranking Score
Comparative Risk
% of Sites No. Of Sites % of Total Risk
Estimated Minimum Total Investment (Millions)
Indicative Minimum Total Investment (£000)
> 105 1300 3 250 73.7 24 30 - 200 100-104 230 5 425 21.7 7 5 - 3O 95-99 40 5 425 3.8 1 1 - 5 90-94 7 7 600 0.9 <0.1 <1 85-89 1 0 760 0.2 <0.1 <0.2 80-84 0.2 0 770 <0.1 <0.01 <0.2 <80 0.03 62 5270 <0.1 <0.01 <0.2 All 100 8500 100 32
Table 2 – (From Figure 1.3 of DfT report ‘Managing the accidental obstruction of the railway’, Feb 2003).

Interim Advice Note 72/06 Advice on the upgrading of existing parapets
IAN 72/06 Page 5 of 8 Feb 2006
Table 2 shows that the maximum recommended expenditure is £200K for the very worst sites and this is less than the minimum likely cost of providing H4a upgrading (£250K at the most optimistic, £400K-£600K probably more realistic). For sites where the score is <90, the maximum recommended expenditure is £200 per site.
5 Value Management Guidance for Parapet Upgrading over railways 5.1 It has been agreed with Network Rail and Rail Safety that for vehicle parapets on existing bridges and structures (other than accommodation bridges) carrying a road over or adjacent to a railway, the Containment Level must be the highest possible Containment Level that can be achieved without undue cost, but must not be less than Normal Containment Level N2.
As indicated above, at the majority of sites, the risk is low and the recommended expenditure is far less than the installation cost of a H4a parapet. On an existing bridge, the majority of the expenditure for the installation of a H4a parapet comes from bridge strengthening works and is therefore in the majority of cases classed as undue cost. For bridges carrying a road over a railway, it is therefore advisable to assess the maximum level of containment that can be achieved without strengthening and use this containment for any parapet upgrade work. H4a containment should only therefore be used where:
(i) it could be installed with none or minimal strengthening works and would not cause undue cost
or
(ii) where the site is classed as high risk (score >90).
As an alternative to normal containment N2 or very high containment H4a parapets, high containment level H1/H2 parapets and/or a combination of safety barrier/pedestrian parapet may be used where they give the best balance of risk/cost at a site. For example, on a recent assessment N2 was estimated at £570,000, H2 at £590,000 and H4a between £780,000 and £870,000 depending on length. The use of a H2 parapet therefore gave the best balance of risk and cost at the site.
6 Implementation 6.1 This IAN should be used with immediate effect and documents amended as follows.
Standard / Advice Note, IAN or CHE Memo
Title Source Aspect Replacement / Supplement Document
BA 37/92 Sections 1.1/ 4.4/ 5.3/8.1 amended
IAN 72/06
Value Management of Structures Renewal Programme
Section A.2.2 IAN 72/06 supplements section A.2.2

Interim Advice Note 72/06 Advice on the upgrading of existing parapets
IAN 72/06 Page 6 of 8 Feb 2006
Appendix A: Amendments required to BA 37/92
Original Text New Text
1.1. The existing stock of structures on motorways and other trunk roads exhibits a large variety of parapet types; many of these are not adequate to cope with the needs of present traffic as expressed in the current criteria for the design of new bridge parapets, BE 5 (DMRB 2.2) (currently being updated as BD 52/92). As part of the Overseeing Department's programme for the rehabilitation of trunk road structures it is intended that the parapets on existing structures should, where necessary, be brought up to the current design standard on a priority basis with the highest risk sites being tackled first.
1.1. The existing stock of structures on motorways and other trunk roads exhibits a large variety of parapet types; many of these are not adequate to cope with the needs of present traffic as expressed in the current criteria for the ‘Criteria for the Provision of Vehicle Parapets’, the IRRRS (Interim Requirements for Road Restraint Systems). As part of the Overseeing Department's programme for the rehabilitation of trunk road structures it is intended that the parapets on existing structures should, where necessary, be brought up to the minimum required design standard on a priority basis with the highest risk sites being tackled first. The minimum required design standard corresponds to the following required minimum containment levels:
N1 - on roads with a speed limit not greater than 50 mph (formerly P2{80} Type) N2 - on roads with a speed limit greaterthan 50 mph or where a bridge carries a road over a railway (formerly P1, P2{113} & P5 Types) H4a (formerly P6 Type) - on roads immediately in the vicinity of high-risk vulnerable facilities (e.g. schools, hospitals, facilities manufacturing or storing hazardous materials in bulk, etc) where the risk ranking is shown to be 90 or greater. Where main structural members of the bridges would otherwise be vulnerable to the effect of collision loading from vehicles on the structure, the minimum required design standard is protection with very high containment level vehicle parapets or safety barriers.
The requirement for H4a shall be approved by the Technical Approval Authority, prior to submission as a bid.

Interim Advice Note 72/06 Advice on the upgrading of existing parapets
IAN 72/06 Page 7 of 8 Feb 2006
Original Text New Text.
4.4. Certain aspects of the method of providing containment need to be allowed for. In particular, certain through deck bridges rely on the main members to provide vehicle containment and this constitutes a high degree of hazard since a collision could lead to the collapse of the bridge itself.
4.4. Certain aspects of the method of providing containment need to be allowed for. In particular, certain through deck bridges rely on the main members to provide vehicle containment and this constitutes a high degree of hazard since a collision could lead to the collapse of the bridge itself.
On the other hand, certain structural members or substandard bridge parapets have already been protected by the installation of additional containment facilities. Where their combined containment capability is adequate, they do not need to be considered for upgrading. Where normal highway safety fences are used, consideration should be given to the clearance provided. If this clearance is less than the minimum given in TD 19/85 (DMRB 2.2) there is a risk that the fence will strike the structure or parapet during vehicle collision.
On the other hand, certain structural members or substandard bridge parapets have already been protected by the installation of additional containment facilities. Where their combined containment capability is adequate, they do not need to be considered for upgrading. Where normal highway safety fences are used, consideration should be given to the clearance provided. If this clearance is less than the minimum required by IAN 44 and the IRRRS (Interim Requirements for Road Restraint Systems) there is a risk that the fence will strike the structure or parapet during vehicle collision.
Where standard systems of safety fence or safety barrier are provided together with the necessary clearance in front of the parapet, this parapet should be excluded from the Ranking System.
Where standard systems of safety fence or safety barrier are provided together with the necessary clearance in front of the parapet, this parapet should be excluded from the Ranking System.
5.3. In situations where present design requirements would indicate the use of a P6 high containment parapet type, then the containment requirement for a high containment parapet will be the basis for assessing the remnant strength category of the existing parapet.
5.3. In situations where the minimum required design requirements would indicate the use of a very high containment level (H4a) vehicle parapet, then the containment requirement for a very high containment parapet will be the basis for assessing the remnant strength category of the existing parapet. (see Para 5.4)
8.1. Design Manual for Roads and Bridges Volume 2: Section 2 Special Structures
BE 5 - The Design of Highway Bridge Parapets (Fourth Revision) [and Amendment No.2] (DMRB 2.2) (currently being updated as BD 52/92) TD 19/85 - Safety Fences and Barriers (DMRB 2.2)
8.1. Interim Advice Notes and Interim Standards
IAN 44/05 - Interim Requirements for Road Restraint Systems (Vehicle and Pedestrian) (Revision 4), August 2005 IRRRS - Interim Requirements for Road Restraint Systems (IRRRS) (Vehicle and Pedestrian) Revision 1, December 2004

Interim Advice Note 72/06 Advice on the upgrading of existing parapets
IAN 72/06 Page 8 of 8 Feb 2006
Appendix B: Managing the Incursion of Road Vehicles from Trunk Road Over Bridges onto Lower Roads

Managing the incursion of road vehicles from trunk road overbridges onto lower roads
by Judith Barker and Jeff Hill
UPR SE/008/04 Clients Project Reference Number: HA 3/372-R013
UNPUBLISHED PROJECT REPORT

TRL Limited
UNPUBLISHED PROJECT REPORT UPR SE/008/04
MANAGING THE INCURSION OF ROAD VEHICLES FROM TRUNK ROAD OVERBRIDGES ONTO LOWER ROADS Version: 1
by Judith Barker (TRL Limited)
Prepared for: Project Record: HA 3/372-R013 Technical Support for Road over
Road Risk Ranking Client: HA, Quality Services, Traffic Safety & Environment
Division (Daniel Ruth)
Copyright TRL Limited August 2004 This report has been prepared for Highways Agency, Quality Services, Traffic Safety & Environment Division is unpublished and should not be referred to in any other document or publication without the permission of the Highways Agency. The views expressed are those of the authors and not necessarily those of the Highways Agency.
Approvals
Project Manager
Quality Reviewed

This report has been produced by TRL Limited, under/as part of a Contract placed by the Highways Agency. Any views expressed are not necessarily those of the Highways Agency. TRL is committed to optimising energy efficiency, reducing waste and promoting recycling and re-use. In support of these environmental goals, this report has been printed on recycled paper, comprising 100% post-consumer waste, manufactured using a TCF (totally chlorine free) process.

CONTENTS
Executive summary i
1 Introduction 1
1.1 Objectives 1 1.2 Road-rail incursion risk ranking procedures 1 1.3 Modifying the Road-Rail risk ranking procedure to use in Road-Road incidents 1 1.4 Trial of modified risk ranking procedures 2 1.5 Comparison with draft outline risk assessment framework for Highways Agency roads 2 1.6 Structure of report 3
2 Motorway, dual- and single carriageway road over road vehicle incursion ranking scoring spreadsheet (Figure 2.1). 3
2.1 Overall scoring 3 2.2 Factors 4
2.2.1 (f1) Upper road approach containment 4 2.2.2 (f2) Upper road alignment (horizontal and vertical) 5 2.2.3 (f3) Sleep-related vehicle accidents (SRVAs) on upper road 5 2.2.4 (f4) Actual speed of approaching road traffic on upper road 5 2.2.5 (f5) Site topography 6 2.2.6 (f6) Site specific hazards increasing the likelihood of a RTA on upper road 6 2.2.7 (f7) Site specific hazards increasing the consequences of the event (between the
upper and lower roads) 6 2.2.8 (f8) Vehicle parapet resilience on upper road 7 2.2.9 (f9) Hard shoulders, edge strips, road verges and footpaths on upper road 7 2.2.10 (f10) Carriageway markings on upper road 7 2.2.11 (f11) Combined Volume of road traffic on both carriageways of upper road 7 2.2.12 (f12) Actual speed of traffic on lower road 7 2.2.13 (f13) Site specific hazards increasing consequences of event on lower road 8 2.2.14 (f14) Combined Volume of road traffic on both carriageways on lower road 8
3 Treatment of reasonable cost 10
4 Procedures for mitigating risk 11
Acknowledgements 11
References 11
Appendix A. Trial of revised ROAD-ROAD risk ranking sheets 13
Appendix B. Background to cost calculations 25
B.1 Introduction 25 B.2 Top down approach – comparison of road-road with road-rail 25
B.2.1 Can we assume the relative risks are the same? 25
TRL Limited UPR SE/008/04

B.2.2 Are the distributions of scores between sites the same? 27 B.2.3 Estimating expenditure assuming similar distributions of scores 29
B.3 Bottom-up approach – estimating size of road-road problem and appropriate budget 30 B.4 Comparing estimates of accidents saved using the two approaches 32 B.5 Conclusions 33
Appendix C. ROAD OVER ROAD - EXTENSION TO HA RISK ASSESSMENT FRAMEWORK 34
TRL Limited UPR SE/008/04

UPR SE/008/04
Unpublished Project Report Version: 1
Executive summary
TRL were asked by the Highways Agency to support them in developing a risk ranking tool for assessing trunk road overbridges where there was potential risk of vehicles leaving the trunk road and reaching lower roads, where they might put other road users at risk.
The aim was for this tool to be usable in an equivalent way to the Road-Rail risk ranking tool already developed as part of the Selby Action Plan.
The specific objectives of the work were
• Development of a Road-Road Risk Ranking Tool to be used by Highway Agency Agents
• Development of guidance notes for application of the tool, including advice on risk mitigation measures and reasonableness of cost of these measures
• Site Trials and calibration against the Road-Rail risk ranking tool and Draft Outline Risk Assessment Framework for Highways Agency Roads
This report details all the work leading to the fulfilment of these objectives and provides a road-road risk ranking tool with guidance on how to use it and guidance on how to select mitigation measures.
The work was seen as an extension of the work that had been done in preparing the advice on managing Road-Rail incursion. The road-road risk ranking tool developed under the project can be used in parallel with the road-rail ranking tool and the resulting scores used together to prioritise both types of site for treatment. The new factors in the road-road ranking tool (which replace f12-f14 in the road-rail tool) are:
• Actual speed of traffic on lower road
• Site specific hazards increasing consequences of event on lower road
• Combined Volume of road traffic on both carriageways on lower road
The efforts to assess reasonable costs of treatment for road-road sites resulted in only tentative conclusions due to the large number of uncertainties. However, considering the number of sites over the network, it was concluded that the Agency should consider a budget for treating road over road sites of the order of twice that planned for all road-rail sites on trunk roads.
TRL Limited i

UPR SE/008/04
Unpublished Project Report Version: 1
1 Introduction TRL were asked by the Highways Agency to support them in developing a risk ranking tool for assessing trunk road overbridges where there was potential risk of vehicles leaving the trunk road and reaching lower roads, where they might put other road users at risk.
The aim was for this tool to be usable in an equivalent way to the Road-Rail risk ranking tool already developed as part of the Selby Action Plan.
1.1 Objectives
The specific objectives of the work were
• Development of a Road-Road Risk Ranking Tool to be used by Highway Agency Agents
• Development of guidance notes for application of the tool, including advice on risk mitigation measures and reasonableness of cost of these measures
• Site Trials and calibration against the Road-Rail risk ranking tool and Draft Outline Risk Assessment Framework for Highways Agency Roads
The work was seen as an extension of the work that had been done in preparing the advice on managing Road-Rail incursion.
1.2 Road-rail incursion risk ranking procedures
The procedures for managing Road-Rail incursion (Department for Transport, 2003) include a first stage which ranks all sites using a simple risk ranking tool and a second stage where a more detailed risk assessment is made of the sites which score highest on the risk ranking. This second stage includes more detailed site assessment and the scope for treatment at reasonable cost. Guidelines are provided on likely range of reasonable cost in relation to the basic risk ranking scores. A spreadsheet is provided for considering the cost effectiveness of different potential mitigation measures.
1.3 Modifying the Road-Rail risk ranking procedure to use in Road-Road incidents
To ensure that trunk road sites over roads and railways are assessed on a consistent basis it is important that the assessment procedures for Road-Road match as closely as possible those for Road-rail.
The risk ranking tool developed for road-rail included 14 factors. Eleven of these addressed the conditions on the road and on the roadside which were likely to affect the likelihood of vehicles leaving the road and reaching the railway line. These eleven factors would act in exactly the same way in road-road situations and therefore should be defined and scored in the same way for compatibility.
The other three factors addressed the potential injury consequences once the road vehicle had reached the railway. These factors need to be adapted to represent the potential consequences in the road-road situation. The three factors in the road-rail situation represented Line speed and alignment, Volume of traffic, and type of traffic. For road-road, traffic speed and traffic volume on the lower road are similarly relevant. The detailed layout and character of roads are much more variable than railways and it was considered the third factor affecting consequences should represent “Site Specific hazards on the lower road”. This was consistent with the inclusion of a similar factor for the upper road as part of the first eleven factors relating to likelihood of errant vehicles leaving that road.
On railways there is usually an intermittent but regular flow of trains; while it might be possible to stop these trains if warning is given early enough, there is no chance for train drivers to take action to change their path to avoid obstacles. On roads, the situation is different. There is a greater likelihood of vehicles being in close proximity when any errant vehicle reaches the road, but the
TRL Limited 1

UPR SE/008/04
Unpublished Project Report Version: 1
drivers of individual vehicles can take action either to stop their vehicles or change position to avoid the obstacle, although this might in turn result in them putting other road users at risk. The situation is different with wider roads than narrower roads, and with two way or one way flows. Local sight lines in the immediate vicinity of the obstacles and the presence of other vulnerable road users could both have a substantial effect on the outcome. These are therefore the type of factors to be taken into account in the “site specific” evaluation.
Scores were assigned to these three new Road-Road factors based on estimating the relative risks in different situations; the initial assumptions were modified following the trial described in 1.4.
1.4 Trial of modified risk ranking procedures
A small trial using the proposed road-road risk ranking tool was made at eleven sites in Area 3 of the Agency network. The aim of this was primarily to look at the consistency with which the three new factors could be scored and the site specific hazards that might be highlighted in the guidance notes.
Based on the trial a slightly wider range of scores was proposed for Factor F13 representing site specific hazards to reflect the need to differentiate more between the potential consequences that might arise on the lower roads observed.
The total score (47) that could be obtained from the three consequence factors in the road-rail situation was considerably higher than maximum score possible from the three consequence factors included in the road-road tool. Because of the desirability of producing consistent results, the proposed range of scores for factor F12 (speed of lower road traffic) and factor F14 (traffic volume on lower road) were also re-examined and both were increased slightly. Nevertheless, the maximum road-road score for these factors (32) remain well below the maximum for the road-rail situation. Subsequent attempts to compare the potential consequences from the two types of situation, are discussed in Appendix B but did not provide any convincing evidence of major differences in the most typical consequences arising in the two situations, although it is, of course, possible to visualise the worst outcomes of a rail crash being more severe than the worst consequence of the road crash.
A fuller description of the trial is given in Appendix A.
1.5 Comparison with draft outline risk assessment framework for Highways Agency roads
The road over road risk ranking tool gives a simple means of reflecting the general level of risk at sites, but it does not follow the traditional approach of estimating risk through combining multiplicatively the probabilities associated with the individual elements of risk. For road over road, the probability of injuries occurring at a site is: The probability of vehicles leaving the road at the site multiplied by the probability of these vehicles reaching the lower road multiplied by the probability of the vehicles that reach the lower road being involved in injury accidents. The main factors that might influence these probabilities are included in the road-road 14 factor risk ranking tool. In Appendix C, a more detailed assessment is considered so that it would be possible to compare the resulting risk with that in other parts of the network, according to the outline risk assessment framework currently under development by the Highways Agency. In this report the numbers used are purely indicative. It is suggested that firmer estimates are developed once the form of the model in a comprehensive risk assessment framework is developed.
TRL Limited 2

UPR SE/008/04
Unpublished Project Report Version: 1
1.6 Structure of report
Section 2 of the report provides the proposed risk ranking tool and guidance notes which follow very closely those provided for road-rail situations. Section 3 (and Appendix B) considers the potential expenditure that might be justified and Section 4 provides guidance on treatment of sites. Again both of these follow closely the procedures adopted for road-rail. More detailed discussion of the development of the advice and the comparisons with road-rail is given in Appendices A and B. Appendix C explores the link between the road over road ranking tool and the draft outline risk assessment framework under development for the Highways Agency.
2 Motorway, dual- and single carriageway road over road vehicle incursion ranking scoring spreadsheet (Figure 2.1).
This document has been developed to be used in parallel with the DfT guidance ‘Managing the accidental obstruction of the railway by road vehicles’ (DfT, 2003). The present document has therefore been left fundamentally the same as the road-rail documentation and has been modified only to address the issues specific to bridge sites on trunk roads which are over roads.
2.1 Overall scoring
You get the overall risk ranking score for a bridge by adding all 14 factors together. As a guide, an increase of two in a score for any of the factors or for an overall risk score implies a doubling of the risk, so 6 is twice as bad as 4, and 12 is eight times worse than 6. This gives a mid range of risk values. A score of 90 implies that the risk is approximately a million times greater than a score of 50.
The scoring regime assumes that no factor needs a score of zero, as even the best protection still allows a slim chance of a vehicle or debris reaching the road below.
Assessors should rank bridges according to score. They should assess the highest scoring bridges in more detail to see what improvements can be made. The maximum possible score is 128. As a guide, scores of 100 or more are significant and scores of 70 or more would suggest that highway authorities should at least consider improvements. This does not rule out simple and cost effective improvements at bridges that score less than 70.
Bridges that score one for factor 1 (road approach containment) combined with a score of 1 for factor 5 (site topography) and a score of two or less for factor 8 (vehicle parapet resilience) require no further action. However the assessor should still complete the scoring sheet to show that they have evaluated the site and to record the present situation.
TRL Limited 3

UPR SE/008/04
Unpublished Project Report Version: 1
2.2 Factors
2.2.1 (f1) Upper road approach containment
This factor is used to consider the possibility of a road traffic accident (RTA) resulting in a vehicle or debris continuing along the road approach side slope and then onto a road below. It is also used to consider a vehicle or debris gaining access either side of the safety barriers and transitions prior to the vehicle parapet in a cutting. Where containment varies on each approach, (that is, at each corner of the bridge) assessors must consider the worst case.
Score 24 for no effective vehicle restraint system or very low containment, non-standard walls, fences or barriers
Here there is a high probability of an errant vehicle continuing at the same speed and/or angle to the lower road.
Score 12 for approach safety barriers of normal containment that are sub-standard, defective, damaged or too short
These sites have safety barriers that do not comply with current standards. This is either as a result of poor original installation, deterioration, damage, settlement or any other significant defect, or because they are too short.
Score 6 for normal containment
This score covers sites with normal containment safety barriers of adequate length, fully complying with current standards, and connected to a normal containment level (formerly P5 type) parapet in accordance with the requirements for non-proprietary and proprietary safety barriers.
Score 1 for very high containment
This means that there is a very high containment barrier (H4a) of adequate length with appropriate transition to a normal containment safety barrier (N2), in accordance with the European standard BS EN 1317 and the Highways Agency’s Interim Requirements for Road Restraint Systems (IRRRS). These should either be continuous or used in conjunction with a very high containment level vehicle parapet. See factor 8.
Assessors should particularly consider the “length of need” for high containment safety barriers and/or vehicle parapets on high-speed roads. The “length of need” is the length reasonably required to prevent a vehicle from reaching the lower road. Road engineers are likely to meet “the length of need” either by using a very high containment level parapet and transition or continuous high containment barriers.
Assessors should only include sites in this category where the length of high containment protection is reasonably likely to prevent most vehicles reaching the road below from either a wide approach angle (eg hitting the containment at an angle of more than 20 degrees) or a shallow approach angle (leaving the road before the containment begins and continuing behind the barrier towards the hazard).
TRL Limited 4

UPR SE/008/04
Unpublished Project Report Version: 1
2.2.2 (f2) Upper road alignment (horizontal and vertical)
Road width and horizontal and vertical alignments are important, but are unlikely to be a significant feature of high-speed major roads. Length of sight lines are important, as blind summits and bends can reduce sighting and reaction times. Assessors should determine inter-visibility on straight road humpbacks and bends in accordance with the ‘Design Manual for Roads and Bridges’, TD 9/93. Assessors should consider using the single carriageways ranking tool for major roads with speed restrictions or with narrow widths and poor alignments.
2.2.3 (f3) Sleep-related vehicle accidents (SRVAs) on upper road
Recent research has identified a number of RTAs caused by drivers falling asleep. These are known as sleep-related vehicle accidents or SRVAs. The study found that SRVAs are relatively common on high-speed major roads. Proportions ranged from 16 per cent to 30 per cent of all reported fatal, injury and damage only accidents.
In a recent study of SRVAs, the highest proportion was found on a featureless, unlit stretch of the M40 in rural Warwickshire. The research indicated that SRVAs are independent of traffic density, but there are some identifiable characteristics that lead to clusters of these accidents.
Availability of service areas did not seem to affect SRVAs. But the study found clusters of SRVAs on slow right hand bends and towards the end of a long route. For example, run-off accidents were clustered on the eastbound carriageway of the eastern end of the M180 and A180, but there was no such cluster on the westbound carriageway.
SRVAs were also found to occur on slow left hand bends. Most major roads have a central reservation safety fence, which heavy goods vehicles (HGVs) may broach thereby posing a particular risk of incursion on to roads below. (See 2.2.11: Traffic volume.)
2.2.4 (f4) Actual speed of approaching road traffic on upper road
This ranking tool is intended for use on fast roads where higher traffic speeds increase both the likelihood and the effect of an accident. This is due to the distance over which the vehicle and debris may travel after the accident, and/or the capability of the vehicle restraint system.
If possible, assessors should use actual speeds taken from site measurements. If these are not available, they should estimate the speed at medium traffic density and note it on the scoring sheet. Assessors should consider traffic density when measuring traffic speed, as these two factors can be interdependent, producing an unreliable figure.
TRL Limited 5

UPR SE/008/04
Unpublished Project Report Version: 1
2.2.5 (f5) Site topography
The assessor should consider how far an errant vehicle leaving a high-speed road would travel. This may be affected by the:
• gradient of the side slope;
• distance from top of cutting slope to the road below;
• height of the road in relation to the field level next to the approach slopes;
• proximity of the road below to ends of the vehicle parapets;
• height of the deck above lower road;
• likelihood of the vehicle becoming airborne;
• skid resistance of the ground between the upper and lower roads; and
• presence of shrubbery between the upper and lower roads.
This factor is not intended to include any assessment of the risk associated with parts of the vehicle parapet or safety barrier being displaced onto the lower road. We consider this in factor 8.
2.2.6 (f6) Site specific hazards increasing the likelihood of a RTA on upper road
Analysis of accident data suggests that RTAs on major, high-speed roads are clustered near junctions or other areas, which can lead to conflicting or unusual traffic movements or vehicles changing lanes. The following are all likely to increase the frequency of RTAs:
• junctions;
• changes in the number of lanes;
• service areas; and
• lay-bys.
Assessors should generally consider the distance of a hazard from the bridge approach when scoring this factor. Raise the score by one band for sites prone to long periods of bad weather, such as exposed moorland.
2.2.7 (f7) Site specific hazards increasing the consequences of the event (between the upper and lower roads)
These include, but are not limited to, exposed pipelines, water mains, communication cabinets and so on, that are:
• attached to the bridge structure; or
• adjacent to the bridge approaches; or
• parallel with the lower road.
Risk increases where there is more than one pipeline or hazard.
TRL Limited 6

UPR SE/008/04
Unpublished Project Report Version: 1
2.2.8 (f8) Vehicle parapet resilience on upper road
Parapet resilience (containment) is important because the effect of an accident will be less if the parapet can contain and redirect crashed vehicles on the bridge deck. Refer to IRRRS for details of parapet types.
The type of parapet will also, by definition, specify the height and the infill. This will, in turn, determine the likelihood of debris from the bridge fouling the lower road.
2.2.9 (f9) Hard shoulders, edge strips, road verges and footpaths on upper road
Road approaches and bridge decks with hard shoulders, edge strips and/or wide footpaths or verges reduce the risk of RTAs, as they give drivers extra width to take avoiding action and to regain control of their vehicles.
2.2.10 (f10) Carriageway markings on upper road
Edge markings, raised rib markings (sometimes called “rumble strips”) and reflective road studs (sometimes called “cats eyes”) on the nearside edge of major roads alert drivers to their position. They should help to reduce the risk of vehicles leaving the nearside of major roads. There is some evidence that adequate, well-maintained raised rib markings can be particularly effective in overcoming run-off accidents where fatigue is a factor. However, assessors need to check their condition of edge and rib markings.
2.2.11 (f11) Combined Volume of road traffic on both carriageways of upper road
Heavy road traffic has been shown to increase the likelihood of a RTA. We measure traffic flow for major high-speed roads with high volumes of traffic in vehicles per day (vpd). On average HGVs make up about 10 per cent of the traffic on motorways and all-purpose trunk roads and are involved in about seven per cent of RTAs. However, the mix of traffic may add to the risk of vehicle incursion, particularly in relation to containment (see 2.2.1: ‘Upper Road Approach Containment’). Assessors should increase the score by one band if HGVs form 12 per cent or more of total traffic.
2.2.12 (f12) Actual speed of traffic on lower road
The higher the traffic speeds on the lower roads the greater the likelihood and consequences of an accident. The fastest lower road drivers will have less time to react to, and avoid, a hazard ahead. In addition, the faster the vehicle is travelling at impact, the greater the kinetic energy on impact. If possible, assessors should use actual speeds taken from site measurements. If these are not available, they should estimate the mean speed of all traffic at medium traffic density and note it on the scoring sheet. Assessors should consider traffic density when measuring traffic speed, as these two factors can be interdependent, producing an unreliable figure.
TRL Limited 7

UPR SE/008/04
Unpublished Project Report Version: 1
2.2.13 (f13) Site specific hazards increasing consequences of event on lower road
Assessors should consider anything within a 100m zone of influence (100m beyond each end of the bridge parapet) that may pose additional hazards. These include, but are not limited to, the presence of:
• pedestrians, especially if stationary (eg at bus stops or crossing);
• narrow road width;
• poor or no lighting, particularly with low bridges;
• reduced sight lines (eg bends, vegetation);
• adjacent land use (eg housing, schools); and
• queuing traffic (traffic signals, junctions).
Score 1 for sites with no site specific hazards on the lower road
For sites with site specific hazards, a doubling of risk is assumed for 2-way roads because of the increased likelihood of more vehicles and casualties being involved.
Score 3 for a 1-way lower road (or 5 for a 2-way lower road) with a single site specific hazard.
Score 5 for a 1-way lower road (or 7 for a 2-way lower road) with two site specific hazards.
Score 7 for a 1-way lower road (or 9 for a 2-way lower road) with queuing or with 3 or more site specific hazards. These should include sites which commonly have pedestrian or vehicle queuing zone of influence around the bridge.
2.2.14 (f14) Combined Volume of road traffic on both carriageways on lower road
The greater the volume of traffic on the lower road the harder it will be for vehicles to avoid a vehicle or debris falling from the road above and the greater the number of vehicles (and so casualties) to be at risk of involvement in the accident. As in 2.2.11 above, we measure traffic flow in vehicles per day (vpd). On average HGVs make up about 6 per cent of the traffic on all roads and are involved in about six per cent of RTAs. However, the mix of traffic may add to the risk of the consequences so assessors should increase the score by one band if HGVs form 7 per cent or more of total traffic.
TRL Limited 8

Unpublished Project Report Version: 1Final version 2004
Road Number:Bridge Number:Carriageway Direction:Date / / .Undertaken by:Factor Options Score Factor Options Score
f1 (See
Note A)
Upper Road Approach Containment Score 1 for Very High Containment (H4a) vehicle restraint system (safety barrier or extended vehicle parapet etc.) of adequate length.Score 6 for Normal Containment (N2) vehicle restraint system of adequate length or compliant with "length of need".Score 12 for sub-standard, defective or damaged or inadequate length approach safety barriers (See Note A)Score 24 for non-existent or significantly sub-standard vehicle restraint system.
f8 Vehicle Parapet Resilience on Upper RoadScore 1 for Very High Contaiment (H4a) vehicle parapet or equivalent Score 2 for a Normal Containment (N2) parapet (of either 1.25 or 1.5 m height) or a sub-standard parapet protected by a normal containment safety barrier Score 3 for a Normal Containment (N2) parapet (of 1 m height) Score 5 for an unprotected 450mm brickwork/masonry vehicle parapet Score 7 for an unprotected 340mm brickwork/masonry vehicle parapet Score11 for an unprotected defective or sub-standard vehicle parapet
f2 Upper Road Alignment (Horizontal & Vertical)Score 1 for full standard sight stopping distance (ssd), full width lanes, straight & constant grade Score 3 for full standard ssd, some curves and undulations but standard horizontal and vertical alignmentsScore 7 for sub-standard ssd or narrow, sub-standard vertical and horizontal alignments
f9 Hard Shoulders, Edge Strips, Road Verges and Footpaths on Upper RoadScore 1 for full width hard shoulder (>3.0m) and 1.5m or greater verge Score 2 for reduced hard shoulder (3.0m<2.5m) or 1m edge strip and 1.5m or greater verge / footpath measured at the narrowest pointScore 3 for narrow hardshoulder (< 2.5m) or edge strip and verge / footpath less than 2m measured at the narrowest point
f3 Sleep-Related Vehicle Accidents on Upper Road Score 1 for no obvious risk factor Score 3 for site on featureless rural road with the minimal services and/or minimal distractions for drivers at the side of the road Score 5 for a bridge on a sweeping right hand bend, sweeping left hand bend with no central reserve safety barriers or a site at the end of a long route (e.g. eastbound of eastern end of M20 or southbound of southern end of M3 etc.)Score 9 for a combination of any of the above factors
f10 (See
Note D)
Carriageway Markings on Upper RoadScore 1 for edge markings, rumble strips and "cats eyes" in accordance with current standardsScore 4 for non-existent, inadequate or obscured markings, worn, buried or over painted rumble strips at a location where considered to be required
f4 Actual Speed Of Approaching Traffic on Upper Road Score 1 for 50 - 60Score 3 for 61-70Score 6 for > 70
f11 (See
Note E)
Combined Volume of Road Traffic on both Carriageways of Upper RoadScore 1 for < 20,000 vehicles per day (vpd)Score 2 for 20,000 - 40,000 vpdScore 3 for 40,000 - 60,000 vpdScore 5 for 61,000 - 120,000 vpdScore 8 for Over 120,000 vpd
f5 Site Topography on Upper RoadScore 1 if vehicle/debris very unlikely to foul lower road from the bridge approachScore 4 if vehicle/debris unlikely to foul lower road from the bridge approachScore 6 if vehicle/debris can be reasonably expected to foul lower road from the bridge approachScore 8 if vehicle/debris likely to foul lower road from the bridge approachScore 10 if vehicle/debris very likely to foul lower road from the bridge approach
f12 Actual Speed of Traffic on Lower RoadScore 1 for <10mph Score 4 for <30mph Score 8 for <50mphScore 10 for <70mphScore 12 for >70mph
f6 (See
Note B)
Site Specific Hazards Increasing Likelihood of RTA on Upper RoadScore 1 for no obvious hazards Score 3 for minor hazard e.g. an off slip roadScore 5 for a more significant single site specific hazard e.g. an adjacent on slip road or junctionScore 9 for major junction or interchange with multiple direction signs likely to lead to conflicting traffic movements
f13 ( See
Note F)
Site Specific Hazards Increasing Consequences of Event on Lower Road Site Specific Hazards Increasing Consequences of Event on Lower Road - 1 way roads Two-way roadsNo hazards Score 1 Score 1Single hazard Score 3 Score 5Two hazards Score 5 Score 73 or more hazards/queuing Score 7 Score 9
f7 (See
Note C)
Site Specific Hazards Increasing Consequences of Event (between Upper and Lower Road)Score 1 for no obvious hazardsScore 3 for single site specific hazardScore 5 for multiple site specific hazards and/or lower road infrastructure likely to increase severity of an incident.
f14 (See Note E)
Combined Volume of Road Traffic on both Carriageways of Lower RoadScore 1 for < 20,000 vehicles per day (vpd)Score 5 for 20,000 - 40,000 vpdScore 7 for 40,000 - 60,000 vpdScore 9 for 61,000 - 120,000 vpdScore 11 for Over 120,000 vpd
TOTALNote A This factor is to be considered in conjunction with f5 Site Topography to determine the "length of need". Note D If Score = 4 road marking deficiencies to be brought to attention of maintaining authority
Note C
Figure 2.1: Proposed road-road Motorway, Dual- and Single-Carriageway Vehicle Incursion Risk Ranking Scoring Spreadsheet
Note B Note E
Note F The hazards cn the lower road leading to increased consequences could include the presence of pedestrians, road and/or verge width (inability to avoid a vehicle blocking the road), poor or no lighting, reduced sight lines (e.g. bends or vegetation) and adjacent land use (e.g. housing, schools), likelihood of queues etc.
The percentage of HGVs on major roads is typically about 10%, consideration should be given to increasing the score for a disproportionately higher level of HGVs on the route.
Site specific hazards increasing the likelihood of an RTA include the following features in proximity to the bridge: interchange, road junction, lay-by, emergency service vehicle recesses, lane drops and no hard shoulder etc. Consideration should be given to increasing the score by two if there is no adequate carriageway lighting.
Site specific hazards increasing the consequences of the event include the following features in proximity to the bridge: exposed gas or chemical pipelines, etc. Road infrastructure likely to increase severity of incident to include bridge piers and abutments and tunnel portals etc within 800m (1/2 mile) of structure.
TRL Limited 9 UPR SE/008/04

UPR SE/008/04
Unpublished Project Report Version: 1
3 Treatment of reasonable cost Advice on expenditure per site in the road-rail procedures was based on
• Estimating the total sum of money that might be justified to spend nationally, based on the annual total of accidents and other costs arising from this problem
• Splitting this total between the total number of sites where incursions onto railways might occur, on the basis of their relative risk ranking, to give indicative levels of expenditure per site.
• Allowing local assessors wide latitude in tailoring the expenditure at a particular site taking account of local site conditions, whilst keeping generally within the overall guidance
It is desirable to use the same general approach for road-road sites so that consistent investment decisions are made for the two types of site. This section therefore discusses how a similar set of numbers might be derived for road-road sites, to assess how the overall budget and the expenditure per site might be compared to those already being used for road-rail sites. A fuller discussion is given in Appendix B.
The first step was to consider “are the relative risks the same between road-road and road-rail sites” and “is the distribution of scores between the two types of site likely to be different”? Any individual outcome is likely to be very different from any other individual outcome, and relative infrequency of the events means that the evidence for making aggregate assessments is very weak. At first sight, the high speeds of rail vehicles and their concentrations of passengers might be expected to give rise to much worse consequences. In practice the data available on rail incursions (HSC, 2002) showed a worst case where 10 people died, with the average casualty outcome apart from this case being only 1.6 fatalities per incident. Similar outcomes can be identified in road accident data, particularly on high speed heavily trafficked roads. It was concluded that overall there did not seem to be a strong argument for assuming a substantial difference between the distribution of scores likely to be found in the road over road and road over rail situations on trunk roads.
Of the overall budget of £32m estimated as reasonable for road-rail bridges, the sum directly associated with valuation of life and injuries is about £15m; the remainder is associated with disruption cost and accident investigation. These latter costs are not as relevant to the road over road situation as both are subsumed within the road injury accident cost. There are some 500 road over rail overbridges on the trunk road network, compared with about 2000 road over road sites on trunk roads, so at the same level of risk, a consistent budget for these sites would be twice that made available by the Agency for road over rail bridges (four times as many sites but with total budget to cover accident costs being half that for all rail site costs). If it is assumed that the risk distribution among road over road sites was similar to that among road over rail sites, the expenditure per site would be about half that for road over rail sites. Generally, within the overall population of sites, risk at trunk road sites was less than that at other sites, so total budget justified for accident savings would be less than this. Very few trunk road-rail sites were considered to be ranked in the top 10-20% of the riskiest sites, and therefore they did not warrant any substantial expenditure. An alternative approach to estimating the cost effectiveness of treating trunk road sites is described in Appendix B, and the way in which different assumptions influence the results is discussed. Overall it is proposed that the Agency should align their policy closely with investment decisions made for road rail sites, and consider a total budget of twice that allocated for those sites.
TRL Limited 10

UPR SE/008/04
Unpublished Project Report Version: 1
4 Procedures for mitigating risk The procedures for road rail include guidance on how to assess the scope for treatment at a site. This includes a spreadsheet which can be used to consider the cost effectiveness of different combinations of measures.
The potential treatment of road-road sites, both to reduce the likelihood of vehicles leaving the road and to minimise the chances of these vehicles reaching the lower road, would be very similar to those for road-rail and the same general guidance is appropriate for both situations. An example of a mitigation spreadsheet for a road-road site is given in Figure 4.1.
Acknowledgements The work described in this report was carried out in the Safety Group of TRL Limited. The authors are grateful to John Rylett, Rob Pratt and Mike Gelpi of Area 3 for their assistance in organising and carrying out the site trial, and to David Lynam of TRL who carried out the quality review and auditing of this report.
References
Department for Transport (2003) ‘Managing the accidental obstruction of the railway by road vehicles’. http://www.dft.gov.uk/stellent/groups/dft_roads/documents/page/dft_roads_507630.pdf
Health & Safety Commission (2002) ‘Obstruction of the railway by road vehicles – Report of the working group set up by the Health & Safety Commission, February 2002’.
TRL Limited 11

UPR SE/008/04
Unpublished Project Report Version: 1
Figure 4.1: Example Road over Road Mitigation Spreadsheet
(a) (b) (c) (d) (e ) (f) (g) (h) (i) (j)
Measure Quantity
Approx cost £ per site
(2003 prices)
Estimated average
effectivenessSuitable for site? (Y/N)
Approx. cost of
measure for this
site
Estimated effectiveness of
measure for this site
cost-effectiveness
(e/1000f) measure alone Selection order
cost effectiveness of measure given others selected
Cost of selected
measuresNormal safety barrier (N2) 30 metres £1,400 -95% Y 8100 -95% -9 5 £8,100Double rail open box beam (DROBB) 30 metres £2,000 -95% Y 11700 -50% -23 -1547High containment (H4a) 30 metres £3,600 -95% Y 14400 -95% -15 -1002
Advisory speed limits 2 signs £1,400 -5% Y 1350 -5% -27 -1785Traffic calming - physical -62% NTraffic calming - marking signing only -20% Y 1000 -20% -5 -330Marking narrowings -5% Y 500 -5% -10 -661Metre strips (marking only) 30 metres £1,400 -5% Y 1500 -5% -30 -1983Hazard signing 2 signs £1,400 -31% NAccident history signs (yellow backed with legend) 2 signs £1,600 -30% NChevrons (excluding lighting costs) 2 Signs £1,600 -70% NVehicle-activated signs 2 signs £15,000 -25% Y 15000 -25% -60 -3966Traffic signals -53% NColoured road surfacing in centre hatching 15 sq m £2,700 -5% NRumble strips 60 m £1,300 -35% Y 1000 -35% -3 3 £1,000Anti-skid surfacing whole c/w 109.5 sq m £1,800 -32% NLighting (excl.elec supply) £200/column 10000 -31% Y 5000 -31% -16 -1066Edge-lining (raised/plain) 30 metres £1,400 -30% Y 1400 -30% -5 4 £1,400Reflectorised posts 15 posts £700 -30% Y 600 -30% -2 1 £600Reflectorised studs 20 studs £900 -5% Y 900 -5% -18 -1190Lane markings/hatching 40 metres £1,900 -10% NOverrun areas -20% Y 5000 -20% -25 -1652Cut back vegetation £0.5/lin m 100 -5% Y 100 -5% -2 2 £100Planting to stabilise slope 1000 -10% NVehicle/debris nets 5000 -20% N
Total cost of selected measures £11,200
Estimated overall effectiveness for the combination of all selected measures -70%
TRL Limited 12

UPR SE/008/04
Unpublished Project Report Version: 1
Appendix A. Trial of revised ROAD-ROAD risk ranking sheets A trial took place on 22nd October 2003 around the HA Area 3 network. The assessments were all carried out on one day with 4 observer engineers scoring eleven road over road sites. In a few instances, the lower roads could be assessed from above but in most cases, the sites were viewed from above and below. Speeds were assessed on site; flows were obtained from a 2002 database after the trial – except for one site where the lower road flows were estimated. The tool (reproduced in appendix A1 of this document) was fairly easy to use, taking about 5-10 minutes per site, or a bit longer if the route to the lower road was lengthy. After discussion between observers, differences in initial scores were generally agreed but the variation between initial scores were of the same order or greater than the variation between all sites visited. Some factors were much more subjective than others. The sites visited were all dual-carriageway trunk A roads or motorways (but no single-carriageway sites) and a variety of lower roads were ranked. These included one-way roads, two-way roads, motorway, dual- and single-carriageways, trunk and local roads. The table below shows the sites visited. A selection of site photos can be found in Appendix A2.
TRL Bridge No. Upper Road Direction Lower Road Direction1 M27/M3 Link M27 E&Wbnd2 M27 Wbnd A323 M27 Alloway Ave4 M3 Sbnd A3035 A303 Wbnd A306 A303 Wbnd A347 M3 Sbnd A339link SBnd8 M3 A3399 M3 Sbnd M27 WBnd
10 M27 A2711 M275 OffSlip to M27 M27 E&Wbnd
TRL Limited 13

UPR SE/008/04
Unpublished Project Report Version: 1
The table below shows notes and comments recorded on site with respect to each site. TRL bridge no. Notes/comments 1 long bridge f6; different parapet f8 2 parapet not in line with road f8; lower rd 40mph limit f12; merge, right turn
lane, lighting, dual carriageway, queuing 3 accident 8yrs ago; sound barrier f6; 30mph limit f12; no lighting, 2way, single
c/w, school, pedestrian footway, curve f13 4 poor forward visibility f13 5 one way; non-standard crash barrier joint f1; bend on approach,
no lighting, bend at bridge f13 6 dual over dual; new barrier damage repair; no lighting but high bridge 7 dark, traffic lights, bend f13 8 40mph/derestricted boundary f12; 1way roundabout, no lighting, pedestrian
footway f13 9 accident site; unlit; lots HGVs f11 10 blocked drains and merging traffic f6; 40mph limit f12;
ped/cycle path, queuing, traffic lights f13 11 wide road, 9 lanes?, queues Eastbound and Westbound in peak hours
The data from the score sheets were entered into an Excel spreadsheet and analysed. A small amount of data were ‘cleaned’ to account for missing factor values and discrepancies between observers for speed factors f4 and f12 which would not occur in a ‘real’ ranking exercise – however, this did not change the results significantly. The graph below shows results after ‘cleaning’.
Risk ranking score averaged over all observers
0
10
20
30
40
50
60
70
8 5 1 3 6 7 9 2 4 10 11
bridge number
scor
e
avgescore
The main comments on site were that f5 was hard to score and that f13 did not have enough scope to differentiate between different types of lower road hazards. In particular, the one way lower roads tended to afford more opportunity for avoiding an accident than two way roads where the likelihood of head on accidents was also important. Similarly, some lower roads were more likely to have queuing traffic or multiple hazards. Consequently, after the trial a new f13 variable has been proposed:
TRL Limited 14

UPR SE/008/04
Unpublished Project Report Version: 1
New f13 scores One way roads Two-way roads No hazards 1 1
Single hazard 3 5 Two hazards 5 7
3 or more hazards 7 9 The graph below shows the trial results re-scored using new f13 variable
Risk ranking score averaged over all observers
0
10
20
30
40
50
60
70
8 1 5 3 2 6 9 7 4 10 11
bridge number
scor
e
avgescore
It should be noted that the maximum score possible using the road-road tool is considerably lower than that for the road-rail tool (21 lower for the amended f13 version). This should be kept in mind if comparing results from the two tools. Although in practice it is likely that one engineer will score all sites in an Area, or several engineers will use a common approach, it is interesting to see how scores vary between different scorers. The following graph below shows variation between scorers for each bridge.
Risk ranking scores for11 road over road sites
01020304050607080
1 2 3 4 5 6 7 8 9 10 11
Bridge number
Ran
king
sco
re obs 1obs 2obs 3obs 4
TRL Limited 15

UPR SE/008/04
Unpublished Project Report Version: 1
Note that these scorers did not receive training before scoring (as an engineer would in practice). As site features were discussed the observers tended towards a common view. Also, this has not been a reported problem with the road-rail tool and so perhaps it is of most interest to compare the variation between factors f1-f11 (as in road-rail tool) with those for f12-f14 (new to the road-road tool). The table below gives a variance and average score for each factor and each bridge. (The values are for the new adjusted f13 with possible scores between 1 and 9.)
bridge no f1 f2 F3 f4 f5 f6 f7 f8 f9 f10 f11 f12 F13 f14 total 1 var1 - - - - - - - - - - - - - - -
avge 6 3 5 6 4 3 1 3 1 1 2 9 1 3 482 var 0 1 1 0 1 1 4 24 1 0 0 0 0 0 32
avge 6 2 2 6 7 4 3 5 2 1 5 7 3 1 553 var 0 0 1 0 9 9 4 0 0 0 0 0 5 0 54
avge 6 1 2 6 8 5 3 3 1 1 5 5 7 1 524 var 0 1 1 0 4 1 1 0 0 0 0 0 1 0 17
avge 6 2 2 6 9 5 2 3 1 1 5 9 7 2 595 var 12 1 1 0 6 0 0 0 0 0 0 0 5 0 37
avge 9 3 2 6 8 1 1 3 1 1 2 7 5 1 496 var 0 0 4 0 6 1 1 0 1 0 0 0 0 0 21
avge 6 3 2 6 7 4 2 2 2 1 3 9 5 3 557 var 0 1 1 0 0 1 4 0 0 0 0 0 9 0 54
avge 6 2 2 6 6 4 4 3 1 1 5 7 7 3 568 var 0 0 1 0 4 0 1 0 0 0 0 0 1 0 27
avge 6 1 4 6 6 1 2 3 1 1 5 5 6 3 489 var 6 0 4 0 1 4 1 0 0 0 0 0 1 0 5
avge 5 3 4 6 10 3 3 3 1 1 3 9 4 3 5510 var 12 0 1 0 5 5 5 0 0 0 0 0 0 0 2
avge 10 1 2 6 9 8 2 2 1 1 5 5 9 2 6311 var 0 0 0 0 0 8 2 1 0 0 0 0 0 0 13
avge 6 7 1 6 10 3 2 3 3 1 3 9 7 5 66 Var=variance between scores given by 4 scorers; avge=average of scores given by 4 scorers Comparisons between scores given by different observers showed the greatest discrepancies for sites 3, 5, 7 and 2. These were largely due to different scores given for factors f5 and f6; f7 and f13; f1 and f5; f7 and f8, respectively. The greatest within factor variances were for f1, f5 and f6. This is reassuring with regards to the suitability of f11-f13. The apparently extreme results for f1, f5 and f6 arose either from some flaw/deficiency in current protection being scored by only some of the observers or from differing assessment of level of site specific risk which were not clearly defined. Particularly for factors f5 and f6, knowledge of actual accidents that had occurred but the circumstances of which would otherwise seem unlikely tended to affect judgements. In summary, the scoring sheet appeared to give sensible results, identifying the sites of most concern and, most importantly, the new variables f12-f14 appeared to make sense for the variety of lower roads in the trial. 1 Only one observer recorded a score for this site.
TRL Limited 16
UPR SE/008/04
Unpublished Project Report Version: 1
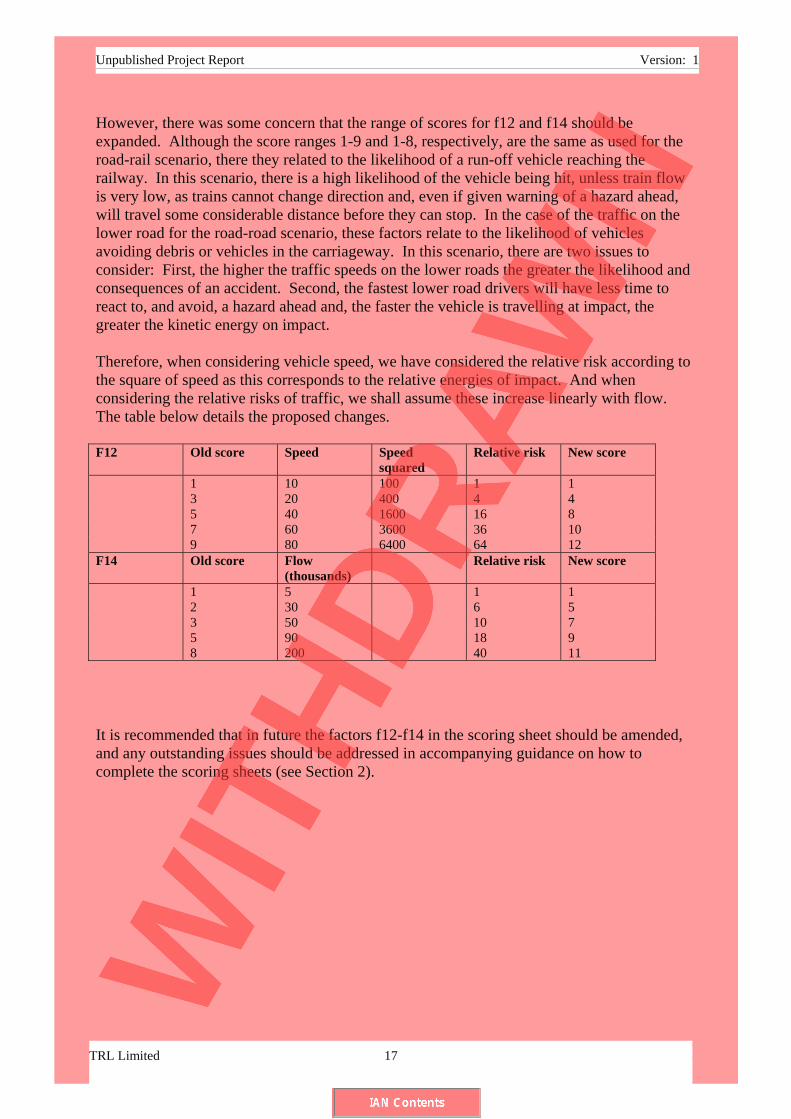
However, there was some concern that the range of scores for f12 and f14 should be expanded. Although the score ranges 1-9 and 1-8, respectively, are the same as used for the road-rail scenario, there they related to the likelihood of a run-off vehicle reaching the railway. In this scenario, there is a high likelihood of the vehicle being hit, unless train flow is very low, as trains cannot change direction and, even if given warning of a hazard ahead, will travel some considerable distance before they can stop. In the case of the traffic on the lower road for the road-road scenario, these factors relate to the likelihood of vehicles avoiding debris or vehicles in the carriageway. In this scenario, there are two issues to consider: First, the higher the traffic speeds on the lower roads the greater the likelihood and consequences of an accident. Second, the fastest lower road drivers will have less time to react to, and avoid, a hazard ahead and, the faster the vehicle is travelling at impact, the greater the kinetic energy on impact. Therefore, when considering vehicle speed, we have considered the relative risk according to the square of speed as this corresponds to the relative energies of impact. And when considering the relative risks of traffic, we shall assume these increase linearly with flow. The table below details the proposed changes. F12 Old score Speed Speed
squared Relative risk New score
1 10 100 1 1 3 20 400 4 4 5 40 1600 16 8 7 60 3600 36 10 9 80 6400 64 12 F14 Old score Flow
(thousands) Relative risk New score
1 5 1 1 2 30 6 5 3 50 10 7 5 90 18 9 8 200 40 11 It is recommended that in future the factors f12-f14 in the scoring sheet should be amended, and any outstanding issues should be addressed in accompanying guidance on how to complete the scoring sheets (see Section 2).
TRL Limited 17

TRL Limited 18 UPR SE/008/04
Unpublished Project Report Version: 1
Appendix A1: Road-road risk ranking scoring sheet used in trial (but since modified) Final version ??? 200?
Road Number:Bridge Number:Carriageway Direction:Date / / .Undertaken by:Factor Options Score Factor Options Score
f1 (See
Note A)
Upper Road Approach Containment Score 1 for Very High Containment (H4a) vehicle restraint system (safety barrier or extended vehicle parapet etc.) of adequate length.Score 6 for Normal Containment (N2) vehicle restraint system of adequate length or compliant with "length of need".Score 12 for sub-standard, defective or damaged or inadequate length approach safety barriers (See Note A)Score 24 for non-existent or significantly sub-standard vehicle restraint system.
f8 Vehicle Parapet Resilience on Upper RoadScore 1 for Very High Contaiment (H4a) vehicle parapet or equivalent Score 2 for a Normal Containment (N2) parapet (of either 1.25 or 1.5 m height) or a sub-standard parapet protected by a normal containment safety barrier Score 3 for a Normal Containment (N2) parapet (of 1 m height) Score 5 for an unprotected 450mm brickwork/masonry vehicle parapet Score 7 for an unprotected 340mm brickwork/masonry vehicle parapet Score11 for an unprotected defective or sub-standard vehicle parapet
f2 Upper Road Alignment (Horizontal & Vertical)Score 1 for full standard sight stopping distance (ssd), full width lanes, straight & constant grade Score 3 for full standard ssd, some curves and undulations but standard horizontal and vertical alignmentsScore 7 for sub-standard ssd or narrow, sub-standard vertical and horizontal alignments
f9 Hard Shoulders, Edge Strips, Road Verges and Footpaths on Upper RoadScore 1 for full width hard shoulder (>3.0m) and 1.5m or greater verge Score 2 for reduced hard shoulder (3.0m<2.5m) or 1m edge strip and 1.5m or greater verge / footpath measured at the narrowest pointScore 3 for narrow hardshoulder (< 2.5m) or edge strip and verge / footpath less than 2m measured at the narrowest point
f3 Sleep-Related Vehicle Accidents on Upper Road Score 1 for no obvious risk factor Score 3 for site on featureless rural road with the minimal services and/or minimal distractions for drivers at the side of the road Score 5 for a bridge on a sweeping right hand bend, sweeping left hand bend with no central reserve safety barriers or a site at the end of a long route (e.g. eastbound of eastern end of M20 or southbound of southern end of M3 etc.) Score 9 for a combination of any of the above factors
f10 (See
Note D)
Carriageway Markings on Upper RoadScore 1 for edge markings, rumble strips and "cats eyes" in accordance with current standardsScore 4 for non-existent, inadequate or obscured markings, worn, buried or over painted rumble strips at a location where considered to be required
f4 Actual Speed Of Approaching Traffic on Upper Road Score 1 for 50 - 60 Score 3 for 61 - 70 Score 6 for > 70
f11 (See
Note E)
Combined Volume of Road Traffic on both Carriageways of Upper RoadScore 1 for < 20,000 vehicles per day (vpd)Score 2 for 20,000 - 40,000 vpdScore 3 for 40,000 - 60,000 vpdScore 5 for 61,000 - 120,000 vpdScore 8 for Over 120,000 vpd
f5 Site Topography on Upper RoadScore 1 if vehicle/debris very unlikely to foul lower road from the bridge approachScore 4 if vehicle/debris unlikely to foul lower road from the bridge approachScore 6 if vehicle/debris can be reasonably expected to foul lower road from the bridge approachScore 8 if vehicle/debris likely to foul lower road from the bridge approachScore 10 if vehicle/debris very likely to foul lower road from the bridge approach
f12 Actual Speed of Traffic on Lower RoadScore 1 for <10mph Score 3 for <30mph Score 5 for <50mphScore 7 for <70mphScore 9 for >70mph
f6 (See
Note B)
Site Specific Hazards Increasing Likelihood of RTA on Upper RoadScore 1 for no obvious hazards Score 3 for minor hazard e.g. an off slip roadScore 5 for a more significant single site specific hazard e.g. an adjacent on slip road or junctionScore 9 for major junction or interchange with multiple direction signs likely to lead to conflicting traffic movements
f13 ( See
Note F)
Site Specific Hazards Increasing Consequences of Event on Lower Road Score 1 for no obvious hazard Score 3 for single site specific hazard Score 5 for multiple site specific hazards
f7 (See
Note C)
Site Specific Hazards Increasing Consequences of Event (between Upper and Lower Road)Score 1 for no obvious hazardsScore 3 for single site specific hazardScore 5 for multiple site specific hazards and/or lower road infrastructure likely to increase severity of an incident.
f14 (See Note E)
Combined Volume of Road Traffic on both Carriageways of Lower RoadScore 1 for < 20,000 vehicles per day (vpd)Score 2 for 20,000 - 40,000 vpdScore 3 for 40,000 - 60,000 vpdScore 5 for 61,000 - 120,000 vpdScore 8 for Over 120,000 vpd
TOTALNote A This factor is to be considered in conjunction with f5 Site Topography to determine the "length of need". Note D If Score = 4 road marking deficiencies to be brought to attention of maintaining authority
Note C
cle Incursion Risk rating Scoring SpreadsheetMotorway and Dual Carriageway Road-Road Vehi
Note B Note E
Note F The hazards cn the lower road leading to increased consequences could include the presence of pedestrians, road and/or verge width (inability to avoid a vehicle blocking the road), poor or no lighting, reduced sight lines (e.g. bends or vegetation) and adjacent land use (e.g. housing, schools), likelihood of queues etc.
The percentage of HGVs on major roads is typically about 10%, consideration should be given to increasing the score for a disproportionately higher level of HGVs on the route.
Site specific hazards increasing the likelihood of an RTA include the following features in proximity to the bridge: interchange, road junction, lay-by, emergency service vehicle recesses, lane drops and no hard shoulder etc. Consideration should be given to increasing the score by two if there is no adequate carriageway lighting.
Site specific hazards increasing the consequences of the event include the following features in proximity to the bridge: exposed gas or chemical pipelines, etc. Road infrastructure likely to increase severity of incident to include bridge piers and abutments and tunnel portals etc within 800m (1/2 mile) of structure.

UPR SE/008/04
Unpublished Project Report Version: 1
Appendix A2: Site photos Example of queuing traffic - M27 over A27
Example of site with queuing, cycle lanes and pedestrian activity – M27 over A27
TRL Limited 19

UPR SE/008/04
Unpublished Project Report Version: 1
Example of site with path through to road below if upper road protection breached – M27 over Allaway Avenue
Example of lower road with sufficient width that obstacles might be avoidable – M27 over Allaway Avenue
TRL Limited 20

UPR SE/008/04
Unpublished Project Report Version: 1
Example of long straight featureless upper road approach – M3 over A339
Example of steep path through to lower road – M3 over A339
TRL Limited 21

UPR SE/008/04
Unpublished Project Report Version: 1
Example of lower road with junction – M3 over A339
Example of lower road with low dark unlit bridge, bend approach – M3 over A339
TRL Limited 22

UPR SE/008/04
Unpublished Project Report Version: 1
Example of site with parallel off-slip leading to lower road roundabout junction – M3 A339
Example of multi-lane dual-carriageway lower road with merging traffic – A303 over A34
TRL Limited 23

UPR SE/008/04
Unpublished Project Report Version: 1
Example of upper road with merging traffic on approach – A303 over A34
Example of bendy approach to unlit bridge over lower road – A303 over A30 slip road
TRL Limited 24

UPR SE/008/04
Unpublished Project Report Version: 1
Appendix B. Background to cost calculations
ESTIMATING REASONABLE EXPENDITURE AT ROAD OVER ROAD SITES
B.1 Introduction This appendix sets out to estimate the amount of expenditure that is reasonable for treating road over road bridge sites on trunk roads, with a view to reducing the risk of accidents and injury at these sites. Two main approaches are explored and the results compared. The methods adopted have been chosen to be compatible with those adopted in a similar assessment of road over rail bridge sites. Both approaches used here (as in the road-rail exercise) are based upon several assumptions and do not attempt to assess absolute levels of risk or precise costs. Figures given are ballpark figures and represent the best available estimates of reasonable expenditure. The two approaches can be considered as ‘top-down’ and ‘bottom-up’. The first takes the estimates for road-rail and assesses how they differ from what is appropriate for the road-road scenario. The second estimates the likely numbers of accidents occurring at all road-road sites and their associated cost. Sections 2 and 3 below detail the two approaches and Section 4 compares the results for each and draws conclusions.
B.2 Top down approach – comparison of road-road with road-rail One way of considering what cost is reasonable and acceptable to spend on a bridge with a particular score would be to use the same basis as has been agreed to justify spend on road-rail bridges. An additional benefit of this would be that all road-over-road and road-over-rail bridges could be assessed in the same exercise. However, we can only do this if both the following statements are valid:
• The relative risks are the same ie one can use the scores on an equal basis • The distribution of scores between sites is the same (ie the appropriate costs per site
are the same).
B.2.1 Can we assume the relative risks are the same?
Factors f1-f11 are the same for the road-road and road-rail (major roads) risk ranking scoring sheets. These relate to the risk of a vehicle leaving a road-road or a road-rail bridge, which is the same. It is the consequences of the two events, as specified in factors f12-f14, that differ
TRL Limited 25

UPR SE/008/04
Unpublished Project Report Version: 1
and we need to examine the relative scenarios and scores more closely to assess the comparative risks. We have tried to assess relative risk and whether the comparative scores are realistic.
Road-rail Road-road Road-rail Road-road Factors/scores maximum maximum Mean mean
f12 24 12 12 8 f13 11 9 5 5 f14 12 11 5 7
Sum of f12-f14 47 32 22 20 Difference 15 2
We need to assess whether the actual difference in risk for the two types of consequences is reflected by the difference in the scores. A difference of 2 in score implies a doubling of risk. Therefore a difference of 15 implies 2(15/2) =181 times the risk for maximum road-rail compared with road-road; correspondingly, a difference of 2 for the mean scores implies 2(2/2) = twice the risk. However, in practice, it is not possible for a bridge to score the maximum for all factors and so it is more realistic to look at approximate mean value scenarios. Very rough and ready comparisons of the effects of mean consequences have been carried out to try and judge whether the relative difference in risk is realistic. F12: Line speed and alignment versus lower road traffic speeds Assuming a mean rail speed of 80mph and a train mass of 100tons; compare with road speed of 50mph and assume vehicle mass 10tons. Then kinetic energy (=one half of the mass times the velocity squared) of rail accident impact would be (100/10)x(80/50)2=26 times that of road accident. F13: Type of rail traffic versus lower road site specific hazards Suppose accident has 1 train with 4 carriages, each carrying 10 people then possibility of 40 casualties. Suppose road accident has 1 HGV, 2 cars and 4 casualties. Therefore, risk on rail could be 10 times road. Although we have not attempted to quantify the effect, we recognise that trains cannot slow or stop as easily as cars and rescue is usually harder and disruption greater for rail accidents. F14: Volume of trains versus traffic on lower road Suppose a two way mean of 18 trains per (24 hour) day. If each train has 4 carriages, each 25m long, then exposure is 1800m per day. Suppose mean road traffic is 50,000 per day. However, if we assume that most lower roads are only two lane roads then, it is likely that an accident would affect both carriageways as vehicles are not likely to be able to take avoiding action (especially when HGVs involved), If the mean vehicle length is 4m, then total exposure is 200,000m per day. Therefore, risk on road could be 111 times that on rail.
TRL Limited 26

UPR SE/008/04
Unpublished Project Report Version: 1
Therefore, for all three factors, the relative risks are estimated as (26x10)/111=2.3 times greater for rail than road. This represents a difference in scores of about 2. These calculations involve a very high degree of uncertainty and the best that can be concluded is that rail provides much higher risks than road in some factors, and vice versa in others. There is no clear evidence that the differences in scores for the road-rail and the road-road ranking tool are unreasonable. Overall the relative risks might be of the same order.
B.2.2 Are the distributions of scores between sites the same? Considering first the spread of the scores for factors f12-f14 only, see Figures B1 and B2 below, for road-rail and road-road scores, respectively. The graphs are quite different but this is not surprising because the factors individually reflect different types of consequences. Figure B1
%distribution of HA road-rail scores for f12-f14
0.0%
50.0%
100.0%
score
% o
f brid
ges
f12
f13
f14
f12 7.6% 29.8% 28.2% 23.3% 6.5% 4.7%
f13 7.6% 62.6% 29.3% 0.5% 0.0% 0.0%
f14 9.3% 14.5% 52.1% 24.1% 0.0% 0.0%
1-3 4-6 7-9 10-12 16-18 19-21
Figure B2
%distribution of HA road-road scores for f12-f14
0.0%
20.0%
40.0%
60.0%
score
% o
f brid
ges
f12
f13
f14
f12 0.0% 0.0% 9.1% 9.1% 36.4% 45.5%
f13 18.2% 54.5% 27.3% 0.0% 0.0% 0.0%
f14 27.3% 0.0% 18.2% 45.5% 9.1% 0.0%
1-2 3-4 5-6 7-8 9-10 11-12
It is more reasonable to compare the difference in the overall distributions for consequences. Consider the distribution of total scores for the 752 road-rail sites and compare with those for the 11 road-road sites (Figure 3). The overall distributions are not obviously dissimilar and support the conclusion that there is no strong evidence that the scoring is unreasonable.
TRL Limited 27

UPR SE/008/04
Unpublished Project Report Version: 1
Although the road-road distribution is based on only 11 sites, the figure does suggest that the mean road-road scores are likely to be similar to the mean road-rail scores. The maximum road-rail score is 15 higher than the maximum road-road score. However, in practice sites cannot score the maximum and although the highest road-rail scores are greater than the highest road-road ones, with only 11 sites trialled we do not know whether the distribution of all sites will support this. Figure B3
HA Road-rail risk ranking scores
0.0%
50.0%
Score% o
f brid
ges
road rail
road road
road rail 4.8% 18.6% 35.4% 26.2% 11.6% 2.9% 0.3% 0.3%
road road 0.0% 18.2% 45.5% 36.4% 0.0% 0.0% 0.0% 0.0%
31-40 41-50 51-60 61-70 71-80 81-90 91- 101-
Another approach to finding evidence of similarity between the risk distributions of the two types of site is to assess comparative exposure to the consequences of an incident. One way to look at comparative exposure is to estimate the proportion of time that vehicles on the lower road or the rail track might be vulnerable to collision. In each case the time during which each vehicle is exposed to direct side impact is very small; the main exposure is the time during which the vehicle on the lower road/track is likely to be unable to avoid running into an obstacle ahead of it. Some very rough comparisons are suggested in the Table below. High traffic Average traffic Low traffic
RAIL frequency 10/hr 3/hr 1/hr Time passing site 1-2 sec 1 sec 1 sec
Time taken to stop (including signal
change)
5 min 5 min 5 min
Time exposed 50min/hr (>80%) 15 min/hr (25%) 5 min/hr (8%)
ROAD flows/speed 2000/hr : 70mph 500/hr : 60mph 200/hr : 50mph Time passing site 4 sec/min 1 sec /min 0.4 sec/min
Time between vehicles 2 sec 7.2 sec 18 sec Time taken to reduce
speed to 30mph potential impact
3 sec 2.6 sec 1.5 sec
Time exposed 60min/hr (100%) 22 min/hr (37%) 5 min/hr (9%)
TRL Limited 28

UPR SE/008/04
Unpublished Project Report Version: 1
The proportionate exposure times are of the same order for the road and rail examples. The number of people exposed might appear to be higher in the rail case, but in practice there are very few rail accidents where more than 1 or 2 people on the train are killed, and the worst situation (eg Selby) is likely to involve around 10 fatalities. In comparison, 5-10 people can be killed in road accidents if a coach or minibus is involved, or a multiple shunt occurs; several people might also be vulnerable if there was, for example, a queue at a bus stop on the lower road. Overall there does not seem to be a strong argument for assuming a substantial difference between the distribution of scores likely to be found in the road over road and road over rail situations on trunk roads. Therefore, it would seem reasonable that we consider road-rail and road-road site ranking scores together and prioritise them accordingly. It would also then seem reasonable to assume that the appropriate costs for mitigation could be the same.
B.2.3 Estimating expenditure assuming similar distributions of scores
One can see that according to Figure B4, which was developed for all road-rail sites and not just trunk roads, that very few trunk road-rail and no road-road sites would warrant any expenditure on that basis. However, the Highways Agency have their own lower criteria for justifying spend. It is also likely that some work would be justifiable if integrated into planned maintenance programmes. Figure B4
If we assume that HA road over road expenditure is calculated on the same basis as the Agency has estimated appropriate expenditure for their road over rail sites, we can now estimate reasonable road-road expenditure, based on the number of bridges involved and the costs to be allowed for in each case. Of the overall budget of £32m estimated as reasonable for road-rail bridges, the sum directly associated with valuation of life and injuries is about £15m; the remainder is associated with disruption cost and accident investigation. These latter costs are not as relevant to the road over road situation as both are subsumed within the road injury accident cost. The road-rail
TRL Limited 29

UPR SE/008/04
Unpublished Project Report Version: 1
case is different as the rail operator has to pay substantial financial penalties to train operators if tracks are closed and accident investigation costs are likely to be much higher. Road accident costs do include a contribution for police time and for clearing the scene of an accident. There are some 500 road over rail overbridges on the trunk road network, compared with 6000 bridges on other roads plus some 2000 parallel sites, that made up the total population of sites on which the £15m budget due to accident cost alone was based. Thus the part of this budget appropriate to trunk roads is about £880k. But generally, within the overall population of sites, risk at trunk road sites was less than that at other sites, so total budget justified for accident savings would be less than this. Very few trunk road-road-rail sites were considered to be ranked in the top 10-20% of the riskiest sites, and therefore warrant any substantial expenditure. In comparison there are about 2000 road over road sites on trunk roads, so at the same level of risk, a consistent budget for these sites would be twice that made available by the Agency for road over rail bridges (four times as many sites but with total budget to cover accident costs being half that for all rail site costs). Again if it could be assumed that the risk distribution among road over road sites was similar to that among road over rail sites, the expenditure per site would be about half that for road over rail sites.
B.3 Bottom-up approach – estimating size of road-road problem and appropriate budget
The appropriate level of spend for all road-rail sites was calculated by estimating the size of the problem and assessing the likely savings if no such accidents occurred. We have attempted a similar exercise for the road over road accident scenario here. In the 3 year period 2000-2002, there were 13,952 accidents where at least one vehicle left the carriageway to the nearside2 (21% of all accidents on trunk roads)3. Of these 5,927 occurred on M and A(M) roads while 8,025 occurred on A roads. Roughly half of these are single vehicles leaving the road, while the remainder result from multiple vehicle injuries. If we assume that a vehicle is just as likely to leave the road at a bridge as anywhere else and that the zone of influence around a bridge (including the approach) is 100m on each side of the road (i.e. 200m per bridge), then we can calculate the total percentage of the network that lie within zones of influence. However, to estimate the number of accidents with vehicles leaving the road at bridge sites it is assumed that all trunk road overbridges have 30m of safety barrier, and that there is a possibility of reaching lower road from leaving any where within 100m of bridge, then length at risk is 70m (but covering the length from 100m to 30m distance from the bridge). This length is at risk in each direction of travel. Note this ignores vehicle leaving to the offside, and the short length of barrier provided to protect against this. 2 Includes vehicles that just left to the nearside and those that left to the nearside and rebounded. 3 All figures based on the 1999 trunk network.
TRL Limited 30

UPR SE/008/04
Unpublished Project Report Version: 1
Next, if we assume that in 10%4 of these accidents, say, a vehicle reached the road below, we can use these numbers to calculate the likely costs of such accidents. Taking the value of preventing an accident given by DfT (2002) as £57,760 we can estimate the total cost of saving accidents as shown in the table below.
Upper road M and A(M) A trunk
No of road-road bridges 1,112 894
Length of road (km) 2,900 7,340
2x length of road for two directions (km)
5,800 14,680
% of trunk road in 2x70m zone 2.68% (=1,112*0.07/2,900)
0.85%
Accidents per year where a vehicle left to nearside
1,976 2,675
Expected no of accidents where vehicle left nearside at a bridge per yr
53 (=1,976*2.68%) 22.8
Expected no of accidents per year where vehicle left nearside and reached lower road
5.3 (=53/10) 2.3
Cost of accidents above (considering upper road only)
£306,000 (=5.3*£57,760)
£132,000
No of accidents per year per bridge 0.0048 0.0026
Therefore the total estimated cost of saving accidents where a vehicle leaves an upper road and reaches a lower road is about £440,000. Following the approach taken in calculating the road-rail value of saving casualties a capital multiplier of 17.47 was applied (to reflect a 20 year lifetime, a 2.03% growth in VOSL and a 3.50% discount rate). If the same was done here the final total value of saving all casualties is estimated as £7.7million. Suppose only 10% of sites were treated that would imply an average spend of about £39,000 per site.
4 There was an assumption used in an HA report – ‘To review the Standards for the provision of nearside safety fences on major roads’ that 25% of vehicles reached the railway tracks, but in that case only single vehicles leaving the road were considered. This figure seems high as we are assuming that only vehicles from multi-vehicle crashes which hit the barrier at high angles but reduced energy might reach the road below for the first 30m in advance of the bridge.
TRL Limited 31

UPR SE/008/04
Unpublished Project Report Version: 1
B.4 Comparing estimates of accidents saved using the two approaches For road over rail, estimate of value of accidents saved was £1.72m per equivalent fatality (ie fatality value expanded to include proportionate cost of non fatal injuries). An average of 0.1 equivalent rail occupant fatalities and 0.4 equivalent road occupant fatalities were assumed, giving a total cost per year of £860k. The HA WG report shows there are 2095 single vehicles leaving the road on trunk roads out of a total of 11107 single-vehicle accidents on all roads (ie 19%). If the frequency of road over rail sites in both groups and the risk of leaving the road and reaching the railway were similar, this would suggest the cost associated with the trunk road bridge sites would be £162k. However, in general, the risk ranking of road over rail sites suggested that risk at trunk road sites is substantially lower than that at non-trunk road sites. There are estimated to be 2000 road over road bridge sites compared with 500 road over rail sites so that if risks were similar and a figure of say £100k was taken for cost of accidents at road over rail trunk road sites, the cost of accidents at road over road sites might be £400k. From the estimates above based on numbers of vehicles leaving the road, the value of injury accidents occurring at road over road sites is £440k if only 10% reach the lower road. These calculations suggest estimates of the total cost of accidents at road-road sites to be of the similar order from the two approaches. However, the two estimates use different costs per accident, so the implied number of accidents per site from the two calculations is different. For the road-rail estimates, a cost per equivalent fatality has been used of £1.72m. This is because the data available were based on numbers of fatalities, not numbers of accidents, and a ratio of other casualty cost to fatality cost of 1.5 was used together with a value of life saved on £1.145m. There were 0.5 equivalent fatalities per year giving a cost of £0.86m per year nationally for these sites. If this valuation was rated at £57,760 per accident, as in the road-road calculations, it would be equivalent to 14.9 accidents. With 8500 bridges this is equivalent to 0.0026 accidents per site per year. If this estimate is reduced, because of the assumed lower than average risk at HA sites, by 100/162 as in the accident cost calculation above, the number of accidents per road-rail site per year is 0.0016. In comparison, for the road-road calculations, the estimated number of accidents per site from Table 1 is (5.3+2.3)/(1112+894) = 0.0038. This factor of around 2 is also apparent if the estimated budgets from the two approaches are compared directly. From the comparison with road-rail in section 2, it is suggested that a budget of about twice that for road-rail is appropriate. On a proportionate basis, the 500 HA overbridges out of the national total of 8500 relevant sites, would warrant 5.9% of the £32m national budget ie £1.9m. Thus twice that budget would be £3.8m. In comparison working directly from the run off accident rates assumed in section B3, a budget of £7.7m is estimated.
TRL Limited 32

UPR SE/008/04
Unpublished Project Report Version: 1
The uncertainties in both calculations are such that it is not obvious that either are preferable. However given that a national budget has already been agreed for road-rail sites, and HA will be making their own provision for their share of these sites, it is suggested that the best approach is to target a budget for road-road sites as a proportion of the planned HA expenditure on road-rail sites.
B.5 Conclusions
In summary, there are a large number of uncertainties in these estimates and only tentative conclusions can be drawn, but we propose that:
• at the level of accuracy at which they have been developed, the road-road risk ranking tool can be used in parallel with the road-rail risk ranking tool and the results assessed on a similar basis
• The Agency should consider a budget for treating road over road sites of the order of
twice that planned for road-rail sites on trunk roads.
TRL Limited 33

UPR SE/008/04
Unpublished Project Report Version: 1
Appendix C. ROAD OVER ROAD - EXTENSION TO HA RISK ASSESSMENT FRAMEWORK
The road over road risk ranking tool gives a simple means of reflecting the general level of risk at sites, but it does not follow the traditional approach of estimating risk through combining multiplicatively the probabilities associated with the individual elements of risk. For road over road, the probability of injuries occurring at a site is: The probability of vehicles leaving the road at the site multiplied by the probability of these vehicles reaching the lower road multiplied by the probability of the vehicles that reach the lower road being involved in injury accidents. The main factors that might influence these probabilities are included in the 15 factor ranking tool. A more detailed assessment could take account of more factors such as those tabulated below (tables C1-3), and weigh up more carefully how to combine these together into an overall probability for that element of risk. These probabilities can be combined more directly into an estimate of actual risk at the site, as shown in table C4. If this approach is followed, it would be possible to compare the resulting risk with that in other parts of the network. The confidence that can be associated with this estimate depends heavily on the confidence limits of the three probabilities. Table C1 Risk of an incident leading to vehicle leaving the carriageway
Does alignment present an extra hazard (bend or brow)? What is likely effect on risk?
Is there likely to be a problem arising from inappropriate overtaking within zone of influence? Effect on risk?
Is some traffic likely to be travelling at inappropriately high speeds for the conditions/layout constraints (even if within the speed limit)? What extra risk will this produce?
Is approach road downhill? If so, what gradient? Is there any provision for stopping vehicle losing control?
Is the road narrow in the vicinity of the road-road bridge?
Are pedestrians and cyclists likely to be in conflict with vehicles at the site?
Are there any layout hazards (junctions, bus stops, accesses, lay-bys etc) within the zone of influence? What is effect on risk? Can these be re-sited?
What would be effect on risk of (1) adding more warning signs, (2) extra road markings, (3) improved road surface grip?
What evidence is there of vehicles having (1) left the road within the influence zone (2) reached the road below? Seek evidence from barrier and parapet damage, skid markings or local knowledge.
TRL Limited 34

UPR SE/008/04
Unpublished Project Report Version: 1
Table C2 Risk of vehicle not being restrained at edge of carriageway by parapet or safety fence
What is standard of parapet (or description if hybrid type)?
Are there any deficiencies in its condition?
Are there marks where it has been hit by vehicles?
Is there a safety fence on the approach to the parapet? If so what type, what standard, and how long is it?
Are there any deficiencies in its condition?
Are there marks where it has been hit by vehicles?
Where there is no safety fence, is there a solid obstacle (wall, trees, fence)? If so, describe it.
What problems might there be in fitting a safety fence?
Table C3 Risk of vehicle not being contained by obstacles outside carriageway before it reaches the lower road (to be completed separately for each length with a different restraint type)
Is slope of ground downwards, upwards, flat? What is average slope over distance to the road (in line of vehicle path)? Are there any major changes in this slope? Are there ditches or mounds in path of vehicle? What is total depth or height of ditches or mounds? What proportion of the potential path is affected by these? Are there obstacles in the path of the vehicle? What proportion of the potential run-off path is blocked (ie the density of obstacles such as trees and a solid wall would be 100%, for example)? The numbers in Table C4 are purely indicative of the process proposed. At a simple level, the probabilities required could simply be estimated from the factor scores in the ranking sheet. But these scores were derived to fit a scaling where each increase of two points reflected a doubling of risk, so the figures on the risk ranking sheet would need to be converted back to absolute risks. More attention to the detail of the site could be taken using data suggested in Tables C1 to 3, and this could be used to improve the estimate of these probabilities. But to be consistent with the wider risk assessment methodology proposed and the models being developed for errant vehicle travel it would be better to develop a scale for these probabilities that better reflected these values being used in these models. It is suggested that this is done once the form of the models for use with the road restraint standard is finalised.
TRL Limited 35

UPR SE/008/04
Unpublished Project Report Version: 1
Table C4: Example of Risk Estimation -Case A - Motorway with safety barrier on central reserve
Risk factor Average site value
Proportion to average
Estimate for site
PROBABILITY P1 OF VEHICLE LEAVING CARRIAGEWAY Vehicles leaving nearside 0.327 Accident frequency for this road - Incident evidence in vicinity of site - Potential effect of local hazards - ESTIMATE FOR SITE - nearside 0.327 0.327 PROBABILITY P2 OF NOT BEING PREVENTED FROM REACHING LOWER ROAD
Length of influence zone unprotected (a) 70m Unprotected Section on nearside prior to parapet
Probability of vehicles not being contained by topography (b)
0.2
Length of influence zone to which applies (c) 30m Probability of breaching safety fence (d) 0.1
Safety fence on nearside prior to parapet Probability of vehicles not being contained by
topography after breaching fence (e) 0.4
Length of parapet (f) 80m Probability of breaching parapet (g) 0.05
Parapet
Probability of vehicles not being contained by topography after breaching parapet (h)
0.9
Length of influence zone to which applies (j) 10m Probability of opposing vehicles breaching safety fence (k)
0.05 Safety fence on nearside after parapet
Probability of vehicles not being contained by topography after breaching fence (l)
0.9
ESTIMATE FOR SITE of vehicle not being contained Calculate as (a.b + c.d.e + f.g.h )/(a+c+f) for nearside,
0.107
PROBABILITY P3 OF INJURIES TO THIRD PARTIES INCLUDING PASSENGERS ON LOWER ROAD
ESTIMATE OF EQUIVALENT FATALITIES PROBABILITY P4 OF INJURIES TO ROAD VEHICLE PASSENGERS IN ERRANT VEHICLE
ESTIMATE OF EQUIVALENT FATALITIES TOTAL RISK ESTIMATE FOR SITE R POTENTIAL MEASURES AND THEIR EFFECTS Lengthen safety barrier on approach
Multiplier a from 70 to 0, b from 30 to 100 P2 = 0.045 0.42R
Improve topography Multiplier b from 0.2 to 0.1 P2 = 0.068 0.64R
Improve parapet containment
Multiplier g from 0.05 to 0.01
P2 = 0.091 0.85R
TRL Limited 36