interim financial report c
TRANSCRIPT

CAPGEMINI JUNE 30, 2021
INTERIM FINANCIAL REPORT
CONSOLIDATED FINANCIAL STATEMENTS

CAPGEMINI JUNE 30, 2021 2
CONTENTS FINANCIAL HIGHLIGHTS .......................................................................................................................................................... 3 STATUTORY AUDITORS' REPORT ON THE 2021 INTERIM FINANCIAL INFORMATION ..................................................... 4 INTERIM FINANCIAL REVIEW................................................................................................................................................... 5 CONDENSED INTERIM CONSOLIDATED FINANCIAL STATEMENTS FOR THE HALF-YEAR ENDED JUNE 30, 2021 .... 10 DECLARATION BY THE PERSON RESPONSIBLE FOR THE INTERIM FINANCIAL REPORT ........................................... 28

CAPGEMINI JUNE 30, 2021 3
FINANCIAL HIGHLIGHTS
Consolidated financial statements
(1) First-half 2017 figures have been restated for the retrospective application of IFRS 15, Revenue from contracts with customers, effective starting January 1, 2018.
* Operating margin, normalized earnings per share, net debt / net cash and cash equivalents and organic free cash flow, alternative performance measures monitored by the Group, are defined in Note 3 - Alternative performance measures, to the condensed interim consolidated financial statements for the half-year ended June 30, 2021. ** First-half 2019 data reflects the application of IFRS 16, Leases, using the modified retrospective method. *** First-half 2020 data reflects the consolidation of Altran from April 1, 2020.
in millions of eurosFirst-half 2017
restated (1)First-half
2018 First-half
2019 **First-half
2020 ***First-half
2021Revenues 6,280 6,467 7,007 7,581 8,711
Operating expenses (5,608) (5,760) (6,210) (6,763) (7,669)
Operating margin * 672 707 797 818 1,042
% of revenues 10.7% 10.9% 11.4% 10.8% 12.0%
Operating profit 538 521 658 577 812
% of revenues 8.6% 8.0% 9.4% 7.6% 9.3%
Profit for the period attributable to owners of the Company 375 314 388 311 443
% of revenues 6.0% 4.8% 5.5% 4.1% 5.2%
Earnings per share
Average number of shares outstanding during the period 168,548,476 167,323,709 165,843,357 167,646,025 168,453,627
Basic earnings per share (in euros) 2.23 1.88 2.34 1.86 2.63
Normalized earnings per share * (in euros) 2.81 2.64 2.90 2.80 3.58
GOODWILL AT JUNE 30 6,939 7,323 7,591 10,316 10,096EQUITY ATTRIBUTABLE TO OWNERS OF THE COMPANY AT JUNE 30 6,845 6,992 7,466 5,922 6,681
(NET DEBT) / NET CASH AND CASH EQUIVALENTS * AT JUNE 30 (1,929) (2,192) (1,621) (6,008) (4,826)
ORGANIC FREE CASH FLOW * AT JUNE 30 64 11 90 106 429
Average number of employees 195,059 201,318 213,470 239,086 276,700
Number of employees at June 30 196,376 205,574 216,801 265,073 289,501

CAPGEMINI JUNE 30, 2021 4
STATUTORY AUDITORS' REPORT ON THE 2021 INTERIM FINANCIAL INFORMATION Statutory auditors’ review report on the half-yearly financial information (For the period from January 1, 2021 to June 30, 2021) This is a free translation into English of the statutory auditors’ review report on the half-year financial information issued in French and is provided solely for the convenience
of English-speaking users. This report includes information relating to the specific verification of information given in the Group’s half-year management report. This report
should be read in conjunction with, and construed in accordance with, French law and professional standards applicable in France. To the Shareholders CAPGEMINI SE 11 rue de Tilsitt 75017 Paris In compliance with the assignment entrusted to us by Annual general meeting and in accordance with the requirements of article L. 451-1-2 III of the French Monetary and Financial Code (“Code monétaire et financier”), we hereby report to you on:
- the review of the accompanying condensed half-year consolidated financial statements of Capgemini SE, for the period from January 1, 2021 to June 30, 2021;
- the verification of the information presented in the half-year management report. Due to the global crisis related to the Covid-19 pandemic, the condensed half-year consolidated financial statements of this period have been prepared and reviewed under specific conditions. Indeed, this crisis and the exceptional measures taken in the context of the state of sanitary emergency have had numerous consequences for companies, particularly on their operations and their financing, and have led to greater uncertainties on their future prospects. Those measures, such as travel restrictions and remote working, have also had an impact on the companies' internal organization and the performance of our procedures. These condensed half-year consolidated financial statements are the responsibility of the Board of Directors. Our role is to express a conclusion on these financial statements based on our review. I - Conclusion on the financial statements We conducted our review in accordance with professional standards applicable in France. A review of interim financial information consists of making inquiries, primarily of persons responsible for financial and accounting matters, and applying analytical and other review procedures. A review is substantially less in scope than an audit conducted in accordance with professional standards applicable in France and consequently does not enable us to obtain assurance that we would become aware of all significant matters that might be identified in an audit. Accordingly, we do not express an audit opinion. Based on our review, nothing has come to our attention that causes us to believe that the accompanying condensed half-year consolidated financial statements are not prepared, in all material respects, in accordance with IAS 34- standard of the IFRSs as adopted by the European Union applicable to interim financial information. II - Specific verification We have also verified the information presented in the half-year management report on the condensed half-year consolidated financial statements subject to our review. We have no matters to report as to its fair presentation and consistency with the condensed half-year consolidated financial statements.
French original signed by
Neuilly-sur-Seine and Courbevoie, July 30, 2021
The Statutory Auditors
PricewaterhouseCoopers Audit
Mazars
Richard Béjot Itto El Hariri Dominique Muller Anne-Laure Rousselou

CAPGEMINI JUNE 30, 2021 5
INTERIM FINANCIAL REVIEW FIRST-HALF 2021 HIGHLIGHTS After a stronger than expected first quarter, Capgemini continued to accelerate, bringing the activity in the second quarter well above pre-crisis level. This strong growth momentum demonstrates the relevance of the Group's strategy and positioning which combines a portfolio of innovative offerings with investments in technology and talent to meet its clients’ digital transformation needs which are even more acute further to the global pandemic. Capgemini’s 290,000 team members are fully mobilized in a context that remains challenging in several regions. The Group continues to closely monitor the health situation, and to implement all necessary measures to ensure that its teams can deliver services in the best possible set-up – in terms of protection and assistance to its employees and their families, as well as hybrid organization and working methods. Capgemini delivered an excellent 2021 first-half performance with: • revenues of €8.7 billion, up +17.9% year-on-year at constant exchange rates; • an operating margin rate up +1.2 points to 12.0%; • organic free cash flow up €323 million to €429 million. In view of this strong growth momentum, the Group has raised all its targets for the fiscal year (see “Outlook for fiscal year 2021” below). New medium-term financial ambitions On March 31, the Group organized a virtual Capital Markets Day for financial analysts and institutional investors. Aiman Ezzat, Chief Executive Officer and Carole Ferrand, Chief Financial Officer, along with other members of the Group Executive Committee, outlined Capgemini’s strategic, operational and financial ambitions for 2025. The Group's Environmental, Social and Governance (ESG) priorities were also presented. The Group's sustainable growth strategy is focused on delivering increased value to clients with an industry-driven approach. It will leverage the accelerating markets of Intelligent Industry (focused on Intelligent Products & Systems, Intelligent Operations and Intelligent Platforms & Ecosystems), and Customer First (focused on the relationship between Capgemini’s clients and their customers). In addition, the rapid adoption of Cloud and Data/Artificial Intelligence will act as a significant growth driver across the Group’s entire portfolio of offerings. Finally, Capgemini will maintain its strict execution discipline and aims to expand its operating margin. The Group has therefore set the following new financial ambitions for the medium-term: Achieve annual revenue growth of +7% to +9% at constant currency on average through 2025; Reach an operating margin of 14% by 2025.
ACTIVITY TRENDS OVER THE HALF-YEAR
Change in revenues vs. 2020
Q1 2021 Q2 2021 H1 2021
Growth at constant Group scope and exchange rates +1.7% +12.9% +7.1% Impact of changes in Group scope +22.5 pts -0.5pt +10.8 pts
Growth at constant exchange rates +24.2% +12.4% +17.9%
Since the Group activity slump in Q2 2020 with the first wave of the pandemic, year-on-year growth rates have accelerated steadily each quarter. From Q1 2021, all Group regions benefited from strengthened underlying organic momentum compared with Q4 2020, enabling the Group to report overall organic growth of +1.7%. Organic growth further improved in Q2 on Q1 for each region, reaching 12.9% at Group level. Q2 activity levels therefore reflect the acceleration observed in the half-year across all regions, with France in particular reporting organic growth in excess of 10%. This acceleration is also visible across all Group sectors, but especially in those heavily hit by the health crisis: Consumer Goods, Services (including transportation, hospitality and catering) and Manufacturing. The latter sector made a strong recovery, returning in Q2 to an activity level comparable to the pre-crisis period, as did the Consumer Goods sector in Q1. In addition, the impact of changes in Group scope varied between the quarters. In Q1 2021, changes in Group scope had a significant impact (+22.5 points at Group level), mainly due to the acquisition of Altran, consolidated from April 1, 2020. The impact was far more limited in the second quarter (-0.5 points at Group level, due to the divestiture of Odigo on

CAPGEMINI JUNE 30, 2021 6
December 30, 2020), and constant currency growth rates are far more representative of underlying organic trends (i.e. at constant Group scope and exchange rates). At constant exchange rates, the Rest of Europe (31% of Group revenues), United Kingdom and Ireland (12% of Group revenues) and Asia-Pacific and Latin America (7% of Group revenues) regions therefore reported growth rates significantly above 10% in Q2, while France (21% of Group revenues) and North America (29% of Group revenues) reported growth close to 10%. These regional trends were fueled by relatively uniform global sector trends. At constant exchange rates, growth is well above 10% in Consumer Goods (13% of Group revenues), Manufacturing (25% of Group revenues and also including Life Sciences), Services (5% of Group revenues) and the Public Sector (14% of Group revenues). Financial Services (22% of Group revenues) and the TMT sector (Telecom, Media and Technology, 13% of Group revenues) came next. Only the momentum of the Energy & Utilities sector (8% of Group revenues) fell significantly short of that of the rest of the Group. FINANCIAL PERFORMANCE Capgemini generated revenues of €8,711 million in H1 2021. After a Q1 2021 already marked by higher than expected growth, the Group accelerated strongly in the second quarter. Organic growth (i.e. adjusted for Group scope and exchange rate impacts) was +12.9%, compared with +1.7% in the previous quarter, with Q2 activity significantly exceeding pre-crisis levels. For the whole of H1, Group growth reached +14.9% on a reported basis, +17.9% at constant exchange rates and +7.1% organically. Digital and Cloud services primarily underpinned this performance, accounting for around two-thirds of activity, excluding Altran, and recording strong double-digit year-on-year growth at constant exchange rates in the first half. Bookings totaled €9,128 million in the first six months of 2021, a +20% increase at constant exchange rates year-on-year. The book-to-bill ratio reached 105% in H1 and 111% in Q2, demonstrating the Group's good business momentum. The operating margin is €1,042 million, or 12.0% of revenues, an increase of 28% or 120 basis points year-on-year. Other operating income and expenses represent a net expense of €230 million, down €11million year-on-year. The decrease in restructuring costs was partially offset by the amortization of intangible assets relating to the acquisition of Altran, as well as by the impact of a higher Capgemini share price on the long-term share-based compensation expense. Capgemini’s operating profit is therefore up +41% at €812 million, or 9.3% of revenues. The net financial expense is €85 million, an increase of €21 million on H1 2020. This increase is mainly due to the full effect in H1 2021 of the coupons on the bond issue performed in Q2 2020 as part of the Altran acquisition. The income tax expense is €282 million and includes exceptional tax expenses of €56 million, compared with €26 million last year. These tax expenses relate to (i) the transitional impact of the 2017 US tax reform and (ii) the consequence of a 2021 change in a local tax regulation on legal restructurings carried out in 2016. Adjusted for these expenses, the effective tax rate is 31.0%, compared with 34.6% in H1 2020 and 33.0% in FY 2020. Net profit (Group share) is up 42% year-on-year at €443 million for the first six months of 2021. Basic earnings per share rose by 42% year-on-year to €2.63, while normalized earnings per share increased 28% to €3.58. Normalized earnings per share adjusted for exceptional tax expenses rose 32% to €3.91. The Group generated organic free cash flow of €429 million, compared with €106 million in the same period in 2020. Return to shareholders totaled €329 million in H1 2021, corresponding to the dividend payment (€1.95 per share). Furthermore, the Group disbursed a net amount of €70 million on external growth transactions during the period. HEADCOUNT At June 30, 2021, the Group’s total headcount stood at 289,500, up +9.2% year-on-year, with 163,200 employees in offshore centers (56% of the total Group headcount, up 3 points on June 30, 2020).

CAPGEMINI JUNE 30, 2021 7
OPERATIONS BY REGION
Revenues
Year-on-year growth
Operating margin rate
H1 2021
(in millions of euros)
Reported
At constant
exchange rates H1 2020
H1 2021
North America 2,478 +3.3% +12.3% 14.4% 15.7% United Kingdom and Ireland 1,018 +19.3% +18.5% 14.3% 17.6% France 1,872 +16.2% +16.2% 6.9% 7.5% Rest of Europe 2,710 +24.8% +23.7% 10.2% 11.5% Asia-Pacific and Latin America 633 +16.4% +21.3% 10.5% 12.5%
TOTAL 8,711 +14.9% +17.9% 10.8% 12.0%
All Group regions reported double-digit growth rates year-on-year at constant exchange rates. This performance takes into account the impact of Altran’s consolidation, which is nonetheless limited to Q1 as explained above. Revenues in North America therefore grew by +12.3% at constant exchange rates, driven mainly by the underlying organic momentum of the Consumer Goods and Manufacturing sectors. The operating margin rate improved further to 15.7%, from 14.4% in the first half of 2020. Momentum was even stronger in the United Kingdom and Ireland region, with activity growth of +18.5% at constant exchange rates. Public Sector and Financial Services organic growth remained buoyant in the half-year, with Consumer Goods accelerating steadily. The operating margin reached a record level of 17.6%, compared with 14.3% a year earlier. France revenues grew by +16.2% at constant exchange rates. The Public Sector and Consumer Goods contributed the most to organic growth during the period, while the Manufacturing sector closed the period on a strong momentum. The operating margin improved by 60 basis points year-on-year to 7.5%. The Rest of Europe region grew +23.7% at constant exchange rates. The Manufacturing, Consumer Goods and TMT sectors reported the strongest organic momentum. The operating margin increased significantly to 11.5% from 10.2% one year ago. Finally, the Asia-Pacific and Latin America region reported revenue growth of +21.3% at constant exchange rates. While the Q1 impact of Altran’s consolidation is far more limited in this region, it nonetheless benefited from the acquisition of the Australian company RXP, completed on March 26, 2021. Organically, the Financial Services, Consumer Goods, TMT and Manufacturing sectors all reported double-digit growth. The region reported a 2-point increase in its operating margin to 12.5%, from 10.5% in H1 2020. OPERATIONS BY BUSINESS
When determining activity trends by business and in accordance with internal operating performance measures, growth at constant exchange rates is calculated based on total revenues, i.e. before elimination of inter-business billing. The Group considers this to be more representative of activity levels by business. As its businesses change, an increasing number of contracts require a range of business expertise for delivery, leading to a rise in inter-business flows.
Total revenues
Year-on-year growth
H1 2021
(% of Group revenues)
At constant exchange rates in total revenues of the business
Strategy & Transformation 7% +27.3%
Applications & Technology 62% +10.1%
Operations & Engineering 31% +33.6%
For the whole of H1 and at constant exchange rates: Strategy & Transformation consulting services reported a +27.3% rise in total revenues; Applications & Technology total revenues increased +10.1%; Finally, Operations & Engineering total revenues grew +33.6% at constant exchange rates with the Q1 impact of the
consolidation of Altran, which mainly delivers Engineering services.

CAPGEMINI JUNE 30, 2021 8
ANALYSIS OF THE CONDENSED INTERIM CONSOLIDATED FINANCIAL STATEMENTS FOR THE HALF-YEAR ENDED JUNE 30, 2021 Consolidated Income Statement Revenues for the first-half 2021 totaled €8,711 million, compared with €7,581 million for the first-half 2020. Growth at current Group scope and exchange rates is 14.9% year-on-year, with revenue increasing 17.9% at constant exchange rates. The operating margin for the first six months of 2021 was €1,042 million, compared with €818 million for the same period in 2020, representing a margin rate of 12.0% compared with 10.8%. Operating profit is €812 million for the first-half 2021, compared with €577 million for the first-half 2020, after taking into account other operating income and expense representing a net expense of €230 million in the first-half 2021 compared with €241 million in the first-half 2020. The net financial expense was €85 million in the first-half 2021, compared with €64 million for the same period in 2020. This increase was mainly due to the full effect during the first-half 2021 of the coupons on the bonds issued in the second quarter of 2020 and the decrease in cash management assets income, partially offset by interest savings following the repayment by Altran Technologies of all its term loans in June 2020 for a nominal amount of nearly €1.6 billion. The income tax expense for the first-half 2021 is €282 million, compared with €204 million for the first-half 2020. The effective tax rate of 31.0% in the first six months of 2021, excluding the transitional impact of the 2017 US tax reform and, in application of regulatory change, the write-off of deferred tax assets on amortizable goodwill recognized in 2016 on legal restructurings, compared with 34.6% for the first-half 2020. Profit for the period attributable to owners of the Company is therefore €443 million for the first-half 2021, compared with €311 million for the first-half 2020. Normalized earnings per share are therefore €3.58 based on an average of 168,453,627 ordinary shares outstanding in the first-half 2021, compared with €2.80 based on an average of 167,646,025 ordinary shares outstanding in the first-half of 2020.

CAPGEMINI JUNE 30, 2021 9
Consolidated Statement of Financial Position Equity attributable to owners of the Company totaled €6,681 million at June 30, 2021, up €578 million on December 31, 2020. This increase was mainly due to: the net profit for the period of €443 million; the positive impact of other comprehensive income of €450 million; the impact of incentive and employee share ownership instruments of €58 million,
partially offset by the payment to shareholders of dividends of €329 million. Non-current assets totaled €14,223 million at June 30, 2021 up €108 million on December 31, 2020, mainly due to the rise in goodwill partially offset by the decrease in intangible assets and property, plant and equipment and lease right-of-use assets. Non-current liabilities totaled €9,062 million at June 30, 2021 down €802 million on December 31, 2020. This decrease comes from the reclassification as current liabilities of bonds maturing in April 2022 and the decrease in provisions for pensions and other post-employment benefits due to the change in the discount rate curve in the first half of the year 2021. Trade receivables and contract assets totaled €4,225 million at June 30, 2021 compared with €3,938 million at December 31, 2020. Trade receivables and contract assets excluding contract costs and net of contract liabilities totaled €3,066 million at June 30, 2021, compared with €2,792 million at December 31, 2020. Accounts and notes payable mainly consist of trade payables and related accounts, personnel costs and accrued taxes other than income tax and total €3,567 million at June 30, 2021, compared with €3,358 million at December 31, 2020. Consolidated net debt was €4,826 million at June 30, 2021, compared with €4,904 million at December 31, 2020. This €78 million decrease on December 31, 2020 is mainly due to the generation of organic free cash flow of €429 million, partially offset by: the payment to shareholders of dividends of €329 million; cash outflows on business combinations, net of cash and cash equivalents acquired, of €70 million. RELATED PARTIES No material transactions with related parties took place in the first-half 2021. MAIN RISKS AND UNCERTAINTIES FOR THE SECOND-HALF 2021 The nature and degree of risks to which the Group is exposed have not changed from those presented on pages 120 to 140 of the 2020 Universal Registration Document. OUTLOOK FOR FISCAL YEAR 2021 Given the confirmed stronger than expected momentum, the Group raised all its targets for the fiscal year on the publication of its half-year results and is now aiming in 2021 for: constant currency growth of +12.0% to +13.0%, instead of +7.0% to +9.0% previously; an operating margin of 12.5% to 12.7%, instead of 12.2% to 12.4%; organic free cash flow above €1 500 million, compared with €1,300 million. The inorganic contribution to growth is anticipated at c. 5.0 points (4.5 points previously).

CAPGEMINI JUNE 30, 2021 10
CONDENSED INTERIM CONSOLIDATED FINANCIAL STATEMENTS FOR THE HALF-YEAR ENDED JUNE 30, 2021 CONSOLIDATED INCOME STATEMENT
* Operating margin, an alternative performance measure monitored by the Group, is defined in Note 3 - Alternative performance measures.
in millions of euros Notes Amount % Amount % Amount %
Revenues 4 - 5 15,848 100 7,581 100 8,711 100Cost of services rendered (11,712) (73.9) (5,616) (74.1) (6,417) (73.7)
Selling expenses (1,113) (7.0) (569) (7.5) (584) (6.7)
General and administrative expenses (1,144) (7.2) (578) (7.6) (668) (7.6)
Operating expenses 6 (13,969) (88.1) (6,763) (89.2) (7,669) (88.0)
Operating margin * 1,879 11.9 818 10.8 1,042 12.0Other operating income and expense 7 (377) (2.4) (241) (3.2) (230) (2.7)
Operating profit 1,502 9.5 577 7.6 812 9.3Net finance costs 8 (82) (0.5) (31) (0.4) (59) (0.7)
Other financial income and expense 8 (65) (0.4) (33) (0.4) (26) (0.3)
Net financial expense (147) (0.9) (64) (0.8) (85) (1.0)
Income tax expense 9 (400) (2.5) (204) (2.7) (282) (3.1)
Share of profit of associates - - - - (1) -
PROFIT FOR THE PERIOD 955 6.1 309 4.1 444 5.2Attributable to:
Owners of the Company 957 6.1 311 4.1 443 5.2
Non-controlling interests (2) - (2) - 1 -
EARNINGS PER SHAREAverage number of shares outstanding during the period
Basic earnings per share (in euros)
Diluted average number of shares outstanding
Diluted earnings per share (in euros)
1.86
172,704,349
1.80 2.55173,684,216
2.63168,453,627
First-half 2021First-half 2020
167,646,025
172,555,946
5.55
2020
167,620,101
5.71

CAPGEMINI JUNE 30, 2021 11
CONSOLIDATED STATEMENT OF COMPREHENSIVE INCOME
(1) Other items of comprehensive income that will not be reclassified subsequently to profit or loss. (2) Other items of comprehensive income that may be reclassified subsequently to profit or loss.
in millions of euros 2020 First-half 2020 First-half 2021
Actuarial gains and losses on defined benefit pension plans, net of tax (1) (19) (101) 198
Remeasurement of cash flow and net investment hedging instruments, net of tax (2) (168) (30) 42
Translation adjustments (2) (563) (132) 210
Other, net of tax (1) (1) (1) -
OTHER ITEMS OF COMPREHENSIVE INCOME (751) (264) 450
Profit for the period (reminder) 955 309 444
Total comprehensive income for the period 204 45 894
Attributable to:
Owners of the Company 205 46 893
Non-controlling interests (1) (1) 1

CAPGEMINI JUNE 30, 2021 12
CONSOLIDATED STATEMENT OF FINANCIAL POSITION
in millions of euros Notes June 30, 2020 December 31, 2020 June 30, 2021
Goodwill 10 10,316 9,795 10,096
Intangible assets 811 1,100 1,042
Property, plant and equipment 846 805 801
Lease right-of-use assets 917 887 809
Deferred taxes assets 1,153 983 873
Other non-current assets 14 502 545 602
Total non-current assets 14,545 14,115 14,223
Contract costs 11 102 102 119
Contract assets 11 1,619 1,148 1,657
Trade receivables 11 2,204 2,688 2,449
Current tax receivables 221 129 264
Other current assets 14 590 598 608
Cash management assets 12 332 338 322
Cash and cash equivalents 12 2,149 2,836 2,623
Total current assets 7,217 7,839 8,042
TOTAL ASSETS 21,762 21,954 22,265
in millions of euros Notes June 30, 2020 December 31, 2020 June 30, 2021
Share capital 1,356 1,350 1,350
Additional paid-in capital 3,149 3,050 3,050
Retained earnings and other reserves 1,106 746 1,838
Profit for the period 311 957 443
Equity (attributable to owners of the Company) 5,922 6,103 6,681
Non-controlling interests 9 12 11
Total equity 5,931 6,115 6,692
Long-term borrowings 12 7,619 7,127 6,639
Deferred taxes liabilities 210 230 255
Provisions for pensions and other post-employment benefits 13 1,202 1,072 744
Non-current provisions 112 337 372
Non-current lease liabilities 715 681 609
Other non-current liabilities 14 377 417 443
Total non-current liabilities 10,235 9,864 9,062
Short-term borrowings and bank overdrafts 12 866 951 1,131Accounts and notes payable 3,255 3,358 3,567
Contract liabilities 11 830 1,044 1,040
Current provisions 95 122 129
Current tax liabilities 134 89 228
Current lease liabilities 277 287 280
Other current liabilities 14 139 124 136
Total current liabilities 5,596 5,975 6,511
TOTAL EQUITY AND LIABILITIES 21,762 21,954 22,265

CAPGEMINI JUNE 30, 2021 13
CONSOLIDATED STATEMENT OF CASH FLOWS
in millions of euros Notes 2020First-half
2020First-half
2021
Profit for the period 955 309 444Depreciation, amortization and impairment of fixed assets and lease right-of-use assets 649 291 328
Change in provisions (66) (33) (93)
Losses/(Gains) on disposals of assets and other (76) 43 8
Expenses relating to share grants 93 48 58
Net finance costs 8 82 31 59
Unrealized (gains) losses on changes in fair value and other financial items 19 13 15
Income tax expense/(income) 9 400 204 282
Cash flows from operations before net finance costs and income tax (A) 2,056 906 1,101
Income tax paid (B) (351) (166) (201)Change in trade receivables, contract assets net of liabilities and contract costs 72 16 (235)
Change in accounts and notes payable (123) (57) 116
Change in other receivables/payables 7 (337) (16)
Change in operating working capital (C) (44) (378) (135)
NET CASH FROM (USED IN) OPERATING ACTIVITIES (D=A+B+C) 1,661 362 765Acquisitions of property, plant and equipment and intangible assets (206) (99) (85)
Proceeds from disposals of property, plant and equipment and intangible assets 2 1 2
Acquisitions of property, plant and equipment and intangible assets, net of disposals (204) (98) (83)Cash (outflows) inflows on business combinations net of cash and cash equivalents acquired 2 (1,557) (1,547) (70)
Cash inflows (outflows) in respect of cash management assets (150) (134) 21
Cash outflows in respect of the acquisition of Altran Technologies shares (15) (15) -
Other cash (outflows) inflows, net 212 (22) (16)
Cash outflows from investing activities (1,510) (1,718) (65)
NET CASH FROM (USED IN) INVESTING ACTIVITIES (E) (1,714) (1,816) (148)Proceeds from issues of share capital 277 (1) -
Dividends paid (226) (226) (329)
Net payments relating to transactions in Capgemini SE shares (514) (204) 2
Proceeds from borrowings 9,308 9,032 84
Repayments of borrowings (6,273) (5,585) (390)
Subsequent acquisition of Altran Technologies securities (1,672) (1,672) -
Repayments of lease liabilities (291) (139) (161)
Interest paid (96) (49) (105)
Interest received 49 30 13
NET CASH FROM (USED IN) FINANCING ACTIVITIES (F) 562 1,186 (886)
NET INCREASE (DECREASE) IN CASH AND CASH EQUIVALENTS (G=D+E+F) 509 (268) (269)Effect of exchange rate movements on cash and cash equivalents (H) (131) (66) 48
CASH AND CASH EQUIVALENTS AT BEGINNING OF PERIOD (I) 12 2,450 2,450 2,828
CASH AND CASH EQUIVALENTS AT END OF PERIOD (G+H+I) 12 2,828 2,116 2,607

CAPGEMINI JUNE 30, 2021 14
CONSOLIDATED STATEMENT OF CHANGES IN EQUITY
Translation adjustments Other
At December 31, 2020 168,784,837 1,350 3,050 (39) 3,444 (644) (1,058) 6,103 12 6,115Dividends paid out for 2020 - - - - (329) - - (329) - (329)Incentive instruments and employee share ownership - - - - 58 - - 58 - 58
Elimination of treasury shares - - - 1 1 - - 2 - 2Finalization of the allocation of the Altran Technologies purchase price - - - - (46) - - (46) (2) (48)
Transactions with shareholders and others - - - 1 (316) - - (315) (2) (317)Income and expense recognized in equity - - - - - 210 240 450 - 450
Profit for the period - - - - 443 - - 443 1 444
At June 30, 2021 168,784,837 1,350 3,050 (38) 3,571 (434) (818) 6,681 11 6,692
Translation adjustments Other
At December 31, 2019 169,345,499 1,355 3,150 (30) 4,899 (80) (870) 8,424 (5) 8,419Dividends paid out for 2019 - - - (226) - - (226) - (226)Incentive instruments and employee share ownership 104,200 1 (1) - 48 - - 48 - 48
Elimination of treasury shares - - (203) (1) - - (204) - (204)
Takeover of Altran Technologies - - - - - - - (459) (459)Subsequent acquisition of Altran Technologies securities - - - (2,134) - - (2,134) 462 (1,672)Transactions with non-controlling interests and others - - - (32) - - (32) 12 (20)Transactions with shareholders and others 104,200 1 (1) (203) (2,345) - - (2,548) 15 (2,533)Income and expense recognized in equity - - - - (133) (132) (265) 1 (264)
Profit for the period - - - 311 - - 311 (2) 309
At June 30, 2020 169,449,699 1,356 3,149 (233) 2,865 (213) (1,002) 5,922 9 5,931
Consolidated retained
earnings and other
reserves
Income and expense recognized in equity
Equity (attributable
to owners of the
Company)
Non-controlling
interests Total equity in millions of eurosNumber of
sharesShare
capital
Additional paid-in capital
Treasury shares
in millions of eurosNumber of
sharesShare
capital
Additional paid-in capital
Treasury shares
Consolidated retained
earnings and other
reserves
Income and expense recognized in equity
Equity (attributable
to owners of the
Company)
Non-controlling
interests Total equity

CAPGEMINI JUNE 30, 2021 15
NOTES TO THE CONSOLIDATED FINANCIAL STATEMENTS FOR THE HALF-YEAR ENDED JUNE 30, 2021 NOTE 1 ACCOUNTING BASIS
The condensed interim consolidated financial statements for the half-year ended June 30, 2021 and the notes thereto were drawn up under the responsibility of the Board of Directors and reviewed by the Board of Directors' meeting of July 27, 2021.
A) IFRS standards base The condensed interim consolidated financial statements for the first-half 2021 have been prepared in accordance with lAS 34, Interim Financial Reporting, as issued by the International Accounting Standards Board (IASB), and endorsed by the European Union. They therefore do not include all the information required under IFRS for full financial statements. These condensed interim consolidated financial statements nonetheless present a selection of notes explaining the major events and transactions of the period in order to understand the changes in the Group’s financial position and performance since the last annual consolidated financial statements. These condensed interim consolidated financial statements for the half-year ended June 30, 2021 should be read in conjunction with the Group’s annual consolidated financial statements for the year ended December 31, 2020 and in particular Note 2 - Consolidation principles and Group structure, relating to the acquisition of Altran Technologies Group. The Group also takes account of the positions adopted by Numeum (merger of Syntec Numérique and TECH IN France), an organization representing major consulting and computer services companies in France, regarding the application of certain IFRS.
B) New standards and interpretations applicable in 2021 a) New standards, amendments and interpretations of mandatory effect at January 1, 2021
The accounting policies applied by the Capgemini Group are unchanged on those applied for the preparation of the December 31, 2020 consolidated financial statements. The standards, amendments, and interpretations which entered into mandatory effect on January 1, 2021 did not have a material impact on the Group financial statements. The potential impacts of the final IFRS IC decision issued in May 2021 on attributing post-employment benefits to periods of service (IAS 19), are currently being analyzed.
b) Other new standards not yet in effect at January 1, 2021 and not adopted early The Group did not adopt early any new standards not yet in effect at January 1, 2021.
C) Use of estimates The preparation of consolidated financial statements involves the use of estimates and assumptions which may have an impact on the reported values of assets and liabilities at the period end or on certain items of either net profit or the income and expenses recognized directly in equity for the year. Estimates are based on economic data and assumptions which are likely to vary over time and interpretations of local regulation when necessary. They have notably been made in an economic and health context that remains uncertain, due to the global Covid-19 pandemic. These estimates are subject to a degree of uncertainty and mainly concern revenue recognition on a percentage-of-completion basis, provisions, measurement of the amount of intangible assets and deferred tax assets, provisions for pensions and other post-employment benefits, the fair value of derivatives and the calculation of the tax expense, notably in the context of the 2017 US tax reform.

CAPGEMINI JUNE 30, 2021 16
NOTE 2 CHANGES IN CONSOLIDATION SCOPE On March 26, 2021, the Group announced the completion of the acquisition of RXP Services. Based in Melbourne, RXP Services has sites in Sydney, Canberra and Hobart. NOTE 3 ALTERNATIVE PERFORMANCE MEASURES
The alternative performance measures monitored by the Group are defined as follows:
► Organic growth, or like-for-like growth, in revenues is the growth rate calculated at constant Group scope and exchange rates. The Group scope and exchange rates used are those for the reported period.
► Growth at constant exchange rates in revenues is the growth rate calculated at exchange rates used for the reported period.
► Operating margin is equal to revenues less operating expenses. It is calculated before “Other operating income and
expense” which include amortization of intangible assets recognized in business combinations, the charge resulting from the deferred recognition of the fair value of shares granted to employees (including social security contributions and employer contributions), and non-recurring revenues and expenses, notably impairment of goodwill, negative goodwill, capital gains or losses on disposals of consolidated companies or businesses, restructuring costs incurred under a detailed formal plan approved by the Group’s management, the cost of acquiring and integrating companies acquired by the Group, including earn-outs comprising conditions of presence, and the effects of curtailments, settlements and transfers of defined benefit pension plans.
► Normalized earnings per share are calculated by dividing normalized profit or loss attributable to owners of the Company by the weighted average number of ordinary shares outstanding during the period, excluding treasury shares. Normalized net profit or loss is equal to profit for the year attributable to owners of the Company corrected for the impact of items recognized in “Other operating income and expense” (see Note 7– Other operating income and expense), net of tax calculated using the effective tax rate:
(1) See Note 9 - Income Tax.
In the first-half of 2021, the Group recognized:
► an income tax expense of €17 million in respect of the transitional impact of the 2017 US tax reform and ► in application of a regulatory change, an income tax expense of €39 million due to the write-off of deferred tax assets
on amortizable goodwill, recognized in 2016 on legal restructurings, reducing normalized earnings per share by €0.10 and €0.23, respectively.
Excluding this tax charge, normalized earnings per share would have been €3.91 in the first-half of 2021:
in millions of euros First-half 2020 First-half 2021
Profit for the period attributable to owners of the Company 311 443
Other operating income and expenses, net of tax calculated at the effective tax rate (1) 158 159
Normalized profit for the period attributable to owners of the Company 469 602
Weighted average number of ordinary shares outstanding 167,646,025 168,453,627
NORMALIZED EARNINGS PER SHARE (in euros) 2.80 3.58
in millions of euros First-half 2020 First-half 2021
NORMALIZED EARNINGS PER SHARE (in euros) 2.80 3.58Tax expense due to the transitional impact of the 2017 US tax reform 26 17Tax expense, in application of regulatory change, from the write-off of deferred tax assets on amortizable goodwill, recognized in 2016 on legal restructurings - 39
Weighted average number of ordinary shares outstanding 167,646,025 168,453,627
Impact of the tax expense due to the transitional impact of the 2017 US tax reform 0.15 0.10Impact of the tax expense, in application of regulatory change, from the write-off of deferred tax assets on amortizable goodwill, recognized in 2016 on legal restructurings - 0.23NORMALIZED EARNINGS PER SHARE - excl. the tax expense due to the transitional impact of the 2017 US tax reform and, in application of regulatory change, the write-off of deferred tax assets on amortizable goodwill, recognized in 2016 on legal restructurings (in euros)
2.95 3.91

CAPGEMINI JUNE 30, 2021 17
► Net debt (or net cash and cash equivalents) comprises (i) cash and cash equivalents, as presented in the Consolidated Statement of Cash Flows (consisting of short-term investments and cash at bank) less bank overdrafts, (ii) cash management assets (assets presented separately in the Consolidated Statement of Financial Position due to their characteristics), less (iii) short- and long-term borrowings. Account is also taken of the impact of hedging instruments when these relate to borrowings and own shares. Following IFRS 16 adoption from January 1, 2019, lease liabilities (including finance lease liabilities) are considered for Net debt and Organic free cash flow as operational items and are excluded from net debt.
► Organic free cash flow calculated based on items in the Statement of Cash Flows is equal to cash flow from operations less acquisitions of property, plant, equipment and intangible assets (net of disposals) and repayments of lease liabilities and adjusted for flows relating to the net interest cost.
The impact of the health crisis on the condensed interim consolidated financial statements for the first-half 2021 is not isolated. The definition of the above alternative performance measures is therefore unchanged and, in accordance with past practice, these condensed interim consolidated financial statements for the first-half 2021 include in other operating income and expense a non-material amount of incremental and non-recurring costs related to this crisis (See Note 7 – Other operating income and expense).
in millions of euros First-half 2020 First-half 2021
Net cash from operating activities 362 765
Acquisitions of property, plant and equipment and intangible assets (99) (85)
Proceeds from disposals of property, plant and equipment and intangible assets 1 2
Acquisitions of property, plant, equipment and intangible assets (net of disposals) (98) (83)
Interest paid (49) (105)
Interest received 30 13
Net interest cost (19) (92)
Repayments of lease liabilities (139) (161)
ORGANIC FREE CASH FLOW 106 429

CAPGEMINI JUNE 30, 2021 18
NOTE 4 OPERATING SEGMENTS Group Management analyzes and measures activity performance in the geographic areas where the Group is present.
The geographic analysis enables management to monitor the performance: ► of commercial development: it focuses on trends in major contracts and clients in Group markets across all its businesses.
This monitoring seeks to coordinate the service offering of the different businesses in the countries, given their considerable interaction and to measure the services.
► at operational and financial level: management of treasury and support services, the operating investment and financing policies and the acquisition policy are decided and implemented by geographic area.
Accordingly, the Group presents segment reporting for the five geographic areas where it is located.
Costs relating to operations and incurred by Group holding companies on behalf of geographic areas are allocated to the relevant segments either directly or on the basis of an allocation key. Items not allocated correspond to headquarter expenses.
Inter-segment transactions are carried out on an arm’s length basis.
The performance of operating segments is measured based on the operating margin*. This indicator enables the measurement and comparison of the operating performance of operating segments, irrespective of whether their business results from internal or external growth.
The operating margin* realized by the main offshore delivery centers (India and Poland) is reallocated to the geographic areas managing the contracts to enable a better understanding of the performance of these areas. * Operating margin, an alternative performance measure monitored by the Group, is defined in Note 3 - Alternative performance measures.
The Group communicates segment information for five geographic areas: North America, France, United Kingdom and Ireland, the Rest of Europe, Asia-Pacific and Latin America.
* Operating margin, an alternative performance measure monitored by the Group, is defined in Note 3 - Alternative performance measures.
* Operating margin, an alternative performance measure monitored by the Group, is defined in Note 3 - Alternative performance measures.
First-half 2021(in millions of euros)
North America France
United Kingdom and
Ireland Rest of Europe
Asia-Pacific and Latin America
Headquarter expenses Eliminations Total
Revenues
► external 2,478 1,872 1,018 2,710 633 - - 8,711
► inter-geographic area 88 182 120 201 883 - (1,474) -
TOTAL REVENUES 2,566 2,054 1,138 2,911 1,516 - (1,474) 8,711
OPERATING MARGIN * 389 141 179 312 78 (57) - 1,042
% of revenues 15.7 7.5 17.6 11.5 12.5 - - 12.0
OPERATING PROFIT 330 66 162 260 51 (57) - 812
First-half 2020(in millions of euros) North America France
United Kingdom and
Ireland Rest of Europe
Asia-Pacific and Latin
AmericaHeadquarter
expenses Eliminations Total
Revenues► external 2,400 1,612 853 2,172 544 - - 7,581
► inter-geographic area 78 148 109 179 828 - (1,342) -
TOTAL REVENUES 2,478 1,760 962 2,351 1,372 - (1,342) 7,581
OPERATING MARGIN * 346 112 122 221 57 (40) - 818% of revenues 14.4 6.9 14.3 10.2 10.5 - - 10.8
OPERATING PROFIT 278 65 107 167 34 (74) - 577
CAPGEMINI JUNE 30, 2021 19
* Operating margin, an alternative performance measure monitored by the Group, is defined in Note 3 - Alternative performance measures.
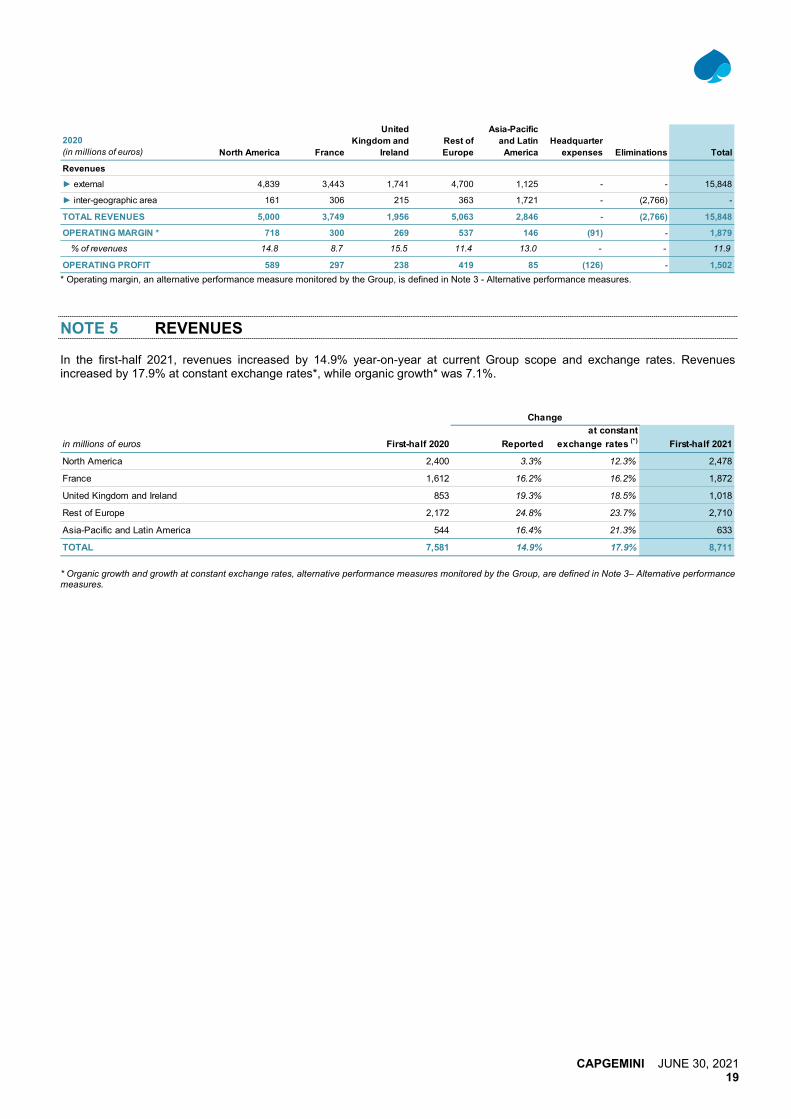
NOTE 5 REVENUES In the first-half 2021, revenues increased by 14.9% year-on-year at current Group scope and exchange rates. Revenues increased by 17.9% at constant exchange rates*, while organic growth* was 7.1%.
* Organic growth and growth at constant exchange rates, alternative performance measures monitored by the Group, are defined in Note 3– Alternative performance measures.
2020 (in millions of euros) North America France
United Kingdom and
Ireland Rest of Europe
Asia-Pacific and Latin
AmericaHeadquarter
expenses Eliminations Total
Revenues► external 4,839 3,443 1,741 4,700 1,125 - - 15,848
► inter-geographic area 161 306 215 363 1,721 - (2,766) -
TOTAL REVENUES 5,000 3,749 1,956 5,063 2,846 - (2,766) 15,848
OPERATING MARGIN * 718 300 269 537 146 (91) - 1,879% of revenues 14.8 8.7 15.5 11.4 13.0 - - 11.9
OPERATING PROFIT 589 297 238 419 85 (126) - 1,502
in millions of euros First-half 2020 Reportedat constant
exchange rates (*) First-half 2021
North America 2,400 3.3% 12.3% 2,478
France 1,612 16.2% 16.2% 1,872
United Kingdom and Ireland 853 19.3% 18.5% 1,018
Rest of Europe 2,172 24.8% 23.7% 2,710
Asia-Pacific and Latin America 544 16.4% 21.3% 633
TOTAL 7,581 14.9% 17.9% 8,711
Change

CAPGEMINI JUNE 30, 2021 20
NOTE 6 OPERATING EXPENSES BY NATURE
NOTE 7 OTHER OPERATING INCOME AND EXPENSE
Amortization of intangible assets recognized in business combinations The increase in amortization of intangible assets recognized in business combinations in first-half 2021 is mainly due to the amortization of intangible assets recognized in the context of the Altran acquisition. Integration costs for companies acquired Integration costs for companies acquired total €57 million mainly on the integration of Altran in the first-half of 2021. Other operating expenses In this evolving context of the global coronavirus pandemic, Capgemini’s priority is the health and safety of its employees while ensuring the continuity of services to its clients. These protection, health and safety, business continuity and sponsorship measures generated non-recurring incremental costs of €5 million in the first-half 2021, compared to €17 million in the first-half 2020. Other operating income In the first-half 2021, the Group recorded a gain of €14 million in respect of the reduction of the pension plans and related commitments following the transfer of employees dedicated to a Canadian client contract.
in millions of euros Amount % of revenues Amount % of revenues Amount % of revenues
Personnel expenses 10,478 66.1% 5,110 67.4% 6,034 69.3%
Travel expenses 221 1.4% 152 2.0% 47 0.5%
10,699 67.5% 5,262 69.4% 6,081 69.8%
Purchases and sub-contracting expenses 2,437 15.4% 1,114 14.7% 1,187 13.6%
Rent and local taxes 185 1.1% 93 1.2% 85 1.0%Charges to depreciation, amortization and provisions and proceeds from asset disposals 648 4.1% 294 3.9% 316 3.6%
OPERATING EXPENSES 13,969 88.1% 6,763 89.2% 7,669 88.0%
2020 First-half 2021First-half 2020
in millions of euros 2020 First-half 2020 First-half 2021
Amortization of intangible assets recognized in business combinations (113) (35) (59)
Expenses relating to share grants (105) (52) (73)
Restructuring costs (147) (76) (40)
Integration costs for companies acquired (71) (25) (57)
Acquisition costs (38) (36) (7)
Other operating expenses (45) (20) (10)
Total operating expenses (519) (244) (246)
Other operating income 142 3 16
Total operating income 142 3 16
OTHER OPERATING INCOME AND EXPENSE (377) (241) (230)

CAPGEMINI JUNE 30, 2021 21
NOTE 8 NET FINANCIAL EXPENSE
Net interest on borrowings (€63 million) and the impact of amortized cost on borrowings (€7 million) total €70 million and mainly comprise: ► the coupon on the 2015 bond issue of €13 million, with a negligible amortized cost accounting impact, ► the coupon on the 2016 bond issue of €2 million, with a negligible amortized cost accounting impact, ► coupons on the 2018 bond issues of €7 million, plus an amortized cost accounting impact of €3 million, ► coupons on the 2020 bond issues of €40 million, plus an amortized cost accounting impact of €4 million. Exchange gains on financial transactions and losses on derivative instruments primarily concern inter-company loans denominated in foreign currencies and the impacts of the related hedging arrangements. NOTE 9 INCOME TAX EXPENSE The effective tax rate for the half-year is calculated by applying the estimated effective tax rate for the fiscal year to pre-tax net profits for the half-year to June 30. The effective income tax rate for the first-half 2021 is 38.7% based on pre-tax net profit of €727 million, compared with 29.5% at December 31, 2020 and 39.7% at June 30, 2020. In application of regulatory change, the Group wrote off deferred tax assets on amortizable goodwill recognized in 2016 on legal restructurings, for an amount of €39 million in the first-half 2021. The effective income tax rate used to calculate normalized earnings per share at June 30, 2021 is 31.0%, compared to 34.6% at June 30, 2020. It is adjusted for:
► an income tax expense of €17 million in respect of the transitional impact of the 2017 US tax reform and ► in application of a regulatory change, an income tax expense of €39 million due to the write-off of deferred tax assets
on amortizable goodwill, recognized in 2016 on legal restructurings.
in millions of euros 2020First-half
2020First-half
2021Income from cash, cash equivalents and cash management assets 48 30 11
Net interest on borrowings (118) (56) (63)
Net finance costs at the nominal interest rate (70) (26) (52)Impact of amortized cost on borrowings (12) (5) (7)
Net finance costs at the effective interest rate (82) (31) (59)Net interest cost on defined benefit pension plans (23) (12) (10)
Interest on lease liabilities (25) (11) (11)
Exchange gains (losses) on financial transactions (6) 3 1
(Losses) gains on derivative instruments 3 (6) (1)
Other (14) (7) (5)
Other financial income and expense (65) (33) (26)
NET FINANCIAL EXPENSE (147) (64) (85)

CAPGEMINI JUNE 30, 2021 22
NOTE 10 GOODWILL Since the closure of the consolidated financial statements for the year ended December 31, 2020 and during the 12 month allocation period, new information came to light regarding facts and circumstances existing at the date of acquisition of control of Altran, leading the Group to increase the goodwill relating to this transaction in the amount of €59 million. At June 30, 2021, the final goodwill recognized in accordance with the partial method is equal to 2,637 million. The following table shows the final allocation of the Altran Technologies purchase price at initial takeover, based on a 55% owned interest:
The Group has not identified any trigger events calling into question the recoverable amount of the Cash Generating Units (CGU) at June 30, 2021. NOTE 11 TRADE RECEIVABLES, CONTRACT ASSETS AND CONTRACT COSTS
(in millions of euros)
Provisional allocation as
at June 30, 2020
Modifications
Provisional allocation as at December
31, 2020
ModificationsFinal allocation
as at June 30, 2021
Fair value of previously-held investment 426 - 426 - 426Acquisition of a controlling interest on March 13, 2020 1,593 - 1,593 - 1,593Cash consideration paid at initial takeover 2,019 - 2,019 - 2,019Non-controlling interest (462) (1) (463) (48) (511)TOTAL CONSIDERATION TRANSFERRED (A) 1,557 (1) 1,556 (48) 1,508
(in millions of euros)
Provisional allocation as
at June 30, 2020
Modifications
Provisional allocation as at December
31, 2020
ModificationsFinal allocation
as at June 30, 2021
Intangible assets 206 462 668 - 668o/w customer relationships - 503 503 - 503
Property, plant and equipment 139 1 140 - 140Other non-current and current assets 351 3 354 - 354Cash and cash equivalents 175 - 175 - 175Short- and long-term borrowings and bank overdrafts (1,731) - (1,731) - (1,731)Current and non-current provisions (197) (144) (341) (42) (383)Deferred taxes, net 171 (148) 23 10 33
o/w deferred tax liabilities relating to the allocation of the purchase price - (129) (129) 10 (119)
Other non-current and current liabilities (178) (24) (202) (76) (278)Other assets and liabilities 44 (152) (108) 1 (107)
NET ASSETS AT DATE OF INITIAL TAKEOVER (B) (1,020) (2) (1,022) (107) (1,129)
GOODWILL (A)-(B) 2,577 1 2,578 59 2,637
in millions of euros June 30, 2020 December 31, 2020 June 30, 2021
Trade receivables 2,241 2,724 2,479
Provisions for doubtful accounts (37) (36) (30)
Contract assets 1,619 1,148 1,657
Trade receivables and contract assets, excluding contract costs 3,823 3,836 4,106
Contract costs 102 102 119
TRADE RECEIVABLES AND CONTRACT ASSETS 3,925 3,938 4,225

CAPGEMINI JUNE 30, 2021 23
Total trade receivables and contract assets net of contract liabilities can be analyzed as follows in number of days’ annual revenue:
At June 30, 2021, receivables totaling €16 million were assigned with transfer of risk as defined by IFRS 9 to financial institutions. These receivables were therefore derecognized in the Statement of Financial Position at June 30, 2021. NOTE 12 NET DEBT/NET CASH AND CASH EQUIVALENTS
* Net debt/net cash and cash equivalents, an alternative performance measure monitored by the Group, is defined in Note 3 - Alternative performance measures. The €78 million decrease in net debt during the first six months of 2021 is mainly due to the generation of organic free cash flow* of €429 million, partially offset by: the payment to shareholders of dividends of €329 million; cash outflows on business combinations, net of cash and cash equivalents acquired, of €70 million. Financial asset and liability fair value measurement methods and classifications are unchanged on December 31, 2020. * Organic free cash flow, an alternative performance measure monitored by the Group, is defined in Note 3 - Alternative performance measures.
in millions of euros June 30, 2020 December 31, 2020 June 30, 2021
Trade receivables and contract assets, excluding contract costs 3,823 3,836 4,106
Contract liabilities (830) (1,044) (1,040)
TRADE RECEIVABLES AND CONTRACT ASSETS NET OF CONTRACT LIABILITIES 2,993 2,792 3,066
ln number of days' annual revenue 64 60 63
in millions of euros June 30, 2020 December 31, 2020 June 30, 2021
Short-term investments 991 1,921 1,313
Cash at bank 1,158 915 1,310
Bank overdrafts (33) (8) (16)
Cash and cash equivalents 2,116 2,828 2,607
Cash management assets 332 338 322
Bonds (7,613) (7,121) (6,627)
Draw-downs on bank and similar facilities and other borrowings (6) (6) (12)
Long-term borrowings (7,619) (7,127) (6,639)
Bonds (48) (577) (1,049)
Drawdowns on bank and similar facilities and other borrowings (785) (366) (66)
Short-term borrowings (833) (943) (1,115)
Borrowings (8,452) (8,070) (7,754)
Derivative instruments (4) - (1)
NET DEBT * (6,008) (4,904) (4,826)

CAPGEMINI JUNE 30, 2021 24
NOTE 13 PROVISIONS FOR PENSIONS AND OTHER POST-EMPLOYMENT BENEFITS
The decrease in provisions for pensions and other post-employment benefits is due to the change in the discount rate curve in the first half of the year 2021. NOTE 14 OTHER NON-CURRENT AND CURRENT ASSETS AND LIABILITIES "Other non-current assets", "Other current assets", "Other non-current liabilities" and "Other current liabilities" presented in the Consolidated Statement of Financial Position break down as follows: OTHER NON-CURRENT AND CURRENT ASSETS
The change in “Other non-current and current assets” during the period came mainly from: ► the increase in certain prepaid expenses related to IT expenses and projects; ► the increase in non-current tax receivables, notably in India, concerning the tax portion required by the Indian tax authorities
following tax audits challenged by the Group; ► change in the fair value on hedging derivatives contracted as part of the centralized management of currency risk.
in millions of euros June 30, 2020 December 31, 2020 June 30, 2021
NET OBLIGATION AT BEGINNING OF PERIOD 1,046 1,046 1,072
Expense for the period recognized in the Income Statement 53 114 44
Cost of services rendered 43 91 48
Plan curtailments, settlements and transfers (2) - (14)
Interest cost 12 23 10
Impact on income and expense recognized in equity 134 43 (263)
Benefits and contributions (69) (190) (132)
Translation adjustments (45) (48) 25
Business combinations 83 113 -
Other movements - (6) (2)
NET OBLIGATION AT END OF PERIOD 1,202 1,072 744
(in millions of euros) June 30, 2020 December 31, 2020 June 30, 2021Derivative instruments 59 100 66
Shares in associates 73 110 107
Social security and tax-related receivables, other than income tax 187 197 183
Prepaid expenses 275 242 308
Long-term deposits, receivables and other investments 163 163 165
Non-current tax receivables 189 183 248
Non-consolidated securities 26 27 28
Other 120 121 105
OTHER NON-CURRENT AND CURRENT ASSETS 1,092 1,143 1,210

CAPGEMINI JUNE 30, 2021 25
OTHER NON-CURRENT AND CURRENT LIABILITIES
The change in “Other non-current and current liabilities” in the first-half 2021 came mainly from the finalization of the allocation of the Altran purchase price based on new information that came to light regarding facts and circumstances that existed at the Altran takeover date (see Note 10- Goodwill). Liabilities related to acquisitions of consolidated companies mainly comprise earn-outs granted at the time of certain acquisitions.
(in millions of euros) June 30, 2020 December 31, 2020 June 30, 2021Special employee profit-sharing reserve 39 30 43
Derivative instruments 51 65 30
Liabilities related to acquisitions of consolidated companies 139 147 125
Non-current tax payables 166 186 258
Other 121 113 123
OTHER NON-CURRENT AND CURRENT LIABILITIES 516 541 579

CAPGEMINI JUNE 30, 2021 26
NOTE 15 NUMBER OF EMPLOYEES AVERAGE NUMBER OF EMPLOYEES BY GEOGRAPHIC AREA
NUMBER OF EMPLOYEES AT PERIOD-END BY GEOGRAPHIC AREA
Number of employees %
Number of employees %
Number of employees %
North America 18,373 8% 18,493 7% 18,243 7%
France 30,574 13% 33,358 13% 36,075 13%
United Kingdom and Ireland 9,673 4% 10,032 4% 10,772 4%
Rest of Europe 46,816 20% 51,220 21% 57,796 21%
Africa and Middle East 2,746 1% 3,226 1% 4,039 1%
Asia-Pacific and Latin America 130,904 54% 135,196 54% 149,775 54%
AVERAGE NUMBER OF EMPLOYEES 239,086 100% 251,525 100% 276,700 100%
First-half 2020 2020 First-half 2021
Number of employees %
Number of employees %
Number of employees %
North America 18,763 7% 18,550 7% 18,278 6%
France 37,365 14% 36,219 13% 36,118 12%
United Kingdom and Ireland 10,628 4% 10,489 4% 11,061 4%
Rest of Europe 56,407 21% 56,946 21% 58,824 21%
Africa and Middle East 3,791 1% 3,888 1% 4,239 1%
Asia-Pacific and Latin America 138,119 53% 143,677 54% 160,981 56%
NUMBER OF EMPLOYEES AT PERIOD-END 265,073 100% 269,769 100% 289,501 100%
First-half 2020 2020 First-half 2021

CAPGEMINI JUNE 30, 2021 27
NOTE 16 OFF-BALANCE SHEET COMMITMENTS COMMITMENTS GIVEN
(1) Following the application of IFRS 16, Leases, at January 1, 2019, the amounts presented as commitments given mainly comprise the non- lease component of the Group's real estate leases. COMMITMENTS RECEIVED
CONTINGENT LIABILITIES
In the normal course of their activities, certain Group companies underwent tax audits, leading in some cases to revised assessments in the first-half 2021 and in the previous fiscal years.
Proposed adjustments were challenged and litigation and pre-litigation proceedings were in progress at June 30, 2021, notably in France and India. In France, the tax authorities consider that Capgemini SE’s reinsurance subsidiary located in Luxembourg takes advantage of a preferential tax regime and therefore that its profits should be taxed in France, at Capgemini SE level. The Indian subsidiaries of the Group have received several revised assessments or proposed revised assessments for income tax in recent years. Most often, no amounts have been booked for these disputes in the consolidated financial statements in so far as the Group considers it justifies its positions that the likelihood of winning is high. NOTE 17 SUBSEQUENT EVENTS On July 19, 2021, the Group announced proposal to acquire the Australian company Empired Limited. This acquisition would strengthen Group’s capabilities in cloud and data across the region.
in millions of euros June 30, 2020 December 31, 2020 June 30, 2021
On client contracts 1,992 1,958 1,920
On non-cancelable leases (1) 125 115 102
Other commitments given 33 67 120
COMMITMENTS GIVEN 2,150 2,140 2,142
in millions of euros June 30, 2020 December 31, 2020 June 30, 2021
On client contracts 5 2 1
Other commitments received 14 14 18
COMMITMENTS RECEIVED 19 16 19

CAPGEMINI JUNE 30, 2021 28
DECLARATION BY THE PERSON RESPONSIBLE FOR THE INTERIM FINANCIAL REPORT "I hereby declare that, to the best of my knowledge, the condensed interim consolidated financial statements for the half-year ended June 30, 2021 have been prepared in accordance with applicable accounting standards and give a true and fair view of the assets, liabilities, financial position and results of the Company and all the other companies included in the scope of consolidation and that the interim financial review on page 5 gives a fair description of the material events that occurred in the first six months of the fiscal year and their impact on the financial statements, the main related party transactions, as well as a description of the main risks and uncertainties for the remaining six months of the year". Aiman Ezzat Chief Executive Officer