interim management statement as at 30 september 2015 (1st ... · (1st quarter of fiscal year...
TRANSCRIPT

Interim Management Statement
as at 30 September 2015
(1st quarter of fiscal year 2015/2016)
Digital Bros S.p.A.
Via Tortona, 37 – 20144 Milan, Italy
VAT and tax identification no. 09554160151
Share capital: 5,644,334.80 euros fully paid-in
Reg. of Co. Court of Milan 290680 - Vol. 7394 Chamber of Commerce 1302132
This report can be downloaded from the Company’s website
at www.digitalbros.com in the Investors section

Digital Bros Group Interim Management Statement as at 30 September 2015
2
(this page intentionally left blank)
Digital Bros Group Interim Management Statement as at 30 September 2015
3
Contents
Officers and control bodies 4
Directors’ report 6
1. Group structure 6
2. The video games market 11
3. Seasonal trends 14
4. Significant events during the period 15
5. Analysis of the economic performance as at 30 September 2015 17
6. Analysis of the statement of financial position as at 30 September 2015 21
7. Performance of business segments 23
8. Intercompany and related party transactions and atypical/unusual transactions 34
9. Treasury shares 36
10. Research and development 36
11. Risk management and financial instruments 37
12. Contingent assets and liabilities 43
13. Subsequent events 43
14. Outlook 44
15. Other information 45
Abridged consolidated financial statements as at 30 September 2015 47
Consolidated statement of financial position as at 30 September 2015 49
Consolidated income statement as at 30 September 2015 50
Consolidated statement of comprehensive income as at 30 September 2015 51
Consolidated statement of cash flows as at 30 September 2015 52
Consolidated statement of changes in equity 54
Notes to the abridged consolidated financial statements as at 30 September 2015 55
1. Form, content and other general information 56
2. Accounting standards 59
3. Use of estimates 60
4. Consolidation methods 63
5. Equity investments in associates and other companies 65
6. Business combinations 66
7. Analysis of the statement of financial position 67
8. Analysis of the income statement 77
9 Non-recurring income and expenses 79
10. Segment reporting 80
11. Related party transactions 86
12. Atypical or unusual transactions 87
Statement pursuant to Art. 154-bis (5) of the Consolidated Finance Act 88

Digital Bros Group Interim Management Statement as at 30 September 2015
4
OFFICERS AND CONTROL BODIES
Board of Directors
Lidia Florean Director (2)
Abramo Galante Chairman and managing director (1)
Davide Galante Director (2)
Raffaele Galante Managing director (1)
Guido Guetta Director (3)
Elena Morini Director (3)
Stefano Salbe Director (1) (4)
Bruno Soresina Director (3)
Dario Treves Director (2)
(1) Executive directors (2) Non-executive directors (3) Independent directors (4) Financial Reporting Officer per Art. 154-bis of Legislative Decree 58/98
Internal Control and Risk Committee Remuneration Committee
Guido Guetta (Chairman) Guido Guetta (Chairman)
Elena Morini Elena Morini
Bruno Soresina Bruno Soresina
Board of Statutory Auditors
Sergio Amendola Chairman
Laura Guazzoni Standing auditor
Paolo Villa Standing auditor
Emanuela Maria Conti Alternate auditor
Simone Luigi Dalledonne Alternate auditor
The Shareholders’ Meeting of 28 October 2014 appointed the members of the Board of Directors and
Board of Statutory Auditors. The terms of office of the directors and statutory auditors will end with the
Shareholders’ Meeting that approves the financial statements at 30 June 2017.
By resolution of 7 August 2007, the Board of Directors appointed board member Stefano Salbe to the
position of Financial Reporting Officer pursuant to Art. 154-bis of Legislative Decree 58/98, granting the
appropriate powers.
External statutory auditors
Deloitte & Touche S.p.A.
At the meeting of 26 October 2012 the shareholders selected Deloitte & Touche S.p.A, with registered
office at Via Tortona 25 in Milan, as external auditing firm until approval of the accounts at 30 June
2021.

Digital Bros Group Interim Management Statement as at 30 September 2015
5
Other information
Publication of the interim management statement of the Digital Bros S.p.A. Group as at 30 September
2015 was authorised by resolution of the Board of Directors on 12 November 2015. Digital Bros S.p.A. is
a joint stock company established and domiciled in Italy. It is listed on the STAR segment of the MTA
market managed by Borsa Italiana S.p.A.

Digital Bros Group Interim Management Statement as at 30 September 2015
6
DIRECTORS’ REPORT
1. GROUP STRUCTURE
The Digital Bros Group develops, publishes, distributes and markets video games on an international
scale.
In order to respond to the changed competitive context of the video games market, the Group has
implemented an organisational change process that involved expanding into the Mobile segment,
dedicated to the publication of video games on smartphones and social networks, alongside the already
existing structure. The reorganisation also entailed the consolidation of the previous Digital unit into the
Publishing business segment, considering that the products distributed on the traditional channels and
digital marketplaces adopt the same development, communication and marketing policies, which are
managed by the same organisational division. The increasing weight of the Mobile and Publishing
business segments and the concurrent reduction of the Italian Distribution business segment resulted in a
need for a more extensive organisational structure to coordinate the Group’s business, the Holding
business segment, in particular for the finance, administration, information technology and general
services functions.
The acquisition of the U.S. company Pipeworks Inc. on 12 September 2014 allowed the Group to extend
the scope of its business to include video game development (the Development business segment).
Since the previous year, the business conducted by the subsidiary Game Network S.r.l., which manages
paid gaming platforms under concession from the Italian State Monopoly Administration (AAMS), has
been separated from the Mobile segment. The above business was merged into the new segment Other
Activities, which also includes the business conducted by the subsidiary Digital Bros Game Academy
S.r.l., namely the organisation of IT and gaming specialisation and training courses.
For the sake of comparison, income statement figures for the period ended 30 September of the previous
year have been restated according to the current arrangement by business segments.
The Group is therefore organised into five business segments:
Development: the Development business segment is responsible for designing and developing video
games. The business is conducted through an organisational structure consisting of qualified staff. The
Company currently benefits from development agreements with clients external to the Group. The
acquisition provides access to an internal development team capable of contributing technological
expertise to the improvement of video game quality and adherence to development schedules.
Publishing: this activity consists of acquiring the rights to use video games from developers and their
subsequent distribution both through a traditional-type international sales network and by distribution on
the digital marketplaces such as, for example: Steam, Sony PlayStation Network, Microsoft Xbox Live.
The video games are normally acquired on an exclusive licence with international exploitations rights
valid for several years.

Digital Bros Group Interim Management Statement as at 30 September 2015
7
505 Games is the trade name used by the Group worldwide in the Publishing segment.
Publishing operations were carried out during the period by the subsidiary 505 Games S.r.l. (which
coordinates the segment), together with 505 Games France S.a.s., 505 Games Ltd., 505 Games (US) Inc.,
505 Games Spain Slu and 505 Games GmbH, operating respectively in the French, U.K., U.S., Spanish
and German markets. The company 505 Games Interactive (US) Inc. provides consultancy on behalf of
505 Games S.r.l. The Swedish company 505 Games Nordic AB was dormant during the period and is
currently in liquidation.
Mobile: this business segment is responsible for the production and marketing of video games for mobile
(smartphone and tablet) platforms and for social networks. The segment is coordinated by 505 Mobile
S.r.l., which controls the U.S. company 505 Mobile (US) Inc., which provided consultancy on behalf of
its parent company. With the acquisition of the English company DR Studios Ltd. on 12 September 2014,
the business segment benefited from an expansion of the activities carried out, which now also include the
development of applications together with the publishing and marketing activities already carried out
previously. The segment also includes Game Entertainment S.r.l., which in the previous year began to
manage mobile video games that generate advertising revenue.
The distinctive nature of the video games of the Mobile business segment relates to the different
distribution platforms and the possibility for players to download applications free from the marketplaces
and then spend money during the phases of the game.
505 Mobile is the trade name used by the Group worldwide in the Mobile segment.
Italian Distribution: the distribution in Italy of video games acquired from international publishers. The
games are marketed through a direct network of key accounts and through an indirect network of sales
representatives.
These operations are conducted by the parent, Digital Bros S.p.A., under the Halifax brand, and by the
subsidiary Game Service S.r.l. for alternative distribution channels.
The Group also distributes the Yu-Gi-Oh! trading card game throughout the country.
Other Activities: this business segment includes all activities of limited scope, which are consolidated into
a separate residual business segment, in the interest of logical presentation of results. The business
segment includes the activities of the subsidiary Game Network S.r.l., which manages paid games under
concession from the Italian State Monopoly Administration (AAMS). The business segment also includes
the activities of the subsidiary Digital Bros Game Academy S.r.l., which organises IT and video game
specialisation courses, training courses and professional refresher courses, in multimedia and other
formats.
Holding: this segment includes all functions of coordination of the various business segments that are
performed directly by the parent company, Digital Bros S.p.A., and in particular the implementation of
financial policies suited to supporting the Group’s activities, management of the Group’s non-investment

Digital Bros Group Interim Management Statement as at 30 September 2015
8
properties and brand management. As from last year, the administration, management control and
development business have been included in the Holding business segment.
In June 2015, in order to bring the organisational structure into line with the structure of the business
segments, the parent company sold 100% of 505 Mobile S.r.l. and its subsidiaries, 505 Games France
S.a.s. and 505 Games Slu, to 505 Games S.r.l.
All of the equity investments indicated in the following organisation chart are fully owned.

Digital Bros Group Interim Management Statement as at 30 September 2015
9
Company organisation chart at 30 September 2015

Digital Bros Group Interim Management Statement as at 30 September 2015
10
During the period, the Group operated from the following locations:
Company Address Function
Digital Bros S.p.A. Via Tortona 37, Milan Offices
Digital Bros S.p.A. Via Boccaccio 95, Trezzano sul Naviglio (MI) Logistics
Digital Bros Game Academy S.r.l. Via Labus, 15 Milan Offices
DR Studios Ltd. 4 Linford Forum, Rockingham Drive, Milton Keynes, U.K. Offices
Game Entertainment S.r.l. Via Tortona 37, Milan Offices
Game Network S.r.l. Via Tortona 37, Milan Offices
Game Service S.r.l. Via Tortona 37, Milan Offices
Pipeworks Inc. 133 W. Broadway, Suite 200 Eugene, Oregon, U.S.A. Offices
505 Games S.r.l. Via Tortona 37, Milan Offices
505 Games France S.a.s. 2, Chemin de la Chauderaie, Francheville, France Offices
505 Games Spain Slu Calle Cabo Rufino Lazaro 15, Las Rozas de Madrid, Spain Offices
505 Games Ltd. 402 Silbury Court, Silbury Boulevard, Milton Keynes, U.K. Offices
505 Games (US) Inc. 5145 Douglas Fir Road, Calabasas, California, U.S.A. Offices
505 Games GmbH Brunnfeld 2-6, Burglengenfeld, Germany Offices
505 Games Interactive Inc. 5145 Douglas Fir Road, Calabasas, California, U.S.A. Offices
505 Mobile S.r.l. Via Tortona 37, Milan Offices
505 Mobile (US) Inc. 5145 Douglas Fir Road, Calabasas, California, U.S.A. Offices
505 Games Nordic AB, based in Stockholm, was placed in liquidation during the period.
At 30 September 2015 the Group had equity investments in the associates listed below:
Company name Registered Office Holding Book value
Delta DNA Ltd. (1) Edinburgh 1.16% 60
Ebooks&Kids S.r.l. Milan 16% 200
Cityglance S.r.l. Milan 37.5% 45
Ovosonico S.r.l. Varese 3.34% 49
Total 354
(1) Previously Games Analytics Ltd.
More information is available in paragraph 5 of the explanatory notes.

Digital Bros Group Interim Management Statement as at 30 September 2015
11
2. THE VIDEO GAMES MARKET
The video games market is part of the entertainment industry. Movies, publishing, and toys are businesses
that build on the same characters and brands.
The market is in constant flux and is expanding quickly as a result of non-stop technological advances.
Today, playing is no longer limited to traditional games consoles, Sony Playstation and Microsoft Xbox
in the various versions, but also mobile telephones, tablets, etc. The dissemination of connectivity at
increasingly lower costs and the availability of optic fibre networks and high speed mobile networks
enable video games to diversify increasingly, becoming more and more sophisticated and interactive. The
spread of smartphones among the entire population, of all ages and walks of life, has meant that the
developers’ creativity can be expressed in completely new ways, generating forms of entertainment
dedicated to an adult public and the female public too.
The video games market for the Sony Playstation and Microsoft Xbox instead performs in cycles, in
parallel with the life cycle of the consoles themselves for which the video games are developed, as is
standard in almost all technological markets. With the rollout of a given console, the price of the
hardware and the video games designed for it is high, and relatively small quantities are sold. Console and
game prices then gradually go down, as they progress from new releases to maturity, and the quantities
sold increase along with the quality of the video games. The games market for a given console usually
peaks in its fifth year on the market. The lifespan for consoles is currently around seven years. The new
consoles Sony Playstation 4 and Microsoft Xbox One came out in November 2013.
High quality video games with high sales potential, in addition to being marketed on the digital
marketplaces, are also produced physically and distributed through traditional sales networks. In this case,
the value chain is as follows:
Developers are those who create and program the game, which is usually based on an original idea, a hot
brand, a film or event sports simulators, etc. The developers retain the intellectual property rights, but
they transfer the exploitation rights – for a limited amount of time agreed by contract – to international
video game publishers, who are therefore crucial for completing the game and giving it a global
reputation and clientèle.
Publishers allow the game to reach the consumer, as most of them are equipped with direct and indirect
sales networks in various countries. They also finance the phases of development and implement
communication strategies to maximise global sales. The publisher decides on a game’s release schedule,
global pricing and sales policy, positioning, and package design, while taking on all of the risks and,

Digital Bros Group Interim Management Statement as at 30 September 2015
12
jointly with the developer, enjoying all the opportunities that the video game may generate if it is a
success.
The console manufacturer is the company that designs, engineers, produces and markets the hardware or
platform on which consumers play the game. Sony is the console manufacturer for Sony Playstation 4 and
Sony PSP Vita; Microsoft is the console manufacturer for Microsoft Xbox One; and Nintendo is the
console manufacturer for Nintendo 3 DS and Nintendo Wii U. The console manufacturer prints the game
on behalf of publishers in specific plants dedicated to the reproduction of software on the various physical
storage devices used. The video game must be approved in advance by the manufacturer, through a
structured process known as submission. Only publishers selected in advance will be allowed to publish
games by the console manufacturer, according to a licensing publishing agreement. The console
manufacturer and the video game publisher are often one and the same.
The role of the distributor varies from country to country. The more a market is fragmented, like Italy’s,
the more the distributor’s role is integrated with that of the publisher, with the implementation of specific
communication policies for a local audience and public relations strategies. In some markets, like the
U.K. and the U.S., retailers are highly concentrated so publishers usually have a direct commercial
presence. The French and Spanish markets have an intermediate structure somewhere between the Italian
and Anglo-Saxon markets.
The retailer is the outlet where the consumer purchases the game. Retailers can be international chains
specialised in the sale of video games, mass retail stores, specialised independent shops, or online stores.
If video games are distributed in digital format on the marketplaces, but also as regards video games for
smartphones and/or tablets, the value chain is less structured and is as follows:
As distribution goes increasingly digital, console manufacturers have developed “marketplaces” where
video games can be sold directly to the consumer without the need for a distributor or retailer. The main
marketplaces through which the video games for consoles are sold to the end consumer are: PlayStation
Store by Sony, Xbox Live by Microsoft and eShop by Nintendo. The world leader in the digital
distribution of games for personal computers is the marketplace Steam. Through its subsidiaries, the
Group has entered into publishing contracts with all of the marketplaces mentioned.
Concerning games for mobile phones, on the other hand, Apple has its AppStore marketplace for iPhone
and iPad games, while the marketplace for Android technology is GooglePlayStore. The Group has
appropriate distribution agreements with the latter as well.
The digital distribution of a video game considerably extends the life cycle of a product, enabling the
video game to be constantly available on the digital catalogue of the marketplace, a factor that is difficult

Digital Bros Group Interim Management Statement as at 30 September 2015
13
to imagine if the product were to be physically distributed, but also allowing the publisher to run effective
promotions. The extension of the life cycle is also accentuated by the possibility for a publisher to
distribute additional episodes to a video game.
Digital Bros Group Interim Management Statement as at 30 September 2015
14
3. SEASONAL TRENDS
The video game market has some typical seasonal trends. Consumers are most likely to buy in the
autumn, due to the approaching holidays and the imminent cold season when they spend more of their
free time indoors. This is why video game publishers prefer to launch their best products in the fall.
Seasonal trends are also influenced by launching hit products at times other than the traditional Christmas
period. Specifically, quarter-on-quarter results can be volatile depending on whether or not a popular new
game is released during each three-month period. The launch of these products causes sales to build up
just before the official release date, known as “day one”.
The seasonal pattern is even more pronounced for the video game publisher, which usually releases a
limited number of games over the 12-month period, whereas the distributor can count on a steady stream
of new products as its business is to sell the games of different publishers in a given geographical market.
The launch of a game in one quarter as opposed to another concentrates sales in a restricted period of
time, thus magnifying the volatility of revenues between different quarters and/or different years.
The publication and distribution of video games in the digital marketplace reduces, but does not
neutralise, the volatility of a publisher’s results from one quarter to the next. In digital distribution,
revenue is recorded when the end consumers download the video game from the marketplace. This
process takes place more gradually over time and not primarily in the days immediately following launch,
differently to traditional distribution that instead sees revenue at the time of delivery to the
distributor/retailer regardless of the purchase by the end consumer.
The financial structure is also closely related to the pattern in sales. The physical distribution of a product
in a quarter entails the concentration of investments in net working capital, which are temporarily
reflected in the net financial position at least until the revenues from sales are collected.

Digital Bros Group Interim Management Statement as at 30 September 2015
15
4. SIGNIFICANT EVENTS DURING THE PERIOD
The main events during the period were as follows:
Digital Bros S.p.A. purchased 1,149,816 Starbreeze B shares for a total of 902 thousand euros
and disposed of 2,350,507 Starbreeze B ordinary shares for a total of 2,313 thousand euros;
during the period, the Company also purchased 708,264 Starbreeze A ordinary shares for a total
of 621 thousand euros;
in August and September, Digital Bros S.p.A. sold on the open market 270,000 treasury shares
for a total value of 3,045 thousand euros. At the end of the quarter, treasury shares held
amounted to 130,247 ordinary shares;
on 2 September 2015, Digital Bros S.p.A. obtained authorisation to incorporate a company based
in Shenzhen, China, with the purpose of carrying out marketing and business development
activity on the Chinese market in favour of Group companies. Share capital is 100 thousand
euros;
on 11 September 2015, the Group entered into a commitment to subscribe for a capital increase
by the Italian video game developer Ovosonico S.r.l. in the total amount, inclusive of premium,
of 720 thousand euros. The increase will take place in multiple stages and will result in Digital
Bros S.p.A. holding a 49% interest in the company at the end of the transaction, scheduled for 31
July 2016. The company is based in Varese and employs about 25 people. Among the products
already developed, Murasaki Baby, award-winning video game published by Sony Computer
Entertainment, stands out. The first instalment of 49 thousand euros, or 3.34% of capital, was
paid in on 30 September.

Digital Bros Group Interim Management Statement as at 30 September 2015
16
(this page intentionally left blank)

Digital Bros Group Interim Management Statement as at 30 September 2015
17
5. ANALYSIS OF THE ECONOMIC PERFORMANCE AS AT 30
SEPTEMBER 2015
The Group’s results for the period ended on 30 September 2015, with comparative figures for the same
period ended 30 September 2014, are presented below in the reclassified consolidated income statement:
EUR/000 30 September 2015 30 September 2014 Change
1 Gross revenues 26,247 103.6% 29,570 104.0% (3,323) -11.2%
2 Revenue adjustments (908) -3.6% (1,128) -4.0% 220 -19.5%
3 Total net revenues 25,339 100.0% 28,442 100.0% (3,103) -10.9%
4 Purchase of goods for resale (8,684) -34.3% (8,168) -28.7% (516) 6.3%
5 Purchase of services for resale (2,457) -9.7% (1,203) -4.2% (1,254) n.s.
6 Royalties (3,651) -14.4% (9,226) -32.4% 5,575 -60.4%
7 Changes in finished product inventories (154) -0.6% (117) -0.4% (37) n.s.
8 Total cost of sold products (14,946) -59.0% (18,714) -65.8% 3,768 -20.1%
9 Gross profit (3+8) 10,393 41.0% 9,728 34.2% 665 6.8%
10 Other revenues 1,299 5.1% 43 0.2% 1,256 n.s.
11 Cost of services (3,266) -12.9% (3,050) -10.7% (216) 7.1%
12 Rent and leasing (388) -1.5% (367) -1.3% (21) 5.7%
13 Personnel costs (4,894) -19.3% (3,137) -11.0% (1,757) 56.0%
14 Other operating expenses (391) -1.5% (290) -1.0% (101) 35.0%
15 Total operating costs (8,939) -35.3% (6,844) -24.1% (2,095) 30.6%
16 EBITDA (9+10+15) 2,753 10.9% 2,927 10.3% (174) -6.0%
17 Amortisation and depreciation (890) -3.5% (429) -1.5% (461) n.s.
18 Provisions 0 0.0% 0 0.0% 0 0.0%
19 Write-down of assets 0 0.0% (332) -1.2% 332 n.s.
20 Write-backs and non-monetary income 0 0.0% 0 0.0% 0 0.0%
21
Total non-monetary income and
operating costs (890) -3.5% (761) -2.7% (129) 16.9%
22 EBIT (16+21) 1,863 7.4% 2,166 7.6% (303) -14.0%
23 Interest and financial income 1,045 4.1% 961 3.4% 84 8.6%
24 Interest and financial expenses (363) -1.4% (474) -1.7% 111 -23.4%
25 Financial income and charges 682 2.7% 487 1.7% 195 40.1%
26 Pre-tax income (22+25) 2,545 10.0% 2,653 9.3% (108) -4.1%
27 Current taxes (922) -3.6% (657) -2.3% (264) 40.2%
28 Deferred taxes (55) -0.2% (346) -1.2% 290 -84.2%
29 Total income taxes (977) -3.9% (1,003) -3.5% 26 -2.6%
30 Net profit (26+29) 1,568 6.2% 1,650 5.8% (82) -5.0%
Net income per share:
33 Basic earnings per share (in euros) 0.11 0.12 (0.01) -8.3%
34 Diluted earnings per share (in euros) 0.11 0.12 (0.01) -8.3%
Digital Bros Group Interim Management Statement as at 30 September 2015
18
The quarter saw the launch on the Italian market of the video games Metal Gear Solid V and PES 2016, in
addition to the launch of Daily Fantasy Sport Fantasfida on the Italian market only. Fantasfida is a skill
game in which the player fields a team of seven football players and participates in a tournament, after
paying entry dues, held during a day of championship and/or European cup competitions. Fantasfida is
operated under concession from the Italian State Monopoly Administration (AAMS) held by the
subsidiary Game Network S.r.l. No new product launches took place in the Publishing and Mobile
business segments.
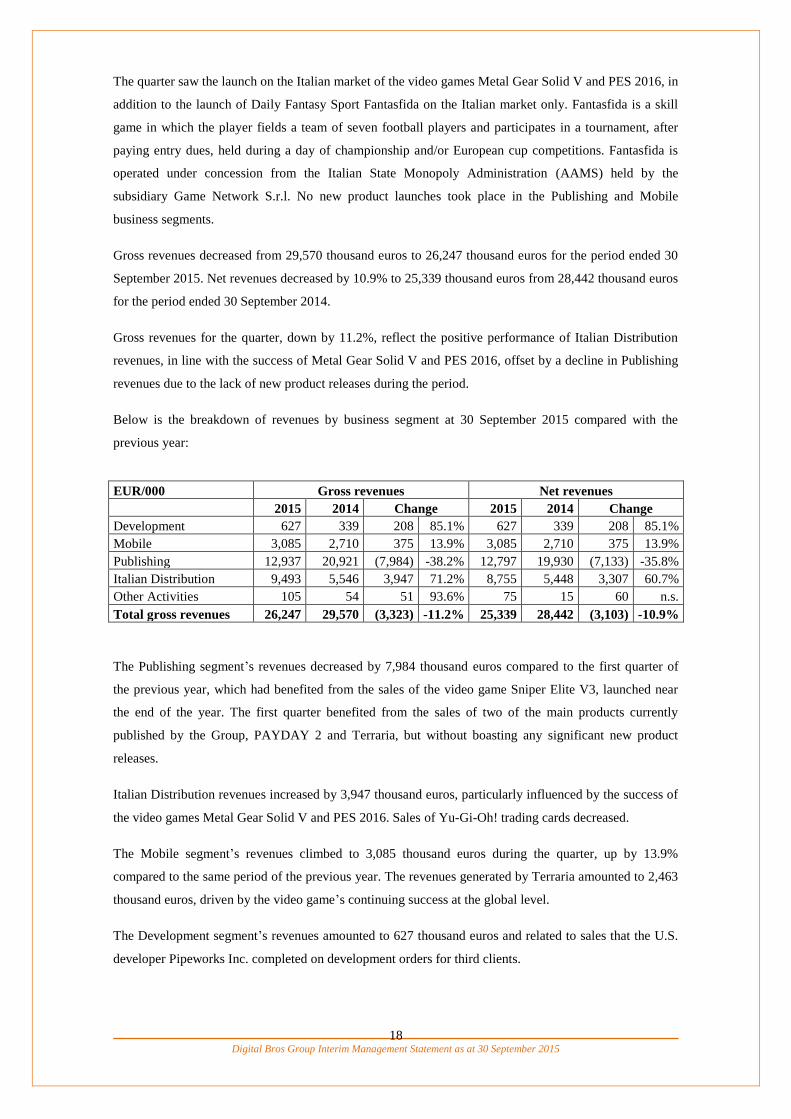
Gross revenues decreased from 29,570 thousand euros to 26,247 thousand euros for the period ended 30
September 2015. Net revenues decreased by 10.9% to 25,339 thousand euros from 28,442 thousand euros
for the period ended 30 September 2014.
Gross revenues for the quarter, down by 11.2%, reflect the positive performance of Italian Distribution
revenues, in line with the success of Metal Gear Solid V and PES 2016, offset by a decline in Publishing
revenues due to the lack of new product releases during the period.
Below is the breakdown of revenues by business segment at 30 September 2015 compared with the
previous year:
EUR/000 Gross revenues Net revenues
2015 2014 Change 2015 2014 Change
Development 627 339 208 85.1% 627 339 208 85.1%
Mobile 3,085 2,710 375 13.9% 3,085 2,710 375 13.9%
Publishing 12,937 20,921 (7,984) -38.2% 12,797 19,930 (7,133) -35.8%
Italian Distribution 9,493 5,546 3,947 71.2% 8,755 5,448 3,307 60.7%
Other Activities 105 54 51 93.6% 75 15 60 n.s.
Total gross revenues 26,247 29,570 (3,323) -11.2% 25,339 28,442 (3,103) -10.9%
The Publishing segment’s revenues decreased by 7,984 thousand euros compared to the first quarter of
the previous year, which had benefited from the sales of the video game Sniper Elite V3, launched near
the end of the year. The first quarter benefited from the sales of two of the main products currently
published by the Group, PAYDAY 2 and Terraria, but without boasting any significant new product
releases.
Italian Distribution revenues increased by 3,947 thousand euros, particularly influenced by the success of
the video games Metal Gear Solid V and PES 2016. Sales of Yu-Gi-Oh! trading cards decreased.
The Mobile segment’s revenues climbed to 3,085 thousand euros during the quarter, up by 13.9%
compared to the same period of the previous year. The revenues generated by Terraria amounted to 2,463
thousand euros, driven by the video game’s continuing success at the global level.
The Development segment’s revenues amounted to 627 thousand euros and related to sales that the U.S.
developer Pipeworks Inc. completed on development orders for third clients.

Digital Bros Group Interim Management Statement as at 30 September 2015
19
The cost of goods decreased by 20.1%, greater than the decline in revenues, from 18,714 thousand euros
to 14,946 thousand euros.
Gross profit thus rose by 6.8% from 9,728 thousand euros for the period ended 30 September 2014 to
10,393 thousand euros for the period ended 30 September 2015.
Other revenues, which were essentially nil in previous years, represented a considerable component
during the period, amounting to 1,299 thousand euros. They consisted of the capitalisation of internal
work as part of the development projects carried out on behalf of Group companies by the subsidiaries
Pipeworks Inc. and DR Studios Ltd.
Operating expenses increased by 30.6%, rising from 6,844 thousand euros for the period ended 30
September 2014 to 8,939 thousand euros for the period ended 30 September 2015, primarily due to the
rise in personnel costs of 1,757 thousand euros, following the acquisition of two development studios that
in the previous year had only been consolidated with respect to the month of September. During the
quarter, advertising costs of 533 thousand euros were incurred in connection with the investment in the
launch of Fantasfida.
EBITDA was 2,753 thousand euros, compared to 2,927 thousand euros for the period ended 30
September 2014, down by 6%.
Non-monetary operating costs increased by 129 thousand euros, due to the increase in amortisation of 461
thousand euros to reflect the investments undertaken by the Group with the acquisitions of 100% of
Pipeworks Inc. and DR Studios Ltd., partially offset by the decline in write-downs of assets of 332
thousand euros.
EBIT thus decreased by 303 thousand euros, falling from 2,166 thousand euros for the period ended 30
September 2014 to 1,863 thousand euros in the current period.
Net financial income amounted to 682 thousand euros, compared to 487 thousand euros in the same
period of the previous year. Interest income increased by 84 thousand euros due to the measurement at
fair value of the Starbreeze B shares (842 thousand euros) and exchange gains of 203 thousand euros,
compared to exchange gains of 961 thousand euros in the first quarter of the previous year. Interest
expenses decreased by 111 thousand euros, in line with the lower average debt for the period.
Pre-tax income for the period ended 30 September 2015 was 2,545 thousand euros, compared to the 2,653
thousand euros recorded during the same period of last year. Net profit was 1,568 thousand euros, equal
to 6.2% of revenues, with respect to the profit of 1,650 thousand euros for the period ended 30 September
2014.
Basic and diluted net earnings per share came to 0.11 euros, versus earnings per share of 0.12 euros in the
same period of the previous year.
Please refer to the specific sections in the report for more information regarding the Group’s performance
in its various business segments, including through subsidiaries.

Digital Bros Group Interim Management Statement as at 30 September 2015
20
(this page intentionally left blank)

Digital Bros Group Interim Management Statement as at 30 September 2015
21
6. ANALYSIS OF THE STATEMENT OF FINANCIAL POSITION AS AT 30
SEPTEMBER 2015
The Group’s reclassified statement of financial position at 30 September 2015 is shown below, with
comparative figures at 30 June 2015:
EUR/000 30 September 2015 30 June 2015 Change
Non-current assets
1 Property, plant and equipment 4,867 4,841 26 0.5%
2 Investment property 0 0 0 0.0%
3 Intangible assets 8,641 7,946 695 8.7%
4 Equity investments 2,227 1,274 953 0.0%
5 Non-current receivables and other assets 1,056 1,058 (2) -0.2%
6 Deferred tax assets 2,123 2,240 (117) -5.2%
Total non-current assets 18,914 17,359 1,555 9.0%
Non-current liabilities
7 Employee benefits (473) (486) 13 -2.6%
8 Non-current provisions (137) (170) 33 -19.7%
9 Other non-current payables and liabilities 0 (589) 589 n.s.
Total non-current liabilities (610) (1,245) 635 -51.0%
Net working capital
10 Inventories 12,727 12,881 (154) -1.2%
11 Trade receivables 36,259 36,350 (91) -0.3%
12 Tax credits 3,283 2,466 817 33.1%
13 Other current assets 9,384 6,148 3,236 52.6%
14 Trade payables (23,314) (26,929) 3,615 -13.4%
15 Tax payables (4,063) (3,029) (1,034) 34.1%
16 Current provisions 0 0 0 0.0%
17 Other current liabilities (2,177) (1,859) (318) 17.1%
Total net working capital 32,099 26,028 6,071 23.3%
Shareholders’ equity
18 Share capital (5,644) (5,644) 0 0.0%
19 Reserves (19,472) (19,417) (55) 0.3%
20 Treasury shares 390 1,199 (809) -67.5%
21 Retained earnings (losses) (13,751) (9,947) (3,804) 38.2%
Total shareholders’ equity (38,477) (33,809) (4,668) 13.8%
Total net assets 11,926 8,333 3,593 43.1%
22 Cash and cash equivalents 4,192 4,339 (147) -3.4%
23 Current payables to banks (14,570) (12,738) (1,832) 14.4%
24
Other current financial assets and
liabilities (178) 1,685 (1,863) n.s.
Current net financial position (10,556) (6,714) (3,842) 57.2%
25 Non-current financial assets 0 0 0 0.0%
26 Non-current payables to banks (1,370) (1,619) 249 -15.4%
27 Other non-current financial liabilities 0 0 0 0.0%
Non-current net financial position (1,370) (1,619) 249 -15.4%
Total net financial position (11,926) (8,333) (3,593) 43.1%

Digital Bros Group Interim Management Statement as at 30 September 2015
22
Non-current assets were up by 1,555 thousand euros compared to 30 June 2015 due to the increase in
intangible assets of 695 thousand euros due to the projects developed internally by Pipeworks Inc. and
DR Studios Ltd. and the increase in equity investments of 953 thousand euros, primarily due to the
purchase of the Starbreeze A shares.
Non-current liabilities decreased by 635 thousand euros, primarily due to the reclassification among other
current liabilities of the estimated earn out payable of 589 thousand euros arising from the purchase
agreement for DR Studios Ltd.
Net working capital was up by 6,071 thousand euros compared to 30 June 2015 due to the increase in
other current assets of 3,236 thousand euros and the decrease in trade payables of 3,615 thousand euros,
only partially offset by the increase in tax payables of 1,034 thousand euros. The changes in the other
components were minor.
An analysis of net working capital in comparison with figures at 30 June 2015 is provided below:
EUR/000 30 September 2015 30 June 2015 Change
Inventories 12,727 12,881 (154) -1.2%
Trade receivables 36,259 36,350 (91) -0.3%
Tax credits 3,283 2,466 817 33.1%
Other current assets 9,384 6,148 3,236 52.6%
Trade payables (23,314) (26,929) 3,615 -13.4%
Tax payables (4,063) (3,029) (1,034) 34.1%
Current provisions 0 0 0 0.0%
Other current liabilities (2,177) (1,859) (318) 17.1%
Total net working capital 32,099 26,028 6,071 23.3%
Net debt decreased to 11,926 thousand euros, up by 3,593 thousand euros compared to 30 June 2015,
mainly due to an increase in current payables to banks of 1,832 thousand euros and the decrease in other
current financial assets and liabilities of 1,863 thousand euros.
In the table below, the net financial position is compared with the situation at 30 September 2015:
EUR/000 30 September 2015 30 June 2015 Change
Cash and cash equivalents 4,192 4,339 (147) -3.4%
Current payables to banks (14,570) (12,738) (1,832) 14.4%
Other current financial assets and liabilities (178) 1,685 (1,863) n.s.
Current net financial position (10,556) (6,714) (3,842) 57.2%
Non-current financial assets 0 0 0 0.0%
Non-current payables to banks (1,370) (1,619) 249 -15.4%
Other non-current financial liabilities 0 0 0 0.0%
Non-current net financial position (11,926) (8,333) (3,593) -15.4%
Total net financial position (11,926) (8,333) (3,593) 43.1%
For further details, see the consolidated statement of cash flows.
Digital Bros Group Interim Management Statement as at 30 September 2015
23
7. PERFORMANCE OF BUSINESS SEGMENTS
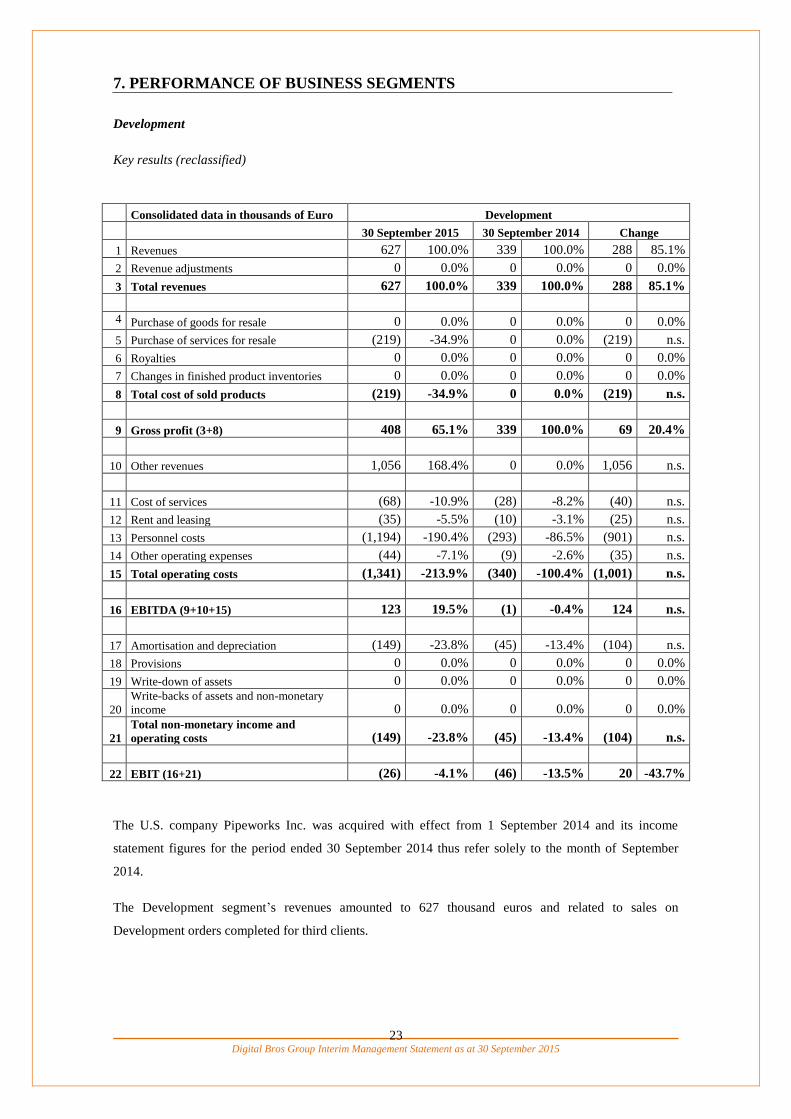
Development
Key results (reclassified)
Consolidated data in thousands of Euro Development
30 September 2015 30 September 2014 Change
1 Revenues 627 100.0% 339 100.0% 288 85.1%
2 Revenue adjustments 0 0.0% 0 0.0% 0 0.0%
3 Total revenues 627 100.0% 339 100.0% 288 85.1%
4 Purchase of goods for resale 0 0.0% 0 0.0% 0 0.0%
5 Purchase of services for resale (219) -34.9% 0 0.0% (219) n.s.
6 Royalties 0 0.0% 0 0.0% 0 0.0%
7 Changes in finished product inventories 0 0.0% 0 0.0% 0 0.0%
8 Total cost of sold products (219) -34.9% 0 0.0% (219) n.s.
9 Gross profit (3+8) 408 65.1% 339 100.0% 69 20.4%
10 Other revenues 1,056 168.4% 0 0.0% 1,056 n.s.
11 Cost of services (68) -10.9% (28) -8.2% (40) n.s.
12 Rent and leasing (35) -5.5% (10) -3.1% (25) n.s.
13 Personnel costs (1,194) -190.4% (293) -86.5% (901) n.s.
14 Other operating expenses (44) -7.1% (9) -2.6% (35) n.s.
15 Total operating costs (1,341) -213.9% (340) -100.4% (1,001) n.s.
16 EBITDA (9+10+15) 123 19.5% (1) -0.4% 124 n.s.
17 Amortisation and depreciation (149) -23.8% (45) -13.4% (104) n.s.
18 Provisions 0 0.0% 0 0.0% 0 0.0%
19 Write-down of assets 0 0.0% 0 0.0% 0 0.0%
20
Write-backs of assets and non-monetary
income 0 0.0% 0 0.0% 0 0.0%
21
Total non-monetary income and
operating costs (149) -23.8% (45) -13.4% (104) n.s.
22 EBIT (16+21) (26) -4.1% (46) -13.5% 20 -43.7%
The U.S. company Pipeworks Inc. was acquired with effect from 1 September 2014 and its income
statement figures for the period ended 30 September 2014 thus refer solely to the month of September
2014.
The Development segment’s revenues amounted to 627 thousand euros and related to sales on
Development orders completed for third clients.

Digital Bros Group Interim Management Statement as at 30 September 2015
24
Other revenues include direct costs on development projects that Pipeworks Inc. incurred for orders with
Group companies and in the period total 1,056 thousand euros. The item can be broken down by order as
follows:
EUR/000 Personnel costs Other costs Total
Prominence Poker 457 146 603
Galapagos 120 0 120
Superfight 99 17 116
Quality Assurance 104 2 106
Other projects 81 30 111
Total 861 195 1,056
The Prominence Poker project is particularly important, as it will result in the release in the third quarter
of the versions for next-generation consoles and the Steam personal computer video game platform. The
game, which is currently in development, draws on Pipeworks’ experience, following its previous
development of World Series of Poker for Microsoft.
Personnel costs were the most significant component of operating costs, amounting to 1,194 thousand
euros. At the monthly level, costs increased compared to the previous year, when costs of 293 thousand
euros were recorded in September alone, primarily due to the reinforcement of the Quality Assurance
Division in response to the greater needs identified by Group companies.
Amortisation/depreciation is for 39 thousand euros relative to the intangible assets brought by Pipeworks
Inc. to the Group, and for 110 thousand euros relative to the allocation of the difference between the price
paid for the acquisition and the shareholders’ equity adjusted to fit with the Group’s accounting standards.

Digital Bros Group Interim Management Statement as at 30 September 2015
25
Publishing
Key results (reclassified)
Consolidated data in thousands of Euro Publishing
30 September 2015 30 September 2014 Change
1 Revenues 12,937 101.1% 20,921 105.0% (7,984) -38.2%
2 Revenue adjustments (140) -1.1% (991) -5.0% 851 -85.8%
3 Total revenues 12,797 100.0% 19,930 100.0% (7,133) -35.8%
4 Purchase of goods for resale (2,463) -19.2% (4,748) -23.8% 2,285 -48.1%
5 Purchase of services for resale (1,836) -14.3% (894) -4.5% (942) n.s.
6 Royalties (2,281) -17.8% (7,276) -36.5% 4,995 -68.6%
7 Changes in finished product inventories (106) -0.8% 268 1.3% (374) n.s.
8 Total cost of sold products (6,686) -52.2% (12,650) -63.5% 5,964 -47.1%
9 Gross profit (3+8) 6,111 47.8% 7,280 36.5% (1,169) -16.1%
10 Other revenues 33 0.3% 4 0.0% 29 n.s.
11 Cost of services (1,278) -10.0% (1,800) -9.0% 522 -29.0%
12 Rent and leasing (125) -1.0% (141) -0.7% 16 -10.9%
13 Personnel costs (1,658) -13.0% (1,316) -6.6% (342) 25.9%
14 Other operating expenses (143) -1.1% (109) -0.5% (34) 31.3%
15 Total operating costs (3,204) -25.0% (3,366) -16.9% 162 -4.8%
16 EBITDA (9+10+15) 2,940 23.0% 3,918 19.7% (978) -25.0%
17 Amortisation and depreciation (292) -2.3% (147) -0.7% (145) 98.9%
18 Provisions 0 0.0% 0 0.0% 0 0.0%
19 Write-down of assets 0 0.0% 0 0.0% 0 0.0%
20
Write-backs of assets and non-monetary
income 0 0.0% 0 0.0% 0 0.0%
21
Total non-monetary income and
operating costs (292) -2.3% (147) -0.7% (145) 98.9%
22 EBIT (16+21) 2,648 20.7% 3,771 18.9% (1,123) -29.8%
The Publishing segment’s revenues decreased by 7,984 thousand euros compared to the first quarter of
the previous year, which had benefited from the sales of the video game Sniper Elite V3, launched near
the end of the year. The first quarter benefited from the sales of two of the main products currently
published by the Group, PAYDAY 2 and Terraria, but without boasting any significant new product
releases.
Details of revenues divided up according to the main products published by the Group during the period
are as follows:

Digital Bros Group Interim Management Statement as at 30 September 2015
26
Data in thousands of Euro 30 September 2015 30 September 2014 Change
Sniper Elite V3 2,253 14,209 (11,956)
PAYDAY 2 6,726 3,828 2,898
Terraria 1,785 961 824
How to Survive 441 308 133
Sniper Elite V2 86 622 (536)
Brothers 1,333 100 1,233
Other 313 893 (580)
Total revenues - Publishing 12,937 20,921 (7,984)
A breakdown of revenues as at 30 September 2015, divided up according to type of distribution channel
and compared with the same data of the previous period, yields the following:
Revenues in thousands of Euro 30 September 2015 30 September 2014 Change
Revenues from retail distribution 6,483 12,828 (6,345) -49.5%
Revenues from digital distribution 6,446 8,029 (1,583) -19.7%
Revenues from sub-licensing 8 64 (56) -87.5%
Total revenues - Publishing 12,937 20,921 (7,984) -38.2%
Digital distribution revenues as at 30 September 2015 are broken down below by digital marketplace, as
follows:
Revenues in thousands of Euro 30 September 2015 30 September 2014 Change
Sony Playstation Network 2,239 2,668 (429)
Steam 2,114 2,235 (121)
Microsoft Xbox Live 2,036 2,949 (913)
Other marketplaces 57 177 (120)
Total revenues from digital distribution 6,446 8,029 (1,583)
Revenue adjustments are down 851 thousand euros, with a percentage decline of 85.2%, thus allowing the
reduction of net revenues to be limited to 35.8% as compared with the 38.2% of gross revenues. The item
includes the estimated credit notes for unsold products that the Group forecasts having to issue to
customers in the near future and was also down as a result of the decrease in retail distribution revenues.
The cost of goods sold decreased by 47.1%, to an extent more than proportional to the decrease in
revenues, thus limiting the decline in the business segment’s gross profit to 16.1%, or 1,169 thousand
euros.
Operating costs were down by 162 thousand euros, due to the decline in the cost of services of 522
thousand euros, as a result of lower advertising investments in support of products, offset by an increase
in personnel costs of 342 thousand euros, following the increase in the number of employees.
Non-monetary operating costs increased by 145 thousand euros as a result of greater amortisation of the
intellectual property owned.

Digital Bros Group Interim Management Statement as at 30 September 2015
27
Mobile
Key results (reclassified)
Consolidated data in thousands of Euro Mobile
30 September 2015 30 September 2014 Change
1 Revenues 3,085 100.0% 2,710 100.0% 375 13.9%
2 Revenue adjustments 0 0.0% 0 0.0% 0 0.0%
3 Total revenues 3,085 100.0% 2,710 100.0% 375 13.9%
4 Purchase of goods for resale 0 0.0% 0 0.0% 0 0.0%
5 Purchase of services for resale (395) -12.8% (303) -11.2% (92) 30.5%
6 Royalties (1,351) -43.8% (1,950) -72.0% 599 -30.7%
7 Changes in finished product inventories 0 0.0% 0 0.0% 0 0.0%
8 Total cost of sold products (1,746) -56.6% (2,253) -83.1% 507 -22.5%
9 Gross profit (3+8) 1,339 43.4% 457 16.9% 882 n.s.
10 Other revenues 146 4.7% 15 0.6% 131 n.s.
11 Cost of services (184) -6.0% (162) -6.0% (22) 13.8%
12 Rent and leasing (18) -0.6% (3) -0.1% (15) n.s.
13 Personnel costs (738) -23.9% (406) -15.0% (332) 81.8%
14 Other operating expenses (19) -0.6% (5) -0.2% (14) n.s.
15 Total operating costs (959) -31.1% (576) -21.3% (383) 66.5%
16 EBITDA (9+10+15) 526 17.0% (104) -3.9% 630 n.s.
17 Amortisation and depreciation (339) -11.0% (133) -4.9% (206) n.s.
18 Provisions 0 0.0% 0 0.0% 0 0.0%
19 Write-down of assets 0 0.0% 0 0.0% 0 0.0%
20 Write-backs of assets and non-monetary income 0 0.0% 0 0.0% 0 0.0%
21 Total non-monetary income and operating costs (339) -11.0% (133) -4.9% (206) n.s.
22 EBIT (16+21) 187 6.1% (237) -8.7% 424 n.s.
The Mobile segment’s revenues climbed to 3,085 thousand euros during the quarter, up by 13.9%
compared to the same period of the previous year. The revenues generated by Terraria amounted to 2,463
thousand euros, driven by the video game’s continuing success at the global level.
Revenue trends of the business segment generated during the period are shown for the main products
below:
Revenues in thousands of Euro 30 September 2015 30 September 2014 Change
Terraria 2,463 2,275 188
Battle Islands 465 264 201
Other products 157 171 (14)
Total revenues - Mobile 3,085 2,710 375
The video game Battle Islands, developed by the subsidiary DR Studios Ltd. and launched in December
2013, made a 465 thousand euros contribution towards period revenues. Differently to Terraria, which is

Digital Bros Group Interim Management Statement as at 30 September 2015
28
distributed in exchange for payment on the main digital marketplaces, Battle Islands can instead be
downloaded free of charge and has purchase functions available to the player while playing.
The cost of goods sold comprises only purchases of services and royalties. The first, which come to 395
thousand euros in the year, consist of localisation costs, ratings and quality assurance, as well as the costs
incurred for live support services. This is a development activity that is carried out after the game is
launched and which helps maintain and improve the game to encourage the player to pay out and continue
playing. Details of costs for services by type are as follows:
Data in thousands of Euro 30 September 2015 30 September 2014 Change
Live support 223 83 140
Programming 27 73 (46)
Quality assurance 113 128 (15)
Other 32 25 7
Total 395 309 86
The decrease in royalty costs was due to the smaller losses (160 thousand euros compared to 535
thousand euros in the same period of the previous year) recorded by the Group due to the early
discontinuation of the development of video games deemed unprofitable.
Operating costs include services (mostly advertising to promote products on the various platforms) and
personnel costs. The increase in personnel costs was related to the acquiree DR Studios Ltd., which
during the previous year was only consolidated with respect to the month of September.
Amortisation and depreciation increased by 206 thousand euros and were composed of:
Data in thousands of Euro
Amortisation/depreciation of Battle Islands 261
Amortisation of intangible assets 66
Depreciation of tangible assets 12
Total 339
Period EBIT came to 187 thousand euros, as compared with negative EBIT of 237 thousand euros
recorded for the period ended 30 September 2014.

Digital Bros Group Interim Management Statement as at 30 September 2015
29
Italian Distribution
Key results (reclassified)
Consolidated data in thousands of Euro Italian Distribution
30 September 2015 30 September 2014 Change
1 Revenues 9,493 108.4% 5,546 101.8% 3,947 71.2%
2 Revenue adjustments (738) -8.4% (98) -1.8% (640) n.s.
3 Total revenues 8,755 100.0% 5,448 100.0% 3,307 60.7%
4 Purchase of goods for resale (6,221) -71.1% (3,420) -62.8% (2,801) 81.9%
5 Purchase of services for resale 0 0.0% 0 0.0% 0 0.0%
6 Royalties 0 0.0% 0 0.0% 0 0.0% 7 Changes in finished product inventories (48) -0.5% (385) -7.1% 337 -87.6%
8 Total cost of sold products (6,269) -71.6% (3,805) -69.9% (2,464) 64.7%
9 Gross profit (3+8) 2,486 28.4% 1,643 30.2% 843 51.3%
10 Other revenues 4 0.0% 24 0.4% (20) -82.1%
11 Cost of services (727) -8.3% (604) -11.1% (123) 20.4%
12 Rent and leasing (12) -0.1% (13) -0.2% 1 -11.7%
13 Personnel costs (488) -5.6% (399) -7.3% (89) 22.3%
14 Other operating expenses (69) -0.8% (67) -1.2% (2) 3.3%
15 Total operating costs (1,296) -14.8% (1,083) -19.9% (213) 19.6%
16 EBITDA (9+10+15) 1,194 13.6% 584 10.7% 610 n.s.
17 Amortisation and depreciation (42) -0.5% (55) -1.0% 13 -22.6%
18 Provisions 0 0.0% 0 0.0% 0 0.0%
19 Write-down of assets 0 0.0% 0 0.0% 0 0.0%
20
Write-backs of assets and non-monetary
income 0 0.0% 0 0.0% 0 0.0%
21
Total non-monetary income and
operating costs (42) -0.5% (55) -1.0% 13 -22.6%
22 EBIT (16+21) 1,152 13.2% 529 9.7% 623 n.s.
Italian Distribution revenues increased by 3,947 thousand euros, particularly influenced by the success of
the video games Metal Gear Solid V and PES 2016. Sales of Yu-Gi-Oh! trading cards decreased.
The breakdown of gross revenues by type of game distributed is as follows:
EUR/000 30 September 2015 30 September 2014 Change
Distribution of video games for consoles 7,505 782 6,723 n.s.
Distribution of video games for PC-CDRom 209 118 91 77.0%
Distribution of trading cards 1,437 4,574 (3,137) -68.6%
Distribution of other products and services 356 135 221 n.s.
Financial discounts (14) (63) 49 -77.8%
Total gross revenues - Italian Distribution 9,493 5,546 3,947 71.2%

Digital Bros Group Interim Management Statement as at 30 September 2015
30
In order to better understand the quarterly trend in gross revenues, the breakdown of distribution revenues
by console is shown below:
EUR/000 30 September 2015 30 September 2014 Change
Units Turnover Units Turnover Units Turnover
Sony Playstation 4 102,074 4,435 2,046 92 n.s. n.s.
Sony Playstation 3 50,731 1,550 19,023 211 n.s. n.s.
Microsoft Xbox One 17,459 754 1,923 78 n.s. n.s.
Microsoft Xbox 360 25,179 733 13,863 162 81.6% n.s.
Other consoles 5,736 31 11,046 239 -48.1% -87.0%
Total console revenues 201,179 7,505 47,901 782 n.s. n.s.
The comparison with the first quarter of the previous year is difficult due to the limited turnover recorded
by the business segment in the first quarter of the previous year. The business segment showed an
increase in console video game distribution revenues of 7,178 thousand euros, due to the concurrent
launch during the period of two video games that met with very high levels of success with the public:
Metal Gear Solid V and PES 2016.
Sales of Yu-Gi-Oh! collectible cards decreased by 3,137 thousand euros.
Net revenues came to 8,755 thousand euros, an increase of 60.7 % compared to the previous year.
The cost of goods sold was up by 2,464 thousand euros (64.7%), a higher increase than that of net
revenues. Gross profits were consequently up by 843 thousand euros, marking a 51.3% increase.
Operating costs increased by 19.6% (213 thousand euros) compared with the same period of the prior
year. This increase was primarily due to the rise in the cost of services of 123 thousand euros as a result
of the greater advertising investments associated with the release of PES 2016 earlier than in the previous
year, and an increase in personnel costs of 89 thousand euros.
EBIT increased by 623 thousand euros, rising from 529 thousand euros during the period ended 30
September 2014 to 1,152 thousand euros in the current quarter.
Digital Bros Group Interim Management Statement as at 30 September 2015
31
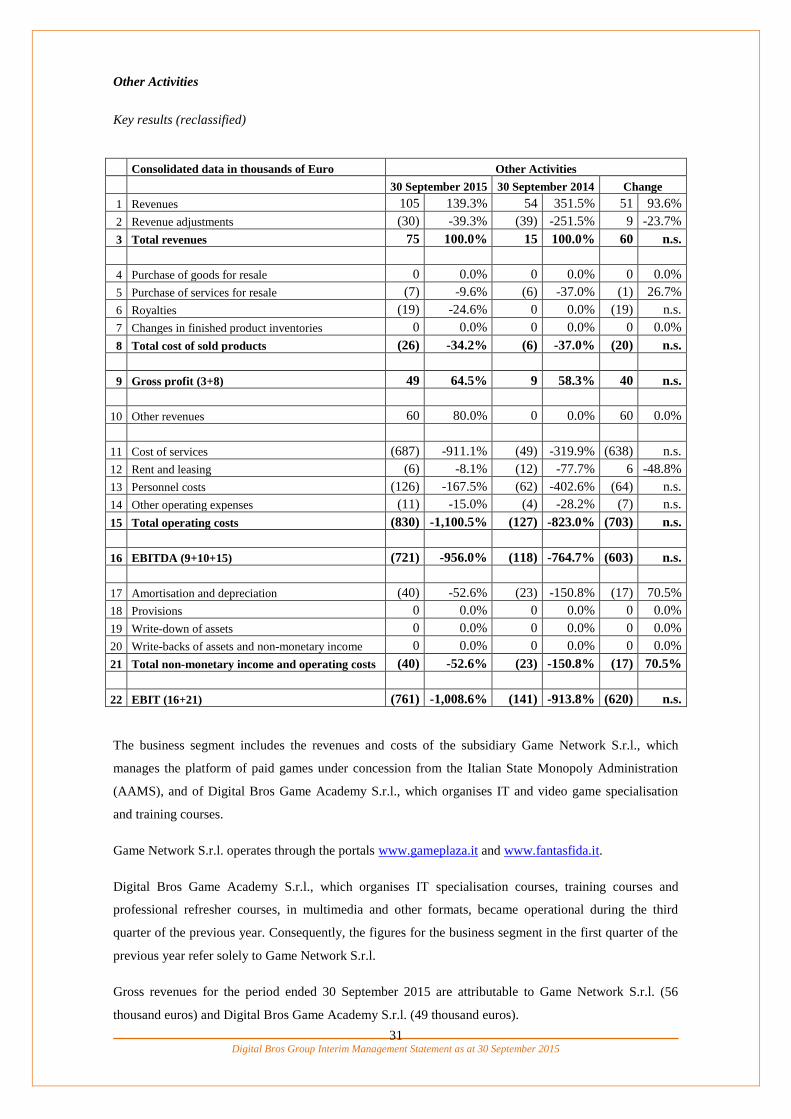
Other Activities
Key results (reclassified)
Consolidated data in thousands of Euro Other Activities
30 September 2015 30 September 2014 Change
1 Revenues 105 139.3% 54 351.5% 51 93.6%
2 Revenue adjustments (30) -39.3% (39) -251.5% 9 -23.7%
3 Total revenues 75 100.0% 15 100.0% 60 n.s.
4 Purchase of goods for resale 0 0.0% 0 0.0% 0 0.0%
5 Purchase of services for resale (7) -9.6% (6) -37.0% (1) 26.7%
6 Royalties (19) -24.6% 0 0.0% (19) n.s.
7 Changes in finished product inventories 0 0.0% 0 0.0% 0 0.0%
8 Total cost of sold products (26) -34.2% (6) -37.0% (20) n.s.
9 Gross profit (3+8) 49 64.5% 9 58.3% 40 n.s.
10 Other revenues 60 80.0% 0 0.0% 60 0.0%
11 Cost of services (687) -911.1% (49) -319.9% (638) n.s.
12 Rent and leasing (6) -8.1% (12) -77.7% 6 -48.8%
13 Personnel costs (126) -167.5% (62) -402.6% (64) n.s.
14 Other operating expenses (11) -15.0% (4) -28.2% (7) n.s.
15 Total operating costs (830) -1,100.5% (127) -823.0% (703) n.s.
16 EBITDA (9+10+15) (721) -956.0% (118) -764.7% (603) n.s.
17 Amortisation and depreciation (40) -52.6% (23) -150.8% (17) 70.5%
18 Provisions 0 0.0% 0 0.0% 0 0.0%
19 Write-down of assets 0 0.0% 0 0.0% 0 0.0%
20 Write-backs of assets and non-monetary income 0 0.0% 0 0.0% 0 0.0%
21 Total non-monetary income and operating costs (40) -52.6% (23) -150.8% (17) 70.5%
22 EBIT (16+21) (761) -1,008.6% (141) -913.8% (620) n.s.
The business segment includes the revenues and costs of the subsidiary Game Network S.r.l., which
manages the platform of paid games under concession from the Italian State Monopoly Administration
(AAMS), and of Digital Bros Game Academy S.r.l., which organises IT and video game specialisation
and training courses.
Game Network S.r.l. operates through the portals www.gameplaza.it and www.fantasfida.it.
Digital Bros Game Academy S.r.l., which organises IT specialisation courses, training courses and
professional refresher courses, in multimedia and other formats, became operational during the third
quarter of the previous year. Consequently, the figures for the business segment in the first quarter of the
previous year refer solely to Game Network S.r.l.
Gross revenues for the period ended 30 September 2015 are attributable to Game Network S.r.l. (56
thousand euros) and Digital Bros Game Academy S.r.l. (49 thousand euros).

Digital Bros Group Interim Management Statement as at 30 September 2015
32
Other revenues represent the increase in internal processing orders relating to the direct costs incurred for
the product Fantasfida.it, which was launched in September 2015.
Revenue adjustments consist entirely of taxes paid on the revenues earned by the portals
www.gameplaza.it and www.fantasfida.it.
Operating costs include services (mostly advertising expenses of 533 thousand euros for the launch of the
game Fantasfida), the partnership costs typical of the business in which Game Network S.r.l. operates, the
costs of teachers for Digital Bros Game Academy S.r.l. and personnel costs.
EBIT was a negative 761 thousand euros, primarily due to the costs of launching Fantasfida.

Digital Bros Group Interim Management Statement as at 30 September 2015
33
Holding
Key results (reclassified)
Consolidated data in thousands of Euro Holding
30 September 2015 30 September 2014 Change
1 Revenues 0 0.0% 0 0.0% 0 0.0%
2 Revenue adjustments 0 0.0% 0 0.0% 0 0.0%
3 Total revenues 0 0.0% 0 0.0% 0 0.0%
4 Purchase of goods for resale 0 0.0% 0 0.0% 0 0.0%
5 Purchase of services for resale 0 0.0% 0 0.0% 0 0.0%
6 Royalties 0 0.0% 0 0.0% 0 0.0%
7 Changes in finished product inventories 0 0.0% 0 0.0% 0 0.0%
8 Total cost of sold products 0 0.0% 0 0.0% 0 0.0%
9 Gross profit (3+8) 0 0.0% 0 0.0% 0 0.0%
10 Other revenues 0 0.0% 0 0.0% 0 0.0%
11 Cost of services (322) 0.0% (407) 0.0% 85 -20.9%
12 Rent and leasing (192) 0.0% (188) 0.0% (4) 0.0%
13 Personnel costs (690) 0.0% (661) 0.0% (29) 4.4%
14 Other operating expenses (105) 0.0% (96) 0.0% (9) 9.4%
15 Total operating costs (1,309) 0.0% (1,352) 0.0% 43 -3.1%
16 EBITDA (9+10+15) (1,309) 0.0% (1,352) 0.0% 43 3.1%
17 Amortisation and depreciation (28) 0.0% (26) 0.0% (2) 0.0%
18 Provisions 0 0.0% 0 0.0% 0 0.0%
19 Write-down of assets 0 0.0% (332) 0.0% 332 n.s.
20 Write-backs of assets and non-monetary income 0 0.0% 0 0.0% 0 0.0%
21 Total non-monetary income and operating costs (28) 0.0% (358) 0.0% 330 92.3%
22 EBIT (16+21) (1,337) 0.0% (1,710) 0.0% 373 21.8%
The increasing importance of the Mobile and Publishing business segments and the corresponding
reduction of the business segment of Italian Distribution has brought about the need for a more extensive
holding structure than before, in particular for the finance, administration, information technology and
general services functions. These are carried out directly by the parent, Digital Bros S.p.A., and among
other activities include the coordination of the different business segments, implementation of sound
financial policies to support the Group’s operations, management of office buildings and brand
management.
Operating costs of 1,309 thousand euros were essentially in line with the period ended 30 September
2014, when they amounted to 1,352 thousand euros.
Amortisation and depreciation were consistent with the previous year, whereas there were no write-downs
of assets as in the same period of the previous year.

Digital Bros Group Interim Management Statement as at 30 September 2015
34
8. INTERCOMPANY AND RELATED PARTY TRANSACTIONS AND
ATYPICAL/UNUSUAL TRANSACTIONS
All intercompany and related party transactions within the Digital Bros Group are conducted at arm’s
length.
Intercompany transactions
The main intercompany transactions are the sale of video games by 505 Games S.r.l. to the local
distributors.
The U.S. subsidiary 505 Games US Inc. is charged royalties by 505 Games S.r.l. for products distributed
locally in the American market.
505 Games Ltd. bills 505 Games S.r.l. for the payroll costs and overheads incurred for employees
involved in production and international marketing of the Publishing business segment.
505 Games (US) Inc. bills 505 Games S.r.l. for the payroll costs and overheads incurred for employees
involved in international marketing of the Publishing business segment.
505 Games Interactive Inc. bills 505 Games S.r.l. for the payroll costs and overheads incurred for
employees involved in product management of the Publishing business segment.
505 Games (US) Inc. bills 505 Mobile S.r.l. for the payroll costs and overheads incurred for employees
involved in production and marketing of the Mobile business segment.
At the time of acquisition, DR Studios Ltd. already had development agreements and live support
contracts for various video games with the subsidiaries 505 Games S.r.l. and 505 Mobile S.r.l., which
have remained such even following the integration.
Pipeworks Inc. has a development agreement in place for some video games with 505 Games S.r.l. and
505 Mobile S.r.l.
Digital Bros S.p.A., 505 Games Ltd., 505 Games France, 505 Games Spain Slu and 505 Games GmbH
charge 505 Games S.r.l. 15% of the revenues it earns from the international distribution, exclusively in
digital format, of its own products in exchange for marketing and production services carried out in the
local markets that are not directly attributable to individual products.
Digital Bros S.p.A. charges 505 Games S.r.l. for the costs incurred for the coordination of business in
acquiring games, for administrative, finance, legal, logistics and information technology services incurred
on its behalf.
Digital Bros S.p.A. charges Digital Bros Game Academy S.r.l. for administrative, finance, legal and
information technology services incurred on its behalf and the lease of the property located in Via Labus
in Milan, the Company’s operative HQ.

Digital Bros Group Interim Management Statement as at 30 September 2015
35
505 Games S.r.l. charges the American company 505 Games (US) for the costs incurred for the
coordination of business in acquiring games, for administrative, finance, legal and information technology
services incurred on its behalf.
Other more minor transactions consist of administrative, financial, legal/advisory and general services
that are usually performed by Digital Bros S.p.A. for other members of the Group.
The parent company also provides a centralised cash management service, using giro accounts to which
the positive and negative balances between Group companies are transferred at least once per quarter,
including through the transfer of receivables. These accounts do not bear interest.
Group companies in Italy also transfer tax receivables and payables to Digital Bros S.p.A. under the
domestic tax consolidation scheme.
In the interim management statement at 30 September 2015, all effects of intercompany transactions on
the balance sheet and income statement have been eliminated.
Transactions with other related parties
Related party transactions regard:
legal consultancy provided by the director Dario Treves;
property rental carried out by Matov Imm. S.r.l. towards the parent company and subsidiary 505
Games France S.a.s.;
property rental carried out by Matov LLC to the subsidiary 505 Games (US) Inc.
Both Matov Imm. S.r.l. and Matov LLC are owned by the Galante family.
The impact of the related party transactions is shown in paragraph 12 of the explanatory notes.
Atypical transactions
There were no atypical or unusual transactions in this or the previous year, as defined by Consob
Communication DEM 6064293 of 28 July 2006.

Digital Bros Group Interim Management Statement as at 30 September 2015
36
9. TREASURY SHARES
Pursuant to Art. 2428, paragraph 2 no. 3 of the Italian Civil Code, at 30 September 2015 Digital Bros
S.p.A. owned 130,247 treasury shares, against the 400,247 held as at 30 June 2015.
In accordance with no. 4 of said paragraph 2, the Company sold off 270,000 of its treasury shares at the
average price of 11.28 euros each, for a total value of 3,045 thousand euros.
10. RESEARCH AND DEVELOPMENT
During the year, the Group incurred research expenses of 5 thousand euros and development expenses of
729 thousand euros. Such costs amounted to 13 thousand euros and 54 thousand euros, respectively,
during the period ended 30 September 2014.
Research and development activities relate solely to video games slated for future launch.

Digital Bros Group Interim Management Statement as at 30 September 2015
37
11. RISK MANAGEMENT AND FINANCIAL INSTRUMENTS
The Group has developed a risk mapping process by which the directors and the front-line organisational
units attend coordination meetings held throughout the year. Their work is summarised in a risk matrix
that is prepared and regularly reviewed by the director in charge of control, who attends the coordination
meetings. In individual charts, each separate risk is described, given a gross rating according to a
probability/impact grid, and assigned a net rating on the basis of mitigating factors and/or steps taken to
reduce and monitor the risk. The executive director is assisted in this task by the Control and Risks
Committee.
The individual risk charts also show the impact that a failure to reach control objectives would have in
terms of operations and financial reporting.
The thoroughness of the risk map and the ratings of net risk are assessed jointly by the two managing
directors and by the director in charge of control, and updated by the Board of Directors at least once a
year.
It is considered that at present, the recent acquisitions of two video game developers have not increased
the number and level of risk, for those risks already highlighted.
The risks can be summarised as two types: operational risks and financial risks.
Operational risks
The most significant operational risks are:
dependence on hardware and its success;
dependence on key customers and bad debt risk;
hardware lifecycles;
ability to publish popular games;
piracy;
product obsolescence;
dependence on key employees.
Dependence on hardware and its success
This is the risk of depending on the success of the hardware for which games are developed. Most of the
Group’s revenues come from the sale of video games for Sony, Microsoft and Nintendo consoles. When
signing a development contract, the Group has to pay advances for a game’s development and production
on the basis of projected demand for these platforms, which takes account of their estimated life cycles.
An error in judging the potential of each gaming platform can lead to a drop in revenues or, if
underestimated, a loss of sales potential, with consequences for future performance.
The existence of market research, management’s familiarity with the market, and the availability of
historical data on hardware ownership are mitigating factors. The Group has also implemented a strategic

Digital Bros Group Interim Management Statement as at 30 September 2015
38
planning procedure that analyses its current development contracts, in an attempt to lower costs, and a
contract acquisition procedure that requires accurate economic projections to be made before signing, by
testing future profitability on the basis of different market scenarios using sensitivity analyses and other
tools.
Dependence on key customers and bad debt risk
At the end of last year, the revenue concentration of the top 10 customers worldwide was about 64%, in
line with the previous year, and that of the top 50 customers was 93%. For the next few years the level of
concentration is expected to rise, especially since the Group’s revenues are projected to grow in markets
like the United States and the United Kingdom, where sales depend on a relatively low number of
retailers. The concentration of revenues on a small number of key customers makes the Group dependent
on the decisions of a few, with the risk that a product not selected for purchase may fail to have the
necessary visibility on store shelves and/or digital platforms and may therefore lose selling potential;
conversely, there is the opportunity to gain such potential if the product is positioned favourably,
especially in the digital marketplace.
Hardware lifecycles
The Group mainly distributes video games for Sony, Microsoft and Nintendo consoles, which have
traditionally had a lifecycle of seven years. Although it currently appears that this lifecycle could be
extended by online features and by new technologies for the consoles now on the market, it could also be
drastically shortened once the consoles mature, especially in light of the international economic crisis.
The lifespan of their predecessors could also be far shorter than thought. The potential volatility of the
market makes it difficult to predict results. This risk is mitigated by the fact that the Group can
significantly reduce operating costs on games scheduled for future release, depending on the forecast
trend in demand.
Ability to publish popular games
The video games market, like the entire entertainment industry, is exposed to a number of risks outside
the Group’s control. These include the popularity of celebrities and sports, the platforms players favour,
demographic changes in consumption, and the rise of other forms of entertainment. If the Group were
unable to please consumers and keep up with the speed of change, its revenues and margins could be
deeply affected and its targets could be difficult to meet. This risk is mitigated by the Group’s
experienced management and by its procedure for the acquisition of licensing and development contracts,
which involves close examination of a product’s economic potential using market analyses and other
means.
Piracy
Piracy has always been a bane to the video games market and to the entertainment industry in general.
The use of peer-to-peer networks and the growing availability and speed of broadband have made it even

Digital Bros Group Interim Management Statement as at 30 September 2015
39
easier to copy a video game illegally. National laws and anti-piracy systems used by manufacturers
reduce this risk substantially, although it varies sharply from one country to the next.
If piracy were to increase, due in part to a weakening of today’s legislation, the Group’s sales and
margins could go down and its forecasts might no longer be reliable. This risk is mitigated by the fact that
video game producers (Microsoft, Sony and Nintendo) earn substantial profits from their game
production businesses and it is thus to their advantage to develop anti-piracy measures. The increasing
use of online features, or even parts or episodes of games that are only available on the servers of
Microsoft, Sony and Nintendo, allows better control over authenticity and deprives bootlegs of much of
their interest. The growth of revenues deriving from digital distribution, for both the Publishing and
Mobile business segments, helps ensure that the risk tends to reduce insofar as for this type of product,
risk of piracy is virtually nil.
Product obsolescence
Video games can quickly become obsolete. A game that is sold at a certain price is then repositioned at
gradually lower ones over time. The launch price of a game is usually high during the launch of the
console, and then decreases throughout the lifecycle of the hardware.
The decision to invest in a certain game is often made years before its actual release. Management must
therefore estimate the retail prices a game will sell for in subsequent periods. A sudden acceleration in the
obsolescence of the game or its supporting hardware could push retail prices below those originally
assumed, to the detriment of revenues and margins as compared with the plans presented.
In the Italian Distribution segment, purchasing decisions in terms of volumes are often made months in
advance, while the contract is being negotiated with publishers, so it is possible that these games will
remain unsold and will require appropriate write-downs for obsolescence.
The risk of obsolescence is mitigated by:
the possibility to reduce the production, marketing and royalty costs paid to developers, thereby
minimising the impact on margins;
awareness of the life cycles of earlier consoles and advance information on new gaming
platforms;
the chance to ask publishers for discounts to offset inventory impairment losses, especially for
games that do not sell well.
Dependence on key employees
The Group’s success depends on the performance of some key individuals who have made a solid
contribution to its development and acquired valuable experience in the industry.
The Group has an executive team (chairman, managing director and CFO) with many years’ experience
in the sector and a decisive role in the management of its business. Losing the services of these
individuals without their being suitably replaced could have a negative impact on the Group’s

Digital Bros Group Interim Management Statement as at 30 September 2015
40
performance and financial position, and in particular could affect the process of understanding,
appreciating and monitoring risks.
In any case, management feels that the Group has an operational and executive structure that can ensure
continuity in the handling of business affairs.
Financial instruments and financial risk management
The main financial instruments used by the Group are as follows:
Bank account overdrafts
Sight- and short-term bank deposits
Import financing
Export financing
Commercial credit lines (factoring)
Finance leases
Derivative contracts
Financial instruments held for trading
The purpose of these instruments is to finance the Group’s operating activities.
The parent company Digital Bros S.p.A. manages all financial risks on behalf of itself and its subsidiaries,
with the exception of other financial instruments not listed above, namely trade payables and receivables
arising from operating activities for which the financial risk is the responsibility of the individual
company.
Since the financial year ended at 30 June 2008, the subsidiary 505 Games S.r.l. has enjoyed its own
independent credit facilities to finance international growth; since April 2011 the subsidiary 505 Games
Ltd. has had access to two international factoring lines and in November 2012, the subsidiary 505 Games
France S.a.s. was granted its own international factoring line.
The Group tries to maintain a balance between short-term and medium/long-term financial instruments.
The Group’s core business, the marketing of video games, entails investments primarily in net working
capital which are funded through short-term credit lines. Long-term investments are normally financed
through medium/long-term lines often dedicated to the individual investment, including in the form of
finance leases.
Given the above, medium- and long-term financial payables have a well-distributed range of maturities.
The main risks generated by the Group’s financial instruments are:
interest rate risk
liquidity risk
exchange rate risk
Digital Bros Group Interim Management Statement as at 30 September 2015
41
credit risk.
Interest rate risk
The Group’s exposure to interest rate fluctuations is marginal with respect to its medium- and long-term
financial instruments, which were originally designated as fixed-rate instruments or have been converted
into fixed rates using appropriate derivative agreements.
For short-term financial instruments, the possibility of rising interest rates is an effective risk, because the
Group cannot immediately transfer the higher rates to its prices. These risks are reduced by:
the availability of an interconnected series of short-term credit lines, allowing it to borrow under
the most favourable conditions;
the degree of short-term borrowings, which varies substantially on the basis of seasonal trends in
the video games market;
the implementation of a short-term cash flow procedure that constantly monitors the trend in
short-term debt and allows preventive action to be taken when interest rates are expected to rise.
Liquidity risk
Liquidity risk arises if it becomes difficult or impossible to obtain, under sustainable conditions, the
financial resources needed to operate the business.
The factors that influence the Group’s financial needs are the resources generated or absorbed by
operating and investing activities, the maturity and renewal terms of debt and the liquidity of investments
and current conditions and available funds in the credit market.
The Group has reduced this risk by:
setting up the centralised management of treasury procedures and therefore of credit lines;
obtaining credit that allows the creation of a sustainable liability structure, through the use of
irrevocable credit lines;
monitoring prospective liquidity conditions.
Given the results of short- and medium/long-term planning, currently available funds, along with those to
be generated by operating activities, should allow the Group to satisfy its requirements as far as
investment, working capital management, and debt repayment at natural maturity are concerned and in
any case to determine financial requirements sufficiently ahead of time.
Exchange rate risk
The Group is affected by exchange rate fluctuations of the British pound and the US dollar. Purchases in
currencies other than the euro are marginal, and are almost entirely in British pounds and US dollars due
to the manufacturing and structural costs of the local subsidiaries.

Digital Bros Group Interim Management Statement as at 30 September 2015
42
The Group’s exposure in US dollars due to the operations of the United States subsidiary is mitigated by
the fact that it has many game development contracts in that currency, so any negative changes in the
EUR/USD exchange rate would cause license costs to go up but would also produce exchange gains on
payments received (the reverse also holds true).
To monitor the risk level of the EUR/USD and EUR/GBP exchange rate, the Group closely monitors
exchange rate forecasts from independent analysts and other sources, and may use derivative instruments
to hedge this risk as appropriate (no such instruments are used at present).
Credit risk
In Italy, the Group sells exclusively to known buyers. If necessary information on customers is not
available, merchandise is sold with advance payment and/or cash on delivery to limit credit risk to
negligible amounts.
Customer credit facilities are granted by a credit committee which includes the managing directors, the
sales department, the finance department and the head of credit management. The credit manager reviews
the credit facilities and customer balances on a daily basis, before any shipments are made. Despite these
precautions, the Group has taken out insurance covering a considerable percentage of its customers.
All foreign subsidiaries have taken out credit insurance with the same global insurance group. The credit
policy is never to exceed the limits of coverage for each individual customer, thereby limiting the chance
that any difficulties faced by customers will affect the Group’s performance.
Derivative contracts
The policy for using derivative contracts is explained in the notes.
Financial instruments held for trading
The policy for using contracts of financial instruments held for trading is explained in the notes.
Digital Bros Group Interim Management Statement as at 30 September 2015
43
12. CONTINGENT ASSETS AND LIABILITIES
At 30 September 2015, there were no contingent assets and liabilities, as in the same period of the
previous year.
13. SUBSEQUENT EVENTS
After the end of the period, Digital Bros S.p.A. purchased 1,149,816 Starbreeze B shares for a total of 902
thousand euros and disposed of 1,149,816 Starbreeze B ordinary shares for a total of 1,510 thousand
euros. The parent company purchased 776,231 Starbreeze A ordinary shares for a total of 707 thousand
euros.
On 2 October 2015, the parent company paid an additional 221 thousand euros as the second instalment
of the capital increase by Ovosonico S.r.l., of which 15,040 thousand euros by way of capital and 205,960
thousand euros by way of premium. As a result of this payment, the Group now holds an 18.38% equity
interest in Ovosonico S.r.l.
Digital Bros Group Interim Management Statement as at 30 September 2015
44
14. OUTLOOK
The main new product launches will take place in the fourth quarter of the year, with the releases of
Assetto Corsa, a car racing game created by Italian developer Kunos Simulazioni, and Abzu, an
innovative underwater adventure with captivating graphics, along with the first games internally
developed by the subsidiary Pipeworks Inc. Prior to these releases, the Publishing segment’s revenues
will be driven by the most successful product of recent years, PAYDAY 2, in both the versions for Steam
and next-generation consoles, following the launch of the Crimewave Edition of the game.
In the Mobile business segment, it is expected that Terraria in the different versions will continue to
generate revenues for the entire year, along with Battle Islands, a Group intellectual property, which will
also benefit from the launch of the version for the Microsoft Xbox One console in October.
Italian Distribution volumes will be virtually stable compared to the previous year; however, the business
segment may benefit from significant cost savings as a result of cost containment policies already being
implemented.
The Development business segment will continue to work on projects started in the previous year and is
expected to continue to benefit from orders from non-captive clients.
Expectations for the current year at the consolidated level are that the previous year’s turnover and profit
levels will be maintained. The concentration of releases in the fourth quarter of the year will result in
increased net debt, which will tend to grow in a linear fashion over the next two quarters and then resume
its natural decline, although at slower rates than in the past.

Digital Bros Group Interim Management Statement as at 30 September 2015
45
15. OTHER INFORMATION
EMPLOYEES
Below are the details of the workforce at 30 September 2015 with comparative figures at 30 September
2014:
Type 30 September 2015 30 September 2014 Change
Executives 10 10 0
Office workers 214 199 15
Blue-collar workers and apprentices 4 6 (2)
Total employees 228 215 13
The same details for employees at the Group’s foreign companies are as follows:
Type 30 September 2015 30 September 2014 Change
Executives 5 4 1
Office workers 160 140 20
Total foreign employees 165 144 21
The average headcount for the period, calculated as the average number of employees in service at the
end of every month, is shown below:
Type
Average number for
2015
Average number for
2014
Change
Executives 10 7 3
Office workers 210 155 55
Blue-collar workers and apprentices 4 6 (2)
Total employees 224 168 56
The average headcount for the period at foreign companies is as follows:
Type
Average number for
2015
Average number for
2014
Change
Executives 5 2 3
Office workers 156 95 61
Total foreign employees 161 97 64
The increase in the number of foreign employees is the result of the acquisitions in the previous year.
The Group’s Italian subsidiaries use the current Confcommercio national collective employment contract
for the commercial, distribution and services sector.
ENVIRONMENT
At 30 September 2015 there were no issues of an environmental nature, and as the Group’s environment-
related activities consist chiefly of packing and shipping video games and affixing labels to packaging,
there is no reason any such problems should arise in the future.

Digital Bros Group Interim Management Statement as at 30 September 2015
46
(this page intentionally left blank)

Digital Bros Group Interim Management Statement as at 30 September 2015
47
Abridged consolidated financial statements as at
30 September 2015

Digital Bros Group Interim Management Statement as at 30 September 2015
48
(this page intentionally left blank)

Digital Bros Group Interim Management Statement as at 30 September 2015
49
FINANCIAL STATEMENTS Digital Bros Group
Consolidated statement of financial position as at 30 September 2015
EUR/000 30 September 2015 30 June 2015 Change
Non-current assets
1 Property, plant and equipment 4,867 4,841 26 0.5%
2 Investment property 0 0 0 0.0%
3 Intangible assets 8,641 7,946 695 8.7%
4 Equity investments 2,227 1,274 953 0.0%
5 Non-current receivables and other assets 1,056 1,058 (2) -0.2%
6 Deferred tax assets 2,123 2,240 (117) -5.2%
Total non-current assets 18,914 17,359 1,555 9.0%
Non-current liabilities
7 Employee benefits (473) (486) 13 -2.6%
8 Non-current provisions (137) (170) 33 -19.7%
9 Other non-current payables and liabilities 0 (589) 589 n.s.
Total non-current liabilities (610) (1,245) 635 -51.0%
Net working capital
10 Inventories 12,727 12,881 (154) -1.2%
11 Trade receivables 36,259 36,350 (91) -0.3%
12 Tax credits 3,283 2,466 817 33.1%
13 Other current assets 9,384 6,148 3,236 52.6%
14 Trade payables (23,314) (26,929) 3,615 -13.4%
15 Tax payables (4,063) (3,029) (1,034) 34.1%
16 Current provisions 0 0 0 0.0%
17 Other current liabilities (2,177) (1,859) (318) 17.1%
Total net working capital 32,099 26,028 6,071 23.3%
Shareholders’ equity
18 Share capital (5,644) (5,644) 0 0.0%
19 Reserves (19,472) (19,417) (55) 0.3%
20 Treasury shares 390 1,199 (809) -67.5%
21 Retained earnings (losses) (13,751) (9,947) (3,804) 38.2%
Total shareholders’ equity (38,477) (33,809) (4,668) 13.8%
Total net assets 11,926 8,333 3,593 43.1%
22 Cash and cash equivalents 4,192 4,339 (147) -3.4%
23 Current payables to banks (14,570) (12,738) (1,832) 14.4%
24 Other current financial assets and liabilities (178) 1,685 (1,863) n.s.
Current net financial position (10,556) (6,714) (3,842) 57.2%
25 Non-current financial assets 0 0 0 0.0%
26 Non-current payables to banks (1,370) (1,619) 249 -15.4%
27 Other non-current financial liabilities 0 0 0 0.0%
Non-current net financial position (1,370) (1,619) 249 -15.4%
Total net financial position (11,926) (8,333) (3,593) 43.1%

Digital Bros Group Interim Management Statement as at 30 September 2015
50
Digital Bros Group
Consolidated income statement as at 30 September 2015
EUR/000 30 September 2015 30 September 2014 Change
1 Gross revenues 26,247 103.6% 29,570 104.0% (3,323) -11.2%
2 Revenue adjustments (908) -3.6% (1,128) -4.0% 220 -19.5%
3 Total net revenues 25,339 100.0% 28,442 100.0% (3,103) -10.9%
4 Purchase of goods for resale (8,684) -34.3% (8,168) -28.7% (516) 6.3%
5 Purchase of services for resale (2,457) -9.7% (1,203) -4.2% (1,254) n.s.
6 Royalties (3,651) -14.4% (9,226) -32.4% 5,575 -60.4%
7 Changes in finished product inventories (154) -0.6% (117) -0.4% (37) n.s.
8 Total cost of sold products (14,946) -59.0% (18,714) -65.8% 3,768 -20.1%
9 Gross profit (3+8) 10,393 41.0% 9,728 34.2% 665 6.8%
10 Other revenues 1,299 5.1% 43 0.2% 1,256 n.s.
11 Cost of services (3,266) -12.9% (3,050) -10.7% (216) 7.1%
12 Rent and leasing (388) -1.5% (367) -1.3% (21) 5.7%
13 Personnel costs (4,894) -19.3% (3,137) -11.0% (1,757) 56.0%
14 Other operating expenses (391) -1.5% (290) -1.0% (101) 35.0%
15 Total operating costs (8,939) -35.3% (6,844) -24.1% (2,095) 30.6%
16 EBITDA (9+10+15) 2,753 10.9% 2,927 10.3% (174) -6.0%
17 Amortisation and depreciation (890) -3.5% (429) -1.5% (461) n.s.
18 Provisions 0 0.0% 0 0.0% 0 0.0%
19 Write-down of assets 0 0.0% (332) -1.2% 332 n.s.
20 Write-backs and non-monetary income 0 0.0% 0 0.0% 0 0.0%
21
Total non-monetary income and
operating costs (890) -3.5% (761) -2.7% (129) 16.9%
22 EBIT (16+21) 1,863 7.4% 2,166 7.6% (303) -14.0%
23 Interest and financial income 1,045 4.1% 961 3.4% 84 8.6%
24 Interest and financial expenses (363) -1.4% (474) -1.7% 111 -23.4%
25 Financial income and charges 682 2.7% 487 1.7% 195 40.1%
26 Pre-tax income (22+25) 2,545 10.0% 2,653 9.3% (108) -4.1%
27 Current taxes (922) -3.6% (657) -2.3% (264) 40.2%
28 Deferred taxes (55) -0.2% (346) -1.2% 290 -84.2%
29 Total income taxes (977) -3.9% (1,003) -3.5% 26 -2.6%
30 Net profit (26+29) 1,568 6.2% 1,650 5.8% (82) -5.0%
Net income per share:
33 Basic earnings per share (in euros) 0.11 0.12 (0.01) -8.3%
34 Diluted earnings per share (in euros) 0.11 0.12 (0.01) -8.3%

Digital Bros Group Interim Management Statement as at 30 September 2015
51
Digital Bros Group
Consolidated statement of comprehensive income as at 30 September 2015
EUR/000 30 September 2015 30 September 2014 Change
Net profit (loss) for the period (A) 1,568 1,650 (82)
Items that will not subsequently be
reclassified to the income statement (B)
Differences from the conversion of foreign
accounts (155) (236) 81
Tax effect relating to the conversion differences
of foreign accounts 0 0 0
Fair value adjustment of shares “available for
sale” 290 0 290
Tax effect related to the fair value adjustment of
shares “available for sale” (80) 0 (80)
Items that will subsequently be reclassified to
the income statement (C) 55 (236) 291
Total other items of comprehensive profit D
= (B)+(C) 55 (236) 291
Total comprehensive profit (loss) (A)+(D) 1,623 1,414 209
Attributable to:
Shareholders of the parent company 1,623 1,414 209
Equity investments pertaining to third parties 0 0 0
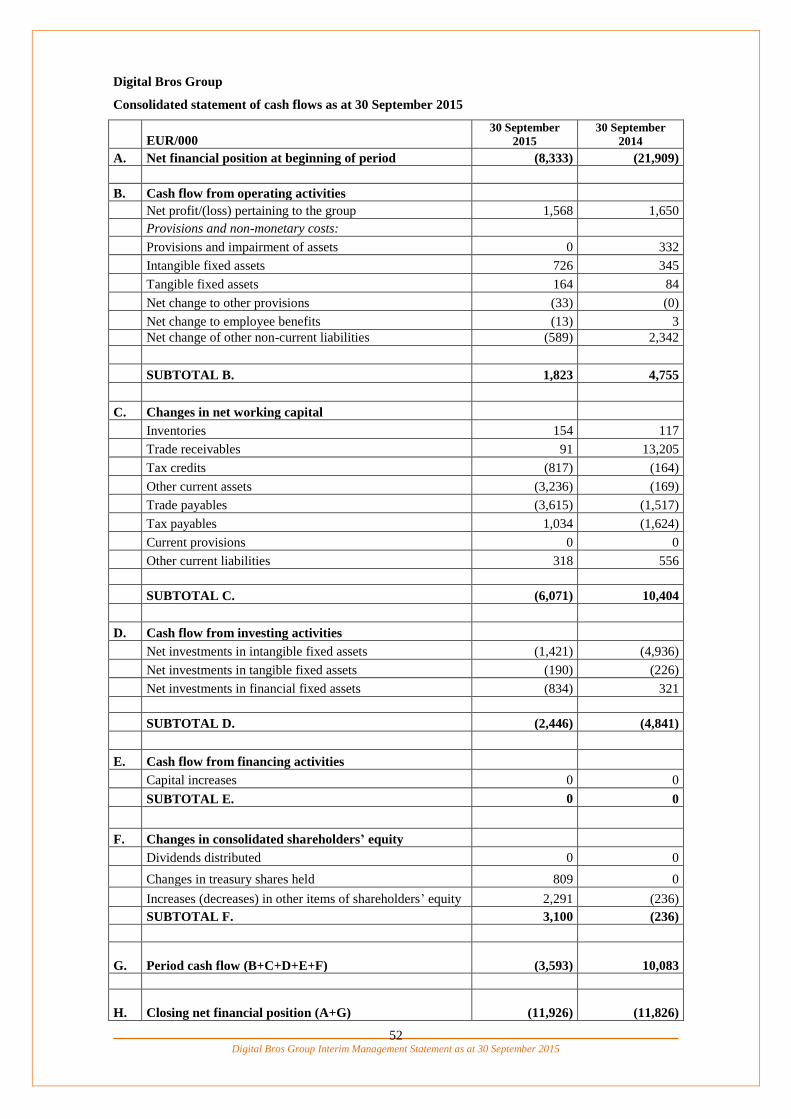
Digital Bros Group Interim Management Statement as at 30 September 2015
52
Digital Bros Group
Consolidated statement of cash flows as at 30 September 2015
EUR/000 30 September
2015
30 September
2014
A. Net financial position at beginning of period (8,333) (21,909)
B. Cash flow from operating activities
Net profit/(loss) pertaining to the group 1,568 1,650
Provisions and non-monetary costs:
Provisions and impairment of assets 0 332
Intangible fixed assets 726 345
Tangible fixed assets 164 84
Net change to other provisions (33) (0)
Net change to employee benefits (13) 3
Net change of other non-current liabilities (589) 2,342
SUBTOTAL B. 1,823 4,755
C. Changes in net working capital
Inventories 154 117
Trade receivables 91 13,205
Tax credits (817) (164)
Other current assets (3,236) (169)
Trade payables (3,615) (1,517)
Tax payables 1,034 (1,624)
Current provisions 0 0
Other current liabilities 318 556
SUBTOTAL C. (6,071) 10,404
D. Cash flow from investing activities
Net investments in intangible fixed assets (1,421) (4,936)
Net investments in tangible fixed assets (190) (226)
Net investments in financial fixed assets (834) 321
SUBTOTAL D. (2,446) (4,841)
E. Cash flow from financing activities
Capital increases 0 0
SUBTOTAL E. 0 0
F. Changes in consolidated shareholders’ equity
Dividends distributed 0 0
Changes in treasury shares held 809 0
Increases (decreases) in other items of shareholders’ equity 2,291 (236)
SUBTOTAL F. 3,100 (236)
G. Period cash flow (B+C+D+E+F)
(3,593) 10,083
H. Closing net financial position (A+G)
(11,926) (11,826)

Digital Bros Group Interim Management Statement as at 30 September 2015
53
Notes to the statement of cash flows
Details of cash flow movements by maturity:
EUR/000 30 September 2015 30 September 2014
Increase (decrease) in securities and liquid funds (147) (273)
Decrease (increase) in current payables to banks (1,832) 8,605
Decrease (increase) in other current financial assets and liabilities (1,863) 1,419
Change in financial position due to acquisition of equity investments 0 327
Short-term period cash flow (3,842) 10,078
Medium-term period cash flow 249 5
Period cash flow (3,593) 10,083
Additional information on the consolidated statement of cash flows:
EUR/000 30 September 2015 30 September 2014 Change
Income tax paid 0 (1,271) 1,271
Interest paid (143) (345) 202
Interest collected 0 2 (2)
Total (143) (1,614) 1,471

Digital Bros Group Interim Management Statement as at 30 September 2015
54
Digital Bros Group
Consolidated statement of changes in equity
EUR/000
Share
capital
(A)
Share
premium
reserve
Legal
reserve
IAS
transition
reserve
Translation
reserve
Other
reserves
Total
reserves
(B)
Treasury
shares
(C)
Retained
earnings
(losses)
Period
profit
(loss)
Total
retained
earnings
(D)
Group
consolidated
shareholders’
equity
(A+B+C+D)
Total as at 01 July 2014 5,644 16,954 1,129 1,367 (208) 0 19,242 (1,574) 1,403 (1,576) (173) 23,139
Allocation of period profit 0 (1,924) 1,924 0 0
Other changes 0 0 0
Comprehensive profit (loss) (236) (236) 1,650 1,650 1,414
Total as at 30 September 2014 5,644 16,954 1,129 1,367 (91) (86) 19,273 (1,574) (2,046) 5,498 3,452 26,795
Total as at 01 July 2015 5,644 16,954 1,129 1,367 (244) 211 19,417 (1,199) (3,006) 12,953 9,947 33,809
Allocation of period profit 0 9,105 (9,105) 0 0
Other changes 0 809 2,236 2,236 3,045
Comprehensive profit (loss) (155) 210 55 1,568 1,568 1,623
Total as at 30 September 2015 5,644 16,954 1,129 1,367 (399) 421 19,472 (390) 8,335 5,416 13,751 38,477
Digital Bros Group Interim Management Statement as at 30 September 2015
55
Notes to the abridged consolidated financial
statements as at 30 September 2015

Digital Bros Group Interim Management Statement as at 30 September 2015
56
1. FORM, CONTENT AND OTHER GENERAL INFORMATION
The main operations of Digital Bros S.p.A. and its subsidiaries are described in the directors’ report.
The abridged consolidated financial statements as at 30 September 2015 have been prepared on a going
concern basis. The Group has determined that the uncertainties and risks to which it is exposed, as
described in the directors’ report, do not cast doubt on its ability to operate as a going concern.
Accounting standards and compliance with IFRS
The abridged consolidated financial statements of the Digital Bros Group as at 30 September 2015 have
been prepared in accordance with Art. 154-ter of Legislative Decree 58 of 24 February 1998, as amended.
These consolidated financial statements at 30 June 2015 comply with the International Financial
Reporting Standards (IFRS) issued by the International Accounting Standards Board (IASB), on the basis
of the text published in the Official Journal of the European Union. The term “IFRS” encompasses the
International Accounting Standards (IAS) still in effect, as well as all interpretations published by the
International Financial Reporting Interpretations Committee (IFRIC). All amounts are expressed in
thousands of euros (EUR/000), unless otherwise specified.
Reporting formats
The abridged consolidated financial statements at 30 September 2015 comply with the IFRS and with the
interpretations thereof (SIC/IFRIC) endorsed by the European Commission as of that date.
The statements and the notes also include the disclosures required by Consob Resolution 15519 of 27 July
2006 and Consob Announcement 6064293 of 28 July 2006.
No changes have been made to the reporting format with respect to previous years, and all schedules are
consistent with those used for the consolidated financial statements at 30 June 2015.
The financial statements are comprised of:
the consolidated statement of financial position at 30 September 2015 with comparative figures
at 30 June 2015 (the previous year-end reporting date);
the consolidated income statement for the period from 1 July 2015 to 30 September 2015, in
comparison with the consolidated income statement from 1 July 2014 to 30 September 2014;
the consolidated statement of comprehensive income for the period from 1 July 2015 to 30
September 2015, in comparison with the consolidated statement of comprehensive income from
1 July 2014 to 30 September 2014;
consolidated statement of cash flows from 1 July 2015 to 30 September 2015, in comparison
with the statement from 1 July 2014 to 30 September 2014;

Digital Bros Group Interim Management Statement as at 30 September 2015
57
the consolidated statement of changes in equity from 1 July 2015 to 30 September 2015 and
from 1 July 2014 to 30 September 2014.
The following have been presented to supplement the information in the financial statements:
details of cash flows by maturity, compared with movements taking place the previous year;
additional information on the consolidated statement of cash flows, with prior-year comparison.
The first column of the statement of financial position indicates the number of the relevant note.
The statement of financial position is divided into five categories:
non-current assets;
non-current liabilities;
net working capital;
shareholders’ equity;
net financial position.
Non-current assets are those whose duration is long-term by nature, such as fixed assets to be used over
several years, equity investments, and receivables due in subsequent periods. They also include
investment property and deferred tax assets regardless of when they might be realised.
Non-current liabilities cover provisions not expected to be used during the next 12 months and for post-
employment benefits, in particular the provision for employee termination indemnity at the parent
company and its Italian subsidiaries, and in general payables due beyond 30 September 2016.
Net working capital expresses current assets and liabilities. Because of the commercial nature of the
Group’s operations, net working capital is especially significant, as it represents the amount the Group
invests in operating activities to help increase its turnover. Its trend in relation to business volumes, and as
a function of seasonal patterns in the market, is extremely important.
Shareholders’ equity consists of share capital, reserves, unallocated earnings (the profit for the year plus
the portion of previous years’ profits not allocated to specific types of reserve by the shareholders), as
adjusted by treasury shares.
Total net assets are the sum of non-current assets plus net working capital, less non-current liabilities and
equity.
The net financial position is divided into current and non-current debt and corresponds to the total of net
assets.

Digital Bros Group Interim Management Statement as at 30 September 2015
58
The first column of the official consolidated income statement and of the income statement provided for
segment reporting purposes indicates the number of the relevant note.
The income statement has been prepared in vertical format, with individual entries grouped by type, and
shows four intermediate levels of profit:
gross profit, the difference between net revenues and the total cost of goods sold;
EBITDA, the difference between the gross profit and total operating costs;
EBIT, the difference between EBITDA and total depreciation, amortisation and impairment;
pre-tax income, the difference between EBIT and net interest income or expense.
The net profit, the difference between the pre-tax income and total tax, is followed by earnings per share.
The statement of cash flows has been prepared using the indirect method, whereby profit is adjusted for
the effects of transactions of a non-cash nature, changes in net working capital, cash flows from financing
and investing activities, and changes in consolidated equity.
The overall change for the period is given by the sum of the following items:
cash flow from operating activities;
changes in net working capital;
cash flow from investing activities;
cash flow from financing activities;
changes in consolidated shareholders’ equity.
The statement of changes in equity has been drawn up in accordance with IFRS, and shows movements
between 1 July 2014 and 30 September 2015.
There are no minority interests, which are therefore not reported.

Digital Bros Group Interim Management Statement as at 30 September 2015
59
2. ACCOUNTING STANDARDS
Figures in the abridged consolidated financial statements were determined according to the International
Accounting Standards and their interpretations in effect at 30 September 2015.
The consolidated financial statements were prepared on the basis of the accounts at 30 September 2015
submitted by the companies in the consolidation, which have been adjusted, where necessary, to bring
them into line with Group accounting policies and IAS/IFRS. All comparative figures from prior periods
have been modified as necessary in order to render them IAS/IFRS-compliant.
The measurement criteria used to prepare the abridged consolidated financial statements as at 30
September 2015 are coherent with those used to prepare the abridged consolidated financial statements as
at 30 September 2014. Changes in the standards and interpretations adopted by the European Union have
had no significant effect on the preparation of the abridged consolidated financial statements as at 30
September 2015.
Please see the Annual Report and financial statements at 30 June 2015 for a complete description of the
accounting standards followed.
New accounting standards
The accounting standards and interpretations for which application is compulsory as from 1 July 2015
have not had any effect on the Group’s interim management statement as at 30 September 2015, as
they refer to situations that do not apply or have impacts considered as insignificant.

Digital Bros Group Interim Management Statement as at 30 September 2015
60
3. USE OF ESTIMATES
Discretionary valuations
The preparation of the abridged consolidated financial statements at 30 September 2015 and their
explanatory notes required Group companies to make certain discretionary valuations. These were used
to prepare estimates and assumptions that affect the recognised value of assets and liabilities in the
abridged consolidated financial statements and the information on contingent assets and liabilities as of
the reporting date. They are formulated on the basis of short- and medium/long-term budgets that are
constantly updated and approved by the Board of Directors prior to the approval of all financial reports.
Estimates are based on data reflecting current available knowledge; they are periodically reviewed and
the effects are conveyed in the income statement. Actual results may differ even substantially from these
estimates due to changes in the factors considered when formulating them. Estimates are used, in
particular, to report provisions for doubtful accounts, the measurement of inventories, depreciation and
amortisation, asset impairment, employee benefits, deferred taxes, and other provisions and reserves.
The main sources of uncertainty in making estimates concerned doubtful accounts, inventory
impairment, employee benefits, revenue adjustments, royalties, and deferred taxes.
Credit risk
For the Group’s Italian companies, the risk of credit default is assessed periodically, on the basis of
opinions provided by the external legal advisor in charge of customer disputes. According to the Group’s
credit collection procedure, receivables not paid within 45 days of falling due are passed on to the legal
advisor for collection. Frequent meetings between the legal advisor and the credit manager, and frequent
updates of the legal advisor’s collectibility forecasts, make the estimate of doubtful accounts reliable
over time.
As for the receivables of foreign subsidiaries, the policy is to stay within the insurance limits for
individual customers, so there are no particular issues of risk assessment.
Valuation of inventories
The Group values inventories on a quarterly basis, in consideration of the rapid obsolescence of its
products. Impairment losses may be charged to reflect individual products’ lower market value with
respect to their historical cost. To arrive at these estimates, the Group uses revenue forecasts for the six
following quarters, produced by the sales department. Any differences found between the market
valuation of a product held in inventory, taking account of its platform/price category, and its historical
cost are recognised to the income statement in the period they are discovered.
Inventories in the Publishing segment are easier to value considering the smaller number of products
distributed and the lower unit cost, which consists solely of the cost of physically producing the games;
unit costs are therefore smaller and consequently reduce the possibility of having to resort to impairment.

Digital Bros Group Interim Management Statement as at 30 September 2015
61
Employee benefits
The Group offers no pension plans and/or other employee benefits, with the exception of the employee
termination indemnity (trattamento di fine rapporto, or TFR) required by Italian law. Estimating those
benefits requires an assessment of the future financial outlays that may arise as a result of employees’
voluntary and involuntary departure from the Company, in relation to their seniority and the revaluation
rates these benefits enjoy by law.
The TFR system underwent significant changes during the year ended 30 June 2006. Estimating the
liability is still complex, due to a small portion of benefits that have remained with Group companies. To
arrive at this estimate, the Group is assisted by a registered actuary to help define the necessary
parameters.
Revenue adjustments
A significant cost element defined as “revenue adjustments” involves analytical computations for which
the Group has adopted suitable procedures.
Revenue adjustments are made up of two kinds of cost. The first, discounts granted to customers at the
end of the contractual period (known as year-end credits), are easier to determine. The second are
difficult to estimate and consist of potential credit notes that the Group will have to issue to customers as
a result of unsold products. To estimate this amount, management uses calculations based on an analysis
by individual customer as well as an analysis by individual product, in which the risk is shown separately
for price differences and potential returns. The forecast is made quarterly, on a product-by-product basis,
comparing volumes sold to retailers with the volumes they have sold to end consumers. The availability
of sales classifications on a single national basis makes the forecast reliable over time, often product
inventory data can be used for certain clients that make forecasts even easier.
Royalties and advances to developers for licenses
The method of calculating royalties varies according to the type of contract the Group has in place. Over
time, the number of contracts that involve fluctuating royalties with a guaranteed minimum and/or a fixed
development portion has increased. Management has to estimate the future benefit these types of contract
will produce in the following quarters in order to respect the principle of matching costs and income,
which is based on sales forecasts for the subsequent periods after valuation. The sales forecasts are based
on medium term (three-year) planning, which is revised twice a year. If determining royalties for products
with digital and/or mobile distribution, the three-year planning revision of revenues takes place
respectively once a week and once a month.
Deferred tax assets and liabilities
There are two areas of uncertainty in the calculation of deferred taxes. The first is their recoverability, an
uncertainty the Group mitigates by comparing the deferred tax assets recognised by individual companies
with their budgets. The second is the tax rate, which is assumed to be constant over time, and to equal the

Digital Bros Group Interim Management Statement as at 30 September 2015
62
rates currently applicable in the various countries where the Group is active and/or modified if we can
already be certain that the changes will come into force.
Digital Bros Group Interim Management Statement as at 30 September 2015
63
4. CONSOLIDATION METHODS
Subsidiaries
Subsidiaries are companies the Group controls. Control exists when the Group has the power, directly or
indirectly, to influence their financial and managerial policies in such a way as to obtain benefits from
their operations. The accounts of subsidiaries are included in the abridged consolidated financial
statements at 30 September 2015 from the date control is assumed until the date control ceases to exist.
The accounts used for the consolidation are prepared as of the same reporting date, and are converted
from local accounting standards to those employed by the Group.
Associates are consolidated using the equity method.
Translation of foreign currency accounts
The Group’s presentation currency is the euro, which is also the functional currency of the parent
company. At the close of the period, the financial statements of foreign companies with a functional
currency other than the euro were translated into the presentation currency as follows:
assets and liabilities were translated using the exchange rate in force at the close of the
financial period;
income statement items were translated using the average exchange rate for the period;
equity items were translated at historical exchange rates.
The exchange differences arising from this process are recognised directly to equity, in a separate
translation reserve under the heading “reserves”.
Transactions eliminated in the consolidation process
In preparing the abridged consolidated financial statements at 30 September 2015, all assets, liabilities,
and economic and financial transactions existing between Group companies have been eliminated, as
have unrealised profits and losses on intercompany transactions.
Scope of consolidation
The tables below show the details of companies consolidated on a line-by-line basis and according to the
equity method.

Digital Bros Group Interim Management Statement as at 30 September 2015
64
Companies consolidated on a line-by-line basis:
Company Operative offices Country Share capital Share held directly
or indirectly
Digital Bros S.p.A. Milan Italy €5,644,334.80 Parent company
Digital Bros Game Academy S.r.l. Milan Italy €50,000 100%
DR Studios Ltd. Milton Keynes United Kingdom £60,826 100%
Game Entertainment S.r.l. Milan Italy €100,000 100%
Game Network S.r.l. Milan Italy €100,000 100%
Game Service S.r.l. Milan Italy €50,000 100%
Pipeworks Inc. Eugene USA $61,929 100%
505 Games S.r.l. Milan Italy €100,000 100%
505 Games France S.a.s. Francheville France €100,000 100%
505 Games Spain Slu Las Rozas de Madrid Spain €100,000 100%
505 Games Ltd. Milton Keynes United Kingdom £100,000 100%
505 Games (US) Inc. Calabasas USA $100,000 100%
505 Games GmbH Burglengenfeld Germany €50,000 100%
505 Games Interactive Inc. Calabasas USA $100,000 100%
505 Mobile S.r.l. Milan Italy €100,000 100%
505 Mobile (US) Inc. Calabasas USA $100,000 100%
505 Games Nordic AB, based in Stockholm, was placed in liquidation during the period.
Companies consolidated according to equity method:
Company name Operative offices Share capital Share held
directly
Share held
indirectly
Delta DNA Ltd. (1) Edinburgh £2,847,000 1.16% 0%
Ebooks&Kids S.r.l. Milan €26,366 16% 0%
Cityglance S.r.l. Milan €10,000 37.5% 0%
Ovosonico S.r.l. Milan €100,000 3.34% 0%
(1) Previously Games Analytics Ltd.

Digital Bros Group Interim Management Statement as at 30 September 2015
65
5. EQUITY INVESTMENTS IN ASSOCIATES AND OTHER COMPANIES
Equity investments held by the Group companies as at 30 September 2015 are as follows:
a 1.16% interest in Delta DNA Ltd., acquired on 3 July 2013 and carried at cost in the amount
of 60 thousand euros (50 thousand pounds);
a 16% interest in Ebooks&Kids S.r.l., carried at cost in the amount of 200 thousand euros. The
equity investment was acquired by initial subscription on 7 July 2013 for 70 thousand euros of
which 68.7 thousand euros by way of premium and, thereafter, on 13 February 2014, by a
further subscription of a share capital increase for 130 thousand euros, of which 127.1
thousand euros by way of premium;
a 37.5% interest in Cityglance S.r.l., carried at 45 thousand euros. That amount includes
3,750.00 euros for the share capital subscribed and about 41 thousand euros in costs incurred
by Digital Bros S.p.A. to develop the company’s operations, which were therefore added to
the value of the investment;
a 3.34% interest in Ovosonico S.r.l., with a carrying amount of 49 thousand euros, of which
3,335 euros of capital and 45,665 euros of premium.

Digital Bros Group Interim Management Statement as at 30 September 2015
66
6. BUSINESS COMBINATIONS
Business combinations are accounted for using the acquisition method envisaged by IFRS 3. At the date
on which the acquisition takes effect, the assets and liabilities being transferred are recognised at their fair
value, with the exception of those for deferred taxes and employee benefits, which are measured
according to the relevant accounting standard. Transaction costs are booked on the income statement.
The identifiable assets acquired and liabilities assumed are recognised at fair value as at the acquisition
date; the following items are an exception to this, which are instead valued according to the reference
standard:
deferred tax assets and liabilities;
assets and liabilities for employee benefits;
liabilities or capital instruments relating to share-based payments of the business acquired or
share-based payments relative to the Group, issued in lieu of contracts of the business acquired;
assets held for sale and discontinued assets and liabilities.
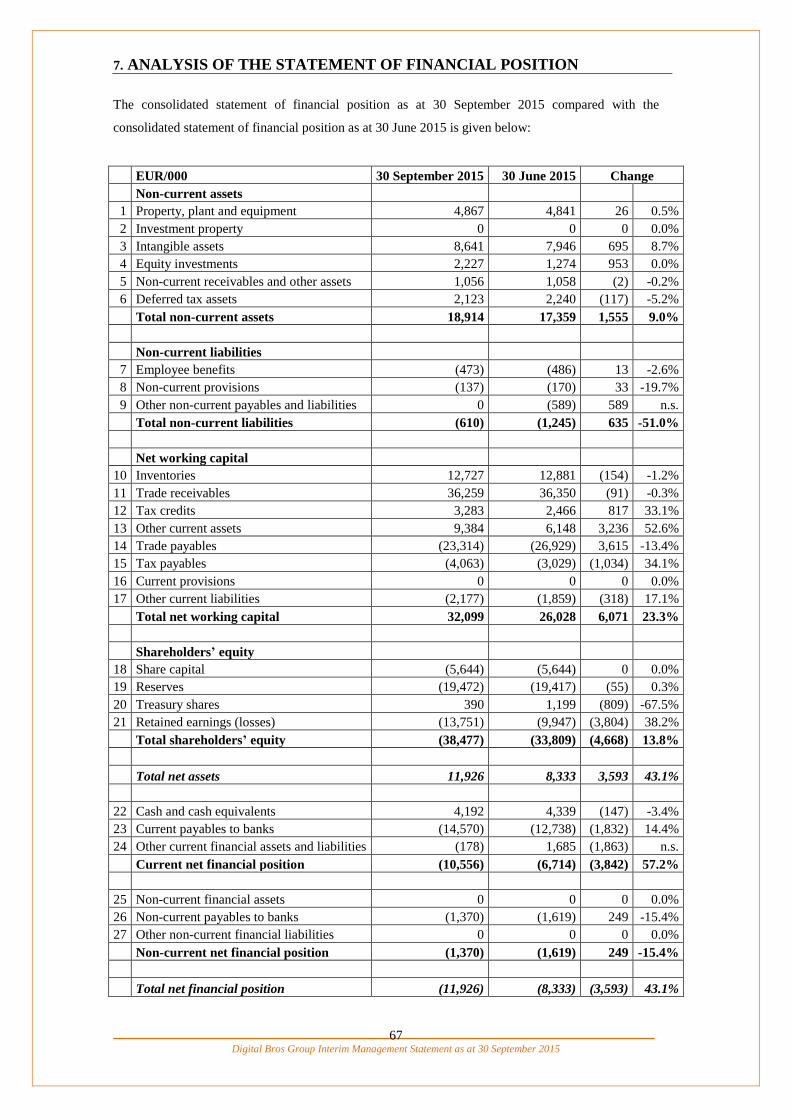
Digital Bros Group Interim Management Statement as at 30 September 2015
67
7. ANALYSIS OF THE STATEMENT OF FINANCIAL POSITION
The consolidated statement of financial position as at 30 September 2015 compared with the
consolidated statement of financial position as at 30 June 2015 is given below:
EUR/000 30 September 2015 30 June 2015 Change
Non-current assets
1 Property, plant and equipment 4,867 4,841 26 0.5%
2 Investment property 0 0 0 0.0%
3 Intangible assets 8,641 7,946 695 8.7%
4 Equity investments 2,227 1,274 953 0.0%
5 Non-current receivables and other assets 1,056 1,058 (2) -0.2%
6 Deferred tax assets 2,123 2,240 (117) -5.2%
Total non-current assets 18,914 17,359 1,555 9.0%
Non-current liabilities
7 Employee benefits (473) (486) 13 -2.6%
8 Non-current provisions (137) (170) 33 -19.7%
9 Other non-current payables and liabilities 0 (589) 589 n.s.
Total non-current liabilities (610) (1,245) 635 -51.0%
Net working capital
10 Inventories 12,727 12,881 (154) -1.2%
11 Trade receivables 36,259 36,350 (91) -0.3%
12 Tax credits 3,283 2,466 817 33.1%
13 Other current assets 9,384 6,148 3,236 52.6%
14 Trade payables (23,314) (26,929) 3,615 -13.4%
15 Tax payables (4,063) (3,029) (1,034) 34.1%
16 Current provisions 0 0 0 0.0%
17 Other current liabilities (2,177) (1,859) (318) 17.1%
Total net working capital 32,099 26,028 6,071 23.3%
Shareholders’ equity
18 Share capital (5,644) (5,644) 0 0.0%
19 Reserves (19,472) (19,417) (55) 0.3%
20 Treasury shares 390 1,199 (809) -67.5%
21 Retained earnings (losses) (13,751) (9,947) (3,804) 38.2%
Total shareholders’ equity (38,477) (33,809) (4,668) 13.8%
Total net assets 11,926 8,333 3,593 43.1%
22 Cash and cash equivalents 4,192 4,339 (147) -3.4%
23 Current payables to banks (14,570) (12,738) (1,832) 14.4%
24 Other current financial assets and liabilities (178) 1,685 (1,863) n.s.
Current net financial position (10,556) (6,714) (3,842) 57.2%
25 Non-current financial assets 0 0 0 0.0%
26 Non-current payables to banks (1,370) (1,619) 249 -15.4%
27 Other non-current financial liabilities 0 0 0 0.0%
Non-current net financial position (1,370) (1,619) 249 -15.4%
Total net financial position (11,926) (8,333) (3,593) 43.1%
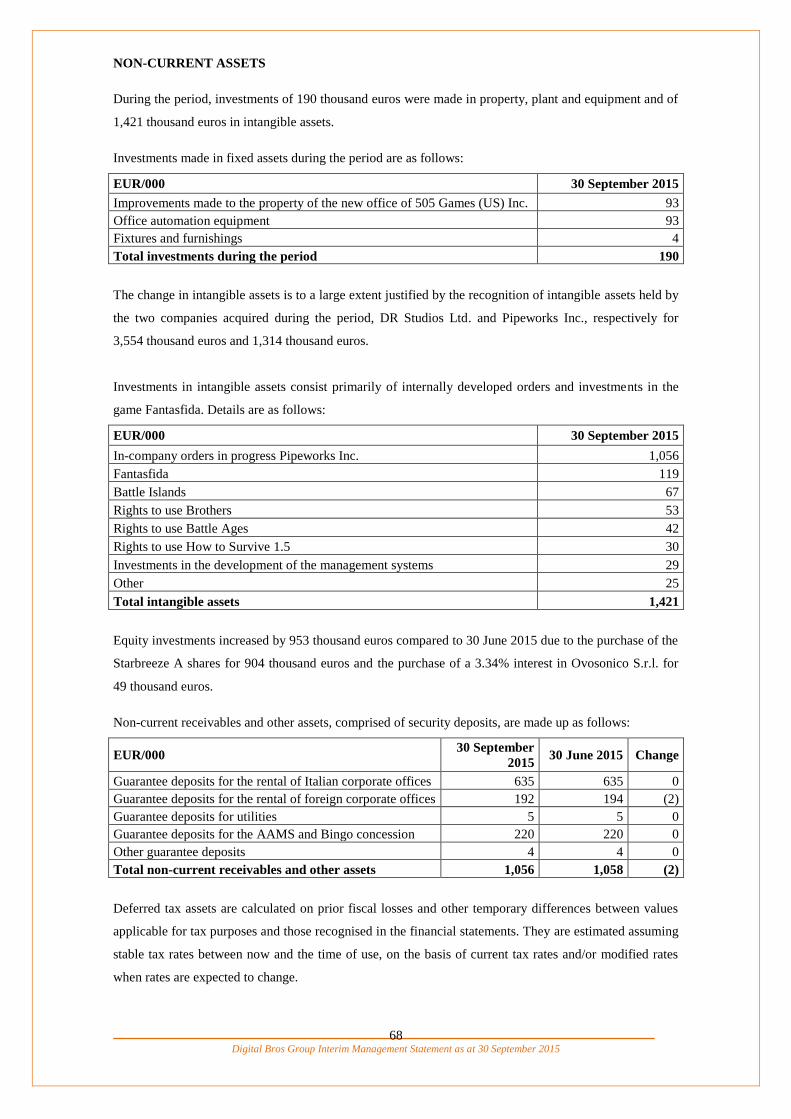
Digital Bros Group Interim Management Statement as at 30 September 2015
68
NON-CURRENT ASSETS
During the period, investments of 190 thousand euros were made in property, plant and equipment and of
1,421 thousand euros in intangible assets.
Investments made in fixed assets during the period are as follows:
EUR/000 30 September 2015
Improvements made to the property of the new office of 505 Games (US) Inc. 93
Office automation equipment 93
Fixtures and furnishings 4
Total investments during the period 190
The change in intangible assets is to a large extent justified by the recognition of intangible assets held by
the two companies acquired during the period, DR Studios Ltd. and Pipeworks Inc., respectively for
3,554 thousand euros and 1,314 thousand euros.
Investments in intangible assets consist primarily of internally developed orders and investments in the
game Fantasfida. Details are as follows:
EUR/000 30 September 2015
In-company orders in progress Pipeworks Inc. 1,056
Fantasfida 119
Battle Islands 67
Rights to use Brothers 53
Rights to use Battle Ages 42
Rights to use How to Survive 1.5 30
Investments in the development of the management systems 29
Other 25
Total intangible assets 1,421
Equity investments increased by 953 thousand euros compared to 30 June 2015 due to the purchase of the
Starbreeze A shares for 904 thousand euros and the purchase of a 3.34% interest in Ovosonico S.r.l. for
49 thousand euros.
Non-current receivables and other assets, comprised of security deposits, are made up as follows:
EUR/000 30 September
2015 30 June 2015 Change
Guarantee deposits for the rental of Italian corporate offices 635 635 0
Guarantee deposits for the rental of foreign corporate offices 192 194 (2)
Guarantee deposits for utilities 5 5 0
Guarantee deposits for the AAMS and Bingo concession 220 220 0
Other guarantee deposits 4 4 0
Total non-current receivables and other assets 1,056 1,058 (2)
Deferred tax assets are calculated on prior fiscal losses and other temporary differences between values
applicable for tax purposes and those recognised in the financial statements. They are estimated assuming
stable tax rates between now and the time of use, on the basis of current tax rates and/or modified rates
when rates are expected to change.
Digital Bros Group Interim Management Statement as at 30 September 2015
69
NON-CURRENT LIABILITIES
The item “Employee benefits” reflects the actuarial value of the Group’s liability to its employees, as
calculated by an independent actuary in accordance with IAS 19.
“Non-current provisions” consist wholly of the provision for agents’ indemnities.
At 30 September 2015, there were no other non-current payables and liabilities, inasmuch as the amount
of 589 thousand euros carried at 30 June 2015, relating to the payable arising from the purchase contract
for DR Studios Ltd., will be paid in September 2016. This amount will thus be reclassified among other
current liabilities.

Digital Bros Group Interim Management Statement as at 30 September 2015
70
NET WORKING CAPITAL
Net working capital was up by 6,071 thousand euros compared to 30 June 2015 due to the increase in
other current assets of 3,236 thousand euros and the decrease in trade payables of 3,615 thousand euros,
only partially offset by the increase in tax payables of 1,034 thousand euros.
An analysis of net working capital in comparison with figures at 30 June 2015 is provided below:
EUR/000 30 September 2015 30 June 2015 Change
Inventories 12,727 12,881 (154)
Trade receivables 36,259 36,350 (91)
Tax credits 3,283 2,466 817
Other current assets 9,384 6,148 3,236
Trade payables (23,314) (26,929) 3,615
Tax payables (4,063) (3,029) (1,034)
Current provisions 0 0 0
Other current liabilities (2,177) (1,859) (318)
Total net working capital 32,099 26,028 6,071

Digital Bros Group Interim Management Statement as at 30 September 2015
71
SHAREHOLDERS’ EQUITY
Detailed changes in shareholders’ equity are reported in the consolidated statement of changes in equity. They can be summarised as follows:
EUR/000 Share
capital
(A)
Share
premium
reserve
Legal
reserve
IAS
transition
reserve
Translation
reserve
Other
reserves
Total
reserves
(B)
Treasury
shares
(C)
Retained
earnings
(losses)
Period
profit
(loss)
Total
retained
earnings
(D)
Group
consolidated
shareholders’
equity
(A+B+C+D)
Total as at 01 July 2015 5,644 16,954 1,129 1,367 (244) 211 19,417 (1,199) (3,006) 12,953 9,947 33,809
Allocation of period profit 0 9,105 (9,105) 0 0
Other changes 0 809 2,236 2,236 3,045
Comprehensive profit (loss) (155) 210 55 1,568 1,568 1,623
Total as at 30 September 2015 5,644 16,954 1,129 1,367 (399) 421 19,472 (390) 8,335 5,416 13,751 38,477
The share capital (unchanged with respect to 30 June 2014) is divided into 14,110,837 ordinary shares of par value of 0.40 eurocents each, for a total of 5,644,334.8 euros. There are
no other types of shares outstanding. There are no rights, preferences or restrictions on ordinary shares.
No specific uses or objectives have been designated for individual equity reserves, other than those defined by law.
During the year, the Company sold off 270,000 of its treasury shares at the average price of 11.28 euros each, for a total value of 3,045 thousand euros. At 30 September 2015 it held
130,247 treasury shares valued at 390 thousand euros.

Digital Bros Group Interim Management Statement as at 30 September 2015
72
The changes in reserves in the period are:
EUR/000 30 June 2015
Change in the translation reserve (155)
Change in the security valuation reserve 210
Total changes in reserves 55
The other changes relating to retained earnings refer solely to the difference between the total amount collected on
the sale of treasury shares and the carrying amount of those shares, for a total of 2,236 thousand euros.
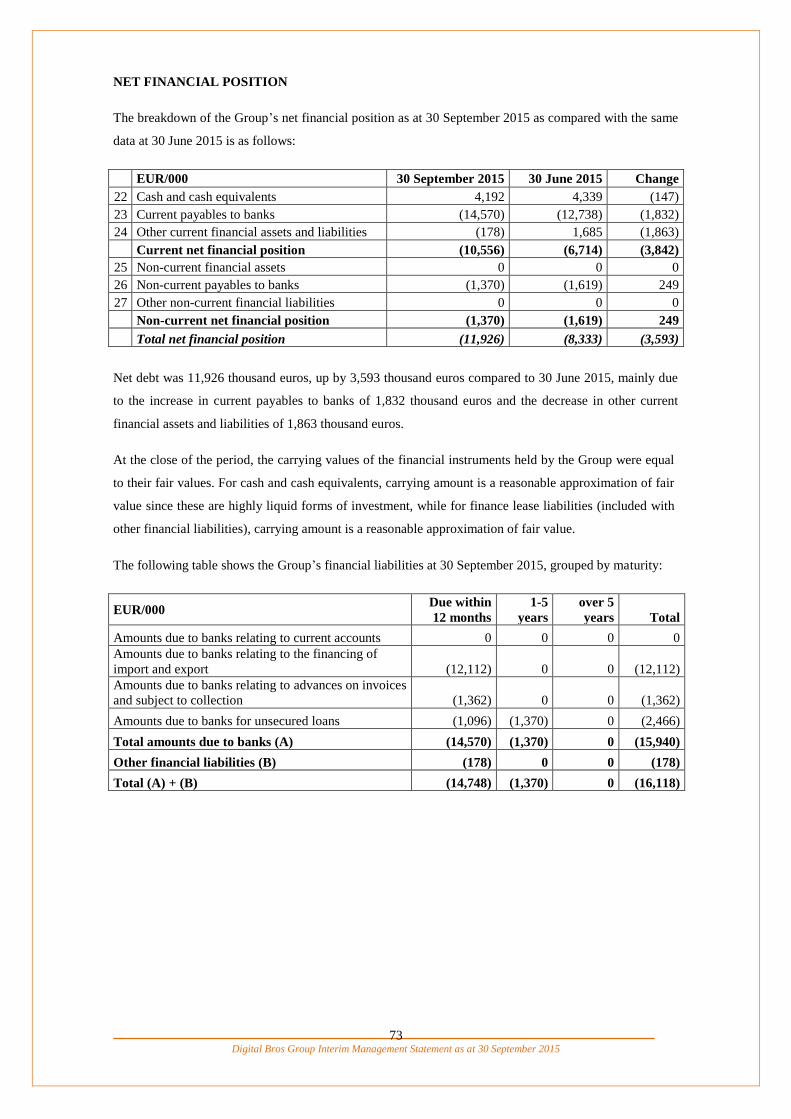
Digital Bros Group Interim Management Statement as at 30 September 2015
73
NET FINANCIAL POSITION
The breakdown of the Group’s net financial position as at 30 September 2015 as compared with the same
data at 30 June 2015 is as follows:
EUR/000 30 September 2015 30 June 2015 Change
22 Cash and cash equivalents 4,192 4,339 (147)
23 Current payables to banks (14,570) (12,738) (1,832)
24 Other current financial assets and liabilities (178) 1,685 (1,863)
Current net financial position (10,556) (6,714) (3,842)
25 Non-current financial assets 0 0 0
26 Non-current payables to banks (1,370) (1,619) 249
27 Other non-current financial liabilities 0 0 0
Non-current net financial position (1,370) (1,619) 249
Total net financial position (11,926) (8,333) (3,593)
Net debt was 11,926 thousand euros, up by 3,593 thousand euros compared to 30 June 2015, mainly due
to the increase in current payables to banks of 1,832 thousand euros and the decrease in other current
financial assets and liabilities of 1,863 thousand euros.
At the close of the period, the carrying values of the financial instruments held by the Group were equal
to their fair values. For cash and cash equivalents, carrying amount is a reasonable approximation of fair
value since these are highly liquid forms of investment, while for finance lease liabilities (included with
other financial liabilities), carrying amount is a reasonable approximation of fair value.
The following table shows the Group’s financial liabilities at 30 September 2015, grouped by maturity:
EUR/000 Due within
12 months
1-5
years
over 5
years Total
Amounts due to banks relating to current accounts 0 0 0 0
Amounts due to banks relating to the financing of
import and export (12,112) 0 0 (12,112)
Amounts due to banks relating to advances on invoices
and subject to collection (1,362) 0 0 (1,362)
Amounts due to banks for unsecured loans (1,096) (1,370) 0 (2,466)
Total amounts due to banks (A) (14,570) (1,370) 0 (15,940)
Other financial liabilities (B) (178) 0 0 (178)
Total (A) + (B) (14,748) (1,370) 0 (16,118)
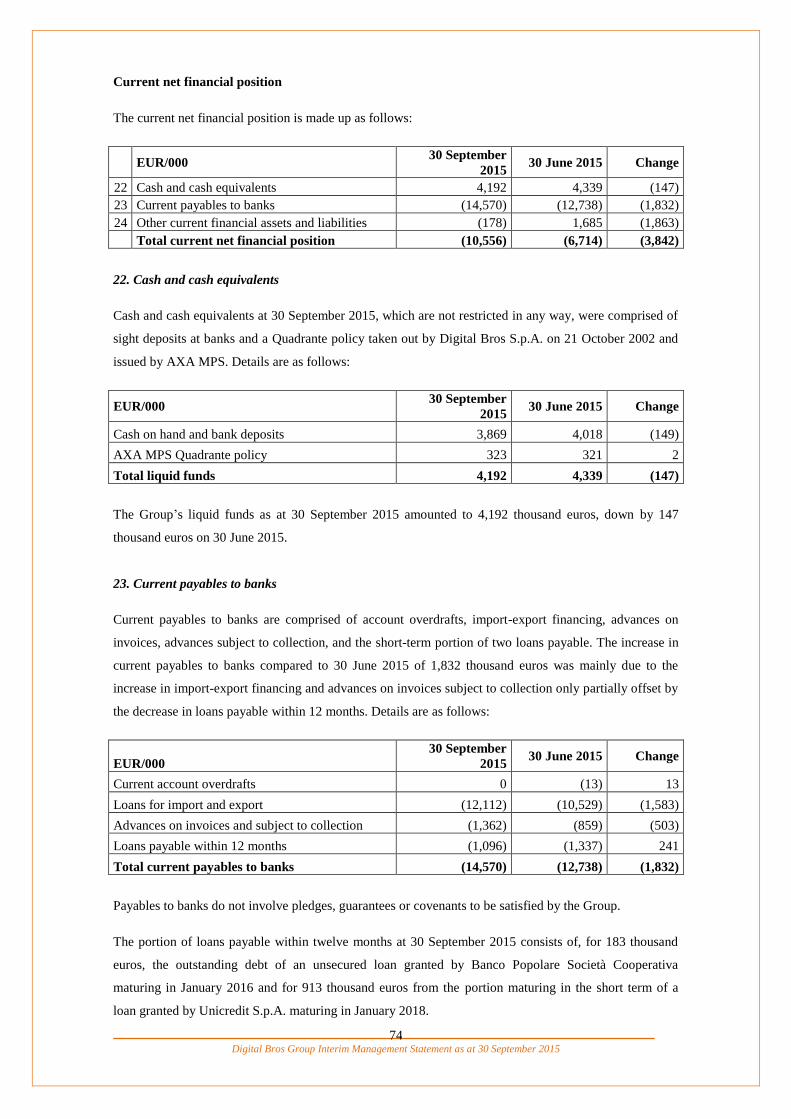
Digital Bros Group Interim Management Statement as at 30 September 2015
74
Current net financial position
The current net financial position is made up as follows:
EUR/000
30 September
2015 30 June 2015 Change
22 Cash and cash equivalents 4,192 4,339 (147)
23 Current payables to banks (14,570) (12,738) (1,832)
24 Other current financial assets and liabilities (178) 1,685 (1,863)
Total current net financial position (10,556) (6,714) (3,842)
22. Cash and cash equivalents
Cash and cash equivalents at 30 September 2015, which are not restricted in any way, were comprised of
sight deposits at banks and a Quadrante policy taken out by Digital Bros S.p.A. on 21 October 2002 and
issued by AXA MPS. Details are as follows:
EUR/000 30 September
2015 30 June 2015 Change
Cash on hand and bank deposits 3,869 4,018 (149)
AXA MPS Quadrante policy 323 321 2
Total liquid funds 4,192 4,339 (147)
The Group’s liquid funds as at 30 September 2015 amounted to 4,192 thousand euros, down by 147
thousand euros on 30 June 2015.
23. Current payables to banks
Current payables to banks are comprised of account overdrafts, import-export financing, advances on
invoices, advances subject to collection, and the short-term portion of two loans payable. The increase in
current payables to banks compared to 30 June 2015 of 1,832 thousand euros was mainly due to the
increase in import-export financing and advances on invoices subject to collection only partially offset by
the decrease in loans payable within 12 months. Details are as follows:
EUR/000
30 September
2015 30 June 2015 Change
Current account overdrafts 0 (13) 13
Loans for import and export (12,112) (10,529) (1,583)
Advances on invoices and subject to collection (1,362) (859) (503)
Loans payable within 12 months (1,096) (1,337) 241
Total current payables to banks (14,570) (12,738) (1,832)
Payables to banks do not involve pledges, guarantees or covenants to be satisfied by the Group.
The portion of loans payable within twelve months at 30 September 2015 consists of, for 183 thousand
euros, the outstanding debt of an unsecured loan granted by Banco Popolare Società Cooperativa
maturing in January 2016 and for 913 thousand euros from the portion maturing in the short term of a
loan granted by Unicredit S.p.A. maturing in January 2018.
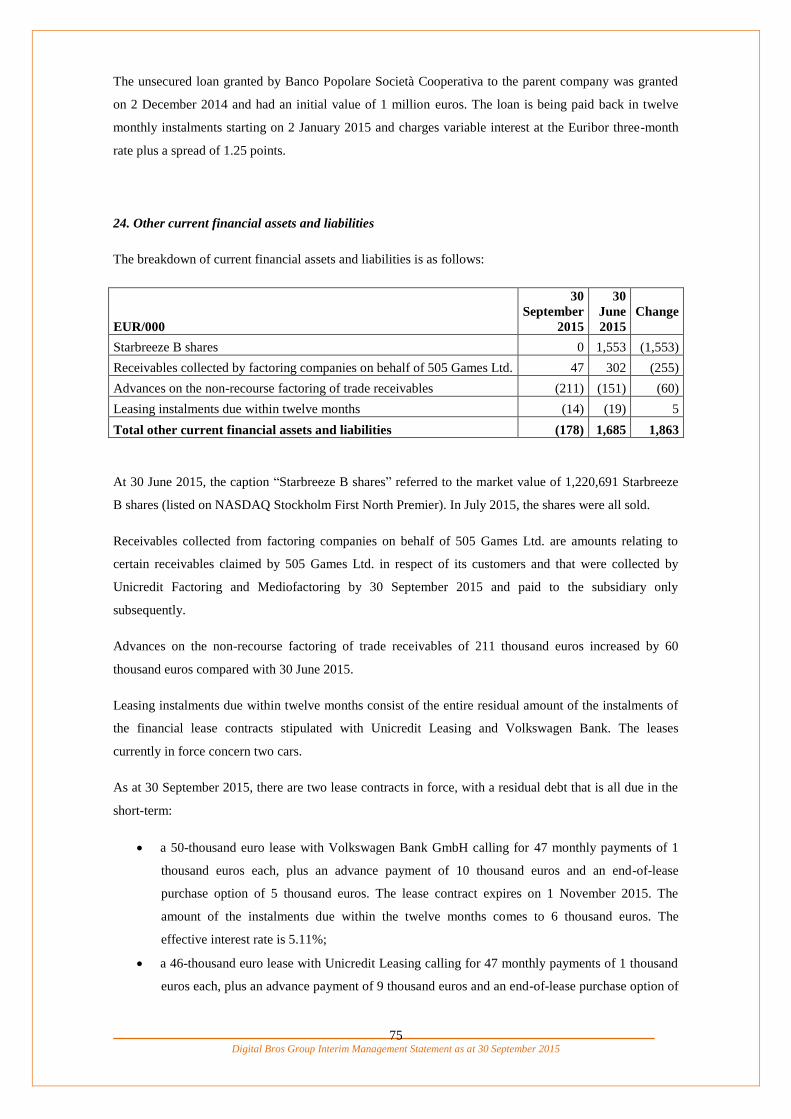
Digital Bros Group Interim Management Statement as at 30 September 2015
75
The unsecured loan granted by Banco Popolare Società Cooperativa to the parent company was granted
on 2 December 2014 and had an initial value of 1 million euros. The loan is being paid back in twelve
monthly instalments starting on 2 January 2015 and charges variable interest at the Euribor three-month
rate plus a spread of 1.25 points.
24. Other current financial assets and liabilities
The breakdown of current financial assets and liabilities is as follows:
EUR/000
30
September
2015
30
June
2015
Change
Starbreeze B shares 0 1,553 (1,553)
Receivables collected by factoring companies on behalf of 505 Games Ltd. 47 302 (255)
Advances on the non-recourse factoring of trade receivables (211) (151) (60)
Leasing instalments due within twelve months (14) (19) 5
Total other current financial assets and liabilities (178) 1,685 1,863
At 30 June 2015, the caption “Starbreeze B shares” referred to the market value of 1,220,691 Starbreeze
B shares (listed on NASDAQ Stockholm First North Premier). In July 2015, the shares were all sold.
Receivables collected from factoring companies on behalf of 505 Games Ltd. are amounts relating to
certain receivables claimed by 505 Games Ltd. in respect of its customers and that were collected by
Unicredit Factoring and Mediofactoring by 30 September 2015 and paid to the subsidiary only
subsequently.
Advances on the non-recourse factoring of trade receivables of 211 thousand euros increased by 60
thousand euros compared with 30 June 2015.
Leasing instalments due within twelve months consist of the entire residual amount of the instalments of
the financial lease contracts stipulated with Unicredit Leasing and Volkswagen Bank. The leases
currently in force concern two cars.
As at 30 September 2015, there are two lease contracts in force, with a residual debt that is all due in the
short-term:
a 50-thousand euro lease with Volkswagen Bank GmbH calling for 47 monthly payments of 1
thousand euros each, plus an advance payment of 10 thousand euros and an end-of-lease
purchase option of 5 thousand euros. The lease contract expires on 1 November 2015. The
amount of the instalments due within the twelve months comes to 6 thousand euros. The
effective interest rate is 5.11%;
a 46-thousand euro lease with Unicredit Leasing calling for 47 monthly payments of 1 thousand
euros each, plus an advance payment of 9 thousand euros and an end-of-lease purchase option of

Digital Bros Group Interim Management Statement as at 30 September 2015
76
5 thousand euros. The lease contract expires on 2 April 2016. The amount of the instalments due
within the twelve months comes to 8 thousand euros. The effective interest rate is 6.46%;
Non-current net financial position
Non-current net financial position is made up as follows:
EUR/000
30 September
2015 30 June 2015 Change
25 Non-current financial assets 0 0 0
26 Non-current payables to banks (1,370) (1,619) (1,370)
27 Other non-current financial liabilities 0 0 0
Non-current net financial position (1,370) (1,619) (1,370)
25. Non-current financial assets
There were no non-current financial assets at 30 September 2015, as there were none at 30 June 2015.
26. Non-current payables to banks
Non-current payables to banks consist exclusively of the portion with maturity beyond 12 months of a
loan granted by Unicredit S.p.A. The unsecured loan granted by Unicredit S.p.A. to the parent company
was granted on 1 April 2015 for a counter-value of 2.5 million euros. The loan provides for interest
payments and the repayment of capital through deferred quarterly instalments starting from 31 July 2015.
The interest rate is variable and is determined based on the 3-month Euribor plus a spread of 3.50 points.
27. Other non-current financial liabilities
There were no non-current financial liabilities at 30 September 2015, as there were none at 30 June 2015.
The following table shows finance lease payments by due date:
EUR/000
Nominal value of
instalments
Due within 12 months 14
1-5 years 0
Non-current(5 years) 0
Total 14

Digital Bros Group Interim Management Statement as at 30 September 2015
77
8. ANALYSIS OF THE INCOME STATEMENT
3. Net revenues
The total is broken down below by segment, excluding the Holding segment, which does not generate
revenues:
EUR/000
Development Mobile Publishing
Italian
Distribution
Other
Activities Total
1 Gross revenues 627 3,085 12,937 9,493 105 26,247
2
Revenue
adjustments 0 0 (140) (738) (30) (908)
3
Total net
revenues 627 3,085 12,797 8,755 75 25,339
The breakdown at 30 June 2014 was as follows:
EUR/000 Development Mobile Publishing
Italian
Distribution
Other
Activities Total
1 Gross revenues 339 2,710 20,921 5,546 54 29,570
2
Revenue
adjustments 0 0 (991) (98) (39) (1,128)
3
Total net
revenues 339 2,710 19,930 5,448 15 28,442
The quarter saw the launch on the Italian market of the video games Metal Gear Solid V and PES 2016, in
addition to the launch of Daily Fantasy Sport Fantasfida on the Italian market only. Fantasfida is a skill
game in which the player fields a team of seven football players and participates in a tournament, after
paying entry dues, held during a day of championship and/or European cup competitions. Fantasfida is
operated under concession from the Italian State Monopoly Administration (AAMS) held by the
subsidiary Game Network S.r.l. No new product launches took place in the Publishing and Mobile
business segments.
Gross revenues decreased from 29,570 thousand euros to 26,247 thousand euros for the period ended 30
September 2015. Net revenues decreased by 10.9% to 25,339 thousand euros from 28,442 thousand euros
for the period ended 30 September 2014.
Gross revenues for the quarter, down by 11.2%, reflect the positive performance of Italian Distribution
revenues, in line with the success of Metal Gear Solid V and PES 2016, offset by a decline in Publishing
revenues due to the lack of new product releases during the period.
The Publishing segment’s revenues decreased by 7,984 thousand euros compared to the first quarter of
the previous year, which had benefited from the sales of the video game Sniper Elite V3, launched near
the end of the year. The first quarter benefited from the sales of two of the main products currently
published by the Group, PAYDAY 2 and Terraria, but without boasting any significant new product
releases.
Italian Distribution revenues increased by 3,947 thousand euros, particularly influenced by the success of
the video games Metal Gear Solid V and PES 2016. Sales of Yu-Gi-Oh! trading cards decreased.

Digital Bros Group Interim Management Statement as at 30 September 2015
78
The Mobile segment’s revenues climbed to 3,085 thousand euros during the quarter, up by 13.9%
compared to the same period of the previous year. The revenues generated by Terraria amounted to 2,463
thousand euros, driven by the video game’s continuing success at the global level.
The Development segment’s revenues amounted to 627 thousand euros and related to sales that the U.S.
developer Pipeworks Inc. completed on Development orders for third clients.
25. Financial income and charges
The item consists of:
EUR/000 30 September 2015 30 September 2014 Change %
23 Interest and financial income 1,045 961 84 8.7%
24 Interest and financial expenses (363) (474) 111 -23.5%
25 Financial income and charges 682 487 195 40.0%
Net financial income amounted to 682 thousand euros, compared to 487 thousand euros in the same
period of the previous year. Interest income increased by 84 thousand euros due to the measurement at
fair value of the Starbreeze B shares (842 thousand euros) and exchange gains of 203 thousand euros,
compared to exchange gains of 961 thousand euros in the first quarter of the previous year. Interest
expenses decreased by 111 thousand euros, in line with the lower average debt for the period.
Below are the details of interest expense:
EUR/000
30
September
2015
30
September
2014
Change %
Interest expense due to banks (109) (334) 225 -67.3%
Other interest expense 0 0 0 0.0%
Interest expense on financing and leasing (31) (6) (25) n.s.
Interest on factoring (3) (5) 2 -41.1%
Total interest expense on sources of finance (143) (345) 202 -58.6%
Exchange losses (220) (129) (91) 70.9%
Total interest and financial expenses (363) (474) 111 -23.4%
29. Taxes
The breakdown of current and deferred taxes at 30 September 2015 is as follows:
EUR/000 30 September
2015
30 September
2014 Change %
Current taxes (922) (657) (265) 40.3%
Deferred taxes (55) (346) 292 -84.5%
Total income taxes (977) (1,003) 27 -2.7%
Digital Bros Group Interim Management Statement as at 30 September 2015
79
9. NON-RECURRING INCOME AND EXPENSES
As required by Consob Resolution no. 15519 of 27 July 2006, non-recurring income and expenses are
shown separately in the income statement. These are generated by transactions or events that by nature do
not occur on a regular basis as part of the business.
During the period, the Group did not recognise any non-recurring income or expenses.

Digital Bros Group Interim Management Statement as at 30 September 2015
80
10. SEGMENT REPORTING
The Digital Bros Group develops, publishes, distributes and markets video games on an international
scale.
In order to respond to the changed competitive context of the video games market, the Group has
implemented an organisational change process that involved expanding into the Mobile segment,
dedicated to the publication of video games on smartphones and social networks, alongside the already
existing structure. The reorganisation also entailed the consolidation of the previous Digital unit into the
Publishing business segment, considering that the products distributed on the traditional channels and
digital marketplaces adopt the same development, communication and marketing policies, which are
managed by the same organisational division. The increasing weight of the Mobile and Publishing
business segments and the concurrent reduction of the Italian Distribution business segment resulted in a
need for a more extensive organisational structure to coordinate the Group’s business, the Holding
business segment, in particular for the finance, administration, information technology and general
services functions.
The acquisition of the U.S. company Pipeworks Inc. on 12 September 2014 allowed the Group to extend
the scope of its business to include video game development (the Development business segment).
Since the previous year, the business conducted by the subsidiary Game Network S.r.l., which manages
paid gaming platforms under concession from the Italian State Monopoly Administration (AAMS), has
been separated from the Mobile segment. The above business was merged into the new segment Other
Activities, which also includes the business conducted by the subsidiary Digital Bros Game Academy
S.r.l., namely the organisation of IT and gaming specialisation and training courses.
For the sake of comparison, income statement figures for the period ended 30 September of the previous
year have been restated according to the current arrangement by business segments.
The Group is therefore organised into five business segments:
Development;
Publishing;
Mobile;
Italian Distribution;
Other Activities;
Holding.
The directors observe the results of each segment separately in order to decide how to allocate resources
and monitor financial results. Financial income and charges (including interest income and expense) and
income tax are managed at the Group level and are not allocated to the business segments.
The following is a breakdown of results by business segment as at 30 September 2015 and 30 September
2014. Refer to paragraph 7 of the directors’ report for comments.

Digital Bros Group Interim Management Statement as at 30 September 2015
81
Income statement by business segment for the period ended 30 September 2015
Consolidated data in thousands of Euro Development Mobile Publishing Italian Distribution
Other
Activities Holding Total
1 Gross revenues 627 3,085 12,937 9,493 105 0 26,247
2 Revenue adjustments 0 0 (140) (738) (30) 0 (908)
3 Total net revenues 627 3,085 12,797 8,755 75 0 25,339
4 Purchase of goods for resale 0 0 (2,463) (6,221) 0 0 (8,684)
5 Purchase of services for resale (219) (395) (1,836) 0 (7) 0 (2,457)
6 Royalties 0 (1,351) (2,281) 0 (19) 0 (3,651)
7 Changes in finished product inventories 0 0 (106) (48) 0 0 (154)
8 Total cost of sold products (219) (1,746) (6,686) (6,269) (26) 0 (14,946)
9 Gross profit (3+8) 408 1,339 6,111 2,486 49 0 10,393
10 Other revenues 1,056 146 33 4 60 0 1,299
11 Cost of services (68) (184) (1,278) (727) (687) (322) (3,266)
12 Rent and leasing (35) (18) (125) (12) (6) (192) (388)
13 Personnel costs (1,194) (738) (1,658) (488) (126) (690) (4,894)
14 Other operating expenses (44) (19) (143) (69) (11) (105) (391)
15 Total operating costs (1,341) (959) (3,204) (1,296) (830) (1,309) (8,939)
16 EBITDA (9+10+15) 123 526 2,940 1,194 (721) (1,309) 2,753
17 Amortisation and depreciation (149) (339) (292) (42) (40) (28) (890)
18 Provisions 0 0 0 0 0 0 0
19 Write-down of assets 0 0 0 0 0 0 0
20 Write-backs of assets and non-monetary income 0 0 0 0 0 0 0
21 Total non-monetary income and operating costs (149) (339) (292) (42) (40) (28) (890)
22 EBIT (16+21) (26) 187 2,648 1,152 (761) (1,337) 1,863

Digital Bros Group Interim Management Statement as at 30 September 2015
82
Income statement by business segment for the period ended 30 September 2014
Consolidated data in thousands of Euro Development Mobile Publishing Italian Distribution
Other
Activities Holding Total
1 Gross revenues 339 2,710 20,921 5,546 54 0 29,570
2 Revenue adjustments 0 0 (991) (98) (39) 0 (1,128)
3 Total net revenues 339 2,710 19,930 5,448 15 0 28,442
4 Purchase of goods for resale 0 0 (4,748) (3,420) 0 0 (8,168)
5 Purchase of services for resale 0 (303) (894) 0 (6) 0 (1,203)
6 Royalties 0 (1,950) (7,276) 0 0 0 (9,226)
7 Changes in finished product inventories 0 0 268 (385) 0 0 (117)
8 Total cost of sold products 0 (2,253) (12,650) (3,805) (6) 0 (18,714)
9 Gross profit (3+8) 339 457 7,280 1,643 9 0 9,728
10 Other revenues 0 15 4 24 0 0 43
11 Cost of services (28) (162) (1,800) (604) (49) (407) (3,050)
12 Rent and leasing (10) (3) (141) (13) (12) (188) (367)
13 Personnel costs (293) (406) (1,316) (399) (62) (661) (3,137)
14 Other operating expenses (9) (5) (109) (67) (4) (96) (290)
15 Total operating costs (340) (576) (3,366) (1,083) (127) (1,352) (6,844)
16 EBITDA (9+10+15) (1) (104) 3,918 584 (118) (1,352) 2,927
17 Amortisation and depreciation (45) (133) (147) (55) (23) (26) (429)
18 Provisions 0 0 0 0 0 0 0
19 Write-down of assets 0 0 0 0 0 (332) (332)
20 Write-backs of assets and non-monetary income 0 0 0 0 0 0 0
21 Total non-monetary income and operating costs (45) (133) (147) (55) (23) (358) (761)
22 EBIT (16+21) (46) (237) 3,771 529 (141) (1,710) 2,166
Digital Bros Group Interim Management Statement as at 30 September 2015
83
Development: the Development business segment is responsible for designing and developing video
games. The business is conducted through an organisational structure consisting of qualified staff. The
Company currently benefits from development agreements with clients external to the Group. The
acquisition provides access to an internal development team capable of contributing technological
expertise to the improvement of video game quality and adherence to development schedules.
Publishing: this activity consists of acquiring the rights to use video games from developers and their
subsequent distribution both through a traditional-type international sales network and by distribution on
the digital marketplaces such as, for example: Steam, Sony PlayStation Network, Microsoft Xbox Live.
The video games are normally acquired on an exclusive licence with international exploitations rights
valid for several years.
505 Games is the trade name used by the Group worldwide in the Publishing segment.
Publishing operations were carried out during the period by the subsidiary 505 Games S.r.l. (which
coordinates the segment), together with 505 Games France S.a.s., 505 Games Ltd., 505 Games (US) Inc.,
505 Games Spain Slu and 505 Games GmbH, operating respectively in the French, U.K., U.S., Spanish
and German markets. The company 505 Games Interactive (US) Inc. provides consultancy on behalf of
505 Games S.r.l. The Swedish company 505 Games Nordic AB was dormant during the period and is
currently in liquidation.
Mobile: this business segment is responsible for the production and marketing of video games for mobile
(smartphone and tablet) platforms and for social networks. The segment is coordinated by 505 Mobile
S.r.l., which controls the U.S. company 505 Mobile (US) Inc., which provided consultancy on behalf of
its parent company. With the acquisition of the English company DR Studios Ltd. on 12 September 2014,
the business segment benefited from an expansion of the activities carried out, which now also include the
development of applications together with the publishing and marketing activities already carried out
previously. The segment also includes Game Entertainment S.r.l., which in the previous year began to
manage mobile video games that generate advertising revenue.
The distinctive nature of the video games of the Mobile business segment relates to the different
distribution platforms and the possibility for players to download applications free from the marketplaces
and then spend money during the phases of the game.
505 Mobile is the trade name used by the Group worldwide in the Mobile segment.
Italian Distribution: the distribution in Italy of video games acquired from international publishers. The
games are marketed through a direct network of key accounts and through an indirect network of sales
representatives.
These operations are conducted by the parent, Digital Bros S.p.A., under the Halifax brand, and by the
subsidiary Game Service S.r.l. for alternative distribution channels.
The Group also distributes the Yu-Gi-Oh! trading card game throughout the country.

Digital Bros Group Interim Management Statement as at 30 September 2015
84
Other Activities: this business segment includes all activities of limited scope, which are consolidated into
a separate residual business segment, in the interest of logical presentation of results. The business
segment includes the activities of the subsidiary Game Network S.r.l., which manages paid games under
concession from the Italian State Monopoly Administration (AAMS). The business segment also includes
the activities of the subsidiary Digital Bros Game Academy S.r.l., which organises IT and video game
specialisation courses, training courses and professional refresher courses, in multimedia and other
formats.
Holding: this segment includes all coordinating functions carried out directly by Digital Bros S.p.A., in
particular the implementation of sound financial policies to support the Group’s operations, management
of office buildings and brand management. As from last year, the administration, management control and
development business have been included in the Holding business segment.
In June 2015, in order to bring the organisational structure into line with the structure of the business
segments, the parent company sold 100% of 505 Mobile S.r.l. and its subsidiaries, 505 Games France
S.a.s. and 505 Games Slu, to 505 Games S.r.l.

Digital Bros Group Interim Management Statement as at 30 September 2015
85
Information on geographical segments
Gross revenues are broken down below by region:
EUR/000 30 September 2015 30 September 2014 Change
Europe 4,532 17% 11,945 40% (7,413) -62.1%
The Americas 11,674 44% 10,958 37% 716 6.5%
Rest of the world 442 2% 1,067 4% (625) -58.6%
Total revenues from abroad 16,648 63% 23,970 81% (7,322) -30.5%
Italy 9,598 37% 5,600 19% 3,998 71.4%
Consolidated total gross revenues 26,246 100% 29,570 100% (3,324) -11.2%
In line with the aforementioned increase in the Italian Distribution segment’s revenues, the weight of
Italian revenues increased from 19% in the first quarter of the previous year to the current 37%. Revenues
in the Americas, owing in part to the strong performance of the local market, increased from 37% to the
current 44%, despite the negative performance of the Publishing segment.
Revenues in the rest of the world were generated by the subsidiary 505 Games Ltd., mainly in Australia,
the Middle East and South Africa.
The most significant portion of the revenues from abroad is generated by the Publishing segment, which
booked revenues from abroad as 12,936 thousand euros. Below is a breakdown of gross revenues from
abroad, according to business segment:
EUR/000 30 September 2015 30 September 2014 Change
Mobile 3,085 19% 2,710 11% 375 13.8%
Publishing 12,936 78% 20,921 87% (7,985) -38.2%
Development 627 4% 339 1% 288 85.0%
Total gross revenues from abroad 16,648 100% 23,970 100% (7,322) -30.5%
The revenues of the Development business segment include the revenues generated by Pipeworks Inc. on
ongoing Development orders from non-captive clients.

Digital Bros Group Interim Management Statement as at 30 September 2015
86
11. RELATED PARTY TRANSACTIONS
In accordance with Consob Resolution 17221 of 12 March 2010, it is hereby reported that all commercial
and financial transactions between members of the Digital Bros Group, and between those companies and
other non-subsidiary related parties, have been conducted at arm’s length and do not qualify as atypical or
unusual transactions.
Intercompany transactions
Intercompany transactions have been described in paragraph 8 of the report on intercompany operations
and related party transactions and atypical/unusual transactions, to which we would refer you.
Other related parties
Related party transactions regard:
legal consultancy provided by the director Dario Treves;
property rental carried out by Matov Imm. S.r.l. towards the parent company and subsidiary 505
Games France S.a.s.;
property rental carried out by Matov LLC to the subsidiary 505 Games (US) Inc.
Both Matov Imm. S.r.l. and Matov LLC are owned by the Galante family.
Transactions at 30 September 2015 are summarised below:
EUR/000 Receivables Payables Revenues Costs
Trade Financial Trade Financial
Dario Treves 0 0 (18) 0 0 (54)
Matov Imm. S.r.l. 0 635 0 0 0 (200)
Matov LLC 0 133 0 0 0 (67)
Total 0 768 (18) 0 0 (321)
As at 30 September 2014, these were:
EUR/000 Receivables Payables Revenues Costs
Trade Financial Trade Financial
Dario Treves 0 0 (18) 0 0 (36)
Matov Imm. S.r.l. 0 635 0 0 0 (196)
Matov LLC 0 119 0 0 0 (56)
Total 0 754 (18) 0 0 (288)
The financial receivable due to Digital Bros S.p.A. by Matov Imm. S.r.l. refers to the security deposit on
the Via Tortona 37 premises in Milan.

Digital Bros Group Interim Management Statement as at 30 September 2015
87
The financial receivable due to 505 Games (US) Inc. by Matov LLC refers to the guarantee deposit paid
by way of guarantee against the lease instalments for the premises that became the American subsidiary’s
offices during the previous year.
Rent for the Milan offices paid during the year by Digital Bros S.p.A. to Matov Imm. S.r.l. amounts to
189 thousand euros, that paid by 505 Games France S.a.s. for the buildings of Francheville amounts to 11
thousand euros.
In November 2013, a rent contract was stipulated between the subsidiary 505 Games (US) Inc. and Matov
LLC, an associated party owned by the Galante family. As a whole, the operation was subject to the
“Related party transactions procedure” adopted by Digital Bros S.p.A. in accordance with Consob
Regulation 17221 of 12 March 2010 and provides for annual charges of 297 thousand US dollars.
Tax consolidation
Digital Bros S.p.A., in its capacity as parent company/consolidating company, has opted for the tax
consolidation allowed by Italian law for the period 2015-2017 with the companies 505 Mobile S.r.l.,
Game Entertainment S.r.l., Game Service S.r.l., 505 Games S.r.l. and Digital Bros Game Academy S.r.l.
This has made it necessary to prepare a set of rules for intercompany relations to ensure that no prejudice
is caused to the individual participants in the system.
12. ATYPICAL OR UNUSUAL TRANSACTIONS
There were no atypical or unusual transactions in the period under examination or the same period of the
previous year, as defined by Consob Communication DEM 6064293 of 28 July 2006.

Digital Bros Group Interim Management Statement as at 30 September 2015
88
STATEMENT PURSUANT TO ART. 154-BIS (5) OF THE CONSOLIDATED
FINANCE ACT
We, the undersigned, Abramo Galante as chairman of the Board of Directors and Stefano Salbe as
Financial Reporting Officer of the Digital Bros Group, hereby declare, including in accordance with Art.
154-bis (3) and (4) of Legislative Decree 58 of 24 February 1998:
- the adequacy in relation to the characteristics of the business; and
- due compliance with the administrative and accounting procedures for the preparation of the
interim management statement at 30 September 2015.
We also confirm that:
1. the interim management statement of the Digital Bros Group at 30 September 2015:
a) has been prepared in accordance with the applicable International Accounting Standards
recognised by the European Union pursuant to Regulation 1606/2002/EC of the European
Parliament and the Council of 19 July 2002;
b) corresponds to the ledgers and accounting entries;
c) provides a true and fair view of the financial position and performance of Digital Bros
S.p.A. and of the companies included in the consolidation;
2. the interim management statement at 30 September 2015 contains information on the key events
that took place during the period and their impact on the interim management statement at 30
September 2015, along with a description of the main risks and uncertainties. It also contains
information on significant transactions with related parties.
Milan, 12 November 2015
Signed
Chairman of the Board of Directors Financial Reporting Officer
Abramo Galante Stefano Salbe