interim performance presentation - beranda · • rspo: to date, 155,045 ha of plantations...
TRANSCRIPT

0
12 November 2013
Interim Performance PresentationYTD Sep 2013 : nine-month period ended 30th September 2013

1
DisclaimerThis presentation has been prepared by Golden Agri-Resources Ltd. (“GAR” or “Company”) for informationalpurposes, and may contain projections and forward looking statements that reflect the Company’s currentviews with respect to future events and financial performance. These views are based on currentassumptions which are subject to various risks and which may change over time. No assurance can begiven that future events will occur, that projections will be achieved, or that the Company’s assumptions arecorrect. Actual results may differ materially from those projected. A prospective investor must make its ownindependent decision regarding investment in securities.
Opinions expressed herein reflect the judgement of the Company as of the date of this presentation andmay be subject to change without notice if the Company becomes aware of any information, whetherspecific to the Company, its business, or in general, which may have a material impact on any suchopinions.
The information is current only as of its date and shall not, under any circumstances, create any implicationthat the information contained therein is correct as of any time subsequent to the date thereof or that therehas been no change in the financial condition or affairs of GAR since such date. This presentation may beupdated from time to time and there is no undertaking by GAR to post any such amendments orsupplements on this presentation.
The Company will not be responsible for any consequences resulting from the use of this presentation aswell as the reliance upon any opinion or statement contained herein or for any omission.
© Golden Agri-Resources Ltd. All rights reserved.

2
Section 1 Executive Summary 3
Section 2 Financial Highlights 5
Section 3 Plantation Highlights 11
Section 4 Downstream Highlights 16
Section 5 Strategy and Outlook 19
Section 6 Appendix 24
Table of Contents

Section 1
Executive Summary

4
Executive Summary
• YTD Sep 2013 vs YTD Sep 2012 results
Revenue $4,683 mn 3%EBITDA $462 mn 28%Net Profit1 $188 mn 47%Palm product output 1.95 mn MT 5%CPO FOB price $786/MT 23%
• 3Q 2013 vs 2Q 2013 results
Revenue $1,571 mn 7%EBITDA $111 mn 21%Net Profit1 $30 mn 33%Palm product output 694,000 MT 17%CPO FOB price $769/MT 3%
Revenue for YTD Sep 2013 grew with expanded downstream operations, despite weaker CPO prices
EBITDA (US$ million)Price (US$/MT)
Output (‘000 MT)
Note:1. Net profit attributable to owners of the Company
100
200
300
400
500
600
700
800
9M09 9M10 9M11 9M12 9M13400
600
800
1,000
1,200
1,400
1,600
1,800
2,000
2,200
EBITDACPO Price (FOB Belawan)Palm Products Output

Section 2
Financial Highlights

6
Financial Performance – YTD Sep 2013
Revenue 4,683 4,533 3%Gross Profit 938 1,250 -25%EBITDA 462 643 -28%
Interest on borrowings -73 -54 35%Depreciation and amortisation -99 -84 18%Foreign exchange loss, net -15 -12 26%
Net Profit attributable to owners of the Company 188 356 -47%
US$ million YTD Sep 2013 YTD Sep 2012 Change
Revenue increased by 3% mainly driven by the expansion of refinery capacity.Lower year-on-year performance mainly caused by the decrease in average CPO FOB prices by 23% to US$786 per tonne in YTD Sep 2013, from US$1,023 per tonne in the same period last year.

7
Financial Performance – 3Q 2013
3Q 2013 performance year-on-year:• Revenue declined by 6% due to weaker average CPO FOB prices by 19%.• Lower 3Q 2013 performance was mainly attributable to weaker selling prices and less palm product output
by 13%.
3Q 2013 performance quarter-on-quarter:• Lower revenue of 7% mainly impacted by lower average selling prices and higher inventory levels.• Weaker 3Q 2013 performance also affected by higher salary costs.
Revenue 1,571 1,672 -6% 1,682 -7% Gross Profit 277 398 -30% 304 -9%EBITDA 111 190 -42% 140 -21%
Interest on borrowings -26 -21 28% -24 12%Depreciation and amortisation -35 -30 18% -33 6%Foreign exchange loss, net -6 -5 35% -14 -56%
Net Profit attributable to owners of the Company 30 86 -65% 45 -33%
US$ million 3Q 2013 3Q 2012 YoY 2Q 2013 QoQChange Change

8
Revenue 3,725 3,583 4% 959 950 1%
Gross Profit 884 1,227 -28% 54 23 140%
Gross Profit Margin 24% 34% -10% 6% 2% 4%
EBITDA 438 648 -32% 24 -5 n.m.
EBITDA Margin 12% 18% -6% 2% -1% 3%
Net Profitattributable to ownersof the Company 173 382 -55% 15 -26 n.m.
Segmental Results
While Indonesia Operations results were weaker, China Operations performance improved as a result of management team strengthening and more favourable business environment.
US$ million Indonesia Operations China OperationsYTD Sep 2013 YTD Sep 2012 Change YTD Sep 2013YTD Sep 2012 Change
9
Financial Position
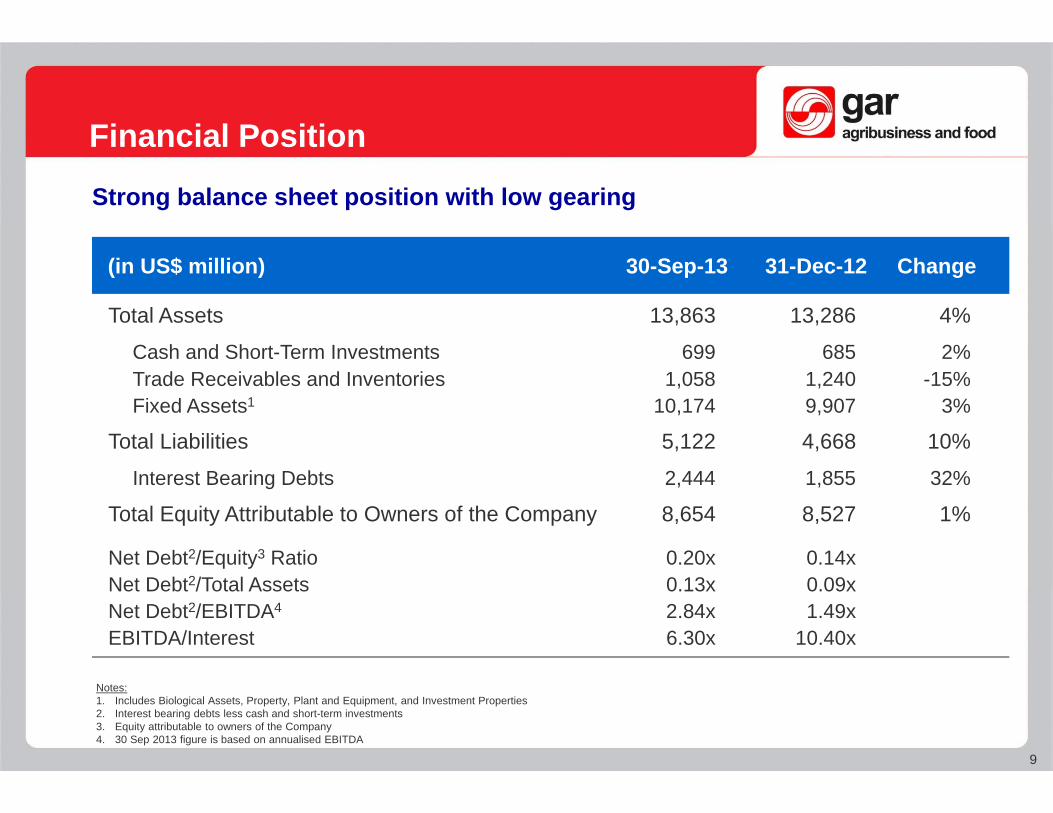
Strong balance sheet position with low gearing
(in US$ million) 30-Sep-13 31-Dec-12 Change
Total Assets 13,863 13,286 4%
Cash and Short-Term Investments 699 685 2%Trade Receivables and Inventories 1,058 1,240 -15%Fixed Assets1 10,174 9,907 3%
Total Liabilities 5,122 4,668 10%
Interest Bearing Debts 2,444 1,855 32%
Total Equity Attributable to Owners of the Company 8,654 8,527 1%
Net Debt2/Equity3 Ratio 0.20x 0.14xNet Debt2/Total Assets 0.13x 0.09xNet Debt2/EBITDA4 2.84x 1.49xEBITDA/Interest 6.30x 10.40x
Notes:1. Includes Biological Assets, Property, Plant and Equipment, and Investment Properties2. Interest bearing debts less cash and short-term investments3. Equity attributable to owners of the Company4. 30 Sep 2013 figure is based on annualised EBITDA

10
Dividend
The proposed dividend is in line with our dividend policy and takes into consideration our strategic expansion as well as potential value-creating acquisitions
The Company’s dividend policy is to distribute up to 30% of underlying profit
Cash DividendDividend per share (in S$ cents) 0.495 0.770 1.840 1.190 0.585Total Dividend (in S$ million) 60.09 93.47 223.35 152.77 75.10% to underlying profit 22% 18% 30% 30% 30%
Interim2009 2010 2011 2012 2013
The Board approves to distribute interim dividend of 0.585 Singapore cents per share, 30% of our underlying profit for YTD Sep 2013

Section 3
Plantation Highlights

12
(in ha) 30 Sep 30 Sep 30 Sep 2013/2012 31 Dec2013 2012 % increase 2012
Planted Area 467,014 459,502 1.6% 463,426Nucleus 368,476 363,586 1.3% 366,914Plasma 98,538 95,916 2.7% 96,512
Mature Area 431,612 418,137 3.2% 416,309Nucleus 339,601 330,187 2.9% 328,423Plasma 92,011 87,950 4.6% 87,886
GAR is the largest Indonesian plantation company with integrated operations
Plantation Area
• Total 8,600 hectares of new planting and replanting• In Dec 2012, we announced the acquisition of approximately 16,000 hectares of mature oil palm
plantations in Indonesia, of which completion is in progess.

13
41,365
91,953
211,932
94,851 19,401
35,402
79,597
224,322
107,369
20,324
Total Planted Area by Age Profile
GAR’s long-term growth is supported by favourable age profile of planted area underpinned by large immature and young plantations
Notes:1. Total planted area, including plasma 2. As of 30 Sep 2013, average age of plantations, including plasma, is 13 years
Sep 2013 Sep 2012
48%
8%4%
23% 17%
46%
20%
9%4%
21%
14
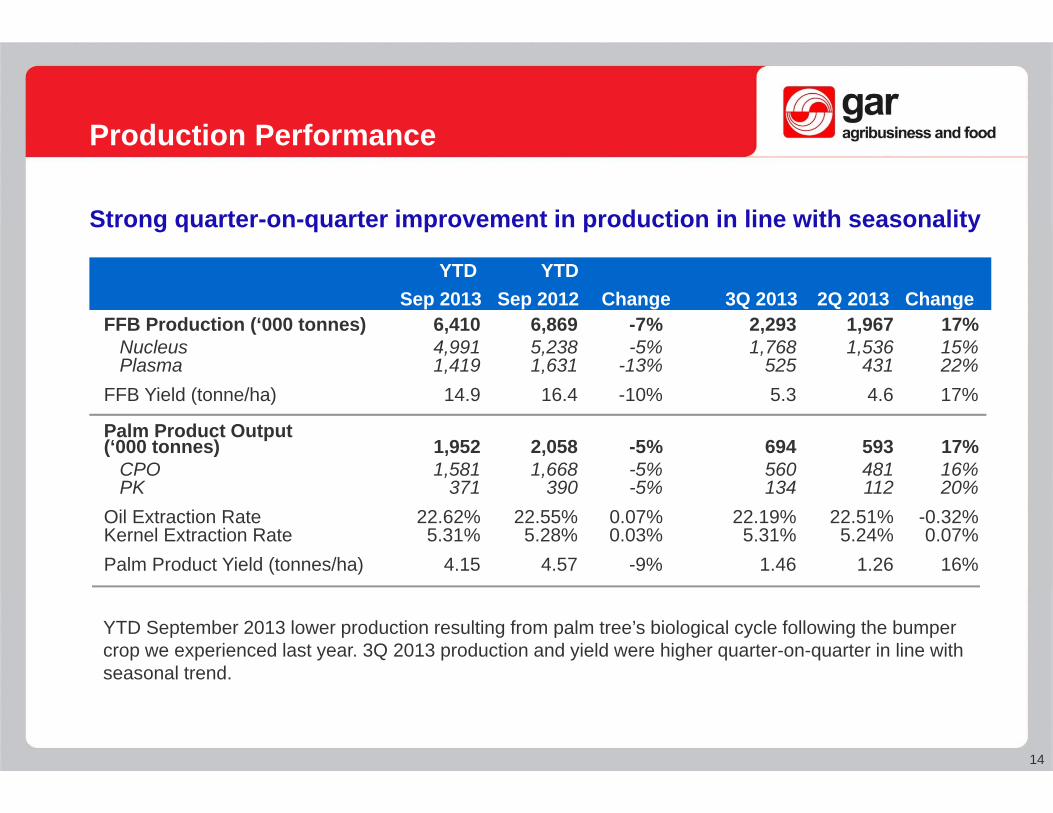
YTD September 2013 lower production resulting from palm tree’s biological cycle following the bumper crop we experienced last year. 3Q 2013 production and yield were higher quarter-on-quarter in line with seasonal trend.
Strong quarter-on-quarter improvement in production in line with seasonality
Production Performance
FFB Production (‘000 tonnes) 6,410 6,869 -7% 2,293 1,967 17%Nucleus 4,991 5,238 -5% 1,768 1,536 15%Plasma 1,419 1,631 -13% 525 431 22%
FFB Yield (tonne/ha) 14.9 16.4 -10% 5.3 4.6 17%
Palm Product Output(‘000 tonnes) 1,952 2,058 -5% 694 593 17%
CPO 1,581 1,668 -5% 560 481 16%PK 371 390 -5% 134 112 20%
Oil Extraction Rate 22.62% 22.55% 0.07% 22.19% 22.51% -0.32%Kernel Extraction Rate 5.31% 5.28% 0.03% 5.31% 5.24% 0.07%Palm Product Yield (tonnes/ha) 4.15 4.57 -9% 1.46 1.26 16%
YTD YTDSep 2013 Sep 2012 Change 3Q 2013 2Q 2013 Change
15
Holistic Approach to Sustainability
Certification Updates• RSPO: To date, 155,045 ha of plantations including smallholder plantations of 21,418 ha, 12 mills and
one refinery have received Roundtable on Sustainable Palm Oil (RSPO) certification.• ISCC: To date, 187,166 ha of plantations including smallholder plantations of 32,873 ha, 16 mills,
10 bulking stations and three refineries have received International Sustainability and Carbon Certification (ISCC).
• ISPO: GAR has also received its first Indonesian Sustainable Palm Oil (ISPO) certification for 9,721 ha of plantations and one mill in Riau in December 2012.
Milestones• Published the first six month progress report on High Carbon Stock (HCS) Forest Conservation pilot
project on 30 October 2013.o Held meetings with the community in PT Kartika Prima Cipta to gather feedback and input to ensure
community buy-in for forest conservation.o Continued engagement with the relevant government ministries to implement a land swap policy.o Conducted three workshops for growers on HCS methodology and discussed about adopting HCS.o We continue our multi-stakeholder engagement to find solutions.
• Published GAR Sustainability Report 2012 in September 2013.
Section 4
Downstream Highlights

17
Our Brands
Expanding Downstream Capacity in Indonesia
• YTD Sep 2013 sales volume of refined products grew by 58% year-on-year
• Refining capacity expansion supported by:• Growing palm products output from our plantations• Export tax scheme favouring refined products• Government target to allow only packaged cooking oil in Indonesia by 2015
• Improved logistics infrastructure through increased bulking and warehousing capacity as well as owned port and jetties
• Our prominent cooking oil brands, Filma and Kunci Mas, are among the leaders in Indonesia supported by nation-wide coverage with hundreds of distributors and thousands of retailers
Expanding Indonesia downstream production base for global exports
0200400600800
100012001400160018002000
2009 2010 2011 2012 Sep-13
Annu
al C
apac
ity ('
000
MT)
Kernel crushingcapacity
Refinery capacity
Expanded annual capacity by 180k MT in Q3 2013

18
ZhuhaiNingbo
Tianjin
Strengthening Downstream Business in China
Strengthening of the management team showing positive impact in China as one of the largest and fastest growing edible oils consumers
GAR strategically strengthen its presence in China by:• Developing distribution channels to enter new areas in
China• Achieve competitive raw material cost by exploring
strategic sourcing opportunities• Enhance relationships with end customers by providing
additional services• Actively manage flexible production to optimise profits• Pursuing value-added products such as specialty fats
Facilities Annual CapacityRefining 776,000 MT
Crushing 2.3 million MT
Noodle Manufacturing 5 billion packets
Oilseeds facilitiesFood facilities

19
Section 5
Strategy and Outlook

20
Strategic Priorities
Build on core competitive strengths and leverage scale to maximize long-term shareholder returns
Objective: Sustained Growth and Profitability
Upstream
• To become the world largest oil palm plantation company in terms of planted area through green field and acquisitions
• Sustain cost leadership through operational excellence, best-in-class plantation management and highest yielding seeds
Downstream• Optimise value throughout the chain supported
by prudent risk management• Grow destination business by extending
distribution and processing reach to key consuming countries
• Shift product mix to higher value-added products, including oleochemicals, through innovation and customer solutions
Continued strong commitment to environmental and social responsibility

21
Downstream Value Chain Optimisation
CANADA
PAKISTAN
TURKEY
UKNETHERLANDGERMANY
EGYPT
46
5
9
10
128
11
Capitalise on our unique advantage of having own large CPO production and close access to third party plantations …
… to grow our globally diversified customer base via distribution, branding, merchandising, destination processing and shipping
East Asia
South Asia
EUUS
Africa
Middle East
CPO inputTrade flows

22
Downstream Value Chain Optimisation
Commercially manage our plantation output and downstream assets to capitalise on value chain optimisation opportunities
Efficient logistics• Own large CPO
output base• Close access to
3rd party plantations
Sourcing of raw materials
• Strategic locations provide logistics advantage
• Refining, shortenings, specialty fats, and oleochemicals facilities
Processing
Margin optimisation through large product portfolio -specifications, quality and sustainability certification
Product customisation
Broad geographic footprint - distribution, branding, merchandising, destination processing, shipping and logistics
Sales and distribution

23
Growth Strategy and Outlook
Growth Strategy• Expanding palm oil plantations by 25,000-30,000 hectares in 2013 through organic growth and
acquisition• Building milling capacity in line with the growth in fruits production• Constructing additional downstream processing capacity in strategic locations • Extending distribution coverage and global market reach as well as logistic facilities to enhance
our integrated operations
Projected capex for FY 2013 growth strategy: approximately US$550 million
Industry OutlookIn the long term, GAR remains to believe in the robust demand growth of palm oil:• As edible oil from both emerging markets and developed countries• As substitute and alternative uses such as oleochemicals and biodiesel• Supported by limited supply growth of other vegetable oils, especially soybean
GAR continues to expand its integrated operation capabilities in order to capitalise on the firm industry long-term outlook, best-in-class plantation
management and solid financial position

24
Section 6
Appendix

25
Revenue Details
CPO38%
Unbranded Refined Palm
Products35%
Branded Products
7%
Soybean Meal8%
Soybean Oil3%
Soybean 4% Others5%
YTD Sep 2013 revenue of US$4.7 billion mainly from CPO and refined palm oil based products
By CountryBy Product
Indonesia Local11%
Indonesia Export
69%
China Local20%

26
Age Profile
GAR’s long-term growth is supported by favourable age profile of planted area underpinned by large immature and young plantations
30 September 2013Nucleus 28,875 69,494 173,434 76,349 20,324 368,476Plasma 6,527 10,103 50,888 31,020 - 98,538Total Area 35,402 79,597 224,322 107,369 20,324 467,014% of total planted area 8% 17% 48% 23% 4% 100%
Immature Young Prime Old 1 Old 2 Total(in ha) (0-3 years) (4-6 years) (7-18 years) (19-25 years) (>25 years)
Note:Average age of plantations as of 30 September 2013 is 13 years
30 September 2012Nucleus 33,399 83,920 153,839 73,027 19,401 363,586Plasma 7,966 8,033 58,093 21,824 - 95,916Total Area 41,365 91,953 211,932 94,851 19,401 459,502% of total planted area 9% 20% 46% 21% 4% 100%
27
Contact Us
If you need further information, please contact:
Golden Agri-Resources Ltdc/o 108 Pasir Panjang Road#06-00 Golden Agri PlazaSingapore 118535
Telephone : +65 65900800Facsimile : +65 65900887
www.goldenagri.com.sg
Contact Person : Richard Fung ([email protected])