interim report / 2013 - admin.blacksheep.design report / 2013. palmerst 201 2. 03 ... cooper rapley...
TRANSCRIPT
PALMERSTON NORTH AIRPORT 2013 INTERIM REPORT 1
I N T E R I M R E P O R T / 2 0 1 3
PALMERSTON NORTH AIRPORT 2013 INTERIM REPORT 2

0 3
C O N T E N T S3 Joint Chairman & Chief Executive’s Report5 Statement of Service Performance6 Financial Statements11 Notes to the Financial Statements

0 4
DIRECTORS: D N Walker (Chairman) O B StockG F GillespieJ E NicholsJ M K B Adlam
MANAGEMENT:D R Cusack Chief ExecutiveR A Bodell Manager Transition & ProjectsL M J Macdonald Manager Business Services & Secretary to the BoardG W Pleasants Manager Aeronautical & Infrastructure
REGISTERED OFFICE:Palmerston North International AirportTerminal BuildingAirport DrivePALMERSTON NORTH 4442
Phone: +64 6 351 4415Fax: +64 6 355 2262e-mail: [email protected]: www.pnairport.co.nz
TRADING BANKERS:Bank of New Zealand
LEGAL ADVISOR:Cooper Rapley
AUDITORS:Audit New Zealand (on behalf of The Auditor-General)
PALMERSTON NORTH AIRPORT LIMITED
C O M P A N Y D I R E C T O R Y

0 5
The first six months of the 2013/14 financial year has been a positive period for Palmerston North Airport Ltd (PNAL) with a range of projects completed or underway and an improved financial result.
The Board and Management of PNAL continue to move forward with implementation of the Company’s strategy. The importance of growth across the region is essential for PNAL’s on-going growth and we continue to strive to achieve our vision to “grow shareholder and regional economic value by operating a safe, efficient, attractive and profitable airport that serves the Central Region”. The vision reflects the importance that the airport plays to the greater region and the need to work closely with a wide range of stakeholders both from a business and tourism perspective in identifying growth opportunities across the visitor and business sectors.
From a financial perspective, a net surplus after tax of $306,171 was achieved for the period. This is 43% above the same period last year. Revenue was up 7.5% on the same period last year as a result of increased passenger numbers which also flowed through to higher car park usage. In addition PNAL experienced growth in land & building rental as a result of moving to concession based charging for the terminal retail activity. EBITDA is up 17.9% on the same period last year.
Passenger numbers on scheduled commercial flights for the six months to 31 December 2013 were up 9% on the same period last year. The available seat capacity was 4% above the same six-month period last year which indicates higher load factors on flights with larger 68 seat aircraft being used more frequently on Auckland and Christchurch routes.
The company undertook a review of its debt structure with new arrangements being completed during 2012/13. The restructuring saw a review of arrangements, with the outcome being a more flexible debt facility for the business. As a result of this re-structure, PNAL reduced the cost of debt for the period by 10%.
PNAL have continued to work closely with Air New Zealand on a range of activities to support both inbound and outbound growth with a range of packages to bring visitors into the region. PNAL also continues to raise the profile of Palmerston North as an airport which is easy to access by road with cost effective car parking options supporting outbound travelers from the greater region. The importance of Palmerston North, Horowhenua, Rangitikei, Ruapehu, Manawatu and Tararua Districts collaborating on initiatives is key part of future success and we continue to refine our visitor strategy focusing on the fly market, however funding constraints restricts activities to support this.
In July we saw the launch of Nelson direct services with Air New Zealand. This has provided both important business and leisure connections for the wider regions of Tasman and Manawatu. Customer feedback has been very good with Air New Zealand now committing to this sector on a full time basis; the team continues to discuss other opportunities around new and existing routes.
Palmerston North also supported the response to natural seismic and weather events in the Wellington region, with diverted air traffic up on the previous year. PNAL’s ability to react positively and provide services for various aircraft diversions has highlighted the importance of PNAL as an emergency alternate. In addition, the strategic advantages of our central location for logistics/distribution businesses and 24/7 operation provide opportunities to grow our already important night freight market.
FROM THE CHAIRMAN & CHIEF EXECUTIVE OFFICER FOR THE SIX MONTHS ENDING 31 DECEMBER 2013
J O I N T R E P O R T

0 6
We continue to seek growth opportunities both from an aeronautical and non-aeronautical perspective. A more commercial approach to various airport concessions and agreements has been followed through, with additional contractual changes planned in the second half of the financial year.
Operationally, we have continued capital upgrades on a variety of facilities with further car park upgrading and resurfacing complete. On airside, we have completed aircraft parking apron upgrades. We have also confirmed our runway capital plan for the next three years with stage one of the programmed runway resurfacing commencing in February 2014.
All statutory requirements relating to the airport have been met, including satisfactory independent audits by the Civil Aviation Authority, during the first six months of the year. These were also supported by continuing monthly internal audits and quality control checks undertaken by an independent body.
The following have been progressed over the last six months:-
• Forward capital program for airside runway pavements confirmed• Completion of stage one of a visitor strategy for the region • Aeronautical route development plans undertaken with the introduction of Nelson direct services and
additional capacity to Auckland and Christchurch • Completion of the café offering in terminal• A 2.6% increase in vehicles using the car park by comparison with the first 6 months of 2013, generated a
3.5% increase in revenue for the same period. • Completion of a new airside facility for Air BP• New airport retail concession with LS Travel (Relay) in the terminal building• Stage one of new car parking system at Palmerston North Airport • Successful negotiation and implementation of new terminal cleaning contract• Review of the air noise contour plan• Review of the Airport Masterplan underway
We watch with interest the performance of the local and global economy and how it impacts on the region in regard to growth opportunities. The domestic travel market has been consistent over the last 6 months, and upcoming airline alliances continue to be a feature of the Australia/New Zealand aviation market with recent announcements from Air New Zealand.
The importance of the wider region collaborating on a visitor strategy that supports opportunities continues to be high on priorities for the second half of the financial year. PNAL is committed to supporting the regions various visitor agencies to identify events and activities for promotion to the domestic and international markets, whilst building on iconic activities such as the Department of Conservation: “Great Walks” featuring the Tongariro Crossing and Whanganui River.
In closing PNAL continue to review its operations and opportunities to bring travelers into the region, we look forward to the stage one runaway project and upgrade of the car park system which continues the prudent capital investment plans for the airport; this also provides benefits to our customers and users.
Derek Walker Darin Cusack Chairman Chief Executive

0 7
• The Company’s Amended Statement of Intent is dated December 2013.• The Company has an interest in FreightGate Limited, a wholly owned subsidiary company which was
formed in October 2001and may be used for the management of non-operational property.• The ratio of consolidated shareholders’ funds to total assets has been maintained above 70%.• The Company is trading as Palmerston North Airport and FreightGate.• Palmerston North Airport has been maintained as an airport certificated pursuant to Civil Aviation Rule Part
139 and has achieved satisfactory audits during the period.• All obligations under the Resource Management Act and the District Plans of the Palmerston North City
Council and Manawatu District Council have been met.
PERFORMANCE MEASURES:
OBJECTIVE:“To grow the shareholder’s and regional economic value by operating a safe, efficient, attractive and profitable airport that serves the Central Region.”
STATEMENT OF SERVICE PERFORMANCE
S E R V I C E P E R F O R M A N C E
Dec 2013 Dec 2012 SOI Target % of target
6 Months 6 Months 12 Months achieved
1. Ratio of Net Surplus before interest and tax to Total Assets:
1.4% 1.2% 2.8% 51%
2. Ratio of Net Surplus after interest and tax to consolidated Shareholders funds:
0.9% 0.6% 1.7% 51%
3. Interest cover ratio of Net Surplus before interest tax and depreciation to interest, at or above :
5.2 2.4 ≥2.5 260%
4. Maintain a tangible net worth (of or above) 35.6 35.20 ≥$35m 100%
5. Total Passenger Throughput 250,284 229,767 475,000 53%
6. Maintain a high level of customer satisfaction 98% are either "Quite satisfied" or “very satisfied” - Customer Satisfaction Survey November 2013

0 8
Derek Walker Gerard GillespieChairman Director
The accompanying accounting policies and notes form part of and are to be read in conjunction with these financial statements
Date: 20 February 2014
STATEMENT OF FINANCIAL PERFORMANCE - PARENT & CONSOLIDATED FOR THE SIX MONTHS ENDED 31 DECEMBER 2013
31-Dec-13 31-Dec-12 30-Jun-14 30-Jun-13
Note 6 Months Unaudited
6 Months Unaudited
12 Months SOI
12 Months Audited
REVENUE 4 2,509,747 2,333,380 4,706,000 4,589,800
OPERATIONAL & MAINTENANCE COSTS
Airfield Services 246,752 246,752 493,500 493,503
Other Operating Expenses 5 575,680 645,430 1,004,000 1,180,906
TOTAL OPERATIONAL & MAINTENANCE COSTS 822,432 892,182 1,497,500 1,674,409
ADMINISTRATION
Audit Fees 14,000 13,583 28,000 27,083
Loss on Sale of Assets 2,812
Bad Debts Written Off 18,732 12,847 5,000 13,367
Changes in doubtful debt provision
Directors' Fees 38,250 38,250 76,500 76,500
Employee Expenses 6 347,243 384,508 825,253 700,649
General Administration 294,983 166,130 304,747 329,876
TOTAL ADMINISTRATION: 713,208 615,318 1,239,500 1,150,287
TOTAL OPERATING COSTS 1,535,640 1,507,500 2,737,000 2,824,696
Operating Surplus before interest, depreciation & taxation 974,107 825,880 1,969,000 1,765,104
FINANCE COSTS & DEPRECIATION
Finance costs 7 187,328 209,122 411,500 408,709
Depreciation 15 344,972 319,895 711,500 647,477
TOTAL FINANCE COSTS & DEPRECIATION: 532,300 529,017 1,123,000 1,056,186
Operating Surplus before taxation 441,807 296,863 846,000 708,918
Taxation Expense on operating surplus 8 135,636 83,122 236,500 217,035
NET SURPLUS AFTER TAXATION 306,171 213,741 609,500 491,883
For and on behalf of the Board
Date: 20 February 2014
0 9
31-Dec-13 31-Dec-12 30-Jun-14 30-Jun-13
Note 6 Months Unaudited
6 Months Unaudited
12 Months SOI
12 Months Audited
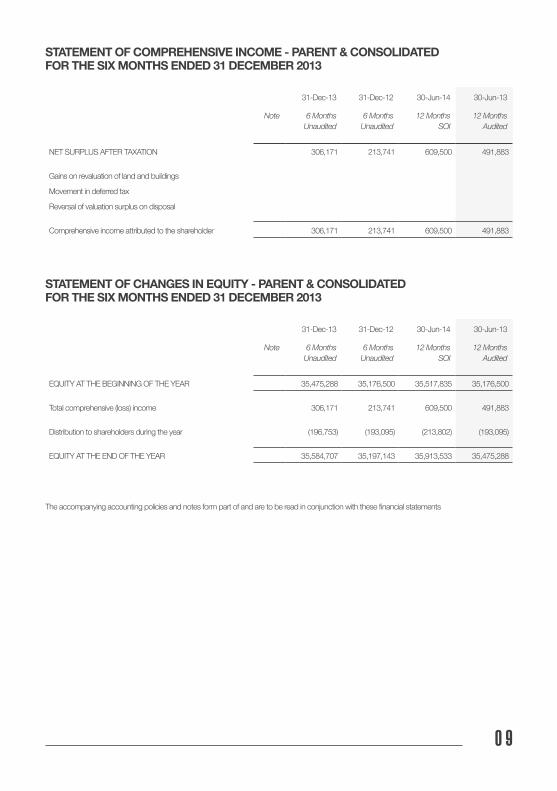
NET SURPLUS AFTER TAXATION 306,171 213,741 609,500 491,883
Gains on revaluation of land and buildings
Movement in deferred tax
Reversal of valuation surplus on disposal
Comprehensive income attributed to the shareholder 306,171 213,741 609,500 491,883
STATEMENT OF COMPREHENSIVE INCOME - PARENT & CONSOLIDATED FOR THE SIX MONTHS ENDED 31 DECEMBER 2013
STATEMENT OF CHANGES IN EQUITY - PARENT & CONSOLIDATED FOR THE SIX MONTHS ENDED 31 DECEMBER 2013
31-Dec-13 31-Dec-12 30-Jun-14 30-Jun-13
Note 6 Months Unaudited
6 Months Unaudited
12 Months SOI
12 Months Audited
EQUITY AT THE BEGINNING OF THE YEAR 35,475,288 35,176,500 35,517,835 35,176,500
Total comprehensive (loss) income 306,171 213,741 609,500 491,883
Distribution to shareholders during the year (196,753) (193,095) (213,802) (193,095)
EQUITY AT THE END OF THE YEAR 35,584,707 35,197,143 35,913,533 35,475,288
The accompanying accounting policies and notes form part of and are to be read in conjunction with these financial statements

010
STATEMENT OF FINANCIAL POSITION - PARENT & CONSOLIDATED AS AT 31 DECEMBER 2013
31-Dec-13 31-Dec-12 30-Jun-14 30-Jun-13
Note 6 Months Unaudited
6 Months Unaudited
12 Months SOI
12 Months Audited
CURRENT ASSETS
Cash and Cash Equivalents 9 302,136 330,591 289,259 344,304
Trade Accounts Receivable 10 404,721 369,140 300,762 332,516
Inventory 11 133 2,066
Sundry Receivables and Prepayments 91,510 94,834 15,677 11,431
Tax Receivable
TOTAL CURRENT ASSETS 798,500 796,631 605,697 688,251
Less: CURRENT LIABILITIES
Income in Advance 105,745 95,987 90,000 79,380
Trade Accounts Payable 12 770,105 101,086 120,000 172,265
Other Creditors 17,212 70,727 150,000 70,892
Employee Benefit Liabilities 13 39,056 4,973 60,000 36,035
Tax Payable 27,255 19,479 86,054 17,362
Current Portion of Borrowings 14 700,000
TOTAL CURRENT LIABILITIES 959,373 992,252 506,054 375,934
WORKING CAPITAL (160,873) (195,621) 99,643 312,317
Add: NON CURRENT ASSETS
Property, Plant & Equipment 15 43,321,697 42,844,508 44,565,633 43,039,088
Less: NON CURRENT LIABILITIES
Deferred Tax Liability 16 2,876,117 2,751,744 2,751,744 2,876,117
Borrowings 14 4,700,000 4,700,000 6,000,000 5,000,000
TOTAL NON CURRENT LIABILITIES 7,576,117 7,451,744 8,751,744 7,876,117
NET ASSETS 35,584,707 35,197,143 35,913,533 35,475,288
Represented by:
SHAREHOLDERS' EQUITY
Paid in Capital 9,380,400 9,380,400 9,380,400 9,380,400
Retained Earnings 16,071,093 15,683,529 16,399,919 15,961,674
Asset Revaluation Reserve 10,133,214 10,133,214 10,133,214 10,133,214
TOTAL SHAREHOLDERS' EQUITY 35,584,707 35,197,143 35,913,533 35,475,288
The accompanying accounting policies and notes form part of and are to be read in conjunction with these financial statements
Derek Walker Gerard GillespieChairman DirectorDate: 20 February 2014
For and on behalf of the Board
Date: 20 February 2014

011
CASH FLOW STATEMENT - PARENT & CONSOLIDATED FOR THE SIX MONTHS ENDED 31 DECEMBER 2013
31-Dec-13 31-Dec-12 30-Jun-14 30-Jun-13
Note 6 Months Unaudited
6 Months Unaudited
12 Months SOI
12 Months Audited
CASH FLOWS FROM OPERATING ACTIVITIES
Cash was provided from:
Receipts from Customers 2,465,231 2,275,498 4,690,518 4,345,606
Interest Received 2,654 969 9,000 5,715
Tax Refund 201,579
2,467,885 2,276,467 4,699,518 4,552,900
Cash was disbursed to:
Payment to Suppliers and Employees 1,443,620 1,805,066 2,646,109 2,731,547
Net GST Movement 131,773
Payment of Income Tax 45,000 120,000 218,000 200,000
Interest Payments 189,364 209,122 411,585 408,709
1,677,984 2,134,188 3,275,694 3,472,029
Net Cash Flows from Operating Activities 17 789,901 142,279 1,423,824 1,080,871
CASH FLOWS FROM INVESTING ACTIVITIES
Cash was provided from:
Sale of Fixed Assets
Cash was applied to:
Purchase of Fixed Assets 335,316 125,489 1,667,290 650,368
Net Cash Flow from Investing Activities (335,316) (125,489) (1,667,290) (650,368)
CASH FLOW FROM FINANCING ACTIVITIES
Cash was provided from:
Borrowing 4,700,000 500,000 300,000
Cash was applied to:
Repayment of Borrowings 300,000 4,700,000 200,000 700,000
Payment of Dividends 196,753 193,095 213,802 193,095
Net Cash from Financing Activities (496,753) (193,095) 86,198 (593,095)
Net Increase/(Decrease) in Cash, Cash Equivalents and Bank Overdrafts
(42,168) (176,305) (157,268) (162,592)
Cash, Cash Equivalents and Bank Overdrafts at the beginning of the year
344,304 506,896 446,527 506,896
Cash, Cash Equivalents and Bank Overdrafts at the end of the year 9 302,136 330,591 289,259 344,304
Made up of:
Cash and Bank Balance 302,136 330,591 289,259 344,304
CLOSING CASH BALANCE 302,136 330,591 289,259 344,304
The accompanying accounting policies and notes form part of and are to be read in conjunction with these financial statements

1 2
CONSOLIDATED STATEMENT OF COMMITMENTS FOR THE SIX MONTHS ENDED 31 DECEMBER 2013
NON-CANCELLABLE COMMITMENTS - OPERATING LEASE COMMITMENTS
Not more than one year 18,306.00
One to two years 10,558.00
Two to five years 6,736.00
Over five years
35,600.0018

1 3
1. REPORTING ENTITY
Palmerston North Airport Limited is a New Zealand company registered under the Companies Act 1993.
The Company and its wholly owned subsidiary (FreightGate Limited) comprise the Palmerston North Airport Limited reporting entity.
The financial statements of Palmerston North Airport Limited are reported as parent and consolidated due to FreightGate Limited being a non-trading company during the six months to 31 December 2013.
2. BASIS OF PREPARATION
Statement of compliance The financial statements of Palmerston North Airport Limited have been prepared in accordance with the requirements of the Airport Authorities Act 1966, Airport Authorities Amendment Act 2000, the Local Government Act 2002, Airport Authorities (Airport Companies Information Disclosure) Regulations 1999 the Companies Act 1993, and the Financial Reporting Act 1993. The financial statements have been prepared in accordance with NZ GAAP. They comply with NZIFRS and other applicable Financial Reporting Standards as appropriate for public benefit entities.
Measurement base The financial statements have been prepared on a historical cost basis except where modified by the revaluation of land and buildings.
Functional and presentation currency The financial statements are presented in New Zealand dollars and all values are rounded to the nearest dollar. The functional currency of the company is New Zealand Dollars.
3. ACCOUNTING POLICIES
Changes in accounting policies There were no changes to accounting policies during the period being reported.
Specific accounting policies The accounting policies as published in the Annual Report to 30 June 2013 have been applied constantly to all periods presented in these financial statements.
FOR THE SIX MONTHS ENDED 31 DECEMBER 2013
N O T E S T O T H E F I N A N C I A L S T A T E M E N T S

1 4
4. ANALYSIS OF OPERATING REVENUE
31-Dec-13 31-Dec-12 30-Jun-14 30-Jun-13
6 Months Unaudited
6 Months Unaudited
12 Months SOI
12 Months Audited
Landing, departure & facility fees 1,359,358 1,291,066 2,567,629 2,508,860
Car park, rent and advertising 1,058,044 982,572 2,064,308 1,968,249
Other 89,691 58,774 65,063 106,976
Interest 2,654 968 9,000 5,715
2,509,747 2,333,380 4,706,000 4,589,800
5. OTHER OPERATING EXPENSES
Rates 181,062 154,513 318,000 337,402
Power and Insurance 164,319 143,886 282,505 288,614
Repairs and maintenance 230,299 347,031 403,495 554,890
575,680 645,430 1,004,000 1,180,906
6. EMPLOYEE EXPENSES
Salaries and wages 386,299 419,806 830,000 688,195
Employer Contribution to Kiwi Saver 9,432
Movement in employee entitlements (39,056) (35,298) (4,747) 3,022
347,243 384,508 825,253 700,649
7. FINANCE COST
Interest on term loans 187,328 209,122 411,500 408,709
Interest on overdraft
187,328 209,122 411,500 408,709
8. TAXATION
Current year tax payable 135,636 83,122 236,500 179,112
Prior year adjustments (86,450)
Movement in deferred tax 124,373
Total 135,636 83,122 236,500 217,035
Tax payable is exclusive of any tax–loss offset with Palmerston North City Council.
1 5
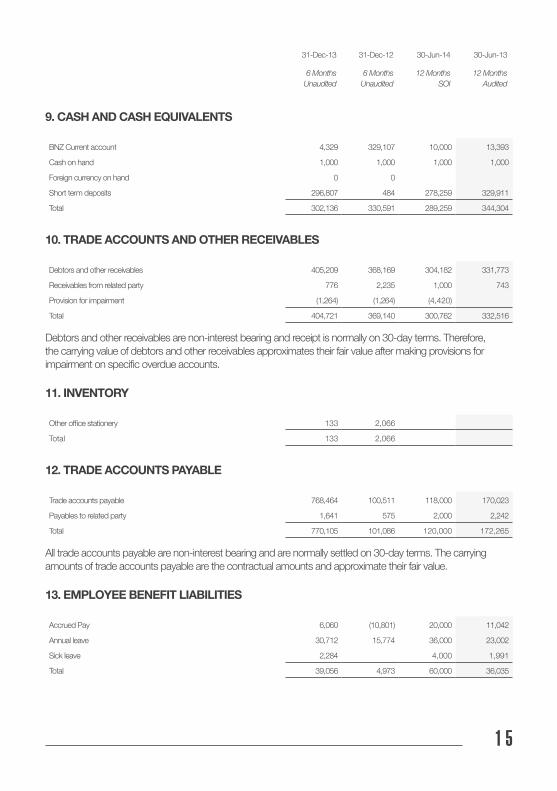
9. CASH AND CASH EQUIVALENTS
31-Dec-13 31-Dec-12 30-Jun-14 30-Jun-13
6 Months Unaudited
6 Months Unaudited
12 Months SOI
12 Months Audited
BNZ Current account 4,329 329,107 10,000 13,393
Cash on hand 1,000 1,000 1,000 1,000
Foreign currency on hand 0 0
Short term deposits 296,807 484 278,259 329,911
Total 302,136 330,591 289,259 344,304
10. TRADE ACCOUNTS AND OTHER RECEIVABLES
Debtors and other receivables 405,209 368,169 304,182 331,773
Receivables from related party 776 2,235 1,000 743
Provision for impairment (1,264) (1,264) (4,420)
Total 404,721 369,140 300,762 332,516
Debtors and other receivables are non-interest bearing and receipt is normally on 30-day terms. Therefore, the carrying value of debtors and other receivables approximates their fair value after making provisions for impairment on specific overdue accounts.
13. EMPLOYEE BENEFIT LIABILITIES
Accrued Pay 6,060 (10,801) 20,000 11,042
Annual leave 30,712 15,774 36,000 23,002
Sick leave 2,284 4,000 1,991
Total 39,056 4,973 60,000 36,035
11. INVENTORY
Other office stationery 133 2,066
Total 133 2,066
12. TRADE ACCOUNTS PAYABLE
Trade accounts payable 768,464 100,511 118,000 170,023
Payables to related party 1,641 575 2,000 2,242
Total 770,105 101,086 120,000 172,265
All trade accounts payable are non-interest bearing and are normally settled on 30-day terms. The carrying amounts of trade accounts payable are the contractual amounts and approximate their fair value.

1 6
14. BORROWINGS
31-Dec-13 31-Dec-12 30-Jun-14 30-Jun-13
6 Months Unaudited
6 Months Unaudited
12 Months SOI
12 Months Audited
Borrowings 4,700,000 4,700,000 6,000,000 5,000,000
Current portion of borrowings 700,000
Total 4,700,000 5,400,000 6,000,000 5,000,000
15. PROPERTY, PLANT AND EQUIPMENT
30-Jun-13 31-Dec-13
Carrying Amount
Additions Disposals Depreciation Carrying Amount
Land 21,351,000 21,351,000
Buildings 10,977,012 40,699 115,606 10,902,105
Infrastructure 9,738,925 592,482 17,946 174,871 10,138,590
Plant & Equipment 664,768 9,999 26,812 647,955
Furniture & Fittings 257,920 1,291 19,496 239,715
Computer Equipment 25,022 1,720 5,421 21,321
Motor Vehicles
Intangibles 23,777 2,765 21,012
43,038,424 646,191 17,946 344,972 43,321,697
A registered first debenture and mortgage secure the $4.7 million borrowings from Bank of New Zealand over assets and property of the Company.
The carrying value of borrowings is materially consistent with their fair value.
16. DEFERRED TAX ASSETS/(LIABILITIES)
Property, plant and equipment
Employee entitlements
Other provisions
Total
Balance at 30 June 2013 2,885,746 (9,629) 2,876,117
Change to profit and loss
Balance at 31 December 2013 2,885,746 (9,629) 2,876,117
1 7
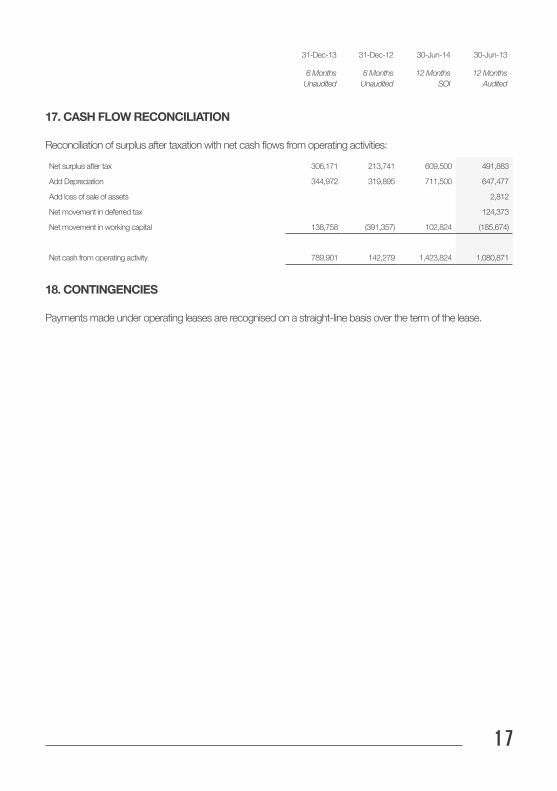
17. CASH FLOW RECONCILIATION
31-Dec-13 31-Dec-12 30-Jun-14 30-Jun-13
6 Months Unaudited
6 Months Unaudited
12 Months SOI
12 Months Audited
Net surplus after tax 306,171 213,741 609,500 491,883
Add Depreciation 344,972 319,895 711,500 647,477
Add loss of sale of assets 2,812
Net movement in deferred tax 124,373
Net movement in working capital 138,758 (391,357) 102,824 (185,674)
Net cash from operating activity 789,901 142,279 1,423,824 1,080,871
Reconciliation of surplus after taxation with net cash flows from operating activities:
18. CONTINGENCIES
Payments made under operating leases are recognised on a straight-line basis over the term of the lease.

1 8

PALMERSTON NORTH AIRPORT 2013 INTERIM REPORT 19

PALMERSTON NORTH AIRPORT 2013 INTERIM REPORT 20
P N A I R P O R T. C O . N ZF B . C O M / P N A I R P O R T