interim report and accounts - banco popular e contas/rc-2016...interim report and accounts half year...
TRANSCRIPT

Banco Popular Portugal, S.A.
Interim Report and Accounts
(Amended)
Half Year
2016

1
Interim Report and Accounts
Half Year 2016
This is a mere translation of the original Portuguese documents prepared by Banco Popular Portugal,
S.A., which was made with the single purpose of simplifying their consultation to English speaking
stakeholders. In case of any doubt or contradiction between these and the original documents, their
Portuguese version prevails.
Interim Report republished with supplementary information and revised comparative data to fully
comply with IAS 34.

2
Interim Report and Accounts
Half Year 2016
Table of Contents Page
General Information ................................................................................................................ 3
Board and Management ......................................................................................................... 4
Banco Popular Portugal Financial Highlights .......................................................................... 5
Interim Management Report ................................................................................................... 6
Macroeconomic scenario ........................................................................................................ 7
Commercial strategy ........................................................................................................... 8
Income and profitability...................................................................................................... 10
Net interest income ........................................................................................................ 10
Banking income ............................................................................................................. 13
Operating income ........................................................................................................... 14
Net Income..................................................................................................................... 15
Investments and assets ..................................................................................................... 16
Total assets .................................................................................................................... 16
Customer funds .............................................................................................................. 16
Lending operations ......................................................................................................... 18
Main risks and uncertainties .............................................................................................. 19
Attachment 1 - Shareholding position of the members of the governing and supervisory
bodies ............................................................................................................................... 22
Attachment 2 - Qualifying holdings .................................................................................... 22
Declaration on the financial information reported .................................................................. 23
Declaration of compliance of the financial information .......................................................... 24
Half-Year Accounts ............................................................................................................... 25
Balance Sheet ................................................................................................................... 25
Income Statement ............................................................................................................. 27
Individual Statement of Changes in Equity ........................................................................ 30
Cash Flow Statement ........................................................................................................ 31
Notes to the Financial Statements ..................................................................................... 32

3
Interim Report and Accounts
Half Year 2016
General Information
Banco Popular Portugal, S.A., was founded on 2 July 1991. The head office is located at 51
Ramalho Ortigão in Lisbon. It is registered at the Lisbon Commercial Registry under the
taxpayer No. 502.607.084. The Bank adopted its current corporate name in September 2005
to the detriment of its former name 'BNC-Banco Nacional de Crédito, S.A.'. Banco Popular
Portugal is a member of the Deposit Guarantee Fund and its current share capital is 513
million euros.
The financial and statistical data provided herein were prepared according to analytical
criteria based on the utmost objectivity, detail, reporting transparency and consistency over
time, from the financial information periodically sent to the Bank of Portugal. The financial
statements are presented in accordance with the legislation in force in 2016, particularly
those issued by the Bank of Portugal regarding the presentation of accounting information.
The current interim financial information was not audited or officially reviewed.
The interim management report, the half-year accounts, and accompanying documents are
available at Banco Popular Portugal’s Internet website: www.bancopopular.pt.

4
Interim Report and Accounts
Half Year 2016
Board and Management
Board of the General Meeting
Augusto Fernando Correia Aguiar-Branco - Chairman
João Carlos de Albuquerque de Moura Navega - Secretary
Board of Directors
Carlos Manuel Sobral Cid da Costa Álvares - Chairman
Pedro Miguel da Gama Cunha - Member
Tomás Pereira Pena - Member
Susana de Medrano Boix - Member
Supervisory Board
Rui Manuel Ferreira de Oliveira - Chairman
António Luis Castanheira da Silva Lopes
António Manuel Mendes Barreira
Rui Manuel Medina da Silva Duarte - Alternate
Statutory Auditor
PricewaterhouseCoopers & Associados, Sociedade de Revisores Oficiais de Contas, Lda.,
represented by António Alberto Henriques Assis or José Manuel Henriques Bernardo
Alternate Statutory Auditor
Jorge Manuel Santos Costa, Statutory Auditor (No. 847)

5
Interim Report and Accounts
Half Year 2016
Banco Popular Portugal Financial Highlights (million euros, unless otherwise stated)

6
Interim Report and Accounts
Half Year 2016
Interim Management Report
As at 30 June 2016, Banco Popular Portugal, S.A., reported shareholders' equity of 772,189
thousand euros on an individual basis (773,307 thousand euros on a consolidated basis after
the integration of Popular Factoring, S.A.) - including the capital increase of 37 million euros
to 513 million euros - managed over 10.5 billion euros of total assets, including customer
funds in the amount of 5.7 billion euros. At the end of the first half of 2016, Banco Popular's
net assets exceeded 9.5 billion euros both on an individual and on a consolidated basis. In
this period, net profit on an individual basis amounted to 9.8 million euros and on a
consolidated basis it exceeded 10.9 million euros.
The bank's activity was supported by a network of 165 branches and a team of 1,159 staff.
Banco Popular Portugal (Bank) offers a full range of products and services, together with the
following companies that are also related with Banco Popular Español (BPE), the group to
which it belongs:
- Popular Gestão de Activos, S.A., wholly owned by BPE, is a Fund Management Company
that manages, among others, the securities and real estate investment funds commercialised
by Banco Popular Portugal;
- Eurovida - Companhia de Seguros de Vida, S.A., is an insurance company that provides life
and capitalisation insurance, and is 84.1% held by BPE and 15.9% held by Banco Popular
Portugal;
- Popular Seguros - Companhia de Seguros, S.A., is wholly owned by Eurovida, and trades
in non-life insurance products.
- Popular Factoring S.A. – On 31 December 2015, Popular Factoring, S.A., handed the Bank
of Portugal a merger project with Banco Popular Portugal, S.A. The planned acquisition of the
Qualifying Holding, owned by Banco Popular Español, S.A. (sole shareholder of Banco
Popular Portugal, S.A.), took place in April 2016, following the approval of the Bank of
Portugal, by means of a share capital increase of Banco Popular Portugal, S.A., fully
subscribed by its sole shareholder, Banco Popular Español, S.A., through contributions in
kind substantiated by the Qualifying Holding.
As at 30 June 2016, the Bank fully owned Popular Factoring, S.A., after acquiring the
qualifying holding from Banco Popular Español, S.A., (which amounted to 99.83%) and
compulsorily purchasing the remaining shares.
Popular Factoring, S.A. (henceforth 'consolidated company') is presented in the Bank's
consolidated accounts under the full consolidation method.

7
Interim Report and Accounts
Half Year 2016
Macroeconomic scenario
According to Statistics Portugal, gross domestic product (GDP) grew by 0.9% between
January and March 2016, when compared with the same period last year. This year-on-year
growth was lower than in the previous quarter (1.3% growth) due to a slowdown in exports of
goods and services and a lower contribution of domestic demand via the slowdown in
investment. Net external demand contributed negatively to the year-on-year GDP change,
which was coupled with a deceleration of imports of goods and services that together
contributed to reduce the openness of the economy.
The several components of domestic demand behaved differently. Private consumption
increased by 2.9% year on year mostly due to the purchase of durable goods. It was also
boosted by the increase of disposable income and the demand of consumer loans, thus
favourably contributing to the total amount. Conversely, regarding the investment component
(-0.6% year on year) there was a decrease in gross fixed capital formation (GFCF) by -2.2%
mostly associated with the construction sector but also extended to machinery, equipment,
and transports.
The year-on-year growth trend of exports slowed down in the first quarter of 2016 (2.2% after
2.8% in the previous quarter), reflecting the deceleration of both exports of goods and
services. Tourism was the exception since it increased substantially in the first quarter.
In the first quarter of 2016, the year-on-year growth trend of imports, mostly of goods,
decelerated (4.6% compared with 5.3% in the same period last year).
Regarding the unemployment rate, according to Statistics Portugal it eased off to 12.4% in
March 2016, with a downward trend both when compared with the same period last year and
on a monthly basis. Inflation levels remained low with a year-on-year change in the
harmonized index of consumer prices by 0.4% at the end of the first quarter of 2016.
Portuguese GDP growth in the first quarter was lower than that of the Euro Zone, whose
economy grew by 1.7% when compared with the same period last year. However, in the
previous quarters and over the year, the recovery rhythm of the economic activity has been
similar to the Euro Zone average.
The projections of the Bank of Portugal point to a continuous gradual economic recovery
process throughout the year. After a 1.5% GDP growth in 2015, a slight deceleration to 1.3%
is expected in 2016, followed by 1.6% and 1.5% increases (revised downwards) for 2017 and
8
Interim Report and Accounts
Half Year 2016
2018 respectively. Exports and investment are expected to post more robust growth in the
years after 2016, given that both domestic demand and private and public consumption will
have a slower rhythm when compared with 2016, which is compatible with the deleveraging
of both private economic agents and the State. The prevalence of historically low interest
rates and the monetary policy in terms of the Euro Zone, together with the existence of
positive domestic primary balances, the need to achieve the goals defined for public finances,
and lastly the growth of international trade and of the main economies whose demand is
targeted at the Portuguese economy will be important factors for the confirmation of these
projections and the recovery.
The projected growth for the Portuguese economy is, however, compatible with a progressive
reduction in the unemployment rate and the inflation rate is expected to have an upward
trend until 2018.
Commercial strategy
In the first half of 2016, Banco Popular strengthened its strategic positioning in the corporate
segment, which resulted in an increased market share. This growth in the corporate market
was coupled with the strengthening of the Bank's positioning regarding private customers,
with the development of several initiatives and solutions that have contributed to approximate
the Bank and its customers.
Regarding the private customer segment, there was an increase of around 12.8 thousand
new customers in the first half of 2016. This growth, in line with 2015, has mostly resulted
from the excellent response of the market to the Bank's offer in terms of residential mortgage
loans, as well as the member-get-member strategy or via corporate customers.
In the scope of partnerships, we would like to highlight the launch of a new car loan together
with Cofidis, the agreement signed with Remax/Melon named 'Casa de Sonho' (Dream
House), and the agreement signed with DECO that offers an exclusive residential mortgage
loan to DECO members (Banco Popular's home loan was considered the right choice for
consumers by DECO). By promoting several initiatives, we have also strengthened our
relationship with Médis and TAP, namely through the Victoria loyalty programme.
In the Corporate segment, the market further recognized Banco Popular has a SME-targeted
bank, which allowed the Bank to raise 4.1 thousand new customers. In spite of the fierce
competition and the still slight recovery of the national economy, Banco Popular has
managed to increase the volume of loans granted, with a corresponding increase in terms of
market share and customer loyalty.
Customer care, operational swiftness, and diversified offer are still key factors for the high
satisfaction levels that Corporate customers feel towards Banco Popular. Banco Popular's
strategy will maintain the transversal support to every sector in the economy and thus will

9
Interim Report and Accounts
Half Year 2016
keep on providing almost every financing arrangement that a company or a sole trader may
need in their activity. Accordingly, credit growth exceeded 336.5 million euros in the first half
of 2016.
Aware of the need to provide our customers with the best solutions and the best possible
experience, we have implemented several improvements in the digital channels, which
guarantee better usability, greater offer, and more information, always with added security.
Also concerning digital channels, we would like to highlight Banco Popular's App, which is
increasingly being downloaded (both iOS and Android versions), and on which Banco
Popular has been focusing its attention, not only by including more and more useful
information, but also continuously improving its functionalities.
In terms of Brand and Communication, Banco Popular has maintained the strategy initiated in
2015 based on an always on approach and an integrated 360º campaign, trying to be present
in the main media and conveying values that characterize its relationship with its customers:
Proximity, Flexibility, and Swiftness.
However, a vital aspect continues to be carrying out several sectoral communication
initiatives, focusing on important topics in the areas of Tourism, Agriculture, and Industry,
trying to obtain from some of the main business people that operate in these sectors answers
or solutions to the many challenges that our economy faces.
The proximity to the corporate world and its customers has led Banco Popular to maintain its
marketing strategy, participating in important national trade fairs and conferences, and to
sponsor various programmes, sharing its market experience as an Iberian Bank that already
counts on 90 years in the market.

10
Interim Report and Accounts
Half Year 2016
Income and profitability
The income statement is summarised in Table 1 with reference to the first half of 2016 and
the same period in 2015, pursuant to regulations issued by the Bank of Portugal, namely as
regards the international accounting standards, including the restatement of 2015 individual
accounts. Table 1a also shows the consolidated income statement for the first half of 2016
resulting from the full acquisition of Popular Factoring, S.A., after having handed the merger
project to the Bank of Portugal at the end of 2015 with a view to integrate the factoring activity
in the Bank.
Net interest income
In the first half of 2016, net interest income without loan fees and commissions stood at 58.7
million euros, 1,744 thousand euros less, or -2.9%, when compared with the same period in
2015. This result was derived mostly from a drop by over 11% in interest and similar income
and the decrease by over 22% in interest and similar charges. The Bank maintained its policy
of reducing the cost of its liabilities initiated in prior years, which resulted in savings of 10.2
million euros in interest and similar charges. This decrease was divided into around 10.4
million euros due to the favourable price effect and around 0.2 million euros due to
unfavourable volume and maturity effects.

11
Interim Report and Accounts
Half Year 2016
As far as total investment is concerned, there was a decrease by almost 12 million euros in
terms of interest and similar income, more than 10.2 million of which due to loans granted
and 2.6 million due to the decrease in the financial asset portfolio.
The volume and maturity effects of investments contributed positively with around 5.4 million
euros to net interest income, which was however insufficient to offset the strong unfavourable
price effect in the amount of 17.4 million euros, of which 16.7 million euros are due to loans
granted (see Table 2).
The necessary combination of the two components of net interest income confirms however
the careful management of interest rates in a historically unfavourable scenario.
Table 1 – Annual changes in net interest income
Regarding average balances and rates, and according to Table 3, average assets at the end
of the first half of 2016 were supported by customer funds (around 55%) and deposits from
banks (around 34%). Loans and advances to customers is still the main component of
assets, representing around 71% of total average assets. In the first half of 2016, compared
with the same period last year, there was an important and balanced increase, on average,
both of loans granted and of customer funds by around 445 million euros.
Evolution of equity and average
annual

12
Interim Report and Accounts
Half Year 2016
rates
Taking into consideration the evolution of the average interest rates of loans and deposits, we
would like to stress that average assets stood at 8.7 Billion euros, with an overall profitability
of 2.19%, which, when compared with the average cost of total resources allocated to the
financing of assets (0.83%), has enabled an annual net interest income of 1.36%. However,
we have to highlight the decrease by 13 basis points in net interest income when compared
with the same period last year.
The policy of reducing the cost of liabilities, already implemented since mid-2014, has led this
past year to a 51 basis points reduction in the annual average rate of customer funds, which
stood at 0.89% at the end of the first half of the year, which compares with 1.40% in the same
period last year (Table 3a). On the other hand, the average annual rate of loans granted
dropped by 54 basis points, from 2.90% to 2.36%. Due to this combined effect, customer
spread decreased by 3 basis points to 1.47%.
Table 3a – Evolution of average annual rates

13
Interim Report and Accounts
Half Year 2016
Individual net interest income stood at 66.5 million euros at the end of the first half of 2016,
which represents a -1.6% change when compared with the same period last year, i.e., around
1 million euros less. This rate of change was less negative due to the year-on-year increase
by around 695 thousand euros in fees and commissions associated with the loans granted.
On a consolidated basis, we would like to highlight the positive effect the merger with Popular
Factoring had on net interest income by around 2,908 thousand euros, which allowed the
consolidated net interest income to stand at 69.4 million euros at the end of the first half of
2016.
Banking income
In 2016, net fees and commissions charged to customers for the sale of products and
services totalled 18.5 million euros, which corresponds to an increase by 3% when compared
with the same period last year, i.e. around 531 thousand euros.
Complementing that information, Table 4 shows the main items that have contributed to the
change in net fees and commissions in the past year. We would like to highlight the positive
contribution of fees and commissions related with insurance brokerage (+53.3%), structuring
financial operations (+34.5%), account management (+13.6%), and other net fees and
commissions (+39.1%). The negative performance of some items, namely the decrease by
4.3% in fees related with collection and payment handling, -7.9% in terms of asset
management fees, and -33.4% in fees related with guarantees and sureties, has contributed
to weaken overall growth.
Regarding the remaining items of the banking product, we would like to highlight the
significant increase by almost 18 million euros in terms of financial transactions, due to the
timely sale of some financial assets in the portfolio with a view to realize gains in a market
context of relevant losses in the profitability levels of certain asset segments.

14
Interim Report and Accounts
Half Year 2016
The item Other operating results had a negative performance of over 54 million euros, which
is explained by the sale in the first half of 2015 of the business unit in charge of managing
real estate assets, which allowed the Bank to realize capital gains of over 48.6 million euros
at the time. This fact explains the decrease in banking product by over 42.8 million euros (-
32.1%), which stood at around 90.4 million euros at the end of the first half of 2016 on an
individual basis. On a consolidated basis, however, we would like to highlight the increase by
2.2 million euros when compared with individual figures due to the aforementioned merger
with the factoring activity.
Operating income
In the first half of 2016, the Bank maintained the measures that have been implemented in
previous years regarding its cost policy. As at 30 June 2016, operating expenses totalled
52.5 million euros on a consolidated basis and 51.7 million euros on an individual basis,
which represents a decrease by over 4 million euros, i.e., -7,4% when compared with the
same period last year.
From Table 5, we can see that personnel expenses on an individual basis amounted to 24.8
million euros, which corresponds to a decrease by 17.1%, when compared with the same
period last year. This decrease is due to the aforementioned sale of the business unit in
charge of managing real estate assets and credit exposures of customers associated with the
real estate sector.
Administrative overheads totalled around 25.7 million euros on a consolidated basis and 25.5
million euros on an individual basis, which corresponds to a 4.6% increase, or around 1.1
million euros, when compared with the same period last year. Since cost control is visible in
every item, this increase is due only to the costs associated with the management of real
estate assets and credit exposures of costumers associated with the real estate sector that
were not entirely offset by the remaining savings.
In terms of allocations for depreciation of fixed assets we have witnessed a positive
performance (-134 thousand euros, or -9.2%) to around 1.3 million euros.

15
Interim Report and Accounts
Half Year 2016
The weight of personnel expenses in operating costs stood at 48%, which compares with
55% at the end of the first half of 2015. In the first half of 2016, operating income amounted
to 38.8 million euros, i.e. around 49.9% less than in the same period last year. This was
mostly due to the negative performance of other operating results, where, in the first half of
2015, there were capital gains from the sale of the aforementioned business unit (around
48.6 million euros).
Net Income
Net income for the first half of 2016 stood at around 9.8 million euros, which compares with
32 million euros in the same period last year. This unfavourable performance was mostly due
to the item Other operating results, because of the aforementioned capital gains in the first
half of 2015, and occurred in spite of the positive performance of other items, namely fees
and commissions, financial transaction results, personnel costs, and provisions.

16
Interim Report and Accounts
Half Year 2016
Investments and assets
Total assets
As at 30 June 2016, Banco Popular’s net assets amounted to around 9,569 million euros,
1,384 million euros more than in the same period last year, which corresponds to an
increase by 16.9%.
Adjustments made to the size of the financial asset portfolio, the increase of customer loans
and the decrease of funding from central banks as a counterpart of the funding from the
parent company, and the inherent management of resources have contributed to this
evolution.
Banco Popular also manages other customer funds applied in investment, savings and
retirement instruments, which amounted to 934 million euros at the end of the first half of
2016, representing a 4.9% decrease when compared with the same period last year, mostly
due to investment funds.
Therefore, total assets managed by the Bank amounted to 10,503 million euros at the end
of the first half of 2016, which represents a 14.6% increase when compared with the same
period last year.
Customer funds
As at 30 June 2016, the total amount of on- and off-balance sheet customer funds
amounted to 5,757 million euros, 11.6% more when compared with the previous year.
Table 6 shows the performance of total customer funds in the first halves of 2016 and 2015.
On-balance sheet funds, mostly via deposits from customers, totalled approximately 4,823
million euros, which corresponds to an increase by 15.5% when compared with the same
period last year, i.e. an overall growth that exceeded 646 million euros both in terms of
demand accounts and time deposits.
Demand accounts posted significant growth of over 406 million euros, or almost 40%, rising
from 1,028 million euros to 1,434 million euros, while time deposits grew by 8%, i.e., around
250 million euros.

17
Interim Report and Accounts
Half Year 2016
Off-balance sheet funds - which include investment fund applications, retirement plans,
funds raised through investment insurance products, and assets managed through private
banking - decreased by 4.9%, dropping from around 982 million euros at the end of the first
half of 2015 to around 934 million euros as at 30 June 2016. The performance of this
component was due to a decrease in investment and capitalization insurance and
investment funds by over 63 million euros since portfolio management grew by 10.3%.
As at 30 June 2016, Banco Popular Portugal was the depositary of 12 investment funds
managed by Popular Gestão de Activos, whose total portfolio amounted then to over 197
million euros. Table 7 shows the assets contained in each of the investment funds
managed with reference to the end of the first halves of 2016 and 2015.
18
Interim Report and Accounts
Half Year 2016
Banco Popular Portugal also sells Eurovida’s retirement plans and investment insurance,
holding an equity stake of 15.9% in that company.
Lending operations
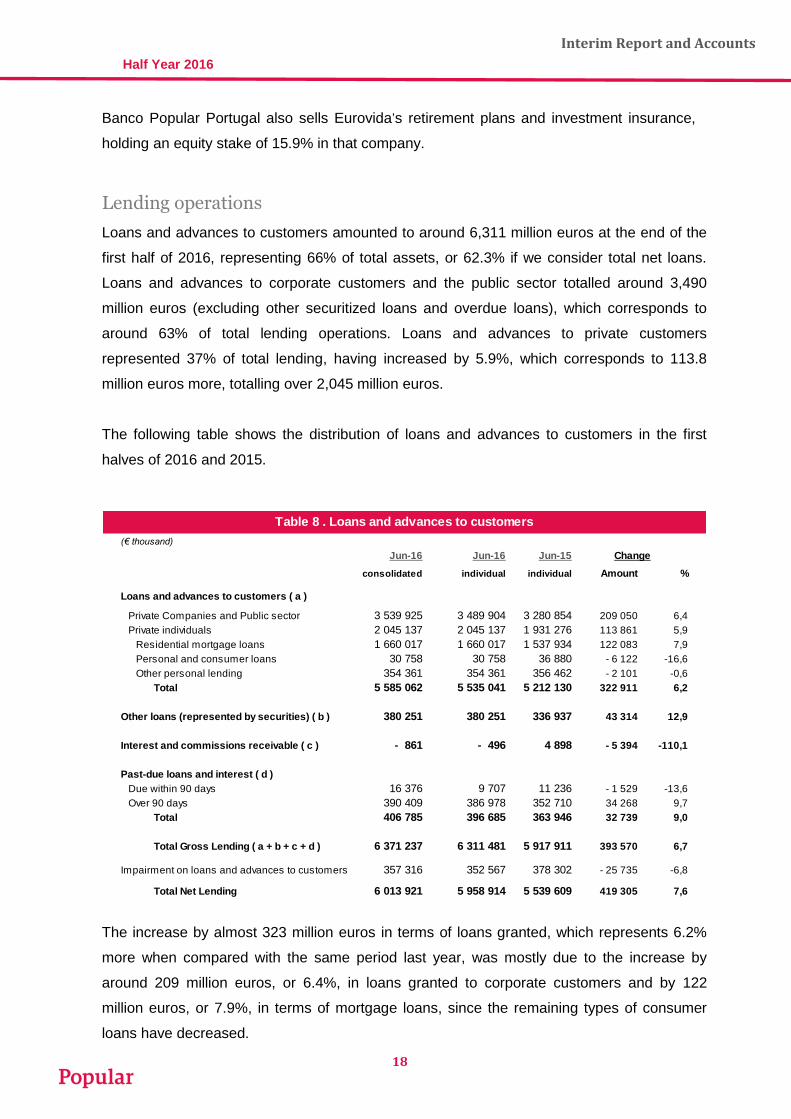
Loans and advances to customers amounted to around 6,311 million euros at the end of the
first half of 2016, representing 66% of total assets, or 62.3% if we consider total net loans.
Loans and advances to corporate customers and the public sector totalled around 3,490
million euros (excluding other securitized loans and overdue loans), which corresponds to
around 63% of total lending operations. Loans and advances to private customers
represented 37% of total lending, having increased by 5.9%, which corresponds to 113.8
million euros more, totalling over 2,045 million euros.
The following table shows the distribution of loans and advances to customers in the first
halves of 2016 and 2015.
Table
2
(€ thousand)
Jun-16 Jun-16 Jun-15
consolidated individual individual Amount %
Loans and advances to customers ( a )
Private Companies and Public sector 3 539 925 3 489 904 3 280 854 209 050 6,4
Private individuals 2 045 137 2 045 137 1 931 276 113 861 5,9
Residential mortgage loans 1 660 017 1 660 017 1 537 934 122 083 7,9
Personal and consumer loans 30 758 30 758 36 880 - 6 122 -16,6
Other personal lending 354 361 354 361 356 462 - 2 101 -0,6
Total 5 585 062 5 535 041 5 212 130 322 911 6,2
Other loans (represented by securities) ( b ) 380 251 380 251 336 937 43 314 12,9
Interest and commissions receivable ( c ) - 861 - 496 4 898 - 5 394 -110,1
Past-due loans and interest ( d )
Due within 90 days 16 376 9 707 11 236 - 1 529 -13,6
Over 90 days 390 409 386 978 352 710 34 268 9,7
Total 406 785 396 685 363 946 32 739 9,0
Total Gross Lending ( a + b + c + d ) 6 371 237 6 311 481 5 917 911 393 570 6,7
Impairment on loans and advances to customers 357 316 352 567 378 302 - 25 735 -6,8
Total Net Lending 6 013 921 5 958 914 5 539 609 419 305 7,6
Change
Table 8 . Loans and advances to customers
–Lending operations
The increase by almost 323 million euros in terms of loans granted, which represents 6.2%
more when compared with the same period last year, was mostly due to the increase by
around 209 million euros, or 6.4%, in loans granted to corporate customers and by 122
million euros, or 7.9%, in terms of mortgage loans, since the remaining types of consumer
loans have decreased.

19
Interim Report and Accounts
Half Year 2016
The amount of past-due loans totalled around 32.7 million euros, i.e. 9%.
The 419 million euro change in terms of total net loans profited from the decrease in loan
impairment by around 25.7 million euros, thus representing a 7.9% increase when compared
wit the same period last year and exceeding the 6.7% change in terms of gross loans.
On an individual basis, the amount of past-due loans and interest totalled approximately
396.7 million euros at the end of the first half of 2016, 9% or 396.7 million euros more, when
compared with the same period last year. This category of loans represented 6.29% of total
loans. Taking into consideration only loans that have been non-performing for more than 90
days this indicator stood at 6.13%.
Total non-performing loans on an individual basis amounted to over 912 million euros at the
end of the first half of 2016, which represents around 14.45% of total loans and has showed
an improving trend of 9% since the end of the first half of 2015. On a consolidated basis its
weight on total loans decreased to 14.37%.
Table 9 –Past-due loans and non-performing loans
At the end of the first half of 2016, customer loan impairment on an individual basis stood at
352.5 million euros, i.e. 6.8% below figures at the end of June 2015.
Main risks and uncertainties
In the second half of 2016, and in spite of a slight recovery trend of the economic situation of
the country, there are still many challenges ahead and therefore we need to take into
consideration a series of situations that may originate certain risks to the development of
Banco Popular's activity, namely those that may restrain the fulfilment of the goals defined in
the Budget and in the Financing and Capital Plan.
At this point, we would like to identify the main risks that may have an impact on the activity
of the Bank during the second half of 2016 and that may lead future results to be materially
different from those expected, namely:

20
Interim Report and Accounts
Half Year 2016
• In Portugal, and despite some positive signs, there are still some risks and uncertainties
tied with the still frail socio-economical conditions and the uncertain political scenario that is
dependant upon the discussion of the General Government Budget for 2017.
• In Europe, we would like to highlight that the European Central Bank has maintained an
accommodative monetary policy by keeping the reference interest rate at low levels for a long
period of time, and enforced a policy on refinancing lines to support the economy, while
strengthening the construction of the Banking Union in the sense of maintaining financial
stability and trust in the euro and the economies that comprise it.
• Future regulatory developments that may introduce additional challenges for the banking
sector on the short term.
Risks associated with the Bank's activity:
Despite the several control mechanisms and the measures implemented to mitigate them, the
Bank is exposed to specific risks in its activity, namely:
• Credit and Concentration Risk – This is the main risk that the Bank is exposed to; we
cannot exclude the possibility of a decline in the quality of its assets.
• Market Risk – The Bank's trading portfolio is not very significant, thus we do not expect
any relevant impact via this type of risk during the second half of 2016.
• Liquidity Risk – In the past few years, the Bank has significantly reduced its liquidity
dependence on the parent company. However, in a possible crisis scenario, it might be more
difficult to obtain funding via the financial markets; the impossibility of resorting to this
financing source would imply an almost exclusive funding by the parent company.
• Interest Rate Risk – Although not expected, a significant change in interest rates might
have a positive impact on net interest income.
• Exchange Rate Risk - The global currency position tends to be null and therefore any
impact on the Bank’s earnings as a result of fluctuations in exchange rates is immaterial.
• Operational Risk - According to the latest self-assessment exercise regarding operational
risks inherent to each area in the Bank, residual risk is concentrated mostly in a low-risk
category. Quantitatively, losses due to operational risk in the first half of the year compare
very favourably with the same period last year and we expect a similar behaviour in the
second half of the year.
• Reputational and Compliance Risk – These are risks to which the Bank is also exposed,
although the internal governance system has reduced the probability of occurrence of events
with impact on the results.
• Other Risks – The Bank is also exposed to other risks (for example, technological risk,
real estate risk or the risk inherent to the application of its strategy). However, we do not

21
Interim Report and Accounts
Half Year 2016
anticipate that these risks shall have a significant influence on the Bank's activity and its
results during the second half of the year.
Lisbon, 29 July 2016
The Board of Directors

22
Interim Report and Accounts
Half Year 2016
Annex 1 - Shareholding position of the members of the
governing and supervisory bodies
(Article 447 of the Commercial Companies Code - ‘Código das Sociedades Comerciais’)
Nothing to report.
Annex 2 - Qualifying holdings
(Article 448 of the Commercial Companies Code and Article 20 of the Securities Code
‘Código dos Valores Mobiliários’)
Shareholders No. of Shares Shareholding Position Voting Rights
Banco Popular Español, SA 513 000 000 100% 100%

23
Interim Report and Accounts
Half Year 2016
Declaration on the financial information reported
STATEMENT REFERRED TO IN ARTICLE 8(4) OF THE
PORTUGUESE SECURITIES CODE
Pursuant to paragraph 4 of article 8 of the Portuguese Securities Code, Banco Popular
Portugal states that the current interim financial information was not audited or officially
reviewed.
Lisbon, 29 July 2016
BANCO POPULAR PORTUGAL, S.A.

24
Interim Report and Accounts
Half Year 2016
Declaration of compliance of the financial information
STATEMENT REFERRED TO IN ARTICLE 246(1)(c)
OF THE PORTUGUESE SECURITIES CODE
Paragraph (c) of article 246(1) of the Portuguese Securities Code states that each of the
responsible persons shall issue a statement as explained therein.
STATEMENT OF THE BOARD OF DIRECTORS
The members of the Board of Directors of Banco Popular Portugal, S.A., identified below by
name, have individually signed the following statement:
'Pursuant to paragraph (c) of article 246(1) of the Portuguese Securities Code, I declare that,
to the best of my knowledge, the condensed financial statements of Banco Popular Portugal,
S.A. referred to the first half of 2016, were drawn up in accordance with the applicable
accounting standards, providing a true and fair view of the assets and liabilities, the financial
position and the results of that entity and that the interim management report faithfully states
the information required in accordance with article 246(2) of the Portuguese Securities Code.'
Lisbon, 29 July 2016
Board of Directors
Carlos Manuel Sobral Cid da Costa Álvares - Chairman
Pedro Miguel da Gama Cunha - Member
Tomás Pereira Pena - Member
Susana de Medrano Boix - Member

25
Interim Report and Accounts
Half Year 2016
Half-Year Accounts
Balance Sheet
(€ thousand)
A mo unt befo re
N o tes/ pro visio ns, P ro visio ns, 31-12-2015
T ablesimpairment andimpairment and N et amo unt
A nnexes depreciat io n depreciat io n
1 2 3 = 1 - 2
Assets
Cash and balances w ith central banks 17 82 867 82 867 55.505
Deposits w ith banks 18 89 820 89 820 76.428
Financial assets held for trading 19 44 975 44 975 49.893
Available-for-sale f inancial assets 21 1 435 988 1 435 988 1.914.430
Loans and advances to banks 22 1 405 171 1 405 171 606.616
Loans and advances to customers 23 6 311 481 352 567 5 958 914 5.702.487
Hedging derivatives 1.055
Non-current assets held for sale 25 0 0 0 0
Other tangible assets 26 156 791 90 452 66 339 68.498
Intangible assets 27 21 573 20 924 649 146
Investments in subsidiaries, associates and joint ventures 20 and 25 22 579 2 336 20 243 20.243
Deferred income tax assets 28 54 076 0 54 076 59.153
Other assets 29 446 063 35 940 410 123 442.035
Total Assets 10 071 384 502 219 9 569 165 8 996 489
Liabilities
Deposits from central banks 30 0 0 0
Financial liabilities held for trading 19 47 835 47 835 41.452
Deposits from banks 31 3 694 312 3 694 312 2.924.272
Deposits from customers 32 4 822 819 4 822 819 5.034.537
Debt securities issued 33 27 525 27 525 38.092
Hedging derivatives 34 75 761 75 761 121.337
Provisions 35 3 297 3 297 2.860
Current income tax liabilities 15 521 521 6.391
Deferred income tax liabilities 28 14 575 14 575 21.131
Other liabilities 36 110 331 110 331 53.779
Total Liabilities 8 796 976 0 8 796 976 8 243 851
Shareholders' Equity
Shareholders' Equity 39 513 000 513 000 476.000
Share premium 39 10 109 10 109 10.109
Revaluation reserves 40 - 15 030 - 15 030 1.722
Other reserves and retained earnings 41 254 274 254 274 220.787
Income for the period 9 836 9 836 44.020
Total Shareholders' Equity 772 189 0 772 189 752 638
Total Liabilities + Shareholders' Equity 9 569 165 0 9 569 165 8 996 489
0 0
THE CERTIFIED PUBLIC ACCOUNTANT THE BOARD OF DIRECTORS
30-06-2016
Individual Balance Sheet as at 30 June 2016 and 2015

26
Interim Report and Accounts
Half Year 2016

27
Interim Report and Accounts
Half Year 2016
Income Statement
(€ thousand)
N o tes/
T ables 30-06-2016 30-06-2015
A nnexes
Interest and similar income 6 102 515 113 788
Interest and similar charges 6 35 989 46 213
Net interest income 66 526 67 575
Revenue from equity instruments 7 94 63
Fees and Commissions received 8 21 212 21 554
Fees and Commissions paid 8 2 694 3 568
Net gains from assets and liabilities at fair value 0 0
through profit or loss 9 - 23 832 - 81
Net gains from available-for-sale f inancial assets 9 41 788 - 1
Net gains from foreign exchange differences 10 777 887
Income from the sale of other assets 11 - 6 023 42
Other operating income 12 - 7 396 46 804
Banking income 90 452 133 275
Personnel expenses 13 24 835 29 965
Administrative overheads 14 25 535 24 403
Depreciation and amortization 26 and 27 1 322 1 456
Provisions net of recoveries and w rite-offs 35 737 - 838
Adjustments to loans and advances to customers 0 0
(net of reversals and w rite-offs) 23 18 499 27 993
Impairment of other assets net of reversals and recoveries 29 7 686 4 168
Net income before tax 11 838 46 128
Income tax 2 002 14 553
Current tax 15 - 1 383 9 811
Deferred tax 15 3 385 4 742
Net income after tax 9 836 31 575
Of w hich: Net income from discontinued operations 0 0
Net income for the period 9 836 31 575
Earnings per share (euro) 0,02 0,07
476 000 476 000
THE CERTIFIED PUBLIC ACCOUNTANT THE BOARD OF DIRECTORS
Individual Income Statement as at 30 June 2016 and 2015

28
Interim Report and Accounts
Half Year 2016
(€ thousand)
N o tes/
T ables 30-06-2016
A nnexes
Interest and similar income 6 105 423
Interest and similar charges 6 35 989
Net interest income 69 434
Revenue from equity instruments 7 94
Fees and Commissions received 8 20 836
Fees and Commissions paid 8 2 841
Net gains from assets and liabilities at fair value
through profit or loss 9 - 23 831
Net gains from available-for-sale f inancial assets 9 41 788
Net gains from foreign exchange differences 10 778
Income from the sale of other assets 11 - 6 023
Other operating income 12 - 7 525
Banking income 92 710
Personnel expenses 13 25 415
Administrative overheads 14 25 709
Depreciation and amortization 26 e 27 1 335
Provisions net of recoveries and w rite-offs 35 737
Adjustments to loans and advances to customers 0
(net of reversals and w rite-offs) 23 18 489
Impairment of other assets net of reversals and recoveries 29 7 686
Net income before tax 13 339
Income tax 2 385
Current tax 15 - 1 000
Deferred tax 15 3 385
Net income after tax 10 954
Of w hich: Net income from discontinued operations 0
Net income for the period 10 954
Earnings per share (euro) 0,02
476 000
THE CERTIFIED PUBLIC ACCOUNTANT
Consolidated Income Statement as at 30 June 2016
THE BOARD OF DIRECTORS

29
Interim Report and Accounts
Half Year 2016
Statement of Comprehensive Income
Individual Statement of Comprehensive Income
(€ thousand)
30-06-2016 30-06-2015
Net income 9 836 31 575
Other comprehensive income:
Items not reclassified as income
Retirement pensions
Recognition of actuarial gains and losses ( 10 534) ( 11 051)
( 10 534) ( 11 051)
Items reclassified as income
Available-for-sale f inancial assets
Revaluation of available-for-sale f inancial assets ( 21 615) ( 4 722)
Tax burden 4 863 1 051
( 16 752) ( 3 671)
Income not recognised in the income statement ( 27 286) ( 14 722)
Individual comprehensive income ( 17 450) 16 853
THE CERTIFIED PUBLIC ACCOUNTANT THE BOARD OF DIRECTORS
Consolidated Statement of Comprehensive Income
(€ thousand)
30-06-2016
Net income 10 954
Other comprehensive income:
Items not reclassified as income
Retirement pensions
Recognition of actuarial gains and losses ( 10 534)
( 10 534)
Items reclassified as income
Available-for-sale f inancial assets
Revaluation of available-for-sale f inancial assets ( 21 615)
Tax burden 4 863
( 16 752)
Income not recognised in the income statement ( 27 286)
Individual comprehensive income ( 16 332)
THE CERTIFIED PUBLIC ACCOUNTANT THE BOARD OF DIRECTORS
30
Interim Report and Accounts
Half Year 2016
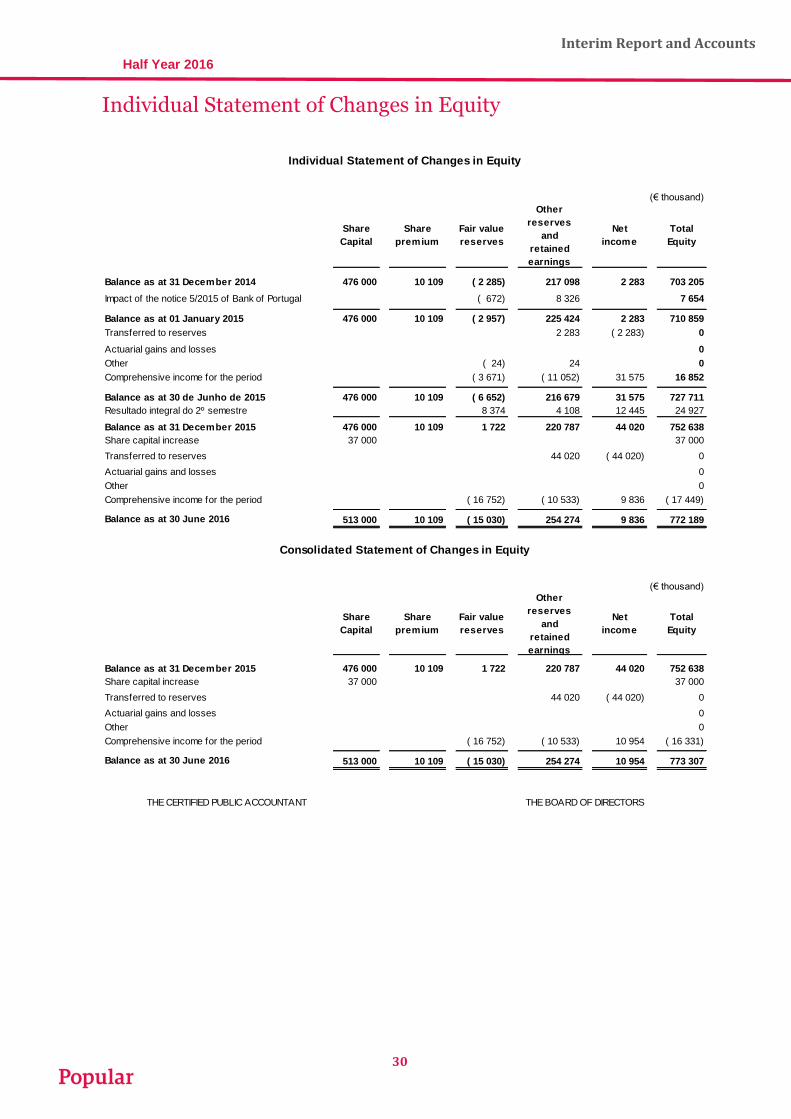
Individual Statement of Changes in Equity
(€ thousand)
Share
Capital
Share
premium
Fair value
reserves
Other
reserves
and
retained
earnings
Net
income
Total
Equity
Balance as at 31 December 2014 476 000 10 109 ( 2 285) 217 098 2 283 703 205
Impact of the notice 5/2015 of Bank of Portugal ( 672) 8 326 7 654
Balance as at 01 January 2015 476 000 10 109 ( 2 957) 225 424 2 283 710 859
Transferred to reserves 2 283 ( 2 283) 0
Actuarial gains and losses 0
Other ( 24) 24 0
Comprehensive income for the period ( 3 671) ( 11 052) 31 575 16 852
Balance as at 30 de Junho de 2015 476 000 10 109 ( 6 652) 216 679 31 575 727 711
Resultado integral do 2º semestre 8 374 4 108 12 445 24 927
Balance as at 31 December 2015 476 000 10 109 1 722 220 787 44 020 752 638
Share capital increase 37 000 37 000
Transferred to reserves 44 020 ( 44 020) 0
Actuarial gains and losses 0
Other 0
Comprehensive income for the period ( 16 752) ( 10 533) 9 836 ( 17 449)
Balance as at 30 June 2016 513 000 10 109 ( 15 030) 254 274 9 836 772 189
Individual Statement of Changes in Equity
(€ thousand)
Share
Capital
Share
premium
Fair value
reserves
Other
reserves
and
retained
earnings
Net
income
Total
Equity
Balance as at 31 December 2015 476 000 10 109 1 722 220 787 44 020 752 638
Share capital increase 37 000 37 000
Transferred to reserves 44 020 ( 44 020) 0
Actuarial gains and losses 0
Other 0
Comprehensive income for the period ( 16 752) ( 10 533) 10 954 ( 16 331)
Balance as at 30 June 2016 513 000 10 109 ( 15 030) 254 274 10 954 773 307
THE CERTIFIED PUBLIC ACCOUNTANT THE BOARD OF DIRECTORS
Consolidated Statement of Changes in Equity
31
Interim Report and Accounts
Half Year 2016
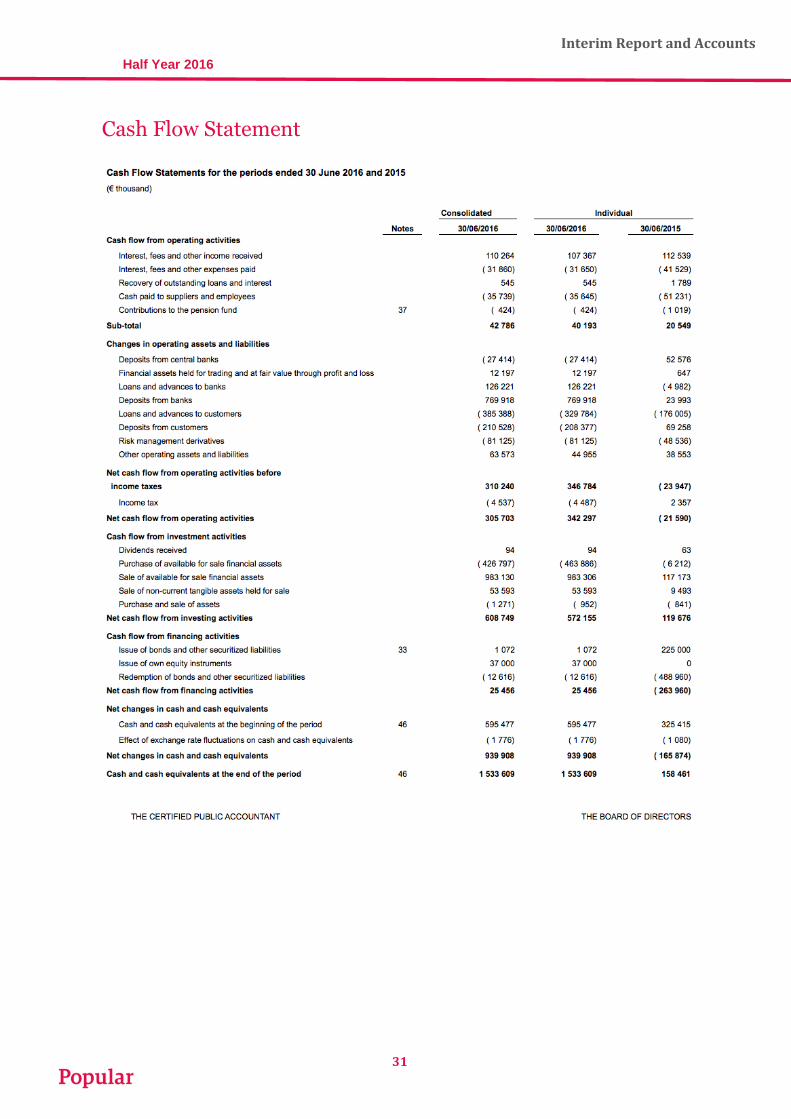
Cash Flow Statement

32
Interim Report and Accounts
Half Year 2016
Notes to the Financial Statements
NOTES TO THE INDIVIDUAL AND CONSOLIDATED FINANCIAL STATEMENTS AS AT 30 June
2016 AND 2015
(€ thousand)
1. INTRODUCTION
1.1 Activity
The Bank - then named BNC-Banco Nacional de Crédito Imobiliário - was founded on 2 July 1991,
following the authorization given by Decree order No. 155/91, of 26 April, issued by the Ministry for
Finances. On 12 September 2005, the name of the Bank was changed to Banco Popular Portugal,
S.A.
The Bank is authorized to operate pursuant to the rules and regulations currently applicable to banks
in Portugal and its corporate purpose is raising funds from third parties in the form of deposits or other,
which it applies, together with its own funds, in granting loans or in other assets, also providing
additional banking services in the country and abroad.
The accounts of the Bank are consolidated at the parent company, Banco Popular Español, S.A.,
(‘BPE’) whose Head Office is located in Madrid, Spain, at 34 Calle Velázquez.
BPE accounts are available at its respective Head Office as well on its webpage
(www.bancopopular.es).
The Bank is not a listed company.
1.2 Bank structure
As a result of the restructuring process initiated in previous years, during 2011, the Bank ceased to
hold any equity stake in any subsidiary and ceased to reclassify 'Class D Notes' issued by Navigator
Mortgage Finance Nº 1 Plc (‘Navigator’) into the available-for-sale asset portfolio.
Based on the assumption that the investment in Navigator and its potential impact on the financial
statements were considered immaterial, and pursuant to IAS 1 revised, the Bank decided not to
prepare consolidated financial statements from 2011 onwards, since that information is not materially
relevant for effects of the presentation of the Bank’s financial information nor does it influence the
decision of the readers of those statements.
As at 30 June 2016 and 2015, the Bank detained only one equity stake in the associated company
Eurovida – Companhia de Seguros de Vida, S.A. (see Notes 20 and 25).
On 31 December 2015, Popular Factoring, S.A., handed the Bank of Portugal a merger project with
Banco Popular Portugal, S.A. The planned acquisition of the Qualifying Holding, owned by Banco
Popular Español, S.A. (sole shareholder of Banco Popular Portugal, S.A.), took place in April 2016,
following the approval of the Bank of Portugal, by means of a share capital increase of Banco Popular

33
Interim Report and Accounts
Half Year 2016
Portugal, S.A., fully subscribed by its sole shareholder, Banco Popular Español, S.A., through
contributions in kind substantiated by the Qualifying Holding.
As at 30 June 2016, the Bank fully owned Popular Factoring, S.A., after acquiring the qualifying holding
from Banco Popular Español, S.A., (which amounted to 99.83%) and compulsorily purchasing the
remaining shares.
Popular Factoring, S.A. (henceforth 'consolidated company') is presented in the Bank's consolidated
accounts under the full consolidation method.
In the first half of 2016, Banco Popular Portugal, S.A., sold its card business, but this operation shall
only come into force on 30 September.
2. Summary of the Main Accounting Principles
The main accounting principles and valuation criteria adopted in the preparation of these financial
statements are stated below. These principles were consistently applied to every year presented,
except when otherwise stated.
2.1 Bases of preparation
Individual financial statements
Pursuant to article 2 of Notice No. 5/2015 issued by the Bank of Portugal on 7 December, starting on 1
January 2016, the entities that are under the supervision of the Bank of Portugal shall prepare their
individual financial statements according to the International Accounting Standards (IAS) as adopted at
each moment by the Regulation of the European Union and respecting the conceptual framework for
the preparation and presentation of financial statements on which those standards are based, as was
formerly required for consolidated financial statements when applicable.
The impact on the individual financial statements of the Bank on 1 January 2016 arising from the
application of the IAS mostly resulted in a decrease in the provisions for customer loans and
guarantees, arising from the recognition of impairment losses according to IAS 39 that replaced the
former framework provided by Notice No. 3/95 issued by the Bank of Portugal and now revoked. This
originated, excluding the associated tax effect, an increase of the share capital by 46 847 thousand
euros.
As a consequence of the same Notice and from the correction of the deferred taxes estimates, the
amounts set out in the 2015 restatement differ from those published in the previous year.
Furthermore, the amount of taxes that result from positive equity changes in consequence of the
revocation of the 3/95 Notice and transition to imparity (according to the 5/95 Notice) were accounted
as current year earnings in the first half of 2016. During this fiscal year these taxes will be reflected as
retained earnings. This impact, materially non-relevant, would have led to a decrease of €1.993
thousands in retained earnings (considering a tax rate – IRC – of 22.5%) and an improvement in
current year earnings of €665 should they had been accounted until June 2016.
34
Interim Report and Accounts
Half Year 2016
Consolidated financial statements
The consolidated financial statements were prepared based on the accounting records of Banco
Popular Portugal, SA and Popular Factoring, SA and were processed according to the Reporting
Standards Financial and International Accounting Standards / International Financial Reporting
Standards (IAS / IFRS) adopted by the European Union as established by Regulation (EC) No
1606/2002 of the European Parliament and of the Council of 19 July, transposed into national law
through the Notice of Banco de Portugal No 1/2005 of 21 February.
2.2 Segmental reporting
As of 1 January 2009, the Bank adopted IFRS 8 – Operating Segments for effects of disclosing
financial information analysed by operating segments (see Note 5).
An operational segment in a business is a group of assets and operations used to provide products or
services, subject to risks and benefits that are different from those seen in other segments.
The Bank determines and presents operational segments based on in-house produced management
information.
2.3 Equity stakes in associated companies
Associated companies are those in which the Bank has, directly or indirectly, a significant influence
over its management and financial policy but does not hold control over the company. It is assumed
that the Bank has a significant influence when it holds the power to control over 20% of the voting
rights of the associate. Even when voting rights are lower than 20%, the Bank may have significant
influence through the participation in management bodies or the composition of the Executive Boards
of Directors.
In the Bank’s individual financial statements, associated companies are booked at historical cost. The
dividends from associated companies are booked in the Bank’s individual income on the date they are
attributed or received.
In case of objective evidence of impairment, the loss by impairment is recognised in the income
statement.
2.4 Foreign currency transactions
a) Functional currency and presentation currency
The financial statements are presented in euros, which is both the functional and presentation
currency of the Bank.
b) Transactions and Balances
Foreign currency transactions are translated into the functional currency using indicative exchange
rates prevailing on the dates of transactions. Gains and losses resulting from the conversion of foreign
currency transactions, deriving from their extinction and conversion into monetary assets and liabilities
in foreign currencies at the exchange rate at the end of each period, are recognised in the income
statement, except when they are part of cash flow hedges or net investment in foreign currency, which
are deferred in equity.

35
Interim Report and Accounts
Half Year 2016
Conversion differences in non-monetary items, such as equity instruments measured at fair value with
changes recognised in net income, are booked as gains and losses at fair value. For non-monetary
items, such as equity instruments, classified as available for sale, conversion differences are booked in
equity, in the fair value reserve.
2.5 Derivative financial instruments
Derivative financial instruments are initially recognised at fair value on trade date and subsequently
remeasured at fair value. Fair values are based on quoted market prices, including recent market
transactions and evaluation models, namely: discounted cash flow models and option valuation
models Derivatives are considered assets when their fair value is positive and liabilities when their fair
value is negative.
Certain derivatives embedded in other financial instruments – such as debt instruments whose
profitability is indexed to share or share index price – are treated as separate derivatives when their
economic characteristics and risks are not closely related to those of the host contract and the host
contract is not carried at fair value through profit or loss. These embedded derivatives are measured at
fair value and subsequent changes are recognised in the income statement.
The Bank holds: (i) trading derivatives, measured at fair value – gains and losses arising from
changes in their fair value are immediately included in the income statement, and (ii) fair value
derivatives accounted for in conformity with Note 3.1 a).
2.6 Recognition of interest and similar income and interest and similar charges
Interest income and charges are recognised in the income statement for all instruments measured at
amortized cost in accordance with the pro rata temporis accrual method.
Once a financial asset or group of financial assets has been written down as a result of an impairment
loss, interest income should be recognised using the rate of interest used to discount the future cash
flows for the purpose of measuring the impairment loss.
2.7 Fees and commissions
Fees and commissions are generally recognised using the accrual method when the service has been
provided. Revenue from credit line fees, which are expected to originate a loan, is differed (together
with any cost directly related) and recognised as an adjustment at the effective interest rate. Fees and
commissions on trades, or participation in third party trades - such as purchasing stock or purchasing
or selling a business - are recognised as earned when the service has been provided. Portfolio and
other management advisory fees are recognised based on the applicable service contracts – usually
recognised proportionally to the time elapsed. Asset management fees related to investment funds are
recognised rateably over the period the service is provided.
2.8 Financial assets
Financial assets are recognised in the Balance Sheet on trade date - the date on which the Bank
commits to purchase or sell the asset. Financial assets are initially recognised at fair value plus direct
transaction costs, except for financial assets carried at fair value through profit or loss for which
transaction cost are directly recognised in the income statement. Financial assets are derecognised
when (i) the rights to receive cash flows from these assets have expired, (ii) the Bank has substantially
transferred all risks and rewards of ownership, or (iii) notwithstanding the fact that the Bank may have

36
Interim Report and Accounts
Half Year 2016
retained part, but not substantially all, of the risks and benefits associated with holding them, control
over the assets was transferred.
Financial assets and liabilities are offset and the net amount booked in the income statement when,
and only when, the Bank has a currently enforceable legal right to offset the recognised amounts and
intends to settle them on a net basis.
The Bank classifies its financial assets into the following categories: at fair value through profit or loss,
loans and receivables, held-to-maturity investments, and available-for-sale financial assets.
Management determines the classification of the financial instruments at initial recognition.
a) Financial assets at fair value through profit or loss
This category has two sub-categories: Financial assets held for trading, and those designated at fair
value through profit or loss. A financial asset is classified in this category if acquired principally for the
purpose of selling in the short term or if so designated by Management. Derivative financial assets are
also categorised as held for trading unless they qualify for hedge accounting.
The fair value option is only used for financial assets and liabilities in one of the following
circumstances:
There is a significant reduction in the measurement inconsistencies that would arise if the
related derivatives were treated as held for trading and the underlying financial instruments were
carried at amortised cost, such as loans and advances to customers or banks and debt
securities;
Certain investments, such as equity investments, that are managed and evaluated on a fair
value basis in accordance with a documented risk management or investment strategy and
reported to management on that basis; and
Financial instruments, such as holdings of debt securities, with one or more embedded
derivatives that significantly modify cash flows, are carried at fair value through profit and loss.
These assets are assessed daily or at each reporting date based on fair value. In the case of bonds
and other fixed-income securities the balance sheet contains the amount of unpaid accrued interest.
Gains and losses arising from changes in fair value are included directly in the income statement,
which also includes interest revenue and dividends on traded assets and liabilities at fair value.
Revenue from interest on financial assets at fair value through profit or loss is carried in net interest
income.
Gains and losses arising from changes in the fair value of the derivatives that are managed together
with designated financial assets and liabilities are included in item ‘Income from assets and liabilities at
fair value through profit and loss'.
b) Loans and receivables
Loans and receivables includes loans to customers and banks, leasing operations, factoring
operations, participation in syndicated loans and securitised loans (commercial paper and corporate
bonds) that are not traded in an active market and for which there is no selling intention.
Loans and securitised loans traded in an active market are classified as available-for-sale financial
assets.

37
Interim Report and Accounts
Half Year 2016
Loans and receivables are initially recognised at fair value. In general, fair value at inception
corresponds to transaction value and includes fees, commissions or other credit-related costs and
revenues.
Subsequently, loans and receivables are valued at amortised cost based on the effective interest rate
method and subject to impairment tests.
Interest, fees, commissions and other credit-related costs and revenues are recognised on an accrual
basis over the period of the transactions regardless of the moment when they are charged or actually
paid. Fees on loan commitments are recognised on a deferred and linear basis during the lifetime of
the commitment.
The Bank classifies as non-performing loans instalments of principal or interest after, at most, thirty
days of their due date. In case of litigation, all principal instalments are considered non-performing
(current and past due).
Factoring
Credit to customers includes advances within factoring operations with recourse and the amount of the
invoices granted without recourse, whose intention is not a short run sale, and is recorded on the date
the accounts receivable are assigned by the seller of the product or service that issues the invoice.
Accounts receivables assigned by the issuer of the invoices or other commercial credits for recourse or
non-recourse factoring are registered on assets under the item Loans and advances to customers. As
a counterpart it changes the item other liabilities.
When invoices are taken with recourse but cash advances on those respective contracts have not
been made yet, they are registered in off-balance sheet accounts on the amount of the invoices that
have been received. The off-balance sheet account is rectified as the cash advances are made.
Commitments arising from credit lines to factoring customers that have not been utilized yet are
registered in off-balance sheet accounts.
Guarantees granted and irrevocable commitments
Liabilities for guarantees granted and irrevocable commitments are registered in off-balance sheet
accounts by the value at risk and interest flows, commissions or other revenues recorded in the
income statement during the lifetime of the operations. These operations are subject to impairment
tests.
c) Held-to-maturity investments
This item includes non-derivative financial assets with fixed or determinable payments and defined
maturities that the Bank has the intention and ability to hold to maturity.
These assets are initially recognised at fair value, minus possible commissions included in the effective
rate, plus all direct incremental costs. They are subsequently valued at amortised cost, using the
effective interest rate method and subject to impairment tests. If during a subsequent period the
amount of the loss of impairment decreases, and that decrease may be objectively tied to an event
that happened after the impairment was recognised, this is reversed through the income statement.

38
Interim Report and Accounts
Half Year 2016
d) Available-for-sale financial assets
Available-for-sale financial assets are non-derivative financial assets that: (i) the Bank intends to keep
for an undetermined period of time, (ii) are recognised as available for sale at inception, or (ii) are not
categorized into any of the other categories described above.
This item includes:
Fixed-income securities that have not been classified in the trading book or the credit portfolio,
or held-to-maturity investments;
Available-for-sale variable-yield securities; and
Available-for-sale financial asset funds and supplementary funds.
Available-for-sale assets are recognised at fair value, except for equity instruments that are not listed
on any active market and whose fair value may not be reliably measured or estimated, in which case
they are recognised at cost value.
Gains and losses arising from changes in the fair value of available-for-sale financial assets are
directly recognised in equity in item Fair value revaluation reserves, except for impairment losses and
foreign exchange gains and losses of monetary assets, until the asset is sold, when the gain or loss
previously recognised in equity is carried in the income statement.
Interest from bonds and other fixed-income securities and the differences between acquisition cost and
the nominal value (premium or discount) are registered in the income statement using the effective rate
method.
Revenue from variable-income securities (dividends in the case of shares) are booked in the income
statement on the date they are attributed or received. According to this criterion, interim dividends are
recorded as profit in the exercise their distribution is decided.
In case of objective impairment evidence – resulting from a significant and prolonged decline in the fair
value of the security or from financial problems on the part of the issuer – the cumulative loss on the
fair-value revaluation reserve is removed from equity and recognised in the income statement.
Impairment losses on fixed-income securities may be reversed on the income statement if there is a
positive change in the security’s fair value as a result of an event that occurred after the initial
impairment recognition. Impairment losses on variable-income securities may not be reversed. In the
case of impaired securities, subsequent negative fair-value changes are always recognised in the
income statement.
Exchange rate fluctuations of non-monetary assets (equity instruments) classified in the available-for-
sale portfolio are registered in fair-value reserves. Exchange rate fluctuations in the other securities are
booked in the income statement.
2.9 Impairment of financial assets
a) Assets carried at amortised cost
The Bank assesses on each balance sheet date whether there is objective evidence that a financial
asset, or group of financial assets, is impaired. A financial asset, or group of financial assets, is
impaired and impairment losses are incurred if, and only if, there is objective evidence of impairment
as a result of one or more events that occurred after the initial recognition of the asset and that event
(or events) has an impact on the estimated future cash flows of the financial asset, or group of financial

39
Interim Report and Accounts
Half Year 2016
assets, that can be reliably estimated. Objective evidence that an asset, or group of assets, is impaired
includes observable data that the Bank is aware of, regarding the following loss events:
(i) significant financial stress of the borrower;
(ii) a breach of contract, such as a default in principal and/or interest payments;
(iii) concessions granted to the borrower, for reasons relating to the borrower’s financial difficulty,
that the lender would not have otherwise considered;
(iv) probability that the borrower will go into bankruptcy or other financial reorganisation;
(v) disappearance of an active market for that financial asset because of financial difficulties;
(vi) information indicating that there will be a measurable decrease in the estimated future cash
flows from a group of financial assets since the initial recognition of those assets, although that
decrease cannot yet be identified with the Bank’s assets, including:
– adverse changes in the group of financial assets’ condition and/or payment capacity;
– national or local economic conditions that correlate with defaults on the assets in the portfolio.
The Bank assesses initially whether objective evidence of impairment exists for financial assets that
are individually significant, and individually or collectively for financial assets that are not individually
significant. If the Bank determines that no objective evidence of impairment exists for an individually
assessed financial asset, whether significant or not, it includes that asset in a group of financial assets
with similar credit risk and collectively assesses them for impairment.
If there is objective evidence of an impairment loss on loans and receivables, or held-to-maturity
investments, the amount of the loss is measured as the difference between the asset's carrying
amount and the present value of estimated future cash flows (excluding future impairment losses that
have not been incurred) discounted at the financial asset's original effective interest rate. The carrying
amount of the asset is reduced and the amount of the loss is recognised in the provisions account. The
Bank may also determine impairment losses through the instrument’s fair value at observable market
prices.
When analysing impairment in a portfolio, the Bank estimates the probability of an operation or a
customer to default during the estimated period between impairment occurs and the loss is identified.
For the purpose of a collective evaluation of impairment, financial assets are grouped on the basis of
similar risk characteristics (i.e., based on the Bank’s classification process that takes into account
asset type, geographical location, collateral type, past due status and other relevant factors). These
characteristics are relevant to estimate future cash flows for groups of financial assets by being
indicative of the counterpart's ability to pay all amounts due according to the contractual terms of the
assets being evaluated.
Future cash flows in a group of financial assets that are collectively evaluated for impairment are
estimated on the basis of the contractual cash flows of the assets in the group and historical loss
experience for assets with credit risk characteristics similar to those in the group. Historical loss
experience is adjusted based on current observable data to reflect the effects of current conditions that
did not affect the period on which the historical loss experience is based and to remove the effects of
conditions in the historical period that do not currently exist.
If, in a subsequent period, the amount of the impairment loss decreases and that decrease can be
related objectively to an event occurring after the impairment was recognised (e.g., improvement in a

40
Interim Report and Accounts
Half Year 2016
debtor’s credit rating), the previously recognised impairment loss is reversed through the provisions
account. The amount of the reversal is recognised directly in the income statement.
Loans to customers whose terms have been renegotiated are no longer considered past due and are
treated as new loan contracts. Restructuring procedures include: extended payment conditions,
approved management plans, payment change and deferral. Restructuring practices and policies are
based on criteria that, from the point of view of the Bank’s management, indicate that payment has a
high probability of occurring.
b) Assets carried at fair value
The Bank assesses at each balance sheet date whether there is objective evidence that a financial
asset, or group of financial assets, is impaired. In the case of equity securities classified as available-
for-sale, a significant or prolonged decline in the fair value of the security below its cost is considered
in determining whether the securities are impaired. If any such evidence exists for available-for-sale
financial assets, the cumulative loss - measured as the difference between the acquisition cost and the
current fair value, minus any impairment loss on that financial asset previously recognised in the
income statement - is removed from equity and recognised in the income statement.
Impairment losses on equity instruments that have been recognised in the income statement are not
reversible. If, in a subsequent period, the fair value of a debt instrument classified as available for sale
increases and growth can be objectively related to an event occurring after the impairment loss was
recognised, the impairment loss is reversed through the income statement.
2.10 Intangible assets
- Software
Acquired computer software licences are capitalised on the basis of the costs incurred to acquire and
bring to use the specific software. These costs are amortised over their estimated useful lives.
Costs associated with software development and maintenance are recognised as expenses when
incurred. Costs directly associated with developing unique and identifiable software, controlled by the
Bank and where it is probable that they will generate future economic benefits, are recognised as
intangible assets.
Costs associated with software development recognised as assets are amortized during its useful life
using the straight-line method.
2.11 Intangible assets
The Bank’s property is comprised essentially of offices and branches. All tangible assets are stated at
historical cost minus depreciation. Historical cost includes expenditure that is directly attributable to the
acquisition of the assets.
Subsequent costs are included in the asset's carrying amount or recognised as a separate asset, only
when it is probable that future economic benefits associated with the item will flow to the Bank and the
cost of the item can be measured reliably. All other repairs and maintenance are charged to the
income statement during the financial period in which they are incurred.
Land is not depreciated. Depreciation of other tangible assets is calculated using the straight-line
method to allocate their cost to their residual values over their estimated useful lives, as follows:

41
Interim Report and Accounts
Half Year 2016
Estimated useful life (years)
Freehold buildings 50
Adaptation works in leasehold property 10, or during the lease period if lower than 10 years
Furniture, fixtures and fittings 5 to 8
Computers and similar equipment 3 to 4
Transport equipment 4
Other tangible assets 4 to 10
Tangible assets subject to depreciation are submitted to impairment tests whenever events or changes
in certain circumstances indicate their carrying amount may no longer be recovered. An asset's
carrying amount is written down immediately to its recoverable amount if the asset's carrying amount is
greater than its estimated recoverable amount. The recoverable amount is the higher between the
value in use and the asset’s fair value, minus sale costs.
Gains and losses on disposals are determined by comparing proceeds with carrying amount. These
gains and losses are included in the income statement.
2.12 Tangible assets held for sale
Assets acquired in exchange for loans (real estate property, equipment and other assets) are booked
in item Tangible assets held for sale at the amount stated in the agreement that regulates the asset’s
delivery, which corresponds to the lower of the outstanding amount of the debt or the asset’s
evaluation at the time of its delivery.
The Bank’s policy for this type of assets is to sell them as soon as possible.
These assets are periodically assessed and impairment losses are recognised whenever the result of
that appraisal is lower than the asset’s book value (see Note 29).
Potential realized gains on these assets are not recorded in the Balance Sheet.
2.13 Leases
a) As lessee
Leases entered by the Bank are essentially related to transport equipment, where there are contracts
classified as financial leases and others as operating leases.
Payments made on operating leases are recognised in the income statement.
When an operating lease is terminated before the end of the lease period, any payment required by
the lessor, by way of compensation, is recognised as an expense in the period the operation is
terminated.
Financial leases are capitalised at the inception of the lease in the respective item of tangible or
intangible assets, as a counterpart to the item Other liabilities, at the lower of (i) the fair value of the
leased asset and (ii) the present value of the minimum lease payments. Incremental costs paid for
leases are added to the recognised asset. Tangible assets are depreciated pursuant to Note 2.11.
Rents are comprised of (i) financial cost charged to expenses and (ii) financial depreciation of premium
that is deducted from the item Other liabilities. Financial charges are recognised as expenses over the
lease term so as to produce a constant periodic interest rate on the remaining balance of the liability

42
Interim Report and Accounts
Half Year 2016
for each period. However, when there is no reasonable certainty that the Bank will obtain possession
of the asset at the end of the lease, the asset must be totally depreciated during the smaller of the
lease period or its useful life.
b) As lessor
Assets held under a financial lease are recognised as an expense in the period to which they relate by
the current amount of the payments to be made. The difference between the gross amount receivable
and the current balance receivable is recognised as receivable financial income.
Interest included in the rents charged to customers is registered as income, while principal
depreciation, also included in the rents, is deducted from the overall amount initially lent. Recognition
of the financial result reflects a constant periodical return rate over the remaining net investment of the
lessor.
2.14 Provisions
Provisions for other risks and charges
Provisions for restructuring costs and legal expenses are recognised whenever: the Bank has a legal
or constructive obligation as a result of past events; it is more likely than not that an outflow of
resources will be required to settle that obligation; and the amount can be reliably estimated.
Loan impairment and Provisions for specific and general credit risks
Pursuant to article 2 of Notice No. 5/2015 issued by the Bank of Portugal on 7 December, starting on 1
January 2016, the entities that are under the supervision of the Bank of Portugal shall prepare their
individual financial statements according to the International Accounting Standards (IAS) as adopted at
each moment by the Regulation of the European Union and respecting the conceptual framework for
the preparation and presentation of financial statements on which those standards are based, as was
formerly required for consolidated financial statements when applicable.
In accordance with No. 7 of the aforementioned legislation, Notice No. 3/95 issued by the Bank or
Portugal was revoked and therefore the Bank prepared its respective financial statements in terms of
recognition, classification and measurement of loans granted and other accounts receivable, and
determination of impairment entirely pursuant to the reference criteria and principles disclosed by the
Bank of Portugal in the Circular Letter No. 02/2014/DSP of 26 February.
2.15 Employee benefits
a) Pension liabilities and other post-retirement benefits
In compliance with the Collective Bargaining Agreement (ACT) for the banking sector, the Bank has
established a Pension Fund designed to cover retirement benefits on account of age, including
disability, and survivor’s benefits, set up for the entire work force, calculated based on projected
salaries of staff in active employment. The pension fund is supported by the contributions made, based
on the amounts determined by periodic actuarial calculations. A defined benefit plan is a pension plan
that generally defines an amount of pension benefit that an employee will receive on retirement,
usually dependent on one or more factors such as age, years of service and compensation.
Every year the Bank determines the amount of liabilities for past services using actuarial calculations
based on the Project Unit Credit method for liabilities for past services in the case of old age and the

43
Interim Report and Accounts
Half Year 2016
Unique Successive Premium to calculate disability and survivor’s benefits. The actuarial assumptions
(financial and demographic) are based on expectation at the balance sheet date for the growth in
salaries and pensions and are based on mortality tables adapted to the Bank’s population. The
discount rate is determined based on market rates for high quality corporate bonds, with periods to
maturity similar to those for settlement of pension liabilities. The assumptions are mutually compatible.
The amount of liabilities includes, besides retirement pensions, post-employment medical care (SAMS)
and post-retirement death benefits.
Until 31 December 2012, the Bank recognized the net accumulated amount (after 1 January 2004) of
actuarial gains and losses resulting from changes in the financial and actuarial assumptions and
differences between the financial and actuarial assumptions used and the actual amounts in the item
Other Assets or Other Liabilities - Actuarial Gains/Losses.
Accumulated actuarial gains or losses that did not exceed 10% of the highest of the current value of
liabilities for past services or the value of the pension funds were included in the 'corridor'. Actuarial
gains/losses in excess of the corridor were recognised against results over the average remaining
period of service of the employees covered by the plan.
As at 1 January 2013 the Bank changed its accounting policy of recognising financial and actuarial
gains and losses for pension plans and other defined benefit post-employment benefits pursuant to
IAS 19 Revised. Financial and actuarial gains and losses are now recognised in the period they occur
directly in equity in the Statement of Comprehensive Income.
Increases in past service liabilities resulting from early retirement are fully recognised as expenses in
the income statement for the year in which they occur.
Increases in past service liabilities resulting from changes in the conditions of Pension Plans are fully
recognised as expenses in the case of acquired benefits or depreciated during the period that remains
until those benefits are acquired. The balance of the increases in liabilities not yet recognised as
expenses are registered in the item Other Assets.
Past service liabilities (post-employment benefits) are covered by a pension fund. The amount of the
pension funds corresponds to the fair value of its assets at the balance sheet date.
The financing regime by the pension fund is established in Notice No. 4/2005 issued by the Bank of
Portugal, which determines the compulsory fully financing pension liabilities and a minimum level of
95% financing of past service liabilities for staff in active employment.
In the Bank’s financial statements, the amount of past service liabilities for retirement pensions, minus
the amount of the pension fund, is stated in item Other Liabilities.
The Bank’s income statement includes the following expenses related to retirement and survivor
pensions:
Current service cost;
Interest expense on the total outstanding liabilities;
Expected revenue of the pension fund;
Expenses with increases in early retirement liabilities;
'Multiprotecção' life insurance premium (see Note 37);
Management fee paid to the fund management company.
On the transition date, the Bank adopted the possibility permitted by IFRS 1 of not recalculating
deferred actuarial gains and losses from the beginning of the plans (normally known as the reset

44
Interim Report and Accounts
Half Year 2016
option). Thus, deferred actuarial gains and losses recognised in the Bank’s accounts as at 31
December 2003 were fully reversed in retained earnings on the transition date – 1 January 2004.
b) Seniority bonuses
In compliance with the Collective Bargaining Agreement (ACT) for the banking sector in Portugal, the
Bank has committed to attribute to active staff that complete fifteen, twenty-five and thirty years of
good and effective service, a seniority bonus equal, respectively, to one, two or three months of their
effective monthly salary on the year of the attribution.
Every year the Bank determines the amount of liabilities for seniority bonuses using actuarial
calculations based on the Project Unit Credit method for liabilities for past services. The actuarial
assumptions (financial and demographic) are based on expectation at the balance sheet date for the
growth in salaries and pensions and are based on mortality tables adapted to the Bank ’s population.
The discount rate is determined based on market rates for high quality corporate bonds, with periods to
maturity similar to those for settlement of pension liabilities. The assumptions are mutually compatible.
Liabilities for seniority bonuses are recognised in the item Other Liabilities.
The Bank’s income statement includes the following expenses regarding seniority bonus liabilities:
cost of current service (cost of one year);
interest expenses;
actuarial gains/losses, changes in assumptions or changes in the conditions of the benefits.
2.16 Deferred taxes
Deferred taxes are recognised using the balance sheet debt method, based on temporary differences
arising from the differences between the tax bases of assets and liabilities and their carrying amounts
in the financial statements. Deferred income tax is determined using the effective tax rate on profits at
the balance sheet date that is expected to apply when the deferred tax asset is realised or the deferred
tax liability is settled.
Deferred income tax is recognised when it is probable that in the future there is enough tax on profits
so that it can be used.
Taxes on profits based on the application of legal rates for each jurisdiction are recognised as
expenses in the period when the profit is originated. The tax effects of reportable tax losses are
recognised as an asset when it is likely that the future profitable profit is enough for the reportable tax
loss to be utilized.
Deferred tax related to fair value revaluation of an available-for-sale asset, which is charged or
credited directly in equity, is also credited or charged in equity and subsequently recognised in the
income statement together with deferred gains or losses.
2.17 Financial liabilities
The Bank classifies its financial liabilities into the following categories: held-for-trade financial liabilities,
other financial liabilities at fair value through profit and loss, deposits from central bank, deposits from
other banks, customer deposits, securitised liabilities and other subordinated liabilities. Management
determines the classification of the financial instruments at initial recognition.

45
Interim Report and Accounts
Half Year 2016
a) Financial liabilities held for trading and at fair value through profit and loss
This item essentially includes deposits whose yield is indexed to stock portfolios or indexes and the
negative fair value of derivative contracts. The evaluation of these liabilities is made based on fair
value. The balance sheet value of deposits includes the amount in accrued interest not paid.
b) Central banks, other banks, and customer funds
After the initial recognition, deposits and other financial assets from customers, central banks and
other banks are revalued at amortized cost based on the effective interest rate method.
c) Securitised liabilities, and other subordinated liabilities
These liabilities are initially recognised at fair value, which is the amount for which they were issued
net of transaction costs incurred. These liabilities are subsequently measured at amortized cost and
any difference between the net amount received on transaction and their redemption value is
recognised in the income statement over the liability period using the effective interest rate method.
If the Bank acquires its own debt, this amount is removed from the balance sheet and the difference
between the balance sheet amount of the liability and the amount spent to acquire it is recognised in
the income statement.
2.18 Non-current assets held for sale
Non-current assets, or disposal groups, are classified as held for sale whenever their book value is
recoverable through sale. This condition can only be met when the sale is highly probable and the
asset is available for immediate sale in its current condition. The sale must be performed within one
year from the date on which they are included in this item. An extension of the period during which the
asset must be sold does not exclude that asset, or a disposal group, from being classified as held for
sale if the delay is caused by an event or circumstances that the Bank cannot control and if the selling
purpose is maintained. Immediately before the initial classification of the asset, or disposal group, as
held for sale, the book value of non-current assets (or of every asset and liability in the group) is
carried pursuant to the applicable IFRS. Subsequently these assets, or disposal group, will be
remeasured at the lower between the initial carrying amount and the fair value minus selling costs.
2.19 Insurance and reinsurance brokerage
Banco Popular Portugal is authorized by the Authority for the Supervision of Insurances and Pension
Funds to act as an insurance broker in the category of Associated Insurance Broker pursuant to
paragraph 8(i) of Decree-law No. 144/2006 of 31 July, performing its brokerage activity in the area of
life and non-life insurances.
In the scope of its insurance brokerage services, Banco Popular sells insurance contracts. As
remuneration for the services rendered as an insurance broker, Banco Popular receives fees and
commissions for insurance contracts and investment contracts, which are defined in
agreements/protocols established between the Bank and the Insurance Companies.
The fees and commissions received for insurance brokerage services are recognized on an accrual
basis, which means that those paid at a different moment from the period their refer to are booked as a
receivable in item Other Assets (see Note 8).

46
Interim Report and Accounts
Half Year 2016
3. Financial risk management
3.1 Strategy used for financial instruments
In view of its activity, the Bank raises funds essentially through customer deposits and monetary
market operations.
Besides the activities of credit granting, the Bank also applies its funds in financial investments,
particularly in the group of investments that currently comprise the Bank’s portfolio.
The Bank’s securities portfolio - including available-for-sale financial assets and trading portfolio -
amounted to around 1.4 billion euros in the first half of 2016, representing around 15% of the Bank's
total net assets. The typology of these assets was broken down as follows: public Portuguese debt
(15.6%), public Spanish debt (60.3%), banks (20.9%) and others (3.2%).
To hedge its investment against interest rate risk, the Bank carried out interest rate swap operations
and monetary market operations, thus trying to control the variability of interest rate risk and the flows
generated by these assets.
a) Fair value hedge accounting
Gains and losses resulting from the revaluation of hedge derivatives are recognised in the income
statement. Gains and losses deriving from differences in terms of the fair value of hedged financial
assets and liabilities, corresponding to the hedged risk, are also recognised in the income statement
as a counterpart for the carrying value of the hedged assets and liabilities, in the case of operations at
amortized cost, or by counterpart of the reserve for fair value revaluation in the case of available-for-
sale assets.
Efficacy tests for hedges are accordingly documented on a regular basis, ensuring the existence of
proof during the lifetime of the hedged operations. If the hedge no longer meets the criteria demanded
by hedge accounting, it shall be prospectively discontinued.
b) Cash flow hedge accounting
In a cash flow hedge, the effective part of the changes in fair value for the hedged derivative is
recognised in reserves, and transferred to the income statement in the periods when the respective
hedged item affects results. If it is foreseeable that the hedged operation will not take place, the
amounts still stated in equity are immediately recognised in the income statement and the hedged
instrument is transferred to the trading book.
The Bank is exposed to a certain cash flow risk as regards open positions in foreign currency.
However, in view of the little materiality of the normally existing overall position, no hedge operations
are carried out in this case.
3.2 Financial assets and liabilities at fair value
The Board of Directors considered that as at 30 June 2016, the fair value of assets and liabilities at
amortised cost did not differ significantly from its book value.

47
Interim Report and Accounts
Half Year 2016
In order to determine the fair value of a financial asset or liability, its market price is applied whenever
there is an active market for it. In case there is no active market, which happens with some financial
assets and liabilities, generally accepted valuation techniques based on market assumptions are
employed.
The net income of financial assets and liabilities at fair value that have not been classified as hedging
includes an amount of 41 858 thousand euros (June 2015: 990 thousand euros).
Consequently, the fair value change recognized in the income statement for the period is analysed as
follows:
The table below classifies fair value assessment of the Bank’s financial assets and liabilities based on
a fair value hierarchy that reflects the significance of the inputs that were used in the assessment,
according to the following levels:
- Level 1: (unadjusted) market prices in active markets for identical assets or liabilities;
- Level 2: different inputs for market prices included in Level 1 that are observable for assets and
liabilities either directly (i.e., as prices) or indirectly (i.e. derived from the prices);
- Level 3: inputs for assets and liabilities that are not based on observable market data (non-
observable inputs).

48
Interim Report and Accounts
Half Year 2016
Individual
Ativos e Passivos mensurados
ao justo valorNível 1 Nível 2 Nível 3 Total Nível 1 Nível 2 Nível 3 Total
Ativos f inanceiros detidos
para negociação
Títulos de rendimento variável 455 - 14 469 2 038 - 9 954 11 992
Derivados - 44 506 - 44 506 - 37 901 - 37 901
Ativos f inanceiros disponíveis
para venda
Títulos de dívida 1 350 206 1 321 - 1 351 527 1 866 044 1 158 - 1 867 202
Títulos de capital - - 84 461 84 461 - - 47 228 47 228
Derivados de cobertura - - - - - 1 055 1 055
Total dos Ativos
mensurados ao justo valor1 350 661 45 827 84 475 1 480 963 1 868 082 40 114 57 182 1 965 378
Passivos f inanceiros detidos
para negociação (Derivados) - 41 452 - 41 452 - 41 452 - 41 452
Derivados de cobertura - 121 337 - 121 337 - 121 337 - 121 337
Total dos Passivos
mensurados ao justo valor 0 162 789 0 162 789 0 162 789 0 162 789
30-06-2016 31-12-2015
3.3 Credit risk
The Bank is exposed to credit risk, which is the possible loss that arises when the Bank’s
counterparties fail to fulfil their obligations. In the case of lending, it implies the loss of principal,
interest and commissions, regarding amount, period and other conditions set forth in the contracts.
Concerning off-balance sheet risks, it derives from the non-compliance of the counterparts regarding
their obligations with third parties, which implies that the Bank has to assume as its own certain
obligations depending on the contracts.
The Bank structures the levels of credit risk it is exposed to by establishing pre-defined acceptable risk
amounts regarding the borrower or group of borrowers and geographical or business activity
segments.

49
Interim Report and Accounts
Half Year 2016
Exposure to credit risk is managed through a regular analysis of the capacity of borrowers and
potential borrowers of meeting payment obligations for principal and interest, and by changing these
loan limits when appropriate. Exposure to credit risk is also managed in part by obtaining collaterals
and personal or corporate guarantees.
- Collaterals
The Bank employs a series of policies and practices in order to mitigate credit risk. The most traditional
one is securing collaterals at the moment funds are advanced. The Bank implements guidelines
regarding the acceptability of specific classes of collaterals or mitigation of credit risk. The main types
of collaterals for loans and receivables are:
- Property mortgages;
- Pledges of operations made within the Bank;
- Pledges on assets such as premises, inventory and accounts receivable;
- Pledges on financial instruments, such as securities and shares.
Long-term loans to corporate and private customers usually require a collateral; lower amounts and
recurring personal loans generally require no collateral. Additionally, with the intention of minimising
loss, at the time an impairment indicator for loans and receivables is identified the Bank tries to obtain
additional collaterals from the relevant counterparties.
Collaterals held for financial assets, except for loans and advances, are determined by the nature of
the instrument. Debt instruments, treasury bonds and other securities usually are not collateralised.
- Lending commitments
The main objective of these instruments is to ensure that funds are made available to customers as
they require them. Loan extension commitments represent non-utilized parts of credit extension
authorizations in the form of loans, guarantees or letters of credit. Regarding the credit risk associated
with loan extension commitments, the Bank is potentially exposed to a loss in the amount of the total of
non-utilized commitments. However, the probable loss amount is much lower than the sum of the non-
utilized commitments since loan extension commitments are revocable and depend on a specific
customer’s credit worthiness. The Bank monitors the maturity of lending commitments since long term
commitments usually present a greater credit risk than short-term commitments.
- Maximum exposure to credit risk
As at 30 June 2016 and 31 December 2015, maximum exposure to credit risk was as follows:

50
Interim Report and Accounts
Half Year 2016
CONSOLIDATED
30-06-2016 30-06-2016 31-12-2015
On-balance sheet
Deposits w ith banks 89 820 89 820 76 428
Financial assets held for trading 44 506 44 506 37 900
Available-for-sale f inancial assets 1 351 528 1 351 528 1 867 203
Loans and advances to banks 1 405 171 1 405 171 606 616
Loans and advances to customers 6 013 920 5 958 914 6 085 775
Other assets 245 729 245 284 272 676 272 676
9 150 674 9 095 223 8 946 598
Off-balance sheet
Financial guarantees 127 341 127 341 288 817
Other guarantees 258 533 258 533 102 654
Lending commitments 948 762 863 659 904 138
Documentary credits 44 614 44 614 44 034
1 379 250 1 294 147 1 339 643
Total 10 529 924 10 389 370 10 286 241
INDIVIDUAL
The table above shows the worst-case scenario in terms of the level of exposure to credit risk the Bank
faced as at 30 June 2016 and 31 December 2015, without considering any collateral held or other
credit enhancements. For on-balance sheet assets, the above stated exposure is based on their
carrying amount on the balance sheet.
As seen in the table above, 65.7% of total maximum exposure results from loans and advances to
customers (dec 2015: 68.0%).
The Bank’s management trusts its capacity to control and maintain a minimal exposure to credit risk,
which results mainly from its customer portfolio, based on the following assumptions:
- 54.15% of the amount of loans and advances to customers has eligible collaterals;
- 93.72% of customer loan portfolio is not past due.
- Concentration by activity segment of financial assets with credit risk
The tables below show the exposure of the Bank according to the assets’ carrying amount (excluding
accrued interest) broken down by activity segment.

51
Interim Report and Accounts
Half Year 2016
Individual
Financial Public Property constr. Other
30-06-2016 Institutions Sector & develop. Industries Services Home loans Other loans
Deposits w ith banks 89 820
Financial assets held for trading 1 930 27 841 71 15 133
Available-for-sale f inancial assets 177 463 1 242 558 0 15 967
Loans and advances to banks 1 405 113
Loans and advances to customers 5 574 803 617 1 129 482 2 362 007 1 676 716 334 581
Investment in subsidiaries and associates 20 243
Other assets 124 359 77 908 334
1 818 928 1 326 040 831 458 1 129 887 2 393 107 1 676 716 334 581
Financial Public Property constr. Other
31-12-2015 Institutions Sector & develop. Industries Services Home loans Other loans
Deposits w ith banks 76 428
Financial assets held for trading 12 963 23 605 73 13 252
Available-for-sale f inancial assets 246 651 1 580 344 87 435
Loans and advances to banks 606 543
Loans and advances to customers 5 470 846 071 1 131 245 2 322 899 1 603 497 173 323
Non-current assets held for sale 20 243
Other assets 160 960 18 653
1 103 545 1 604 467 869 676 1 131 318 2 443 829 1 603 497 173 323
Private
Private
Consolidated
Financial Public Property constr. Other
30-06-2016 Institutions Sector & develop. Industries Services Home loans Other loans
Deposits w ith banks 89 820
Financial assets held for trading 1 930 27 841 71 15 133
Available-for-sale f inancial assets 140 374 1 242 558 0 15 967
Loans and advances to banks 1 405 171
Loans and advances to customers 5 574 822 656 1 203 040 2 328 670 1 676 716 334 581
Investment in subsidiaries and associates 20 243
Other assets 124 359 78 199 365
1 781 897 1 326 331 850 497 1 203 476 2 359 770 1 676 716 334 581
Private
3.4 Geographic breakdown of assets, liabilities and off-balance sheet items
The Bank operates fully on the national market. Therefore, it is not relevant to perform an analysis by
geographical sector, since there is no identifiable item within a specific economic environment that is
subject to differentiated risks or benefits.
3.5 Market risk
Market Risk is the probability of negative impact on the Bank’s earnings or capital due to adverse
changes in the market prices of the instruments in the trading book, caused by the volatility of equity
prices, interest rates, and foreign exchange rates.
As at 30 June 2016, the Bank’s portfolio amounted to around 1.8 billion euros, of which only around
0.47 million euros were classified as financial assets held for trading.

52
Interim Report and Accounts
Half Year 2016
- Risk-sensitivity analysis
In the scope of the stress test performed, Banco Popular carries out a sensitivity analysis to a 30%
fluctuation in stock indexes. In case of devaluation within such order of magnitude, we can conclude
that there is no need for additional capital.
We would also like to add that on that date, market risk represented only around 0.002% of total risk
weighted assets (RWA) calculated pursuant to CRD IV/CRR.
3.6 Exchange rate risk
The national currency equivalent, in thousands of euros, of assets and liabilities at sight expressed in
foreign currency is as follows:
Individual
30 June 2016 USD GBP CHF JPY CAD AUD NOK Other
Assets
Cash and cash equivalents 172 119 80 7 39 9 4 13
Deposits w ith banks 12 457 8 481 424 44 762 4 407 2 923 272
Available-for-sale f inancial assets 58 - - - - - - -
Loans and advances to banks 36 704 18 403 - - - - - -
Loans and advances to customers 3 171 1 474 - - - - - -
Other assets 3 685 259 2 5 3 256 2 1
56 247 28 736 506 56 804 4 672 2 929 286
Liabilities
Deposits from banks 37 289 18 412 373 52 23 - - 147
Deposits from customers 59 617 9 435 118 - 786 4 457 2 926 156
Other liabilities 2 738 798 11 1 31 309 18 2
99 644 28 645 502 53 840 4 766 2 944 305
Net balance sheet position - 43 397 91 4 3 - 36 - 94 - 15 - 19
Foreign exchange forw ard transactions 44 967 - - - - - - - 13
Net position 1 570 91 4 3 - 36 - 94 - 15 - 32
31 December 2015
Total assets 103 035 66 312 461 155 8 104 5 272 2 950 469
Total liabilities 90 554 66 399 217 50 6 300 5 364 2 852 129
Net balance sheet position 12 481 - 87 244 105 1 804 - 92 98 340
Foreign exchange forw ard transactions - 12 096 - - 258 - 170 - 1 984 - - 137 - 401
Net position 385 - 87 - 14 - 65 - 180 - 92 - 39 - 61

53
Interim Report and Accounts
Half Year 2016
- Risk-sensitivity analysis
The activity of Banco Popular Portugal regarding foreign currency consists in making transactions
based on customer operations. In this framework, the overall foreign exchange position of the Bank is
virtually non-existent.
Thus, as can be seen, whatever the impact of foreign currency prices on foreign exchange terms, it is
financially immaterial for the Bank’s income, which is why no risk-sensitivity analysis are carried out.
3.7 Interest rate risk
This risk assesses the impact on net interest income and equity as a result in fluctuation in market
interest rates.
The interest rate risk of the balance sheet is measured using a repricing gap model applied to assets
and liabilities that are susceptible to interest rate fluctuations pursuant to Instruction No. 19/2005
issued by the Bank of Portugal. Briefly, this model groups assets and liabilities that are sensitive to
fluctuations at fixed time brackets (maturity dates or the first interest rate revision in case of
indexation), from which one calculates the potential impact on the intermediation margin.

54
Interim Report and Accounts
Half Year 2016
Up to 1 month1 to 3
months
3 to 12
months
Over 12
monthsNot sensitive Total
Cash and Currency Market 257 980 1 259 175 34 - 60 669 1 577 859
Loans and advances to customers 1 308 601 1 901 632 2 172 359 526 717 49 604 5 958 914
Securities market 14 000 593 053 243 000 80 990 258 072 1 189 116
Other assets - - - - 551 429 551 429
Total Assets 1 580 581 3 753 861 2 415 393 607 707 919 774 9 277 317
Currency market 771 199 1 830 753 1 036 841 50 000 0,01 3 688 793
Deposit market 904 476 476 813 1 598 823 1 816 570 31 673 4 828 355
Securities market 4 536 - 22 000 - 542 27 078
Other liabilities - - - - 301 298 301 298
Total Liabilities 1 680 211 2 307 566 2 657 664 1 866 570 333 513 8 845 524
Gap ( 99 630) 1 446 295 ( 242 271) (1 258 863) 586 261
Accumulated gap ( 99 630) 1 346 665 1 104 394 ( 154 469) 431 792
Gap 30 069 2 311 978 (1 059 425) (1 137 290) 534 727
Accumulated gap 30 069 2 342 047 1 282 622 145 332 680 059
M aturity and repricing gap for the Bank's activity as at 30 June 2016
M aturity and repricing gap for the Bank's activity as at 31 December 2015
- Risk-sensitivity analysis
Pursuant to the referred to model, the Bank calculates the potential impact on net interest income and
net income.
In the table below, this model considers a potential 1% immediate impact on interest rates, i.e., on the
date interest rates are revised. Therefore, the new interest rates will start to show this effect both on
assets and liabilities.

55
Interim Report and Accounts
Half Year 2016
3.8 Liquidity risk
The Bank permanently follows the evolution of its liquidity, monitoring cash inflows and outflows at all
times. Liquidity projections are prepared in order to allow for careful planning of short and medium-
term funding strategies.
The Bank's primary source of funding are deposits from customers, complemented by access to the
capital markets via bond issues and to the interbank market, where we focus on operations with Banco
Popular Group. Simultaneously the Bank has tried to ensure other sources of funding, carefully
selected for each maturity depending on pricing, stability, speed of access, depth, and compliance with
the pre-established risk management policies.
The liquidity management process, as performed by the Bank, includes:
- The daily funding needs that are managed by monitoring future cash flows in order to guarantee
that the requirements are met. This includes write-backs as loans mature or are granted to
customers;
- Maintaining a high-liquidity asset portfolio so that these can be easily converted into cash as a
protection against any unexpected interruption in cash flows;
- Monitoring liquidity ratios taking into account external and internal requirements;
- Managing the concentration and profile of debt maturities resorting to the liquidity gap model.
Besides the obligations established by the Bank of Portugal under the terms of Instruction No.
13/2009, the Bank also resorts to the concept of liquidity gap, i.e., from the balance sheet of the Bank
as at 30 June 2016, based on the maturities of assets and liabilities it is possible to ascertain the ratio
between the referred to maturities (positive or negative) according to residual maturity deadlines called
liquidity gaps. The Bank also calculates LCR (Liquidity Coverage Ratio), NSFR (Net Stable Funding
Ratio), and ALMM (Additional Liquidity Monitoring Metrics), with the aim to monitor the evolution of
liquidity and report it to the supervising authorities.
The table below presents the Bank’s balance sheet (without accrued interest) at the end of June 2016
with the main classes grouped by maturity date:

56
Interim Report and Accounts
Half Year 2016
- Off-balance sheet exposures (Liquidity risk)
As at 30 June 2016, maturities for the contracted amounts of off-balance sheet financial instruments
that may commit the Bank to lending and other facilities to customers were as follows:

57
Interim Report and Accounts
Half Year 2016
Individual
30-06-2016 Up to 1 month1 to 3
months
3 to 12
months
1 to 5
years
Over 5
yearsUndated
Contingent liabilities:
Documentary credits - - - - - 44 614
Guarantees and Sureties 5 922 6 546 16 143 47 008 4 615 305 639
Commitments:
Irrevocable loans - - - - - -
Revocable loans 52 528 81 301 332 612 28 767 113 279 255 172
Total 58 450 87 847 348 755 75 775 117 894 605 425
31-12-2015 Up to 1 month1 to 3
months
3 to 12
months
1 to 5
years
Over 5
yearsUndated
Contingent liabilities:
Documentary credits - - - - - 44 034
Guarantees and Sureties 2 226 1 541 7 486 52 985 5 731 321 502
Commitments:
Irrevocable loans - - - - - -
Revocable loans 54 592 102 980 327 991 26 041 114 315 278 219
Total 56 818 104 521 335 477 79 026 120 046 643 755
Consolidated
30-06-2016 Up to 1 month1 to 3
months
3 to 12
months
1 to 5
years
Over 5
yearsUndated
Contingent liabilities:
Documentary credits - - - - - 44 614
Guarantees and Sureties 5 922 6 546 16 143 47 008 4 615 305 639
Commitments:
Irrevocable loans - - - - - -
Revocable loans 187 979 172 549 190 961 28 767 113 279 255 228
Total 193 901 179 095 207 104 75 775 117 894 605 481
3.9 Operational risk
Banco Popular Portugal interprets Operational Risk as defined in the Basel II Accord, i.e., as the risk of
loss resulting from inadequate or failed internal processes, people and systems or from external
events.
The management process is based on an analysis by functional area listing the risks inherent in the
specific functions and tasks of each body in the structure.
Involving the whole organization, the management model is ensured by the following structures:
Executive Committee (CE) – top management structure that is the main responsible for
management guidelines and policies, establishing and monitoring risk appetite and risk tolerance
limits.

58
Interim Report and Accounts
Half Year 2016
Risk Management (DGR) - integrates the unit exclusively dedicated to managing operational risk. It
is in charge of boosting and coordinating the remaining structures towards the application of
methodologies and employment of corporate tools to support the model.
Heads of Operational Risk (RRO) – corresponds to the basis of the organization, these are
elements appointed by the hierarchies of each organic unit who have the role of facilitators and
promoters of the operational risk management model.
In the process of operational risk management, they also play a key role in the auditing structures,
internal control and security of the Bank.
3.10 Fiduciary activities
The Bank provides custody services, guarantees, corporate management services, investment
management and third party advisory services. These activities demand the allocation of assets and
purchasing and sale transactions regarding a wide range of financial instruments. These assets, which
are kept in fiduciary capacity, are not included in these financial statements. As at 30 June 2016, the
Bank held investment accounts in the amount of 5 615 124 thousand euros (dec 2015: 5116508
thousand euros) and managed estimated financial assets in the amount of 175 742 thousand euros
(dec 2015: 179144 thousand euros).
3.11 Capital management and disclosures
The main objective of capital management at the Bank is meeting the minimum requirements defined
by supervisory entities in terms of capital adequacy and ensuring that the strategic objectives of the
Bank in terms of capital adequacy are met.
The definition of the strategy to adopt in terms of capital management is in the scope of the Bank’s
Board of Directors.
In prudential terms, the Bank is subject to the supervision of the Bank of Portugal, which issues the
rules and regulations regarding this matter that guide the several institutions under their supervision.
These rules and regulations determine a minimum ratio of total own funds in relation to the
requirements of committed risks that the institutions must abide by.
As at 30 June 2016, Core Tier 1 ratio calculated pursuant to CRD IV/CRR stood at 13.8% (dec 2015:
12.0%) highly above the minimum amount required by the Bank of Portugal (7%).
4. Estimates and assumptions in the application of accounting policies

59
Interim Report and Accounts
Half Year 2016
The Bank makes estimates and assumptions with impact on the reported amount of assets and
liabilities in the following year. These estimates and assumptions are continuously assessed and
conceived based on historical data and other factors, such as expectations regarding future events.
a) Impairment losses on loans
Every month, the Bank assesses its securities portfolio to evaluate potential impairment losses. In
determining whether an impairment loss should be recorded in the income statement, the Bank
analyses observable data that may be indicative of a measurable decrease in estimated cash flows
both of the trading book and of specific individual cases within a trading book. This analysis may
indicate, for example, an adverse event in the capacity of a customer to pay a loan or the worsening of
macroeconomic conditions and related indicators. Management uses estimates based on historical
data available for assets with similar credit risk and possible impairment losses. The methodology and
assumptions used to calculate these estimates are revised regularly aiming at reducing any differences
between estimated and actual losses.
b) Fair value of derivatives and unlisted financial assets
The fair value of derivatives and unlisted financial assets was determined based on evaluation
methods and financial theories whose results depend on the assumptions that have been used.
c) Impairment of equity investments in the portfolio of Available-for-sale financial assets
The Bank determines that there is impairment of equity investments of available-for-sale assets when
there has been a significant or prolonged decline in the fair value below its cost. The required
quantification for the expressions ‘significant’ and ‘prolonged’ imply professional judgement. When
making this judgement, the Bank assesses among other factors the normal volatility of share prices. As
a complement, impairment should be recognised when there are events that show the deterioration of
the viability of the investment, the performance of the industry and the sector, technological changes
and operational and financial cash flows.
d) Retirement and survivor’s pensions
Liabilities for retirement and survivor’s pensions are estimated based on actuarial tables and
assumptions on the growth of pensions and salaries. These assumptions are based on the Bank ’s
expectations for the period when the liabilities are to be settled.
e) Deferred taxes
The recognition of a deferred tax asset assumes the existence of profit and a future tax base. Deferred
tax assets and liabilities have been determined based on tax legislation currently in effect or on
legislation already published for future application. Changes in the interpretation of tax legislation may
influence the amount of deferred tax that has been recognised.
5. Segmental reporting
The Bank operates essentially in the financial sector and its activity is targeted at corporate,
institutional and private customers.
The products and services offered by the Bank include deposits, loans to companies and private
individuals, brokerage and custody services, investment banking services, and selling investment
funds and life and non-life insurance. Additionally, the Bank makes short, medium, or long term
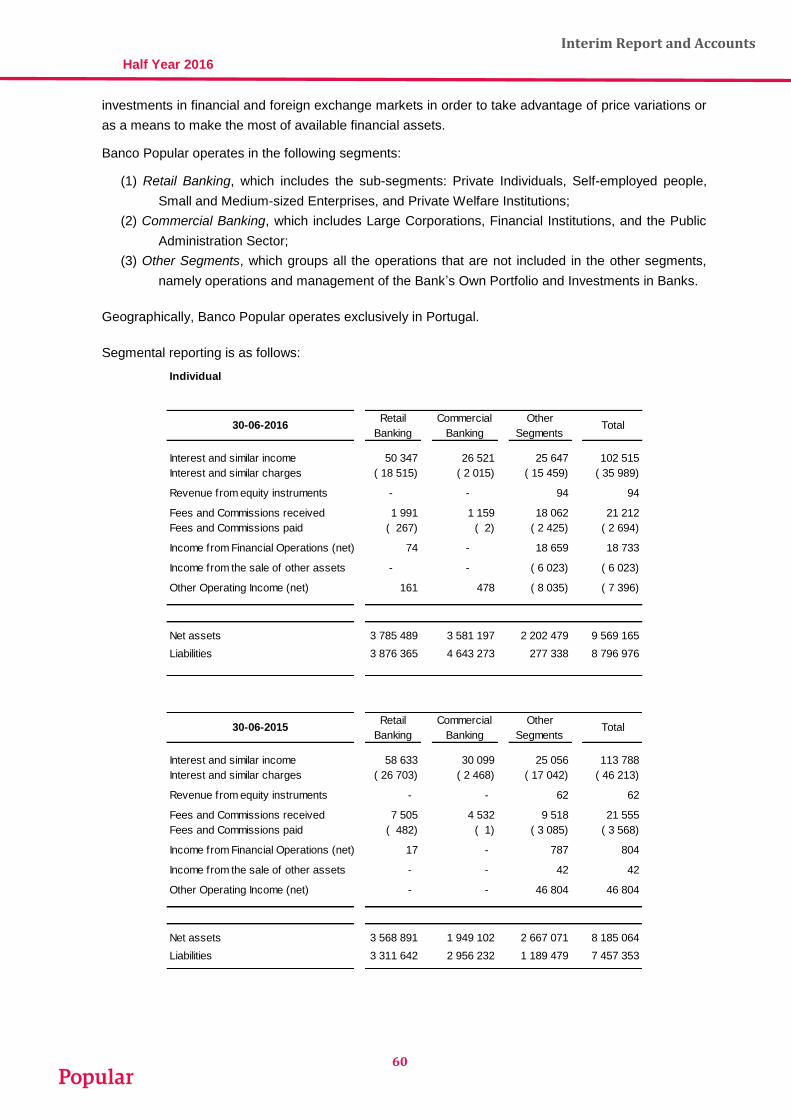
60
Interim Report and Accounts
Half Year 2016
investments in financial and foreign exchange markets in order to take advantage of price variations or
as a means to make the most of available financial assets.
Banco Popular operates in the following segments:
(1) Retail Banking, which includes the sub-segments: Private Individuals, Self-employed people,
Small and Medium-sized Enterprises, and Private Welfare Institutions;
(2) Commercial Banking, which includes Large Corporations, Financial Institutions, and the Public
Administration Sector;
(3) Other Segments, which groups all the operations that are not included in the other segments,
namely operations and management of the Bank’s Own Portfolio and Investments in Banks.
Geographically, Banco Popular operates exclusively in Portugal.
Segmental reporting is as follows:
Individual
30-06-2016Retail
Banking
Commercial
Banking
Other
SegmentsTotal
Interest and similar income 50 347 26 521 25 647 102 515
Interest and similar charges ( 18 515) ( 2 015) ( 15 459) ( 35 989)
Revenue from equity instruments - - 94 94
Fees and Commissions received 1 991 1 159 18 062 21 212
Fees and Commissions paid ( 267) ( 2) ( 2 425) ( 2 694)
Income from Financial Operations (net) 74 - 18 659 18 733
Income from the sale of other assets - - ( 6 023) ( 6 023)
Other Operating Income (net) 161 478 ( 8 035) ( 7 396)
Net assets 3 785 489 3 581 197 2 202 479 9 569 165
Liabilities 3 876 365 4 643 273 277 338 8 796 976
30-06-2015Retail
Banking
Commercial
Banking
Other
SegmentsTotal
Interest and similar income 58 633 30 099 25 056 113 788
Interest and similar charges ( 26 703) ( 2 468) ( 17 042) ( 46 213)
Revenue from equity instruments - - 62 62
Fees and Commissions received 7 505 4 532 9 518 21 555
Fees and Commissions paid ( 482) ( 1) ( 3 085) ( 3 568)
Income from Financial Operations (net) 17 - 787 804
Income from the sale of other assets - - 42 42
Other Operating Income (net) - - 46 804 46 804
Net assets 3 568 891 1 949 102 2 667 071 8 185 064
Liabilities 3 311 642 2 956 232 1 189 479 7 457 353

61
Interim Report and Accounts
Half Year 2016
Consolidated
30-06-2016Retail
Banking
Commercial
Banking
Other
SegmentsTotal
Interest and similar income 50 347 29 429 25 647 105 423
Interest and similar charges ( 18 515) ( 2 015) ( 15 459) ( 35 989)
Revenue from equity instruments - - 94 94
Fees and Commissions received 1 991 783 18 062 20 836
Fees and Commissions paid ( 267) ( 149) ( 2 425) ( 2 841)
Income from Financial Operations (net) 74 - 18 660 18 734
Income from the sale of other assets - - ( 6 023) ( 6 023)
Other Operating Income (net) 161 349 ( 8 035) ( 7 525)
Net assets 3 785 489 3 598 457 2 202 479 9 586 425
Liabilities 3 876 365 4 659 416 277 338 8 813 119
6. Net interest income
This item is broken down as follows:
7. Return on equity instruments
Balance for this item is as follows:
These amounts are similar to consolidated amounts given that the consolidated company does not
book any amount in this item.

62
Interim Report and Accounts
Half Year 2016
8. Revenue and expense with fees and commissions
These items are broken down as follows:
9. Net income from financial operations
This item is broken down as follows:
These amounts are similar to consolidated amounts given that the consolidated company does not
book any amount in this item.
During the first half of 2016, the Bank received 11.0 thousand euros in dividends from financial assets
held for trading (2015: 27.1 thousand euros). In 2016 and 2015 the Bank did not earn any income from
financial assets at fair value through profit or loss.
The effect seen in the item Hedging derivatives at fair value results from fluctuations in the fair value of
hedge instruments (interest rate swaps) and variations in the fair value of hedged assets, resulting
from the hedged risk (interest rate). Since the hedging instrument is accounted for in the Available-for-
sale financial assets portfolio, that variation in fair value is carried from Fair value revaluation reserve
to the income statement.

63
Interim Report and Accounts
Half Year 2016
10. Net gains from foreign exchange differences
These items are broken down as follows:
These amounts are similar to consolidated amounts given that the consolidated company does not
book any amount in this item.
11. Net gains from the sale of other assets
This item is broken down as follows:
These amounts are similar to consolidated amounts given that the consolidated company does not
book any amount in this item.
12. Other operating income
This item is broken down as follows:

64
Interim Report and Accounts
Half Year 2016
The amount in the capital gains item, in June 2015, is due to the income obtained from the sale of the
business unit in charge of managing real estate and credit exposures of customers associated with the
real estate sector from Banco Popular Portugal to Recbus - Recovery to Business, S.A. ('Recbus,
S.A.'), 20% owned by Banco Popular Español. This transaction implied the transference of the legal
status of employer in the employment contracts of this unit's employees, who are now employed by
Recbus, S.A. Also in this regard, several agreements have been signed, among which a service
rendering contract between the Bank and Recbus, S.A., for the management of the concerned assets
for a period of 10 years.
13. Personnel expenses
This item is broken down as follows:
14. Administrative overheads
This item is broken down as follows:
15. Income tax
Income tax for the first half of 2016 was calculated based on a nominal rate of 21% over the tax base
(21% in 2015). Both in 2016 and 2015, besides the nominal rate, a municipal surcharge of 1.5% was
also levied on taxable income, as well as a variable state surcharge that depended on the below
indicated tiers:

65
Interim Report and Accounts
Half Year 2016
In March 2016, Banco Popular Portugal, S.A., joined the Special Tax Framework for Groups of
Companies (Regime Especial de Tributação para Grupos de Sociedades - RETGS), having appointed
its sole shareholder, Banco Popular Español, S.A. (BPE), as the leading company in the tax group of
companies it owns in Portugal with a stake of 75% or higher, taking the responsibility for the fulfilment
of the obligations of the dominant company. The companies owned by BPE that comprise the
aforementioned tax group are the following: Popular Factoring, S.A.; Popular Gestão de Activos, S.A.;
Eurovida - Companhia de Seguros de Vida, S.A.; Popular Seguros - Companhia de Seguros, S.A.;
and Consulteam - Consultores de Gestão, Lda.
As at 30 June 2016, tax expenses on net profit, as well as the tax burden, measured by the relation
between income taxes and the profit for the year in the scope of RETGS may be summed up as
follows:
As at 30 June 2016 and 2015, tax expenses on individual net profit (excluding RETGS) attributed to
Banco Popular, S.A., as well as the tax burden, measured by the relation between income taxes and
the profit for the year before those taxes may be summed up as follows:
The reconciliation between the nominal tax rate and the tax burden for 2016 and 2015, as well as the
reconciliation between tax expense/income and the product of the individual accounting profit
multiplied by the nominal tax rate, after deferred tax, is analysed as follows:

66
Interim Report and Accounts
Half Year 2016
For additional information on deferred tax assets and liabilities see Note 28.
16. Financial assets and liabilities classified in accordance with IAS 39 categories
Classification of financial assets and liabilities in accordance with IAS 39 categories has the following
structure:

67
Interim Report and Accounts
Half Year 2016
31-12-2015 AccountsAvailable-for-sale Non-fin.
Trading Fair value op. receivablefinancial assets assets Total
Assets
Cash and balances w ith central banks 55 505
Deposits w ith banks 76 428
Financial assets held for trading 49 893
Other f in. assets at fair value thr. prof./loss
Available-for-sale f inancial assets 1 914 430
Loans and advances to banks 606 616
Loans and advances to customers 6 085 775
Non-current assets held for sale 1.055
Other assets 243 309 201 034
49 893 0 7 067 633 1 914 430 1 055 201 034
Booked at fair value
31-12-2015 Booked at fair value Other f inancial Hedging Non-fin.
Trading liabilities derivatives liabilities Total
Liabilities
Deposits from central banks 0
Deposits from banks 2 924 272 2 924 272
Financial liabilities held for trading 41 452 41 452
Deposits from customers 5 034 537 5 034 537
Debt securities issued 38 092 38 092
Hedging derivatives 121 337 121 337
Other liabilities 35 479 18 300 53 779
41 452 8 032 380 121 337 18 300 8 213 469
17. Cash and balances with Central Banks
The balance of this item is broken down as follows:
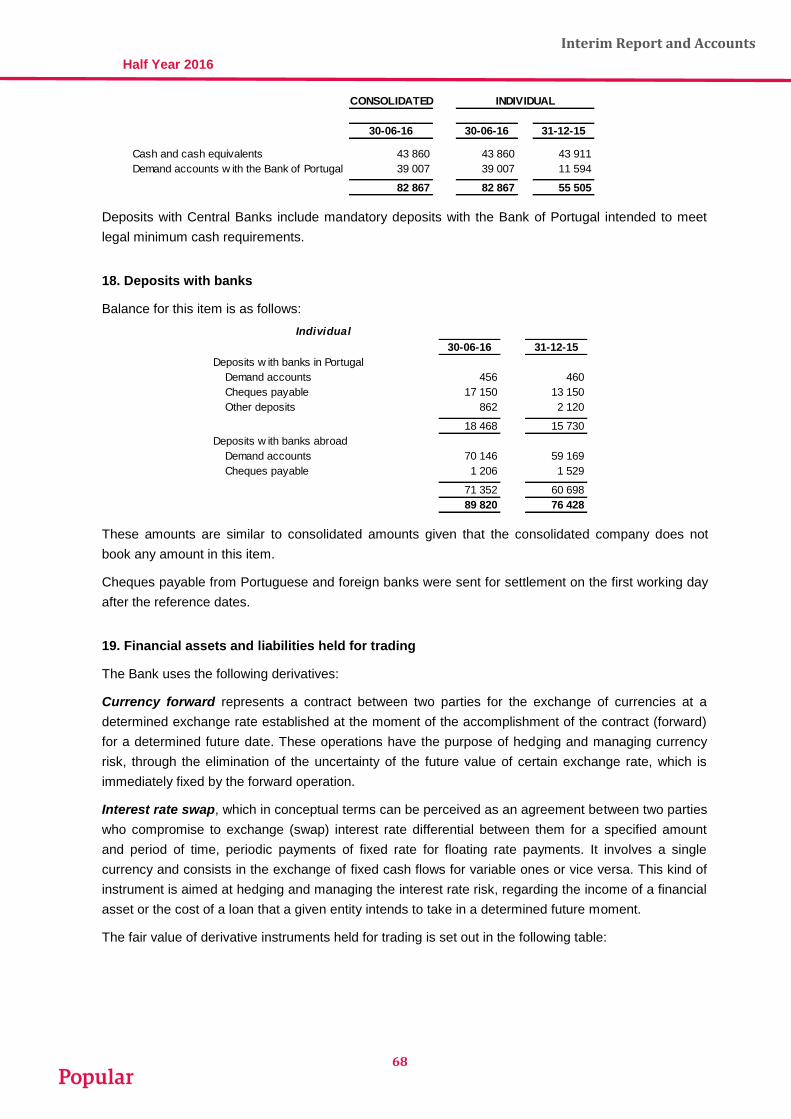
68
Interim Report and Accounts
Half Year 2016
CONSOLIDATED
30-06-16 30-06-16 31-12-15
Cash and cash equivalents 43 860 43 860 43 911
Demand accounts w ith the Bank of Portugal 39 007 39 007 11 594
82 867 82 867 55 505
INDIVIDUAL
Deposits with Central Banks include mandatory deposits with the Bank of Portugal intended to meet
legal minimum cash requirements.
18. Deposits with banks
Balance for this item is as follows:
Individual
30-06-16 31-12-15
Deposits w ith banks in Portugal
Demand accounts 456 460
Cheques payable 17 150 13 150
Other deposits 862 2 120
18 468 15 730
Deposits w ith banks abroad
Demand accounts 70 146 59 169
Cheques payable 1 206 1 529
71 352 60 698
89 820 76 428
These amounts are similar to consolidated amounts given that the consolidated company does not
book any amount in this item.
Cheques payable from Portuguese and foreign banks were sent for settlement on the first working day
after the reference dates.
19. Financial assets and liabilities held for trading
The Bank uses the following derivatives:
Currency forward represents a contract between two parties for the exchange of currencies at a
determined exchange rate established at the moment of the accomplishment of the contract (forward)
for a determined future date. These operations have the purpose of hedging and managing currency
risk, through the elimination of the uncertainty of the future value of certain exchange rate, which is
immediately fixed by the forward operation.
Interest rate swap, which in conceptual terms can be perceived as an agreement between two parties
who compromise to exchange (swap) interest rate differential between them for a specified amount
and period of time, periodic payments of fixed rate for floating rate payments. It involves a single
currency and consists in the exchange of fixed cash flows for variable ones or vice versa. This kind of
instrument is aimed at hedging and managing the interest rate risk, regarding the income of a financial
asset or the cost of a loan that a given entity intends to take in a determined future moment.
The fair value of derivative instruments held for trading is set out in the following table:

69
Interim Report and Accounts
Half Year 2016
31-Dez-2015
Contract value
(Notional amount) Assets Liabilities
Trading derivatives
a) Foreign currency derivatives
Currency forw ards 59 476 334 284
Currency Options 5 298 0 41
b) Interest rate derivatives
Interest rate sw aps 402 147 37 534 41 094
Options 47 498 33 33
Total derivatives held for trading (assets/liabilities) 37 901 41 452
Fair value
As at 30 June 2016, the fair value of other financial assets and liabilities held for trading was as
follows:
30-06-16 31-12-15
Other financial assets
Variable-income securities
Equity stakes 469 11 992
469 11 992
Total 469 11 992
Total financial assets held for trading 44 975 49 893
Total financial liabilities held for trading 47 835 41 452
These amounts are similar to consolidated amounts given that the consolidated company does not
book any amount in this item.
20. Investments in subsidiaries and associates
As at 30 June 2016, the Bank only held an equity stake in the associate company Eurovida -
Companhia de Seguros de Vida, S.A., booked for 20 243 thousand euros, net of impairment, which
was reclassified from non-current assets held for sale.
Effective
stake
Net
Assets
Shareholde
rs' EquityNet Profit
On
consolidation
reserves
On Net
Income
15,9348% 1 015 299 113 516 5 206 - 2 984 830
Consolidated Financial Results for
Eurovida at 30/06/2016
Impact of the application of
the equity method

70
Interim Report and Accounts
Half Year 2016
This reclassification results from the fact that IFRS 5 establishes the requirement that for an asset to be
classified as non-current its sale should be completed within a year from the date of the
reclassification, except as allowed in paragraph 9 of that standard, a situation that was not in effect at
the end of December 2015.
21. Available-for-sale financial assets
The balance of this item is broken down as follows:
30-06-16 31-12-15
Securities issued by residents
Government bonds - at fair value 224 063 45 117
Other debt securities - at fair value - -
Equity securities - at fair value 37 849 652
Equity stakes 46 538 46 500
308 450 92 269
Securities issued by non-residents
Government bonds - at fair value 865 787 758 407
Other debt securities - at fair value 261 677 1 063 678
Other securities 74 76
1 127 538 1 822 161
Total 1 435 988 1 914 430
These amounts are similar to consolidated amounts given that the consolidated company does not
book any amount in this item.
As at 30 June 2016, the Bank had no unlisted equity instruments classified as available-for-sale
financial assets, which, since their fair value cannot be reliably measured, were recognised as costs
(dec 2015: 0 thousand euros).
The Bank has in its available-for-sale financial assets portfolio an investment of 1 362 thousand euros
regarding subordinate bonds (Class D Notes) purchased in June 2002 associated with the
securitisation of home loans, in the amount of 250 million euros named Navigator Mortgage Finance
No. 1.
In the scope of that securitisation operation, assets were acquired by a loan securitisation fund
named Navigator Mortgage Finance No. 1, which simultaneously issued securitisation units fully
subscribed by Navigator Mortgage Finance No. 1 Plc, which also issued bonds with the following
characteristics:
Under the terms of the agreement that was signed the Bank did not assume any commitment
regarding cash availabilities of the issuer, as well as liquidity lines, credits, guarantees, rights and
residual profits, or any other risks, besides the Class D Notes.
Intervening entities:

71
Interim Report and Accounts
Half Year 2016
Navigator Mortgage Finance No. 1 Fundo, a Portuguese loan securitization fund that
purchased the loans;
Navigator, SGFTC, a loan securitisation fund manager that manages the fund;
Navigator Mortgage Finance No. 1 Plc, the company that purchased the securitization units
and issued the notes.
The most relevant financial data extracted from Navigator’s unaudited financial statements as at 30
June 2016 were as follows:
30-06-16 31-12-15 30-06-15
Net assets 44 615 47 401 50 887
Liabilities 51 641 54 154 57 441
Shareholders' equity (7 026) (6 753) (6 554)
Income for the period ( 273) ( 608) ( 410)
22. Loans and advances to banks
The nature of loans and advances to banks is as follows:
30-06-16 31-12-15
Loans and advances to banks in Portugal
Time deposits 34 37
Loans 9 050 10 000
Other 85 5
Interest receivable 0 0
9 169 10 042
Loans and advances to banks abroad
Time deposits 1 221 327 594 564
Reverse repurchase agreements 171 485 -
Other 3 133 1 937
Interest receivable 57 73
1 396 002 596 574
1 405 171 606 616
Set out below is a breakdown of loans and advances to banks by period to maturity:
30-06-16 31-12-15
Up to 3 months 1 399 929 475 137
From 3 months to 1 year 4 050 130 269
Over 5 years 1 134 1 137
Interest receivable 58 73
1 405 171 606 616
These amounts are similar to consolidated amounts given that the consolidated company does not
book any amount in this item.
23. Lending operations
Loans are granted via loan agreements, including overdraft facilities in demand accounts, and by the
discount of effects. Total amounts of loans and advances to customers in the balance sheet, by nature,
are as follows:

72
Interim Report and Accounts
Half Year 2016
CONSOLIDATED
30-06-16 30-06-16 31-12-15
Internal credit operations
Public sector 3 508 544 3 459 182 3 345 956
Private customers 2 014 737 2 014 737 1 945 814
Residential mortgage loans 1 637 707 1 637 707 1 568 480
Personal and consumer loans 30 700 30 700 32 211
Other personal lending 346 329 346 329 345 123
5 523 281 5 473 919 5 291 770
External credit operations
Public sector 31 381 30 722 29 322
Private customers 30 400 30 400 27 976
Residential mortgage loans 22 310 22 310 19 359
Personal and consumer loans 58 58 16
Other personal lending 8 032 8 032 8 601
61 781 61 122 57 298
Other loans (represented by securities) 380 251 380 251 355 677
Interest and commissions receivable - 861 - 496 3 270
Past-due loans and interest
Due w ithin 90 days 16 376 9 707 11 957
Over 90 days 390 409 386 978 365 803
406 785 396 685 377 760
Gross Total 6 371 237 6 311 481 6 085 775
Minus:
Customer loan impairment 357 316 352 567 383 288
357 316 352 567 383 288
Net total 6 013 921 5 958 914 5 702 487
INDIVIDUAL
As at 30 June 2016, credit operations included 882 905 thousand euros in mortgage loans assigned to
the issuance of mortgage bonds (dec 2015: 889775 thousand de euros) (Note 33).
Set out below is a breakdown of loans and advances to customers by period to maturity:
CONSOLIDATED
30-06-16 30-06-16 31-12-15
Up to 3 months 1 189 668 1 146 410 876 237
From 3 months to 1 year 987 036 980 273 692 505
1 to 5 years 1 650 328 1 650 328 1 300 943
Over 5 years 2 138 281 2 138 281 2 835 060
Undetermined maturity (past due) 406 785 396 685 377 760
Interest and commissions receivable ( 861) ( 496) 3 270
6 371 237 6 311 481 6 085 775
INDIVIDUAL
Provisions for customer loan losses
The balance of the provision account for specific credit risks is detailed in the following table:

73
Interim Report and Accounts
Half Year 2016
24. Held-to-maturity investments
In June 2013, the Bank sold 210 million of Spanish debt securities that were classified as held-to-
maturity investments. Due to this sale, and pursuant to IAS 39, at the end of June, the Bank
reclassified the remaining portfolio as available for sale without going through the profit or loss
account.
Still pursuant to IAS 39, the Bank may only hold held-to-maturity instruments in 2016.
25. Non-current assets held for sale
As at 30 June 2016, the Bank only held an equity stake in the associate company Eurovida -
Companhia de Seguros de Vida, S.A., booked for 20 243 thousand euros (dec 2015: 20243 thousand
euros).
This participation was reclassified in investments in subsidiaries and associates, see Note 20.
26. Other tangible assets
This item is broken down as follows:
31-12-2015
Art and Assets
Real estate Equipment antiques in progress Total Total
Balance as at 01 January
Acquisition cost 108 310 49 443 149 65 157 967 160 247
Accumulated depreciation (38 887) (48 173) - (87 060) (87 207)
Accumulated impairment (2 410) (2 410) (2 410)
Acquisitions 358 40 398 1 478
Transfers
Acquisition cost (1 502) ( 65) (1 567) (1 392)
Accumulated depreciation 277 277 702
Disposals / Write-offs
Acquisition cost - ( 7) ( 7) (2 366)
Accumulated depreciation - 7 7 2 364
Impairment depreciation - - 0
Depreciation for the year ( 878) ( 386) ( 2) (1 266) (2 919)
Balance as at 30 June
Acquisition cost 106 808 49 794 149 40 156 791 157 967
Accumulated depreciation (39 488) (48 552) ( 2) (88 042) (87 060)
Accumulated impairment (2 410) (2 410) (2 410)
Net amount 64 910 1 242 149 38 66 339 68.497
30-06-2016

74
Interim Report and Accounts
Half Year 2016
27. Intangible assets
This item is broken down as follows:
Individual
31-12-2015
Softw areMiscellaneous in progress Total Total
Balance as at 01 January
Acquisition cost 18 775 2 240 - 21 015 20 864
Accumulated depreciation (18 760) (2 109) - (20 869) (20 793)
Acquisitions 39 519 558 151
Transfers
Acquisition cost - -
Accumulated depreciation ( 76)
Depreciation for the year ( 26) ( 29) ( 55)
Balance as at 30 June
Acquisition cost 18 814 2 240 519 21 573 21 015
Accumulated depreciation (18 786) (2 138) - (20 924) (20 869)
Net amount 28 102 519 649 146
30-06-2016

75
Interim Report and Accounts
Half Year 2016
28. Deferred taxes
Deferred taxes are calculated in respect of all the temporary differences using an effective tax rate of
22.5%, except those regarding tax loss for which a 21% rate was used.
Balances for these items are as follows:

76
Interim Report and Accounts
Half Year 2016
29. Other assets
This item is detailed as follows: CONSOLIDATED
30-06-16 30-06-16 31-12-15
Recoverable government subsidies 91 91 77
Recoverable taxes 23 741 23 741 18 576
Pledge accounts 125 760 125 760 161 681
Other debtors 74 484 74 453 63 115
Other income receivable 261 261 328
Expenses w ith deferred charges 8 331 8 312 4 673
Asset operations pending settlement - Miscellaneous 19 676 20 979 29 367
Assets received in lieu of payment 190 836 190 836 197 650
Other tangible assets held for sale 1 574 1 574 958
Foreign exchange transactions to be settled 56 56 146
444 810 446 063 476 631
Impairment of assets received in lieu of payment (30 052) (30 052) (31 324)
Impairment of other tangible assets held for sale ( 376) ( 376) ( 367)
Provisions for other assets (5 512) (5 512) (2 905)
408 870 410 123 442 035
INDIVIDUAL
Balances and movements in the accounts of Provisions for other assets are as follows:
CONSOLIDATED
Provisions for other assets 30-06-16 30-06-16 31-12-15
Balance as at 1 January 2 905 2 905 1 313
Appropriations 2 607 2 607 7 237
Used - - 5 000
Cancelled - - 278
Balance as at 30 June 5 512 5 512 3 272
INDIVIDUAL
Movements in the account Assets received in lieu of payment in 2016 were as follows: 31-12-2015
Available-
for-sale
properties
Properties
not available
for sale
Equipment Total Total
Balance as at 01 January
Gross amount 193 034 4 109 506 197 649 145 921
Accumulated impairment (30 285) ( 998) ( 41) (31 324) (27 804)
Net amount 162 749 3 111 465 166 325 118 117
Additions
Acquisitions 46 638 4 377 77 51 092 88 093
Other 2 263 - - 2 263 1 246
Disposals
Gross amount (59 907) - ( 116) (60 023) (37 236)
Transfers 513 ( 658) - ( 145) ( 375)
Impairment losses (6 932) - ( 45) (6 977) (6 920)
Used 6 002 - 62 6 064 1 266
Reversed 2 183 - 2 2 185 2 134
Balance as at 31 December
Gross amount 182 541 7 828 467 190 836 197 649
Accumulated impairment (29 032) ( 998) ( 22) (30 052) (31 324)
Net amount 153 509 6 830 445 160 784 166 325
30-06-2016
These amounts are similar to consolidated amounts given that the consolidated company does not
book any amount in this item.

77
Interim Report and Accounts
Half Year 2016
30. Deposits from central banks
The bank doesn’t have resources in central banks both in individual and considated terms
These amounts are similar to consolidated amounts given that the consolidated company does not
book any amount in this item.
31. Deposits from banks
The balance of this item, spot and forward, is composed as follows in terms of nature:
Individual
30-06-16 31-12-15
Recursos de instituições de crédito no país
Depósitos 202 577 482 774
Juros a pagar 332 596
202 909 483 370
Recursos de instituições de crédito no estrangeiro
Empréstimos 106 250 106 250
Depósitos 2 391 527 1 539 470
Oper. venda com acordo recompra 992 211 794 379
Outros recursos 231 5
Juros a pagar 1 184 798
3 491 403 2 440 902
3 694 312 2 924 272
These amounts are similar to consolidated amounts given that the consolidated company does not
book any amount in this item.
The item International credit institutions - Deposits includes essentially deposits made by the
shareholder BPE.
In terms of residual maturity, these funds are broken down as follows:
30-06-16 31-12-15
Spot 36 017 16 199
Forw ard
Up to 3 months 2 406 757 1 162 837
From 3 months to 1 year 843 772 1 693 842
1 to 5 years 206 250 50 000
Over 5 years 200 000 -
Interest payable 1 516 1 394
3 658 295 2 908 073
3 694 312 2 924 272
32. Customer funds
The balance of this item is composed as follows in terms of nature:

78
Interim Report and Accounts
Half Year 2016
CONSOLIDATED
30-06-16 30-06-16 31-12-15
Resident funds
Demand accounts 1 382 133 1 384 284 1 102 703
Time deposits 3 300 062 3 300 062 3 772 675
Savings accounts 5 799 5 799 6 386
Cheques payable 6 973 6 973 4 328
Other funds 22 22 9
4 694 989 4 697 140 4 886 101
Non-resident funds
Demand accounts 50 141 50 141 36 811
Time deposits 61 804 61 804 95 122
Cheques payable 573 573 0
112 518 112 518 131 933
Interest payable 13 161 13 161 16 503
4 820 668 4 822 819 5 034 537
INDIVIDUAL
In terms of residual maturity, these funds are broken down as follows:
CONSOLIDATED
30-06-16 30-06-16 31-12-15
Spot 1 432 275 1 434 426 1 139 515
Forw ard
Up to 3 months 1 239 932 1 239 932 1 599 448
From 3 months to 1 year 1 603 094 1 603 094 1 632 538
1 to 5 years 532 126 532 126 645 725
Over 5 years 80 80 808
Interest payable 13 161 13 161 16 50316 502 533 16 502 533 ########
3 388 393 3 388 393 3 895 022
4 820 668 4 822 819 5 034 537
INDIVIDUAL
33. Debt securities issued
The balance of this item is broken down as follows:
30-06-16 31-12-15
Bonds 2 000 2 383
Euro Medium Term Note 24 536 35 167
Interest payable 989 542
27 525 38 092
These amounts are similar to consolidated amounts given that the consolidated company does not
book any amount in this item.
During 2010, Banco Popular Portugal constituted a Mortgage Bond Issuance Programme whose
maximum amount is 1 500 million euros. Within the scope of this programme, the Bank made six
mortgage bond issuances in the total amount of 1 330 million euros.
On 30 June 2016, the 5th Series (290 million euros), the 6
th Series (225 million) euros, and the 7
th
Series (300 million euros) were booked in the balance sheet.

79
Interim Report and Accounts
Half Year 2016
On 31 December 2015, , the 5th Series (290 million) euros, the 6
th Series (225 million euros) and the
7th Series (300 million euros) were booked in the balance sheet. This last issuance was fully
repurchased by the Bank.
These bonds are covered by a group of residential mortgage loans and other assets that have been
segregated as autonomous equity in the Bank’s accounts, therefore grating special credit privileges to
the holders of these securities over any other creditors. The conditions of the aforementioned
issuances are in accordance with Decree-law No. 59/2006, and Notices Nos.5/2006, 6/2006, 7/2006
and 8/2006 and Instruction No. 13/2006 issued by the Bank of Portugal.
On 30 June 2016, the characteristics of these issuances were the following:
On 30 June 2016, autonomous equity assigned to these issuances amounted to 883 628 thousand
euros (dec 2015: 890993 thousand de euros) (see Note 23).
During 2011, Banco Popular Portugal constituted a Euro Medium Term Notes Issuance Programme
whose maximum amount is 2.5 billion euros. In the scope of this programme, the Bank has already
carried out 36 issuances and as at 30 June 2016, its balance was broken down as follows:
34. Hedging derivatives
The item hedging derivatives is composed as follows:
Notional Notional
Amount Assets Liabilities Amount Assets Liabilities
Interest rate contracts
Sw aps 792 000 0 75 761 1 370 000 1 055 121 337
30-06-2016 31-12-2015
Carrying amountCarrying amount
As referred to previously, the Bank covers part of its interest rate risk, resulting from any possible
decrease in the fair value of fixed interest rate assets, using interest rate swaps. On 30 June 2016, the
net fair value of hedging interest rate swaps (see above) and trading swaps was negative (see Note
19) in the amount of -80 182 thousand euros (dec015: -123843 thousand euros).
Fluctuations in the fair value associated with hedged assets and their respective hedging derivatives
are registered in the income statement under item Net income from financial operations (see Note 9).
35. Other provisions
Balances and movements for the Provisions account were as follows:
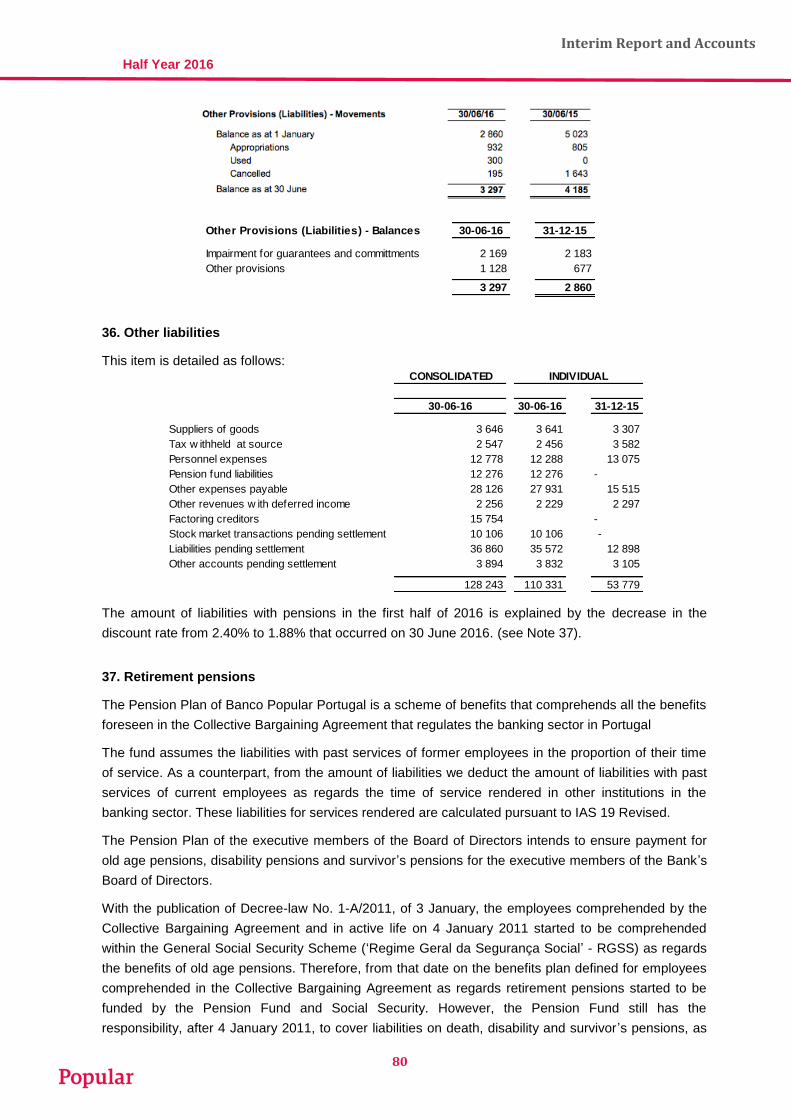
80
Interim Report and Accounts
Half Year 2016
Other Provisions (Liabilities) - Balances 30-06-16 31-12-15
Impairment for guarantees and committments 2 169 2 183
Other provisions 1 128 677
3 297 2 860
36. Other liabilities
This item is detailed as follows: CONSOLIDATED
30-06-16 30-06-16 31-12-15
Suppliers of goods 3 646 3 641 3 307
Tax w ithheld at source 2 547 2 456 3 582
Personnel expenses 12 778 12 288 13 075
Pension fund liabilities 12 276 12 276 -
Other expenses payable 28 126 27 931 15 515
Other revenues w ith deferred income 2 256 2 229 2 297
Factoring creditors 15 754 -
Stock market transactions pending settlement 10 106 10 106 -
Liabilities pending settlement 36 860 35 572 12 898
Other accounts pending settlement 3 894 3 832 3 105
128 243 110 331 53 779
INDIVIDUAL
The amount of liabilities with pensions in the first half of 2016 is explained by the decrease in the
discount rate from 2.40% to 1.88% that occurred on 30 June 2016. (see Note 37).
37. Retirement pensions
The Pension Plan of Banco Popular Portugal is a scheme of benefits that comprehends all the benefits
foreseen in the Collective Bargaining Agreement that regulates the banking sector in Portugal
The fund assumes the liabilities with past services of former employees in the proportion of their time
of service. As a counterpart, from the amount of liabilities we deduct the amount of liabilities with past
services of current employees as regards the time of service rendered in other institutions in the
banking sector. These liabilities for services rendered are calculated pursuant to IAS 19 Revised.
The Pension Plan of the executive members of the Board of Directors intends to ensure payment for
old age pensions, disability pensions and survivor’s pensions for the executive members of the Bank’s
Board of Directors.
With the publication of Decree-law No. 1-A/2011, of 3 January, the employees comprehended by the
Collective Bargaining Agreement and in active life on 4 January 2011 started to be comprehended
within the General Social Security Scheme (‘Regime Geral da Segurança Social’ - RGSS) as regards
the benefits of old age pensions. Therefore, from that date on the benefits plan defined for employees
comprehended in the Collective Bargaining Agreement as regards retirement pensions started to be
funded by the Pension Fund and Social Security. However, the Pension Fund still has the
responsibility, after 4 January 2011, to cover liabilities on death, disability and survivor’s pensions, as

81
Interim Report and Accounts
Half Year 2016
well as the old age complement in order to match the retirement of the participants in the Pension
Fund to the amounts of the current pension plan.
According to guidelines derived from the Note issued on 26 January 2011 by the National Council of
Financial Supervisors, the Bank has kept with reference to 31 December 2010 the recognition and
measurement method for past services of active employees regarding the events transferred to the
RGSS used in previous years.
In accordance with Decree-law No. 127/2011 of 31 December, Banco Popular Portugal transferred to
Social Security the liabilities for pensions in payment on 31 December 2011, as well as the part of the
assets contained in the pension fund that already covered such liabilities. The liabilities transferred
amounted to 6.3 million euros and have already been fully paid (55% in December 2011 and 45% in
March 2012).
This transference was booked in the income statement in the amount of 795 thousand euros due to
the allocation of the proportional part of accumulated actuarial gains/losses and the actuarial
gains/losses originated by the difference in actuarial assumptions used for the calculation of the
transferred liabilities. In accordance with Decree-law No. 127/2011 of 31 December, this amount shall
be deductible for effects of determining taxable profit, in equal parts, from the fiscal year started on 1
January 2012, regarding the average of the number of years of life expectancy of the pensioners
whose responsibilities have been transferred. The respective deferred taxes have been on the amount
recognised in the year's net income.
Until 31 December 2012, the Bank recognized the net accumulated amount (after 1 January 2004) of
actuarial gains and losses resulting from changes in the financial and actuarial assumptions and
differences between the financial and actuarial assumptions used and the actual amounts in the item
'Other Assets or Other Liabilities – Actuarial gains/losses'. Accumulated actuarial gains or losses that
did not exceed 10% of the highest of the current value of liabilities for past services or the value of the
pension funds were included in the 'corridor'. Actuarial gains/losses in excess of the corridor were
recognised against results over the average remaining period of service of the employees covered by
the plan.
As at 1 January 2013 Banco Popular changed its accounting policy of recognising financial and
actuarial gains and losses for pension plans and other defined benefit post-employment benefits
pursuant to IAS 19 Revised. Financial and actuarial gains and losses are now recognised in the period
they occur directly in equity in the Statement of Comprehensive Income.
On 30 June 2016, the number of participants in the fund was 1 107 (dec 2015: 1 111. On this date,
there were 49 retired people and 24 pensioners, and the remaining employees were active.
Current amount of Liabilities
The liabilities assumed for retirement and survivor’s pensions are as follows:
Past Services 30-06-16 31-12-15
Obligations at the beginning of the period 163 299 154 196
Service expenses 1 243 2 781
Interest expense 1 922 3 756
Pensions paid ( 783) ( 1 307)
Actuarial deviations 9 799 3 813
Obligations as at 30 June 175 480 163 239

82
Interim Report and Accounts
Half Year 2016
Every year the Bank determines the amount of liabilities for past services using actuarial calculations
based on the Project Unit Credit method for liabilities for past services in the case of old age and the
Unique Successive Premium to calculate disability and survivor’s benefits. The discount rate is
determined based on market rates for high quality corporate bonds, with periods to maturity similar to
those for settlement of pension liabilities.
In 2015, those showed a significant reduction with subsequent impact on actuarial gains and losses
and on the obligations for services rendered.
Obligations for survival and disability, foreseen in the Collective Bargaining Agreement and insurable
are covered by the subscription of a multi-protection life insurance policy for the population at stake,
except for those whose urgency of disability or survival is considered unfit to insure.
This is an annual renewable temporary contract in which the Insurance company guarantees the
Pension Fund of Banco Popular Portugal, S.A., in case of death or disability assessed at 66% or more
according to the National Table for Disability, for any of the people comprehended within the insured
group, the payment of the hired premiums.
This insurance contract was signed with Eurovida - Companhia de Seguros de Vida S.A., an insurance
company that is an associate of Banco Popular Portugal, S.A.
Equity Amount of the Fund
The movements occurred in the total amount of the pension fund were as follows:
Equity amount of the Fund 30-06-16 31-12-15
Amount at the beginning of the period 163 299 154 305
Contributions paid
Employer 0 11 300
Employees 386 766
Return on Fund assets 1 249 627
Pensions paid ( 783) ( 1 307)
Other net differences ( 946) ( 2 392)
Amount of the Fund as at 30 June 163 205 163 299
Current obligations for past services 175 480 163 239
Coverage level 93,0% 100,0%
Evolution of Liabilities and Total Amount of the Fund
The evolution of liabilities and the total amount of the pension fund in the past five years was as
follows:
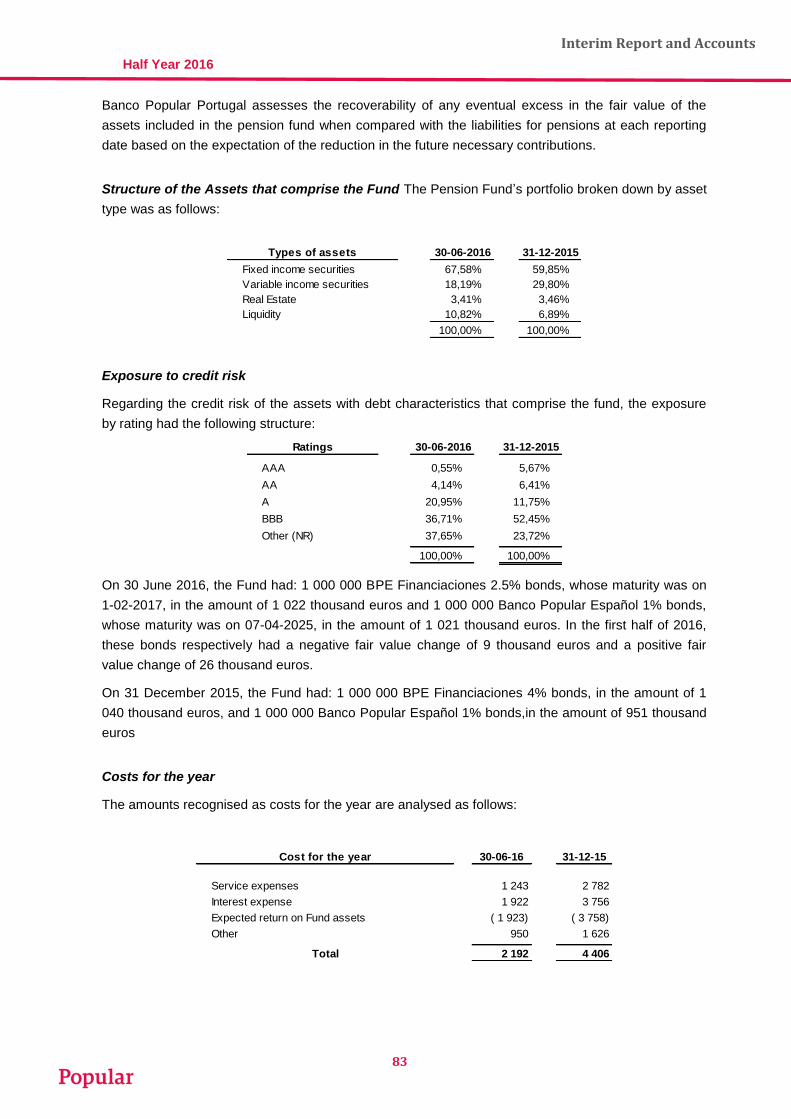
83
Interim Report and Accounts
Half Year 2016
Banco Popular Portugal assesses the recoverability of any eventual excess in the fair value of the
assets included in the pension fund when compared with the liabilities for pensions at each reporting
date based on the expectation of the reduction in the future necessary contributions.
Structure of the Assets that comprise the Fund The Pension Fund’s portfolio broken down by asset
type was as follows:
Types of assets 30-06-2016 31-12-2015
Fixed income securities 67,58% 59,85%
Variable income securities 18,19% 29,80%
Real Estate 3,41% 3,46%
Liquidity 10,82% 6,89%
100,00% 100,00%
Exposure to credit risk
Regarding the credit risk of the assets with debt characteristics that comprise the fund, the exposure
by rating had the following structure:
Ratings 30-06-2016 31-12-2015
AAA 0,55% 5,67%
AA 4,14% 6,41%
A 20,95% 11,75%
BBB 36,71% 52,45%
Other (NR) 37,65% 23,72%
100,00% 100,00%
On 30 June 2016, the Fund had: 1 000 000 BPE Financiaciones 2.5% bonds, whose maturity was on
1-02-2017, in the amount of 1 022 thousand euros and 1 000 000 Banco Popular Español 1% bonds,
whose maturity was on 07-04-2025, in the amount of 1 021 thousand euros. In the first half of 2016,
these bonds respectively had a negative fair value change of 9 thousand euros and a positive fair
value change of 26 thousand euros.
On 31 December 2015, the Fund had: 1 000 000 BPE Financiaciones 4% bonds, in the amount of 1
040 thousand euros, and 1 000 000 Banco Popular Español 1% bonds,in the amount of 951 thousand
euros
Costs for the year
The amounts recognised as costs for the year are analysed as follows:
Cost for the year 30-06-16 31-12-15
Service expenses 1 243 2 782
Interest expense 1 922 3 756
Expected return on Fund assets ( 1 923) ( 3 758)
Other 950 1 626
Total 2 192 4 406

84
Interim Report and Accounts
Half Year 2016
Actuarial gains and losses
The amount of actuarial gains and losses as at 30 June 2016 and 31 December 2015 is broken down
as follows:
Actuarial gains and losses 30-06-16 31-12-15
Actuarial gains/losses as at 1 January ( 35 629) ( 28 686)
Actuarial losses for the year - obligations ( 9 860) ( 3 812)
Actuarial gains for the year - Fund ( 674) ( 3 131)
Actuarial gains/losses ( 46 163) ( 35 629)
Actuarial assumptions
The main actuarial and financial assumptions used were as follows:
Assump. Real Assump. Real
Discount rate 1,88% 1,88% 2,33% 2,40%
Expected return rate on Fund assets 1,88% 1,56% 2,33% 0,46%
Salaries and other benefits grow th rate 0,75% 0,0% 0,8% 0,0%
Pensions grow th rate 0,5% 0,0% 0,5% 0,0%
Mortality table TV 88/90 TV 88/90
Disability table ERC Frankona ERC Frankona
Turnover n.a. n.a. n.a. n.a.
30-06-16 31-12-15
Gains and losses arising from experience adjustments and changes in actuarial assumption are
recognised in other comprehensive income in Retained Earnings in the period they occur.
Sensitivity analysis to the Main Assumptions that contribute to the liabilities amount
Taking into consideration the most significant impacts on the amount of liabilities, we have performed a
sensitivity analysis through a positive and negative fluctuation in the main assumptions that contribute
to the amount of the liabilities, whose impact is analysed as follows:
The sensitivity analyses above are based on the change in a given assumption, keeping all other
assumptions equal. In practice, that is very unlikely to occur given the correlations that exist between
the several assumptions. When calculating the sensitivity of the amount of liabilities for significant
actuarial assumptions we applied the same methods used to calculate the positions in the Balance
Sheet.
The methodology used to perform the sensitivity analysis remained unchanged from the previous year.
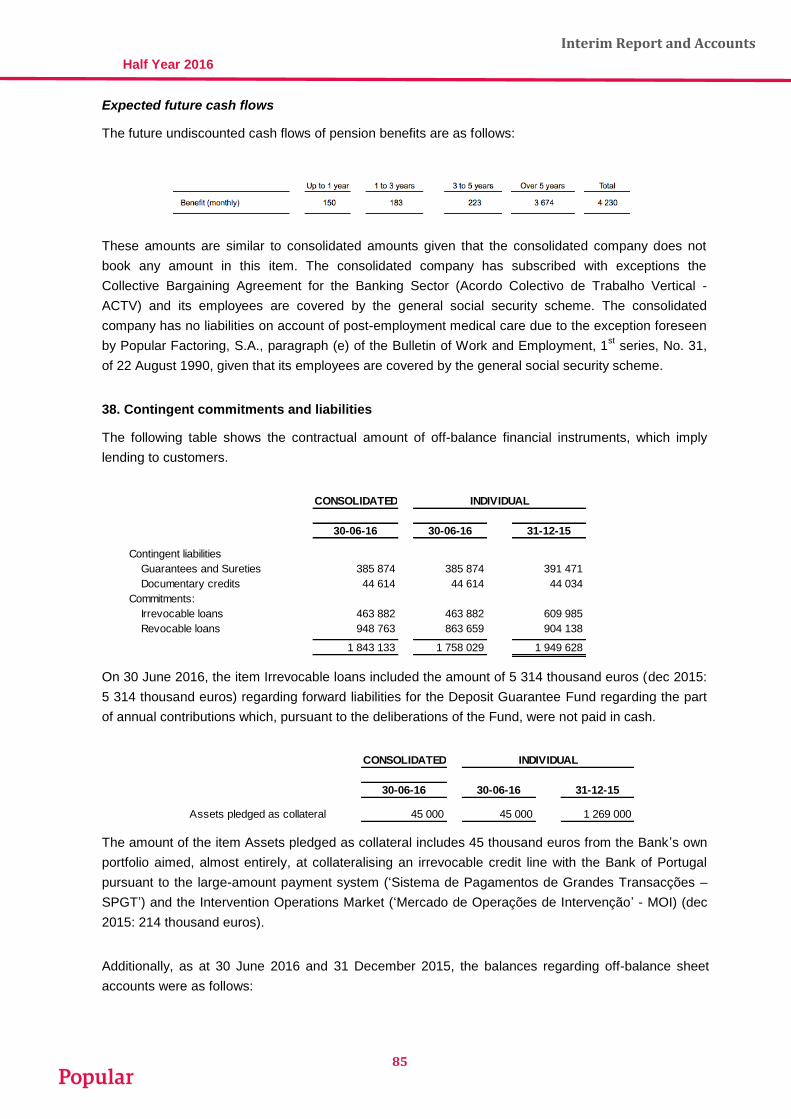
85
Interim Report and Accounts
Half Year 2016
Expected future cash flows
The future undiscounted cash flows of pension benefits are as follows:
These amounts are similar to consolidated amounts given that the consolidated company does not
book any amount in this item. The consolidated company has subscribed with exceptions the
Collective Bargaining Agreement for the Banking Sector (Acordo Colectivo de Trabalho Vertical -
ACTV) and its employees are covered by the general social security scheme. The consolidated
company has no liabilities on account of post-employment medical care due to the exception foreseen
by Popular Factoring, S.A., paragraph (e) of the Bulletin of Work and Employment, 1st series, No. 31,
of 22 August 1990, given that its employees are covered by the general social security scheme.
38. Contingent commitments and liabilities
The following table shows the contractual amount of off-balance financial instruments, which imply
lending to customers.
CONSOLIDATED
30-06-16 30-06-16 31-12-15
Contingent liabilities
Guarantees and Sureties 385 874 385 874 391 471
Documentary credits 44 614 44 614 44 034
Commitments:
Irrevocable loans 463 882 463 882 609 985
Revocable loans 948 763 863 659 904 138
1 843 133 1 758 029 1 949 628
INDIVIDUAL
On 30 June 2016, the item Irrevocable loans included the amount of 5 314 thousand euros (dec 2015:
5 314 thousand euros) regarding forward liabilities for the Deposit Guarantee Fund regarding the part
of annual contributions which, pursuant to the deliberations of the Fund, were not paid in cash.
CONSOLIDATED
30-06-16 30-06-16 31-12-15
Assets pledged as collateral 45 000 45 000 1 269 000
INDIVIDUAL
The amount of the item Assets pledged as collateral includes 45 thousand euros from the Bank ’s own
portfolio aimed, almost entirely, at collateralising an irrevocable credit line with the Bank of Portugal
pursuant to the large-amount payment system (‘Sistema de Pagamentos de Grandes Transacções –
SPGT’) and the Intervention Operations Market (‘Mercado de Operações de Intervenção’ - MOI) (dec
2015: 214 thousand euros).
Additionally, as at 30 June 2016 and 31 December 2015, the balances regarding off-balance sheet
accounts were as follows:

86
Interim Report and Accounts
Half Year 2016
CONSOLIDATED
30-06-16 30-06-16 31-12-15
Deposit and custody of securities 5 615 124 5 615 124 5 166 509
Amounts received for collection 93 135 86 593 84 630
5 708 259 5 701 717 5 251 139
INDIVIDUAL
39. Share capital and share premium
As at 30 June 2016, the Bank’s share capital was represented by 513 000 thousand shares with the
nominal value of 1 euro each, which was subscribed and fully paid by Banco Popular Español, S.A. On
4 April 2016, a share capital increase in the amount of 37 000 000 euros was approved, through the
issuance of 37 000 thousand shares with the nominal value of 1 euro each, subscribed and paid by
Banco Popular Español, S.A., by delivering 2 495 631 Popular Factoring, S.A., shares with a nominal
value of 5 euros each.
As at 31 December 2015, the Bank’s share capital was represented by 476 000 thousand shares with
the nominal value of 1 euro each, which was subscribed and fully paid by Banco Popular Español, S.A.
The amount recognised in item Share premiums originated in the premiums paid by shareholders in
the share capital increases made in 2000, 2003 and 2005.
40. Fair value reserves
The movements in this account are detailed on the following table:
30-06-16 31-12-15
Revaluation reserves and Fair Value
Available-for-sale investments
Net balance as at 1 January 1 722 (2 981)
Revaluation at fair value (21 615) 6 083
Deferred taxes 4 863 (1 380)
Balance as at 30 June (15 030) 1 722
Balance as at 30 June (15 030) 1 722
Revaluation reserves regarding available-for-sale assets result from the adequacy to the fair value of
the securities in the Bank’s portfolio. These balances shall be reversed through the income statement
at the time the securities that originated them are disposed of or in case there is any impairment.
The revaluation reserve regarding the adequacy to fair value of tangible assets for own use is related
to the property on Rua Ramalho Ortigão (Note 26).
The revaluation reserve for tangible assets calculated in accordance with Decree-law No. 31/98 shall
only be moved when it is considered realized, total or partially, and pursuant to the following priorities:
(i) To correct any excess found on the date of the revaluation between the net book value of the
elements being revalued and their current real value;
(ii) To absorb accumulated loss until the revaluation date, inclusively;
(iii) To incorporate in the share capital for the remaining part.

87
Interim Report and Accounts
Half Year 2016
41. Other reserves and retained earnings
The balances of the accounts for other reserves and retained earnings are analysed as follows:
30-06-16 31-12-15
Statutory reserve 36 785 35 450
Other reserves 304 708 292 699
Retained earnings ( 87 219) ( 107 362)
254 274 220 787
INDIVIDUAL
Movements in the items reserves and retained earnings were as follows:
30-06-16 31-12-15
Statutory reserve
Balance as at 1 January 35 450 35 221
Transf. Retained earnings 1 335 229
Balance as at 30 June 36 785 35 450
Other reserves
Balance as at 1 January 292 699 290 622
Transf. Retained earnings 12 009 2 054
Transf. Revaluation reserves - 23
Balance as at 31 December 304 708 292 699
Retained earnings
Balance as at 1 January ( 115 688) ( 108 745)
Net income for the previous year 13 343 2 283
Actuarial gains/losses of the Pension Fund ( 10 534) ( 6 943)
Accounting change due to the revocation of Notice 3/95 39 004 8 326
Transf. to statutory reserve ( 1 335) ( 229)
Transf. to other reserves ( 12 009) ( 2 054)
Balance as at 30 June ( 87 219) ( 107 362)
254 274 220 787
INDIVIDUAL
- Statutory Reserve
The statutory reserve can only be used to absorb accumulated losses or to increase share capital.
Portuguese legislation applicable to the banking sector (Article 97 of Decree-Law No. 298/92 of 31
December) requires that at least 10% of the profit for the year be transferred to the statutory reserve
until it is equal to the share capital.
The individual values are similar to the consolidated, as the society doesn’t have any values in this
item
42. Personnel expenses
The number of employees of the Bank according to their professional category was as follows:

88
Interim Report and Accounts
Half Year 2016
Consolidated
30-06-16 30-06-16 31-12-15
Directors 104 101 81
Management 389 384 378
Technical personnel 503 503 493
Clerical staff 187 171 210
1 183 1 159 1 162
Individual
43. Remunerations of the governing bodies and the personnel with responsibility over risk
taking and control
As at 30 June 2016, the annual amounts earned by the members of the Board of Directors and the
Supervisory Board are detailed, individually and in group, on the following table:
The remunerations earned and the number of employees who have responsibilities in terms of risk
taking regarding the Bank or its customers as well as those who assume control functions pursuant to
Notice 5/2008 issued by the Bank of Portugal are detailed below:
44. Remuneration of the Statutory Auditor
The amounts paid to the Audit Firm PricewaterhouseCoopers in the first half of 2016 and in the first
half of 2015 were:

89
Interim Report and Accounts
Half Year 2016
45. Relationship with related companies
As at 30 June 2016 and 2015, the amounts payable and receivable regarding related companies
was as follows:
30-06-16 30-06-15 30-06-16 30-06-15 30-06-16 30-06-15 30-06-16 30-06-15
Consulteam, Lda - - 35 723 12 546 360 377 - -
Eurovida, SA 2 007 4 055 69 032 53 000 1 674 1 339 932 1 339
Popular Gestão de Activos, SA 99 111 1 583 2 403 816 893 36 13
Popular Factoring, SA 99 071 93 368 - - 1 117 925 90 166
Imopopular Fundo Especial I.I. 20 3 784 376 221 16 49 - -
Popular Arrendamento 3 0 10 730 6 978 22 26 9 10
Popular Seguros, SA - 0 635 1 068 371 360 - -
Popular Predifundo - 466 - 1 - 11 - -
SPE-Special Pourpuse Entities 1 272 1 437 - - 337 251 - -
102 472 103 221 82 356 76 217 4 353 4 231 1 067 1 528
Banco Popular Español, SA 1 580 579 212 535 3 522 746 1 759 068 60 361 61 632 112 729 80 388
Credit Debit Income Expense
31-12-15 31-12-14 31-12-15 31-12-14 31-12-15 31-12-14 31-12-15 31-12-14
Eurovida, SA 2 002 4 004 58 605 117 668 4 201 5 971 2 317 6 096
Popular Gestão de Activos, SA 111 119 1 524 2 572 1 775 1 931 23 8
Popular Factoring, SA 98 303 87 321 - 35 1 816 2 195 315 267
Imopopular Fundo Especial I.I. 2 716 4 039 66 2 86 238 - -
Popular Arrendamento 4 4 13 612 5 061 52 91 24 273
Popular Seguros, SA - - 775 680 701 748 - -
Popular Predifundo 3 228 1 065 1 - 57 75 - -
SPE-Special Pourpuse Entities 1 221 1 621 - - 1 062 810 - -
Consulteam, Lda - - 47 722 5 078 740 674 - -
107 585 98 173 122 305 131 096 10 490 12 733 2 679 6 644
Banco Popular Español, SA 802 137 423 029 2 497 710 2 028 211 94 611 86 299 150 099 150 293
Credit Debit Income Expense
As at 30 June 2016, the guarantees pledged by the Bank to related companies amounted to 78 150
thousand euros (dec 2015: 76196 thousand euros).
As at 30 June 2016, the Bank received deposits from BPE to guarantee the risk associated with loans
granted by the Bank in the amount of 49 404 thousand euros (dec 2015: 98690 thousand euros).
Transactions with related companies are based on common market conditions.
As at 30 June 2016, the members of the Bank's Board of Directors did not hold any deposits with
Banco Popular and had loans, granted before they were appointed, in the total amount of 239
thousand euros.
46. Cash and cash equivalents
For effects of the cash flow statement, Cash and cash equivalents include the following balances with
maturity of less than 90 days:

90
Interim Report and Accounts
Half Year 2016
Consolidated
30-06-16 30-06-16 31-12-15
Cash (Note 18) 43 859 43 859 43 914
Cash and balances w ith banks (note 18) 89 820 89 820 76 428
Deposits w ith banks w ith maturities of less than 3 months 1 399 930 1 399 930 475 135
1 533 609 1 533 609 595 477
Individual
47. Measurement of portfolio impairment and respective disclosures (Circular Letter No.
02/2014/DSP issued by the Bank of Portugal)
Qualitative disclosures:
a) Credit risk management policy.
The Bank is exposed to credit risk, which is the possible loss that arises when the Bank’s counterparts
fail to fulfil their obligations. In the case of refundable financing it arises as a consequence of the non-
recovery of principal, interest and commissions, regarding amount, period and other conditions
stipulated in the contracts. Concerning off-balance sheet risks, it derives from the non-compliance of
the counterparts regarding their obligations with third parties, which implies that the Bank has to
assume as its own certain obligations depending on the contracts.
The Bank structures the levels of credit risk it is exposed to by establishing pre-defined acceptable
risk limits regarding the borrower or group of borrowers and geographical or business activity
segments.
Exposure to credit risk is managed through a regular analysis of the capacity of borrowers and
potential borrowers of meeting payment obligations for principal and interest, and by changing these
credit limits when appropriate. Exposure to credit risk is also managed in part by obtaining collaterals
and personal or corporate guarantees.
Collaterals
The Bank employs a series of policies and practices in order to mitigate credit risk. The most
traditional one is securing collaterals at the moment funds are advanced. The Bank implements
guidelines regarding the acceptability of specific classes of collaterals or mitigation of credit risk. The
main types of collaterals for loans and receivables are the following:
- Property mortgages;
- Pledges of operations made within the Bank;
- Pledges on assets such as premises, inventory and accounts receivable;
- Pledges on financial instruments, such as securities and shares.
Long-term loans to corporate and private customers usually require a collateral; lower amounts and
recurring personal loans generally require no collateral. Additionally, with the intention of minimising
loss, at the time an impairment indicator for loans and receivables is identified the Bank tries to obtain
additional collaterals from the relevant counterparties.
Collaterals held for financial assets, except for loans and advances, are determined by the nature of
the instrument. Treasury bonds and other debt instruments usually are not collateralised.

91
Interim Report and Accounts
Half Year 2016
Lending commitments
The main objective of these instruments is to ensure that funds are made available to customers as
they require them. Loan extension commitments represent non-utilized parts of credit extension
authorizations in the form of loans, guarantees or letters of credit. Regarding the credit risk associated
with loan extension commitments, the Bank is potentially exposed to a loss in the amount of the total
of non-utilized commitments. However, the probable loss amount is much lower than the sum of the
non-utilized commitments since loan extension commitments are revocable and depend on a specific
customer’s credit worthiness. The Bank monitors the maturity of lending commitments since long-term
commitments usually present a greater credit risk than short-term commitments.
Concentration Risk
Concentration risk is managed and monitored by Risk Management that also ensures that adequate
policies and procedures are maintained and implemented to monitor and manage credit concentration
risk. It is also in charge of monitoring delegated powers in terms of concentration risk and periodically
presents reports on concentration risk to the Board of Directors.
The Bank has defined a structure of limits aimed at maintaining an exposure level in line with its risk
profile and an adequate diversification of its loan portfolio.
The limits currently approved for credit concentration risk are the following:
i) Risk limit for a Group/Customer
Pursuant to the delegations attributed by BAPOP to the Bank, the maximum limit for total exposure
with a Group/Customer is 10% of GBP's Tier I. The maximum limit for a Group/Customer, except
bank and technical guarantees and transactions guaranteed with deposits is 5% of GBP's Tier I.
ii) Risk limit by transaction amount
The maximum amount for a lending transaction is defined.
In case of funding working capital or without a specific destination every risk with that characteristic
shall be aggregated.
Regarding project finance and syndicated financing, BAPOP's participation shall not be higher than
25% of the total amount, in case the transaction is higher than the limit defined for this type of lending.
iii) Limit of participation in the Credit Risk Central (CRC)
The maximum limit for participation in the CRC with a Group/Customer shall be the following:
Group/Customer with risks of over € 500 million - Lower than 10% of CRC.
Group/Customer with risks of over € 250 million - Lower than 15% of CRC.
Group/Customer with risks of over € 100 million - Lower than 25% of CRC.
Group/Customer with risks of over € 20 million - Lower than 50% of CRC.
iv) Limit of risk concentration by activity sector
The maximum limits of concentration of total risk by activity sector are the following:
Construction and property development: 25%;
Manufacturing and mining industries: 15%;
Information and communication, education and other services: 5%;

92
Interim Report and Accounts
Half Year 2016
Remaining sectors: 10% (Agriculture, forestry and fisheries; Energy and water supply;
Wholesale and retail trade, repair of motor vehicles; Hotels and restaurants; Transport and
storage; Banking and insurance; Administrative, professional sanitary and artistic activities).
v) Limit of risk concentration in large companies
There is a maximum limit of 30% of total risk for the Large Companies segment.
vi) Limit of risk concentration by product
There are also defined limits according to the type of product:
Transactions with mortgages on land;
Property development;
Loans to purchase securities.
vii) Assessment of mortgage collaterals
A set of limits is also defined according to the loan to value (LTV) of lending transactions with
mortgage collaterals.
b) Loan write-off policy.
The loan write-off policy determines that write-offs may only be carried out when the loans
simultaneously have been non-performing for 2 years and have an impairment level of 100%
c) Impairment reversion policy.
The analysis and subsequent determination of individual impairment of a customer that has shown
impairment in previous periods may only result in a reversion in case it is related with the occurrence
of an event after the initial recognition (e.g. improvement of the customer's rating or strengthening
collaterals).
Additionally, there may be implicit reversions of impairment, resulting from new estimates of collective
parameters or changes in the type of customer analysis (individual or collective).
The reversal amount may not be higher than the accumulated impairment amounts previously
recorded.
d) Conversion of the debt into debtor's equity.
The Bank does not usually employ this type of solution and solely holds an exposure on an economic
group that was subject to this type of loan restructuring. In this case, the loan is replaced by a position
comprised of shares from a Restructuring Fund.
These positions are subject to impairment tests every six months from the moment those shares are
included in the Restructuring Fund. For junior debt positions maintained in companies held by these
Funds a 100% impairment is estimated regarding their respective exposure.
e) Description of restructuring measures applied and their respective associated risks, as
well as control and monitoring mechanisms.
The Bank has defined a vast set of restructuring measures, which are negotiated by a large set of
Agencies specialising in credit recovery. The most common measures are extending the maturity date
of the loan or the inclusion of a grace period.

93
Interim Report and Accounts
Half Year 2016
In terms of characteristics, these restructuring operations are divided into large groups: without
overdue credit (with or without strengthening collaterals); and with overdue credit (with or without
strengthening collaterals).
The Bank's decision-making body in terms of loan granting shall identify the restructuring operations
that result from customers' financial difficulties. These are subsequently classified by the Bank's
computer system. Costumers with lending operations that are undergoing a restructuring process are
also subject to an internal definition of a loan restrictive classification. Agencies are thus forced to act
on this policy, which may imply maintaining, reducing or extinguishing risks.
Regarding monitoring in terms of the loan impairment model, these transactions shall bear the
restructuring brand for a two-year healing period pursuant to Instruction No. 32/2013 issued by the
Bank of Portugal.
f) Description of the process of assessing and managing collaterals.
For situations in which it is admissible that credit recovery shall occur via foreclosure the amounts that
shall be considered (market value of the most recent appraisal known with the application of a
temporal haircut) are also defined by internal regulations.
Reappraisals of these collaterals are usually done within the time frames defined by Notices Nos.3/95
and 5/2006 issued by the Bank of Portugal. However, in the case of properties related with
transactions done with customers with significant exposures (over 1 million euros), reappraisals are
carried out more often.
Despite the pre-defined time frames, appraisals are carried out whenever they are considered
relevant to monitor the value of the collateral.
The value of the properties considered as collaterals is adjusted to the current macroeconomic
scenario through the application of haircuts, based on Management analysis and market practices.
Regarding financial collaterals and securities, we have defined the periodical monitoring of the lending
operations collateralised with this type of assets, and these are regularly reported to Management.
Assets used as collateral are indicated, as well as the overall hedging ratio. These amounts are
considered in the scope of an individual impairment analysis.
g) Nature of main judgements, estimates and hypotheses used to determine impairment.
Losses due to impairment correspond to estimates based on judgements made by top management in
view of the facts and circumstances on a given date. Consequently, future events and developments
are expected, in some cases, to converge into a different result vis-à-vis the estimate amount.
In order to ensure the adequacy of the impairment model to the macroeconomic scenario, the Bank
carries out monthly impairment reviews of its individually analysed customers, as well as reviewing
every six months the parameters applied to the collective part of its credit portfolio.
94
Interim Report and Accounts
Half Year 2016
In terms of the individual analysis, impairment depends on the disbursement capacity of the debtor
and/or respective guarantors, or the collaterals the Bank has to guarantee the lending transactions,
applying the reference criteria described in Circular Letter 02/2014/DSP issued by the Bank of
Portugal.
As far as the collective part of the portfolio is concerned and especially the calculation of LGD
estimates, these are calculated based on the history of effective recoveries, as well as on
conservative assumptions, defined and approved by Management for future estimates.
h) Description of the methods employed to calculate impairment, including the way
portfolios are segmented in order to reflect the different characteristics of the lending
operations.
In compliance with the conceptual model on which impairment calculations are based, every month an
analysis is carried out to the overall credit portfolio divided into seven main groups: (i) default loans,
(ii) loans in arrears (30- 90 days), (iii) restructured loans, (iv) non-performing loans (with impairment
signs), (v) healing loans, (vi) healed loans, and (vii) performing loans.
Definition of default
A loan is considered defaulted whenever it shows at least one of the following signs:
Loans in arrears for more than 90 days;
Customers in insolvency/bankruptcy situations or undergoing a special revitalisation process
(PER); or
Bank guarantees called in by the beneficiary.
A customer's full exposure is considered defaulted whenever the sum of their transactions in arrears
for more than 90 days exceeds 20% of total exposure.
Homogeneous segments result from the creation of transaction groups that have similar credit risks,
taking into consideration the Bank's management model. In order to do so, we have defined as
relevant segmentation factors some lending transactions characteristics, such as type of customer,
materiality of the exposure, type of product and type of associated collateral.
The segmentation currently in force distinguishes between specific PD segmentation and specific
LGD segmentation:

95
Interim Report and Accounts
Half Year 2016
Probability of default (PD) represents the estimate based on the last 5 years of the Bank's history of
the number of transactions with or without impairment signs that can default during a given period of
time (emerging period). So that the history reflects the current economic conditions, the observations
obtained are adjusted through the following risk weights that may be adjusted every six months
according to the regular exercise of PD back testing:
PD is also differentiated according to the classification of each loan: (i) default loans, (ii) loans in
arrears (30- 90 days), (iii) restructured loans, (iv) non-performing loans (with impairment signs), (v)
healing loans, (vi) healed loans, and (vii) performing loans.
i) Impairment signs by credit segment
The Bank considers that a loan shows impairment signs when one of the following events occurs.
Customers with at least 1 loan of a material amount in arrears for more than 30 days;
Customers in litigation;
Customers with at least 1 loan of a material amount restructured due to financial difficulties of the
customer or perspective/request for restructuring;
Customers with at least 1 loan undergoing out of court procedures to regularise their situation
(PERSI);
Customers with at least 1 loan of material amount in the banking system in arrears, premium and
interest cancelled/annulled or in court, according to information made available by the Central for
Credit Liabilities of the Bank of Portugal;
Customers with loan transactions written-off by BAPOP in the past 12 months;

96
Interim Report and Accounts
Half Year 2016
Customers with banking guarantees made by the Bank which have been foreclosed within the
past 24 months;
Costumers with pledges or assignments to the Bank in the past 24 months;
Customers with non-performing operations in other entities of Popular Group;
Any other signs that cause a higher probability of defaulting detected in the individual analysis.
j) Limits defined for individual analysis.
On each reporting date a set of customers is selected, who due to the materiality of their exposure to
the Bank are considered significant. Those customers are subject to an individual analysis procedure
in order to conclude whether there is evidence of impairment or to determine the amount of
impairment.
Individual analyses are carried out on:
Default customers or customers showing impairment signs with total liabilities of over 750,000
euros;
Significant customer portfolio with no impairment signs and total liabilities of over 2,500,000.
At all times, between 25% and 30% of total on-balance sheet loans of BAPOP have to be individually
analysed. In case the above-mentioned limits do not allow that percentage to be within that interval
they may be adjusted.
Customer lending subject to individual analysis in which no objective evidence of impairment is
identified shall be included in homogeneous risk segments in order to be considered for collective
impairment.
k) Policy on internal risk levels, specifying the treatment given to a borrower classified as
impaired.
Operations that are in arrears for more than 90 days, or in insolvency situations or undergoing a
special revitalisation process (PER), or that require more specialised monitoring are regularly
migrated to a set of Agencies.
The mission and objectives of that set of agencies are the rigorous analysis, monitoring and
management of customers and risks, carried out by Specialised Managers distributed into 3 segments
(Private individuals, Corporate, and Large Risks). From a comprehensive vision of the whole recovery
process, we try to find and employ the most adequate solutions for a swift credit recovery.
l) General description of the calculation of the current amount of future cash flows when
calculating impairment losses assessed individual and collectively.
According to the impairment model used by the Bank, when objective evidence of an event that
originated a loss due to impairment is identified, the amount of that loss shall be determined as the
difference between the amount on the balance sheet and the present amount of the estimated future
cash flows (excluding losses due to events that have not occurred yet), discounted at the original
effective interest rate.
Estimated future cash flows included in the calculation regard the contractual amount for the loans,
adjusted by any amounts that the Bank expects not to recover and the time frame in which it is
foreseeable that those shall be carried out. The time frame for the recovery of cash flows is a very
significant variable for the calculation of impairment, since an impairment loss is always recognised,
even in the cases in which total recovery of the contractual outstanding cash flows is expected to be

97
Interim Report and Accounts
Half Year 2016
received but after the agreed dates. This situation shall not be verified in case the Bank receives
compensation in full (for example, as interest or default interest) for the period in which the loan was
overdue.
Estimating an amount and the moment future cash flows shall be recovered for a loan involves
professional judgement. The best estimate for those, taking into consideration the guidelines defined
on Circular Letter No. 02/2014/DSP, is based on reasonable assumptions and on observable data at
the date impairment is assessed, on the capacity of a customer to pay or on the possibility of a
foreclose on a collateral.
In the case of collective portfolios, a probability of default (PD) and a rate of loss given default (LGD)
are applied to each homogeneous segment.
In the case of defaulted loans, PD is 100% and the balance is established at the moment each loan
defaults.
LGD is an estimate of loss given default of a customer. For the calculation of this variable, a random
sample of the Bank's history is used, based on a trust interval of 95% regarding every customer that
has defaulted. Thus, the average loss is calculated for each segment based on every recovery
discounted at the effective rate for the month in which that operation defaulted until maturity
date/settlement, as well as possible future estimates for the cases in which operations have not been
settled when the analysis is carried out.
Recovery of the loans included in the sample are checked on a case-by-case basis, including:
Historical recoveries via payments made by the debtor (recoveries since the date of default until
the date of analysis);
Historical recoveries via foreclosure, deducted from expenses;
Estimates of recoveries after the reference dates used for the analysis;
Recoveries after write-off.
m) Description of the emerging period(s) used for the different segments and justification
of their adequacy.
Emerging periods, which result from internal studies and the estimate of time management in the time
frame between the event and default, are the following:
n) Detailed description of the cost associated with credit risk, including disclosure of PD,
EAD, LGD and healing rates.
For restructured or healing loans, average PD is determined for each month of the demarcation stage
(24 or 12 months respectively); after that time curves are drawn and applied.
In the segments where those time curves do not show correlations that can be considered
explanatory, the PD applied during the demarcation stage results from the weighted average by the
total number of restructured or healing loans in each segment and in each month (without attributing
different weights to moment PD was observed).

98
Interim Report and Accounts
Half Year 2016
Additionally, from a conservative perspective, the minimum point of each curve may never be lower
than the PD obtained for performing loans for the same period.
In the following tables, the main points of their respective curves applied to restructured or healing
loans are shown as follows:
Performing loans or loans with probability of default
Restructured loans
n+1 n+2 n+3 n+4 n+5 n+6 n+7 n+8 n+9 n+10 n+11 n+12
Credit cards - Private individuals 4,9% 4,9% 4,9% 4,9% 4,9% 4,9% 4,9% 4,9% 4,9% 4,9% 4,9% 4,9%
Relevant Customers 59,1% 53,6% 48,5% 43,6% 38,9% 34,5% 30,4% 26,5% 22,8% 19,4% 16,3% 13,4%
Corporate Customers 33,3% 33,3% 33,3% 33,3% 33,3% 33,3% 33,3% 33,3% 33,3% 33,3% 33,3% 33,3%
Property construction 46,4% 44,3% 42,2% 40,1% 38,0% 35,9% 33,9% 31,8% 29,7% 27,6% 25,5% 23,4%
Residential mortgage loans 31,1% 27,8% 24,9% 22,3% 19,9% 17,8% 15,9% 14,3% 12,8% 11,4% 10,2% 9,1%
Consumer credit 45,8% 39,8% 34,6% 30,0% 26,0% 22,5% 19,6% 17,2% 15,2% 13,5% 12,1% 11,0%
Employees 9,6% 4,3% 2,5% 1,7% 1,1% 0,8% 0,5% 0,3% 0,2% 0,1% 0,1% 0,1%
Corporate customers 47,5% 42,4% 37,8% 33,7% 30,2% 27,1% 24,5% 22,2% 20,2% 18,6% 17,1% 15,9%
State and other public bodies 0,0% 0,0% 0,0% 0,0% 0,0% 0,0% 0,0% 0,0% 0,0% 0,0% 0,0% 0,0%
Banco Popular Group 0,0% 0,0% 0,0% 0,0% 0,0% 0,0% 0,0% 0,0% 0,0% 0,0% 0,0% 0,0%
Property development 46,5% 44,0% 41,5% 39,0% 36,5% 34,0% 31,5% 29,0% 26,5% 24,0% 21,5% 19,0%
Segment:Time frame of the restructuring (in months):

99
Interim Report and Accounts
Half Year 2016
Healing loans
LGDs applied as at 30 June 2016 were the following:
We would like to stress once more that the project that will allow the Bank to calculate LGD based on
the whole portfolio and not simply on a sample is almost complete as mentioned in paragraph (l).
o) Conclusions of the sensitivity analysis to the amount of impairment and changes to the
main assumptions
As at 31 December 2015, an increase by 10% in PD would imply an increase by 4 million euros in the
total amount of impairment. A similar increase in LGD would imply an increase by 18.3 million euros.
An increase by 10% in both variables would imply a 22.7 million euro increase in the total amount of
impairment.
p) Qualitative disclosures of Popular Factoring, S.A.
The impairment model used by Popular Factoring, S.A., in view of the specificity of its business and
the fact that it had been an independent legal person until now, is not based on the same
methodology that regulates Banco Popular, S.A., although it achieved results that are very close to
those that Popular Factoring, S.A., has historically showed. In this scope, Banco Popular Portugal,
S.A., after the merger project with that company, which is now under way, will homogenize data.

100
Interim Report and Accounts
Half Year 2016
In this note, we present a brief description of the model that exists in the consolidated company and
its main impact on the reference values of Banco Popular, S.A., which we consider of little
significance. For this reason, in this interim report, the tables in the quantitative disclosures, in face of
the size and complexity of the factoring business inside the consolidated portfolio, will be presented
only when materially relevant.
The impairment of the credit portfolio of Popular Factoring, S.A., is calculated with reference to the
bases, reasonability, results, and experience, given the reality of the company and the type of product
that factoring represents. The company has a calculation model that intends to be reliable and timely,
and corresponds to an impairment model.
The model developed by Popular Factoring, S.A., is based on three major areas: I-Seniority; II-Internal
credit rating; and III-Subjective analysis.
Seniority is measured from the maturity date of two invoices granted. The greater the seniority, the
larger the weight for the constitution of impairment.
The internal credit rating of the customers (the internal classification of the customer based on the
notation defined by the company) contributes to calculate impairment, combined with the remaining
available information on customers and adherents.
The model is based on an internal credit rating of its customers, whose classification varies from 1
(excellent risk) to 5 (high risk). This system is based on two aspects, incorporating the specific risk of
the operation/customer portfolio and the company risk, obtained through the points that result from the
analysis of the updated financial information on the companies. The higher the rating, the higher the
impairment.
Finally, impairment is defined and calculated based on a subjective credit analysis.
Quantitative disclosures:
a) Detailed exposures and impairments by segment.
Segment: Total exposurePerforming
loans
Of which:
healed
Of which:
restructured
Non-performing
loans
Of which:
restructured
Total
impairment
Performing
loans
Non-performing
loans
Corporate 326 012 269 988 0 4 207 62 023 21 462 30 077 466 26 911
Property construction and CRE 548 971 347 213 201 34 071 201 757 87 047 87 918 8 424 79 494
Residential mortgage loans 1 726 927 1 612 328 1 631 100 156 114 599 47 731 18 340 5 765 12 574
Relevant 1 139 249 949 517 14 910 53 614 189 732 75 942 85 069 28 453 56 616
Corporate customers 1 981 021 1 627 616 987 36 349 353 405 88 108 140 584 24 818 115 766
Other 363 595 314 008 88 6 247 49 587 9 358 21 300 2 380 18 920
Total 6 085 775 5 114 670 17 824 234 643 971 104 329 647 383 288 70 306 312 981
Exposure as at 31/12/2015 Impairment as at 31/12/2015

101
Interim Report and Accounts
Half Year 2016
Segment:Performing
loansWith imp. signs <= 90 > 90 < 30
between 30 and
90<= 90 > 90
Corporate 326 012 249 480 14 390 119 29 318 32 705 30 077 455 10 10 975 18 637
Property construction and CRE 548 971 280 095 63 397 3 721 39 276 162 481 87 918 7 923 500 13 654 65 839
Residential mortgage loans 1 726 927 1 380 870 200 722 30 736 9 361 105 238 18 340 4 564 1 201 1 156 11 419
Relevant 1 139 249 845 808 103 685 24 40 701 149 031 85 069 28 429 24 12 267 44 349
Corporate customers 1 981 021 1 520 295 92 342 14 979 55 385 298 020 140 584 22 551 2 267 16 877 98 888
Other 363 595 296 373 15 176 2 459 1 483 48 104 21 300 1 917 463 475 18 445
Total 6 085 775 4 572 921 489 712 52 037 175 525 795 579 383 288 65 840 4 466 55 404 257 577
Days past due
Exposure as at 31/12/2015 Impairment as at 31/12/2015
Performing loans Non-performing loans Performing loans Non-performing loans
Total exposure
Over 30 days past due Between 30 and
90 days past
due
Days past dueTotal
impairment
Days past due

102
Interim Report and Accounts
Half Year 2016
b) Detailed credit portfolio by segment and year of production.
31-12-2015
Production
year
Number of
transactionsAmount
Constituted
impairment
Number of
transactionsAmount
Constituted
impairment
Number of
transactionsAmount
Constituted
impairment
<= 2004 26 55 9 656 22 657 6 750 4 706 148 385 2 150
2005 14 393 5 185 10 512 2 937 1 940 104 558 1 312
2006 30 5 703 6 305 14 122 1 888 1 774 91 610 1 374
2007 51 0 0 446 36 474 7 650 2 046 111 954 2 232
2008 17 0 0 433 14 312 1 890 2 718 157 523 1 727
2009 20 11 402 4 886 550 24 934 7 785 3 159 195 851 2 328
2010 44 5 344 3 344 722 38 120 11 934 4 092 284 399 2 581
2011 95 10 184 412 767 32 385 9 195 2 014 160 279 1 237
2012 24 10 555 8 811 865 43 830 7 590 876 72 599 942
2013 46 29 121 3 931 867 52 737 8 129 1 063 80 171 582
2014 30 12 749 2 572 828 65 894 7 990 1 531 127 559 450
2015 107 240 506 6 102 4 118 192 992 14 181 2 057 192 039 1 426
Total 504 326 012 30 077 10 742 548 971 87 918 27 976 1 726 927 18 340
Corporate Property construction and CRE Residential mortgage loans
31-12-2015
Production
year
Number of
transactionsAmount
Constituted
impairment
Number of
transactionsAmount
Constituted
impairment
Number of
transactionsAmount
Constituted
impairment
<= 2004 23 21 337 781 1 455 7 436 1 409 3 567 17 785 666
2005 9 7 083 13 504 7 102 935 1 958 6 598 514
2006 23 48 606 9 185 737 9 049 1 920 2 949 11 857 1 258
2007 28 46 628 2 558 1 147 29 386 4 844 3 394 11 035 2 241
2008 25 87 468 6 226 1 081 16 511 3 942 3 411 15 784 2 054
2009 192 81 854 6 011 1 509 54 747 10 818 5 374 20 218 2 441
2010 100 48 716 6 700 2 193 77 657 16 873 7 490 32 569 3 588
2011 81 55 976 765 2 282 79 016 14 458 6 046 27 760 2 870
2012 101 34 168 802 4 129 131 645 15 308 8 085 13 474 1 138
2013 153 114 688 18 494 4 825 196 813 18 749 8 022 17 311 1 212
2014 205 154 998 6 324 5 240 328 417 19 616 9 450 45 074 1 255
2015 574 437 727 27 209 21 769 1 043 242 31 712 18 854 144 131 2 063
Total 1 514 1 139 249 85 069 46 871 1 981 021 140 584 78 600 363 595 21 300
Relevant Corporate customers Other

103
Interim Report and Accounts
Half Year 2016
c) Detailed amount of gross credit exposure and individual and collectively assessed
impairment by segment, business sector and geography.
c.1) By segment:
Individual
31-12-2015
Assessment Exposure Impairment Exposure Impairment Exposure Impairment
Individual 304 969 30 023 119 500 45 150 10 080 1 385
Collective 21 043 54 429 471 42 767 1 716 848 16 955
Total 326 012 30 077 548 971 87 918 1 726 927 18 340
Assessment Exposure Impairment Exposure Impairment Exposure Impairment Exposure Impairment
Individual 1 139 249 85 062 122 136 41 810 28 973 49 1 724 906 203 480
Collective 0 7 1 858 885 98 774 334 622 21 251 4 360 868 179 808
Total 1 139 249 85 069 1 981 021 140 584 363 595 21 300 6 085 775 383 288
Total
Corporate Property construction and CRE Residential mortgage loans
Relevant Corporate customers Other
Consolidated

104
Interim Report and Accounts
Half Year 2016
c.2) By business sector:
Individual
31-12-2015
Assessment Exposure Impairment Exposure Impairment Exposure Impairment
Individual 285 168 71 571 277 252 16 145 132 614 24 219
Collective 193 295 24 548 713 223 32 384 695 667 46 381
Total 478 463 96 118 990 475 48 529 828 281 70 600
Assessment Exposure Impairment Exposure Impairment Exposure Impairment Exposure Impairment
Individual 192 596 17 278 201 653 24 172 342 046 38 773 1 431 329 192 158
Collective 140 000 1 319 113 957 6 024 551 250 23 892 2 407 393 134 549
Total 332 596 18 597 315 611 30 196 893 296 62 666 3 838 721 326 707
Total
Property construction Industries Commerce
Financial/Insurance Companies Real Estate Agents Other
Consolidated

105
Interim Report and Accounts
Half Year 2016
c.3) By geography:
Individual
Assessment Exposure Impairment
Individual 1 724 906 203 480
Collective 4 360 868 179 808
Total 6 085 775 383 288
31-12-2015
Portugal
Consolidated
d) Detailed portfolio of restructured loans by applied restructuring measure.
MeasureNumber of
transactionsExposure Impairment
Number of
transactionsExposure Impairment
Number of
transactionsExposure Impairment
Maturity date extension 299 53 123 2 278 336 73 482 15 472 635 126 605 17 750
Grace period 1 173 106 227 4 560 1 067 138 391 40 780 2 240 244 618 45 340
Other measures 1 718 75 293 3 855 1 494 117 774 39 033 3 212 193 067 42 888
Total 3 190 234 643 10 694 2 897 329 647 95 285 6 087 564 290 105 979
Performing loans Non-performing loans Total
31-12-2015

106
Interim Report and Accounts
Half Year 2016
e) In and out movements in the restructured loan portfolio.
31-12-2015
Initial balance of the restructured portfolio (gross of impairment) 599 089
Restructured loans in the period 167 934
Interest on the restructured portfolio - 335
Loan repayment (partial or total) - 117 976
Loans reclassified from 'restructured' to 'regular'' - 82 043
Other - 2 378
Final balance of the restructured portfolio (gross of impairment) 564 290
f) Detailed fair value of collaterals underlying the credit portfolio for the Corporate,
Construction, Commercial Real Estate (CRE) and Residential segments.
31-12-2015
Fair value Number Amount Number Amount Number Amount Number Amount Number Amount Number Amount
< 0.5 M€ 2 572 1 0 1 877 217 545 923 55 316 19 975 2 806 871 510 18 526
>= 0.5 M€ and < 1 M€ 0 0 1 541 128 89 778 18 10 313 240 154 743 2 1 110
>= 1 M€ and < 5 M€ 3 6 324 1 3 576 96 176 958 8 9 995 38 57 725 7 10 270
>= 5 M€ and < 10 M€ 1 8 194 0 0 8 53 766 0 0 2 10 397 0 0
>= 10 M€ and < 20 M€ 0 0 1 10 392 0 0 0 0 0 0 0 0
>= 20 M€ and < 50 M€ 0 0 0 0 0 0 0 0 0 0 0 0
>= 50M€ 0 0 0 0 0 0 0 0 0 0 0 0
Total 6 15 090 4 14 508 2 109 538 048 949 75 624 20 255 3 029 736 519 29 906
Corporate Property construction and CRE Residential mortgage loans
Properties Other real collaterals Properties Other real collaterals Properties Other real collaterals

107
Interim Report and Accounts
Half Year 2016
g) LTV ratio for the Corporate, Construction, CRE and Residential segments.
Number of
properties
Performing
loans
Non-performing
loansImpairment
Corporate 156 318 67 120 18 633
Without any collateral n.a. 244 711 56 281 26 713
< 60% 2 5 703 398 6
>= 60% and < 80% 1 1 464 0 2
>= 80% and < 100% 1 8 052 0 8
>= 100% 2 4 059 5 344 3 349
Property construction and CRE 347 213 201 757 87 918
Without any collateral n.a. 140 057 111 297 58 343
< 60% 10 235 83 775 29 597 6 326
>= 60% and < 80% 7 902 29 397 11 400 2 526
>= 80% and < 100% 5 545 30 104 6 368 1 553
>= 100% 1 943 63 879 43 096 19 170
Residential mortgage loans 1 612 328 114 599 18 340
Without any collateral n.a. 6 753 10 775 2 177
< 60% 10 235 475 333 27 085 3 751
>= 60% and < 80% 7 902 593 991 19 544 3 240
>= 80% and < 100% 5 545 425 911 23 092 3 974
>= 100% 1 943 110 340 34 104 5 199
31-12-2015
Segment/Ratio

108
Interim Report and Accounts
Half Year 2016
h) Detailed fair value and net book value of repossessed properties or foreclosed properties,
by type of asset or time elapsed.
Assets
Number of
properties
Fair value
of the
asset
Carrying
amount
Land
Urban 114 10 134 8 700
Rural 49 7 098 5 974
Properties under development
Residential 312 38 196 37 407
Commercial 24 1 150 958
Other 163 6 151 5 541
Built properties
Residential 459 57 148 54 266
Commercial 129 14 546 12 679
Other 213 28 594 25 814
Other 17 11 737 11 410
1 480 174 754 162 749
31-12-2015

109
Interim Report and Accounts
Half Year 2016
Time elapsed since
repossession/foreclosure
< 1 year
>= 1 year
and < 2.5
years
>= 2.5
years and
< 5 years
>= 5
yearsTotal
Land
Urban 5 004 1 901 1 700 95 8 700
Rural 1 039 849 3 809 277 5 974
Properties under development
Residential 13 041 7 209 5 838 11 319 37 407
Commercial 0 0 0 958 958
Other 66 626 3 747 1 102 5 541
Built properties
Residential 23 170 15 803 6 981 8 312 54 266
Commercial 7 374 2 850 1 105 1 350 12 679
Other 9 163 10 297 4 996 1 358 25 814
Other 9 059 36 1 515 800 11 410
67 916 39 571 29 691 25 571 162 749
31-12-2015
i) Distribution of the credit portfolio measured by degrees of internal risks.
Although Banco Popular possesses internal rating models, these are still at their validation stage.
j) Disclosure of the risk parameters associated with the impairment model by segment.
Risk parameters associated with the impairment model by segment are explained in paragraph (n) of
the qualitative disclosures of this note.
THE CERTIFIED PUBLIC ACCOUNTANT
THE BOARD OF DIRECTORS