interim report and financial statements for sentinel defensive portfolio · 2017-04-13 ·...
TRANSCRIPT

HEAD OFFICE MARGETTS FUND MANAGEMENT LTD DEALING 1 SOVEREIGN COURT PO BOX 17067 GRAHAM STREET www.margetts.com BIRMINGHAM BIRMINGHAM VAT No. (GB) 795 0415 16 B2 2HL B1 3JR
Registered in England No. 4158249
TELEPHONE: 0121 236 2380 Authorised and Regulated by TELEPHONE: 0345 607 6808 FACSIMILE: 0121 236 2330 the Financial Conduct Authority FACSIMILE: 0121 236 8990
Interim Report and
Financial Statements
for Sentinel Defensive Portfolio
For the six months ended 31 January 2017 (Unaudited)

ACD Margetts Fund Management Limited
1 Sovereign Court Graham Street
Birmingham B1 3JR
Tel: 0121 236 2380 Fax: 0121 236 2330
(Authorised and regulated by the Financial Conduct Authority)
Directors of the ACD T J Ricketts T H Ricketts A J M Quy J E J Clay
M D Jealous A S Weston
G M W Oakley (non-exec) J Vessey (non-exec)
Depositary BNY Mellon Trust & Depositary (UK) Ltd
The Bank of New York Mellon Centre 160 Queen Victoria Street
London EC4V 4LA
(Authorised and regulated by the Financial Conduct Authority)
Administrator and Registrar Margetts Fund Management Ltd
PO Box 17067 Birmingham
B2 2HL
Tel: 0345 607 6808 Fax: 0121 236 8990
(Authorised and regulated by the Financial Conduct Authority)
Auditors Shipleys LLP
Chartered Accountants & Statutory Auditors 10 Orange Street
Haymarket London
WC2H 7DQ
Investment Advisers
Premier Fund Managers Limited Eastgate Court
High Street Guildford Surrey
GU1 3DE
(Authorised and regulated by the Financial Conduct Authority)

Contents
Investment Adviser’s Report 1 Certification of Accounts by Directors of the ACD 2 Significant Purchases and Sales 3 Portfolio Statement 4 Net Asset Value per Share and Comparative Tables 8 Financial Statements
Statement of Total Return 11 Statement of Change in Net Assets Attributable to Shareholders 11 Balance Sheet 12 Notes to the Financial Statements 13 Distribution Table 22
General Information 23

1
Investment Adviser’s Report For the period ended 31 January 2017 Investment Objective To provide medium term capital growth from a portfolio of investments. The investment policy of the Fund is to invest principally in a combination of zero dividend preference shares of quoted investment companies and securities which, in the Investment Adviser’s opinion, are lower risk securities. The Fund may also invest in equities, units in collective investment schemes, fixed interest securities, money market instruments, structured products and other derivative instruments, deposits, warrants, cash and near cash. Investments may be made in immovable property typically through units in collective investment schemes and/or shares of property companies. The Fund may also invest in unregulated collective investment schemes such as hedge funds (where investment in such funds would be consistent with the investment objective and policy of the Fund). Investment Review Sentinel Defensive A 3.34% Sentinel Defensive B 3.72% Performance The Fund (class B accumulation shares) delivered a performance of 3.17% over the reporting period. For comparison purposes, the FTSE 100 Index returned 7.36%, and cash, as represented by 3 Month Sterling London Interbank Offered Rate (LIBOR), returned 0.20%. The Fund remains very stable with volatility only a small fraction of equity market volatility. Market Review The period under review was dominated by political events; the start of the period focused on the response of financial markets to the UK referendum result, before attention shifted to the US election and the aftermath of the Trump victory. Even for investors who had predicted the outcomes of both events correctly it would have been very difficult to forecast the market’s reaction to them. Following an initial sell-off after the referendum result, equity markets recovered strongly. UK equities were helped by the devaluation of Sterling while global markets continued to be underpinned by accommodative central bank monetary policy. The Trump victory fuelled equity markets to new heights as the incoming President was believed to be positive for growth given his campaign promises to cut taxes and increase government spending. At the same time the final quarter of the year saw bond markets suffer as fears over increasing inflation spooked investors. Since the start of the year we’ve seen financial markets remain range-bound as investors started to query whether the reaction to the Trump victory had gone too far given policies have yet to be implemented. Portfolio Activity We are increasingly using investment strategies which have the potential to benefit from any increase in market volatility and dispersion, therefore making the Fund less sensitive to market shocks. We have incorporated more relative value strategies that have the potential to generate positive returns in both rising and falling markets. The flexibility to access and adjust exposures to asset classes, enables the Fund to be positioned to take advantage of both value and pricing opportunities that arise during pockets of market volatility. We invest in a diverse range of strategies which predominantly offer a predictable return profile. Strategies typically have a fixed life, enabling easier identification of the major risks, and a fixed entitlement, enabling us to calculate the responsiveness of the investments if those major risks occur.

2
Investment Adviser’s Report (continued) Underlying asset class exposure is diverse and includes UK equities, indirect exposure to commercial property, private equity, reinsurance, US equities, Asian equities, litigation finance, and many other asset classes. Geographical, sector, and asset class exposures are determined by our top-down analysis and then complemented by bottom-up analysis, focusing on stability and downside protection, looking to extract value from a continually moving set of opportunities. Outlook With financial markets having already navigated through the US election and Italian referendum the geopolitical focus now shifts to the upcoming European elections. Amongst all this uncertainty, financial markets face significant headwinds and we continue to position the Fund in a defensive fashion. This is achieved by constantly monitoring our exposures to risks and accordingly adjusting our responsiveness in line with the Fund’s principles. We currently look for less correlated strategies that can provide an attractive balance for investors and seek to generate growth on a low volatility basis utilising predictable investments and our risk modelling techniques. Premier Fund Managers Ltd Investment Adviser 01 March 2017
Certification of Accounts by Directors of the ACD This report is signed in accordance with the requirements of the Collective Investment Schemes Sourcebook (COLL) as issued and amended by the Financial Conduct Authority.
T J Ricketts M D Jealous
Margetts Fund Management Ltd 31 March 2017
Authorised Status
The Sentinel Defensive Fund is a sub-fund of The Sentinel Fund ICVC with investment powers equivalent to those of a UCITS Scheme. The umbrella company is The Sentinel Fund ICVC which is an open-ended investment company with variable capital incorporated in England and Wales under regulation number IC658 and authorised by the Financial Conduct Authority with effect from 1 May 2008. It is a Non-UCITS Retail Fund (NURS) as classified under the FCA’s Collective Investment Schemes Sourcebook. Shareholders are not liable for the debts of the fund.

3
Significant purchases and salesFor the period ended 31 January 2017
Total purchases for the period £23,649,939
Purchases Cost (£)
INVESTEC SX5E SPX 2,006,640.00
NATIXIS REV CONV ESTOXX 1,968,960.90
INVESTEC UKX DEFNSIVE 4.2Y AUTOCALL 04/01/2021 1,599,760.00
MS 4Y GBP EIS SX5E SPX STEP 1,003,000.00
NATIXIS STRUCTURED 11 AUG 2020 1,000,000.00
ROYAL BANK OF CANADA 10/01/2018 1,000,000.00
ROYAL BANK CANADA TORONTO 11.04.19 986,697.48
BARCLAYS BANK PLC MTN 0% 23/04/2019 926,870.00
SG4YGBP RANGE ACC FTSE 902,000.00
GOLDMAN SACHS & CO WERT 881,989.76
BLUECREST ALLBLUE FUND LIMITED ORD NPV GBP 621,031.89
SANDITON INVESTMENT TRUST 518,309.56
BNP PARIBAS ARBITRAGE SP 500,000.00
SOCGEN 4.1Y FTSE AUTOCALL 11/12/2020 500,000.00
Total sales for the period £26,936,661
Sales Proceeds (£)
SG 4 YEAR AUTOCALL 3,153,000.00
ELECTRA PRIVATE EQUITY INVEST PLC 2,388,651.70
UIL FINANCE LTD ZDP 2016 1,971,616.97
ROYAL BANK OF CANADA 0.0% 28/08/18 1,866,200.00
EW&PO FINANCE PLC ZERO DIVD PREFERENCE SHARES $1 1,647,175.00
INVESTEC UKX DEFENSIVE 4Y AUTOCALL 1,572,750.00
SG 4Y GILTS AUTOCALL FTSE 1,560,000.00
CREDIT SUISSE AG ELN 0.0% 04/12/17 ANDREA INV PREF 1,499,375.00
PICTON ZDP LIMITED ZDP 0.0001P 1,336,331.00
MORGAN STANLEY 0% 10 SEP 2019 1,055,800.00
SG 4YR GBP AUTOCALL ON FTSE 2016 1,052,500.00

4
Portfolio Statement As at 31 January 2017
Total Net Assets
Holding Portfolio of Investments Value (£) 31.01.17
% 31.07.16
%
Closed-Ended
480,000 Acencia Debt Strategies Ltd 569,184 0.74
80,000 BH Global Limited 1,020,000 1.33
42,167 BH Macro Limited 879,604 1.15
40,000 Blackrock World Mining Trust 153,600 0.20
350,000 Blue Capital Global Reinsurance Fund Ltd 260,085 0.34
515,000 Bluecrest Allblue Fund Ltd 1,022,275 1.35
40,000 Boussard & Gavaudan 611,732 0.80
28,750 British Empire Securities & General Trust 186,156 0.24
93,250 Brunner Investment Trust 578,150 0.76
10,000 Capital Gearing Trust Plc 379,500 0.50
72,900 CATCo Reinsurance Opportunities Fund Ltd 73,476 0.10
138,536 DW Catalyst Fund Limited 1,630,569 2.13
30,000 Harbourvest Global Private Equity Ltd 356,100 0.47
50,000 ICG Enterprise Trust 347,500 0.45
700,000 JPMorgan Global Convertibles Income Fund 644,000 0.84
40,000 JPmorgan Global Growth & Income 112,900 0.15
351,000 Juridica Investments Limited 70,200 0.09
35,000 MFC Tri-Continental Corp Com Fund 621,698 0.82
295,000 Miton Worldwide Growth Investment Trust 651,950 0.86
80,000 PEWT Securities 89,200 0.12
305,000 Phaunos Timber Fund Limited 101,260 0.13
175,000 Picton Property Income Ltd 140,000 0.18
152,500 Ruffer Investment Co Ltd 358,375 0.47
496,000 Sanditon Investment Trust 510,880 0.67
114,334 Standard Life Euro Private Equity 334,999 0.44
135,000 Threadneedle Uk Select Trust 249,750 0.33
264,405 UK Mortgages Ltd 253,168 0.33
16,897 Zweig Fund Incorporated 144,660 0.19
Total Closed-Ended 12,350,971 16.18 10.35
Convertible Bonds
530,000 Aberdeen Asian Smaller Companies 3.5% 31/05/2019
622,750 0.81
500,000 British Land White 2015 (Zero Coupon) 462,690 0.61
23 City Natural Resources High Yield 3.5% 30/09/2018
22 -
1,724,666 Edinburgh Dragon Trust 3.5% 31/01/2018 1,741,913 2.28
290,040 F&C Global Smaller Companies 3.5% 31/07/2019
362,550 0.47
300,000 Helical Bar Jersey 4% 17/06/2019 293,442 0.38
60,000 JZ Capital Partners 6% 31/03/2021 678,000 0.89
1,200,000 St Modwen Props. 2.875% 06/03/2019 1,156,368 1.51
Total Convertible Bonds 5,317,735 6.95 5.97

5
Portfolio Statement (continued)
Total Net Assets
Holding Portfolio of Investments Value (£) 31.01.17
% 31.07.16
%
Exchange Traded Notes
3,050 iPath S&500 VIX Short Term Future 46,823 0.06
Total Exchange Traded Notes 46,823 0.06 0.04
Options
10 FTSE 100 P5800 16/06/17 2,150 -
Total Options 2,150 - 0.05
Preference Shares
706,000 Aberforth Geared Income Trust Plc 1,108,420 1.46
1,822,888 Acorn Income Fund Ld 2,542,929 3.33
1,000,000 Alt Asset Opps PCC Ltd Ref Pref - -
1,512,500 Conygar Plc 1,815,000 2.38
151,724 FRM Credit Alpha Red Part Prf NPV (Red Oct 13)
- -
30,088 FRM Diversified Al GBP Red Part Prf Shs NPV
- -
689,961 GLI Finance 679,612 0.89
448,000 Inland Plc 636,160 0.83
22,500 JP Morgan Income & Capital Trust Plc 41,850 0.05
140,000 JZ Capital Partners Ltd 575,400 0.75
3,106,361 M&G High Income Investment Trust Plc 3,735,398 4.90
100,000 NB Private Equity ZDP 2022 105,750 0.14
200,000 Ranger Direct Lending ZDP 2021 210,000 0.27
1,175,000 Real Estate Credit Investments Ltd 1,224,938 1.60
612,500 Small Companies Plc 820,750 1.07
290,250 Taliesin Property Fund Ltd 387,484 0.51
74,000 UIL Finance Ltd ZDP 2018 113,775 0.15
Total Preference Shares 13,997,466 18.33 28.96
Shares
200,000 Blackrock Income Strategies Trust Plc 215,000 0.28
20,000 Burford Capital Ltd 132,000 0.17
220,164 Capital & Regional Plc 119,989 0.16
5,500 Deutsche Wohnen 143,227 0.19
450,000 Dexion Redemption Shares 2013 - -
330,816 Hadrians Wall Secured Investments 345,703 0.45
35,000 NB Private Equity Partners 344,467 0.45
20,000 Pantheon International 342,000 0.45
100,000 SQN Asset Finance Income C 105,500 0.14
50,000 Urban & Civic Plc 108,125 0.14
5,500 Vonovia 144,261 0.19
10,000 VIB Vermoegen 160,266 0.22
Total Shares 2,000,272 2.62 1.52
Portfolio Statement (continued)

6
Total Net Assets
Holding Portfolio of Investments Value (£) 31.01.17
% 31.07.16
%
Structured Products
720,000 Barc Warrant Linked GBP 2020 786,312 1.03
200,000 Barclays Bank Plc 0% 06/11/2017 301,200 0.39
1,200,000 Barclays Bank Plc Mtn 0% 23/04/2019 1,600,800 2.09
100,000 Barclays Bank Plc Trk Zt 06/12/19 (Ipath S&P)
14,900 0.02
300,000 Bnp 3 Years Synergy Preference Share 20/11/19
304,380 0.40
500,000 Bnp 4y Lookback GBP On FTSE 524,650 0.69
500,000 Bnp Arb 0% 12/02/18 592,200 0.77
800,000 Bnp Paribas Aibv Cert 23/04/2018 (Prf Shs) 939,679 1.24
500,000 Bnp Paribas Arbitrage Issuance B.V 0% 17/03/2017
575,700 0.75
500,000 Bnp Paribas Arbitrage Sp 490,450 0.64
300,000 Credit Suisse 4yr Autocall Ukxe 04/11/2020 304,440 0.4
480,000 Cr Suisse London 0.0% 13/08/18 482,688 0.63
700,000 Cs S&P Twin Win 725,480 0.95
500 Goldman Sachs 29/06/2018 465,464 0.61
300,000 Goldman Sachs & Co Wert 0% Bonds 20/06/2018
291,750 0.38
250,000 Goldman Sachs & Co Wert 01 July 2019 303,350 0.40
500 Goldman Sachs & Co Wert 479,632 0.63
500,000 Goldman Sachs International 535,600 0.70
400,000 Goldman Sachs Structured Product P4yr 299,352 0.39
500,000 Goldmans 4yr Delta Russell 433,300 0.57
500,000 GS 4y GBP FTSE 100 Il Pf Shs 444,350 0.58
2,000,000 Investec 4yr Sx5e/UKX 2,110,300 2.76
2,000,000 Investec Sx5e Spx 2,027,520 2.65
1,600,000 Investec UKX Defnsive 4.2y Autocall 04/01/2021
1,607,567 2.11
700,000 JPM Outperformance Tracker 5y Eluk Index 17/03/2021
659,050 0.86
1,000,000 MS 4y GBP Eis Sx5e Spx Step 1,009,800 1.32
600,000 MS Bv 0% Domestic 05/02/19 536,400 0.70
500,000 MS Eurostoxx Dividend Tracker 586,750 0.77
400,000 MS Worst Of Barrier Rev Conv 434,480 0.57
500,000 Natixis Euro Stoxx 50 11/05/17 422,090 0.55
2,000,000 Natixis Rev Conv Estoxx 1,676,032 2.19
1,000,000 Natixis Structured 11 Aug 2020 1,020,490 1.34
900,000 Natixis Structured Issuance 2019 727,222 0.95
600 Nomura 4 Yrs Bear On FTSE100 598,812 0.78
1,100,000 Royal Bank Of Canada 0.0% 09/04/2018 1,151,809 1.52
1,000,000 Royal Bank Of Canada 10/01/2018 1,003,300 1.31
600,000 Royal Bank Of Canada 20/11/2019 571,980 0.75
1,200,000 Royal Bank Canada Toronto 11.04.19 908,111 1.19
900,000 SG 19/02/20 Corp Sp 779,940 1.02
1,500,000 SG 5y GBP Auto FTSE 100 Call 1,577,250 2.06
400,000 SG 5y GBP Cln On Itraxx Xover S24 S695 413,920 0.54
1,300,000 SG Gilt Backed Defensive Autocall 1,374,490 1.80
Portfolio Statement (continued)

7
Total Net Assets
Holding Portfolio of Investments Value (£) 31.01.17
% 31.07.16
%
Structured Products (continued)
1,050,000 SG4yGBP Range Acc FTSE 908,775 1.19
4,000,000 SG Itraxx Temp 122,400 0.16
900,000 Socgen 0 09/11/18 Corp 1,042,020 1.36
500,000 Socgen 4.1y FTSE Autocall 11/12/2020 496,050 0.65
Total Structured Products 34,662,235 45.36 46.30
Corporate Bonds
600,000 Barclays 7.75% 10/04/2023 498,973 0.65
626,900 Burford Capital 6.5% 19/08/2022 682,606 0.89
Total Corporate Bonds 1,181,579 1.54 1.95
Forward FX Currency Contracts
(3,075,000) Sell EUR, Buy GBP 2,665,368 20/04/2017 35,355 0.05
(9,555,000) Sell USD, Buy GBP 7,707,896 20/04/2017 165,046 0.21
Total Forward FX Currency Contracts 200,401 0.26 (0.05)
Futures
(16) FTSE 100 Index Future March 2017 3,200 -
100 FTSE 100 RDSA Future December 2019 450 -
(60) Long Gilt Future March 2017 (8,400) (0.01)
(10) Medium Gilt Future March 2017 (350) -
(140 MSCI Asia Ex Japan March 2017 (4,205) (0.01)
(15) Russell 2000 Mini March 2017 (8,813) (0.01)
(13) S&P500 EMINI EOM March 2017 (3,211) -
(100) Short Gilt Future March 2017 (500) -
Total Futures (21,829) (0.03) (0.75)
Portfolio of Investments 69,559,231 91.02 95.14
Forward FX Currency Contracts 200,401 0.26 (0.05)
Investment Liabilities (21,829) (0.03) (0.75)
Net Current Assets 6,680,365 8.75 5.66
Net Assets 76,418,169 100.00 100.00
The investments have been valued in accordance with note 1(b).

8
Net Asset Value per Share and Comparative Tables
A Accumulation share class
Change in net assets per share 31/01/2017 31/07/2016 31/07/2015 31/07/2014
Opening net asset value per share 124.2739 125.1200 121.7200 116.7600
Return before operating charges * 4.3771 -0.0461 3.5000 5.1500
Operating charges -0.8800 -0.8000 -0.1000 -0.1900
Return after operating charges 3.4971 -0.8461 3.4000 4.9600
Distribution on income shares 0.0000 0.0000 0.0000 0.0000
Closing NAV per share 127.7710 124.2739 125.1200 121.7200
Retained distribution on acc shares 0.0000 0.0000 0.1951 0.0000
* After direct transaction costs of 0.0493 0.0546 0.0043 0.0041
Return after charges 2.81% -0.68% 2.79% 4.25%
Other Information
Closing net asset value (£) 4,264,104 4,325,801 6,500,889 19,535,935
Closing number of shares 3,337,231 3,480,860 5,195,788 16,050,226
OCF 1.42% 1.46% 1.40% 1.36%
Direct transaction costs 0.04% 0.04% 0.00% 0.00%
Prices
Highest share price (pence) 128.56 125.89 125.92 122.43
Lowest share price (pence) 124.40 122.69 120.58 117.26
Performance
A Income share class
Change in net assets per share 31/01/2017 31/07/2016 31/07/2015 31/07/2014
Opening net asset value per share 124.1449 124.5900 121.7400 116.7500
Return before operating charges * 0.0000 -0.4451 3.0027 5.1800
Operating charges 0.0000 0.0000 -0.0100 -0.1900
Return after operating charges 3.4870 -0.4451 2.9927 4.9900
Distribution on income shares 0.0000 0.0000 -0.1427 0.0000
Closing NAV per share 127.6319 124.1449 124.5900 121.7400
* After direct transaction costs of 0.0000 0.0513 0.0014 0.0043
Return after charges 2.81% -0.36% 2.46% 4.27%
Other Information
Closing net asset value (£) - - 5,536 523,918
Closing number of shares - - 4,444 430,358
OCF 1.42% 1.46% 1.40% 1.36%
Direct transaction costs 0.00% 0.04% 0.00% 0.00%
Prices
Highest share price (pence) 128.43 125.51 125.56 122.43
Lowest share price (pence) 1.2427 122.33 120.57 117.26
Performance

9
Net Asset Value per Share and Comparative Tables (continued)
B Accumulation share class
Change in net assets per share 31/01/2017 31/07/2016 31/07/2015 31/07/2014
Opening net asset value per share 128.1476 128.1100 123.8400 117.8700
Return before operating charges * 4.5225 0.4876 4.4200 6.1600
Operating charges -0.4300 -0.4500 -0.1500 -0.1900
Return after operating charges 4.0925 0.0376 4.2700 5.9700
Distribution on income shares 0.0000 0.0000 0.0000 0.0000
Closing NAV per share 132.2401 128.1476 128.1100 123.8400
Retained distribution on acc shares 0.0000 0.5984 0.6583 0.2778
* After direct transaction costs of 0.0509 0.0565 0.0061 0.0046
Return after charges 3.19% 0.03% 3.45% 5.06%
Other Information
Closing net asset value (£) 71,492,915 69,060,409 71,199,643 49,284,215
Closing number of shares 54,062,972 53,891,302 55,579,363 39,797,456
OCF 0.67% 0.71% 0.65% 0.61%
Direct transaction costs 0.04% 0.04% 0.00% 0.00%
Prices
Highest share price (pence) 133.05 129.35 128.87 124.53
Lowest share price (pence) 1.2828 126.22 122.84 118.38
Performance
B Income share class
Change in net assets per share 31/01/2017 31/07/2016 31/07/2015
Opening net asset value per share 126.9101 127.4700 123.8400
Return before operating charges * 4.4644 0.5210 4.4772
Operating charges -0.4100 -0.4700 -0.1800
Return after operating charges 4.0544 0.0510 4.2972
Distribution on income shares 0.0000 -0.6109 -0.6672
Closing NAV per share 130.9645 126.9101 127.4700
* After direct transaction costs of 0.0505 0.0564 0.0068
Return after charges 3.19% 0.04% 3.47%
Other Information
Closing net asset value (£) 661,239 582,302 510,495
Closing number of shares 504,900 458,830 400,505
OCF 0.67% 0.71% 0.65%
Direct transaction costs 0.04% 0.04% 0.01%
Prices
Highest share price (pence) 131.77 128.48 128.63
Lowest share price (pence) 1.2717 125.40 124.41
Performance
1 The share class was launched on 24 November 2014.

10
Net Asset Value per Share and Comparative Tables (continued) Risk Warning An investment in an open-ended investment company (OEIC) should be regarded as a medium to long term investment. Investors should be aware that the price of shares and the income from them can fall as well as rise and investors may not receive back the full amount invested. Past performance is not a guide to future performance. Investments denominated in currencies other than the base currency are subject to fluctuations in exchange rates, which can be favourable or unfavourable. Fund Performance The performance of the fund is shown in the ACD’s Report.

11
Financial statements
Notes 31.01.17 31.01.16
Income £ £ £ £
Net capital gains/(losses) 4 2,673,858 (364,753)
Other losses 5 (376,043) (379,430)
Revenue 6 306,065 420,601
Expenses 7 (254,954) (292,450)
Finance costs: Interest 9 (4,478) (3,313)
Net revenue before taxation 46,633 124,838
Taxation 8 - (13,355)
Net revenue after taxation 46,633 111,483
2,344,448 (632,700)
Finance costs: Distribution 9 - (123,724)
2,344,448 (756,424)
£ £ £ £
Opening net assets attributable
to shareholders73,968,512 78,216,563
3,348,479 5,775,997
(3,247,495) (9,531,455)
Dilution levy 4,225
105,209 (3,755,458)
2,344,448 (756,424)
- 112,304
76,418,169 73,816,985
Statement of total returnFor the period ended 31 January 2017
Statement of change in net assets attributable to shareholdersFor the period ended 31 January 2017
Total return before distributions
Amounts receivable on issue of shares
Amounts payable on cancellation of shares
Change in net assets attributable to
shareholders from investment activities
Change in net assets attributable to
shareholders from investment activities
Closing net assets attributable to shareholders
Retained distribution on accumulation
shares

12
As at 31 January 2017
Notes 31.01.17 31.07.16
Assets £ £ £ £
Investment assets 69,759,633 70,334,763
Debtors 10 610,091 2,450,855
Bank balances 6,753,764 1,867,041
Total other assets 7,363,855 4,317,896
Total assets 77,123,488 74,652,659
Liabilities
Investment liabilities 21,829 546,896
Creditors 11 683,490 135,585
Bank overdrafts - 1,666
Total other liabilities 683,490 137,251
Net assets attributable to shareholders 76,418,169 73,968,512
Balance sheet

13
Notes to the financial statements As at 31 January 2017
1 Accounting policies
a) Basis of accounting
The financial statements have been prepared under the historical cost basis, in accordance with Financial Reporting Standard (FRS 102), as modified by the revaluation of investments, and in accordance with the revised Statement of Recommended Practice (SORP) for Authorised Funds issued by the Investment Management Association in May 2014. No changes to the Net Asset Value of the fund have arisen from the adoption of the SORP.
b) Basis of valuation of investments
The investments are valued at quoted bid prices for dual priced funds and at quoted prices for single priced funds, on the last business day of the accounting period.
c) Foreign exchange rates
Transactions in foreign currencies are recorded in sterling at the rate ruling at the date of the transactions. Assets and liabilities expressed in foreign currencies at the end of the accounting period are translated into sterling at the closing middle exchange rates ruling on that date.
d) Revenue
All income allocations and distributions declared by the managers of the underlying funds up to the accounting date are included in Income, net of attributable tax credits. The net allocations which are retained in Income are included in the fund’s own income allocation. Bank and other interest receivable is accrued up to the accounting date. Equalisation on distributions received is deducted from the cost of the investment and not included in the fund’s income available for distribution.
e) Expenses
The ACD’s periodic charge is deducted from Income. All of the other expenses are also charged against Income except for costs associated with the purchase and sale of investments which are charged against Capital.
f) Taxation
(i) The fund is treated as a corporate shareholder with respect to its underlying holdings and its income is subject to streaming into franked and unfranked.
(ii) Corporation tax is provided at 20% on income, other than the franked portion of distributions from collective investment schemes, after deduction of expenses.
(iii) The charge for deferred tax is based on the profit for the year and takes into account taxation deferred because of timing differences between the treatment of certain items for taxation and accounting purposes. Deferred tax is provided using the liability method on all timing differences, calculated at the rate at which it is anticipated the timing differences will reverse. Deferred tax assets are recognised only when, on the basis of available evidence, it is more likely than not that there will be taxable profits in the future against which the deferred tax asset can be offset.
2 Distribution policy
Income arising from investments accumulates during each accounting period. Surplus income is allocated to shareholders in accordance with the COLL regulations. In order to conduct a controlled dividend flow to shareholders, interim distributions will be made at the ACD’s discretion, up to a maximum of the distributable income available for the period. All remaining income is distributed in accordance with the COLL regulations.

14
3 Risk management policies
In pursuing the investment objective, a number of financial instruments are held which may comprise securities and other investments, cash balances and debtors and creditors, that arise directly from operations. Derivatives, such as futures or forward foreign exchange contracts, may be utilised for efficient portfolio management purposes. Political and economic events in the major economies of the world, such as the United States, Japan and the European Union, will influence stock and securities markets worldwide. The main risks from the fund’s holding of financial instruments with the ACD’s policy for managing these risks are set out below:
i. Credit Risk – The fund may find that collective investment schemes in which it invests fail to settle their debts or deliver the investments purchased on a timely basis.
ii. Interest Rate Risk – Debt securities may be held by the underlying investments of the fund.
The Interest Rate Risk of these securities is managed by the relevant manager.
iii. Foreign Currency Risk – Although the net assets of the fund are denominated in sterling, a proportion of the fund’s investments in collective investment schemes have currency exposure with the effect that the balance sheet and total return can be affected by currency movements.
iv. Liquidity Risk – The main liability of the fund is the cancellation of any shares that investors
want to sell. Securities may have to be sold to fund such cancellations should insufficient cash be held at the bank to meet this obligation. Smaller companies by their nature, tend to have relatively modest traded share capital, and the market in such shares can, at times, prove illiquid. Shifts in investor sentiment, or the announcement of new price-sensitive information, can provoke significant movement in share prices, and make dealing in any quantity difficult. The equity markets of emerging countries tend to be more volatile than the more developed markets of the world. Standards of disclosure and accounting regimes may not always fully comply with international criteria, and can make it difficult to establish accurate estimates of fundamental value. The dearth of accurate and meaningful information and insufficiencies in its distribution, can leave emerging markets prone to sudden and unpredictable changes in sentiment. The resultant investment flows can trigger significant volatility in these relatively small and illiquid markets. At the same time, this lack of liquidity, together with the low dealing volumes, can restrict the ACD’s ability to execute substantial deals.
v. Market Price Risk – Market Price Risk is the risk that the value of the fund’s financial instruments will fluctuate as a result of changes in market prices caused by factors other than interest rates or foreign currency movement. The Market Price Risk arises primarily from uncertainty about the future prices of financial instruments that the fund holds.
Market Price Risk represents the potential loss the fund may suffer through holding market positions in the face of price movements. This risk is generally regarded as consisting of two elements – Stock Specific Risk and Market Risk. The fund’s exposure to Stock Specific Risk is reduced for equities and bonds through the holding of a diversified portfolio in accordance with the investment and borrowing powers set out in the Instrument of Incorporation.
vi. Counterparty Risk – Transactions in securities entered into by the fund give rise to exposure to the risk that the counterparties may not be able to fulfil their responsibility by completing their side of the transaction.
vii. Fair Value of Financial Assets and Financial Liabilities – There is no material difference
between the value of the financial assets and liabilities, as shown in the balance sheet, and their fair value.

15
4 Net capital gains/(losses) 31.01.17 31.01.16
£ £
Proceeds from sales on investments during the period 26,936,661 24,691,147
Original cost of investments sold during the period (24,304,844) (23,544,456)
Gains realised on investments sold during the period 2,631,817 1,146,691
Net appreciation thereon already recognised in prior periods (1,511,811) (1,476,279)
Net realised appreciation/(depreciation) for the period 1,120,006 (329,588)
Net unrealised appreciation for the period 1,349,641 26,985
Net gains/(losses) on non-derivative securities 2,469,647 (302,603)
Net gains/(losses) on derivatives 204,211 (62,150)Net capital gains/(losses) on investments 2,673,858 (364,753)
5 Other losses
Realised currency forward losses (570,669) (379,430)
Unrealised currency forward gains 194,626 - (376,043) (379,430)
6 Purchases, sales and transaction costs
Purchases excluding transaction costs 6,782,692 5,457,601
Commissions : 0.14% [ 0.11%] 9,677 6,163
Stamp duty : 0.20% [ 0.05%] 13,264 2,959
Trustee transaction charges : 0.02% [ 0.01%] 1,617 546Purchases including transaction costs 6,807,250 5,467,269
Sales excluding transaction costs 9,742,737 12,552,583
Commissions : 0.02% [ 0.09%] (2,335) (11,204)
Trustee transaction charges : 0.01% [ 0.01%] (941) (866)Sales including transaction costs 9,739,461 12,540,513
Purchases excluding transaction costs - 1,480,372
Commission : Nil% [0.06%] - 909
Trustee transaction charges : Nil % [ 0.01%] - 193Purchases including transaction costs - 1,481,474
Sales excluding transaction costs 510,684 2,026,396
Commission : Nil % [0.06%] - (1,200)
Trustee transaction charges : 0.01% [ 0.01%] (38) (278)Sales including transaction costs 510,646 2,024,918
Purchases excluding transaction costs 16,843,390 17,242,384
Commissions : 0.01% [ 0.02%] 915 3,431
Trustee transaction charges : 0.00% [ 0.00%] 394 471Purchases including transaction costs 16,844,699 17,246,286
Sales excluding transaction costs 16,685,575 10,124,691
Commissions : Nil% [ 0.02%] - (118)
Trustee transaction charges : 0.00% [ 0.00%] (267) (182)Sales including transaction costs 16,685,308 10,124,391
Trustee transaction charges have been deducted in determining net capital
Transaction charges are displayed as percentage of purchase/sale
Closed Ended Securities
Debt Securities
Derivatives

16
6 Purchases, sales and transaction costs 31.01.17 31.01.16
£ £ Total commission : 0.02% [0.03%] 12,927 23,025
Total stamp duty : 0.02% [0.00%] 13,264 2,959
Total trustee transaction charges : 0.00% [0.00%] 3,257 2,535
Total charges displayed as percentage of average net asset value
Average portfolio dealing spread : 1.26% [1.30%]
7 Revenue
UK franked dividends 37,941 40,209
Gross bond interest 102,631 150,381
Overseas franked income 23,032 17,856
Overseas gross unfranked income 142,443 212,143
Bank interest 18 12Total revenue 306,065 420,601
8 Expenses
ACD's periodic charge 187,826 192,351
Depositary's fee 21,314 21,213
Safe custody 836 15,314
22,150 36,527
Other expenses:
FCA fee 84 (63)
Audit fee 3,660 5,032
Registration fees 15,549 5,630
Sundry charges 2,592 -
Printing costs 1,110 (5,029)
Price data provision 14,683 14,375
Transfer agency fee 5,729 40,196
Distribution costs 1,571 3,431Total expenses 254,954 292,450
Payable to the Depositary associates of the Depositary and agents of either:
Payable to the ACD, associates of the ACD and agents of either:
17
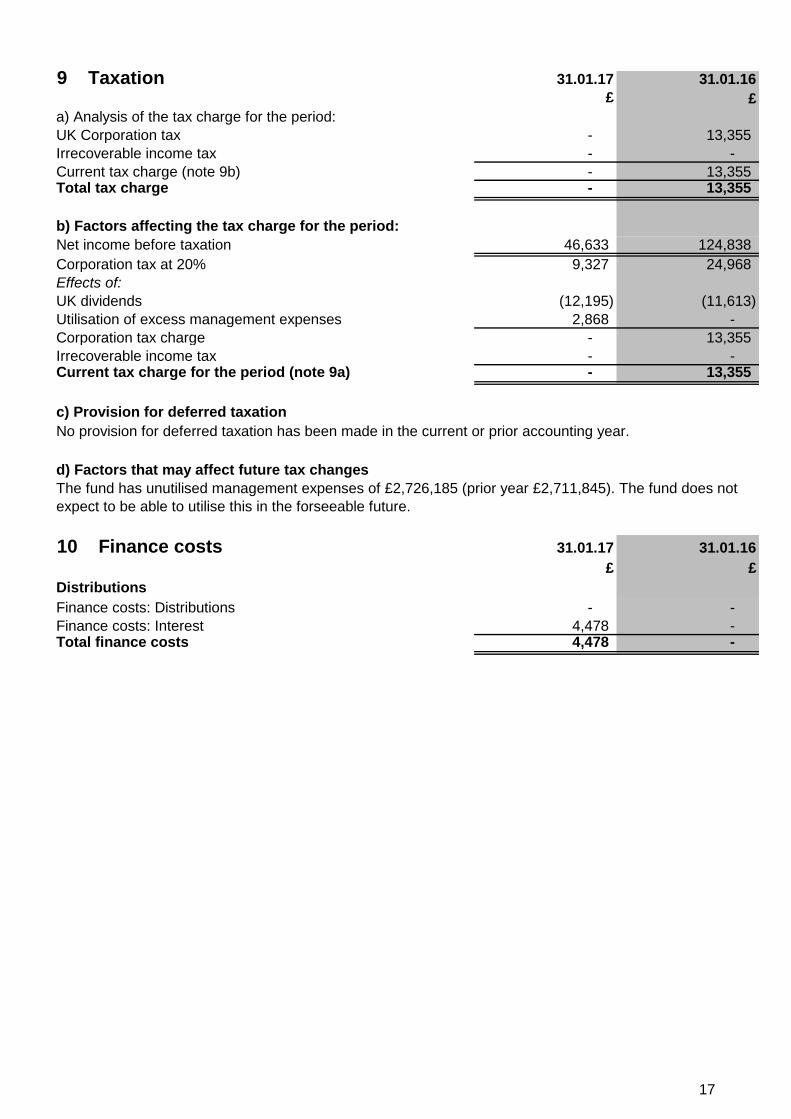
9 Taxation 31.01.17 31.01.16
£ £
a) Analysis of the tax charge for the period:
UK Corporation tax - 13,355
Irrecoverable income tax - -
Current tax charge (note 9b) - 13,355Total tax charge - 13,355
b) Factors affecting the tax charge for the period:
Net income before taxation 46,633 124,838
Corporation tax at 20% 9,327 24,968
Effects of:
UK dividends (12,195) (11,613)
Utilisation of excess management expenses 2,868 -
Corporation tax charge - 13,355
Irrecoverable income tax - - Current tax charge for the period (note 9a) - 13,355
c) Provision for deferred taxation
No provision for deferred taxation has been made in the current or prior accounting year.
d) Factors that may affect future tax changes
The fund has unutilised management expenses of £2,726,185 (prior year £2,711,845). The fund does not
expect to be able to utilise this in the forseeable future.
10 Finance costs 31.01.17 31.01.16
£ £
Distributions
Finance costs: Distributions - -
Finance costs: Interest 4,478 - Total finance costs 4,478 -

18
11 Debtors 31.01.17 31.07.16
£ £
Amounts receivable for issue of shares 142,781 81,527Amounts receivable for investment securities sold 332,557 2,278,794
Accrued income:UK franked dividends 12,150 11,250UK unfranked dividends 6,300 6,300Bond interest 45,854 46,895Gross bond interest 842 842Overseas franked dividends 4,192 3,147Overseas gross unfranked income 15,387 22,095
84,725 90,529
Prepayments 83 5
Other receivables 6,231 -
Taxation recoverable 43,714 - Total debtors 610,091 2,450,855
12 Creditors
Amounts payable for cancellation of shares 465,448 32,263
Amounts payable for investment securities purchased 122,278 -
Accrued expenses:
Amounts payable to the ACD, associates and agents:
ACD's periodic charge 30,076 31,182
Amounts payable to the Depositary, associates and agents:
Depositary's fees 3,407 3,528
Transaction charges 332 340
Safe custody fee 3,301 11,443
7,040 15,311
Other expenses 18,049 45,287
Taxation payable:
Corporation tax 40,599 11,542Total creditors 683,490 135,585
13 Contingent liabilities and commitments
There were no contingent liabilities or outstanding commitments at the balance sheet date [31.07.16 : £Nil].
14 Related party transactions
Margetts Fund Management Ltd as ACD, is a related party, and acts as principal in respect of all transactions of shares in the Company. The aggregate monies received through issues, and paid on cancellations are disclosed in the statement of change in net assets attributable to shareholders and note 11. Amounts paid to Margetts Fund Management Ltd in respect of management services are disclosed in note 8 and amounts due at the end of the year in note 12. All other amounts paid to, or received from, the related parties, together with the outstanding balances are disclosed in the financial statements.

19
Acc Inc B Acc B Inc
Opening number of shares 3,480,860 - 53,891,302 458,830
Shares issued 7,735 - 4,188,591 48,050
Shares converted (27,127) - 26,304 -
Shares redeemed (124,237) - (4,043,225) (1,980)Closing number of shares 3,337,231 - 54,062,972 504,900
15 Shareholders' funds
16 Risk disclosures Debt securities may be held by the underlying investments of the fund. The Interest Rate Risk of these securities is managed by the relevant manager. The table below shows the Interest Rate Risk profile at the balance sheet date:
The floating rate financial assets and liabilities comprise bank balances, which earn or pay interest at rates linked to the UK base rate.
31.01.17 31.07.16
£ £
Floating rate assets (pounds sterling): 6,434,721 1,343,165
Floating rate assets (australian dollars): 21,451 20,526
Floating rate assets (swiss francs): 2,192 2,147
Floating rate assets (euro): 170 276,796
Floating rate assets (hong kong dollars): 11,108 10,660
Floating rate assets (us dollars): 284,122 213,747
Assets on which interest is not paid (pounds sterling): 56,393,636 69,573,811
Assets on which interest is not paid (euro): 4,667,438 480,841
Assets on which interest is not paid (us dollars): 13,645,310 2,586,845
Assets on which interest is paid (pounds sterling): 5,537,629 5,121,462
Assets on which interest is paid (us dollars): 498,973 725,681
Liabilities on which interest is not paid (pounds sterling): (683,490) (684,147)
Liabilities on which interest is not paid (euro): (2,665,367) (1,111,904)
Liabilities on which interest is not paid (us dollars): (7,707,895) (4,591,118)
Net Assets 76,439,998 73,966,846
ii. Currency risk 31.01.17 31.07.16
£ £
GBP 67,682,496 75,354,291
Australian dollars 21,451 20,526
Swiss francs 2,192 2,147
Euro 2,002,241 (354,267)
Hong Kong dollars 11,108 10,660
US dollars 6,720,510 (1,064,845)Net Assets 76,439,998 73,968,512
Fixed rate financial assets have the below weighted average yield and period for which income is fixed:
Years %
GBP 2.54 4.07
US Dollars 6.19 7.75

20
17 Post balance sheet events
There were no material post balance sheet events which have a bearing on the understanding of the financial statements.
18 Fair Value Techniques
Assets 31.01.17 31.07.16
£ £
Quoted prices for identical instruments in active markets 69,759,633 70,334,763
Prices of recent transactions for identical instruments - -
Valuation techniques using observable data 200,401 (36,000)
Valuation techniques using non-observable data - -
69,960,034 70,298,763
Liabilities
£ £
Quoted prices for identical instruments in active markets (21,829) (546,896)
Prices of recent transactions for identical instruments - -
Valuation techniques using observable data - -
Valuation techniques using non-observable data - -
21,829- 546,896-
19 Remuneration
In accordance with the requirements of FUND 3.3.5(5) the total amount of remuneration paid by the ACD to its staff for the financial period ended 30 September 2016 is:
2016
£
Fixed Remuneration 1,351,756
Variable Remuneration 1,573,101
Total Remuneration 2,924,857
Full Time Equivalent number of staff 38
Analysis of senior management
Senior management 1,813,059
Staff whose actions may have a material impact on the funds -
Other -
1,813,059
The remuneration for senior management has been calculated in accordance with the remuneration policy and is reviewed annually. The remuneration policy and, where required by the FCA, how benefits are calculated together with details of the remuneration committee can be found on the website: www.margetts.com. A paper copy of this is available free of charge upon request by writing to the compliance officer at 1 Sovereign Court, Graham Street, Birmingham B1 3JR. No material changes were made to the policy or irregularities reported at the last review.

21
20 Periodic disclosure
As required by FUND 3.2.5R the ACD is required to disclose certain information periodically in relation to the Fund which is shown below. At the end of the reporting period the percentage of the Fund’s assets subject to special arrangements arising from their illiquid nature was 0% of the NAV. There have been no new arrangements introduced for managing the liquidity of the Fund.
The risk characteristics of the Fund are explained in the Prospectus. In order to assess the sensitivity of the Fund’s portfolio to the risks to which the Fund is or could be exposed, Margetts Fund Management Ltd monitors relative value at risk, commitment, gross leverage and the results of stress tests. The ACD has set limits considered appropriate to the risk profile of the fund. Any breaches of these limits are investigated by the Margetts risk committee and appropriate action taken if necessary. During the reporting period there have been no changes to the maximum level of leverage that the Fund can employ or any right of reuse of collateral or any guarantee granted under leveraging arrangements. At the end of the reporting period the total amount of leverage, expressed as a ratio, calculated using the commitment approach was 1:0.91 and using the gross method was 1:0.91.
Leverage is limited to overdraft use and the gross exposure from EPM techniques. Although the ACD may use derivatives for EPM, no collateral arrangements are currently in place and no asset re-use arrangements are in place. The Fund does not currently, and does not envisage in the future, intentionally employing leverage as a part of its investment strategy. However it does invest in some instruments, such as convertible bonds and structured products, which embed derivatives and it utilises derivative hedging instruments. Some of these hedging instruments do not meet all the commitment leverage methodology requirements for them to be offset against the positions they are hedging. The majority of derivative hedging instruments are held to offset interest rate, currency and general equity exposures, reducing the risks the Fund is exposed to. In addition, the Fund may experience a small amount of leverage when using its permitted 10% of net asset value short term borrowing facility used in the course of the routine settlement of positions. Consequently, the maximum leverage of the Fund calculated using the ‘commitment leverage’ methodology and “gross leverage” methodology has therefore been set at 1.5:1 and 2:1 respectively.

22
Distribution Table For the six months ended 31 January 2017 - in pence per share
Interim Group 1 – shares purchased prior to 01 August 2016 Group 2 – shares purchased on or after 01 August 2016
A Accumulation shares
Units Net Income Equalisation Allocating 31.03.17
Allocated 31.03.16
Group 1 - - - - Group 2 - - - -
A Income shares
Units Net Income Equalisation Payable 31.03.17 Paid 31.03.16
Group 1 - - - - Group 2 - - - -
B Accumulation shares
Units Net Income Equalisation Allocating 31.03.17
Allocated 31.03.16
Group 1 - - - 0.2326 Group 2 - - - 0.2326
B Income shares
Units Net Income Equalisation Payable 31.03.17 Paid 31.03.16
Group 1 - - - 0.2478 Group 2 - - - 0.2478
Equalisation only applies to shares purchased during the distribution period (group 2 shares). It represents the accrued income included in the purchase price of the shares. After averaging it is returned with the distribution as a capital repayment. It is not liable to income tax but must be deducted from the cost of the shares for capital gains tax purposes.

23
General Information Valuation Point The Valuation Point of the fund is at 12.00pm each business day. Valuations may be made at other times with the Depositary’s approval. Buying and Selling of Shares The ACD will accept orders to buy or sell shares on normal business days between 9.00am and 5.00pm and transactions will be effected at prices determined by the following valuation. Instructions to buy or sell shares may be made either in writing to: Margetts Fund Management Ltd, PO Box 17067, Birmingham B2 2HL or by telephone on 0345 607 6808. A contract note will be issued by close of business on the next business day after the dealing date to confirm the transaction. Prices The most recent mid prices of shares are published on the Margetts website at www.margettsfundmanagement.com. Other Information The Instrument of Incorporation, Prospectus, Key Investor Information Document, Supplementary Information Document and the latest annual and interim reports may be inspected at the offices of the ACD, with a copy available, free of charge, on written request. The register of shareholders can be inspected by shareholders during normal business hours at the offices of the Administrator. The Head Office of the Company is at 1 Sovereign Court, Graham Street, Birmingham B1 3JR and is also the address of the place in the United Kingdom for service on the Company of notices or other documents required or authorised to be served on it.
The base currency of the Company is pounds (£) sterling.
The maximum share capital of the Company is currently £100,000,000,000 and the minimum is £1000. Shares in the Company have no par value and therefore the share capital of the Company at all times equals the Company’s current net asset value. Shareholders who have any complaints about the operation of the fund should contact the ACD or the Depositary in the first instance. In the event that a shareholder finds the response unsatisfactory, they may make their complaint direct to the Financial Ombudsman Service at South Quay Plaza, 183 Marsh Wall, London E14 9SR. Data Protection Act Shareholders’ names will be added to a mailing list which may be used by the ACD, its associates or third parties, to inform investors of other products by sending details of such products. Shareholders who do not want to receive such details should write to the ACD, requesting their removal from any such mailing list.