interim report january - june 2015 - start - sagax q2 eng 2015.pdfinterim report january - june 2015...
TRANSCRIPT
Interim report January - June 2015
AB Sagax is a property company whose business concept is to invest in commercial properties, primarily in
the warehouse and light industry segment.

Interim report January - June 2015
FIRST SIX MONTHS OF 2015 ■ Rental revenue increased 17% to SEK 616 M (526 for the year-earlier period).
■ Profit from property management increased 24% to SEK 395 M (319). Profit from property management per common share after dilution rose 26% to SEK 2.12 (1.68). In connection with early refinancing, nonrecurring expenses of SEK 28 M were charged to earnings for the period.
■ In total, property revaluation affected profit by SEK 430 M (253), of which joint ventures accounted for SEK 89 M (237).
■ Revaluation of fixed-income derivatives had an impact total-ing SEK 86 M on profit (neg 262), of which joint ventures accounted for SEK 44 M (neg 108).
■ Profit after tax for the period amounted to SEK 724 M (249), corresponding to SEK 4.19 (1.24) per common share after dilution.
■ Cash flow from operating activities before changes in work-ing capital amounted to SEK 322 M (258), corresponding to SEK 1.66 (1.29) per common share after dilution.
■ During the period, Sagax invested a net amount of SEK 770 M (1,066), of which the acquisition of 17 properties accounted for SEK 698 M.
SECOND QUARTER OF 2015 ■ Rental revenue increased 15% to SEK 309 M (269 for the year-earlier period).
■ Profit from property management increased 9% to SEK 196 M (179). In connection with early refinancing, nonrecurring ex-penses of SEK 28 M were charged to earnings for the quarter.
■ In total, property revaluation affected profit by SEK 346 M (218), of which joint ventures accounted for SEK 48 M (245).
■ Revaluation of fixed-income derivatives had an impact total-ing SEK 149 M on profit (neg 139), of which joint ventures accounted for SEK 79 M (neg 58).
■ Profit after tax for the period amounted to SEK 537 M (207).
■ Cash flow from operating activities before changes in work-ing capital amounted to SEK 169 M (138).
■ During the period, Sagax invested a net amount of SEK 348 M (416), of which the acquisition of nine properties accounted for SEK 319 M.
ADJUSTED FORECAST FOR 2015Profit from property management for 2015, meaning profit before revaluations and tax, is expected to amount to SEK 860 M based on the current property portfolio and announced acquisitions and divestments. The previously submitted forecast was for profit of SEK 840 M and was presented in conjunction with the publication of the interim report for January - March 2015.
The period in brief
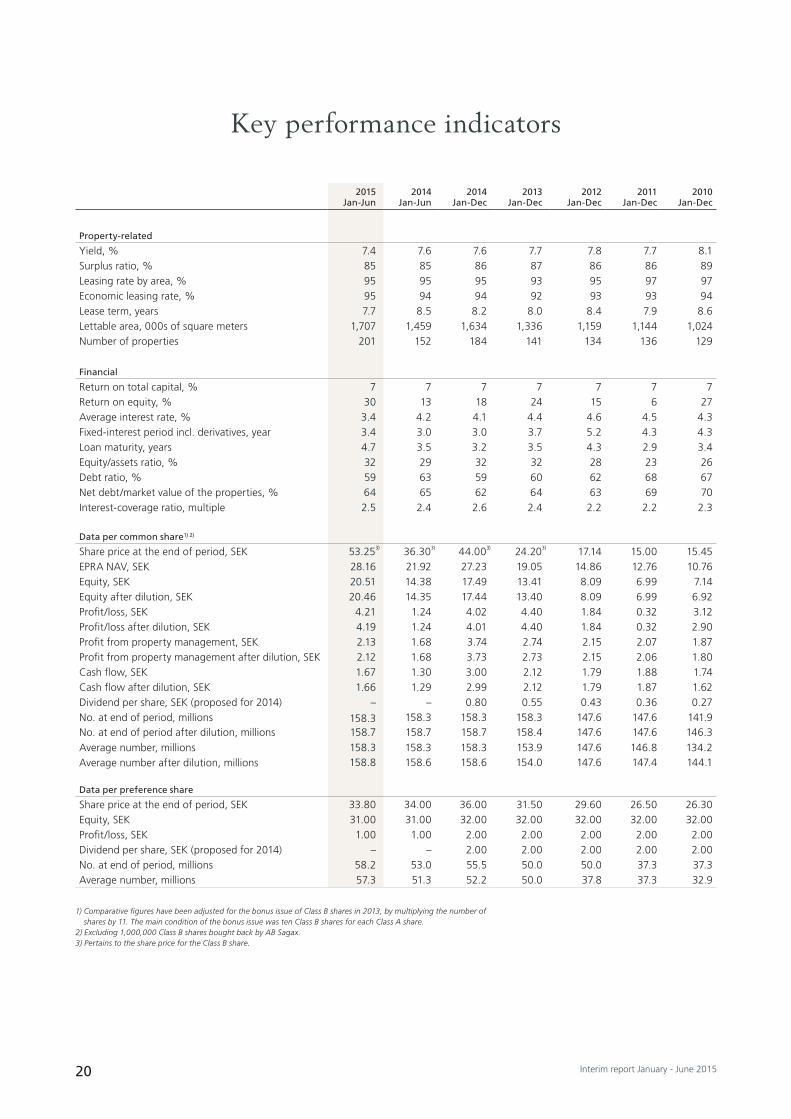
Selected key performance indicators
2015 2014 2014 2013 2012 2011 2010Jan-Jun Jan-Jun Jan-Dec Jan-Dec Jan-Dec Jan-Dec Jan-Dec
Profit from property management per common share, SEK 2.12 1.68 3.73 2.73 2.15 2.06 1.80 Change compared with preceding year 26% 33% 37% 27% 4% 14% 23%Earnings per common share, SEK 4.19 1.24 4.01 4.40 1.84 0.32 2.90Dividend per common share, SEK – – 0.80 0.55 0.43 0.36 0.27Dividend per preference share, SEK – – 2.00 2.00 2.00 2.00 2.00Market value of properties, SEK M 14,378 12,029 13,428 10,825 9,396 8,961 7,535Yield 7.4% 7.6% 7.6% 7.7% 7.8% 7.7% 8.1%Lease term, years 7.7 8.5 8.2 8.0 8.4 7.9 8.6
1Interim report January - June 2015
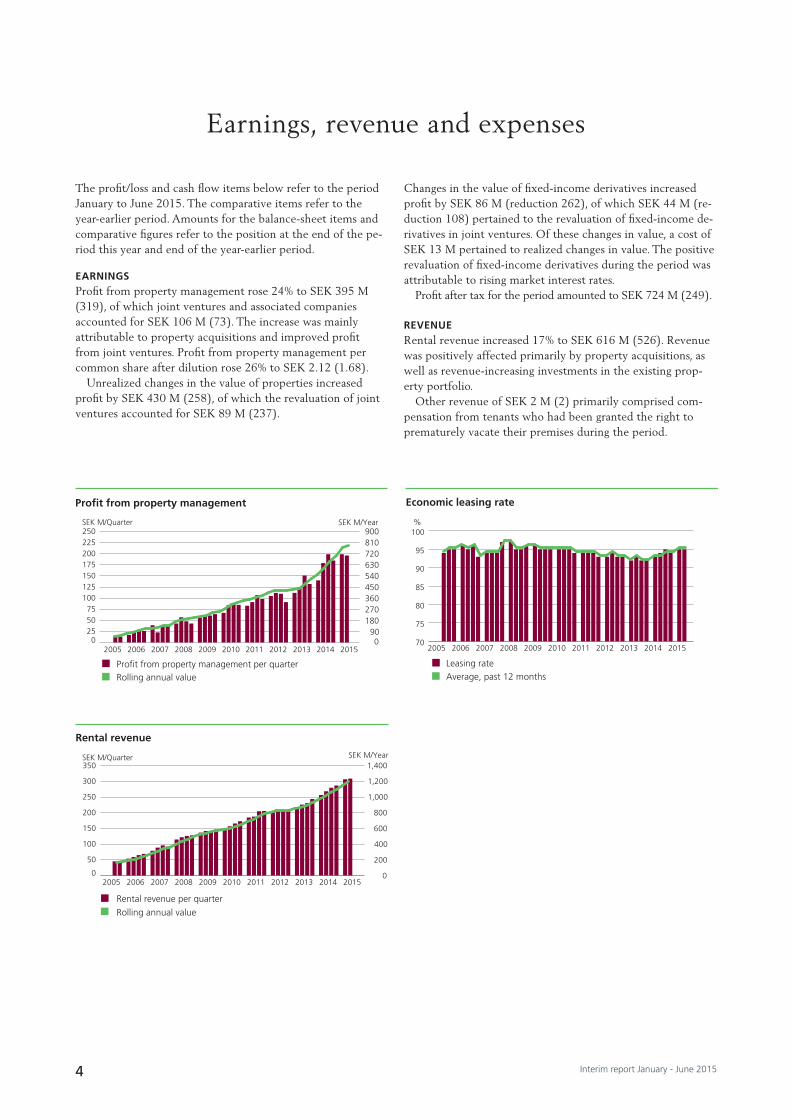
SAGAX’S EARNINGS TRENDSagax’s profit from property management for the first half of the year amounted to SEK 395 M, which was the highest profit from property management Sagax has been able to re-port and represented a year-on-year improvement of 24%. The increase was SEK 76 M and comprised a higher net operating income (up SEK 76 M) and increased earnings from joint ven-tures (up SEK 33 M), which were charged with higher central administration costs (up SEK 5 M) and increased financial ex-penses (up SEK 27 M).
The increase in net operating income was primarily attrib-utable to the acquisition by Sagax of properties for approxi-mately SEK 1.6 billion in the past year. In the same manner, our joint ventures have completed several complementary ac-quisitions, which have increased their earnings, thus contribut-ing to the Group’s profit from property management.
Sagax’s central administration costs have been stable in re-cent years but have, as a consequence of increasingly extensive operations and, accordingly, the accompanying need for addi-tional employees risen during the period. In the second quar-ter, costs rose SEK 6 M year-on-year. Over and above normal costs, this was driven by recruitment expenses and non-bill-able project planning costs. I assess the current organization as adequate for the foreseeable future and do not expect any-thing more than marginal changes in the costs.
Financial expenses for the period included nonrecurring ex-penses of SEK 28 M. These costs were charged to earnings for the second quarter as a consequence of Sagax selecting to re-finance the equivalent of half its interest-bearing borrowings (SEK 4.3 billion) ahead of time. The costs mainly comprised accrued expenses that would have been expensed over the re-maining tenors of the loans. The refinancing has led to lower financial risk and enhanced terms and conditions.
The earnings impact of the refinancing is shown in Sagax’s earnings capacity which, as of July 1, was calculated at SEK 953 M per year (refer to page 8 for the calculation). Accord-ingly, the earnings capacity has increased by SEK 105 M since April 1, of which SEK 23 M is attributable to lower financial expenses despite a parallel rise in borrowings of SEK 682 M as a consequence of investing activities. The remaining in-crease in earnings capacity is attributable to the acquisitions we made during the year and is allocated equally between our joint ventures and the wholly owned property portfolio.
CHANGE IN THE PROPERTIES’ MARKET VALUESagax uses external valuations of its properties and, gener-ally, reports relatively small changes in value. However, in the
first six months, Sagax reported changes in value amounting to SEK 341 M (up 2.4%), of which SEK 298 M pertained to the second quarter. The change in value was essentially exclu-sively attributable (SEK 287 M of SEK 341 M) to declining yield requirements as a consequence of a stronger investment market, primarily in Stockholm. Sagax’s Stockholm portfolio accounted for 68% of the entire portfolio’s change in value, corresponding to a 3.9% upward adjustment of property val-ues since the start of the year. The market value of the prop-erties in our other markets rose SEK 108 M, corresponding to 1.6%.
My assessment is that this discrepancy in value change and the relatively substantial value adjustment in Stockholm cor-rectly reflect the investment market. Interest rates and access to equity have impacted values but it is primarily the rapid population increase and, accordingly, the consequent future potential for housing projects that have driven property values in Stockholm’s older industrial areas. I would not exclude fur-ther increases in value moving forward.
OTHER MARKET AND COMPANY NEWSMy view is that the rental market remains healthy and that the investment market, as stated above, continues to be ex-tremely strong. The capital and bank markets function well and I do not anticipate any major risks from their direction. I assess the company as functioning smoothly and am pleased about the new employees who have chosen to start at Sagax. The only operational disappointment comprised the termina-tion of a major lease of approximately 30,000 square meters in Helsinki just ahead of the summer. We take comfort from the fact that it was a relatively low rental income, good prem-ises and an excellent location.
FORECAST PROFIT FROM PROPERTY MANAGEMENTOur assessment is that Sagax’s profit from property manage-ment in 2015 will amount to SEK 860 M based on the current property portfolio and announced acquisitions and divestments. The previous forecast, announced in conjunction with the first-quarter report, was SEK 840 M.
Stockholm, August 25, 2015
DAVID MINDUSChief Executive Officer
CEO’S comments

2 Interim report January - June 2015
BUSINESS CONCEPTAB Sagax is a property company whose business concept is to invest in commercial properties, primarily in the warehouse and light industry segment.
COMPANY GOALSThe overriding goal is the long-term generation of the maxi-mum risk-adjusted return to the company’s owners. To reach this goal, Sagax has set the following business targets:
■ Operations must generate a long-term sustainable return and strengthen cash flow.
■ The company is to continue to grow through property acquisitions after taking into account the risk-adjusted return.
■ Measured in real terms, the company is to create cash-flow growth from the existing property portfolio.
FINANCIAL TARGETS ■ The return on equity, measured over a five-year period, should not fall below 15% per year. During the period, it was 30%. The average return over the past five years has been 20% per year.
■ Profit from property management per common share should increase by a minimum of 15% per year. During the period, it increased to SEK 2.12 per common share, up 26% com-pared with the year-earlier period. The average annual in-crease over the past five years has been 22%.
■ The long-term target for the interest-coverage ratio is a mini-mum of 150%. The interest-coverage ratio amounted to 245% and the average over the past five years has been 244%.
■ The long-term target for the debt ratio is that it should be less than 70%. The debt ratio amounted to 59% and the average over the past five years has been 64%.
The following diagram illustrates the outcome for the past five years in relation to the financial targets.
Business concept, goals and strategies
Debt ratio
Debt ratio
Over the long term, must never exceed 70%
0
10
20
30
40
50
60
70
80
201520142013201220112010
%
Return on equity, rolling 5 years
Objective for return on equity over a five-year period
0
10
20
30
40
50
201520142013201220112010
Return on equity
%
Return on equity
Interest coverage ratio
Interest-coverage ratio
Over the long term, must never be less than 150%
0
50
100
150
200
250
300
201520142013201220112010
%
Annual growth rate, rolling 12 months
Objective for annual growth rate
Profit from property management per common share, rolling 12 months
Profit from property management per common share
SEK
0
1.0
2.0
3.0
4.0
5.0
2015201420132012201120100
10
20
30
40
50%

3Interim report January - June 2015
Market value
Lettable area
Market value and area of properties
000s square meters SEK M
0
300
600
900
1,200
1,500
1,800
201520142013201220112010200920082007200620050
3,000
6,000
9,000
12,000
15,000
18,000
STRATEGIESInvestment strategySagax invests primarily in warehouse and industrial properties. As a result of a high continuous yield in combination with a low rate of new production and stable leasing rates, properties designed as warehouses and for light industries are attractive investment objects. Sagax invests in complementary acquisi-tions and investments in existing properties. Property acqui-sitions and investments in the existing portfolio are aimed at increasing cash flow and diversifying rental revenue to there-by reduce the company’s operational and financial risks. The following diagram illustrates Sagax’s rate of growth over a ten-year period in terms of the properties’ market value and lettable area since 2005.
Financing strategyThe financing structure of Sagax is designed with a clear focus on operating cash flow and the interest-coverage ratio. This is expected to create excellent prerequisites for expansion and an attractive return on shareholders’ capital. The following diagram shows Sagax’s profit from property management and cash flow from operating activities. As illustrated, cash flow corresponds closely to profit from property management. The deviation is due mainly to profit from joint ventures, which is not recognized as cash flow. Dividends received from joint ventures are recognized as cash flow from operating activities.
Sagax adopts a conservative approach to the assumption of risk and thus endeavors to achieve well-balanced fixed inter-est and maturity structures to secure operating cash flow. The average fixed-interest period was 3.4 (3.0) years at the end of the quarter. The long fixed-interest period reduces interest-rate sensitivity but results in a higher average interest rate than a shorter fixed-interest period. The company also endeav-ors to have a low refinancing risk. The average maturity period at the end of six months was 4.7 (3.5) years.
The company has three classes of shares: Class A com-mon shares, Class B common shares, and preference shares. The preference shares attract investor categories that value a steady stream of dividends. The preference shares diversify Sagax’s capital base and allow the company to increase the
Group’s capital without increasing the number of common shares. Class B shares have been issued to positively impact the liquidity and pricing of common shares while contributing to enhancing Sagax’s financial flexibility.
Management strategySagax pursues efficiency and a long-term approach in its man-agement strategy. The management strategy includes actively pursuing long leases. This applies equally to new leases and to the management of existing leases. The company’s policy is to abstain from attempting to maximize rent levels at all points of time in favor of reaching lease agreements of a longer dura-tion with solvent tenants. This is regarded as being more ad-vantageous since it reduces the risk of vacancies, while leading to reduced costs for letting premises and adapting premises to tenant needs. On June 30, the average remaining term under the company’s leases was 7.7 years (8.5).
Strategy for tenantsSagax endeavors to attract well-reputed and creditworthy ten-ants. The company mainly enters into leases that exclude the cost of heating and hot water and that are thus only affected to a limited extent by changes in consumption or changed rates, pertaining to such utilities as heating, electricity, prop-erty tax, water and sewage.
Strategy for the rental marketSagax invests primarily in regions experiencing stable popu-lation growth and that have diversified business activities. Sagax’s greatest exposure to the rental market occurs in Stockholm and Helsinki, which are the markets regarded as offering the best potential for long-term growth in the Nordic region. The risk of a decline in the leasing rate and rent lev-els due to a weaker rental market is regarded as low in view of the stable demographic growth and the diversified business operations in these regions. Read more about this in the Sagax Annual Report for 2014.
Profit from property management, rolling annual valueCash flow from operating activities before change in working capital, rolling annual value
Profit from property management and cash flow
SEK M
0
100
200
300
400
500
600
700
800
20152014201320122011201020092008200720062005
4 Interim report January - June 2015
The profit/loss and cash flow items below refer to the period January to June 2015. The comparative items refer to the year-earlier period. Amounts for the balance-sheet items and comparative figures refer to the position at the end of the pe-riod this year and end of the year-earlier period.
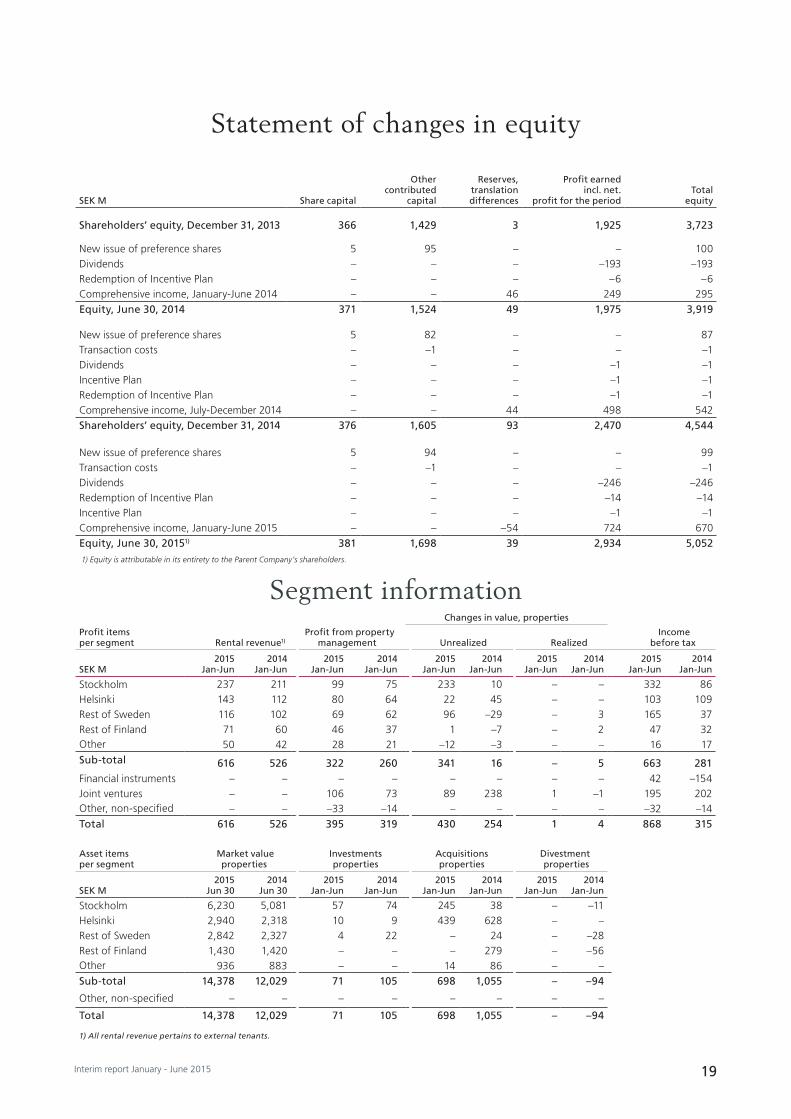
EARNINGSProfit from property management rose 24% to SEK 395 M (319), of which joint ventures and associated companies accounted for SEK 106 M (73). The increase was mainly attributable to property acquisitions and improved profit from joint ventures. Profit from property management per common share after dilution rose 26% to SEK 2.12 (1.68).
Unrealized changes in the value of properties increased profit by SEK 430 M (258), of which the revaluation of joint ventures accounted for SEK 89 M (237).
Changes in the value of fixed-income derivatives increased profit by SEK 86 M (reduction 262), of which SEK 44 M (re-duction 108) pertained to the revaluation of fixed-income de-rivatives in joint ventures. Of these changes in value, a cost of SEK 13 M pertained to realized changes in value. The positive revaluation of fixed-income derivatives during the period was attributable to rising market interest rates.
Profit after tax for the period amounted to SEK 724 M (249).
REVENUERental revenue increased 17% to SEK 616 M (526). Revenue was positively affected primarily by property acquisitions, as well as revenue-increasing investments in the existing prop-erty portfolio.
Other revenue of SEK 2 M (2) primarily comprised com-pensation from tenants who had been granted the right to prematurely vacate their premises during the period.
Earnings, revenue and expenses
Rolling annual valueProfit from property management per quarter
Profit from property management
SEK M/Quarter SEK M/Year
0255075
100125150175200225250
201520142013201220112010200920082007200620050
90180270360450540630720810900
Rolling annual value
Rental revenue per quarter
Rental revenue
SEK M/Quarter SEK M/Year
0
50
100
150
200
250
300
350
201520142013201220112010200920082007200620050
200
400
600
800
1,000
1,200
1,400
Average, past 12 monthsLeasing rate
Economic leasing rate
%
70
75
80
85
90
95
100
20152014201320122011201020092008200720062005
5Interim report January - June 2015
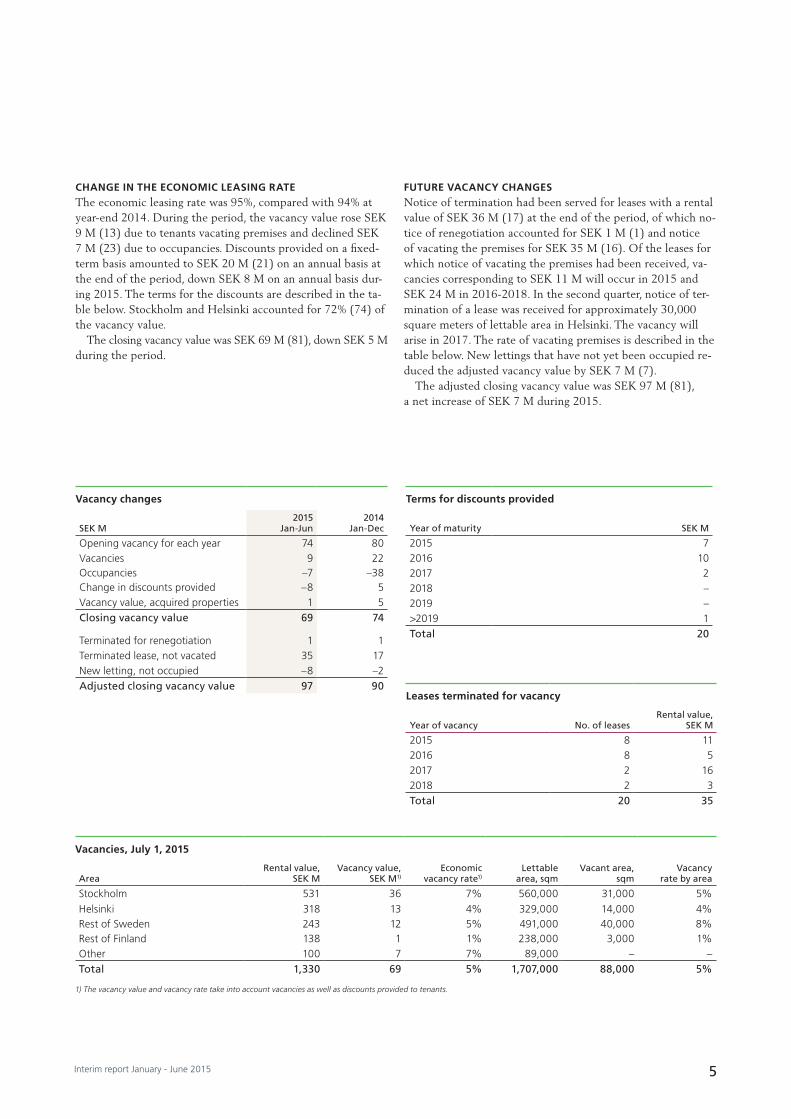
CHANGE IN THE ECONOMIC LEASING RATE The economic leasing rate was 95%, compared with 94% at year-end 2014. During the period, the vacancy value rose SEK 9 M (13) due to tenants vacating premises and declined SEK 7 M (23) due to occupancies. Discounts provided on a fixed-term basis amounted to SEK 20 M (21) on an annual basis at the end of the period, down SEK 8 M on an annual basis dur-ing 2015. The terms for the discounts are described in the ta-ble below. Stockholm and Helsinki accounted for 72% (74) of the vacancy value.
The closing vacancy value was SEK 69 M (81), down SEK 5 M during the period.
FUTURE VACANCY CHANGESNotice of termination had been served for leases with a rental value of SEK 36 M (17) at the end of the period, of which no-tice of renegotiation accounted for SEK 1 M (1) and notice of vacating the premises for SEK 35 M (16). Of the leases for which notice of vacating the premises had been received, va-cancies corresponding to SEK 11 M will occur in 2015 and SEK 24 M in 2016-2018. In the second quarter, notice of ter-mination of a lease was received for approximately 30,000 square meters of lettable area in Helsinki. The vacancy will arise in 2017. The rate of vacating premises is described in the table below. New lettings that have not yet been occupied re-duced the adjusted vacancy value by SEK 7 M (7).
The adjusted closing vacancy value was SEK 97 M (81), a net increase of SEK 7 M during 2015.
Vacancies, July 1, 2015
AreaRental value,
SEK MVacancy value,
SEK M1)Economic
vacancy rate1)Lettable
area, sqmVacant area,
sqmVacancy
rate by area
Stockholm 531 36 7% 560,000 31,000 5%Helsinki 318 13 4% 329,000 14,000 4%Rest of Sweden 243 12 5% 491,000 40,000 8%Rest of Finland 138 1 1% 238,000 3,000 1%Other 100 7 7% 89,000 – –Total 1,330 69 5% 1,707,000 88,000 5%
Terms for discounts provided
Year of maturity SEK M
2015 72016 102017 22018 –2019 –>2019 1Total 20
Leases terminated for vacancy
Year of vacancy No. of leasesRental value,
SEK M
2015 8 112016 8 52017 2 162018 2 3Total 20 35
1) The vacancy value and vacancy rate take into account vacancies as well as discounts provided to tenants.
Vacancy changes
SEK M 2015
Jan-Jun2014
Jan-Dec
Opening vacancy for each year 74 80Vacancies 9 22Occupancies –7 –38Change in discounts provided –8 5Vacancy value, acquired properties 1 5Closing vacancy value 69 74
Terminated for renegotiation 1 1Terminated lease, not vacated 35 17New letting, not occupied –8 –2Adjusted closing vacancy value 97 90

6 Interim report January - June 2015
PROPERTY EXPENSESOperating and maintenance costs rose to a total of SEK 57 M (49). The increase was due primarily to property ac-quisitions during the past 12 months. Property tax and site leaseholds amounted to SEK 27 M (21). Costs for property administration amounted to SEK 11 M (11).
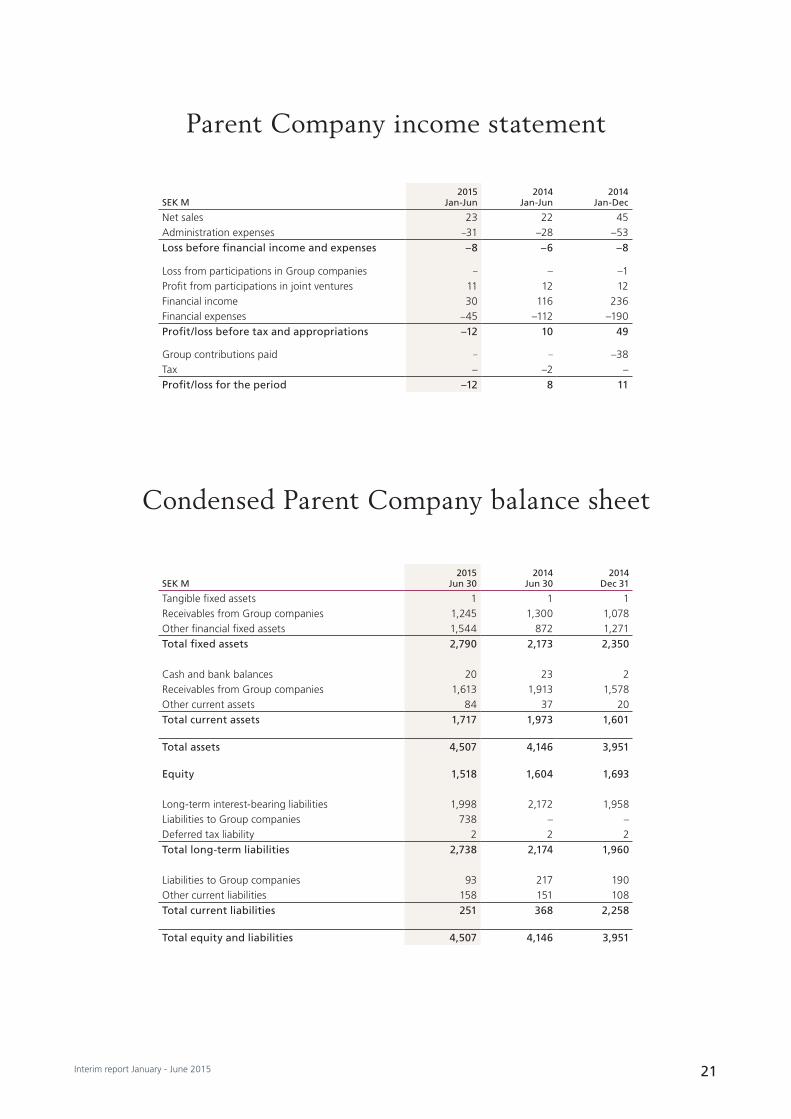
CENTRAL ADMINISTRATIONCosts for the Group’s central administration amounted to SEK 29 M (24). The Parent Company, AB Sagax, is respon-sible for stock market issues, such as financial reporting and stock market information. The Parent Company is also re-sponsible for credit market issues, such as borrowing and fi-nancial risk management. Services between Group companies are charged on commercial terms and conditions and in ac-cordance with market-based pricing. Intra-Group services comprise management services and internal interest charging. During the period, the Parent Company’s fees for property and company management from Group companies amounted to SEK 15 M (15) and from joint ventures to SEK 7 M (7). The Parent Company’s income statement and balance sheet are shown on page 21.
At the end of the period, the Group had 33 employees, of whom 12 were women. 22 employees work at the Parent Company and are stationed at the company’s office in Stock-holm, ten employees work in one of the Finnish subsidiar-ies and are stationed in Helsinki and one employee works in France and is stationed in Paris. The other subsidiaries have no employees. Such functions as property management and on-call operations are outsourced.
PROFIT FROM JOINT VENTURES AND ASSOCIATED COMPANIESProfit from joint ventures and associated companies amount-ed to SEK 106 M (73) and pertained to Sagax’s shares in the earnings of the company’s joint ventures and associated com-panies; refer also to page 14 for more information.
The profit including changes in the value of properties and fixed-income derivatives, amounted to SEK 239 M (202), of which profit from property management accounted for SEK 106 M (73) M, changes in the value of fixed-income deriva-tives for SEK 44 M (negative: 108) and changes in the value of properties for SEK 89 M (237).
Sagax’s share of its joint ventures’ and associated compa-nies’ tax expenses is also recognized in Sagax’s profit/loss. The deferred tax expense for the company amounted to SEK 44 M (54) for the period.
NET FINANCIAL ITEMSSagax’s financial expenses amounted to SEK 207 M (177). The company’s average interest rate was 3.4% (4.2) at June 30, 2015. During the past 12 months, due to financing of property acquisitions, interest-bearing liabilities have in-creased to SEK 9,360 M (8,516). SEK 28 M of the SEK 30 M increase comprised nonrecurring expenses. For more informa-tion about financing at Sagax, see page 15.
In recent years, Sagax’s debt ratio has declined in parallel with a rise in the interest-coverage ratio; see diagram below. This means that financial expenses have declined in relation to Group revenues. The aforementioned nonrecurring financial expense of SEK 28 M in the second quarter entailed that the interest-coverage ratio remained unchanged at 245% (240) at June 30, 2015. Excluding these expenses, the interest-cov-erage ratio would have been 283%. Interest-bearing net debt averaged 8.4 (8.6) times net operating income for the last 12 months.
REVALUATION OF PROPERTIESAt June 30, 2015, the property portfolio comprised 201 (152) properties with a market value of SEK 14,378 M (12,029). The value trend for operations in Sweden was an increase of SEK 329 M (decline 18) and for foreign operations an in-crease of SEK 12 M (34). New lettings and renegotiations of leases increased the market value of the properties by
Debt ratio
Interest-coverage ratio
Debt ratio and interest-coverage ratio
Debt ratio, %Interest-coverage ratio, %
0
60
120
180
240
300
201520142013201220112010200920082007200620050
20
40
60
80
100
Covered net debt/net operating income
Net debt/net operating income
Net debt/net operating income
Multiple
201520142013201220112010200920082007200620056
7
8
9
10
11
12

7Interim report January - June 2015
SEK 87 M (29), and vacancies and renegotiations reduced the value by SEK 33 M (36). The general change in market value during the period was SEK 287 M (23), corresponding to 2% of property value at the end of the period. The market value of the property portfolio was revalued by a total of SEK 341 M (16), excluding currency effects. The change in the market value of the property portfolio is also described on page 13.
Unrealized changes in value
SEK M Jan-Jun 2015
New lettings/Renegotiations 77Vacancies/Renegotiations –15General market value changes 267Sub-total, Sweden 329
New lettings/Renegotiations 10Vacancies/Renegotiations –18General market value changes 20Sub-total, non-Swedish 12
Total unrealized changes in value 341
The weighted yield requirement used in the valuations was 7.6% (8.2). The weighted cost of capital for the present value calculation of cash flows and residual values amounted to 8.7% (9.1) and 9.5% (10.0), respectively. See also the section on analysis and general conditions on page 13.
REVALUATION OF FINANCIAL INSTRUMENTSSagax’s financial instruments at June 30, 2015 comprised fixed-income derivatives in the form of nominal interest-rate swaps and interest-rate caps. All financial instruments are recognized at market value and changes in market value are recognized in profit and loss. Changes in value for the period amounted to SEK 42 M (neg 154), which comprised unreal-ized changes in value of SEK 55 M (neg 154) and realized changes in value of negative SEK 13 M (–).
Sagax recognized positive unrealized changes in the value of fixed-income derivatives because market interest rates rose during the period. At the end of the period, the reserve for
the deficit value of fixed-income derivatives was SEK 479 M (468); refer to the section on financing on page 15.
Sagax’s earnings were also impacted by a revaluation of SEK 44 M (neg 108) of fixed-income derivatives in Sagax’s joint ventures. In its consolidated financial statements, Sagax continuously recognizes the company’s share of deficit values of the fixed-income derivatives of its joint ventures.
TAXSagax recognizes a current tax expense of SEK 16 M (10) pri-marily pertaining to foreign operations.
The deferred tax expense for the period amounted to SEK 128 M (2). The Group’s deferred tax assets and tax liabilities amounted to SEK 2 M (3) and SEK 555 M (345), respec-tively, at the end of the period. Deferred tax assets were rec-ognized net against deferred tax liabilities for the respective countries in the balance sheet. Sagax is not involved in any tax disputes.
Deferred tax assets/tax liabilities by country
SEK M Jun 30, 2015
Sweden –349Finland –189Germany –17Denmark 2Net tax assets/tax liabilities –553
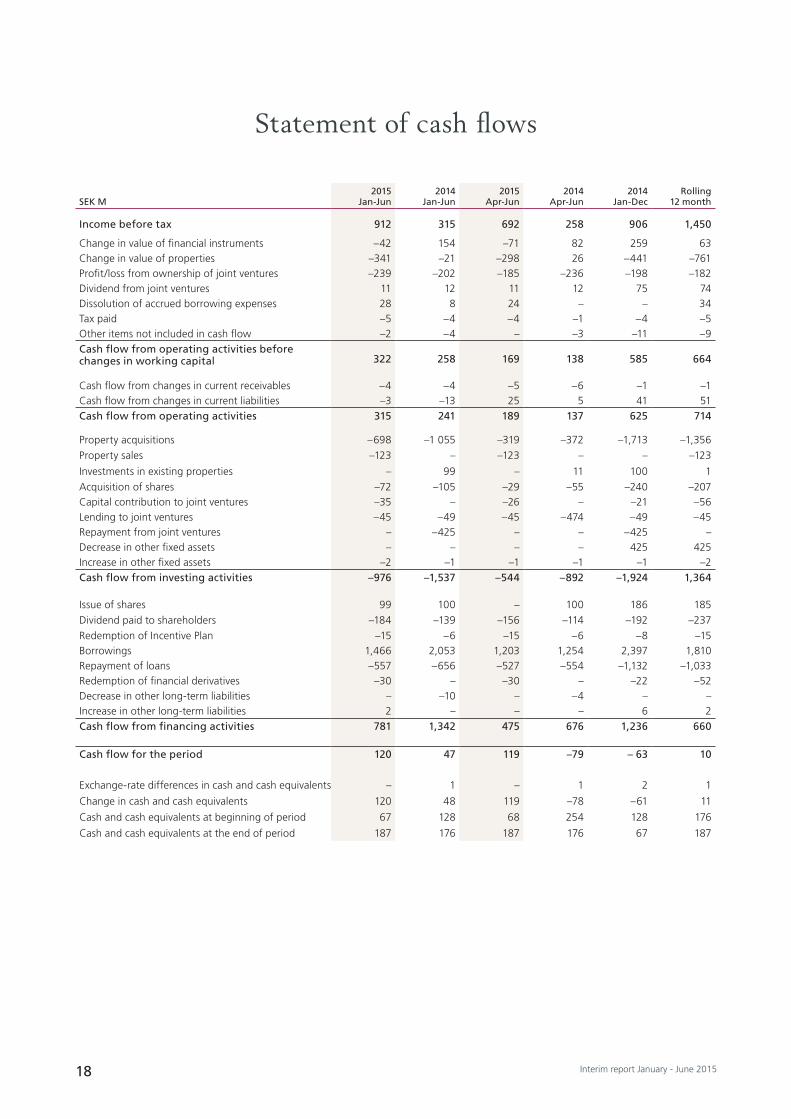
CASH FLOWCash flow from operating activities before changes in working capital amounted to SEK 322 M (258). Changes in working capital had a negative impact of SEK 7 M (neg: 17) on cash flow. Investing activities had a negative impact of SEK 976 M (neg: 1,537) on cash flow, while cash flow from financing activities contributed SEK 781 M (1,342) to Sagax. In total, cash and cash equivalents rose SEK 120 M (48) during the pe-riod. See page 18 for the statement of cash flows.
8 Interim report January - June 2015
ADJUSTED FORECAST FOR 2015Profit from property management for 2015, meaning profit before revaluations and tax, is expected to amount to SEK 860 M based on the current property portfolio and an-nounced acquisitions and divestments. The previously submit-ted forecast was for profit of SEK 840 M and was presented in conjunction with the publication of the interim report for January - March 2015.
CURRENT EARNINGS CAPACITYThe table below shows Sagax’s earnings capacity on a 12-month basis at July 1, 2015. It is important to note that this capacity cannot be compared with a forecast for the forthcoming 12 months because it does not contain assess-ments about, for example, future vacancies, the interest rate scenario, currency effects, rent trends or changes in value. Nor does it take into account repayments, when agreed rent sup-plements come into effect or when discounts provided cease to apply.
Sagax reports its current earnings capacity in conjunction with interim reports and year-end reports.
The rental value is based on contractual rental revenue on an annual basis, with supplements for estimated market rents for vacant premises. Property expenses are based on actual outcomes over the most recent 12-month period adjusted for the holding period. Costs for central administration are based on actual outcomes over the most recent 12-month period. Net financial items are calculated based on interest-bearing liabilities and assets on the balance sheet date. Expenses for interest-bearing liabilities are based on the Group’s estimated average interest rate, with the addition of financing costs al-located over time. Tax is calculated at the standard tax rate of 22% and is deemed to predominantly comprise deferred tax. Sagax’s share of profit in joint ventures and associated compa-nies is calculated in accordance with the same assumptions as for Sagax, taking into account the size of the participation.
Current earnings capacity
SEK M Jul 1, 2015 Jan 1, 2015
Rental value 1,330 1,267Vacancy –69 –74Rental revenue 1,261 1,193Property expenses –162 –170Net operating income 1,099 1,023Central administration –53 –47Joint ventures and associated companies 240 198Net financial items –333 –362Profit from property management 953 812Tax –210 –179Profit after tax 743 633 – of which holders of preference
shares 116 111 – of which, holders of common shares 627 522
Forecast and current earnings capacity
0
200
400
600
800
1,000
201520142013201220112010
Current earnings capacity before tax
SEK M
0
1
2
3
4
5
6
7
20152014201320122011201020092008200720062005
Difference between yield of Sagax’s properties and Sagax’s average interest rate
Difference between yield of Sagax’s properties and ten-year swap rate
Difference between yield and lending rate
%
Sagax’s average lending rateYield of Sagax’s properties
Ten-year swap rate
Yield and lending rate
%
0
2
4
6
8
10
20152014201320122011201020092008200720062005
9Interim report January - June 2015
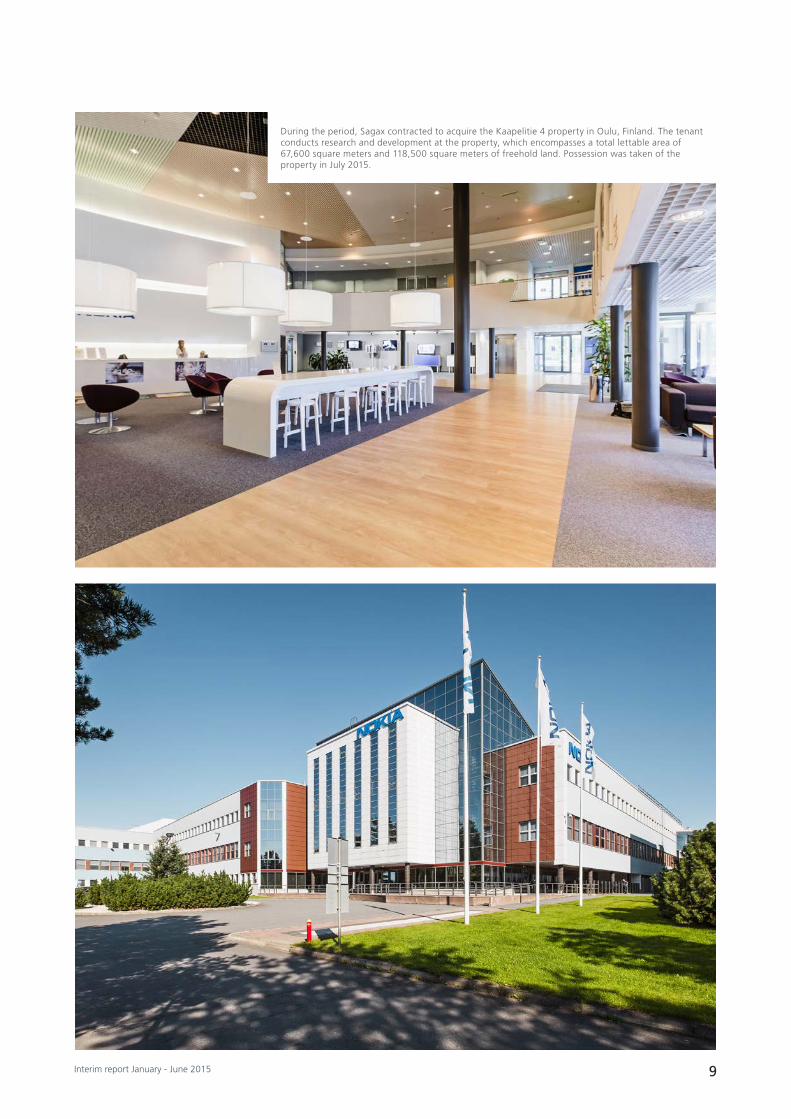
During the period, Sagax contracted to acquire the Kaapelitie 4 property in Oulu, Finland. The tenant conducts research and development at the property, which encompasses a total lettable area of 67,600 square meters and 118,500 square meters of freehold land. Possession was taken of the property in July 2015.

10 Interim report January - June 2015
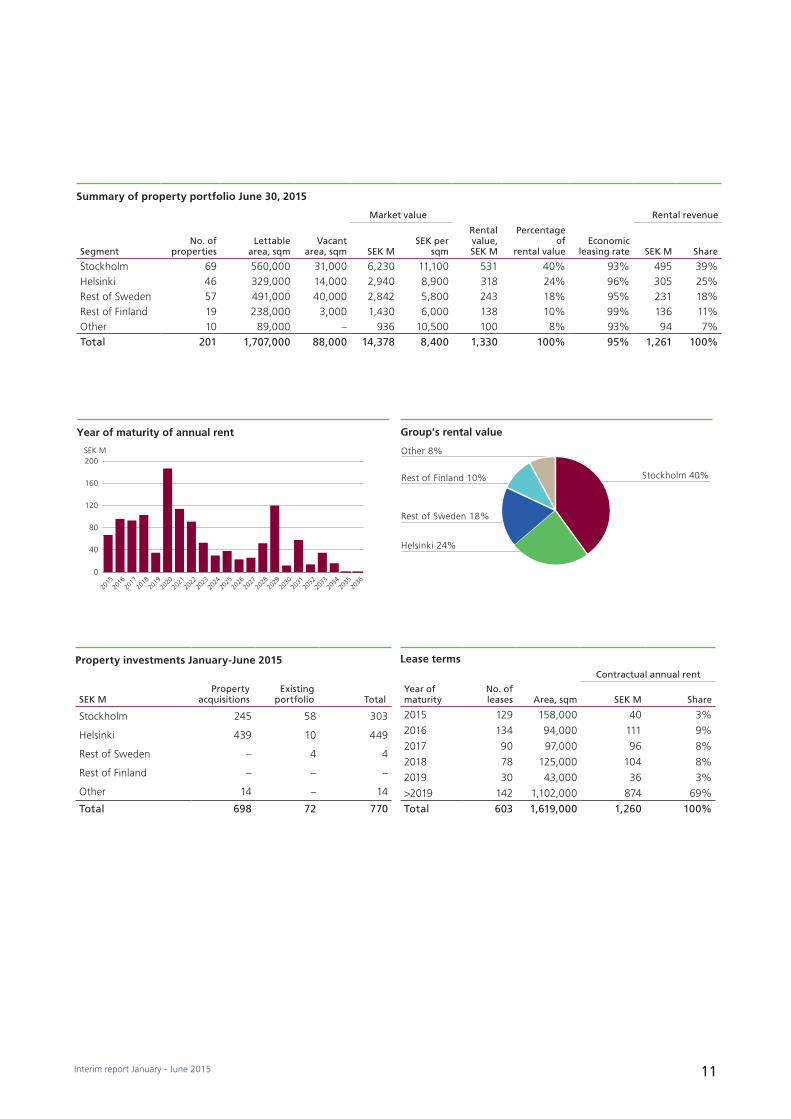
At June 30, 2015, the property portfolio comprised 201 (152) properties with a lettable area of 1,707,000 (1,459,000) square meters. The average remaining lease term was 7.7 years (8.5). The focus of the portfolio is on the Stockholm region where 43% (42) of the market value and 40% (41) of the rental value is concentrated. At the end of the period, the to-tal rental value and contractual annual rent amounted to SEK 1,330 M (1,168) and SEK 1,261 M (1,097), respectively. This corresponds to an economic leasing rate of 95% (94).
INVESTMENTSDuring the period, Sagax invested SEK 770 M (1,160), of which the property acquisitions accounted for SEK 698 (1,055) M. SEK 245 M of the investments pertained to Stock-holm and SEK 439 M to Helsinki, meaning that 98% of the investments during the first six months were made in Sagax’s two principal markets. Sagax acquired 17 properties during the period with a total lettable area of 65,700 square meters; see table below.
During the second quarter, Sagax agreed to acquire a re-search and development facility in Oulu, Finland, comprising 67,600 square meters of lettable area and 118,500 square me-
Property portfolio
Property acquisitions January-June 2015
Property Municipality Segment Lettable area, sqm
Hangaren 3 Stockholm Stockholm 3,600 Oluarinluoma 8 (49-22-3-4) Espoo Helsinki 4,900 Vantaanlaaksontie 6 (92-16-114-9) Vantaa Helsinki 8,600 Vantaanlaaksontie 6 (92-16-114-11) Vantaa Helsinki 5,200 Puusepäntie 2 (91-43-59-5) Helsinki Helsinki 7,900 Lyhtytie 7 (91-40-153-22) Helsinki Helsinki 900 Porttisuontie 9 (92-64-4-3) Helsinki Helsinki 4,500 25 rue Henri Farman Paris Other 1,800 First quarter 37,400
Elektrikern 2 Sollentuna Stockholm 2,500 Hällsätra 2 Stockholm Stockholm 10,800 Telegrafen 1 Huddinge Stockholm 1,500 Mörtö 9 Stockholm Stockholm 3,300 Säteritaket 1 Stockholm Stockholm 2,500 Runö 7:73 & 7:74 Österåker Stockholm 2,500 Hakamäenkuja 4-6 (92-68-106-5) Vantaa Helsinki 2,600 Trukkikuja 1 (92-75-200-1) Vantaa Helsinki 2,600 Second quarter 28,300
Total 65,700
ters of freehold land. The property is fully let under a long-term lease that excludes the cost of heating and hot water and possession was taken in the third quarter of 2015.
During the period, Sagax also agreed the acquisition of an industrial property in Herblay, about 25 kilometers north-west of central Paris. The property encompasses 19,600 square meters of freehold land and 7,400 square meters of industrial premises, which were erected in 2002. The property is fully let to four tenants and possession was taken in the third quar-ter of 2015.
A total of SEK 72 M (105) pertained to investments in the existing property portfolio. SEK 6 M of the investments for the period were made against rent supplements, SEK 5 M was invested in conjunction with new lettings, SEK 43 M in con-junction with new production and SEK 18 M pertained to property maintenance. New builds at the Bulten 1 property in Danderyd were completed during the first quarter.
DIVESTMENTSDuring the period, Sagax agreed the sale of about 22,000 square meters of land in Lund. The property is expected to be vacated in the fourth quarter of 2015.
11Interim report January - June 2015
Group’s rental value
Helsinki 24%
Stockholm 40%
Other 8%
Rest of Finland 10%
Rest of Sweden 18%
Year of maturity of annual rent
SEK M
0
40
80
120
160
200
2036
2035
2034
2033
2032
2031
2030
2029
2028
2027
2026
2025
2024
2023
2022
2021
2020
2019
2018
2017
2016
2015
Property investments January-June 2015
SEK MProperty
acquisitionsExisting
portfolio Total
Stockholm 245 58 303
Helsinki 439 10 449
Rest of Sweden – 4 4
Rest of Finland – – –
Other 14 – 14
Total 698 72 770
Lease terms
No. of leases
Contractual annual rent
Year of maturity Area, sqm SEK M Share
2015 129 158,000 40 3%
2016 134 94,000 111 9%
2017 90 97,000 96 8%
2018 78 125,000 104 8%
2019 30 43,000 36 3%
>2019 142 1,102,000 874 69%
Total 603 1,619,000 1,260 100%
Summary of property portfolio June 30, 2015
Market value Rental revenue
SegmentNo. of
propertiesLettable
area, sqmVacant
area, sqm SEK MSEK per
sqm
Rental value, SEK M
Percentage of
rental valueEconomic
leasing rate SEK M Share
Stockholm 69 560,000 31,000 6,230 11,100 531 40% 93% 495 39%Helsinki 46 329,000 14,000 2,940 8,900 318 24% 96% 305 25%Rest of Sweden 57 491,000 40,000 2,842 5,800 243 18% 95% 231 18%Rest of Finland 19 238,000 3,000 1,430 6,000 138 10% 99% 136 11%Other 10 89,000 – 936 10,500 100 8% 93% 94 7%Total 201 1,707,000 88,000 14,378 8,400 1,330 100% 95% 1,261 100%

12 Interim report January - June 2015
In the second quarter of 2015, Sagax took possession of seven properties in the Stockholm area. The image at the top of the page depicts the Säteritaket 1 property in Stockholm, which comprises 2,500 square meters of lettable area. The property is located in Hässelby Gård, close to Bergslagsvägen with an interesting location directly adjacent to residential areas. The image below depicts the Hällsätra 2 property in Stockholm, which comprises 10,800 square meters of lettable area. The property is located in Sätra adjacent to the E4 express-way, an area where Sagax already owns a number of properties.
13Interim report January - June 2015
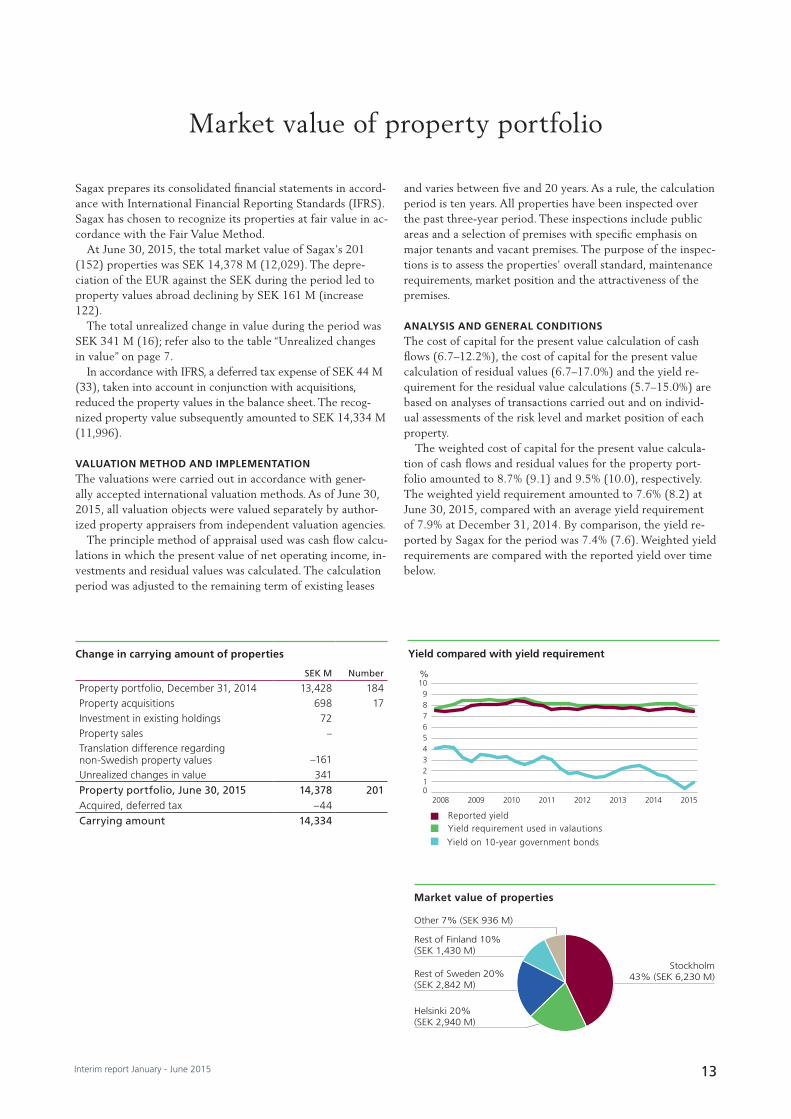
Sagax prepares its consolidated financial statements in accord-ance with International Financial Reporting Standards (IFRS). Sagax has chosen to recognize its properties at fair value in ac-cordance with the Fair Value Method.
At June 30, 2015, the total market value of Sagax’s 201 (152) properties was SEK 14,378 M (12,029). The depre-ciation of the EUR against the SEK during the period led to property values abroad declining by SEK 161 M (increase 122).
The total unrealized change in value during the period was SEK 341 M (16); refer also to the table “Unrealized changes in value” on page 7.
In accordance with IFRS, a deferred tax expense of SEK 44 M (33), taken into account in conjunction with acquisitions, reduced the property values in the balance sheet. The recog-nized property value subsequently amounted to SEK 14,334 M (11,996).
VALUATION METHOD AND IMPLEMENTATIONThe valuations were carried out in accordance with gener-ally accepted international valuation methods. As of June 30, 2015, all valuation objects were valued separately by author-ized property appraisers from independent valuation agencies.
The principle method of appraisal used was cash flow calcu-lations in which the present value of net operating income, in-vestments and residual values was calculated. The calculation period was adjusted to the remaining term of existing leases
and varies between five and 20 years. As a rule, the calculation period is ten years. All properties have been inspected over the past three-year period. These inspections include public areas and a selection of premises with specific emphasis on major tenants and vacant premises. The purpose of the inspec-tions is to assess the properties’ overall standard, maintenance requirements, market position and the attractiveness of the premises.
ANALYSIS AND GENERAL CONDITIONSThe cost of capital for the present value calculation of cash flows (6.7–12.2%), the cost of capital for the present value calculation of residual values (6.7–17.0%) and the yield re-quirement for the residual value calculations (5.7–15.0%) are based on analyses of transactions carried out and on individ-ual assessments of the risk level and market position of each property.
The weighted cost of capital for the present value calcula-tion of cash flows and residual values for the property port-folio amounted to 8.7% (9.1) and 9.5% (10.0), respectively. The weighted yield requirement amounted to 7.6% (8.2) at June 30, 2015, compared with an average yield requirement of 7.9% at December 31, 2014. By comparison, the yield re-ported by Sagax for the period was 7.4% (7.6). Weighted yield requirements are compared with the reported yield over time below.
Market value of property portfolio
Change in carrying amount of properties
SEK M Number
Property portfolio, December 31, 2014 13,428 184Property acquisitions 698 17Investment in existing holdings 72Property sales –Translation difference regarding non-Swedish property values –161Unrealized changes in value 341Property portfolio, June 30, 2015 14,378 201Acquired, deferred tax –44Carrying amount 14,334
Market value of properties
Helsinki 20% (SEK 2,940 M)
Stockholm43% (SEK 6,230 M)
Other 7% (SEK 936 M)
Rest of Finland 10% (SEK 1,430 M)
Rest of Sweden 20%(SEK 2,842 M)
Yield requirement used in valautions Reported yield
Yield on 10-year government bonds
Yield compared with yield requirement
%
0123456789
10
20152014201320122011201020092008
14 Interim report January - June 2015
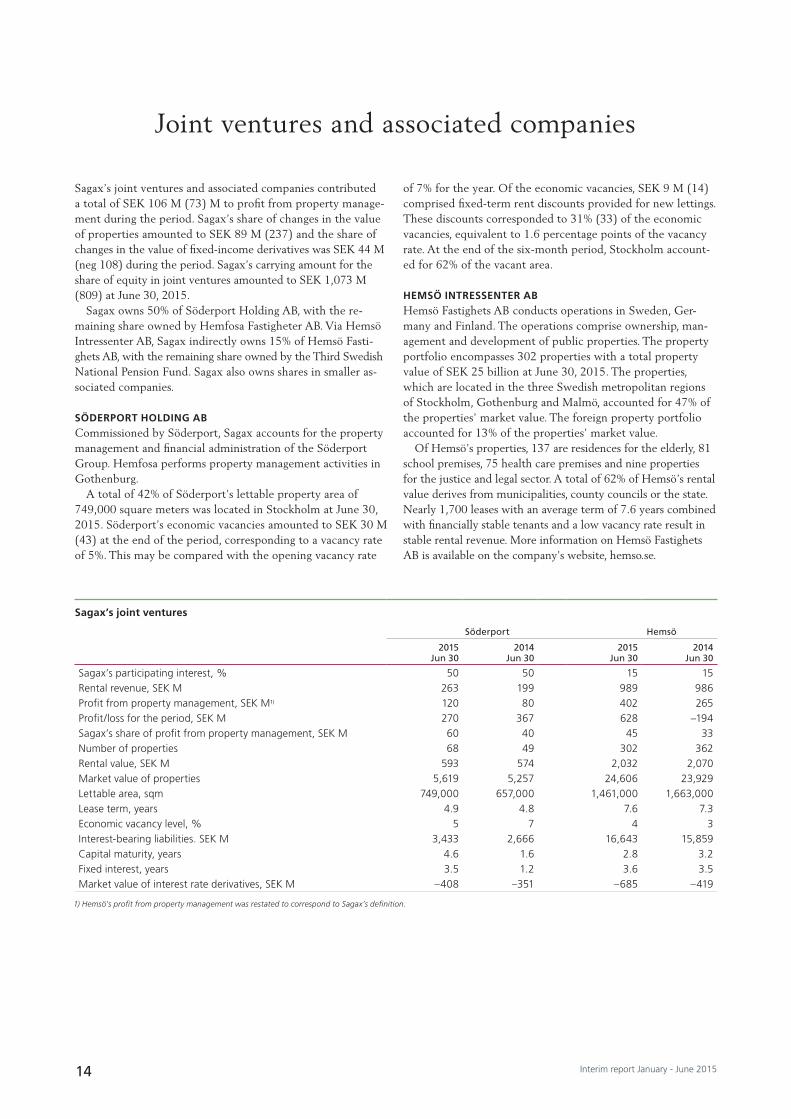
Sagax’s joint ventures and associated companies contributed a total of SEK 106 M (73) M to profit from property manage-ment during the period. Sagax’s share of changes in the value of properties amounted to SEK 89 M (237) and the share of changes in the value of fixed-income derivatives was SEK 44 M (neg 108) during the period. Sagax’s carrying amount for the share of equity in joint ventures amounted to SEK 1,073 M (809) at June 30, 2015.
Sagax owns 50% of Söderport Holding AB, with the re-maining share owned by Hemfosa Fastigheter AB. Via Hemsö Intressenter AB, Sagax indirectly owns 15% of Hemsö Fasti-ghets AB, with the remaining share owned by the Third Swedish National Pension Fund. Sagax also owns shares in smaller as-sociated companies.
SÖDERPORT HOLDING ABCommissioned by Söderport, Sagax accounts for the property management and financial administration of the Söderport Group. Hemfosa performs property management activities in Gothenburg.
A total of 42% of Söderport’s lettable property area of 749,000 square meters was located in Stockholm at June 30, 2015. Söderport’s economic vacancies amounted to SEK 30 M (43) at the end of the period, corresponding to a vacancy rate of 5%. This may be compared with the opening vacancy rate
of 7% for the year. Of the economic vacancies, SEK 9 M (14) comprised fixed-term rent discounts provided for new lettings. These discounts corresponded to 31% (33) of the economic vacancies, equivalent to 1.6 percentage points of the vacancy rate. At the end of the six-month period, Stockholm account-ed for 62% of the vacant area.
HEMSÖ INTRESSENTER ABHemsö Fastighets AB conducts operations in Sweden, Ger-many and Finland. The operations comprise ownership, man-agement and development of public properties. The property portfolio encompasses 302 properties with a total property value of SEK 25 billion at June 30, 2015. The properties, which are located in the three Swedish metropolitan regions of Stockholm, Gothenburg and Malmö, accounted for 47% of the properties’ market value. The foreign property portfolio accounted for 13% of the properties’ market value.
Of Hemsö’s properties, 137 are residences for the elderly, 81 school premises, 75 health care premises and nine properties for the justice and legal sector. A total of 62% of Hemsö’s rental value derives from municipalities, county councils or the state. Nearly 1,700 leases with an average term of 7.6 years combined with financially stable tenants and a low vacancy rate result in stable rental revenue. More information on Hemsö Fastighets AB is available on the company’s website, hemso.se.
Joint ventures and associated companies
Sagax’s joint ventures
Söderport Hemsö
2015Jun 30
2014Jun 30
2015Jun 30
2014Jun 30
Sagax’s participating interest, % 50 50 15 15Rental revenue, SEK M 263 199 989 986Profit from property management, SEK M1) 120 80 402 265Profit/loss for the period, SEK M 270 367 628 –194Sagax’s share of profit from property management, SEK M 60 40 45 33Number of properties 68 49 302 362Rental value, SEK M 593 574 2,032 2,070Market value of properties 5,619 5,257 24,606 23,929Lettable area, sqm 749,000 657,000 1,461,000 1,663,000Lease term, years 4.9 4.8 7.6 7.3Economic vacancy level, % 5 7 4 3Interest-bearing liabilities. SEK M 3,433 2,666 16,643 15,859Capital maturity, years 4.6 1.6 2.8 3.2Fixed interest, years 3.5 1.2 3.6 3.5Market value of interest rate derivatives, SEK M –408 –351 –685 –419
1) Hemsö’s profit from property management was restated to correspond to Sagax’s definition.
15Interim report January - June 2015
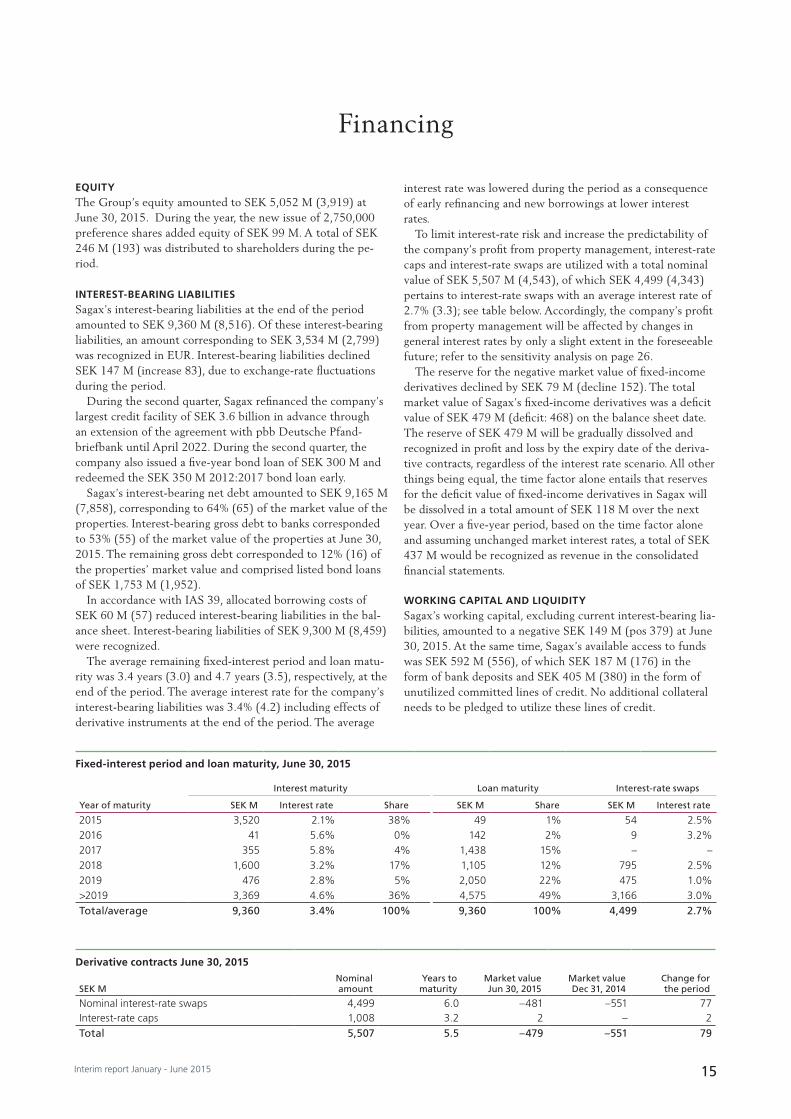
EQUITYThe Group’s equity amounted to SEK 5,052 M (3,919) at June 30, 2015. During the year, the new issue of 2,750,000 preference shares added equity of SEK 99 M. A total of SEK 246 M (193) was distributed to shareholders during the pe-riod.
INTEREST-BEARING LIABILITIESSagax’s interest-bearing liabilities at the end of the period amounted to SEK 9,360 M (8,516). Of these interest-bearing liabilities, an amount corresponding to SEK 3,534 M (2,799) was recognized in EUR. Interest-bearing liabilities declined SEK 147 M (increase 83), due to exchange-rate fluctuations during the period.
During the second quarter, Sagax refinanced the company’s largest credit facility of SEK 3.6 billion in advance through an extension of the agreement with pbb Deutsche Pfand-briefbank until April 2022. During the second quarter, the company also issued a five-year bond loan of SEK 300 M and redeemed the SEK 350 M 2012:2017 bond loan early.
Sagax’s interest-bearing net debt amounted to SEK 9,165 M (7,858), corresponding to 64% (65) of the market value of the properties. Interest-bearing gross debt to banks corresponded to 53% (55) of the market value of the properties at June 30, 2015. The remaining gross debt corresponded to 12% (16) of the properties’ market value and comprised listed bond loans of SEK 1,753 M (1,952).
In accordance with IAS 39, allocated borrowing costs of SEK 60 M (57) reduced interest-bearing liabilities in the bal-ance sheet. Interest-bearing liabilities of SEK 9,300 M (8,459) were recognized.
The average remaining fixed-interest period and loan matu-rity was 3.4 years (3.0) and 4.7 years (3.5), respectively, at the end of the period. The average interest rate for the company’s interest-bearing liabilities was 3.4% (4.2) including effects of derivative instruments at the end of the period. The average
interest rate was lowered during the period as a consequence of early refinancing and new borrowings at lower interest rates.
To limit interest-rate risk and increase the predictability of the company’s profit from property management, interest-rate caps and interest-rate swaps are utilized with a total nominal value of SEK 5,507 M (4,543), of which SEK 4,499 (4,343) pertains to interest-rate swaps with an average interest rate of 2.7% (3.3); see table below. Accordingly, the company’s profit from property management will be affected by changes in general interest rates by only a slight extent in the foreseeable future; refer to the sensitivity analysis on page 26.
The reserve for the negative market value of fixed-income derivatives declined by SEK 79 M (decline 152). The total market value of Sagax’s fixed-income derivatives was a deficit value of SEK 479 M (deficit: 468) on the balance sheet date. The reserve of SEK 479 M will be gradually dissolved and recognized in profit and loss by the expiry date of the deriva-tive contracts, regardless of the interest rate scenario. All other things being equal, the time factor alone entails that reserves for the deficit value of fixed-income derivatives in Sagax will be dissolved in a total amount of SEK 118 M over the next year. Over a five-year period, based on the time factor alone and assuming unchanged market interest rates, a total of SEK 437 M would be recognized as revenue in the consolidated financial statements.
WORKING CAPITAL AND LIQUIDITYSagax’s working capital, excluding current interest-bearing lia-bilities, amounted to a negative SEK 149 M (pos 379) at June 30, 2015. At the same time, Sagax’s available access to funds was SEK 592 M (556), of which SEK 187 M (176) in the form of bank deposits and SEK 405 M (380) in the form of unutilized committed lines of credit. No additional collateral needs to be pledged to utilize these lines of credit.
Financing
Derivative contracts June 30, 2015
SEK MNominal amount
Years to maturity
Market value Jun 30, 2015
Market value Dec 31, 2014
Change for the period
Nominal interest-rate swaps 4,499 6.0 –481 –551 77Interest-rate caps 1,008 3.2 2 – 2Total 5,507 5.5 –479 –551 79
Fixed-interest period and loan maturity, June 30, 2015
Interest maturity Loan maturity Interest-rate swaps
Year of maturity SEK M Interest rate Share SEK M Share SEK M Interest rate
2015 3,520 2.1% 38% 49 1% 54 2.5%2016 41 5.6% 0% 142 2% 9 3.2%2017 355 5.8% 4% 1,438 15% – –2018 1,600 3.2% 17% 1,105 12% 795 2.5%2019 476 2.8% 5% 2,050 22% 475 1.0%>2019 3,369 4.6% 36% 4,575 49% 3,166 3.0%Total/average 9,360 3.4% 100% 9,360 100% 4,499 2.7%
16 Interim report January - June 2015
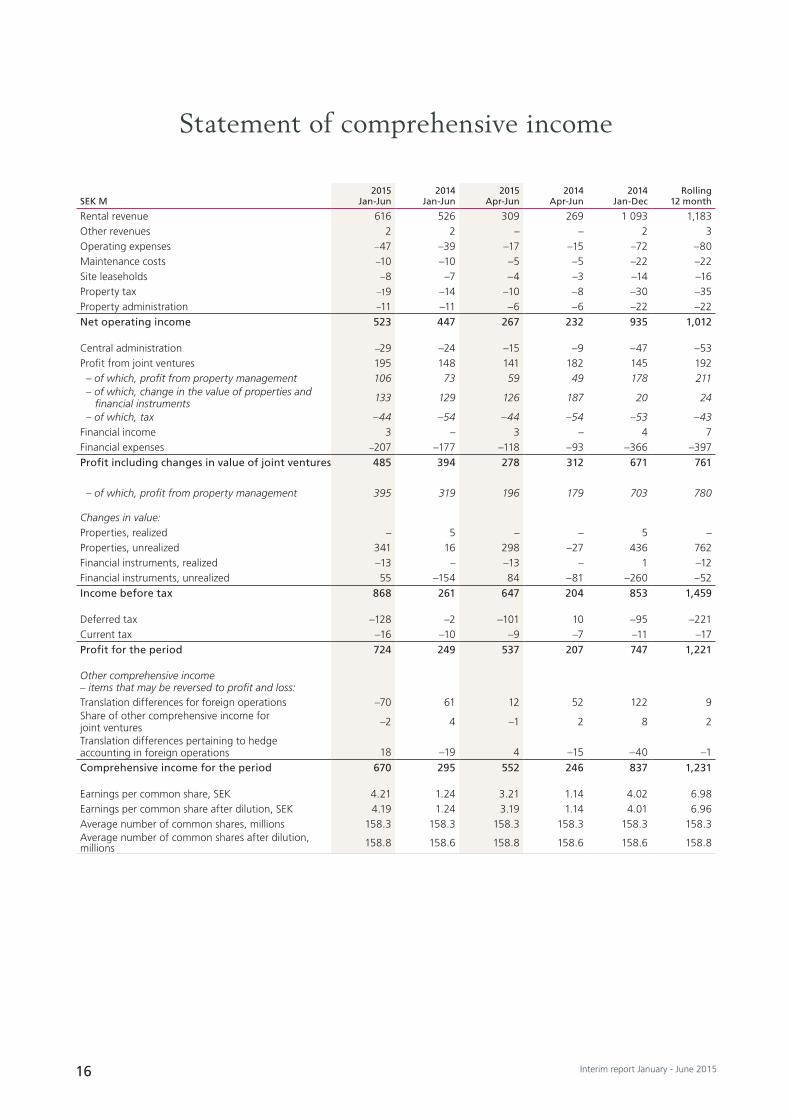
Statement of comprehensive income
SEK M2015
Jan-Jun2014
Jan-Jun2015
Apr-Jun2014
Apr-Jun2014
Jan-DecRolling
12 month
Rental revenue 616 526 309 269 1 093 1,183Other revenues 2 2 – – 2 3Operating expenses –47 –39 –17 –15 –72 –80Maintenance costs –10 –10 –5 –5 –22 –22Site leaseholds –8 –7 –4 –3 –14 –16Property tax –19 –14 –10 –8 –30 –35Property administration –11 –11 –6 –6 –22 –22Net operating income 523 447 267 232 935 1,012
Central administration –29 –24 –15 –9 –47 –53Profit from joint ventures 195 148 141 182 145 192 – of which, profit from property management 106 73 59 49 178 211 – of which, change in the value of properties and financial instruments 133 129 126 187 20 24
– of which, tax –44 –54 –44 –54 –53 –43Financial income 3 – 3 – 4 7Financial expenses –207 –177 –118 –93 –366 –397Profit including changes in value of joint ventures 485 394 278 312 671 761
– of which, profit from property management 395 319 196 179 703 780
Changes in value:Properties, realized – 5 – – 5 –Properties, unrealized 341 16 298 –27 436 762Financial instruments, realized –13 – –13 – 1 –12Financial instruments, unrealized 55 –154 84 –81 –260 –52Income before tax 868 261 647 204 853 1,459
Deferred tax –128 –2 –101 10 –95 –221Current tax –16 –10 –9 –7 –11 –17Profit for the period 724 249 537 207 747 1,221
Other comprehensive income – items that may be reversed to profit and loss:Translation differences for foreign operations –70 61 12 52 122 9Share of other comprehensive income for joint ventures –2 4 –1 2 8 2
Translation differences pertaining to hedge accounting in foreign operations 18 –19 4 –15 –40 –1
Comprehensive income for the period 670 295 552 246 837 1,231
Earnings per common share, SEK 4.21 1.24 3.21 1.14 4.02 6.98Earnings per common share after dilution, SEK 4.19 1.24 3.19 1.14 4.01 6.96Average number of common shares, millions 158.3 158.3 158.3 158.3 158.3 158.3Average number of common shares after dilution, millions 158.8 158.6 158.8 158.6 158.6 158.8

17Interim report January - June 2015
Condensed statement of financial position
SEK M2015
Jun 302014
Jun 302014
Dec 31
Investment properties 14,334 11,996 13,387Participations in joint ventures 1,073 809 796,Deferred tax asset 2 3 1Other fixed assets 140 9 9Total fixed assets 15,549 12,817 14,193
Cash and bank balances 187 176 67Other current assets 112 104 121Total current assets 299 754 188
Total assets 15,849 13,571 14,381
Equity 5,052 3,919 4,544
Long-term interest-bearing liabilities 9,163 8,107 8,332Deferred tax liability 555 345 434Financial instruments 481 468 551Other long-term liabilities 10 4 9Total long-term liabilities 10,209 8,925 9,326
Current interest-bearing liabilities 137 352 140Other current liabilities 450 375 371Total current liabilities 587 727 511
Total equity and liabilities 15,849 13,571 14,381
18 Interim report January - June 2015
Statement of cash flows
SEK M2015
Jan-Jun2014
Jan-Jun2015
Apr-Jun2014
Apr-Jun2014
Jan-DecRolling
12 month
Income before tax 912 315 692 258 906 1,450
Change in value of financial instruments –42 154 –71 82 259 63Change in value of properties –341 –21 –298 26 –441 –761Profit/loss from ownership of joint ventures –239 –202 –185 –236 –198 –182Dividend from joint ventures 11 12 11 12 75 74Dissolution of accrued borrowing expenses 28 8 24 – – 34Tax paid –5 –4 –4 –1 –4 –5Other items not included in cash flow –2 –4 – –3 –11 –9Cash flow from operating activities before changes in working capital 322 258 169 138 585 664
Cash flow from changes in current receivables –4 –4 –5 –6 –1 –1Cash flow from changes in current liabilities –3 –13 25 5 41 51Cash flow from operating activities 315 241 189 137 625 714
Property acquisitions –698 –1 055 –319 –372 –1,713 –1,356
Property sales –123 – –123 – – –123
Investments in existing properties – 99 – 11 100 1
Acquisition of shares –72 –105 –29 –55 –240 –207Capital contribution to joint ventures –35 – –26 – –21 –56Lending to joint ventures –45 –49 –45 –474 –49 –45Repayment from joint ventures – –425 – – –425 –Decrease in other fixed assets – – – – 425 425Increase in other fixed assets –2 –1 –1 –1 –1 –2Cash flow from investing activities –976 –1,537 –544 –892 –1,924 1,364
Issue of shares 99 100 – 100 186 185
Dividend paid to shareholders –184 –139 –156 –114 –192 –237
Redemption of Incentive Plan –15 –6 –15 –6 –8 –15Borrowings 1,466 2,053 1,203 1,254 2,397 1,810Repayment of loans –557 –656 –527 –554 –1,132 –1,033Redemption of financial derivatives –30 – –30 – –22 –52Decrease in other long-term liabilities – –10 – –4 – –Increase in other long-term liabilities 2 – – – 6 2Cash flow from financing activities 781 1,342 475 676 1,236 660
Cash flow for the period 120 47 119 –79 – 63 10
Exchange-rate differences in cash and cash equivalents – 1 – 1 2 1
Change in cash and cash equivalents 120 48 119 –78 –61 11
Cash and cash equivalents at beginning of period 67 128 68 254 128 176
Cash and cash equivalents at the end of period 187 176 187 176 67 187
19Interim report January - June 2015
SEK M Share capital
Other contributed
capital
Reserves, translationdifferences
Profit earned incl. net.
profit for the periodTotal
equity
Shareholders’ equity, December 31, 2013 366 1,429 3 1,925 3,723
New issue of preference shares 5 95 – – 100Dividends – – – –193 –193Redemption of Incentive Plan – – – –6 –6Comprehensive income, January-June 2014 – – 46 249 295Equity, June 30, 2014 371 1,524 49 1,975 3,919
New issue of preference shares 5 82 – – 87Transaction costs – –1 – – –1Dividends – – – –1 –1Incentive Plan – – – –1 –1Redemption of Incentive Plan – – – –1 –1Comprehensive income, July-December 2014 – – 44 498 542Shareholders’ equity, December 31, 2014 376 1,605 93 2,470 4,544
New issue of preference shares 5 94 – – 99Transaction costs – –1 – – –1Dividends – – – –246 –246Redemption of Incentive Plan – – – –14 –14Incentive Plan – – – –1 –1Comprehensive income, January-June 2015 – – –54 724 670Equity, June 30, 20151) 381 1,698 39 2,934 5,052
Statement of changes in equity
1) Equity is attributable in its entirety to the Parent Company’s shareholders.
Segment informationChanges in value, properties
Profit items per segment Rental revenue1)
Profit from property management Unrealized Realized
Income before tax
SEK M2015
Jan-Jun2014
Jan-Jun2015
Jan-Jun2014
Jan-Jun2015
Jan-Jun2014
Jan-Jun2015
Jan-Jun2014
Jan-Jun2015
Jan-Jun2014
Jan-Jun
Stockholm 237 211 99 75 233 10 – – 332 86Helsinki 143 112 80 64 22 45 – – 103 109Rest of Sweden 116 102 69 62 96 –29 – 3 165 37Rest of Finland 71 60 46 37 1 –7 – 2 47 32Other 50 42 28 21 –12 –3 – – 16 17Sub-total 616 526 322 260 341 16 – 5 663 281Financial instruments – – – – – – – – 42 –154Joint ventures – – 106 73 89 238 1 –1 195 202Other, non-specified – – –33 –14 – – – – –32 –14Total 616 526 395 319 430 254 1 4 868 315
Asset items per segment
Market value properties
Investments properties
Acquisitions properties
Divestment properties
SEK M2015
Jun 302014
Jun 302015
Jan-Jun2014
Jan-Jun2015
Jan-Jun2014
Jan-Jun2015
Jan-Jun2014
Jan-Jun
Stockholm 6,230 5,081 57 74 245 38 – –11Helsinki 2,940 2,318 10 9 439 628 – –Rest of Sweden 2,842 2,327 4 22 – 24 – –28Rest of Finland 1,430 1,420 – – – 279 – –56Other 936 883 – – 14 86 – –Sub-total 14,378 12,029 71 105 698 1,055 – –94
Other, non-specified – – – – – – – –
Total 14,378 12,029 71 105 698 1,055 – –94
1) All rental revenue pertains to external tenants.
20 Interim report January - June 2015
Key performance indicators
2015Jan-Jun
2014Jan-Jun
2014Jan-Dec
2013 Jan-Dec
2012Jan-Dec
2011Jan-Dec
2010Jan-Dec
Property-related
Yield, % 7.4 7.6 7.6 7.7 7.8 7.7 8.1Surplus ratio, % 85 85 86 87 86 86 89Leasing rate by area, % 95 95 95 93 95 97 97Economic leasing rate, % 95 94 94 92 93 93 94Lease term, years 7.7 8.5 8.2 8.0 8.4 7.9 8.6Lettable area, 000s of square meters 1,707 1,459 1,634 1,336 1,159 1,144 1,024Number of properties 201 152 184 141 134 136 129
Financial
Return on total capital, % 7 7 7 7 7 7 7Return on equity, % 30 13 18 24 15 6 27Average interest rate, % 3.4 4.2 4.1 4.4 4.6 4.5 4.3Fixed-interest period incl. derivatives, year 3.4 3.0 3.0 3.7 5.2 4.3 4.3Loan maturity, years 4.7 3.5 3.2 3.5 4.3 2.9 3.4Equity/assets ratio, % 32 29 32 32 28 23 26Debt ratio, % 59 63 59 60 62 68 67Net debt/market value of the properties, % 64 65 62 64 63 69 70Interest-coverage ratio, multiple 2.5 2.4 2.6 2.4 2.2 2.2 2.3
Data per common share1) 2)
Share price at the end of period, SEK 53.253) 36.303) 44.003) 24.203) 17.14 15.00 15.45EPRA NAV, SEK 28.16 21.92 27.23 19.05 14.86 12.76 10.76Equity, SEK 20.51 14.38 17.49 13.41 8.09 6.99 7.14Equity after dilution, SEK 20.46 14.35 17.44 13.40 8.09 6.99 6.92Profit/loss, SEK 4.21 1.24 4.02 4.40 1.84 0.32 3.12Profit/loss after dilution, SEK 4.19 1.24 4.01 4.40 1.84 0.32 2.90Profit from property management, SEK 2.13 1.68 3.74 2.74 2.15 2.07 1.87Profit from property management after dilution, SEK 2.12 1.68 3.73 2.73 2.15 2.06 1.80Cash flow, SEK 1.67 1.30 3.00 2.12 1.79 1.88 1.74Cash flow after dilution, SEK 1.66 1.29 2.99 2.12 1.79 1.87 1.62Dividend per share, SEK (proposed for 2014) – – 0.80 0.55 0.43 0.36 0.27No. at end of period, millions 158.3 158.3 158.3 158.3 147.6 147.6 141.9No. at end of period after dilution, millions 158.7 158.7 158.7 158.4 147.6 147.6 146.3Average number, millions 158.3 158.3 158.3 153.9 147.6 146.8 134.2Average number after dilution, millions 158.8 158.6 158.6 154.0 147.6 147.4 144.1
Data per preference share
Share price at the end of period, SEK 33.80 34.00 36.00 31.50 29.60 26.50 26.30Equity, SEK 31.00 31.00 32.00 32.00 32.00 32.00 32.00Profit/loss, SEK 1.00 1.00 2.00 2.00 2.00 2.00 2.00Dividend per share, SEK (proposed for 2014) – – 2.00 2.00 2.00 2.00 2.00No. at end of period, millions 58.2 53.0 55.5 50.0 50.0 37.3 37.3Average number, millions 57.3 51.3 52.2 50.0 37.8 37.3 32.9
1) Comparative figures have been adjusted for the bonus issue of Class B shares in 2013, by multiplying the number of shares by 11. The main condition of the bonus issue was ten Class B shares for each Class A share.
2) Excluding 1,000,000 Class B shares bought back by AB Sagax.3) Pertains to the share price for the Class B share.
21Interim report January - June 2015
Parent Company income statement
Condensed Parent Company balance sheet
SEK M2015
Jan-Jun2014
Jan-Jun2014
Jan-Dec
Net sales 23 22 45Administration expenses –31 –28 –53Loss before financial income and expenses –8 –6 –8
Loss from participations in Group companies – – –1Profit from participations in joint ventures 11 12 12Financial income 30 116 236Financial expenses –45 –112 –190Profit/loss before tax and appropriations –12 10 49
Group contributions paid – – –38Tax – –2 –Profit/loss for the period –12 8 11
SEK M2015
Jun 302014
Jun 302014
Dec 31
Tangible fixed assets 1 1 1Receivables from Group companies 1,245 1,300 1,078Other financial fixed assets 1,544 872 1,271Total fixed assets 2,790 2,173 2,350
Cash and bank balances 20 23 2Receivables from Group companies 1,613 1,913 1,578Other current assets 84 37 20Total current assets 1,717 1,973 1,601
Total assets 4,507 4,146 3,951
Equity 1,518 1,604 1,693
Long-term interest-bearing liabilities 1,998 2,172 1,958Liabilities to Group companies 738 – –Deferred tax liability 2 2 2Total long-term liabilities 2,738 2,174 1,960
Liabilities to Group companies 93 217 190Other current liabilities 158 151 108Total current liabilities 251 368 2,258
Total equity and liabilities 4,507 4,146 3,951

22 Interim report January - June 2015
The Sagax share and shareholders
At the end of the period, the company had 7,578 (7,653) shareholders. Sagax’s market capitalization amounted to SEK 10,504 M (7,609). Sagax has three classes of shares: Class A common shares, Class B common shares, and prefer-ence shares. Sagax’s shares are listed on Nasdaq Stockholm, Mid Cap. There are a total of 13,416,822 Class A shares,
144,858,130 Class B shares and 58,250,000 preference shares outstanding. In addition, 1,000,000 previously bought back Class B shares were held in treasury.
Each preference share entails a preferential right to SEK 2.00 in annual dividends. The share price trend and informa-tion about share trading are provided below.
Omsatt antal aktier 1 000-tal per veckaPreferensaktien
Kr
0
150
300
450
600
750
900
1 050
1 200
JunMajAprMarFebJanDecNovOktSepAugJul0
5
10
15
20
25
30
35
40
©
Price trend of preference shares for the past 12 months
Omsatt antal aktier 1 000-tal per vecka
Carnegie Real Estate Index
Kr
Sagax B
0
300
600
900
1 200
1 500
JunMajAprMarFebJanDecNovOktSepAugJul0
10
20
30
40
50
60
70
© OMX Stockholm_Pl
Price trend of Class B shares for the past 12 months
Voting rights and proportion of share capital
Class of share No.Voting rights
per shareNumber of
votesProportion
of votesProportion
of share capital
Class A shares 13,416,822 1.00 13,416,822 40% 6%Class B shares 145,858,130 0.10 14,585,813 43% 67%Preference shares 58,250,000 0.10 5,825,000 17% 27%Total 217,524,952 33,827,635 100% 100%
Trade in the shares on the Nasdaq Stockholm
Price paid, SEKTransactions per
trading dayTurnover rate
on an annual basis, % Average trading volume per
trading day, SEK M
Jun 30, 2015 Jun 30, 2014 Jan-Jun 2015 Jan-Jun 2014 Jan-Jun 2015 Jan-Jun 2014 Jan-Jun 2015 Jan-Jun 2014
Class A shares 57.25 38.20 9 7 4 9 0.1 0.2Class B shares 53.25 36.30 139 44 14 20 4.5 3.9Preference shares 33.80 34.00 65 42 30 39 2.5 2.8

23Interim report January - June 2015
1) Comparative figures have been adjusted for the bonus issue of Class B shares in 2013, by multiplying the number of shares by 11. The conditions of the bonus issue were ten Class B shares for each Class A share.
2) Profit from property management and cash flow pertain to a rolling 12 months.3) Cash flow pertains to cash flow from operating activities before changes in working capital.4) See page 29 for definition.
Key data per common share1)
2015Jun 30
2014Jun 30
2014Dec 31
2013Dec 31
2012Dec 31
2011Dec 31
2010Dec 31
Price of Class B share at the end of the period, SEK 53.25 36.30 44.00 24.20 17.14 15.00 15.45
Profit from property management after dilution, SEK 2) 4.17 3.13 3.73 2.73 2.15 2.06 1.74Cash flow after dilution, SEK 2) 3) 3.45 2.29 2.99 2.12 1.79 1.87 1.62Equity after dilution, SEK 20.46 14.35 17.44 13.40 8.09 6.99 6.92EPRA NAV, SEK 4) 30.09 21.92 27.23 19.05 14.86 12.76 10.76Price of Class B share/Profit from property management, multiple 2) 12.8 11.6 11.8 8.9 8.0 7.3 8.9Price of Class B share/Cash flow, multiple 2) 3) 15.4 15.8 14.7 11.4 9.6 8.0 9.5Price of Class B share/Equity, % 260 253 252 181 212 215 224Price of Class B share/EPRA NAV, % 177 166 162 127 116 118 144
WARRANTSSagax has three warrant plans for the company’s employees. In total, Sagax’s employees hold warrants corresponding to 0.9% of the number of common shares outstanding. The company’s CEO and Board members are not involved in the plans. These plans are valid for three years, encompassing the periods 2013-2016, 2014-2017 and 2015-2018. Warrants entitle the holder to subscribe for new common shares in June 2016, June 2017 and June 2018, respectively. The subscrip-tion price corresponds to the price paid for the common share at the start of the warrant plans converted using the average share price trend for the listed property companies in accord-ance with Carnegie’s property index (CREX) during the cor-responding period. Accordingly, the warrants will have a value on condition that the price performance of the Sagax share exceeds the average for all listed property companies during each three-year period.
PROFIT FROM PROPERTY MANAGEMENT PER COMMON SHARE Profit from property management per common share after dilution on a rolling 12-month basis amounted to SEK 4.17 (3.13) which, compared with the share price of the common share at the end of the year, corresponded to a multiple of 12.8 (11.6).
EQUITY PER COMMON SHARE Equity per common share after dilution amounted to SEK 20.46 (14.35). EPRA NAV per common share amounted to SEK 30.09 (21.92). For definitions of key ratios, see page 29. The share price for the Class B share at the end of the year was 260% (253) of equity per common share and 177% (166) of EPRA NAV per common share.
Share price/profit from property management per common share
Multiple
Share prince/profit from property management per Class B share, rolling 12 months
2005 2006 2007 2008 2009 2015201420132012201120100
5
10
15
20
25
Share price in relation to equity and EPRA NAV
%
Share price/EPRA NAV per Class B shareShare price/equity per Class B share
0
70
140
210
280
350
2005 2006 2007 2008 2009 201520142013201220112010

24 Interim report January - June 2015
No. of shares No. of shareholders
1–500 3,454
501–1,000 860
1,001–2,000 813
2,001–5,000 1,066
5,001–10,000 545
10,001–50,000 594
50,001– 246
Total 7,578
Shareholder category No.
Share of voting power
Private individuals residing in Sweden 6,516 10%
Private individuals residing abroad 60 1%
Companies/institutions in Sweden 686 82%
Companies/institutions abroad 316 7%
Total 7,578 100%
Shareholders by country No.
Share of voting power
Sweden 7,202 92%
Luxembourg 18 4%
UK 43 1%
Norway 23 1%
USA 43 1%
Other countries 249 1%
Total 7,578 100%
Shareholder structure June 30, 20151)
1) Including shares repurchased by AB Sagax.
1) Ownership structure at June 30 is based on information from Euroclear Sweden and the Swedish Financial Supervisory Authority’s insider register. 2) Voting rights for treasury shares held by AB Sagax have been excluded.
Largest shareholders, June 30, 20151)
No. of shares Percentage of
Class A shares Class B shares Preference shares Share capital Votes2)
David Mindus and companies 4,985,000 37,693,025 775 19.6% 26.0%Salén family and companies 1,998,733 17,485,330 78,595 9.0% 11.1%Rutger Arnhult and companies 2,793,315 15,756,685 61,711 8.6% 13.0%Länsförsäkringar Fastighetsfond – 14,061,534 – 6.5% 4.2%Third Swedish National Pension Fund – 12,068,689 – 5.5% 3.6%Catella Hedgefond – – 6,776,583 3.1% 2.0%Avanza Pension 25,813 788,101 2,363,737 1.5% 1.0%Volvo Pension Foundation – – 2,940,000 1.4% 0.9%Robur Realinvest 250,000 2,500,000 – 1.3% 1.5%Swedish Foundation for Strategic Research – – 2,750,000 1.3% 0.8%SEB S.A 72,750 336,790 2,241,483 1.2% 1.0%Fourth Swedish National Pension Fund 2,858 2,136,699 – 1.0% 0.6%Robur Småbolagsfond Sverige 133,731 1,863,275 – 0.9% 0.9%Sifonen 145,000 1,668,450 10,033 0.8% 0.9%Stiftelsen Stockholms Sjukhem – – 1,800,000 0.8% 0.5%Nordnet Pensionsförsäkring 61,896 713,465 983,346 0.8% 0.7%Skandia Liv 137,108 1,587,429 – 0.8% 0.9%Banque Carnegie Luxembourg 696,382 917,000 31,666 0.8% 2.3%Second Swedish National Pension Fund – 1,621,005 – 0.7% 0.5%Patrik Brummer – – 1,579,796 0.7% 0.5%Total 20 largest shareholders 11,302,586 111,197,477 21,617,725 66.3% 72.9%
Other shareholders 2,114,236 33,660,653 36,632,275 33.3% 27.1%Sub-total 13,416,822 144,858,130 58,250,000 99.5% 100.0%
Treasury shares held by AB Sagax – 1 000 000 – 0.5% 0.0%Total 13,416,822 145,858,130 58,250,000 100.0% 100.0% – of which, Board and employees 7,418,161 59,870,205 280,749 31.1% 39.8%

25Interim report January - June 2015
Annual General Meeting of AB Sagax 2015
At the AGM of AB Sagax on May 7, 2015, it was resolved that:
■ the income statements and balance sheets, and the Board’s proposed appropriation of profits be adopted;
■ the Board’s proposed dividend of SEK 0.80 per Class A and Class B common share and SEK 2.00 per preference share for the 2014 fiscal year, with quarterly payments of SEK 0.50 per preference share, be adopted. May 11, 2015 was adopted as the record day for payment of dividends on com-mon shares. Tuesday June 30, 2015; Wednesday September 30, 2015; Wednesday December 30, 2015 and Thursday March 31, 2016 were adopted as the record days for the payments of dividends on preference shares. The dividend is expected to be paid by Euroclear on the third working day after each record day;
■ the Board and the CEO be discharged from personal liability for the 2014 fiscal year;
■ the number of Board members was to amount to seven for the period until the next AGM;
■ Board members Johan Cederlund, Filip Engelbert, Göran E Larsson, David Mindus, Staffan Salén, Johan Thorell and Ul-rika Werdelin be reelected, and that Göran E Larsson be ap-pointed Board Chairman;
■ fees be paid in the amount of SEK 300,000 to the Board Chairman and SEK 165,000 to each other non-executive Board member elected by the AGM. The fees also include remuneration for committee work;
■ Ernst & Young AB be reelected as auditors for the forthcom-ing one-year period, with Magnus Fredmer as the auditor in charge;
■ guidelines for remuneration of the company’s senior execu-tives be adopted;
■ the 2015/2018 Incentive Plan, based on the issue of a maxi-mum of 400,000 Series 2015/2018 warrants be imple-mented. Disapplying the preferential rights of shareholders, subscription entitlement will accrue to the wholly owned subsidiary, Satrap Kapitalförvaltning AB. The warrants will be issued free of charge. Each warrant entitles the holder to subscribe for one new Class B common share in the com-pany;
■ Satrap Kapitalförvaltning be permitted to transfer a maxi-mum of 400,000 warrants in AB Sagax of the 2015/2018 series, to employees, or to have control over the warrants in some other manner in order to secure obligations pursuant to Incentive Plan 2015/2018. It is estimated that the maxi-mum number of additional Class B common shares will not exceed 400,000, corresponding to approximately 0.27% of the total number of Class B common shares in the company, subject to full subscription and full exercise of all warrants. The increase in share capital in such a case will amount to a maximum of SEK 700,000. The Incentive Plan is targeted at
individuals who are or will be employees of AB Sagax or its subsidiaries, except for the CEO;
■ authorization be granted to the Board, within the framework of the applicable Articles of Association, with or without disapplying the shareholders’ preferential rights, on one or more occasions prior to the next AGM, to make decisions to increase AB Sagax’s share capital through the new issue of Class A common shares, Class B common shares, preference shares, warrants and/or convertibles in the company. The to-tal number of shares encompassed by such share issues may not exceed 10% of the number of votes in the company, based on the total number of votes in the company on the date of the 2015 Annual General Meeting;
■ the new preference shares that may be issued under the au-thority granted by the Meeting are to provide entitlement to dividends from the date on which they are entered into the shareholders' register administered by Euroclear Sweden AB;
■ authorization be granted to the Board, on one or more occa-sions prior to the next AGM, to make a decision to acquire a total of as many Class A common shares, Class B common shares, preference shares, warrants and/or convertibles as necessary so that the company’s holdings at any time do not exceed a tenth of the total number of shares in the company. Acquisitions of treasury shares are to take place on Nasdaq Stockholm and may only take place at a price within the price span applicable at any time, meaning the span between the highest bid and lowest offer price, or on the basis of an acquisition offering directed to all shareholders, whereby the acquisition is to take place at a price that on the decision date corresponds to a minimum of the applicable share price and a maximum of 150% of the applicable share price. Ac-quisition of treasury warrants and/or convertibles is to take place at a price that on the decision date corresponds to a maximum of the market value;
■ authorization be granted to the Board, on one or more occa-sions prior to the next AGM, to make decisions to transfer, with or without disapplying the shareholders’ preferential rights, all or portions of the company’s holding of treasury Class A common shares, Class B common shares, preference shares and/or warrants as payment for acquisitions of prop-erties or property companies, or parts of properties or prop-erty companies, at a price corresponding to the share price or, regarding warrants the market value, on the date of sale. Transfer of all or portions of the company’s holdings of treas-ury Class A common shares, Class B common shares and/or preference shares may also occur, on one or more occa-sions prior to the next AGM, to finance such acquisitions, for which shares are to be sold on Nasdaq Stockholm at a price that is within the price interval applicable at any time.
26 Interim report January - June 2015
Risks and uncertainties
To prepare the accounts in accordance with generally accept-ed accounting policies, company management is required to make judgments and assumptions that affect the asset and lia-bility items, and revenue and expense items recognized in the accounts and other information provided. The actual outcome may differ from these judgments.
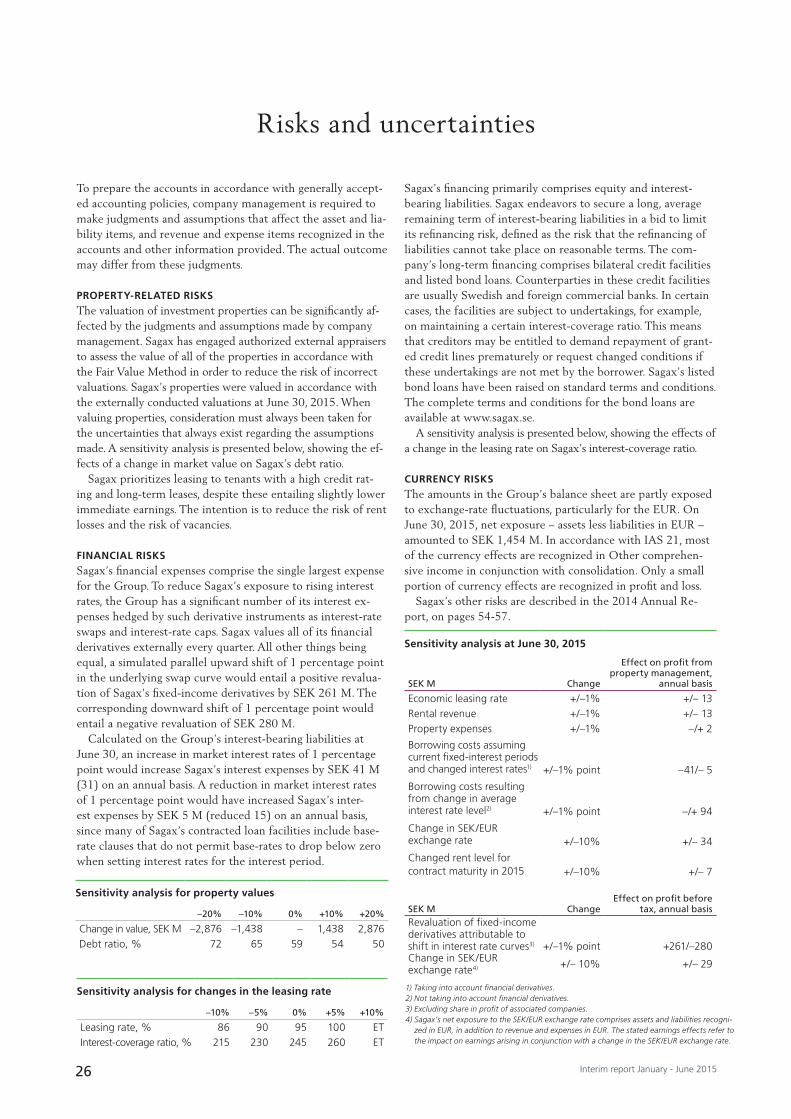
PROPERTY-RELATED RISKSThe valuation of investment properties can be significantly af-fected by the judgments and assumptions made by company management. Sagax has engaged authorized external appraisers to assess the value of all of the properties in accordance with the Fair Value Method in order to reduce the risk of incorrect valuations. Sagax’s properties were valued in accordance with the externally conducted valuations at June 30, 2015. When valuing properties, consideration must always been taken for the uncertainties that always exist regarding the assumptions made. A sensitivity analysis is presented below, showing the ef-fects of a change in market value on Sagax’s debt ratio.
Sagax prioritizes leasing to tenants with a high credit rat-ing and long-term leases, despite these entailing slightly lower immediate earnings. The intention is to reduce the risk of rent losses and the risk of vacancies.
FINANCIAL RISKSSagax’s financial expenses comprise the single largest expense for the Group. To reduce Sagax’s exposure to rising interest rates, the Group has a significant number of its interest ex-penses hedged by such derivative instruments as interest-rate swaps and interest-rate caps. Sagax values all of its financial derivatives externally every quarter. All other things being equal, a simulated parallel upward shift of 1 percentage point in the underlying swap curve would entail a positive revalua-tion of Sagax’s fixed-income derivatives by SEK 261 M. The corresponding downward shift of 1 percentage point would entail a negative revaluation of SEK 280 M.
Calculated on the Group’s interest-bearing liabilities at June 30, an increase in market interest rates of 1 percentage point would increase Sagax’s interest expenses by SEK 41 M (31) on an annual basis. A reduction in market interest rates of 1 percentage point would have increased Sagax’s inter-est expenses by SEK 5 M (reduced 15) on an annual basis, since many of Sagax’s contracted loan facilities include base-rate clauses that do not permit base-rates to drop below zero when setting interest rates for the interest period.
Sagax’s financing primarily comprises equity and interest-bearing liabilities. Sagax endeavors to secure a long, average remaining term of interest-bearing liabilities in a bid to limit its refinancing risk, defined as the risk that the refinancing of liabilities cannot take place on reasonable terms. The com-pany’s long-term financing comprises bilateral credit facilities and listed bond loans. Counterparties in these credit facilities are usually Swedish and foreign commercial banks. In certain cases, the facilities are subject to undertakings, for example, on maintaining a certain interest-coverage ratio. This means that creditors may be entitled to demand repayment of grant-ed credit lines prematurely or request changed conditions if these undertakings are not met by the borrower. Sagax’s listed bond loans have been raised on standard terms and conditions. The complete terms and conditions for the bond loans are available at www.sagax.se.
A sensitivity analysis is presented below, showing the effects of a change in the leasing rate on Sagax’s interest-coverage ratio.
CURRENCY RISKSThe amounts in the Group’s balance sheet are partly exposed to exchange-rate fluctuations, particularly for the EUR. On June 30, 2015, net exposure – assets less liabilities in EUR – amounted to SEK 1,454 M. In accordance with IAS 21, most of the currency effects are recognized in Other comprehen-sive income in conjunction with consolidation. Only a small portion of currency effects are recognized in profit and loss.
Sagax’s other risks are described in the 2014 Annual Re-port, on pages 54-57.
1) Taking into account financial derivatives.2) Not taking into account financial derivatives.3) Excluding share in profit of associated companies.4) Sagax’s net exposure to the SEK/EUR exchange rate comprises assets and liabilities recogni-
zed in EUR, in addition to revenue and expenses in EUR. The stated earnings effects refer to the impact on earnings arising in conjunction with a change in the SEK/EUR exchange rate.
Sensitivity analysis at June 30, 2015
SEK M Change
Effect on profit from property management,
annual basis
Economic leasing rate +/–1% +/– 13Rental revenue +/–1% +/– 13Property expenses +/–1% –/+ 2
Borrowing costs assuming current fixed-interest periods and changed interest rates1) +/–1% point –41/– 5
Borrowing costs resulting from change in average interest rate level2) +/–1% point –/+ 94
Change in SEK/EUR exchange rate +/–10% +/– 34
Changed rent level for contract maturity in 2015 +/–10% +/– 7
SEK M ChangeEffect on profit before
tax, annual basisRevaluation of fixed-income derivatives attributable to shift in interest rate curves3) +/–1% point +261/–280Change in SEK/EUR exchange rate4) +/– 10% +/– 29
Sensitivity analysis for property values
–20% –10% 0% +10% +20%
Change in value, SEK M –2,876 –1,438 – 1,438 2,876Debt ratio, % 72 65 59 54 50
Sensitivity analysis for changes in the leasing rate
–10% –5% 0% +5% +10%
Leasing rate, % 86 90 95 100 ET Interest-coverage ratio, % 215 230 245 260 ET
27Interim report January - June 2015
Sagax complies with the International Financial Reporting Standards (IFRS), as adopted by the EU, and the interpreta-tions of the International Financial Reporting Interpretations Committee (IFRIC). The consolidated financial statements have also been prepared in accordance with Swedish law ap-plying Recommendation RFR 1 Supplementary Accounting Rules for Corporate Groups of the Swedish Financial Report-ing Board.
This interim report has been prepared in accordance with International Accounting Standards (IAS) 34. Apart from the above, the accounting policies and calculation methods applied in this report are unchanged compared with those applied in the 2014 Annual Report.
Accounting policies
On July 10, Sagax announced the acquisition of a property in Stockholm for a total of SEK 142 M. The property is lo-cated Järfälla Municipality in the north of Stockholm and en-
compasses 13,000 square meters of lettable area and 37,000 square meters of freehold land. Possession will be taken on 1 September.
Significant events after the end of the period
Stockholm, August 25, 2015AB SAGAX (publ)
Corporate Registration Number 556520-0028
Göran E LarssonChairman of the Board
Johan Cederlund Filip Engelbert David Mindus Board Member CEO and Board Member Board Member
Staffan Salén Johan Thorell Ulrika Werdelin Board member Board member Board member
This interim report has not been audited. This constitutes information that AB Sagax may be legally obliged to publish under the Securities Market Act and/or the Financial Instruments Trading Act. The information was released for publication on August 26, 2015 at 8.00 a.m. (CET).
The Board of Directors and CEO give their assurance that this interim report provides a fair review of the company’s and the Group’s operations, financial position and earnings and describes significant risks and uncertainties faced by the company and the companies included in the Group.

28 Interim report January - June 2015
FOR FURTHER INFORMATION, PLEASE CONTACT:
David Mindus, CEO+46 8 545 83 540, [email protected]
Peter Larsen, CFO+46 8 545 83 540, [email protected]
Visit us at www.sagax.se.
Interim Report January-September 2015 October 22, 2015Year-end report 2015 February 11, 2016
SCHEDULE OF DIVIDEND PAYMENTS TO PREFERENCE SHAREHOLDERS
September 2015 ■ Final day for trading including dividend rights September 28, 2015 ■ First day for trading excluding dividend rights September 29, 2015 ■ Record date for dividend payment September 30, 2015 ■ Expected payment date by Euroclear1) October 5, 2015
December 2015 ■ Final day for trading including dividend rights December 28, 2015 ■ First day for trading excluding dividend rights December 29, 2015 ■ Record date for dividend payment December 30, 2014 ■ Expected payment date by Euroclear1) January 7, 2016
March 2016 ■ Final day for trading including dividend rights March 29, 2016 ■ First day for trading excluding dividend rights March 30, 2016 ■ Record date for dividend payment March 31, 2016 ■ Expected payment date by Euroclear1) April 5, 2016
June 2016 ■ Final day for trading including dividend rights June 28, 2016 ■ First day for trading excluding dividend rights June 29, 2016 ■ Record date for dividend payment June 30, 2016 ■ Expected payment date by Euroclear1) July 5, 2016
1) Payment is made on the third bank day following the record date for Swedish issuers. Sagax is unable to affect this date.
Financial calendar
29Interim report January - June 2015
Definitions
Cash flow per common shareProfit before tax adjusted for items not in-cluded in cash flow and less current tax in relation to the average number of common shares. The preferential rights of preference shares to dividends for the period were also deducted from profit before tax. Dividends received from joint ventures have been added to profit before tax.
Debt ratioInterest-bearing liabilities at the end of the period as a percentage of total assets at the end of the period.
DilutionDilution due to outstanding warrants has been calculated, in accordance with IAS 33, as the number of common shares that are to be issued to cover the difference between the redemption price and share price for all po-tential common shares (warrants) outstand-ing, to the extent it is probable that they will be utilized.
Earnings per common shareProfit in relation to the average number of common shares after taking into account pref-erence shares’ portion of profit for the period.
Economic leasing rateContractual annual rent at the end of the pe-riod as a percentage of rental value at the end of the period.
EPRA NAVRecognized equity according to the balance sheet with reversal of reserves for fixed-in-come derivatives, deferred tax pertaining to temporary differences on property values and deferred tax pertaining to reserves for fixed-income derivatives.
Equity/assets ratioEquity as a percentage of total assets.
Equity per common shareEquity at the end of the period as a percent-age of the number of common shares at the end of the period after taking into account preference share capital.
Equity per preference shareEquity per preference share corresponds to the preferential right of the preference share on liquidation of the Company (SEK 30 per preference share) and the share’s accumu-lated preferential right to dividends (SEK 2 per year).
EURIBOREURIBOR, or the Euro Interbank Offered Rate, is a daily reference rate based on the av-erage of the interest rates at which euro inter-
bank term deposits are being offered by one prime bank to another within the EMU zone.
Financial derivativesAgreements on lending rates that may include the factors of time, inflation and/or maximum interest rate levels. Usually signed to hedge in-terest rate levels for interest-bearing loans.
IFRSInternational Financial Reporting Standards. International Financial Reporting Standards (IFRS), to be applied for consolidated finan-cial statements by listed companies within the EU.
Interest-coverage ratioProfit from property management, exclud-ing profit from joint ventures but including dividends from joint ventures, after reversal of financial expenses in relation to financial expenses.
Interest-rate swapsAn interest-rate swap is an agreement be-tween two parties to swap interest rate condi-tions on loans in the same currency. The swap entails that one party exchanges its variable interest rate for a fixed rate, while the other party receives a fixed rate in exchange for a variable rate. The purpose of an interest rate swap is to reduce interest-rate risk.
Joint venturePartnership form whereby several owners have a shared controlling influence.
Lease termRemaining term of a lease.
Leasing rate by areaContracted area at the end of the period as a percentage of total lettable area at the end of the period.
Net debtInterest-bearing liabilities less interest-bearing assets and cash and cash equivalents.
Preference equityCalculated as equity per preference share multiplied by the number of outstanding preference shares.
Profit from property managementProfit excluding changes in value and tax.
Profit from property management per common share after dilutionProfit from property management for the pe-riod reduced by preference shares’ preferen-tial rights to dividends, divided by the average number of common shares after dilution.
PropertyPertains to properties held under title or site leasehold.
Rental valueThe contractual annual rent applicable at the end of the period, with supplements for esti-mated market rents for vacant premises.
Return on equityProfit for the period, recalculated to 12 months, as a percentage of average equity (opening and closing balances)/2 for the period.
Return on total capitalProfit for the period, recalculated at 12 months, after net financial items after re-versal of financial expenses as a percentage of average total assets for the period.
STIBORSTIBOR, or Stockholm Interbank Offered Rate, is a daily reference rate based on the av-erage of the interest rates at which banks offer to lend unsecured funds to other banks in the Swedish wholesale money market.
Surplus ratioNet operating income for the period as a per-centage of the period’s rental revenue.
Total return on sharesTotal of the change in the share price during the period and the dividend paid during the period as a percentage of the share price at the end of the preceding year.
Total yield on propertyTotal of yield and change in value during the period as a percentage of the property value at the end of the preceding year.
Triple net leaseThese are a type of lease agreement, where-by the tenant, in addition to the rent, agrees to pay all costs that accrue to the property and, which would normally be charged to the property owner. These include operat-ing expenses, maintenance, property tax, site leasehold fees, insurance, property manage-ment, etc.
YieldNet operating income for the period (in-cluding property administration), recalcu-lated at 12 months, adjusted for the holding periods of the properties during the period as a percentage of the carrying amounts of the properties at the end of the period.
AB Sagax (publ), Engelbrektsplan 1, SE-114 34 Stockholm, SwedenCorp. Reg. No. 556520-0028
Tel: + 46 8 545 83 540, fax: + 46 8 545 83 549www.sagax.se
AB Sagax is a property company whose business concept is to invest in commercial properties, primarily in the warehouse and light industry segment. Sagax’s property holdings at
June 30, 2015 amounted to 1,707,000 square meters, distributed between 201 properties. AB Sagax (publ) is listed on Nasdaq Stockholm, Mid Cap.
More information is available at www.sagax.se.