interim report q1 2019 - corporate.elisa.com · göteborg film festival. • elisa started the...
TRANSCRIPT
Interim Report Q1 201917 APRIL 2019
Q1
2019
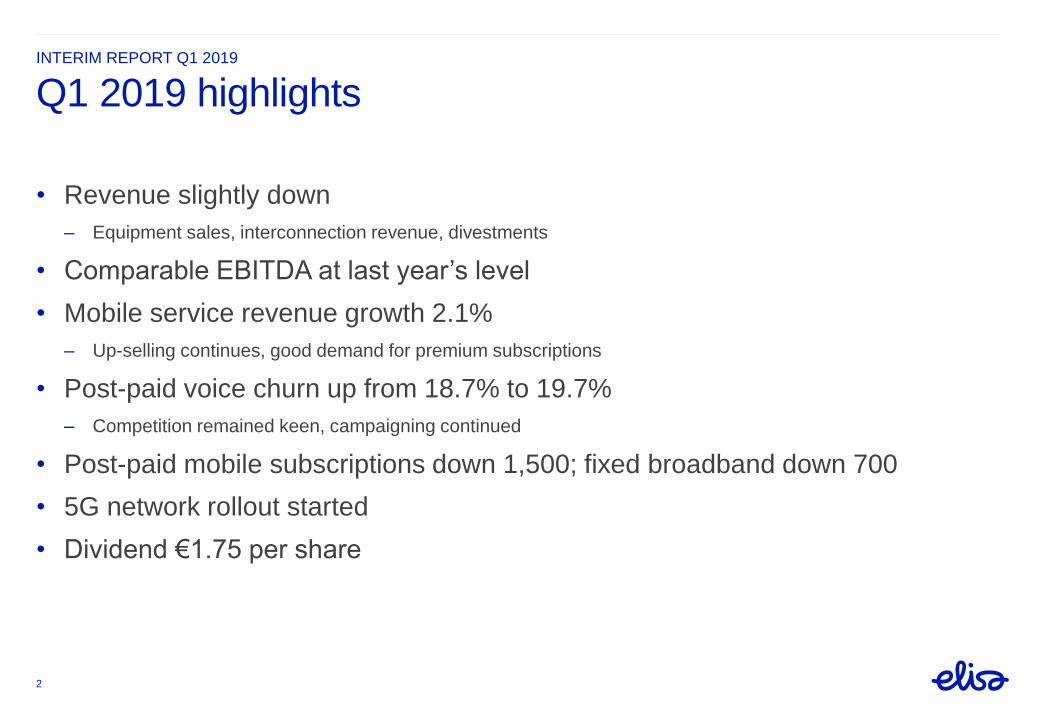
• Revenue slightly down
– Equipment sales, interconnection revenue, divestments
• Comparable EBITDA at last year’s level
• Mobile service revenue growth 2.1%
– Up-selling continues, good demand for premium subscriptions
• Post-paid voice churn up from 18.7% to 19.7%
– Competition remained keen, campaigning continued
• Post-paid mobile subscriptions down 1,500; fixed broadband down 700
• 5G network rollout started
• Dividend €1.75 per share
INTERIM REPORT Q1 2019
2
Q1 2019 highlights
INTERIM REPORT Q1 2019
3
Revenue Mobile service revenue
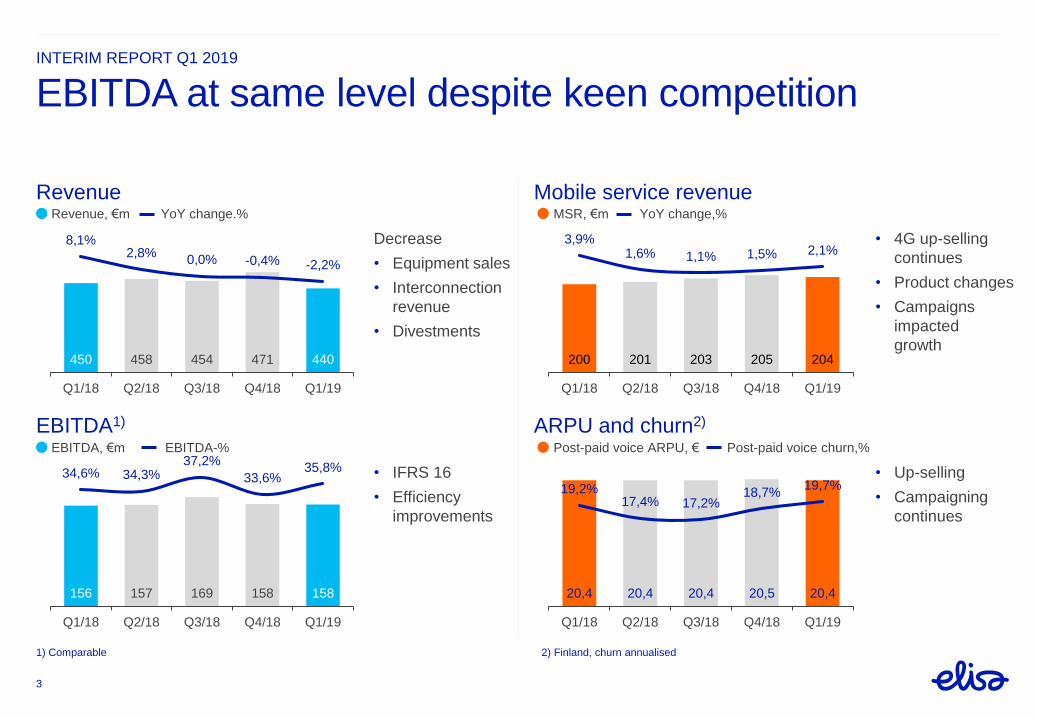
EBITDA at same level despite keen competition
EBITDA1) ARPU and churn2)
450 458 454 471 440
8,1%2,8%
0,0% -0,4% -2,2%
Q1/18 Q2/18 Q3/18 Q4/18 Q1/19
156 157 169 158 158
34,6% 34,3%37,2%
33,6%35,8%
Q1/18 Q2/18 Q3/18 Q4/18 Q1/19
20,4 20,4 20,4 20,5 20,4
19,2%17,4% 17,2%
18,7%19,7%
Q1/18 Q2/18 Q3/18 Q4/18 Q1/19
200 201 203 205 204
3,9%1,6% 1,1% 1,5% 2,1%
Q1/18 Q2/18 Q3/18 Q4/18 Q1/19
Decrease
• Equipment sales
• Interconnection
revenue
• Divestments
• 4G up-selling
continues
• Product changes
• Campaigns
impacted
growth
• IFRS 16
• Efficiency
improvements
• Up-selling
• Campaigning
continues
2) Finland, churn annualised1) Comparable
Post-paid voice ARPU, € Post-paid voice churn,%
MSR, €m YoY change,%
EBITDA, €m EBITDA-%
Revenue, €m YoY change.%
INTERIM REPORT Q1 2019
4
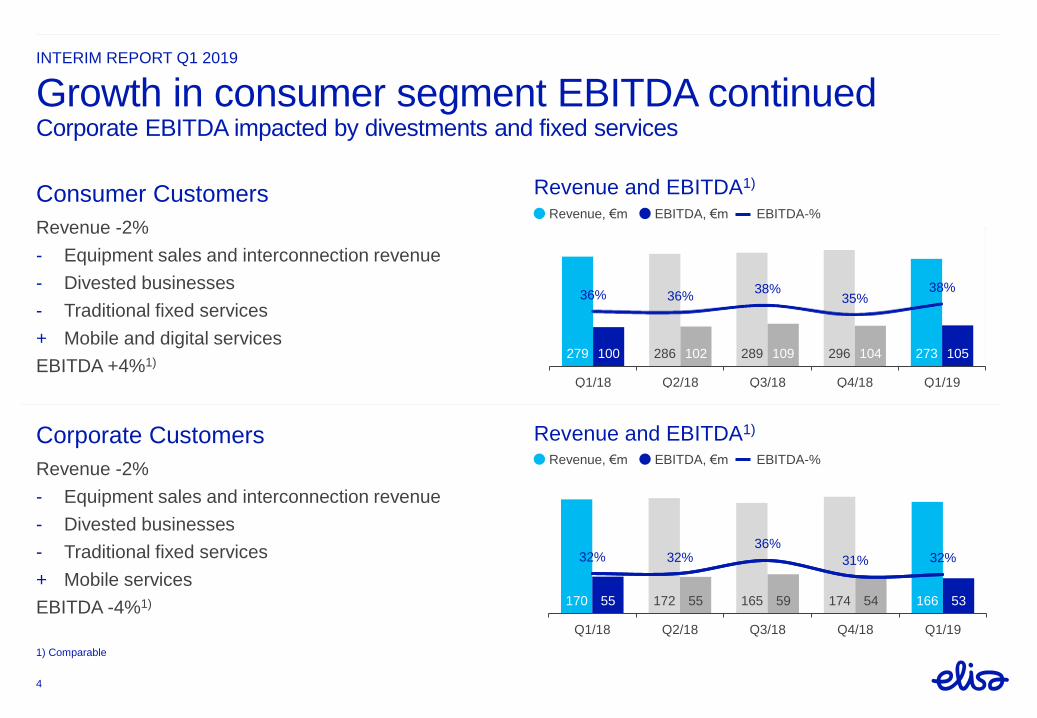
Consumer Customers Revenue and EBITDA1)
Growth in consumer segment EBITDA continuedCorporate EBITDA impacted by divestments and fixed services
Corporate Customers Revenue and EBITDA1)
Revenue -2%
- Equipment sales and interconnection revenue
- Divested businesses
- Traditional fixed services
+ Mobile and digital services
EBITDA +4%1)
Revenue -2%
- Equipment sales and interconnection revenue
- Divested businesses
- Traditional fixed services
+ Mobile services
EBITDA -4%1)
1) Comparable
279 286 289 296 273100 102 109 104 105
36% 36%38%
35%38%
Q1/18 Q2/18 Q3/18 Q4/18 Q1/19
170 172 165 174 16655 55 59 54 53
32% 32%36%
31% 32%
Q1/18 Q2/18 Q3/18 Q4/18 Q1/19
Revenue, €m EBITDA, €m EBITDA-%
Revenue, €m EBITDA, €m EBITDA-%
Strategy executionINTERIM REPORT Q1 2019
5
Increase mobile and fixed service revenues
Grow digital service businesses
Improve efficiency and quality
INTERIM REPORT Q1 2019
6
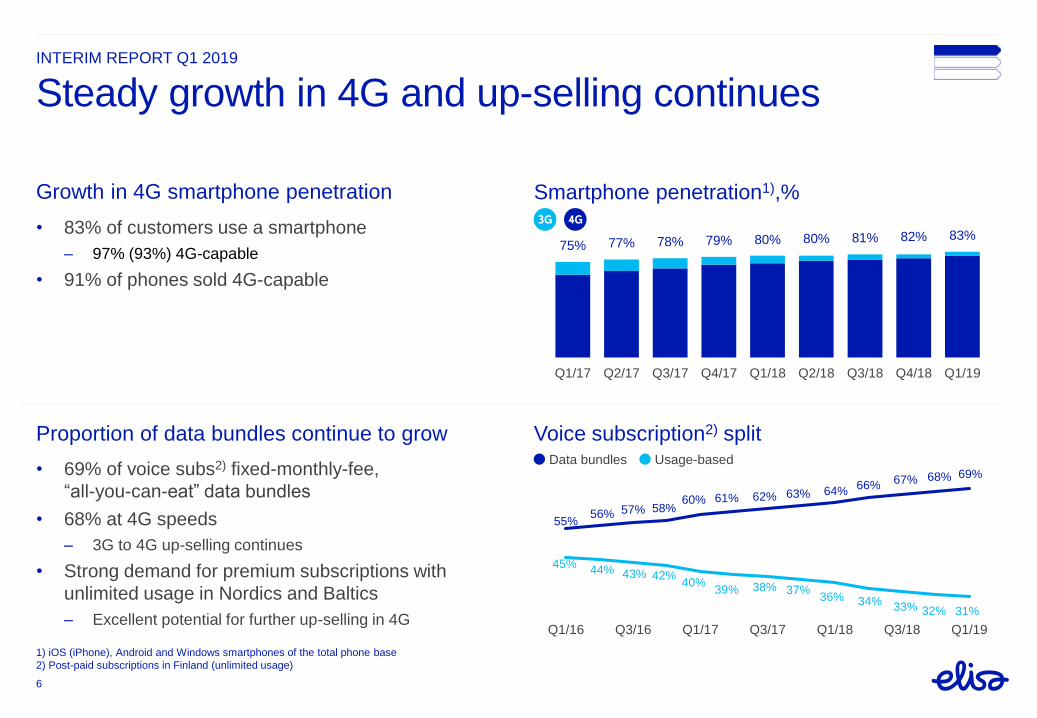
Smartphone penetration1),%
Steady growth in 4G and up-selling continues
Proportion of data bundles continue to grow Voice subscription2) split
• 83% of customers use a smartphone
– 97% (93%) 4G-capable
• 91% of phones sold 4G-capable
• 69% of voice subs2) fixed-monthly-fee,
“all-you-can-eat” data bundles
• 68% at 4G speeds
– 3G to 4G up-selling continues
• Strong demand for premium subscriptions with
unlimited usage in Nordics and Baltics
– Excellent potential for further up-selling in 4G
1) iOS (iPhone), Android and Windows smartphones of the total phone base
2) Post-paid subscriptions in Finland (unlimited usage)
55%56% 57% 58%
60% 61% 62% 63% 64%66% 67% 68% 69%
45%44% 43% 42%
40%39% 38% 37%
36% 34% 33% 32% 31%
Q1/16 Q3/16 Q1/17 Q3/17 Q1/18 Q3/18 Q1/19
75% 77% 78% 79% 80% 80% 81% 82% 83%
Q1/17 Q2/17 Q3/17 Q4/17 Q1/18 Q2/18 Q3/18 Q4/18 Q1/19
Growth in 4G smartphone penetration
Data bundles Usage-based
• Elisa original series Arctic Circle became all-
time most watched series and All the Sins won
award for outstanding screenwriting at TV at
Göteborg Film Festival.
• Elisa started the first ever 5G eSports tour in
cities across Finland. The tour is being
streamed via Elisa Viihde.
• Number of Videra’s video conferencing room
systems exceeded 100,000
• Elisa Automate has been contracted by
Orange Spain to develop service assurance
automation
• Elisa Smart Factory won its first customer in
pharmaceutical industry and is already
delivering services in 5 different industry
verticals
INTERIM REPORT Q1 2019
7
Expansion of digital service businesses continuedLeveraging core business capabilities to provide interesting growth perspective
Domestic digital services International digital services
INTERIM REPORT Q1 2019
Largest Finnish company awarded Great Place to Work for three years running
8
• Elisa again one of Finland’s best work places in the
Great Place to Work 2019 survey
• Elisa is the largest listed company in Finland awarded
for the third year in a row
• Elisians value the “Elisa Ideal Work” and flexible ways
of working, cooperation and good atmosphere of their
workplace
• Long-term development of personnel satisfaction is
evident also in Elisa’s empowerment index: 4.1 (scale
1–5)
The positive development of the macroeconomic environment is decelerating in
Finland. Competition remains challenging.
• Revenue same level or slightly higher than in 2018
• Comparable EBITDA same level or slightly higher than in 2018
• CAPEX maximum 12% of revenue
INTERIM REPORT Q1 2019
9
Outlook and guidance for 2019
Financial performanceINTERIM REPORT Q1 2019
Q1
2019
INTERIM REPORT Q1 2019
11
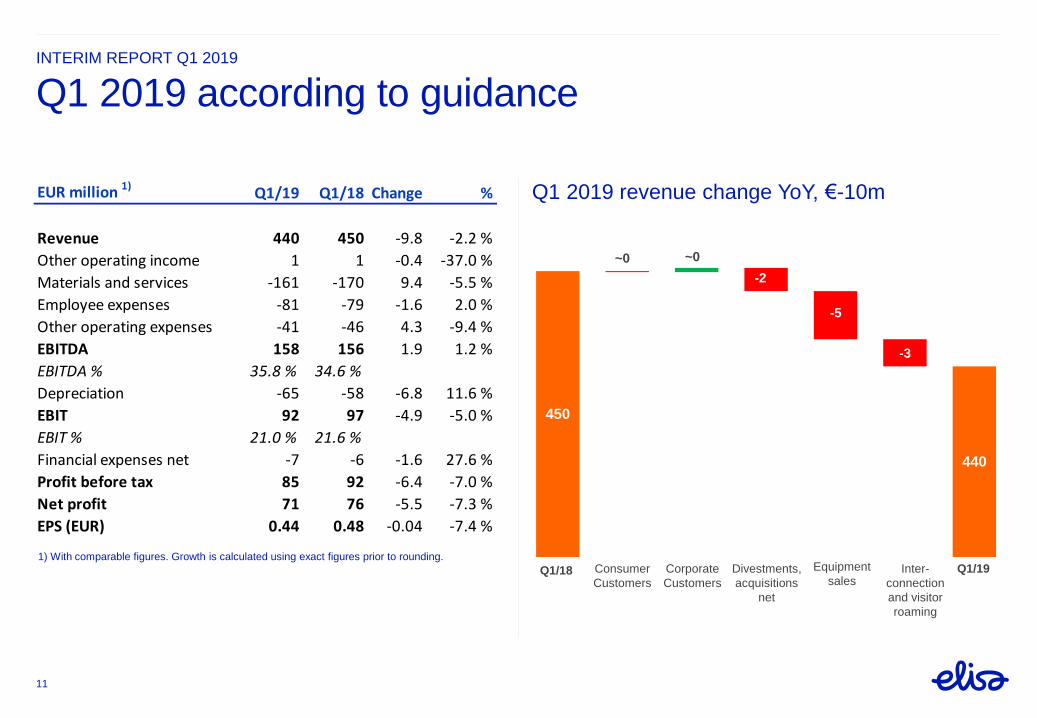
Q1 2019 according to guidance
Q1 2019 revenue change YoY, €-10m
450
440
-2
-5
-3
1) With comparable figures. Growth is calculated using exact figures prior to rounding.Consumer
Customers
Corporate
Customers
Equipment
salesInter-
connection
and visitor
roaming
Divestments,
acquisitions
net
Q1/18 Q1/19
~0 ~0
EUR million 1)Q1/19 Q1/18 Change %
Revenue 440 450 -9.8 -2.2 %
Other operating income 1 1 -0.4 -37.0 %
Materials and services -161 -170 9.4 -5.5 %
Employee expenses -81 -79 -1.6 2.0 %
Other operating expenses -41 -46 4.3 -9.4 %
EBITDA 158 156 1.9 1.2 %
EBITDA % 35.8 % 34.6 %
Depreciation -65 -58 -6.8 11.6 %
EBIT 92 97 -4.9 -5.0 %
EBIT % 21.0 % 21.6 %
Financial expenses net -7 -6 -1.6 27.6 %
Profit before tax 85 92 -6.4 -7.0 %
Net profit 71 76 -5.5 -7.3 %
EPS (EUR) 0.44 0.48 -0.04 -7.4 %
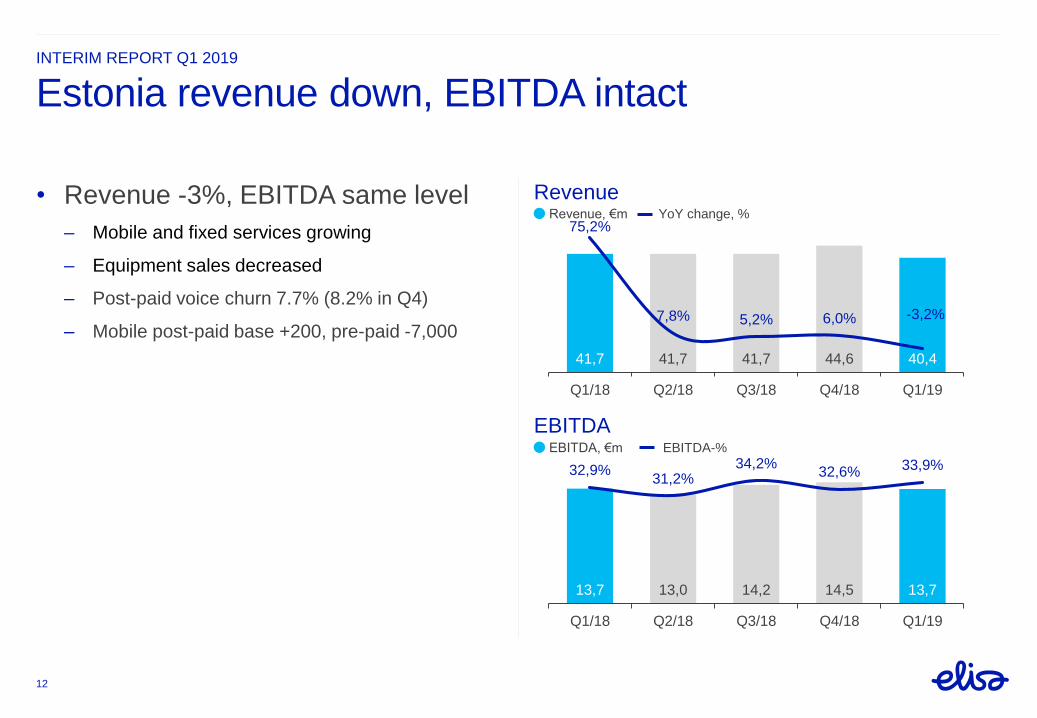
INTERIM REPORT Q1 2019
Estonia revenue down, EBITDA intact
• Revenue -3%, EBITDA same level
– Mobile and fixed services growing
– Equipment sales decreased
– Post-paid voice churn 7.7% (8.2% in Q4)
– Mobile post-paid base +200, pre-paid -7,000
12
Revenue
EBITDA
41,7 41,7 41,7 44,6 40,4
75,2%
7,8% 5,2% 6,0% -3,2%
Q1/18 Q2/18 Q3/18 Q4/18 Q1/19
13,7 13,0 14,2 14,5 13,7
32,9%31,2%
34,2%32,6% 33,9%
Q1/18 Q2/18 Q3/18 Q4/18 Q1/19
Revenue, €m YoY change, %
EBITDA, €m EBITDA-%
INTERIM REPORT Q1 2019
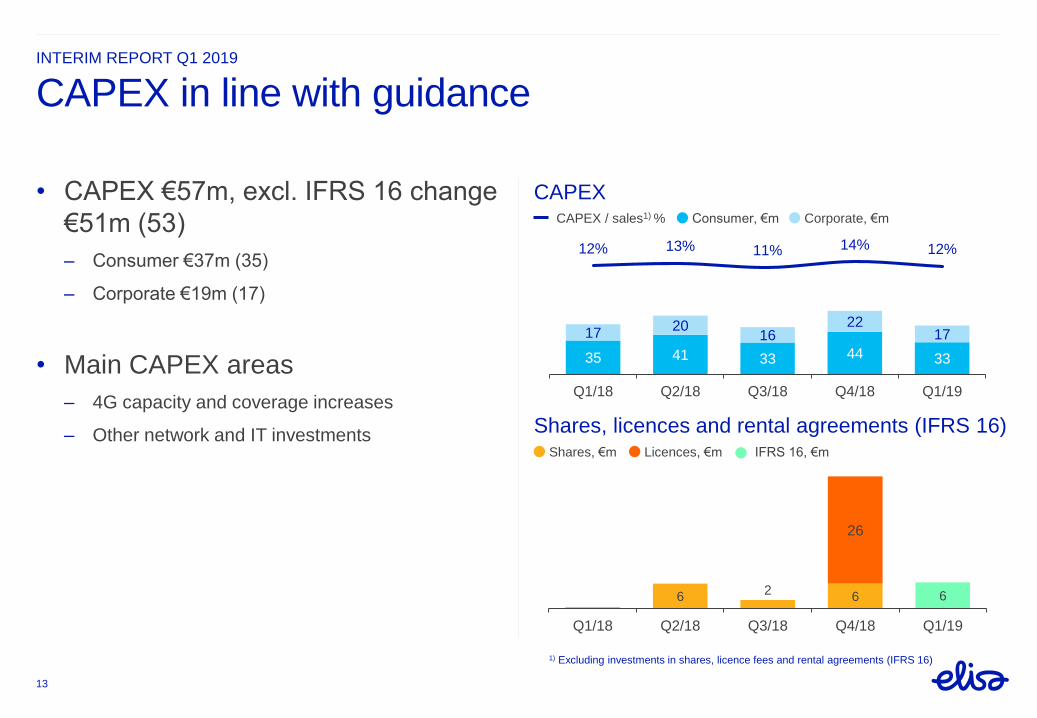
CAPEX in line with guidance
• CAPEX €57m, excl. IFRS 16 change
€51m (53)
– Consumer €37m (35)
– Corporate €19m (17)
• Main CAPEX areas
– 4G capacity and coverage increases
– Other network and IT investments
1) Excluding investments in shares, licence fees and rental agreements (IFRS 16)
35 41 33 44 33
1720
1622
17
12% 13% 11% 14% 12%
Q1/18 Q2/18 Q3/18 Q4/18 Q1/19
62
6
26
6
Q1/18 Q2/18 Q3/18 Q4/18 Q1/19
CAPEX / sales1) % Consumer, €m Corporate, €m
Shares, €m Licences, €m
13
CAPEX
Shares, licences and rental agreements (IFRS 16)IFRS 16, €m
INTERIM REPORT Q1 2019
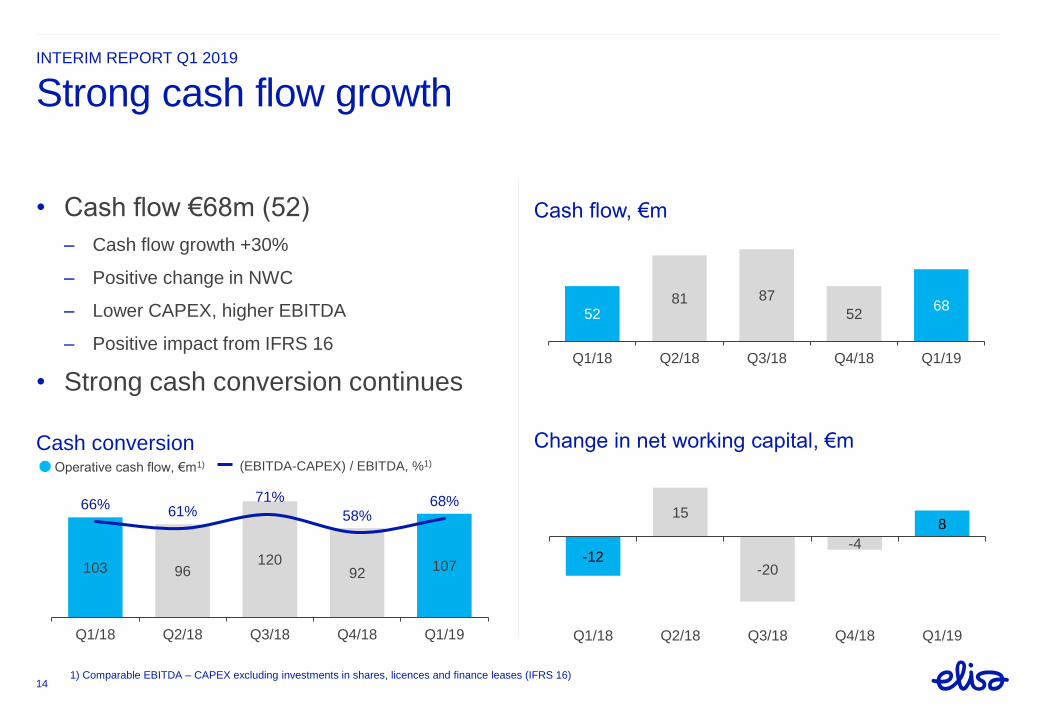
Cash conversion
Strong cash flow growth
Cash flow, €m
103 96120
92107
66%61%
71%
58%68%
Q1/18 Q2/18 Q3/18 Q4/18 Q1/19
5281 87
5268
Q1/18 Q2/18 Q3/18 Q4/18 Q1/19
• Cash flow €68m (52)
– Cash flow growth +30%
– Positive change in NWC
– Lower CAPEX, higher EBITDA
– Positive impact from IFRS 16
• Strong cash conversion continues
1) Comparable EBITDA – CAPEX excluding investments in shares, licences and finance leases (IFRS 16)14
Operative cash flow, €m1) (EBITDA-CAPEX) / EBITDA, %1)
Change in net working capital, €m
-12
15
-20
-4
8
Q1/18 Q2/18 Q3/18 Q4/18 Q1/19
INTERIM REPORT Q1 2019
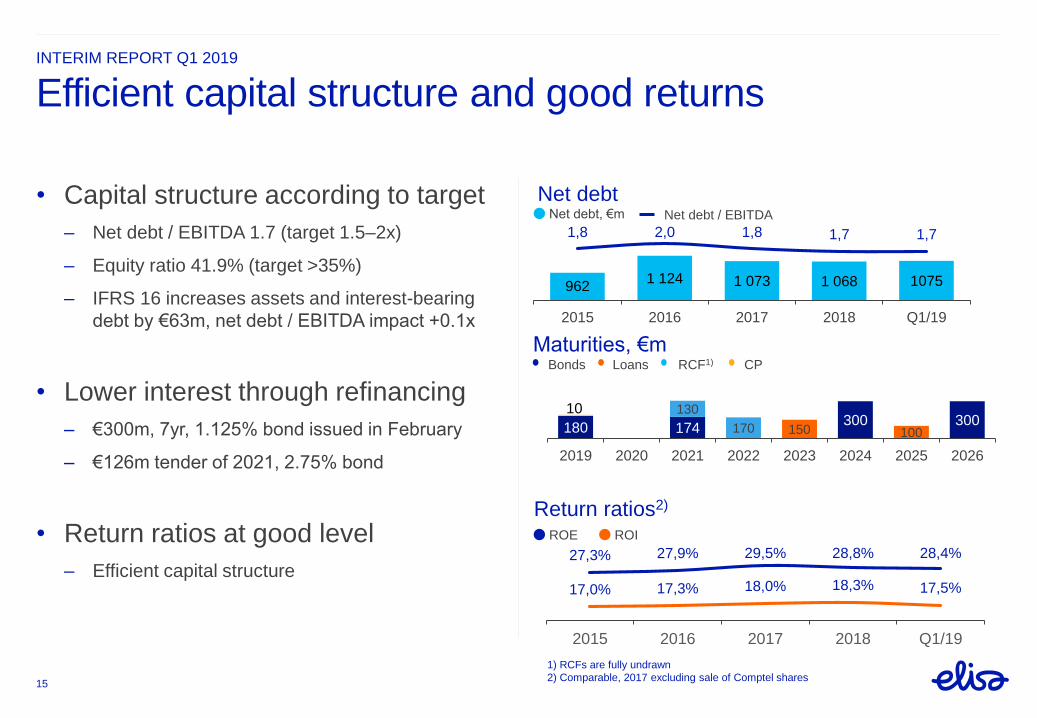
Efficient capital structure and good returns
Return ratios2)
• Capital structure according to target
– Net debt / EBITDA 1.7 (target 1.5–2x)
– Equity ratio 41.9% (target >35%)
– IFRS 16 increases assets and interest-bearing
debt by €63m, net debt / EBITDA impact +0.1x
• Lower interest through refinancing
– €300m, 7yr, 1.125% bond issued in February
– €126m tender of 2021, 2.75% bond
• Return ratios at good level
– Efficient capital structure
15
ROE ROI
Net debt
9621 124 1 073 1 068 1075
1,8 2,0 1,8 1,7 1,7
2015 2016 2017 2018 Q1/19
Net debt, €m Net debt / EBITDA
27,3% 27,9% 29,5% 28,8% 28,4%
17,0% 17,3% 18,0% 18,3% 17,5%
2015 2016 2017 2018 Q1/19
1) RCFs are fully undrawn
2) Comparable, 2017 excluding sale of Comptel shares
180 174300 300
10
150 100
130
170
2019 2020 2021 2022 2023 2024 2025 2026
Bonds RCF1) CPLoans
Maturities, €m
INTERIM REPORT Q1 2019
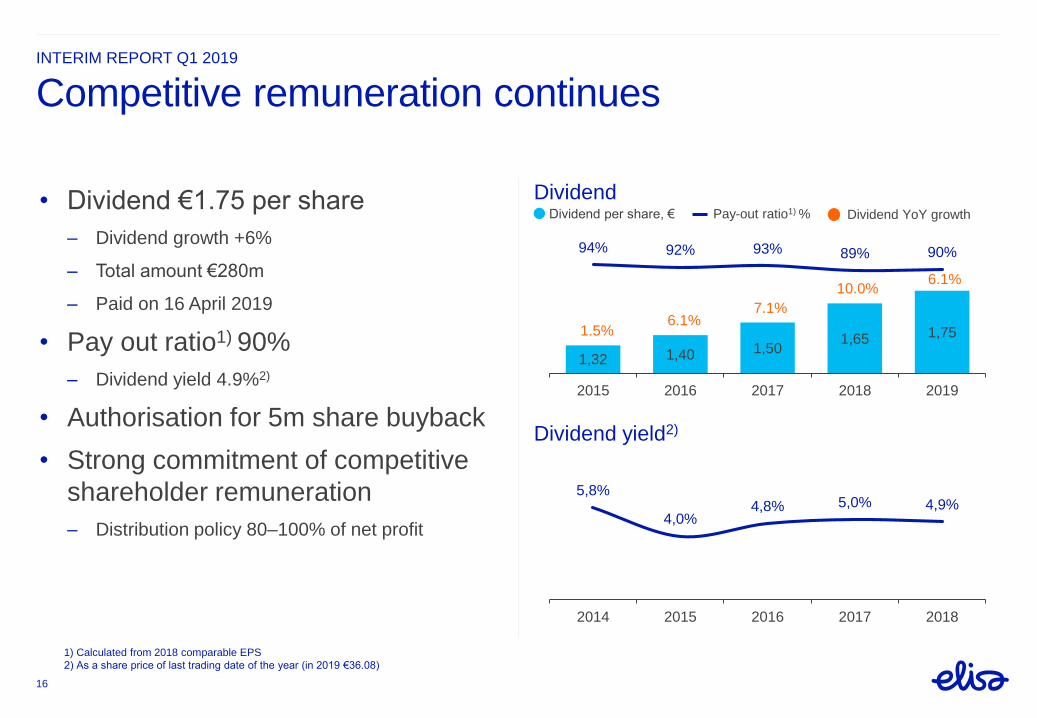
Dividend
Competitive remuneration continues
Dividend yield2)
1,32 1,40 1,501,65 1,75
94% 92% 93% 89% 90%
2015 2016 2017 2018 2019
• Dividend €1.75 per share
– Dividend growth +6%
– Total amount €280m
– Paid on 16 April 2019
• Pay out ratio1) 90%
– Dividend yield 4.9%2)
• Authorisation for 5m share buyback
• Strong commitment of competitive
shareholder remuneration
– Distribution policy 80–100% of net profit
1) Calculated from 2018 comparable EPS
2) As a share price of last trading date of the year (in 2019 €36.08)
16
5,8%
4,0%4,8% 5,0% 4,9%
2014 2015 2016 2017 2018
Dividend per share, € Pay-out ratio1) % Dividend YoY growth
1.5%6.1%
7.1%
10.0%6.1%

Q&A
Contacts:
Mr. Vesa Sahivirta
+358 50 520 5555
Ms. Kati Norppa
+358 50 308 9773
APPENDIX
19
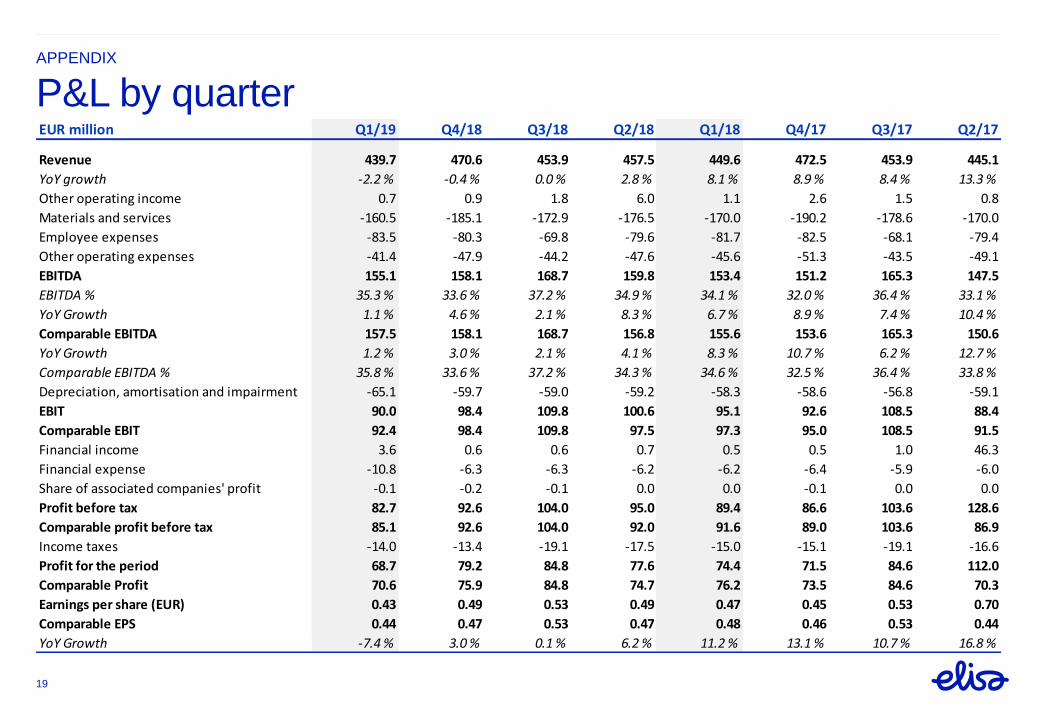
P&L by quarterEUR million Q1/19 Q4/18 Q3/18 Q2/18 Q1/18 Q4/17 Q3/17 Q2/17
Revenue 439.7 470.6 453.9 457.5 449.6 472.5 453.9 445.1
YoY growth -2.2 % -0.4 % 0.0 % 2.8 % 8.1 % 8.9 % 8.4 % 13.3 %
Other operating income 0.7 0.9 1.8 6.0 1.1 2.6 1.5 0.8
Materials and services -160.5 -185.1 -172.9 -176.5 -170.0 -190.2 -178.6 -170.0
Employee expenses -83.5 -80.3 -69.8 -79.6 -81.7 -82.5 -68.1 -79.4
Other operating expenses -41.4 -47.9 -44.2 -47.6 -45.6 -51.3 -43.5 -49.1
EBITDA 155.1 158.1 168.7 159.8 153.4 151.2 165.3 147.5
EBITDA % 35.3 % 33.6 % 37.2 % 34.9 % 34.1 % 32.0 % 36.4 % 33.1 %
YoY Growth 1.1 % 4.6 % 2.1 % 8.3 % 6.7 % 8.9 % 7.4 % 10.4 %
Comparable EBITDA 157.5 158.1 168.7 156.8 155.6 153.6 165.3 150.6
YoY Growth 1.2 % 3.0 % 2.1 % 4.1 % 8.3 % 10.7 % 6.2 % 12.7 %
Comparable EBITDA % 35.8 % 33.6 % 37.2 % 34.3 % 34.6 % 32.5 % 36.4 % 33.8 %
Depreciation, amortisation and impairment -65.1 -59.7 -59.0 -59.2 -58.3 -58.6 -56.8 -59.1
EBIT 90.0 98.4 109.8 100.6 95.1 92.6 108.5 88.4
Comparable EBIT 92.4 98.4 109.8 97.5 97.3 95.0 108.5 91.5
Financial income 3.6 0.6 0.6 0.7 0.5 0.5 1.0 46.3
Financial expense -10.8 -6.3 -6.3 -6.2 -6.2 -6.4 -5.9 -6.0
Share of associated companies' profit -0.1 -0.2 -0.1 0.0 0.0 -0.1 0.0 0.0
Profit before tax 82.7 92.6 104.0 95.0 89.4 86.6 103.6 128.6
Comparable profit before tax 85.1 92.6 104.0 92.0 91.6 89.0 103.6 86.9
Income taxes -14.0 -13.4 -19.1 -17.5 -15.0 -15.1 -19.1 -16.6
Profit for the period 68.7 79.2 84.8 77.6 74.4 71.5 84.6 112.0
Comparable Profit 70.6 75.9 84.8 74.7 76.2 73.5 84.6 70.3
Earnings per share (EUR) 0.43 0.49 0.53 0.49 0.47 0.45 0.53 0.70
Comparable EPS 0.44 0.47 0.53 0.47 0.48 0.46 0.53 0.44
YoY Growth -7.4 % 3.0 % 0.1 % 6.2 % 11.2 % 13.1 % 10.7 % 16.8 %
APPENDIX
20
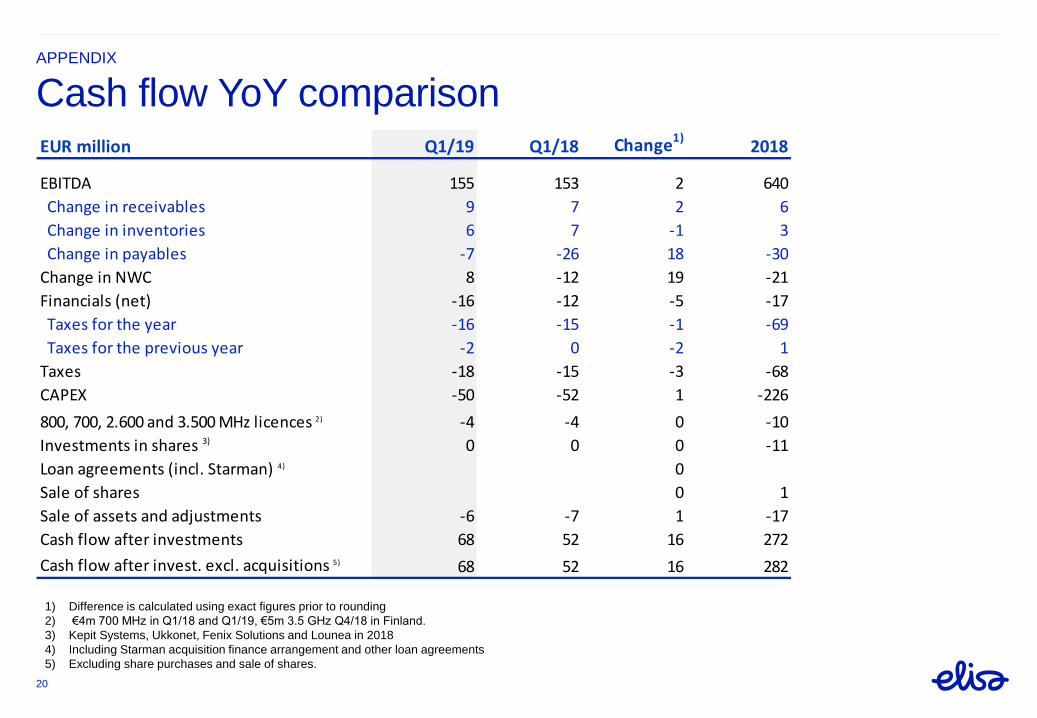
Cash flow YoY comparison
1) Difference is calculated using exact figures prior to rounding
2) €4m 700 MHz in Q1/18 and Q1/19, €5m 3.5 GHz Q4/18 in Finland.
3) Kepit Systems, Ukkonet, Fenix Solutions and Lounea in 2018
4) Including Starman acquisition finance arrangement and other loan agreements
5) Excluding share purchases and sale of shares.
EUR million Q1/19 Q1/18 Change1)2018
EBITDA 155 153 2 640
Change in receivables 9 7 2 6
Change in inventories 6 7 -1 3
Change in payables -7 -26 18 -30
Change in NWC 8 -12 19 -21
Financials (net) -16 -12 -5 -17
Taxes for the year -16 -15 -1 -69
Taxes for the previous year -2 0 -2 1
Taxes -18 -15 -3 -68
CAPEX -50 -52 1 -226
800, 700, 2.600 and 3.500 MHz licences 2) -4 -4 0 -10
Investments in shares 3) 0 0 0 -11
Loan agreements (incl. Starman) 4) 0
Sale of shares 0 1
Sale of assets and adjustments -6 -7 1 -17
Cash flow after investments 68 52 16 272
Cash flow after invest. excl. acquisitions 5) 68 52 16 282
APPENDIX
21
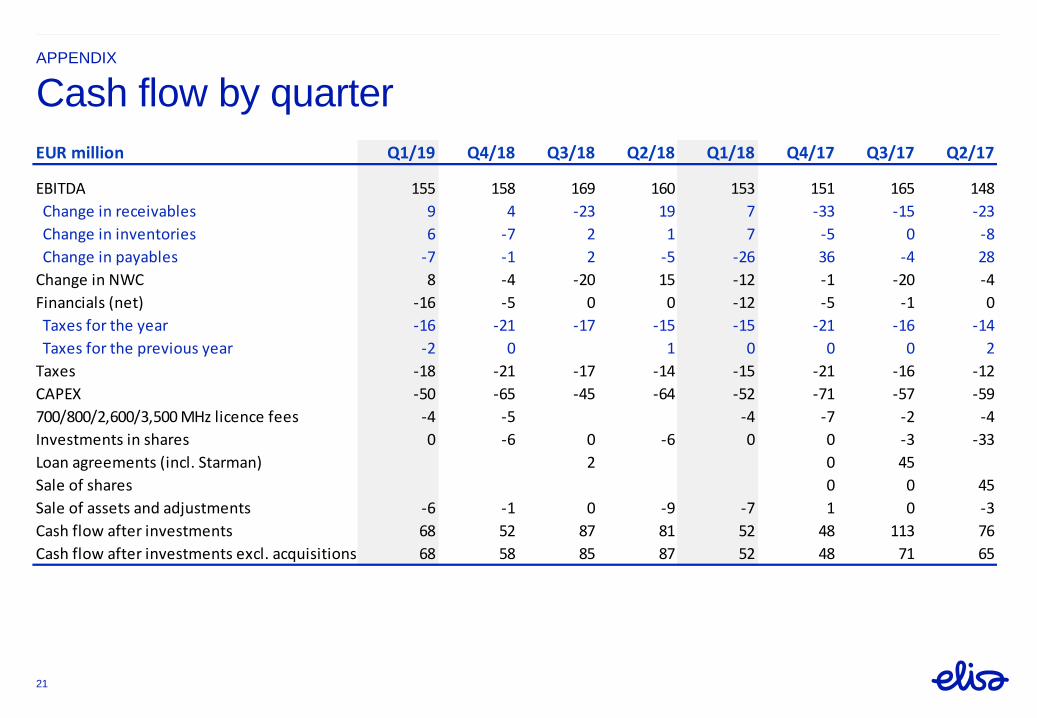
Cash flow by quarter
EUR million Q1/19 Q4/18 Q3/18 Q2/18 Q1/18 Q4/17 Q3/17 Q2/17
EBITDA 155 158 169 160 153 151 165 148
Change in receivables 9 4 -23 19 7 -33 -15 -23
Change in inventories 6 -7 2 1 7 -5 0 -8
Change in payables -7 -1 2 -5 -26 36 -4 28
Change in NWC 8 -4 -20 15 -12 -1 -20 -4
Financials (net) -16 -5 0 0 -12 -5 -1 0
Taxes for the year -16 -21 -17 -15 -15 -21 -16 -14
Taxes for the previous year -2 0 1 0 0 0 2
Taxes -18 -21 -17 -14 -15 -21 -16 -12
CAPEX -50 -65 -45 -64 -52 -71 -57 -59
700/800/2,600/3,500 MHz licence fees -4 -5 -4 -7 -2 -4
Investments in shares 0 -6 0 -6 0 0 -3 -33
Loan agreements (incl. Starman) 2 0 45
Sale of shares 0 0 45
Sale of assets and adjustments -6 -1 0 -9 -7 1 0 -3
Cash flow after investments 68 52 87 81 52 48 113 76
Cash flow after investments excl. acquisitions 68 58 85 87 52 48 71 65
APPENDIX
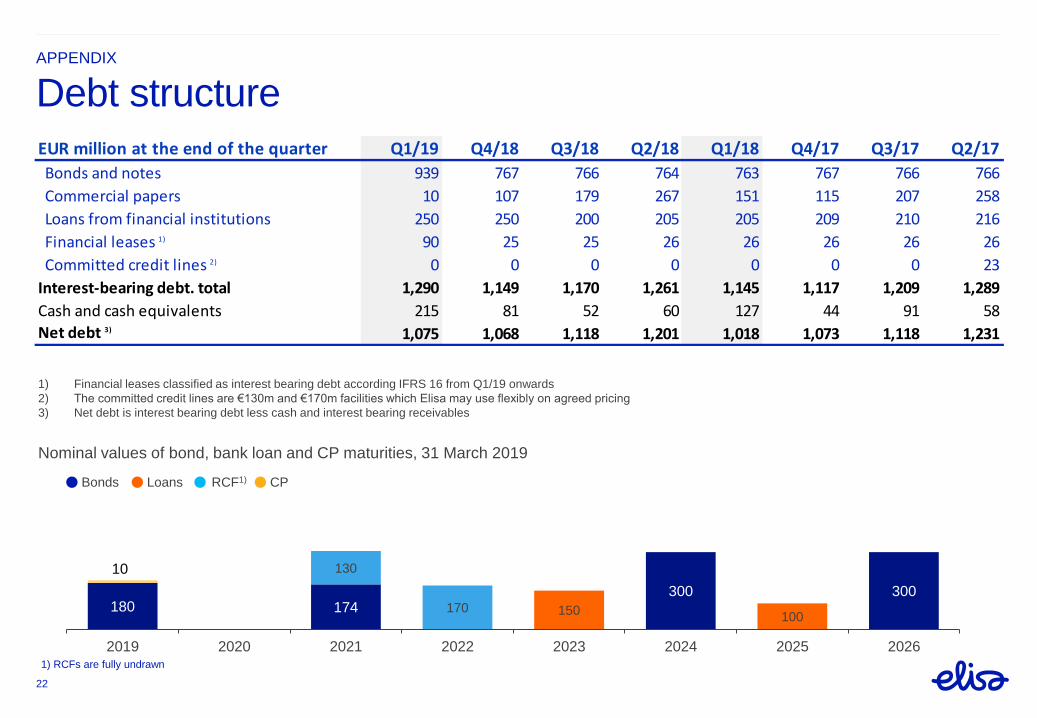
22
Debt structure
Nominal values of bond, bank loan and CP maturities, 31 March 2019
180 174300 300
10
150100
130
170
2019 2020 2021 2022 2023 2024 2025 2026
Bonds RCF1) CPLoans
1) RCFs are fully undrawn
1) Financial leases classified as interest bearing debt according IFRS 16 from Q1/19 onwards
2) The committed credit lines are €130m and €170m facilities which Elisa may use flexibly on agreed pricing
3) Net debt is interest bearing debt less cash and interest bearing receivables
EUR million at the end of the quarter Q1/19 Q4/18 Q3/18 Q2/18 Q1/18 Q4/17 Q3/17 Q2/17
Bonds and notes 939 767 766 764 763 767 766 766
Commercial papers 10 107 179 267 151 115 207 258
Loans from financial institutions 250 250 200 205 205 209 210 216
Financial leases 1) 90 25 25 26 26 26 26 26
Committed credit lines 2) 0 0 0 0 0 0 0 23
Interest-bearing debt. total 1,290 1,149 1,170 1,261 1,145 1,117 1,209 1,289
Cash and cash equivalents 215 81 52 60 127 44 91 58
Net debt 3) 1,075 1,068 1,118 1,201 1,018 1,073 1,118 1,231
Statements made in this document relating to the future, including future
performance and other trend projections, are forward-looking statements.
By their nature, forward-looking statements involve risks and uncertainties
because they relate to events and depend on circumstances that will occur
in the future. There can be no assurance that actual results will not differ
materially from those expressed or implied by these forward-looking statements,
due to many factors, many of which are outside of Elisa’s control.
INTERIM REPORT
23
Forward-looking statements