interim report q2 2016 - amazon s3nkt i interim report q2 2016 i webcast 18 august 2016 i 2 forward...
TRANSCRIPT
NKT I Interim report Q2 2016 I Webcast I 118 August 2016
6
Interim report Q2 2016
Webcast, 18 August 2016, 09:00 CET
NKT I Interim report Q2 2016 I Webcast I 218 August 2016
Forward looking statements
This presentation and related comments contain forward-looking statements Such statements are subject to many uncertainties and risks, as various factors of which several are beyond NKT Group’s control, may cause that the actual development and results differ materially from the expectations
NKT I Interim report Q2 2016 I Webcast I 318 August 2016
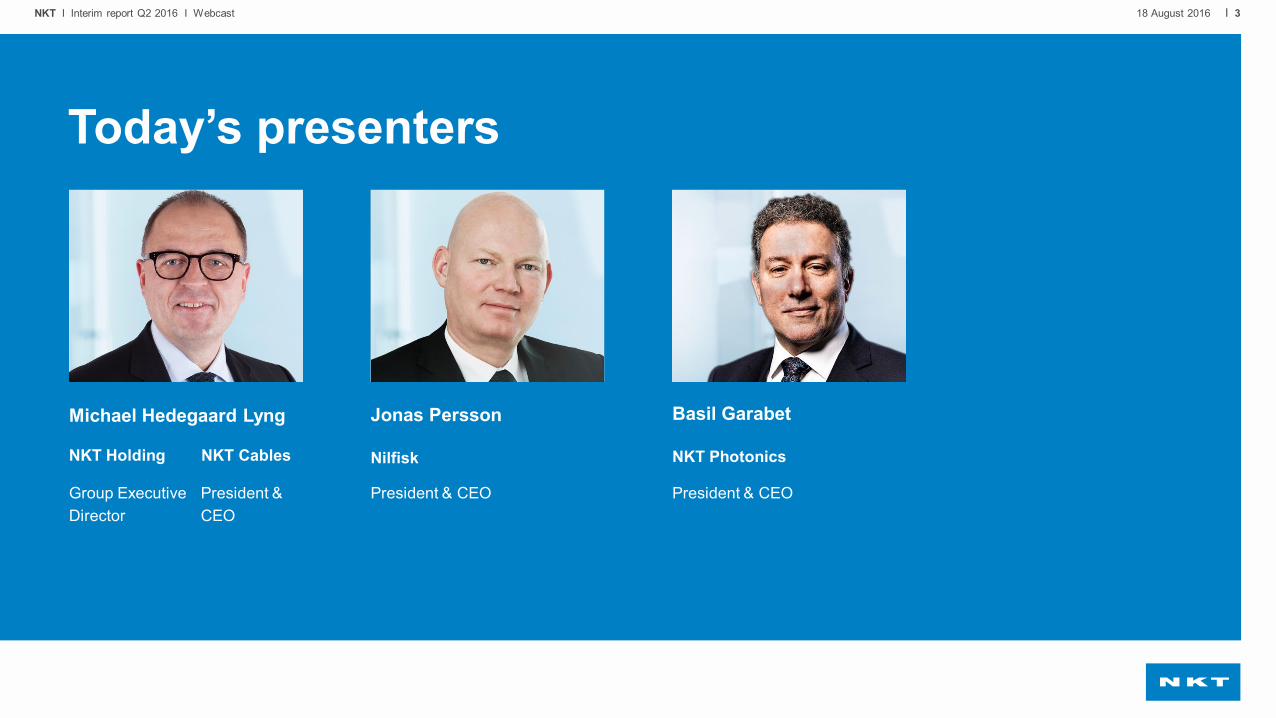
Today’s presenters
Michael Hedegaard Lyng
NKT Holding NKT Cables
Jonas Persson
Nilfisk
Basil Garabet
NKT Photonics
President & CEO
President & CEOGroup Executive Director
President & CEO

NKT I Interim report Q2 2016 I Webcast I 418 August 2016
Agenda
Highlights Q2 2016Business units
• Nilfisk
• NKT Cables
• NKT Photonics
Questions & Answers

NKT I Interim report Q2 2016 I Webcast I 518 August 2016
Highlights Q2 2016
Organic growth and earnings improved. New organisation and cost savings to secure future growth and profitability
Overall growth and earnings as expected with positive performance
by Products
Satisfactory financial performance. Basis for commercial scale enhanced
• Organic growth 3% overall, driven by EMEA, and operational EBITDA improved by 0.4%-points
• Positive effects seen from increased sales and service focus, but overall organic growth lower than expected
• New organisational structure by end-2016 to ensure growth and realise cost savings of EUR 35m by 2019
• Products business delivered 9% organic growth, while Projects was impacted by current order portfolio
• Roll-out of the EXCELLENCE 2020 strategy is on track
• New Group Management team complete and new organisational structure being finalised
• Satisfactory organic growth and earnings slightly improved
• Integration of Fianium and Lios progressed as planned and basis for more industrial solutions to gain commercial scale is in place
• Major 18-month frame contract signed with industrial customer
* std. metal prices
Earnings in line with expectations. Outlook for 2016 maintained, underlying assumptions specified• Organic growth of -5% in Q2 as expected• Operational EBITDA margin* of 10.9% in
Q2 in line with expectations and based on organic growth of -5%
• Working capital, LTM, reduced significantly driven by NKT Cables and Nilfisk
• Cash flow improved to EUR 28.7m and net-interest bearing debt remained at a low level
• Overall outlook 2016 maintained with flat organic growth and operational EBITDA margin* of ~9.4% with underlying assumptions specified− Nilfisk Organic growth
Oper. EBITDA, %− NKT Cables Oper. EBITDA, %*
1 – 3%10.0 – 10.5%
~ 9.0%

NKT I Interim report Q2 2016 I Webcast I 618 August 2016
Financial highlights Q2 2016
Revenue EUR 553.2m (Q2 2015: EUR 600.4m), impacted by lower revenue in NKT Cables
Operational EBITDA EUR 52.9m, 10.9% (std. metal prices) (Q2 2015: EUR 59.5m, 12.0%), compared with a strong Q2 2015 where NKT Cables finalised several projects
One-off costs impacting EBITDA EUR 2.1m (Q2 2015: EUR 4.6m), all related to NKT Cables
Profit after tax EUR 20.2m (Q2 2015: EUR -27.9m)
Working capital amounted to EUR 318.8m and LTM at 15.4% (Q1 2016: EUR 308m and 15.8%), driven mainly by NKT Cables’ Projects business• Nilfisk 19.6% (Q1 2016: 20.2%)• NKT Cables 11.0% (Q1 2016: 11.6%)
Cash flow from operating activities increased due to improvement in working capital ratio• Operating activities EUR 28.7m (Q2 2015: EUR 5.2m)• Investing activities EUR -17.5m (Q2 2015: EUR -29.8m) • Free cash flow EUR 11.2m (Q2 2015: EUR -24.6m)
Net cash flow EUR -13.4m (Q2 2015: EUR 8.8m) impacted by share buyback programme (EUR 20.1m) and dividend payment (EUR 13.0m)
Net interest-bearing debt amounted to EUR 188.2m (Q1 2016: EUR 158.9m)
Organic growth Q2 2016
NKT -5%
Nilfisk 3%
NKT Cables -13%
NKT Photonics 9%
See appendix for more on working capital, cash flow, and net interest-bearing debt

NKT I Interim report Q2 2016 I Webcast I 718 August 2016
2016 Original Specified Q2NKT
- Organic growth ~ 0% Unchanged
- Operational EBITDA, %* On par with 2015 (~ 9.4%) Unchanged
Nilfisk- Organic growth 0 - 5% 1 - 3%
- Operational EBITDA, % 10 - 11% 10.0 – 10.5%
NKT Cables
- Organic growth ~ neg. 5% Unchanged
- Operational EBITDA, %* 8 – 9% ~ 9.0%
NKT Photonics
- Organic growth ~ 10% Unchanged
- Operational EBITDA, % 12 - 14% Unchanged
Overall outlook 2016 maintained, underlying assumptions specified
* std. metal prices
Plan
ning
ass
umpt
ions

NKT I Interim report Q2 2016 I Webcast I 818 August 2016
138
143
144
146
151
156
158
171
174
190
191
175
176
169
8.4%
9.6% 9.4% 9.6% 9.3%
0%
2%
4%
6%
8%
10%
0
20
40
60
80
100
120
140
160
180
200
Oper. EBITDA, LTM Oper. EBITDA, LTM, std. metal prices, % Oper. EBITDA, LTM, %
2013 2014 2015 2016
Operational EBITDA impacted by lower revenue in NKT Cables
Operational EBITDA margin, LTM, decreased to 9.3% (Q1 2016: 9.6%)
This is compared with a strong Q2 2015 in NKT Cables where several projects were finalised
Operational EBITDA, LTM
EURm

NKT I Interim report Q2 2016 I Webcast I 918 August 2016
Changes Q2 2016 vs. Q2 2015
*01
*02
EURm 2016 2015 Change 2015
Revenue 553.2 600.4 -47.2 2,223.6 Revenue, std.metal prices 485.5 494.8 -9.3 1,869.2
Operational EBITDA 52.9 59.5 -6.6 175.2 Oper. EBITDA margin, std.metal prices 10.9% 12.0% -1.1% 9.4%
One-off´s -2.1 -4.6 2.5 -23.2 EBITDA 50.8 54.9 -4.1 152.0 Depreciation/Amortisation -20.5 -56.2 35.7 -76.9 Impairment - -41.0 41.0 -40.9 EBIT 30.3 -5.7 36.0 34.2 Financial items, net -2.9 -2.8 -0.1 -6.1 EBT 27.4 -8.5 35.9 28.1 Tax -7.2 -19.4 12.2 -26.9 Profit 20.2 -27.9 48.1 1.2
RoCE, LTM 9.3% 11.2% -1.9% 10.1%
CAPEX 17.9 14.7 3.2 70.1 PPE 7.5 7.9 -0.4 39.0 Intangible assets 10.4 6.8 3.6 31.0
Working capital 318.8 374.2 -55.4 269.2 NIBD 188.2 193.1 -4.9 88.9
EURm Revenue decreased by -47.2 Metal prices -37.9 FX changes -7.5 Acquisitions/divestments 20.9 -5% organic growth -22.7 - Nilfisk 3% - NKT Cables -13% - NKT Photonics 9%
-6.6 Nilfisk Margin 11.8% (Q2 2015: 11.4%) 3.6 NKT Cables Margin 10.8% (Q2 2015: 14.0%) -11.2 1.0
01
02EURm Operational EBITDA decreased by
NKT Photonics & Other

NKT I Interim report Q2 2016 I Webcast I 1018 August 2016
Agenda
Highlights Q2 2016
Business units• Nilfisk
• NKT Cables
• NKT Photonics
Questions & Answers
NKT I Interim report Q2 2016 I Webcast I 1118 August 2016
Nilfisk
NKT I Interim report Q2 2016 I Webcast I 1218 August 2016
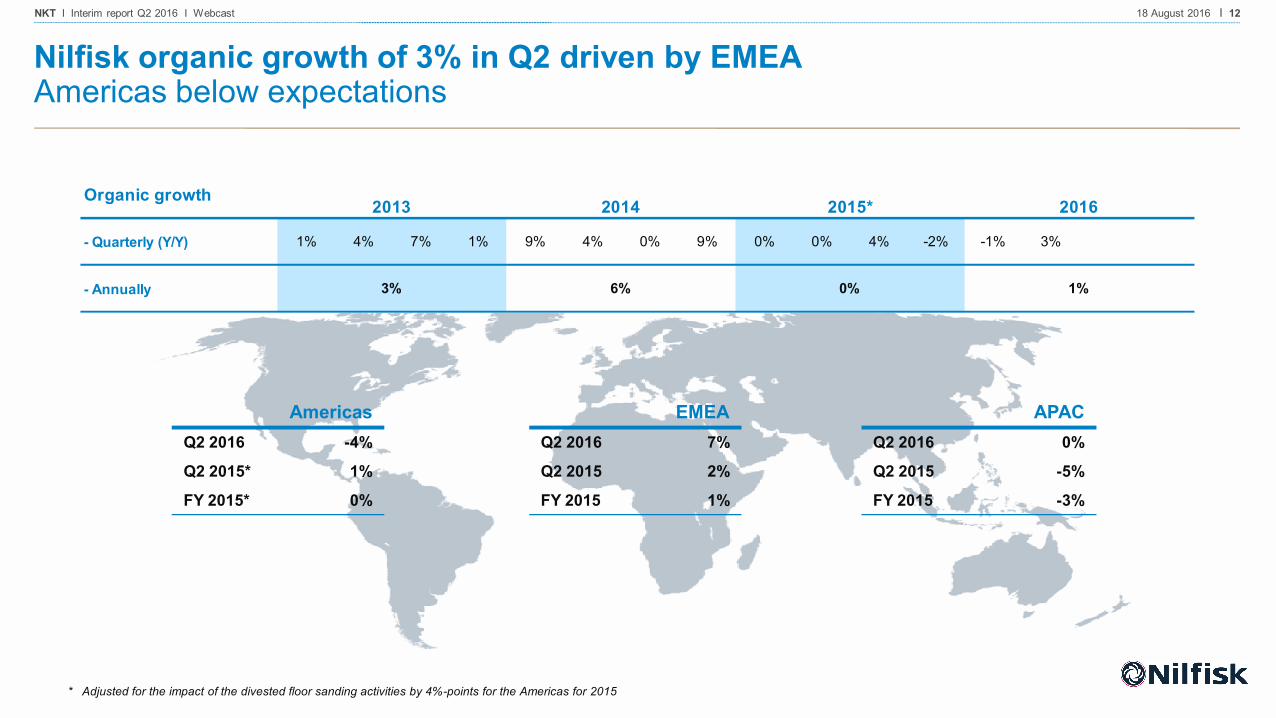
Nilfisk organic growth of 3% in Q2 driven by EMEAAmericas below expectations
AmericasQ2 2016 -4%
Q2 2015* 1%
FY 2015* 0%
EMEAQ2 2016 7%
Q2 2015 2%
FY 2015 1%
APACQ2 2016 0%
Q2 2015 -5%
FY 2015 -3%
* Adjusted for the impact of the divested floor sanding activities by 4%-points for the Americas for 2015
Organic growth
- Quarterly (Y/Y) 1% 4% 7% 1% 9% 4% 0% 9% 0% 0% 4% -2% -1% 3%
- Annually 3% 6% 0% 1%
2013 2014 2015* 2016
NKT I Interim report Q2 2016 I Webcast I 1318 August 2016
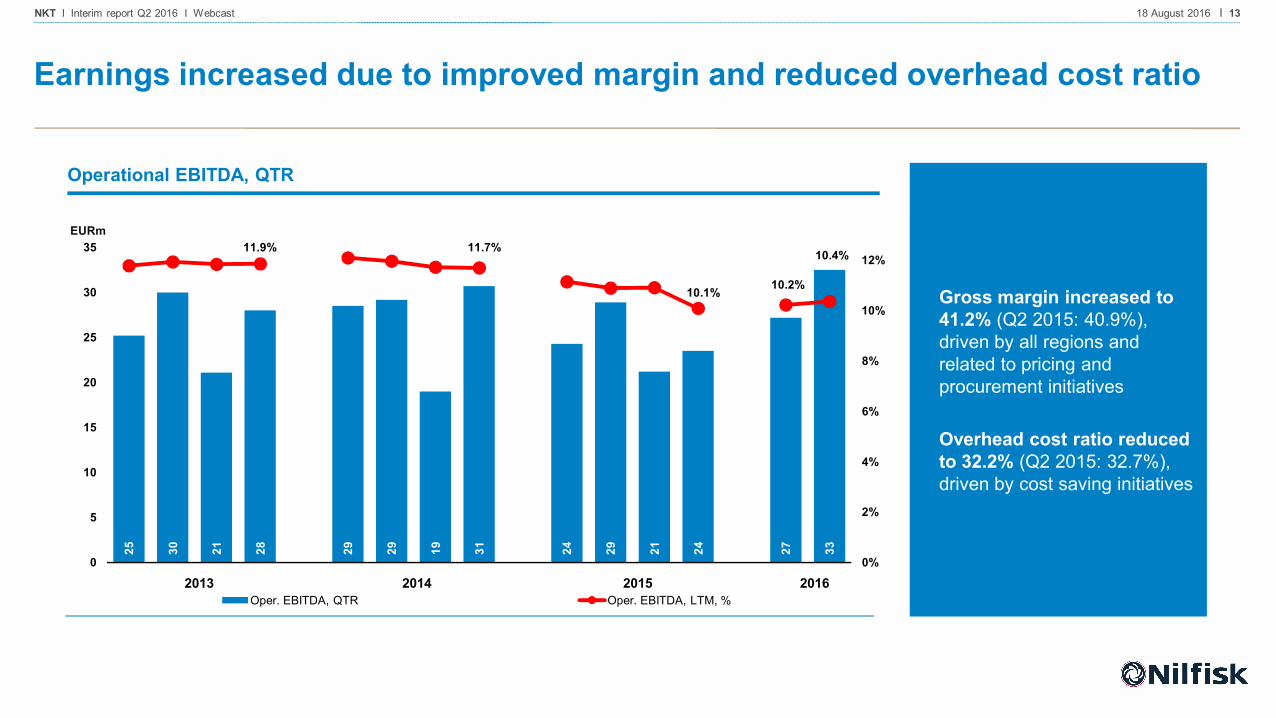
25 30 21 28 29 29 19 31 24 29 21 24 27 33
11.9% 11.7%
10.1% 10.2%
10.4%
0%
2%
4%
6%
8%
10%
12%
0
5
10
15
20
25
30
35
Oper. EBITDA, QTR Oper. EBITDA, LTM, %2013 2014 2015 2016
Earnings increased due to improved margin and reduced overhead cost ratio
Gross margin increased to 41.2% (Q2 2015: 40.9%), driven by all regions and related to pricing and procurement initiatives
Overhead cost ratio reduced to 32.2% (Q2 2015: 32.7%), driven by cost saving initiatives
Operational EBITDA, QTR
EURm
NKT I Interim report Q2 2016 I Webcast I 1418 August 2016
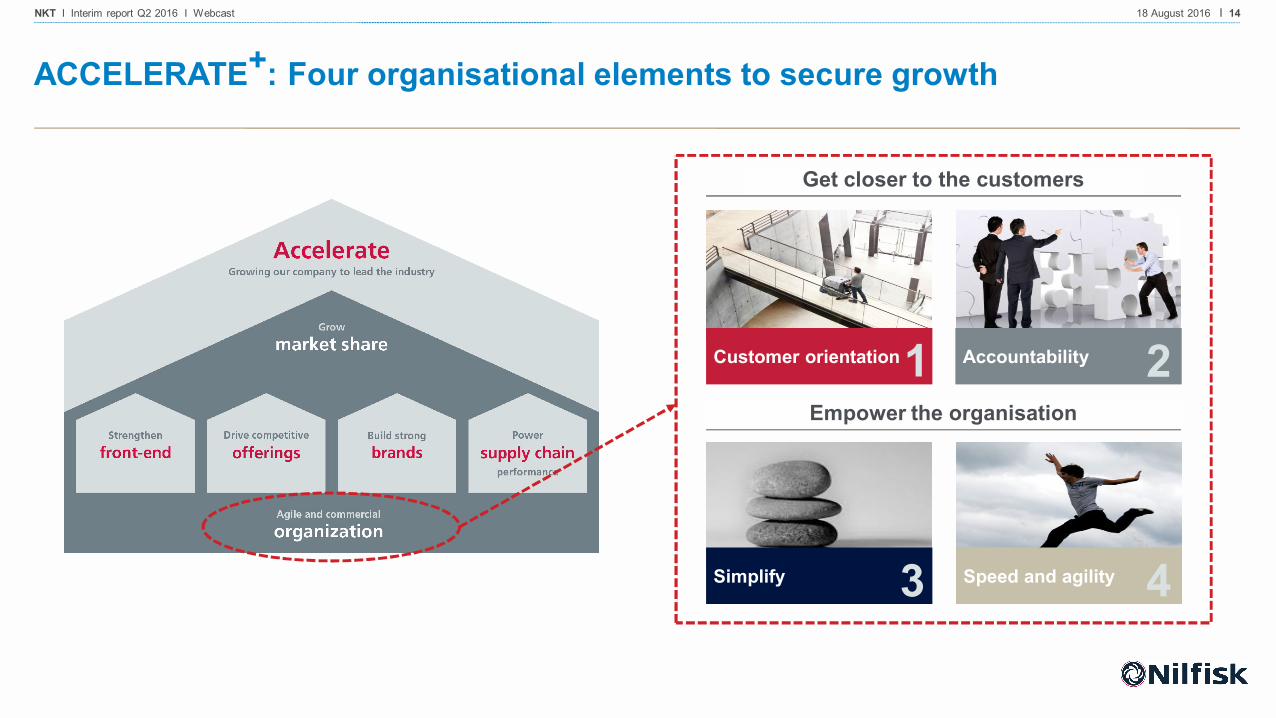
ACCELERATE+: Four organisational elements to secure growth
Get closer to the customers
Empower the organisation
Speed and agility
AccountabilityCustomer orientation
Simplify
1
3 4
2
NKT I Interim report Q2 2016 I Webcast I 1518 August 2016
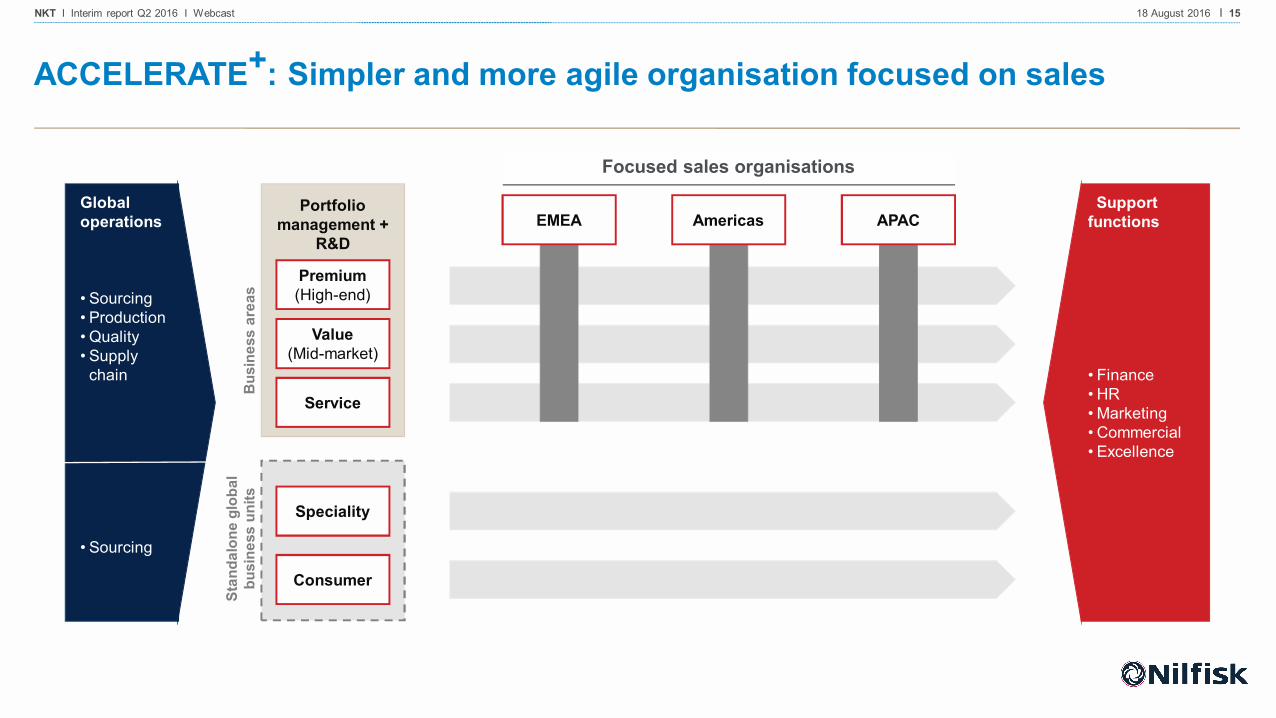
ACCELERATE+: Simpler and more agile organisation focused on sales
Globaloperations
• Sourcing• Production• Quality• Supply
chain
• Sourcing
Portfolio management +
R&D
Support functions
• Finance• HR• Marketing• Commercial• Excellence
Bus
ines
s ar
eas
Stan
dalo
ne g
loba
l bu
sine
ss u
nits
Premium(High-end)
Value(Mid-market)
Service
Speciality
Consumer
EMEA Americas APAC
Focused sales organisations

NKT I Interim report Q2 2016 I Webcast I 1618 August 2016
ACCELERATE+: Identified EUR 35m cost savings
Expected one-off costs for savings
Total by 2019
EUR 35m
Cost savings impact
Full EBITDA impact 2019
EUR 35m • Overhead reductions through
structural changes• Sourcing• Production footprint optimisation• Complexity reduction• Margin optimisation
• One-off costs to realise identified savings
Expected one-off costs for new organisational structure
Total by 2019
EUR 5m • One-off costs to implement new
organisational structure

NKT I Interim report Q2 2016 I Webcast I 1718 August 2016
New organisational structure and improved organic growth and earnings
Financials Highlights and summary
FYEURm 2016 2015 2016 2015 2015
Revenue 276.5 253.2 531.9 494.2 971.5 Organic growth 3% 0% 1% -1%* 0%*Gross margin 41.2% 40.9% 41.9% 41.3% 40.4%Overhead cost ratio 32.2% 32.7% 33.5% 33.2% 33.1%
Operational EBITDA 32.5 28.9 59.7 53.2 97.9 Operational EBITDA margin 11.8% 11.4% 11.2% 10.8% 10.1%
RoCE, LTM 12.7% 15.1% 12.7% 15.1% 12.9%
CAPEX 11.0 9.9 23.4 19.6 44.2 PPE 3.5 4.6 11.5 8.0 21.7 Intangible assets 7.5 5.3 11.9 11.6 22.5
Capital employed 545.4 515.1 545.4 515.1 501.6 Working capital 193.8 198.4 193.8 198.4 173.4
Full-time employees, end of period 5,673 5,409 5,673 5,409 5,545
Q2 1st half• Growth of 3% overall driven by strong increase in EMEA of
7% with Americas below expectations. Change in Americas management to improve performance
• Oper. EBITDA margin, LTM, improved driven by price increases and procurement initiatives improving gross margin and from overhead cost savings
* Adjusted for the impact of the divested floor sanding activities by 4%-points for the Americas for 2015

NKT I Interim report Q2 2016 I Webcast I 1818 August 2016
NKT Cables

NKT I Interim report Q2 2016 I Webcast I 1918 August 2016
Overall organic growth in line with expectationsProducts grew by 9% while Projects was impacted by current project portfolio
ProjectsQ2 2016 -43%
Q2 2015 72%
FY 2015 15%
Market
Offshore
Onshore
ProductsQ2 2016 9%
Q2 2015 0%
FY 2015 5%
Market
Nordics
Central Europe
Specialties
APACQ2 2016 -26%
Q2 2015 -40%
FY 2015 -37%
Market
Railway
Medium-/high-voltage
Organic growth
- Quarterly (Y/Y) 4% 10% -2% 4% 6% -11% 1% -12% 16% 13% -12% 2% -24% -13%
- Annually
2013 2014 2015 2016
4% -5% 4% -19%
NKT I Interim report Q2 2016 I Webcast I 2018 August 2016
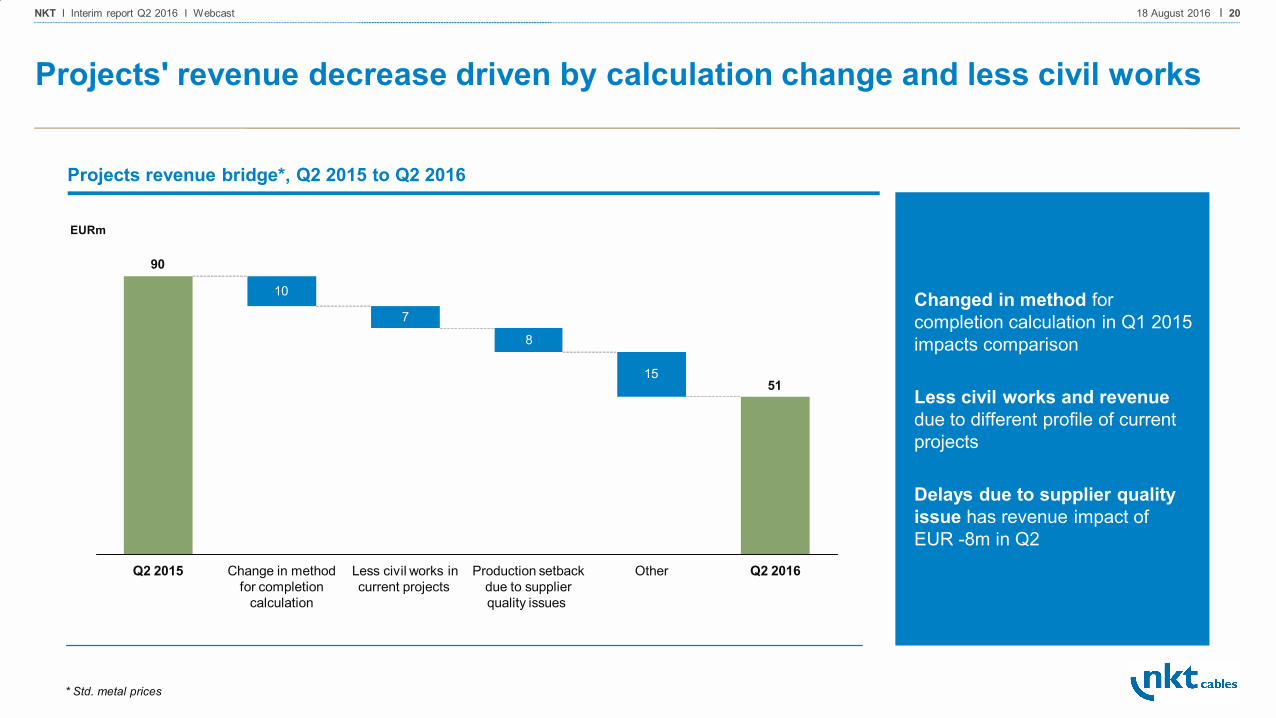
Projects' revenue decrease driven by calculation change and less civil works
* Std. metal prices
EURm
Projects revenue bridge*, Q2 2015 to Q2 2016
Changed in method for completion calculation in Q1 2015 impacts comparison
Less civil works and revenue due to different profile of current projects
Delays due to supplier quality issue has revenue impact of EUR -8m in Q2
10
7
8
1551
90
Production setback due to supplier quality issues
Change in method for completion
calculation
OtherLess civil works in current projects
Q2 2016Q2 2015
NKT I Interim report Q2 2016 I Webcast I 2118 August 2016
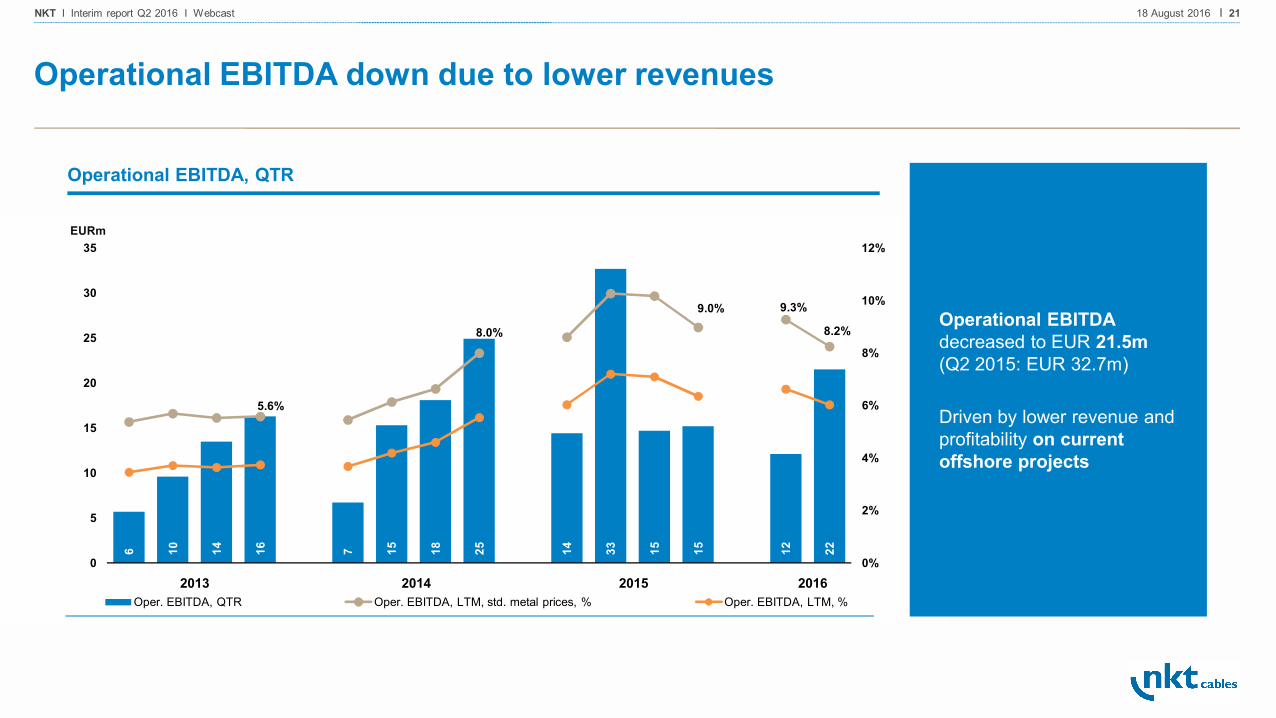
6 10 14 16 7 15 18 25 14 33 15 15 12 22
5.6%
8.0%
9.0% 9.3%
8.2%
0%
2%
4%
6%
8%
10%
12%
0
5
10
15
20
25
30
35
Oper. EBITDA, QTR Oper. EBITDA, LTM, std. metal prices, % Oper. EBITDA, LTM, %2013 2014 2015 2016
Operational EBITDA down due to lower revenues
Operational EBITDAdecreased to EUR 21.5m (Q2 2015: EUR 32.7m)
Driven by lower revenue and profitability on current offshore projects
Operational EBITDA, QTR
EURm
NKT I Interim report Q2 2016 I Webcast I 2218 August 2016
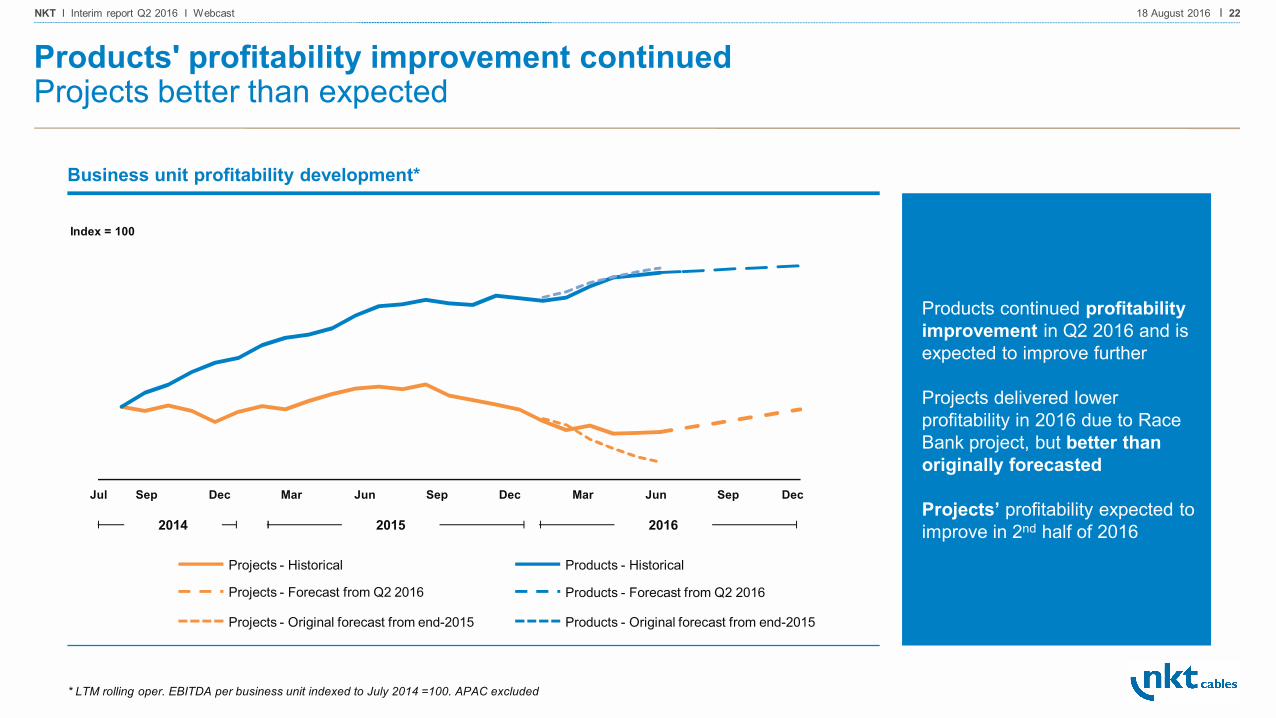
MarSep Sep MarJun Dec DecSepJunJul Dec
2014 2015 2016
Products continued profitability improvement in Q2 2016 and is expected to improve further
Projects delivered lower profitability in 2016 due to Race Bank project, but better than originally forecasted
Projects’ profitability expected to improve in 2nd half of 2016
Products - Forecast from Q2 2016
Products - HistoricalProjects - Historical
Business unit profitability development*
Index = 100
Products' profitability improvement continuedProjects better than expected
* LTM rolling oper. EBITDA per business unit indexed to July 2014 =100. APAC excluded
Products - Original forecast from end-2015 Projects - Original forecast from end-2015
Projects - Forecast from Q2 2016

NKT I Interim report Q2 2016 I Webcast I 2318 August 2016
Products business continued positive growth and earnings trend in Q2 2016
Financials Highlights and summary
FYEURm 2016 2015 2016 2015 2015
Revenue 267.8 338.7 490.8 647.9 1,211.9 Revenue, std.metal prices 200.1 233.1 363.4 449.8 857.5 Organic growth -13% 13% -19% 15% 4%
Operational EBITDA 21.5 32.7 33.6 47.1 77.0 Operational EBITDA margin, std.metal prices 10.8% 14.0% 9.3% 10.5% 9.0%
RoCE, LTM 6.1% 9.3% 6.1% 9.3% 8.2%
CAPEX 6.2 4.2 10.7 6.8 22.5 PPE 3.9 3.2 6.4 5.2 16.5 Intangible assets 2.3 1.0 4.3 1.6 6.0
Capital employed 404.1 463.6 404.1 463.6 381.3 Working capital 115.7 165.5 115.7 165.5 87.1
Full-time employees, end of period 3,148 3,212 3,148 3,212 3,208
Q2 1st half • Positive growth in Products, driven especially by Central Europe, but also Nordics and Specialities. Sustainable APAC setup to be defined by end 2016
• Negative growth as expected in Projects due to less civil works and a strong Q2 2015, which was impacted by a change in calculation method
• Profitability better than expected in Projects compared to initial end-2015 forecast
• New Group Management team complete with Frida Norrbom Sams as Head of Applications (from 1 June) and Dietmar Müller as Head of Operations (from 1 October)
• Execution of EXCELLENCE 2020 strategy progressed as planned

NKT I Interim report Q2 2016 I Webcast I 2418 August 2016
NKT Photonics

NKT I Interim report Q2 2016 I Webcast I 2518 August 2016
Satisfactory organic growth of 9% driven by Sensing & Energy
Focused growth area Established area New growth area
2015 revenue split
Imaging & Metrology Sensing & Energy Material Processing
Revenue split ~45% ~42% ~13%
• Existing Imaging & Metrology segment delivered moderate organic growth in Q2 2016
• Significant 18-month frame contract signed with large semiconductor customer
• Strong growth across existing segments, for example the structural monitoring project for the Gotthard Base Tunnel
• Many new growth segments, for example gasifiers and chemical storaging
• Very strong overall organic growth in 1st half 2016, despite slightly negative organic growth in Q2
• Deliveries continued in Q2 on major orders awarded in 2015 and Q1 2016

NKT I Interim report Q2 2016 I Webcast I 2618 August 2016
Integration of Fianium and Lios progressed as planned
Manufacturing sitesSales officesDistributors
Integration of Fianium, the recent UK-based acquisition within ultra-fast lasers, going well and synergies are realised as planned
Integration of Lios, the German-based entity within distributed temperature sensing, going better than expected with sales increasing significantly to existing as well as new segments
New
Note: Fianium acquisition date 31 March 2016

NKT I Interim report Q2 2016 I Webcast I 2718 August 2016
Satisfactory growth and integration proceeding as expected
Financials Highlights and summary
FYEURm 2016 2015 2016 2015 2015
Revenue 8.9 8.5 16.1 17.1 40.6 Organic growth 9% -14% 11% -9% 9%
Operational EBITDA -0.3 -1.0 -0.6 -1.0 3.7
Capital employed 44.6 22.2 44.6 22.2 19.2 Working capital 8.9 9.7 8.9 9.7 8.5
Full-time employees, end of period 237 207 237 207 180
Q2 1st half
1 1 2 1 1 1 1 3 3 2 4 4 4 5
2.3%
7.2%
9.6% 9.7%
11.5%
0%
2%
4%
6%
8%
10%
12%
14%
0
1
2
3
4
5
6
Oper. EBITDA, LTM Oper. EBITDA, LTM, %
2013 2014 2015 2016
• Good growth in all segments with Sensing showing strong growth
• Improved EBTIDA amounted to EUR -0.3m compared with EUR -1.0m in Q2 2015 driven by higher revenue
• Integration of Fianium and Lios companies going as planned, important steps to become leader within ultra-fast and supercontinuum fiber lasers and grow distributed temperature sensing business

NKT I Interim report Q2 2016 I Webcast I 2818 August 2016
Agenda
Highlights Q2 2016
Business units
• Nilfisk
• NKT Cables
• NKT Photonics
Questions & Answers
NKT I Interim report Q2 2016 I Webcast I 2918 August 2016
Financial calendar
201611 November Interim Report, Q3
20171 March 2016 Annual Report
For list of Investor Relations events, go to www.nkt.dk

NKT I Interim report Q2 2016 I Webcast I 3018 August 2016
Appendix
NKT I Interim report Q2 2016 I Webcast I 3118 August 2016
15.8%
20.2%
11.6%
10%
12%
14%
16%
18%
20%
22%
2013 2014 2015 2016
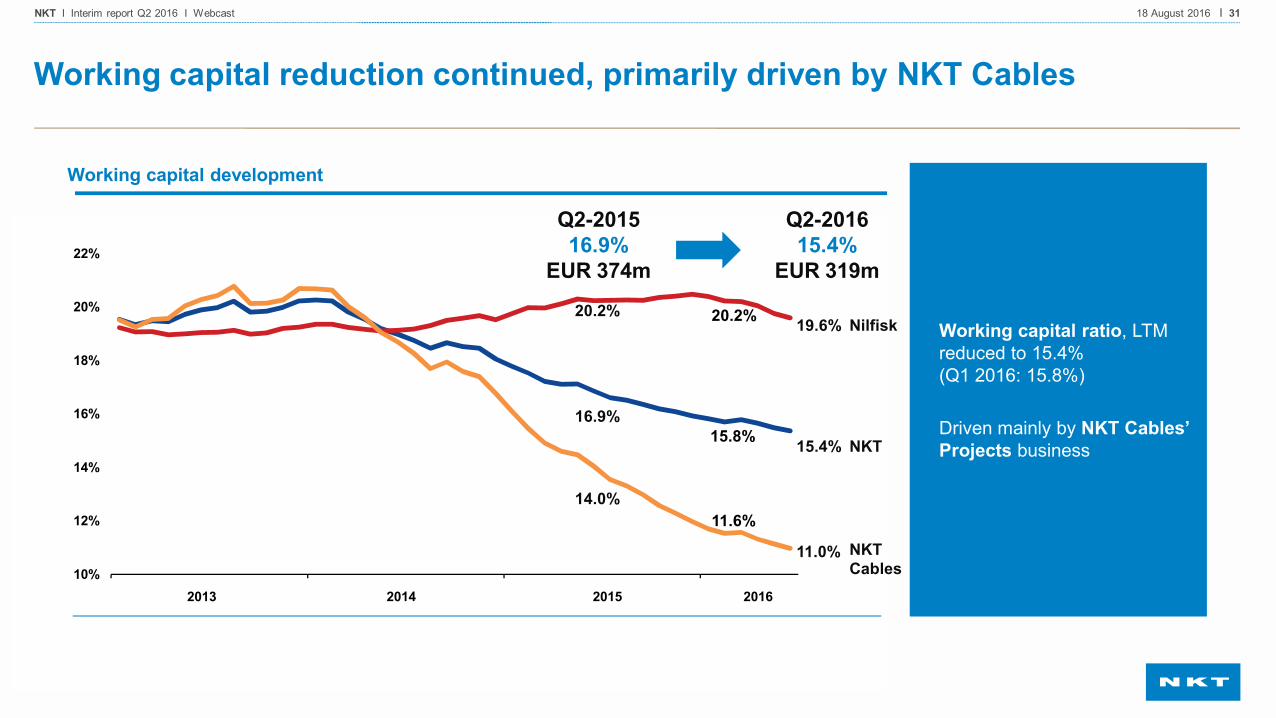
Working capital reduction continued, primarily driven by NKT Cables
Working capital development
Q2-201615.4%
EUR 319m
NKT
Nilfisk
NKT Cables
19.6%
15.4%
11.0%
20.2%
16.9%
14.0%
Q2-201516.9%
EUR 374m
Working capital ratio, LTM reduced to 15.4% (Q1 2016: 15.8%)
Driven mainly by NKT Cables’ Projects business

NKT I Interim report Q2 2016 I Webcast I 3218 August 2016
FYEURm 2016 2015 2015EBITDA 50.8 54.9 152.0 Financial items, net -2.9 -2.8 -6.1 Change in working capital -9.0 -37.9 41.7 Other -10.2 -9.0 -14.1 Cash flows from operating activities 28.7 5.2 173.2 Acquisition of business - -15.7 -29.1 Divestment of business - - 6.0 Acq./disp. of property, plant and equipment, net -6.6 -7.4 -35.1 Other investments, net -10.9 -6.7 -29.7 Cash flows from investing activities -17.5 -29.8 -87.9 Free cash flow 11.2 -24.6 85.3 Change in long- and short term loans 11.5 33.4 -79.3 Non-controlling interest -3.0 - Share buyback programme -20.1 - - Dividend paid -13.0 - -13.0 Cash from exercise of share-based options etc. - - 11.3 Cash flows from financing activities -24.6 33.4 -81.0 Net cash flow -13.4 8.8 4.3
Q2
Strong operating cash flow of EUR 28.7m
Operating cash flow of EUR 28.7m due to change in working capital of EUR -9.0m (Q2 2015 EUR 37.9m)
Cash flow from investing was EUR 0.0m due to no acquisitions in Q2 (Q2 2015 EUR -15.7m)
Share buyback programme and dividend payment impacted net cash flow

NKT I Interim report Q2 2016 I Webcast I 3318 August 2016
373
381
370
283
268
269
285
152
178
193
168
89 159
188
1.9x
0.9x
0.5x
0.9x
1.1x
0x
1x
2x
3x
0
50
100
150
200
250
300
350
400
450
Net interest-bearing debt Net interest-bearing debt relative to operational EBITDA, LTM
2013 2014 2015 2016
Net interest-bearing debt still low, impacted by share buyback programme
Positive free cash flow, offset by share buyback programme (EUR 20.1m) and dividend payment (EUR 13.0m)
Net interest-bearing debt
EURm Q1-20160.9x
EUR 159m
Q2-20161.1x
EUR 188m