interim report q3 /15 - kuka
TRANSCRIPT

Q3 /15InterIm report

2
Q39M /15 AND Q3 /15 DEVELOPMENTS
�ORDERS RECEIVED RISE BY 22.6 pERcEnt tO A tOtAL OF € 2,134.8 mILLIOn (9m /15); SWISSLOG REcEIVES ORDERS OF € 360.6 mILLIOn
· Stronger growth in Q3 /15: +25.0 percent to € 694.9 million
�SALES REVENUES Up 45.9 pERcEnt tO € 2,199.4 mILLIOn In FIRSt nInE mOntHS OF 2015; EXcLUDInG SWISSLOG, tHE IncREASE WAS 14.8 pERcEnt
�EBITDA GroWS From € 129.2 mIllIon In FIrSt nIne montHS oF 2014 to € 199.3 mIllIon In tHe SAme perIoD oF 2015
�EBIT mARGIn BEFORE pURcHASE pRIcE ALLOcAtIOn REAcHES 6,9 pERcEnt In FIRSt nInE mOntHS OF 2015 AFtER 6.5 pERcEnt In FIRSt nInE mOntHS OF 2014
· Incl. purchase price allocation eBIt margin was 4.8 percent in first nine months of 2015
· Systems has an operative eBIt margin of 7.1 percent in Q3 /15
EARNINGS AFTER TAXES OF € 63.4 mILLIOn In FIRSt nInE mOntHS OF 2015 AFtER € 45.1 mILLIOn In FIRSt nInE mOntHS OF 2014
2015 GUIDANCE cOnFIRmED: SALES REVEnUES AppROX. € 2.9 BILLIOn AnD EBIt mARGIn 6.5 – 7.0 pERcEnt BEFORE pURcHASE pRIcE ALLOcAtIOn
KR AGILUS LBR IIWA / KMR
2011 2014 KR QUAntec
2009

3
Development Q3 /15Key Figures
KEY FIGURES
in € millions Group 9m /14
Group 9M /15
Change Swisslog 9M /15
Group excl. Swisslog
9M /15
Change
orders received 1,741.7 2,134.8 22.6% 360.6 1,774.2 1.9%
order backlog (09 /30) 1,286.1 1,727.4 34.3% 454.7 1,272.7 -1.0%
Sales revenues 1,507.9 2,199.4 45.9% 468.6 1,730.8 14.8%
Gross profit 365.0 517.6 41.8% 69.6 448.0 22.7%
in % of sales revenues 24.2% 23.5% – 14.9% 25.9% –
earnings before interest and taxes (eBIt) 98.1 105.9 8.0% -34.8 140.7 43.4%
in % of sales revenues 6.5% 4.8% – -7.4% 8.1% –
earnings before interest, taxes, depreciation and amortization (eBItDA) 129.2 199.3 54.3% 20.2 179.1 38.6%
in % of sales revenues 8.6% 9.1% – 4.3% 10.3% –
earnings after taxes 45.1 63.4 40.6% -31.6 95.0 110.6%
earnings per share in € (undiluted) 1.33 1.79 34.6% – – –
earnings per share in € (diluted) 1.28 1.70 32.8% – – –
Capital expenditure 46.9 67.7 44.3% 17.2 50.5 7.7%
equity ratio in % (09 /30) 27.6% 29.3% – – – –
net debt /liquidity (09 /30) 182.4 16.6 -90.9% 34.8 -18.2 -110.0%
employees (09 /30) 9,588 12,071 25.9% 2,543 9,528 -0.6%
in € millions Group Q3 /14
Group Q3 /15
Change Swisslog Q3 /15
Group excl. Swisslog
Q3 /15
Change
orders received 556.0 694.9 25.0% 127.3 567.6 2.1%
order backlog (09 /30) 1,286.1 1,727.4 34.3% 454.7 1,272.7 -1.0%
Sales revenues 539.3 722.0 33.9% 154.3 567.7 5.3%
Gross profit 131.8 173.3 31.5% 26.3 147.0 11.5%
in % of sales revenues 24.4% 24.0% – 17.0% 25.9% –
earnings before interest and taxes (eBIt) 36.8 37.5 1.9% -6.2 43.7 18.8%
in % of sales revenues 6.8% 5.2% – -4.0% 7.7% –
earnings before interest, taxes, depreciation and amortization (eBItDA) 47.2 66.4 40.7% 8.9 57.5 21.8%
in % of sales revenues 8.8% 9.2% – 5.8% 10.1% –
earnings after taxes 22.6 21.9 -3.1% -8.5 30.4 34.5%
earnings per share in € (undiluted) 0.67 0.60 -10.4% – – –
earnings per share in € (diluted) 0.63 0.57 – – – –
Capital expenditure 19.7 22.8 15.7% 9.0 13.8 -29.9%

4
KUKA AktiengesellschaftInterim report Q3 /2015
DEAr ShArEholDErS,
KUKA can look back on a good third quarter of 2015 and thus on profitable overall growth for the year so far.
the first nine months of this year have been characterized by positive sales development. KUKA generated revenues of € 2,199.4 million. Compared with the figure of € 1,507.9 million for the previous year, this represents an increase of 45.9 per-cent. Swisslog contributed € 468.6 million to this result. even excluding Swisslog, we achieved organic sales growth of 14.8 percent. the eBIt margin for the first nine months of 2015 was 7.0 percent.
All divisions contributed to this positive result. In this quarter, once again, we were particularly pleased to receive major orders from both general industry and the automotive sector. Swisslog, for example, was able to win a large-scale contract from the Saudi food manufacturer Almarai for the automation of its distribution logistics. In the automotive sector, we received an order from BmW for 1,000 robots.
one new KUKA product caused a sensation in Asia. the new Kr CYteC nano series from KUKA celebrated its world premiere at the “robotics Show” held during the 17th China International Industrial Fair (CIIF) in Shanghai. With this new product, we are specifically responding to the demand from our customers in the world’s largest automation market – China – for a robot for welding and handling tasks in the low payload range.
We are also continuing to work on solutions for the factory of the future and holding discussions with the worlds of science and politics on how Germany as a business location can benefit from the technological competence of small and mid-sized enterprises for these developments. Above all, this involves the framework and prerequisites that need to be created for digitally networked production in order to keep Germany at the forefront of technology. In this respect, KUKA sees itself as a driving force behind this development, and aims to coordinate efforts with politics and science to form a partnership respon-sible for shaping “Industry 4.0”.
At IroS (the International Conference on Intelligent robots and Systems) in Hamburg, one of the largest international research conferences, KUKA presented its ideas for the factory of the future centered on the lBr iiwa sensitive lightweight robot. With this approach, we are combining the creativity and cognitive abilities of humans with the repeatability, strength and precision of robots. other key issues are mobility and the flexible deployment of robots. this is because the requirements on production are becoming greater with increasing product variety and ever-decreasing production runs. to achieve this, versatile production systems are necessary as well as continuous communication between the systems involved – which then organize themselves based on the data exchanged.
It is very important for us to facilitate our innovative strength, which is why, some time ago, we invested in a technology and Development Center at our headquarters in Augsburg. I am pleased to announce that we will be able to move in at the end of this year. Short distances between colleagues from the Development, Service and Sales departments will enhance the cooperation, creativity and innovative spirit of our staff.
they are the basis for our future and I have every confidence in the KUKA team. I would like to take this opportunity to thank them for their team spirit and motivation.
In light of the positive development in the first nine months of 2015, we are able to confirm our guidance targets for the cur-rent financial year. We are expecting sales revenues of € 2.9 billion and an eBIt margin of 6.5 to 7.0 percent.
Yours,
till reuter
FOREwORD

5
KUKA AND THE CAPITAL MARKET
140
130
120
110
100
90
KUKA’S SHARE PRICE PERFORMANCE JANUARY 1 TO SEPTEMBER 30, 2015 *
* December 30, 2014 = 100 share price performance indexed, prices: XetrA
KUKA mDAX
Jan Feb mar Apr may Jun Jul Aug Sep
performance on the German equities markets varied during the first nine
months of the 2015 financial year. the DAX index fell by 1.5 percent to
9,660 points. Concerns about possible weaker economic growth in China
depressed stock market sentiment throughout the world. However investors
continued to take the view that the prospects for medium sized companies
were positive such that the mDAX was able to increase during the first nine
months, showing a rise of 13.9 percent as at September 30.
Agreement among eU finance ministers regarding the third aid program
for Greece along with robust economic data in the eurozone and the USA
initially brought about a recovery on stock markets at the beginning of
Q3 /15. Subsequently, weak economic data from China in mid-August, the
postponement of an interest rate turnaround in the USA and finally the
Volkswagen emissions scandal caused prices to fall on the stock markets.
the DAX declined by 11.7 percent in the third quarter to 9,660 points and
the mDAX by 1.7 percent to 19,622 points.
KUKA’s share price rose sharply by 16.1 percent in the first nine months.
However the price fell by 8.3 percent in the last quarter. the KUKA share
started the third quarter at the Xetra closing price of € 74.72 as at the end
of June. the positive environment for shares at the beginning of the quarter
and KUKA’s improved forecast for the 2015 financial year then generated
an all-time high share price of € 82.06. towards the end of the quarter, like
other machinery manufacturers, the share lost its price gains and closed
at € 68.49 on September 30, 2015.
INVESTorS holDING 3 pErcENT or MorE oF ThE KUKA’S ShArE cApITAl
the free float of KUKA’s shares at the end of the third quarter of 2015 was
56.5 percent of the total share capital. the investors were: Voith Group
with 25.1 percent, SWoCtem GmbH with 10.0 percent, midea Group with
5.4 percent and Schroders Group with 3.0 percent.
ForewordKUKA and the capital market
0,9
1,0
1,1
1,2
1,3
1,4
0,9
1,0
1,1
1,2
1,3
1,4

6
KUKA AktiengesellschaftInterim report Q3 /2015
DemAnD For CArS
rise in car sales – best September for 15 years in the USA and further growth in chinaAccording to the German Association of the Automotive Industry (VDA), the
3 biggest markets for car sales – Western europe, China and the USA – are
on course for growth and have all risen considerably since the beginning
of 2015. the Western european market continued to recover and saw an
8.7 percent increase in sales to 10.4 million new vehicles. the German
market has the highest volume of car sales in europe in absolute terms.
During the first nine months of 2015 the market grew by 5.5 percent to
2.4 million cars sold.
In China, new car sales in the first nine months of 2015 amounted to
13.7 million vehicles, thereby exceeding the previous year’s figure by almost
5 percent. According to the VDA, competition is in fact intensifying. However
the potential in China is still very high: for every 1,000 inhabitants in China
there are only approximately 61 vehicles at present, whereas the equivalent
figure in Germany is 540 vehicles per 1,000 inhabitants.
the US market for light vehicles (cars and light trucks), which is an impor-
tant market for KUKA’s customers, had an excellent performance up to
September 2015. overall sales in the first nine months of 2015 rose by a
good 5 percent to almost 13 million vehicles.
EcoNoMIc ENVIroNMENT
ImF reDUCeS oUtlooK
the International monetary Fund (ImF) reduced its outlook for 2015 and
2016. Compared with expectations in July 2015, the ImF is now forecast-
ing global economic growth of 3.1 percent for 2015 and 3.6 percent for
2016 compared with its previous figures of 3.3 percent and 3.8 percent
respectively. one of the main reasons for the revised forecast is the lower
oil price, which is likely to have a negative influence on growth in some
emerging economies. Countries such as Germany benefit from the price
decline but on a worldwide scale there are many losers. emerging econo-
mies are therefore collectively expected to grow by only 4 percent compared
with 4.6 percent in the previous year. these countries, which account for
the lion’s share of worldwide growth and are responsible for more than
half the global economic output, are primarily decisive for the diminished
outlook as they are predominantly exporters of oil. In the eurozone, KUKA’s
most important regional market, there are renewed signs of growth, albeit
moderate. the lower price of oil, the expansive monetary policy operated by
the european Central Bank and the depreciation of the euro compared with
other currencies such as the US dollar helped this development. the ImF
experts anticipate strongly positive performance in the USA with, however,
slightly reduced expectations for 2016. Weak productivity values, amongst
other factors, indicate a lack of investments, which may in the long term be
associated with risks. For China, the world’s second largest economy, the
ImF maintains its prediction of 6.8 percent growth in 2015 and 6.3 percent
in the following year. Stronger private consumption and a concentration on
services are able to offset structural problems to a certain extent.
mrCONSOLIDATED MANAGEMENT REPORT

7
Consolidated management report
BUSINESS pErForMANcE
orDerS reCeIVeD
KUKA GroupKUKA Group won a large volume of new orders over the past quarter. With
orders received totaling almost € 700 million, the quarterly figure was once
again high and benefited from the sales of the newly-consolidated Swisslog.
excluding Swisslog, the value of orders received was 2.1 percent above the
figure of € 556.0 million for the previous year’s quarter. the strong demand
was supported by both the automotive and the general industry customer
segments. the overall volume of orders received in KUKA Group over the
past quarter totaled € 694.9 million, a rise of 25.0 percent.
In the first nine months of 2015, new orders reached a value of € 2,134.8 mil-
lion or € 1,774.2 million excluding Swisslog. In comparison with the figure
of € 1,741.7 million for the first nine months of 2014, this represents an
increase of 22.6 percent (1.9 percent excluding Swisslog).
KUKA roboticsthe robotics division generated a high level of orders received in the third
quarter of 2015, significantly above the € 200 million threshold. over the
past quarter, robotics sold robots and services with a total volume of
€ 222.4 million. Compared with the previous year’s quarter, new orders
therefore increased by 20.2 percent.
this increase was attributable to all segments – automotive, general indus-
try and service. In terms of countries, China, the USA and Germany showed
a particularly strong development. Comparing the performance in the first
three quarters, orders received rose by 9.3 percent from € 628.2 million
(9m /14) to € 686.5 million (9m /15).
orders received in the general industry segment for the past quarter again
exceeded orders in the automotive segment. Customers in the general
industry segment placed new orders totaling € 89.8 million during the third
quarter of 2015, accounting for a share of 40.4 percent. In a year-on-year
comparison with the third quarter of 2014, the increase was 17.2 percent.
the rise reflects the successful restructuring of the sales organization and
the strategic focus on this customer segment. the automotive segment
generated new orders of € 87.5 million in the past quarter, accounting for
39.3 percent of the total orders received. All three German manufactur-
ers and also several Chinese automakers placed orders with the robotics
division. Compared with the same period of the previous year, there was a
decline of 25.4 percent (Q3 /14: € 69.8 million) for reasons related to projects
and model cycles. performance in the service business remained dynamic
over the past quarter and continued to benefit from the rising number of
KUKA robots installed throughout the world. orders received amounting to
€ 45.1 million exceeded the previous year’s quarterly figure by 16.5 percent
(Q3 /14: € 38.7 million). Service business therefore accounted for 20.3 per-
cent of the robotics division’s total orders received.
KUKA SystemsIn the third quarter of 2015 the Systems division received new orders
amounting to € 355.1 million. this represented a decline of 6.0 percent in
comparison with the same period last year (Q3 /14: € 377.8 million). the
reasons for the decline were the more difficult market conditions on the
european car market for Systems and the fact that the aircraft construction
segment had received large one-off orders in the previous year, which make
it hard to compare quarters. the automotive business in north America
continued its highly dynamic performance.
In the first three quarters of 2015 Systems booked new orders worth
€ 1,114.0 million (9m /14: € 1,137.7 million).
roBoTIcS orDErS rEcEIVED BY SEGMENT In % oF totAl
Service 20.9%
General Industry 41.4%
Automotive 37.7%
Q3 /14
Service 20.3%
General Industry 40.4%
Automotive 39.3%
Q3 /15
CONSOLIDATED MANAGEMENT REPORT

8
KUKA AktiengesellschaftInterim report Q3 /2015
KUKA Systemsthe Systems division generated sales revenues of € 367.3 million in the third
quarter of 2015, 13.2 percent up on the previous year (Q3 /14: € 324.5 mil-
lion). Systems benefited from the high levels of orders received in previous
quarters and was accordingly able to achieve very high capacity utilization.
the body-in-white and aerospace segments recorded significant growth in
sales revenues. In terms of regions, performance was particularly strong in
the USA but considerable increases were also registered in europe.
In the first nine months of 2015, sales revenues totaled € 1,099.5 million
compared with € 903.3 million in the previous year. this represented a rise
of 21.7 percent.
Swisslogthe Swisslog division achieved sales revenues of € 154.3 million in the third
quarter of 2015, which gave a total of € 468.6 million when added to the
result of the first half of 2015. Swisslog was not consolidated in the previ-
ous year.
BooK-to-BIll rAtIo AnD orDer BACKloG
KUKA Groupthe book-to-bill ratio, i. e. orders received in relation to sales revenues,
amounted to 0.96 in the third quarter of 2015 (Q3 /14: 1.03) and 0.97 in
the first three quarters of 2015 (9m /14: 1.16). the strong growth in sales
revenues over the past months, which led to a record sales figure in the
first nine months of 2015, exceeded the orders received. this is why the
book-to-bill ratio is below 1.
0 500 1000 1500 2000 2500
9m /14
9M /15
Q3 /14
Q3 /15
SAlES rEVENUESIn € mIllIonS
robotics Systems Swisslog* incl. Consolidation
620.3
659.4
222.4
207.4
324.5
367.3 154.3
1,099.5 468.6
903.3
1,507.9 *
539.3 *
722.0 *
2,199.4 *
Swisslogorders received at the Swisslog division amounted to € 127.3 million in the
third quarter of 2015 and to € 360.6 million in the first nine months of 2015.
Swisslog was not consolidated in the previous year.
SAleS reVenUeS
KUKA GroupKUKA Group’s consolidated sales revenues in the third quarter of 2015
totaled € 722.0 million. the new Swisslog division contributed € 154.3 mil-
lion to the consolidated figure. total sales revenues were 33.9 percent higher
than in the third quarter of 2014. Adjusted for Swisslog revenues, there was
a rise in sales revenues of 5.3 percent compared with the previous year.
In the first three quarters of 2015, cumulative sales revenues totaled
€ 2,199.4 million (€ 1,730.8 million excluding Swisslog). Compared with
the same period in 2014 (9m /14: € 1,507.9 million) growth amounted to
45.9 percent (14.8 percent excluding Swisslog).
KUKA roboticsIn the third quarter of 2015 the robotics division reported sales of
€ 207.4 million. Compared with the figure for the third quarter of 2014
(Q3 /14: € 222.4 million) there was a decrease of 6.7 percent. the main
cause of the negative performance was the automotive segment where as
a result of the recall policy of automobile manufacturers in 2015, it is the
first and the last quarters which are likely to be stronger. Conversely the
two other customer segments – general industry and service – grew over
the past quarter compared with the previous year.
In the first three quarters of 2015, sales revenues at robotics totaled
€ 659.4 million, a record result over a nine-month period. Compared with
the previous year’s figure there was a rise of 6.3 percent (9m /14: € 620.3 mil-
lion).
0 500 1000 1500 2000 2500
9m /14
9M /15
Q3 /14
Q3 /15
orDErS rEcEIVEDIn € mIllIonS
robotics Systems Swisslog* incl. Consolidation
628.2
686.5
185.1
222.4
377.8
355.1 127.3
1,114.0 360.6
1,137.7
1,741.7 *
556.0 *
694.9 *
2,134.8 *

9
Consolidated management report
eBIt
KUKA GroupIn the third quarter of 2015, KUKA Group achieved earnings before interest
and taxes (eBIt) of € 37.5 million, which was 1.9 percent above the figure
for the same quarter of the previous year (Q3 /14: € 36.8 million). purchase
price allocation costs for Swisslog of € 11,8 million are included in this result.
Without this amortization, eBIt amounted to € 49.3 million. At Group level
this represents an eBIt margin of 5.2 percent with the purchase price alloca-
tion effect or 6.8 percent without the purchase price allocation effect. the
eBIt margin was 6.8 percent in the previous year’s quarter. on the whole,
the relatively high capacity utilization in the operating divisions and scal-
ing effects more than compensated for the additional costs of integrating
Swisslog and the investments for the new product lifecycle management
(plm) system and the new erp system.
Comparing the nine-month periods, eBIt before purchase price allocation
grew 8.0 percent from € 98.1 million (9m /14) to € 105.9 million (9m /15).
the eBIt margin amounted to 6.5 percent in the first three quarters of 2014
and to 4.8 percent in the same period of 2015 including the purchase price
allocation effect and 6,9 percent excluding this effect.
roboticsDuring the past quarter, the robotics eBIt decreased 11.6 percent from
€ 25.9 million (Q3 /14) to € 22.9 million (Q3 /15). this had been expected
on account of the lower sales due to seasonal effects in the automotive
segment and the substantial high-margin sales in the general industry seg-
ment in the previous year’s quarter. Conversely the increased proportion
of sales revenues from general industry and from the service segment had
a highly positive effect on the profitability in this division. over the past
quarter these two segments accounted for almost 70 percent of sales rev-
enues. In addition the division benefited from the success of the efficiency
program. the eBIt margin for the past quarter was 11.0 percent (Q3 /14:
11.6 percent).
0 20 40 60 80 100 120
9m /14
9M /15
Q3 /14
Q3 /15
EBITIn € mIllIonS
98.1
36.8
37.5
105.9
the Group order backlog was again higher and including Swisslog amounted
to € 1,727.4 million as at September 30, 2015. the figure therefore surpassed
the previous year’s level by 34.3 percent (September 30, 2014: € 1,286.1 mil-
lion). Compared with the figure for the previous quarter, there was a slight
decrease of 3.3 percent (June 30, 2015: € 1,786.3 million). the newly-con-
solidated Swisslog division had an order backlog of € 454.7 million as at
September 30, 2015.
KUKA roboticsIn the past quarter the robotics division recorded a book-to-bill ratio of
1.07, considerably higher than the Q3 /14 figure of 0.83. In the first three
quarters of 2015 the ratio was 1.04 (9m /14: 1.01).
As at September 30, 2015 the division’s order backlog totaled € 279.8 million
excluding the framework contracts received particularly in the automotive
segment. Compared with the reference value for the previous year, perfor-
mance was almost unchanged (Q3 /14: € 284.2 million) while showing a slight
increase in comparison to the previous quarter (Q2 /15: € 267.0 million).
KUKA SystemsSystems’ book-to-bill ratio in the third quarter of 2015 was 0.97. this was
a decline from the previous year’s figure (Q3 /14: 1.16). In the first nine
months of 2015 the average figure was 1.01 (9m /14: 1.26).
Systems’ order backlog as at September 30, 2015 was reported at
€ 1,002.7 million, which was 1.1 percent below the previous year’s quarter
(September 30, 2014: € 1,013.9 million) and 4.5 percent below the previous
quarter (June 30, 2015: € 1,049.6 million).
SwisslogIn the third quarter of 2015 the Swisslog division recorded a book-to-bill ratio
of 0.83 and the order backlog as at September 30, 2015 was € 454.7 million.
the order backlog in the previous quarter was € 477.5 million. Swisslog was
not consolidated in the previous year.0 500 1000 1500 2000
09 /30 /2014
09 /30 /2015
orDEr BAcKloGIn € mIllIonS
1,286.1 *
1,727.4 *
279.8 1,002.7 454.7
284.2 1,013.9
robotics Systems Swisslog* incl. Consolidation

10
KUKA AktiengesellschaftInterim report Q3 /2015
in € millions Q3 /14 Q3 /15 Change
orders received 185.1 222.4 20.2%
order backlog (09 /30) 284.2 279.8 -1.5%
Sales revenues 222.4 207.4 -6.7%
Gross profit 79.3 82.6 4.2%
in % of sales revenues 35.7% 39.8% –
earnings before interest and taxes (eBIt) 25.9 22.9 -11.6%
in % of sales revenues 11.6% 11.0% –
earnings before interest, taxes, depreciation and amortization (eBItDA) 31.3 28.5 -8.9%
in % of sales revenues 14.1% 13.7% –
KeY FIGUreS – SYStemS
in € millions 9m /14 9M /15 Change
orders received 1,137.7 1,114.0 -2.1%
order backlog (09 /30) 1,013.9 1,002.7 -1.1%
Sales revenues 903.3 1,099.5 21.7%
Gross profit 142.4 193.5 35.9%
in % of sales revenues 15.8% 17.6% –
earnings before interest and taxes (eBIt) 49.8 89.8 80.3%
in % of sales revenues 5.5% 8.2% –
earnings before interest, taxes, depreciation and amortization (eBItDA) 62.1 106.5 71.5%
in % of sales revenues 6.9% 9.7% –
employees (09 /30) 5,738 5,126 -10.7%
in € millions Q3 /14 Q3 /15 Change
orders received 377.8 355.1 -6.0%
order backlog (09 /30) 1,013.9 1,002.7 -1.1%
Sales revenues 324.5 367.3 13.2%
Gross profit 51.7 65.2 26.1%
in % of sales revenues 15.9% 17.8% –
earnings before interest and taxes (eBIt) 21.8 29.5 35.3%
in % of sales revenues 6.7% 8.0% –
earnings before interest, taxes, depreciation and amortization (eBItDA) 25.8 36.6 41.9%
in % of sales revenues 8.0% 10.0% –
the eBIt at robotics in the first nine months of 2015 amounted to € 72.8 mil-
lion (9m /14: € 66.9 million) and the eBIt margin to 11.0 percent (9m /14:
10.8 percent).
Systemsthe Systems division achieved an eBIt of € 29.5 million in the third quarter
of 2015, which was 35.3 percent higher than the previous year (Q3 /14:
€ 21.8 million). Here Systems benefited from the sale of the tools and dies
business unit. the eBIt margin therefore improved considerably from 6.7 per-
cent in Q3 /14 to 8.0 percent (with the one-off effect from the sale of the
tools and dies business). once again, Systems was thus able to achieve
a very high operating profit over the past quarter. the improved margin
arose from the good price quality of the order backlog and the success of
the efficiency program.
on the whole Systems generated an eBIt of € 89.8 million in the first nine
months of 2015 (9m /14: € 49.8 million). the eBIt margin was up correspond-
ingly to 8.2 percent (9m /14: 5.5 percent).
SwisslogIn the third quarter of 2015 the Swisslog division achieved an eBIt of
€ -6.2 million (9m /15: € -34.8 million) and an eBIt margin of -4.0 percent
(9m /15: -7.4 percent). Disregarding the amortization of the purchase price
allocation the eBIt was € 5,6 million (9m /15: € 11,5 million) and the opera-
tive eBIt margin was 3,6 percent (9m /15: 2.5 percent). Swisslog had not
yet been consolidated in the same quarter of the previous year.
pErForMANcE oF ThE DIVISIoNS
KeY FIGUreS – roBotICS
in € millions 9m /14 9M /15 Change
orders received 628.2 686.5 9.3%
order backlog (09 /30) 284.2 279.8 -1.5%
Sales revenues 620.3 659.4 6.3%
Gross profit 221.4 254.8 15.1%
in % of sales revenues 35.7% 38.6% –
earnings before interest and taxes (eBIt) 66.9 72.8 8.8%
in % of sales revenues 10.8% 11.0% –
earnings before interest, taxes, depreciation and amortization (eBItDA) 83.2 91.5 10.0%
in % of sales revenues 13.4% 13.9% –
employees (09 /30) 3,579 4,055 13.3%

11
Consolidated management report
KeY FIGUreS – SWISSloG
in € millions 9M /15
orders received 360.6
order backlog (09 /30) 454.7
Sales revenues 468.6
Gross profit 69.6
in % of sales revenues 14.9%
earnings before interest and taxes (eBIt) -34.8
in % of sales revenues -7.4%
earnings before interest, taxes, depreciation and amortization (eBItDA) 20.2
in % of sales revenues 4.3%
employees (09 /30) 2,543
in € millions Q3 /15
orders received 127.3
order backlog (09 /30) 454.7
Sales revenues 154.3
Gross profit 26.3
in % of sales revenues 17.0%
earnings before interest and taxes (eBIt) -6.2
in % of sales revenues -4.0%
earnings before interest, taxes, depreciation and amortization (eBItDA) 8.9
in % of sales revenues 5.8%
FINANcIAl poSITIoN AND pErForMANcE
preSentAtIon oF tHe FInAnCIAl StAtementS
In the reporting process for KUKA Group, minor changes have been made
to the presentation of the income statement and the cash flow statement
compared to the previous year. these are intended to further increase the
informational value of the financial statements. the information for the
previous year has been adapted accordingly to provide a correct basis for
comparison. Further details can be found in the notes to the quarterly
report /accounting policies.
In order to allow comparison of Group quarterly figures with those of the
previous year, the effects of the acquisition of Swisslog Group (initially con-
solidated in December 2014) have been shown separately.
eArnInGS
Sales revenues in the first three quarters of the year at KUKA Group
amounted to € 2,199.4 million (9m /14: € 1,507.9 million). Swisslog Group
also contributed € 468.6 million to this result. on an organic basis, i. e.
excluding Swisslog Group, KUKA Group showed a considerable increase of
€ 222.9 million or 14.8 percent to € 1,730.8 million. there was also a rise in
sales revenues in the third quarter of 2015, continuing the positive trend
of the previous quarters. After the record quarterly figure of € 757.6 million
in Q2 /15, another excellent result of € 722.0 million (Q3 /14: € 539.3 mil-
lion) was achieved.
Group orders received at € 2,134.8 million (9m /14: € 1,741.7 million) con-
stituted a very good result. this is still the case even when the € 360.6 mil-
lion contributed by Swisslog Group is excluded (organic orders received
9m /15: € 1,774.2 million). overall a slight organic increase of 1.9 percent
was also generated.
the gross earnings from sales at € 517.6 million represented an increase
of € 152.6 million or 41.8 percent (9m /14: € 365.0 million). taking into
account the € 69.6 million contributed by Swisslog Group, the organic fig-
ure is € 448.0 million, which constitutes an improvement of 22.7 percent.
In the first nine months of 2015 the Group’s organic gross margin rose from
24.2 percent to 25.9 percent. of particular note was the development of
the gross profit margin of Swisslog Group. From 13.3 percent in the first
quarter of 2015, it increased to 14.2 percent in the second quarter and
already reached 17.0 percent in the third quarter of 2015.
overhead costs (sales, research & development and administration) totaled
€ 417.7 million (9m /14: € 263.9 million). these overhead costs amounted
to 19.0 percent of sales, which was higher than the previous year’s level of
17.5 percent in the first nine months of 2014. this increase is due above all
to the even higher overhead costs at Swisslog, which are also a consequence
of additional amortization of the purchase price allocation. If these effects
are eliminated, the organic ratio of overhead costs to sales revenues was
18.0 percent, only slightly higher than the previous year’s level. organic
sales costs rose in absolute terms from € 114.3 million in the previous year’s
period to € 138.1 million, an increase of 20.8 percent. As a proportion of
sales, however, the rise amounts to just 0.5 of a percentage point. Swisslog
Group’s sales cost ratio currently amounts to 10.2 percent. Administrative
expenses in relation to sales showed an organic decrease of 0.7 percentage
points to 5.7 percent compared with the same period of the previous year.
this proves that KUKA constantly keeps an eye on internal costs even at
times of high business volumes and a good market environment.
the research and development costs shown in the income statement
amounted to € 87.8 million in the first nine months of 2015 and thus were
significantly higher than for the corresponding period of the previous year
(€ 53.8 million). this increase reflects the sustained strategic orientation of
the Group towards structured expansion of investment in further develop-
ments and in new and forward-looking technologies, in particular also in
the field of Industry 4.0. KUKA is currently working on the following topics:

12
KUKA AktiengesellschaftInterim report Q3 /2015
overall operating profit for the first nine months of this year was € 103.8 mil-
lion (9m /14: € 96.0 million). Adjusted for financing charges of € 2.1 million
included in operating profit (9m /14: € 2.1 million), earnings before inter-
est and taxes (eBIt) came in at € 105.9 million (9m /14: € 98.1 million). the
eBIt margin for the 2015 reporting period therefore fell to 4.8 percent com-
pared to the figure of 6.5 percent for the same period of the previous year.
the decline in the margin, as previously announced, is due to the planned
depreciation arising from the purchase price allocation in connection with
the acquisition of Swisslog Group. So far in 2015 eBIt was impacted by
depreciation costs amounting to € 46.3 million. For the full year 2015 a
charge against profits of approx. € 60 million is expected in this connection.
organically, i. e. without Swisslog, the eBIt would amount to € 140.7 million
with a much-improved eBIt margin of 8.1 percent. this shows that KUKA
Group has continued seamlessly on from the outstanding previous quarters.
Q1 /14 Q2 /14 Q3 /14 Q4 /14 Q1 /15 Q2 /15 Q3 /15
eBIt (in € millions) 27.1 34.2 36.8 43.7 28.1 40.3 37.5
eBIt margin (in %) 5.9% 6.8% 6.8% 7.4% 3.9% 5.3% 5.2%
eBIt organic (in € millions) – – – – 42.2 54.8 43.7
eBIt margin organic (in %) – – – – 7.4% 9.3% 7.7%
eBItDA (in € millions) 37.4 44.6 47.2 56.1 59.5 73.4 66.4
eBItDA margin (in %) 8.1% 8.8% 8.8% 9.5% 8.3% 9.7% 9.2%
eBItDA organic (in € millions) – – – – 54.2 67.4 57.5
eBItDA margin organic (in %) – – – – 9.5% 11.4% 10.1%
In the Systems segment the eBIt margin was 8.2 percent (9m /14: 5.5 per-
cent). this considerable rise reflects various factors. Firstly in the previous
year the margin was still affected by the acquisition of reis Group. Also the
positive effects from the sale of HlS Group and of the tools and dies business
unit have made a positive contribution during the financial year. In addi-
tion, however, the project optimization measures taken in the past are also
now having a stronger effect. the robotics division achieved 11.0 percent,
thus surpassing even the high level of the previous year (9m /14: 10.8 per-
cent). As expected, Swisslog returned a significantly negative eBIt margin
of -7.4 percent. However this was still predominantly due to depreciation
in connection with the purchase price allocation. If this is excluded, the
Swisslog segment had an eBIt margin of 2.5 percent.
Comparison with the previous year shows that eBItDA (earnings before
interest, taxes, depreciation and amortization) rose from € 129.2 million to
€ 199.3 million. the contrasting development of eBItDA in comparison to
eBIt is due to the additional amortization charges arising from the purchase
price allocation for Swisslog Group, since these do not impact eBItDA. there
was also a clear increase on an organic basis, with a result of € 179.1 million,
38.6 percent up on the previous year. the eBItDA margin was 9.1 percent
after 8.6 percent in the comparable period of the previous year. Swisslog
has also contributed to this improvement during the financial year. Whereas
Further development of the KUKA Sunrise control software
Upgrading of and development of applications for lBr iiwa
Development of the Kr ForteC, a new series of heavy-duty robots for
payloads between 360 and 600 kg
Applications in the mobile robotics field
Application expertise in the aerospace sector – for example, a mobile
platform with two collaborating robots has been successfully imple-
mented for setting rivets in aircraft construction
Further development of crane solutions in the logistics sector
Development of software to optimize inventories in the pharmaceuti-
cals and hospitals sectors
In addition to its own development work, KUKA is intensifying its collabora-
tion with other companies. In February 2014, for example, KUKA bought
shares in KBee AG, munich, a company specializing in robot hardware, soft-
ware and design. In may 2015, KUKA announced another strategic coop-
eration with tttech, a leading global real-time technology business. KUKA
and tttech will be investing jointly in real-time technology platforms and
in start-ups in order to implement Industry 4.0 solutions more quickly. the
first joint investment by KUKA and tttech is in a Silicon Valley start-up with
a focus on real-time cloud computing.
the results of KUKA’s research and development work also attract attention
from outside the Group. In march 2015, KUKA development projects received
a double accolade. to start with, our lBr iiwa lightweight robot won the
German Business Innovation Award in the “large company” category. In
addition to that, KUKA won the eurobotics technology transfer Award. KUKA
was awarded this prize jointly with the Albert ludwig University of Freiburg
for a successful technology transfer project entitled “Flexible Autonomous
navigation for the Industrial Shop Floor”. For further details about current
development projects, please refer to the company’s 2014 annual report.
the costs of € 8.5 million (9m /14: € 5.0 million) for new developments dur-
ing the reporting period were capitalized and will be reported as planned
depreciation in subsequent financial statements. research and development
expenditure depreciation amounted to € 13.3 million (9m /14: € 8.5 million).
the rise in the balance of other operating expenses and income from
€ -3.3 million in the first nine months of 2014 to € 6.9 million from January
to September 2015 results partly from the sale of HlS Group and the tools
and dies business unit in Schwarzenberg and Dubnica /Slovakia. the income
generated, which was in the lower double-digit million range, was reported
as other operating income.

13
Consolidated management report
earnings before taxes (eBt) in the first nine months of 2015 amounted to
€ 95.8 million (9m /14: € 71.8 million). In the period under consideration,
taxes amounted to € 32.4 million (9m /14: € 26.7 million). this represented
a tax rate of 33.8 percent (9m /14: 37.2 percent).
In the reporting period, earnings after taxes were € 63.4 million (9m /14:
€ 45.1 million). the undiluted earnings per share increased correspondingly
from € 1.33 to € 1.79.
ConSolIDAteD InCome StAtement (ConDenSeD)
in € millions 9m /14 9M /15 9M /15 Swisslog
9M /15 organic
Sales revenues 1,507.9 2,199.4 468.6 1,730.8
eBIt 98.1 105.9 -34.8 140.7
eBItDA 129.2 199.3 20.2 179.1
Financial result -24.2 -8.0 -3.3 -4.7
taxes on income 26.7 32.4 -6.5 38.9
earnings after taxes 45.1 63.4 -31.6 95.0
FInAnCIAl poSItIon
the stable income position is reflected in the cash earnings. these are
derived from the earnings after taxes, adjusted for income taxes, net inter-
est, cash-neutral depreciation on tangible and intangible assets, together
with other non-cash expenses and income. Cash earnings were € 201.5 mil-
lion, more than € 60 million higher than the corresponding value for the pre-
vious year of € 137.6 million. even on an organic basis this was an increase
of € 45.0 million to € 182.6 million.
Cash flow from operating activities amounted to € 34.6 million. Due to
business cycle considerations, Swisslog accounted for a negative amount
of around € 20 million. on an organic basis the operating cash flow was
€ 54.2 million, well below the previous year’s figure of € 123.4 million. the
main reason for this was the increase in the trade working capital require-
ments due to the business performance, as shown in the following table:
in € millions 12 /31 /2014 09 /30 /2015
Inventories less advance payments 194.1 246.8
trade receivables and receivables from construction contracts 612.9 647.8
trade payables and liabilities from construction contracts 522.2 523.0
Trade working capital 284.8 371.6
In total the trade working capital of the Group increased by € 86.8 million
to € 371.6 million. the rise was mostly attributable to the Systems division.
Swisslog’s eBItDA margin in the first two quarters stood at 3.6 percent, the
figure had risen to 5.8 percent in the third quarter. Depreciation during
the reporting period amounted to € 93.4 million (9m /14: € 31.1 million).
€ 18.7 million of this (9m /14: € 16.3 million) was attributable to robotics,
€ 16.7 million (9m /14: € 12.3 million) to Systems, € 55.5 million (9m /14:
zero) to Swisslog and € 3.2 million (9m /14: € 2.5 million) to other areas.
the financial result improved from € -24.2 million last year to € -8.0 mil-
lion. the financial result for the previous year included one-off charges of
€ 17.7 million arising from the repurchase of the corporate bond in line with
the market. the bond was fully redeemed in may 2014. During the reporting
period there was a one-off charge of € 1.3 million in connection with the
Syndicated Senior Facilities Agreement.
in € millions 9m /14 9M /15
Interest income from finance lease 4.6 5.2
remaining interest and similar income 2.2 1.0
other interest and similar income 6.8 6.2
Interest component for allocations to pension provisions 1.9 1.3
Guarantee commissions 0.4 0.4
Interest expense for the convertible bond 5.1 5.2
Interest expense for the corporate bond 5.6 –
Financing costs reclassified to operating results -2.3 -2.2
Foreign currency gains and losses 0.5 1.5
remaining interest and similar expenses 2.1 6.7
current other interest and similar expenses 13.3 12.9
current financial result -6.5 -6.7
one-off charge on Syndicated Senior Facilities Agreement -1.3
Interest expense from the repurchase of corporate bond shares 17.7 –
Financial result -24.2 -8.0
the interest income amounted to € 6.2 million (9m /14: € 6.8 million). this
includes mainly income in connection with the finance lease and income
from short-term investments.
the net interest item includes € 5.2 million (9m /14: € 5.1 million) for interest
on the convertible bond with a nominal value of € 150.0 million placed in
February and July 2013 in two tranches. In accordance with accounting stan-
dards, the reclassification of financing charges into operating profit reduced
interest charges by € 2.2 million (9m /14: € 2.3 million). the net interest
expense for pensions was € 1.3 million (9m /14: € 1.9 million). As described
in the notes to this quarterly report, the effects of currency exchange rates
in the area of financing are shown from now on in the financial results. the
net effect for the first three quarters amounted to € 1.5 million (9m /14:
€ 0.5 million). the increase was due largely to the major appreciation of the
Swiss franc against other currencies, especially against the euro, in the first
quarter of 2015. other interest and similar expenses include interest on the
utilization of the cash credit line by subsidiaries of KUKA plus interest in
connection with external audits.

14
KUKA AktiengesellschaftInterim report Q3 /2015
KUKA syndicated loan successfully refinanced and extendedIn march 2015 KUKA AG prematurely refinanced the syndicated loan that
it concluded in December 2013. the new contract provides for a surety
and guarantee line in the amount of € 140.0 million and a working capital
line, which can also be used for sureties and guarantees, in the amount
of € 90.0 million. this makes available a volume € 70.0 million higher than
with the previous contract. In addition, structural contract adaptations have
been made. the refinancing is attributable to the integration of Swisslog
Holding AG and its subsidiaries, in which a majority stake was acquired in
December 2014. moreover, it was possible to benefit from the improved
market situation to obtain significantly improved terms. the term of the
loan agreement is five years with two one-year extension options.
the new credit facility will be used for general corporate financing purposes.
In particular, it provides the surety and guarantee lines for the operative
business of KUKA and Swisslog. the contract came into force at the start
of April 2015. Further details of the Syndicated Senior Facilities Agreement
can be found in the notes to the quarterly report.
other financing measures in the fourth quarter of 2015After the cut-off date of this quarterly report, convertible bonds with a
nominal value of € 25.4 million were converted into 690,082 shares in octo-
ber. As a result the financial liabilities are reduced and at the same time the
equity capital is increased accordingly.
By way of a further supporting financial measure to pursue the Group’s
growth strategy, KUKA issued a promissory note loan with a total volume of
€ 250 million in october 2015. For further details please refer to the “events
after the balance sheet date” section.
ConSolIDAteD CASH FloW StAtement (ConDenSeD)
in € millions 9m /14 9M /15 9m /14 Swisslog
9M /15 excl.
Swisslog
Cash earnings 137.6 201.5 18.9 182.6
Cash flow from current business operations 123.4 34.6 -19.6 54.2
Cash flow from investment activities -25.6 -27.4 -28.9 1.5
Free cash flow 97.8 7.2 -48.5 55.7
net WortH
As at the reporting date, the balance sheet total of KUKA Group had
increased from € 1,979.5 million at December 31, 2014 to € 2,057.2 mil-
lion, an increase of 3.9 percent. As well as the changes described below, a
significant cause of the increase was the large gain in the Swiss franc /eUr
exchange rate following the decision made by the Swiss national Bank in
January to abandon the minimum exchange rate of around 1.20 CHF /eUr.
(the CHF /eUr spot rate was 1.2024 on December 31, 2014 and 1.0915 on
September 30, 2015). this change in exchange rate alone generated an
increase of the KUKA balance sheet total in the double-digit million range as
a result of Swisslog Group balance sheet items denominated in Swiss francs.
In the first nine months of 2015 the company invested € 67.7 million
(9m /14: € 46.9 million). Capital investment for tangible assets totaled
€ 47.7 million, mainly for technical plant and equipment as well as the
new Development and technology Center being built in Augsburg, which
will be completed and in use in the fourth quarter of 2015, as planned. In
addition an investment was made in a modern heating plant with a district
heating connection at the Augsburg site. Investments in intangible assets
totaled € 20.0 million, of which € 8.5 million was for internally generated
intangible assets. the sale of HlS Group and the tools and dies business
unit gave rise to cash inflows of € 47.2 million. the gains on the sale are
shown in the cash flow from current business operations. In particular,
there were outflows of cash amounting to € 41.7 million associated with
the acquisition of all the outstanding shares in Swisslog Group and Forte
Industries, and with a milestone payment to KBee AG. Cash inflows from
financial resources invested for short-term periods at the end of the 2014
financial year amounted to € 23.5 million, with the effect that the cash flow
from investment activities totaled € -27.4 million (9m /14: € -25.6 million).
the cash flow from current business operations plus cash flow from
investment activities resulted in a free cash flow of € 7.2 million (9m /14:
€ 97.8 million). As a result of the free cash flow of € 28.5 million generated
in the third quarter, the negative free cash flow of the previous quarter was
absorbed and the figure is positive on an annual basis.
In total the cash flow from financing activities was € -43.7 million (9m /14:
€ -227.4 million). In the same period of the previous year, the financing cash
flow was characterized by the early redemption of the corporate bond, which
brought about cash outflows of € 173.0 million as well as a corresponding
one-off interest charge (see explanations above). the dividend payment
to KUKA shareholders of € 0.40 per share (previous year: € 0.30 per share)
resulted in cash outflows of € 14.3 million (previous year: € 10.2 million).
Dividends amounting to € 2.6 million were paid to external shareholders of
subsidiary companies during the reporting year.
As a result of this, the cash and cash equivalents available to KUKA Group
as at September 30, 2015 were € 158.9 million (9m /14: € 322.7 million).
the heavy decline from the previous year’s value is due essentially to the
cost of acquiring Swisslog and the increase of the trade working capital in
line with the course of business during the reporting period. Compared to
December 31, 2014 the cash and cash equivalents decreased by € 33.2 mil-
lion (December 31, 2014: € 192.1 million).

15
Consolidated management report
on the assets side, non-current assets rose to € 813.3 million (Decem-
ber 31, 2014: € 798.0 million). the amount reported for goodwill amounted
to € 253.3 million (December 31, 2014: € 226.0 million). the difference arose
not only from the movements in exchange rates, particularly for the CHF,
but also from the acquisitions conducted in 2015 (approximately € 10 mil-
lion). the increase in tangible assets reflected amongst other things con-
tinued progress in completing the Development and technology Center
at Augsburg such that the first KUKA employees will move into the new
building in the fourth quarter of 2015 as planned. As at the reporting date,
a value of € 61.5 million had been booked to this (December 31, 2014:
€ 53.3 million). Amounts totaling € 4.4 million were included for investments
in associated companies (December 31, 2014: € 5.6 million). Deferred tax
assets amounted to € 50.0 million (December 31, 2014: € 48.2 million) and
€ 14.5 million was attributable to losses carried forward (December 31, 2014:
€ 11.1 million).
the value of current assets amounted to € 1,243.9 million as at Septem-
ber 30, 2015 (December 31, 2014: € 1,181.5 million). the increase in other
assets stems among other reasons from the considerable increase in foreign
sales tax receivables. As at the end of fiscal 2014 assets held for disposal
were reported here in connection with the sale of HlS Group in 2015 (Decem-
ber 31, 2014: € 16.5 million). Further explanations regarding the current
assets are included in the notes on the financial position.
Within the reporting period, equity capital increased from € 541.1 million
to € 603.2 million. this was the result not only of the earnings after taxes
(€ 63.4 million) but also of the contribution from exchange rate effects total-
ing € 37.3 million. the valuation of pension provisions (€ 2.5 million) and
the dividend distribution to KUKA shareholders of € 0.40 per share (totaling
€ 14.3 million) had no effect on earnings but did reduce the equity capital.
minority interests were reduced from € 16.8 million to € -0.3 million pri-
marily due to the acquisition of all the shares in Swisslog Holding AG. the
equity ratio, i. e. the ratio of equity capital to the balance sheet total, was
29.3 percent, which was much higher than at the end of the 2014 financial
year (December 31, 2014: 27.3 percent).
the financial liabilities predominantly relate to the convertible bond matur-
ing in February 2018 (for further details of the convertible bond, please refer
to the “events after the balance sheet date” section).
Current liabilities increased from € 1,096.2 million at December 31, 2014
to € 1,111.6 million at September 30, 2015. the changes in trade working
capital referred to above were the main reason for this. In addition, the
amounts reported for income taxes were higher due to the good growth in
profit. Also accruals for outstanding vacation claims at the end of the third
quarter are, as usual, above the value for the end of the year. no figure now
applies to liabilities in connection with assets held for sale (December 31,
2014: € 7.3 million).
Due to the effects described in the explanation of the Group financial
position, there was a net liquidity figure of € 16.6 million as at Septem-
ber 30, 2015, the balance of liquid assets minus current and non-current
financial liabilities. As a result it was possible to absorb the net debt which
existed at the end of the previous quarter in an amount of € 10.1 million.
the Group had a net liquidity of € 32.6 million as at December 31, 2014.
GroUp net WortH
in € millions 12 /31 /2014 09 /30 /2015
Balance sheet total 1,979.5 2,057.2
equity 541.1 603.2
in % of balance sheet total 27.3% 29.3%
net liquidity 32.6 16.6
rESEArch & DEVElopMENT
research & development expenditure in KUKA Group amounted to € 35.9 mil-
lion, substantially higher than the same period last year (Q3 /14: € 18.4 mil-
lion). this includes Swisslog, which has been fully consolidated since
December 31, 2015. research and development expenditure for the first
nine months of the year thus totaled € 87.8 million (9m /14: € 53.8 million).
the expenditure is attributable predominantly to the robotics division.
Systems conducts most of its research and development in conjunction
with customer projects.
In the third quarter of 2015, KUKA focused on expanding and improving
the existing product portfolio. In addition, activities were concentrated on
pushing ahead with key technologies for Industry 4.0, human-robot col-
laboration, mobility and smart platforms.
eFFICIent orDer-pICKInG proCeSSeS In IntrAloGIStICS
Automated case pickone of the central tasks in intralogistics is the automatic loading of mixed
pallets. packaging form and sequencing place the highest quality require-
ments on palletizing algorithms. together with a long-standing customer,
we are developing an automatic palletizing station which sets new standards
in terms of sturdiness and efficiency.

16
KUKA AktiengesellschaftInterim report Q3 /2015
DeSIGn AWArD For Kr AGIlUS
KUKA won the International Design excellence Award (IDeA) for the design
of the small robot series Kr AGIlUS at the 50th anniversary international
conference of the Industrial Designers Society of America (IDSA). the design
conveys the technical properties of Kr AGIlUS – high speed, exact precision
and maximum flexibility. It is characterized by dynamism and emphasizes
the robot’s nimbleness and fast motion sequences. the robot is designed
to save on materials with the aim of avoiding any impairment of its agility.
this makes the robot a perfect combination of form and function.
EMploYEES
As at September 30, 2015, KUKA Group had 12,071 employees, including
2,543 at Swisslog. Compared with the figure of 9,588 for the reporting date
of the previous year, this represents an increase of 25.9 percent. the robotics
division’s headcount rose from 3,579 to 4,055, an increase of 13.3 percent.
the workforce has expanded in all areas, i. e. automotive, research and
development, general industry and service. In the Systems division the
number of employees fell by 10.7 percent year-on-year from 5,738 to 5,126.
this is due to the sale of HlS engineering Group and the tools and dies busi-
ness, which happened in the second and third quarter 2015. Group-wide,
KUKA had 1,885 temporary employees as at September 30, 2015, 174 more
than on September 30, 2014, when the number was 1,711. Augsburg had
3,143 employees at the end of the third quarter of 2015.0 3000 6000 9000 12000 15000
09 /30 /2014
09 /30 /2015
EMploYEES
9,588
12,071
5,1264,055 2,543 347
5,7383,579 272
robotics Systems Swisslog AG /others
Automated item pickthe first automatic pick station was presented at Hannover messe 2015.
In addition to advanced vision technology and high-performance evalu-
ation software, the entire package also includes the robotic equipment
with gripper elements. the complete package can also be used together
with order pickers (human-robot collaboration) and is offered as an add-on
module for Swisslog’s highly efficient pick stations.
FleXFelloW preSenteD At moteK
flexFelloW is a mobile robot unit that can be manually moved and put
into operation where it is needed in the shortest amount of time. KUKA
flexFelloW allows completely new flexibility for planning systems as well
as fluid variation in terms of the degree of automation. the combinability
of manual and automatic tasks means that production can be optimally
adapted to the required capacity utilization. Combining it with lBr iiwa
offers many advantages. For example, the complex external sensors are no
longer required as the force and torque sensors of the lightweight robot
can be used. the ability to combine human-robot collaboration with mobile
robotics offers a further unique selling point.
KUKA flexFelloW can be deployed in various workplaces, to automate
manual workstations and therefore handle ramp-ups of production facili-
ties, peak loads and resource shortfalls in production. It allows people and
robots to work together in the same workplace. Cost-effective automation of
non-ergonomic manual activities that were previously difficult to automate
is now possible. reproducible processes are performed with high quality,
without requiring product-specific or component-relevant investment.
KUKA At IroS
From September 29 to october 1, 2015, researchers and developers got an
up-close look at the innovative products from KUKA at IroS (International
Conference on Intelligent robots and Systems) in Hamburg and also had
an opportunity to share visionary future concepts. the visitors learned the
initial steps in robot programming and operation in a mobile training cell
with Kr AGIlUS. KUKA also showcased its mobile Kmr iiwa, which sup-
ports human workers in the factory of the future. Kmr iiwa combines the
strengths of the sensitive lightweight robot lBr iiwa with a mobile plat-
form. Its autonomous navigation software enables the robot to move fully
autonomously in space without cable connections. environment scanners
and ultrasound sensors on the vehicle allow obstacles to be detected and
avoided.

17
Consolidated management report
opporTUNITIES AND rISK rEporT
overall, KUKA Group’s named risks relate to the business performance of
the divisions and financial risks associated with currency exchange rate
fluctuations and corporate financing. the executive Board is not aware of
any individual or aggregated risks that could threaten the company’s exis-
tence. Strategically and financially, the company is positioned to be able to
take advantage of business opportunities. For information on risks affecting
eBIt, please also refer to the detailed report on pages 45 and following of
the 2014 annual report /management report.
the Volkswagen Group is one of KUKA’s most important customers. As a
result of the emissions scandal, the Volkswagen Group took initial action in
mid-october to reduce its investments by € 1 billion per year. From today’s
perspective, it is not yet possible to definitively assess the effects that the
emissions scandal will have on automotive suppliers in general and on
KUKA in particular.
oUTlooK
Given the current economic forecasts and general conditions, KUKA expects
high demand in the 2015 financial year, particularly from the north America
and Asia regions, and especially from China. Demand in europe is expected
to remain relatively stable or to rise slightly. From a sector perspective,
general industry growth is expected to be strong. this is due in part to the
high potential for automation solutions as well as the positive economic
prospects for general industry customers.
Automotive customers have already significantly increased investments over
the past few years. Demand in 2015 should therefore develop relatively sta-
bly altogether, with positive influences from China and the United States.
on the basis of the current general conditions and exchange rates, KUKA is
anticipating sales revenues of approximately € 2.9 billion. the sales devel-
opment will profit from the first-time consolidation of Swisslog. In addi-
tion, both customer segments – general industry and automotive – and
from a regional viewpoint, China and north America, will make a positive
contribution to sales development. Based on the current economic envi-
ronment and the development of sales, KUKA Group expects to achieve an
eBIt margin of 6.5 to 7.0 percent before ppA (purchase price allocation) for
Swisslog, and including the positive effects of the sale of HlS Group and
the tools and dies business unit. Investments in growth in general industry
and China as well as the integration and restructuring costs for Swisslog
are having an impact on the eBIt margin. In addition, the introduction of
product lifecycle management software at Systems and erp software to be
used throughout the Group will result in higher costs during 2015, but in
subsequent years they will help make further improvements in efficiency.
Having regard to the expenditure for purchase price allocation, KUKA Group
expects a lower eBIt margin. In the coming years, after restructuring and
an increase in efficiency at Swisslog, a positive contribution to value added
is anticipated for KUKA Group.
EVENTS AFTEr ThE BAlANcE ShEET DATE
promISSorY note loAn (SCHUlDSCHeInDArleHen)ISSUeD For A totAl oF € 250 mIllIon
In october 2015 KUKA AG issued promissory notes for a total of € 250 million.
Due to significant oversubscription, the initial volume of € 150 million was
increased. the additional funds will be used to continue the growth strategy.
the overall volume of the loan was issued in two tranches with maturities
of five and seven years at a fixed interest rate averaging 1.35 percent.
ConVerSIon oF ConVertIBle BonD SHAreS
In october 2015, creditors of the 2013 convertible bond made use of their
conversion right. Due to the conversion declaration, new shares were cre-
ated in accordance with the bond terms. through the issue of new shares,
the total number of KUKA shares has risen by 690,082, from 35,708,315
to 36,398,397. pursuant to section 200 of the German Stock Corporation
Act (AktG), the issue of new shares saw the company’s share capital rise by
€ 1,794,213.20, from € 92,841,619.00 to € 94,635,832.20.
Apart from this there have been no events subject to reporting requirements
that had an impact on the financial position and performance of the com-
pany since the balance sheet reporting date.

18
KUKA AktiengesellschaftInterim report Q3 /2015
INTERIM REPORT (CONDENSED)coNSolIDATED INcoME STATEMENTof KUKA Aktiengesellschaft for the period January 1 to September 30, 2015
in € millions Q3 /14 Q3 /15 9m /14 9M /15
Sales revenues 539.3 722.0 1,507.9 2,199.4
Cost of sales -407.5 -548.7 -1,142.9 -1,681.8
Gross profit 131.8 173.3 365.0 517.6
Selling expenses -38.9 -59.6 -114.3 -185.7
research and development expenses -18.4 -35.9 -53.8 -87.8
General and administrative expenses -37.6 -44.9 -95.8 -144.2
other operating income 1.1 6.9 5.3 20.6
other operating expenses -1.2 -1.9 -8.6 -13.7
earnings from companies valued at equity -0.8 -1.0 -1.8 -3.0
Earnings from operating activities 36.0 36.9 96.0 103.8
reconciliation to earnings before interest and taxes (EBIT)
Financing costs included in cost of sales 0.8 0.6 2.1 2.1
Earnings before interest and taxes (EBIT) 36.8 37.5 98.1 105.9
Depreciation and amortization 10.4 28.9 31.1 93.4
Earnings before interest, taxes, depreciation and amortization (EBITDA) 47.2 66.4 129.2 199.3
net interest income 2.2 1.1 6.8 6.2
net interest expense -3.1 -4.0 -31.0 -14.2
Financial result -0.9 -2.9 -24.2 -8.0
Earnings before taxes 35.1 34.0 71.8 95.8
taxes on income -12.5 -12.1 -26.7 -32.4
Earnings after taxes 22.6 21.9 45.1 63.4
of which: attributable to minority interests 0.0 0.6 0.0 -0.4
of which: attributable to shareholders of KUKA AG 22.6 21.3 45.1 63.8
Earnings per share (undiluted) in € 0.67 0.60 1.33 1.79
Earnings per share (diluted) in € 0.63 0.57 1.28 1.70
STATEMENT oF coMprEhENSIVE INcoMEof KUKA Aktiengesellschaft for the period January 1 to September 30, 2015
in € millions Q3 /14 Q3 /15 9m /14 9M /15
earnings after taxes 22.6 21.9 45.1 63.4
Items that may potentially be reclassified to profit or loss
Currency translation adjustments 8.5 -13.3 7.9 37.3
Items that are not reclassified to profit or loss
Changes of actuarial gains and losses -2.8 -0.4 -10.2 0.3
Deferred taxes on changes of actuarial gains and losses 0.6 -1.7 2.3 -2.8
changes recognized directly in equity 6.3 -15.4 0.0 34.8
Comprehensive income 28.9 6.5 45.1 98.2
of which: attributable to minority interests 0.0 -0.6 0.0 -0.4
of which: attributable to shareholders of KUKA AG 28.9 7.1 45.1 98.6

19
Interimreport
coNSolIDATED cASh FloW STATEMENTof KUKA Aktiengesellschaft for the period January 1 to September 30, 2015
in € millions 9m /14 9M /15
Earnings after taxes 45.1 63.4
Income taxes 24.6 48.7
net interest 23.7 8.0
Depreciation /amortization on intangible assets 13.0 69.1
Depreciation /amortization on tangible assets 18.1 24.3
other non-payment-related income -7.9 -19.7
other non-payment-related expenses 21.0 7.7
cash earnings 137.6 201.5
result on the disposal of assets 0.0 -10.3
Changes in provisions 45.2 12.1
Changes in current assets and liabilities:
Changes in inventories -38.6 -59.3
Changes in receivables and deferred charges -41.1 -91.2
Changes in liabilities and deferred charges (excl. financial debt) 38.3 19.7
Income taxes paid -15.2 -35.8
Investment /financing matters affecting cash flow -2.8 -2.1
cash flow from current business operations 123.4 34.6
payments from disposals of fixed assets 0.5 5.8
payments for capital expenditures on intangible assets -8.5 -20.0
payments for capital expenditures on tangible assets -38.4 -47.7
payments for investment in financial investments 0.0 -0.5
payments received from financial assets in the course of short-term funds management 30.4 23.5
payments received from the sale of consolidated companies and other business units – 47.2
payments for the acquisition of consolidated companies and other business units -16.0 -41.7
Interest received 6.4 6.0
cash flow from investment activities -25.6 -27.4
Free cash flow 97.8 7.2
Dividend payments -10.2 -16.9
proceeds /payments from the issuance /repayment of bonds and similar liabilities -173.0 –
proceeds from /payments for the acceptance /repayment of bank loans -17.7 -22.2
payments from grants received 2.8 2.1
Interest paid -29.3 -6.7
cash flow from financing activities -227.4 -43.7
payment-related changes in cash and cash equivalents -129.6 -36.5
Changes in cash and cash equivalents related to acquisitions 5.5 1.9
exchange-rate-related and other changes in cash and cash equivalents 5.7 1.4
changes in cash and cash equivalents -118.4 -33.2
(of which net increase /decrease in restricted cash) (1.9) (1.5)
Cash and cash equivalents at the beginning of the period 441.1 192.1
(of which restricted cash at the beginning of the period) (6.1) (2.4)
Cash and cash equivalents at the end of the period 322.7 158.9
(of which restricted cash at the end of the period) (4.2) (3.8)

20
KUKA AktiengesellschaftInterim report Q3 /2015
coNSolIDATED BAlANcE ShEETof KUKA Aktiengesellschaft as of September 30, 2015
ASSETS
in € millions 12 /31 /2014 09 /30 /2015
Non-current assets
Intangible assets 430.4 426.3
tangible assets 233.8 242.7
Financial investments 0.6 2.9
Investments accounted for at equity 5.6 4.4
670.4 676.3
Finance lease receivables 66.1 65.5
Income tax receivables 3.4 3.4
other long-term receivables and other assets 9.9 18.1
Deferred taxes 48.2 50.0
798.0 813.3
current assets
Inventories 272.4 331.8
receivables and other assets
trade receivables 273.8 309.7
receivables from construction contracts 339.1 338.1
Finance lease receivables 6.9 8.0
Income tax receivables 9.7 9.2
other assets, prepaid expenses and deferred charges 71.0 88.3
700.5 753.3
Cash and cash equivalents 192.1 158.8
Assets held for sale 16.5 –
1,181.5 1,243.9
1,979.5 2,057.2

21
Interimreport
LIABILITIES
in € millions 12 /31 /2014 09 /30 /2015
Equity
Subscribed capital 92.8 92.8
Capital reserve 176.5 176.5
revenue reserves 255.0 334.2
minority interests 16.8 -0.3
541.1 603.2
Non-current liabilities
Financial liabilities 137.0 139.9
other liabilities 18.2 12.5
pensions and similar obligations 121.7 128.9
Deferred taxes 65.3 61.1
342.2 342.4
current liabilities
Financial liabilities 22.5 2.3
trade payables 274.6 365.7
Advances received 78.3 85.0
liabilities from construction contracts 247.6 157.3
Accounts payable to affiliated companies 0.1 0.1
Income tax liabilities 24.9 37.4
other liabilities and deferred income 290.8 306.7
other provisions 150.1 157.1
liabilities from assets held for sale 7.3 –
1,096.2 1,111.6
1,979.5 2,057.2

22
KUKA AktiengesellschaftInterim report Q3 /2015
DEVElopMENT oF GroUp EQUITYof KUKA Aktiengesellschaft for the period January 1 to September 30, 2015
revenue reserves
in € millions number of shares out-
standing
Subscribed capital
Capital reserve
translation gains /losses
Actuarial gains and losses
Annual net income and
other revenue reserves
equity to shareholders
minority interests
Total
01 /01 /2015 35,708,315 92.8 176.5 9.7 -17.2 262.5 524.3 16.8 541.1
earnings after taxes 63.8 63.8 -0.4 63.4
other earnings 37.3 -2.5 34.8 34.8
comprehensive income – – – 37.3 -2.5 63.8 98.6 -0.4 98.2
KUKA AG dividend -14.3 -14.3 -14.3
other changes -5.1 -5.1 -16.7 -21.8
09 /30 /2015 35,708,315 92.8 176.5 47.0 -19.7 306.9 603.5 -0.3 603.2
DEVElopMENT oF GroUp EQUITYof KUKA Aktiengesellschaft for the period January 1 to September 30, 2014
revenue reserves
in € millions number of shares out-
standing
Subscribed capital
Capital reserve
translation gains /losses
Actuarial gains and losses
Annual net income and
other revenue reserves
equity to shareholders
minority interests
Total
01 /01 /2014 33,915,431 88.2 94.5 -2.2 -4.9 202.2 377.8 1.3 379.1
earnings after taxes 45.1 45.1 45.1
other earnings 7.9 -7.9 0.0
comprehensive income – – – 7.9 -7.9 45.1 45.1 – 45.1
KUKA AG dividend -10.2 -10.2 -10.2
other changes 2.9 2.9 2.9
09 /30 /2014 33,915,431 88.2 94.5 5.7 -12.8 240.0 415.6 1.3 416.9

23
Interimreport
NOTES ON THE QUARTERLY REPORT (CONDENSED)GroUp SEGMENT rEporTof KUKA Aktiengesellschaft for the period January 1 to September 30, 2015
robotics Systems Swisslog KUKA AG and other companies
reconciliation and consolidation
Group
in € millions 9m /14 9M /15 9m /14 9M /15 9M /15 9m /14 9M /15 9m /14 9M /15 9m /14 9M /15
orders received 628.2 686.5 1,137.7 1,114.0 360.6 – – -24.2 -26.3 1,741.7 2,134.8
order backlog (09 /30) 284.2 279.8 1,013.9 1,002.7 454.7 – – -12.0 -9.8 1,286.1 1,727.4
Group external sales revenues 607.2 638.3 900.7 1,092.5 468.6 0.0 0.0 – – 1,507.9 2,199.4
in % of Group sales revenues 40.3% 29.0% 59.7% 49.7% 21.3% – – – – 100.0% 100.0%
Intra-Group sales revenues 13.1 21.1 2.6 7.0 0.0 – – -15.7 -28.1 – –
Sales revenues by division 620.3 659.4 903.3 1,099.5 468.6 0.0 0.0 -15.7 -28.1 1,507.9 2,199.4
Gross profit 221.4 254.8 142.4 193.5 69.6 – – 1.2 -0.3 365.0 517.6
in % of sales revenu-es of the division 35.7% 38.6% 15.8% 17.6% 14.9% – – – – 24.2% 23.5%
EBIT 66.9 72.8 49.8 89.8 -34.8 -19.0 -19.7 0.4 -2.2 98.1 105.9
in % of sales revenu-es of the division 10.8% 11.0% 5.5% 8.2% -7.4% – – – – 6.5% 4.8%
EBITDA 83.2 91.5 62.1 106.5 20.2 -16.6 -16.6 0.5 -2.3 129.2 199.3
in % of sales revenu-es of the division 13.4% 13.9% 6.9% 9.7% 4.3% – – – – 8.6% 9.1%
Assets 382.6 455.9 712.4 751.4 552.6 224.0 530.2 -160.2 -445.0 1,158.8 1,845.1
number of employees (09 /30) 3,579 4,055 5,738 5,126 2,543 271 347 – – 9,588 12,071
24
KUKA AktiengesellschaftInterim report Q3 /2015
ADDItIonS oF CompAnIeS
the additions relate to the acquisition or foundation of:
Forte Industrial equipment Systems Inc., mason, ohio /USA
Swisslog Automation GmbH, Karlsruhe
Swisslog middle east llC, Dubai /United Arab emirates
KUKA Beteiligungen (Schweiz) AG, Buchs (AG) /Switzerland
Swisslog Automation GmbH, Karlsruhe was founded in the second quarter
of 2015 (further details can be found under “Acquisitions”).
Swisslog AG, Buchs /Switzerland, 100 percent subsidiary of Swisslog Hold-
ing AG, Buchs /Switzerland, founded Swisslog middle east llC, Dubai /United
Arab emirates, together with Al tayer Group. In accordance with the articles
of association, Swisslog holds 49.0 percent (corresponding to < € 0.1 million)
of the share capital. However, Swisslog has an interest of 51.0 percent in
the income and nominates the majority of members on the administrative
board, with the effect that the company is fully incorporated into KUKA
Group. In total the business operations in 2015 are still of minor significance.
In the second quarter, to compensate the remaining shareholders of Swiss-
log Holding AG, Buchs /Switzerland, KUKA Beteiligungen (Schweiz) AG,
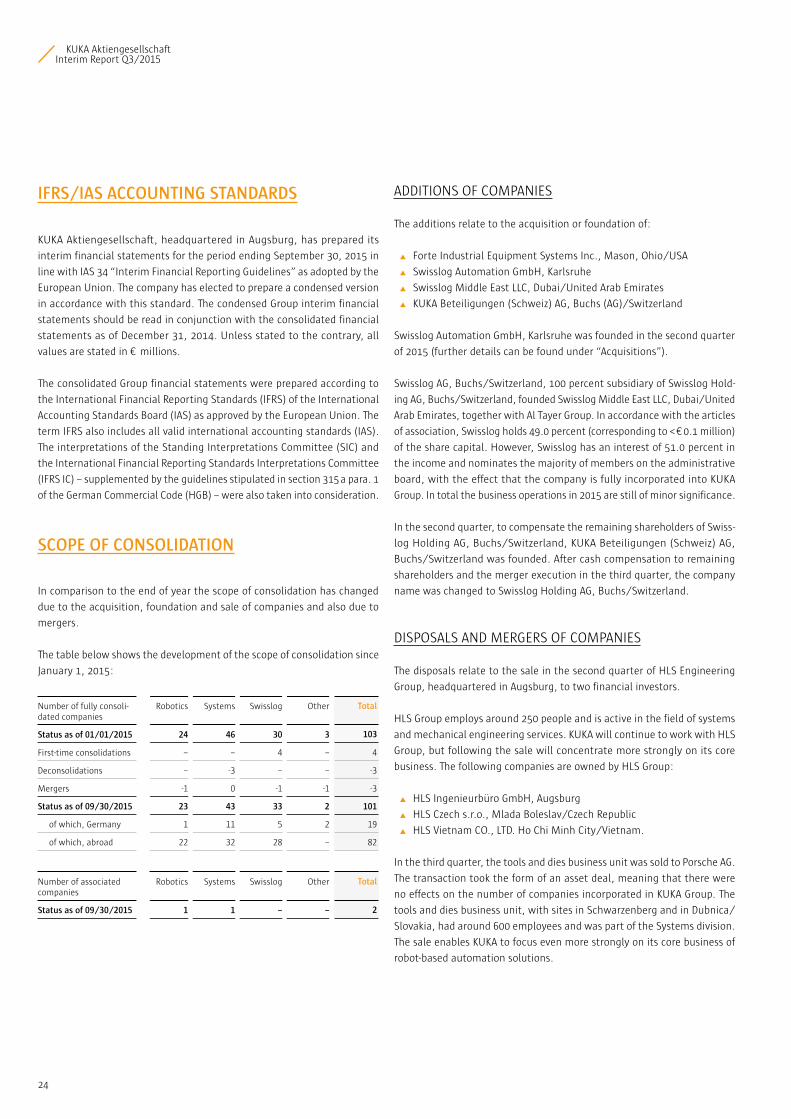
Buchs /Switzerland was founded. After cash compensation to remaining
shareholders and the merger execution in the third quarter, the company
name was changed to Swisslog Holding AG, Buchs /Switzerland.
DISpoSAlS AnD merGerS oF CompAnIeS
the disposals relate to the sale in the second quarter of HlS engineering
Group, headquartered in Augsburg, to two financial investors.
HlS Group employs around 250 people and is active in the field of systems
and mechanical engineering services. KUKA will continue to work with HlS
Group, but following the sale will concentrate more strongly on its core
business. the following companies are owned by HlS Group:
HlS Ingenieurbüro GmbH, Augsburg
HlS Czech s.r.o., mlada Boleslav /Czech republic
HlS Vietnam Co., ltD. Ho Chi minh City /Vietnam.
In the third quarter, the tools and dies business unit was sold to porsche AG.
the transaction took the form of an asset deal, meaning that there were
no effects on the number of companies incorporated in KUKA Group. the
tools and dies business unit, with sites in Schwarzenberg and in Dubnica /
Slovakia, had around 600 employees and was part of the Systems division.
the sale enables KUKA to focus even more strongly on its core business of
robot-based automation solutions.
IFrS /IAS AccoUNTING STANDArDS
KUKA Aktiengesellschaft, headquartered in Augsburg, has prepared its
interim financial statements for the period ending September 30, 2015 in
line with IAS 34 “Interim Financial reporting Guidelines” as adopted by the
european Union. the company has elected to prepare a condensed version
in accordance with this standard. the condensed Group interim financial
statements should be read in conjunction with the consolidated financial
statements as of December 31, 2014. Unless stated to the contrary, all
values are stated in € millions.
the consolidated Group financial statements were prepared according to
the International Financial reporting Standards (IFrS) of the International
Accounting Standards Board (IAS) as approved by the european Union. the
term IFrS also includes all valid international accounting standards (IAS).
the interpretations of the Standing Interpretations Committee (SIC) and
the International Financial reporting Standards Interpretations Committee
(IFrS IC) – supplemented by the guidelines stipulated in section 315 a para. 1
of the German Commercial Code (HGB) – were also taken into consideration.
ScopE oF coNSolIDATIoN
In comparison to the end of year the scope of consolidation has changed
due to the acquisition, foundation and sale of companies and also due to
mergers.
the table below shows the development of the scope of consolidation since
January 1, 2015:
number of fully consoli-dated companies
robotics Systems Swisslog other Total
Status as of 01 /01 /2015 24 46 30 3 103
First-time consolidations – – 4 – 4
Deconsolidations – -3 – – -3
mergers -1 0 -1 -1 -3
Status as of 09 /30 /2015 23 43 33 2 101
of which, Germany 1 11 5 2 19
of which, abroad 22 32 28 – 82
number of associated companies
robotics Systems Swisslog other Total
Status as of 09 /30 /2015 1 1 – – 2

25
Interimreport
CompAnY merGerS AnD CHAnGe oF SeGment
In the first quarter of 2015, KUKA laboratories GmbH, Augsburg /Germany
was merged into KUKA roboter GmbH, Augsburg /Germany, and reis Holding
Corp. USA, elgin, Illinois /USA was merged into reis robotics USA Inc., elgin,
Illinois /USA. In addition, as part of the merger compensation to remaining
Swisslog shareholders, Swisslog Holding AG was merged with KUKA Beteili-
gungen (Schweiz) AG (see also above under “Additions of companies”).
the previous shell company KUKA Industries GmbH, Augsburg started opera-
tions in 2015. In this context, the company was removed from the other
segment and allocated to Systems.
AcQUISITIoNS
Forte InDUStrIAl eQUIpment SYStemS InC., mASon, oHIo /USA (“Forte”)
In April 2015, 100.0 percent of the shares in Forte, a renowned system
integrator for the automation of warehouses, headquartered in mason,
ohio /USA, were acquired. the company specializes in services in the fields
of solutions design, system integration and software technology for distribu-
tion centers. Forte plans, designs and implements intralogistics systems
using its own warehouse execution software.
the acquisition strengthens the strategy of the Swisslog segment in the
north American market by adding a complementary spectrum of products
and services, and increases the range of market coverage especially in the
segments of e-commerce and pharmaceuticals.
€ 11.4 million of the € 12.9 million purchase price was paid immediately in
cash. the remaining purchase price is due within 18 months and is covered
by specific contractual guarantees. Cash and cash equivalents of € 1.4 mil-
lion were transferred. no shares in previously fully consolidated companies
of KUKA Group were acquired.
the acquisition has contributed € 11.2 million and a break-even result to
overall Group sales revenues so far this year. If the company had already
been taken over at the beginning of 2015, this would have created additional
revenues of around € 3.6 million and a net loss for the year of € -0.1 million.
the following table shows the carrying amounts assumed as a result of the
purchase of the divisions immediately prior to the acquisition as well as the
opening balance sheet in fair values (preliminary).
Carrying amounts assumed
opening balance sheet in fair
values
Intangible assets 0.0 3.9
tangible assets 0.2 0.2
Inventories 0.3 0.3
receivables and other assets 2.9 2.9
liabilities and provisions 4.4 4.4
the acquired intangible assets consist to a large extent of rights to names,
technology and orders on hand. receivables and inventories primarily con-
cern orders in house at the time of the acquisition. Contingent liabilities
were not transferred. no deferred taxes arising from the takeover have to be
taken into account. the transaction thus led to goodwill of € 8.6 million. the
goodwill reflects first and foremost the future synergies described above.
SWISSloG AUtomAtIon GmBH, KArlSrUHe
In April 2015 KUKA also acquired a range of technologies and personnel from
Grenzebach Automation GmbH in Karlsruhe, Germany, in order to further
strengthen its competence in the fields of automated guided vehicles (AGVs)
and logistics robots. Swisslog Automation GmbH, Karlsruhe was initially
founded in the course of the takeover.
the acquisition consistently follows the strategy of positioning Swisslog
more strongly in the e-commerce and multi-channel segments and expand-
ing the production logistics area. the purchase price amounted to a total
of € 1.1 million, which was paid in cash.
Swisslog Group, Buchs /Switzerland was acquired and first consolidated at
the end of 2014, as too was Faude Automatisierungstechnik GmbH, Gärtrin-
gen /Germany. For further details please refer to the company’s 2014 annual
report. Both purchase price allocations remain unfinalized in respect of the
capitalized intangible assets and the associated effects arising on taxation.

26
KUKA AktiengesellschaftInterim report Q3 /2015
the following changes in presentation were made in the cash flow state-
ment:
From 2015 onwards, dividends received will be shown within the invest-
ment cash flow instead of within the operating cash flow.
Based on DrS 21, interest paid and grants received will no longer be
shown within the operating cash flow but instead within the financing
cash flow. Implementation of this change for 2014 results in an increase
of € 20.1 million in operating cash flow and an increase of € 6.4 million
in investment cash flow. this results in a free cash flow figure higher by
€ 26.5 million and a financing cash flow figure lower by € 26.5 million.
For further information on the valuation methodology and accounting prin-
ciples please refer to the consolidated financial statements dated Decem-
ber 31, 2014, which form the basis of the interim report presented here.
this is also available on the Internet at www.KUKA.com.
chANGES IN AccoUNTING polIcIES
the following new standards and interpretations have become mandatory
since the start of the 2015 financial year:
Amendments to IAS 19: employee contributions
IFrIC 21: levies
Annual Improvements 2010 – 2012
Annual Improvements 2011 – 2013
the first-time application of these standards and interpretations led to only
slight effects on the consolidated financial statements, or to no effects on
them at all.
EArNINGS pEr ShArE
Undiluted /diluted earnings per share as at September 30, 2015 break down
as follows:
9m /14 9M /15
net result attributable to shareholders of KUKA AG (in € millions) 45.1 63.8
Weighted average number of shares outstanding 33,915,431 35,708,315
Undiluted earnings per share (in € ) 1.33 1.79
Diluted earnings per share (in € ) 1.28 1.70
Undiluted earnings per share due to shareholders of KUKA Aktiengesellschaft
were calculated in accordance with IAS 33 and the weighted average number
of shares outstanding for the year.
INVESTMENTS IN ASSocIATED coMpANIES
As at the reporting date, the investment carrying amount of the two associ-
ated companies KBee AG, Germany, and Yawei reis robot manufacturing
(Jiangsu) Co., ltd., China, was valued at € 4.4 million; the effect on earnings
was € -3.0 million.
the stake in KBee AG was increased by contractual milestone payments of
€ 3.0 million. For further details please refer to the company’s 2014 annual
report.
AccoUNTING AND VAlUATIoN METhoDS
the same valuation methodology and accounting principles as those used
for the consolidated financial statements for the 2014 financial year were
applied in preparing this consolidated interim report.
In respect of acquisitions made during the preceding year, KUKA Group has
further optimized its internal reporting. this has resulted in minor changes
to the presentation of external reports in respect of the income statement
and the cash flow statement. the previous year’s figures have been adapted
accordingly to allow comparison.
In particular the following changes of presentation which affect the income
statement have been made:
As well as the reconciliation of the operating profit to the eBIt (earnings
before interest and taxes), the eBIt will from now on be additionally
reconciled to the eBItDA (earnings before interest, taxes, depreciation
and amortization). As a result of this, amortization of capitalized bor-
rowing costs for intangible assets was also reclassified from the recon-
ciliation of the operating profit to eBIt to the reconciliation of eBIt to
eBItDA.
Since the start of the financial year, currency translation gains and
losses from the operating areas (for instance receivables or liabilities
for goods and services in foreign currency) have been reported within
the cost of sales. the effects of currency exchange rates arising from
financial activities, on the other hand, are reported as a balance within
other interest charges and similar income and expenses. this change in
reporting has led in the previous year’s comparative figures to reclas-
sification of amounts from the other operating income (€ 6.2 million
for Q3 /14 and € 21.2 million for 9m /14) and from the other operating
expenses (€ 11.8 million for Q3 /14 and € 32.5 million for 9m /14) to
the cost of sales (€ 5.5 million for Q3 /14 and € 10.8 million for 9m /14)
and to other interest and similar expenses (€ 0.1 million for Q3 /14
and € 0.5 million for 9m /14). Whilst the earnings after taxes remain
unaffected, the reclassification results in a higher eBIt (€ 0.1 million
for Q3 /14 and € 0.5 million for 9m /14) together with a financial result
reduced by this amount.
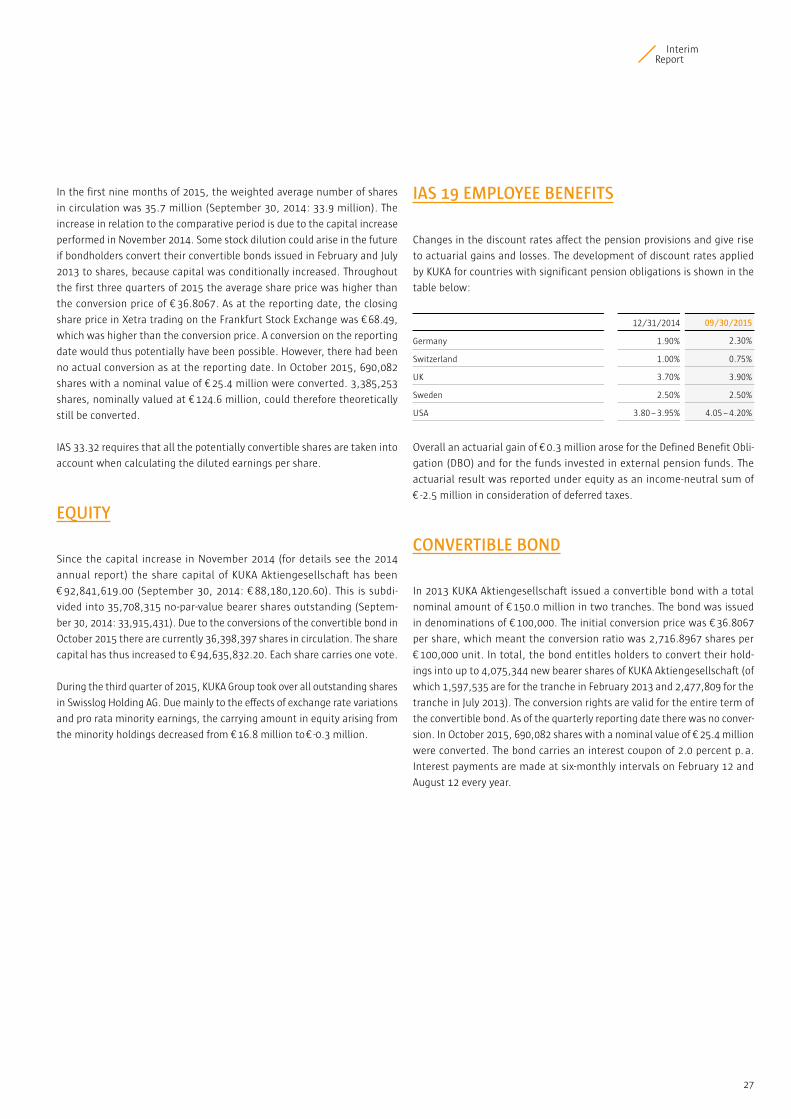
27
Interimreport
IAS 19 EMploYEE BENEFITS
Changes in the discount rates affect the pension provisions and give rise
to actuarial gains and losses. the development of discount rates applied
by KUKA for countries with significant pension obligations is shown in the
table below:
12 /31 /2014 09 /30 /2015
Germany 1.90% 2.30%
Switzerland 1.00% 0.75%
UK 3.70% 3.90%
Sweden 2.50% 2.50%
USA 3.80 – 3.95% 4.05 – 4.20%
overall an actuarial gain of € 0.3 million arose for the Defined Benefit obli-
gation (DBo) and for the funds invested in external pension funds. the
actuarial result was reported under equity as an income-neutral sum of
€ -2.5 million in consideration of deferred taxes.
coNVErTIBlE BoND
In 2013 KUKA Aktiengesellschaft issued a convertible bond with a total
nominal amount of € 150.0 million in two tranches. the bond was issued
in denominations of € 100,000. the initial conversion price was € 36.8067
per share, which meant the conversion ratio was 2,716.8967 shares per
€ 100,000 unit. In total, the bond entitles holders to convert their hold-
ings into up to 4,075,344 new bearer shares of KUKA Aktiengesellschaft (of
which 1,597,535 are for the tranche in February 2013 and 2,477,809 for the
tranche in July 2013). the conversion rights are valid for the entire term of
the convertible bond. As of the quarterly reporting date there was no conver-
sion. In october 2015, 690,082 shares with a nominal value of € 25.4 million
were converted. the bond carries an interest coupon of 2.0 percent p. a.
Interest payments are made at six-monthly intervals on February 12 and
August 12 every year.
In the first nine months of 2015, the weighted average number of shares
in circulation was 35.7 million (September 30, 2014: 33.9 million). the
increase in relation to the comparative period is due to the capital increase
performed in november 2014. Some stock dilution could arise in the future
if bondholders convert their convertible bonds issued in February and July
2013 to shares, because capital was conditionally increased. throughout
the first three quarters of 2015 the average share price was higher than
the conversion price of € 36.8067. As at the reporting date, the closing
share price in Xetra trading on the Frankfurt Stock exchange was € 68.49,
which was higher than the conversion price. A conversion on the reporting
date would thus potentially have been possible. However, there had been
no actual conversion as at the reporting date. In october 2015, 690,082
shares with a nominal value of € 25.4 million were converted. 3,385,253
shares, nominally valued at € 124.6 million, could therefore theoretically
still be converted.
IAS 33.32 requires that all the potentially convertible shares are taken into
account when calculating the diluted earnings per share.
EQUITY
Since the capital increase in november 2014 (for details see the 2014
annual report) the share capital of KUKA Aktiengesellschaft has been
€ 92,841,619.00 (September 30, 2014: € 88,180,120.60). this is subdi-
vided into 35,708,315 no-par-value bearer shares outstanding (Septem-
ber 30, 2014: 33,915,431). Due to the conversions of the convertible bond in
october 2015 there are currently 36,398,397 shares in circulation. the share
capital has thus increased to € 94,635,832.20. each share carries one vote.
During the third quarter of 2015, KUKA Group took over all outstanding shares
in Swisslog Holding AG. Due mainly to the effects of exchange rate variations
and pro rata minority earnings, the carrying amount in equity arising from
the minority holdings decreased from € 16.8 million to € -0.3 million.

28
KUKA AktiengesellschaftInterim report Q3 /2015
FINANcIAl INSTrUMENTS rEporTED AT FAIr MArKET VAlUE
IFrS 13 defines how to determine fair market value and expands on
disclosures related to the fair market value. the standard does not include
any requirements regarding the cases for which fair value is to be used.
Here, fair value is defined as the price that would be paid by independent
market participants in an arm’s length transaction at the evaluation date
if an asset were sold or a liability transferred. In accordance with IFrS 13,
assets and liabilities evaluated at market values are to be attributed to the
three levels of the fair value hierarchy. the three levels of the fair value
hierarchy are defined as follows:
level 1Quoted prices in active markets for identical assets or liabilities
level 2Inputs other than quoted prices that are observable either directly or
indirectly
level 3Inputs for assets and liabilities that are not based on observable market
data.
the following table shows the breakdown of the financial assets and
liabilities measured at fair value:
09 /30 /2015
in € millions level 1 level 2 level 3 Total
Financial assets 0.4 4.5 0.3 5.2
Financial liabilities – 6.5 – 6.5
12 /31 /2014
in € millions level 1 level 2 level 3 Total
Financial assets 0.3 0.8 0.2 1.3
Financial liabilities – 7.3 – 7.3
the financial assets of level 1 mainly relate to mixed fund units. the assets
in level 2 mainly relate to forward exchange transactions carried as assets or
liabilities. the value is determined with the aid of standard financial math-
ematical techniques, using current market parameters such as exchange
rates and counterparty credit ratings (mark-to-market method) or quoted
prices. middle rates are used for this calculation. the financial assets of
level 3 were measured using the discounted future cash flows from the
sale of a minority interest.
SYNDIcATED SENIor FAcIlITIES AGrEEMENT
KUKA AG prematurely refinanced the syndicated loan that it concluded in
December 2013, and at the same time redeemed the existing Swisslog Hold-
ing AG syndicated senior facilities agreement. the new contract was signed
on march 30, 2015 and came into force on April 2, 2015. this provides for
a surety and guarantee line in the amount of € 140.0 million and a work-
ing capital line, which can also be used for sureties and guarantees, in the
amount of € 90.0 million. this results in a volume € 70 million higher than
with the previous contract. In addition, structural contract adaptations have
been made. Both measures are attributable to the integration of Swisslog
Holding AG and its subsidiaries, which was acquired in December 2014.
the syndicated senior facilities agreement is unsecured and contains only
the customary equal treatment clauses and negative pledges. moreover,
it was possible to benefit from the improved market situation to obtain
significantly improved terms, so that for instance the gearing (ratio of net
financial liabilities to equity) is no longer part of the financial covenant.
thus all that remains is a lower limit to the interest coverage ratio (ratio of
eBItDA to net interest expense) and an upper limit to the leverage (ratio of
net financial liabilities to eBItDA). During the integration of Swisslog, the
consortium of banks was expanded to include the consortium banks from
the old contract with Swisslog Holding AG.
As at the reporting date the utilization of the guarantee facility and cash
credit line from the syndicated senior facilities agreement of KUKA AG
amounted to a total of € 86.5 million (December 31, 2014: € 136.1 million,
including the former syndicated senior facilities agreement of Swisslog Hold-
ing AG). For further details about the redeemed syndicated senior facilities
agreements please refer to the company’s 2014 annual report.
lINES oF crEDIT FroM BANKS AND SUrETY coMpANIES
the guarantee facilities promised by banks and surety companies outside
the syndicated senior facilities agreement amounted at September 30, 2015
to an unchanged figure of € 89.0 million (December 31, 2014: € 89.0 mil-
lion) and were available to be utilized in full. As at the reporting date, the
amount exercised was € 41.2 million (December 31, 2014: € 41.2 million).
ASSET-BAcKED SEcUrITIES proGrAM
In June 2011, KUKA Group set up an ABS (Asset-Backed Securities) facility
with a volume of € 25.0 million. Under the terms of this facility, € 15.9 mil-
lion had been taken up by September 30, 2015, compared to € 3.1 million
by December 31, 2014.

29
Interimreport
rElATED pArTY DIScloSUrES
the list of related companies and persons has remained unchanged since
December 31, 2014. In the first nine months of the financial year, services
to the value of € 1.3 million were performed by related persons or compa-
nies, and services to the value of € 0.5 million were received by them. As
at the reporting date, the sums outstanding in relation to dealings with
related persons amounted to € 1.1 million for receivables and € 0.1 million
for liabilities. of these amounts, services performed to the value of € 0.8 mil-
lion and services received of € 0.3 million are attributable to Voith Group.
Services performed to the value of € 0.2 million and receivables amounting
to € 0.2 million are attributable to Yawei robot manufacturing, China. KUKA
has an obligation to inject further cash in the single-digit million range
between now and the end of 2016 depending on further developments
and the achievement of certain milestones in connection with the stake
the company holds in munich-based KBee AG.
EVENTS oF MATErIAl IMporTANcE AFTEr ThE END oF ThE rEporTING pErIoD
In october 2015 KUKA AG issued promissory notes for a total of € 250 million.
Due to significant oversubscription, the initial volume of € 150 million was
increased. the additional funds will be used to continue the growth strategy.
the overall volume of the loan was issued in two tranches with maturities
of five and seven years at a fixed interest rate averaging 1.35 percent.
In october 2015, creditors of the 2013 convertible bond made use of their
conversion right. Due to the conversion declaration, new shares were cre-
ated in accordance with the bond terms. through the issue of new shares,
the total number of KUKA shares has risen by 690,082, from 35,708,315
to 36,398,397. pursuant to section 200 of the German Stock Corporation
Act (AktG), the issue of new shares saw the company’s share capital rise by
€ 1,794,213.20, from € 92,841,619.00 to € 94,635,832.20.
Apart from this there have been no events subject to reporting requirements
that had an impact on the financial position and performance of the com-
pany since the balance sheet reporting date.
Augsburg, november 10, 2015
the executive Board
Dr. till reuter peter mohnen
All other financial instruments are reported at amortized cost. the market
values here reflect mainly the book values, with the exception of the con-
vertible bond. As at the reporting date, the market value of the convertible
bond was € 277.3 million versus € 246.5 million on December 31, 2014,
and the book value was € 140.2 million compared with € 138.0 million on
December 31, 2014.
ASSETS AND lIABIlITIES hElD For SAlE
the assets and liabilities held for sale at December 31, 2014 relate to the
sale of HlS Group. For further details please refer to the company’s 2014
annual report.
SEGMENT rEporTING
the internal reporting and organizational structure subdivides KUKA into
the KUKA robotics, KUKA Systems and Swisslog segments. Key financial
indicators are determined for all three segments. earnings before interest
and taxes (eBIt) are used as the key indicator with regard to managing
segment profits.
the main elements of the segment reports are contained in the manage-
ment report on the robotics, Systems and Swisslog operating divisions, as
well as in the tables at the beginning of the notes to this interim report.
cASh FloW STATEMENT
the cash flow statement shows changes to KUKA Group’s liquidity position in
accordance with IAS 7. this item comprises all funds recognized on the bal-
ance sheet as cash and cash equivalents; i. e. cash in hand, checks and cash
balances with financial institutions, provided that they are available within
three months. Cash and cash equivalents of € 3.8 million (December 31,
2014: € 2.4 million) were subject to availability restrictions. the increase
arose primarily in connection with a government-funded contract in Brazil.
coNTINGENT lIABIlITIES AND oThEr FINANcIAl coMMITMENTS
there has been no material change in other financial obligations and
contingent liabilities since December 31, 2014.

KUKA AktiengesellschaftInterim report Q3 /2015
pRELImInARY FIGURES FEBRUARY 17
AnnUAL AccOUntS pRESS cOnFEREncE mARcH 22
IntERIm REpORt FOR FIRSt QUARtER mAY 4
AnnUAL GEnERAL mEEtInG mAY 27
IntERIm REpORt FOR SEcOnD QUARtER AUGUSt 3
IntERIm REpORt FOR tHIRD QUARtER nOVEmBER 9
FINANCIAL CALENDAR 2016
this quarterly report was published on november 11, 2015 and is available in German and english.
In the event of doubt, the German version applies.
CONTACT AND IMPRINTKUKA Aktiengesellschaft Zugspitzstr. 140
86165 Augsburg
Deutschland
phone: +49 821 797-0
Fax: +49 821 797-5213
public relations phone: +49 821 797-3722
Fax: +49 821 797-5213
Investor relations phone: +49 821 797-5226
Fax: +49 821 797-5213
Design and realisation Whitepark GmbH & Co., Hamburg

www.KUKA.COM