interim report ro om - deutsche wohnen reports... · fair value of real estate properties1) eur m...
TRANSCRIPT

interim report as at 30 September 2011
togrow
roMo

Key figures 2 Interim management report 3 Interim financial statements 18 Financial calendar 30 Imprint 31
C
Con
ten
ts
1
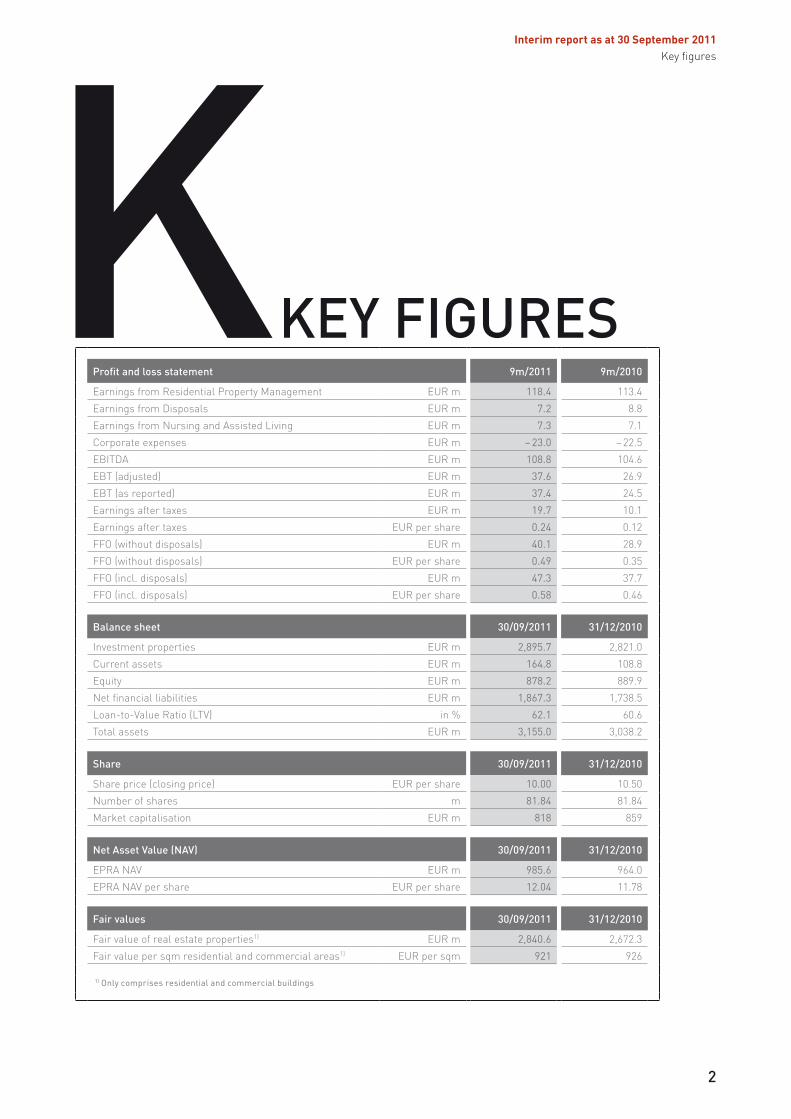
Profit and loss statement 9m/2011 9m/2010
Earnings from Residential Property Management EUR m 118.4 113.4
Earnings from Disposals EUR m 7.2 8.8
Earnings from Nursing and Assisted Living EUR m 7.3 7.1
Corporate expenses EUR m – 23.0 – 22.5
EBITDA EUR m 108.8 104.6
EBT (adjusted) EUR m 37.6 26.9
EBT (as reported) EUR m 37.4 24.5
Earnings after taxes EUR m 19.7 10.1
Earnings after taxes EUR per share 0.24 0.12
FFO (without disposals) EUR m 40.1 28.9
FFO (without disposals) EUR per share 0.49 0.35
FFO (incl. disposals) EUR m 47.3 37.7
FFO (incl. disposals) EUR per share 0.58 0.46
Balance sheet 30/09/2011 31/12/2010
Investment properties EUR m 2,895.7 2,821.0
Current assets EUR m 164.8 108.8
Equity EUR m 878.2 889.9
Net financial liabilities EUR m 1,867.3 1,738.5
Loan-to-Value Ratio (LTV) in % 62.1 60.6
Total assets EUR m 3,155.0 3,038.2
share 30/09/2011 31/12/2010
Share price (closing price) EUR per share 10.00 10.50
Number of shares m 81.84 81.84
Market capitalisation EUR m 818 859
net Asset Value (nAV) 30/09/2011 31/12/2010
EPRA NAV EUR m 985.6 964.0
EPRA NAV per share EUR per share 12.04 11.78
Fair values 30/09/2011 31/12/2010
Fair value of real estate properties1) EUR m 2,840.6 2,672.3
Fair value per sqm residential and commercial areas1) EUR per sqm 921 926
1) Only comprises residential and commercial buildings
Key FIguresK
2
Interim report as at 30 September 2011Key figures

Overview
Deutsche Wohnen continued to perform strongly in the third quarter of 2011 and can thus easily pick up on the successful development of the first six months of the fiscal year.
Operational development (compared with the equivalent reporting period of the previous year, 9 months)
• Increase in the in-place rent per sqm in the letting portfolio of the core regions on a comparable basis (like-for-like) by monthly EUR 0.19 per sqm or 3.4 % to EUR 5.64 per sqm
• Increase in the in-place rent per sqm in the letting portfolio of Greater Berlin (like-for-like) by monthly EUR 0.22 or 4.2 % to EUR 5.51 per sqm
• Reduction in the vacancy rate from 2.5 % to 1.7 % (like-for-like: from 2.5 % to 1.7 %) in the letting port-folio of the core regions
• Notarised disposals volume of 2,655 residential units, thereof 1,025 units through privatisation with a gross margin of 33 %
• Reduction of current interest expenses by 7.3 % to EUR 59.8 million
Earnings (compared with equivalent reporting period of previous year, 9 months)
• Increase in the profit for the period by EUR 9.6 to EUR 19.7 million
• Increase in adjusted earnings before taxes by EUR 10.7 million or 40 % to EUR 37.6 million
• Improvement in the recurring FFO (without disposals) per share by 40 % from EUR 0.35 to EUR 0.49 per share
• Increase in the EPRA NAV compared to 31 December 2010 by around 2.2 % or EUR 0.26 per share to EUR 12.04 per share
• Increase in Loan-to-Value Ratio (LTV) to 62.1 % due to acquisitions and thus within our current range of up to 65 %
Sustainable value-creating growth through selective acquisitions in our core regions• Since July 2010, Deutsche Wohnen has bought nearly
8,000 residential units solely in growth regions, of which almost 6,000 are in Berlin and a further 1,160 in Dusseldorf. Deutsche Wohnen has therewith opened up a new metropolitan region.
• From the approximately 8,000 residential units, the transfer of risks and rewards for around 2,300 apart-ments will take place in the fourth quarter 2011 and respectively on 1 January 2012.
Interim management report
3
Interim management reportOverview

The following table gives an overview of important key figures of acquisitions taken place, based on the busi-ness plans and underlying assumptions.
Acquisitions 2010 and 2011
region Berlin Letting
Berlin Privati -
sation
rhine- Main
rhine Valley south
rhine Valley north
total
Portfolio Total units 4,145 1,867 466 350 1,160 7,988
thereof residential units 4,128 1,858 457 334 1,160 7,937
Total area (sqm) 236,592 110,825 24,713 23,557 72,423 468,110
Gross asset value (in EUR m) 204.8 75.5 25.8 18.7 82.6 407.4
Gross asset value (in EUR/sqm) 866 681 1,044 794 1,141 870
Actual vacancy (%) 2.4 5.9 2.5 4.1 1.3 3.1
rent
Actual in-place rent (EUR/sqm/month) 4.98 5.15 6.66 4.96 5.89 5.25
Estimated potential rent (EUR/sqm/month)1) 6.22 5.16 7.86 5.76 6.87 6.13
Rent potential 25 0 18 16 17 17
Average sales price (EUR/sqm) 974 974
Gross margin (%)2) 43 43
KPIs
Net initial yield (%)3) 6.9 8.6 7.8 7.5 6.3 7.2
FFO without disposals pre-tax (EUR m) 6.6 2.9 0.9 0.6 2.0 13.0
per sqm 27.9 26.2 36.4 25.5 27.6 27.8
pre-tax FFO incremental contribution yield (%)4) 8.1 9.6 8.7 8.0 6.1 8.0
FFO from disposal pre-tax 2.0 2.0
Total FFO pre-tax 6.6 4.9 0.9 0.6 2.0 15.0
per share (based on 81.84 million) 0.08 0.06 0.01 0.01 0.02 0.181) Companies estimate2) Average sales price (in EUR/sqm) divided by gross asset value (in EUR/sqm)3) Current gross rental income divided by gross asset value4) FFO without disposals pre-tax divided by assumed equity portion based on a LTV of 60 %
Interim management report
4
Overview
Portfolio
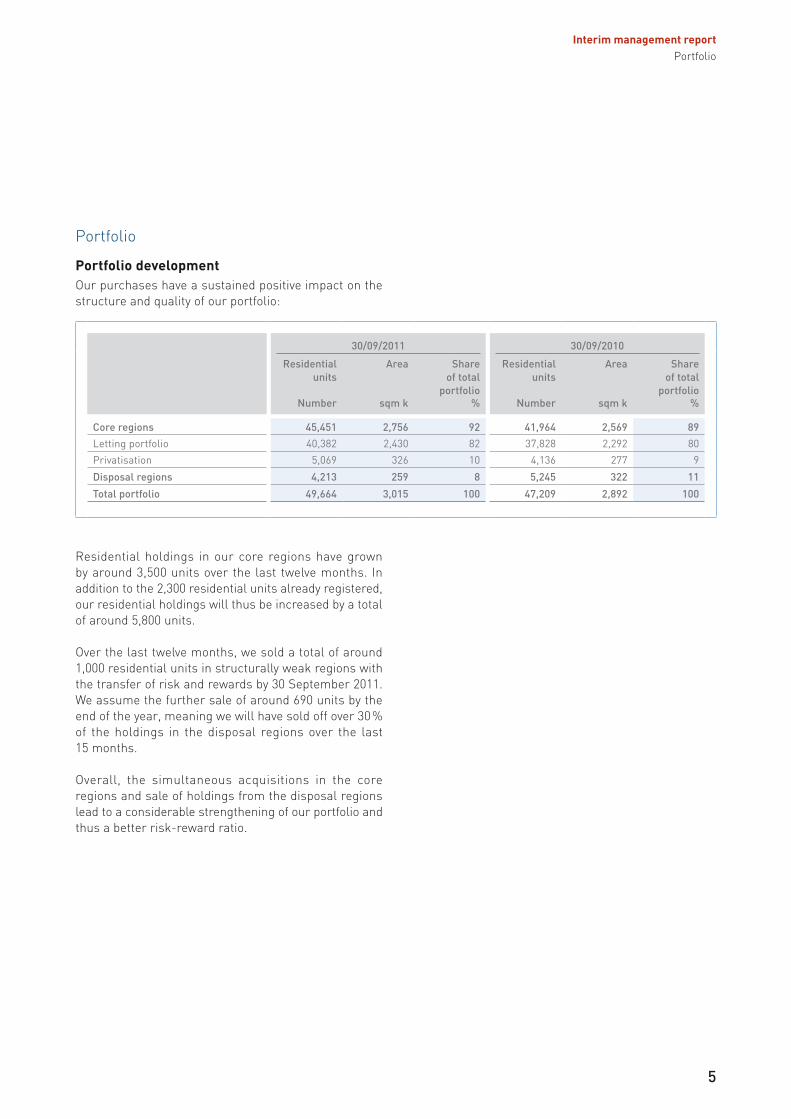
Portfolio developmentOur purchases have a sustained positive impact on the structure and quality of our portfolio:
30/09/2011 30/09/2010
residentialunits
Area
share of total
portfolio
residentialunits
Area
share of total
portfolionumber sqm k % number sqm k %
Core regions 45,451 2,756 92 41,964 2,569 89Letting portfolio 40,382 2,430 82 37,828 2,292 80
Privatisation 5,069 326 10 4,136 277 9
Disposal regions 4,213 259 8 5,245 322 11
total portfolio 49,664 3,015 100 47,209 2,892 100
Residential holdings in our core regions have grown by around 3,500 units over the last twelve months. In addition to the 2,300 residential units already registered, our residential holdings will thus be increased by a total of around 5,800 units.
Over the last twelve months, we sold a total of around 1,000 residential units in structurally weak regions with the transfer of risk and rewards by 30 September 2011. We assume the further sale of around 690 units by the end of the year, meaning we will have sold off over 30 % of the holdings in the disposal regions over the last 15 months.
Overall, the simultaneous acquisitions in the core regions and sale of holdings from the disposal regions lead to a considerable strengthening of our portfolio and thus a better risk-reward ratio.
Interim management report
5
Portfolio

Core regions
The following table shows the portfolio structure in the core regions as at 30 September 2011:
residential units Area
share of total portfolio
In-place rent1) Vacancy rate
number sqm k % eur/sqm %
Core regions 45,451 2,756 92 5.59 2.3Letting portfolio 40,382 2,430 82 5.59 1.7
Privatisation 5,069 326 10 5.58 6.8
Greater Berlin 27,817 1,661 56 5.42 1.8
Letting portfolio 24,564 1,456 49 5.44 1.3
Privatisation 3,253 205 7 5.26 5.7
Frankfurt/Main 4,158 252 8 6.96 2.0
Letting portfolio 3,544 208 7 7.07 0.9
Privatisation 614 44 1 6.37 7.6
Rhine-Main 4,676 282 9 6.16 4.6
Letting portfolio 4,169 249 8 6.10 4.2
Privatisation 507 33 1 6.64 7.0
Rhine Valley South 4,837 304 10 5.31 2.9
Letting portfolio 4,408 276 9 5.30 2.0
Privatisation 429 27 1 5.45 11.3
Rhine Valley North 3,217 207 6 5.08 2.5
Letting portfolio 2,951 190 6 5.04 1.8
Privatisation 266 17 1 5.52 10.4
Other (letting only) 746 51 2 5.03 4.3
1) Contractually owed rent from rented apartments divided by rented area
With around 73 % share of the portfolio (including priva-tisation holdings), Berlin, as well as Frankfurt/Main and the Rhine-Main region have overriding importance for Deutsche Wohnen.
split within the core regions
Greater Berlin = 61 %
Frankfurt/Main = 9 %
Rhine-Main = 10 %
Rhine Valley South = 11 %
Rhine Valley North = 7 %
Other = 2 %
in %
Interim management report
6
Portfolio

The ongoing, demand-based momentum in our letting markets clearly shows a positive impact on current gross rental income and new-lettings rent:
like-for-like comparison
In-place rent1) eur/sqm
30/09/2011 30/09/2010 %
Letting portfolio in the core regions 5.64 5.45 3.4Greater Berlin 5.51 5.29 4.2
Frankfurt/Main 7.07 6.90 2.5
Rhine-Main 6.06 5.91 2.5
Rhine Valley South 5.30 5.17 2.5
Rhine Valley North 5.04 4.94 2.1
Other 5.03 4.95 1.61) Contractually owed rent from rented apartments divided by rented area
In our core regions, we increased the in-place rent of our units, which were in our holding from 30 September 2010 to 30 September 2011 (like-for-like), by EUR 0.19 or 3.4 % to EUR 5.64 per sqm. In Greater Berlin, which constitutes over half of our total holdings, we even managed to increase in-place rents by 4.2 %.
The new-lettings rent achieved in the non-rent restric-ted units in 2011 were around 20 % above the current gross rental income of the reporting date.
We also improved the vacancy rate in the letting port-folio like-for-like again from 2.5 % to 1.7 %.
Compared to the previous year, the volume of trans-actions in privatisations was increased significantly by 35 %. Here, the disposal ratio in the homeowners’ associations is around 77 %.
rent potentials1) from the letting portfolio in the core regions
in %
core regions average of the core regions 1) Rent potential: New-letting rent (i.e. contractually owed rent for newly
concluded contracts for units not subject to rent control effective in 2011) compared to in-place rent
30
25
20
15
10
5
0Rhine- Main
Frankfurt/ Main
Greater Berlin
Rhine Valley South
OtherRhine Valley North
24.5
17.5
12.5
4.4
11.2
20.4 20.4
Interim management report
7
Portfolio

Disposal regionsThe following table shows details of our portfolio in the disposal regions:
residential units Area
share of total portfolio
In-place rent1) Vacancy rate
number sqm k % eur/sqm %
Disposal regions 4,213 259 8 4.62 10.8Adjustment portfolio 1,990 121 4 4.36 17.2
Other disposal holdings 2,223 138 4 4.81 5.8
1) Contractually owed rent from rented apartments divided by rented area
We have identified as disposal regions those markets which are stagnating in their development or are even developing negatively. In particular, the rate of disposals of properties which are to be sold in the context of portfolio adjustments is to be speeded up because of structural risks. The remaining portfolio available for disposal shows significantly better key figures. These properties are also to be sold, however, for portfolio strategy reasons.
PortfolioInterim management report
8

Business development of the segments
The business activities of Deutsche Wohnen comprise the following areas: the letting and management of our own holdings (earnings from Residential Property Management), the disposal of apartments to owner-occupiers and institutional investors (earnings from Disposals) and the management of residential nursing facilities and residential care homes (earnings from Nursing and Assisted Living).
The overview shows the segment earnings in compari-son to the first nine months of the fiscal year 2010:
in eur m 9m/2011 9m/2010
Earnings from Residential Property Management 118.4 113.4
Earnings from Disposals 7.2 8.8
Earnings from Nursing and Assisted Living 7.3 7.1
Contribution margin of segments 132.9 129.3
Corporate expenses – 23.0 – 22.5
Other operating expenses/ income – 1.1 – 2.2
operating result 108.8 104.6
Residential Property Management segment
The focus of our business activity lies in the manage-ment and development of our own portfolio. This is where we have specific know-how. The markets we serve are, in our view, in the long run primarily letting markets. Disposals are made in accordance with our strategic direction – to develop the portfolio or if appro-priate market opportunities present themselves.
The operating result (Net Operating Income – NOI) was increased in comparison to the equivalent period of the previous year by 5.6 % to EUR 3.94 per sqm and month.
in eur m 9m/2011 9m/2010
Current gross rental income 144.7 143.1Non-recoverable expenses – 4.4 – 4.7
Rental loss – 1.2 – 1.6
Maintenance – 20.1 – 21.8
Other – 0.6 – 1.6
Contribution margin 118.4 113.4Staff and general and administration expenses
– 12.2
– 12.0
operating result (net operating Income – noI)
106.2
101.4
NOI margin in % 73.4 70.9
NOI in EUR per sqm and month1)
3.94
3.73
Increase in % 5.6 1) Taking account of the average areas on a quarterly basis
in the relevant reporting period
The increase of the current gross rental income is attri-butable to the continued reduction in the vacancy rate and also to acquisitions.
The average in-place rent for residential units which we managed over the last twelve months (like-for-like) in the letting portfolio of our core regions was EUR 5.64 per sqm as at the reporting date. This represents an increase in comparison to the figure for the equivalent reporting period of the previous year (EUR 5.45 per sqm) of 3.4 %.
We were also able to improve the vacancy rate in the letting portfolio once again in a like-for-like comparison from 2.5 % to 1.7 %.
4,171 new tenancy agreements were signed in the entire portfolio in the first three quarters of 2011, of these, 2,823 were in the non-rent restricted letting portfolio of the core regions with an average monthly new-letting rent of EUR 6.73 per sqm. The new-letting is thus monthly around EUR 1.14 per sqm or 20.4 % above the related in-place rent.
At around 10 %, the annual fluctuation rate projected on the whole year remains nearly constant. Overall, 135 apartments (0.3 % of the holdings in the core regions) have a vacancy rate of more than twelve months.
Business development of the segmentsInterim management report
9

In the first nine months of 2011 a total of EUR 37.5 mil-lion (EUR 12.44 per sqm) was invested in maintenance and value enhancing investments (modernisations). The figure for the equivalent period of the previous year was EUR 41.7 million or EUR 13.81 per sqm.
After current interest expenses the cash flow from the portfolio has improved significantly and sustainably by EUR 9.5 million or 24 %. This is because we were able to improve the earnings from lettings whilst reducing interest charges.
in eur m 9m/2011 9m/2010
NOI from lettings 106.2 101.4
Current interest expenses (without Nursing and Assisted Living) – 57.8 – 62.4
Cash flow from portfolio after current interest expenses 48.4 39.0
Interest ratio 1.84 1.63
Disposals segment
In the fiscal year 2011, Deutsche Wohnen is focusing on individual privatisations and portfolio adjustments in structurally weak regions.
The following table shows the notarised contracts as at 30 September 2011 with the transfer of risks and rewards in 2011:
units transactionVolume
Fair Value Margin
number eur m eur m eur m
in %
Privatisations 1,025 75.9 57.0 18.9 33
Bloc sales 1,630 57.7 58.4 – 0.7 – 1
total 2,655 133.6 115.4 18.2 16
With privatisations we were able to increase the sales volume in comparison to the equivalent period of the previous year from EUR 56.1 million to EUR 75.9 million (+35 %) with almost the same margin (33 %).
In comparison to the equivalent period of the previous year, the volume of bloc sales declined by EUR 44.6 mil-lion in 2011, as we mainly focused on the adjustment of structurally weak regions.
As at the reporting date, 30 September 2011, 1,791 of the 2,655 residential units with a sales volume of EUR 85.7 million were recorded on the balance sheet on account of the transfer of risks and rewards.
Interim management report
10
Business development of the segments

Nursing and Assisted Living segment
The Nursing and Assisted Living segment comprises mainly the operational management of high-quality residential nursing properties and residential homes for senior citizens. All the facilities comply with the require-ments for age-appropriate living and are recognised as residential care facilities in accordance with §§ 11 and 12 of the statutory regulations governing nursing and other homes (Heimgesetz). The properties are located in the five federal states of Berlin, Brandenburg, Saxony, Lower Saxony and Rhineland-Palatinate.
in eur m 9m/2011 9m/2010
Income
Nursing 25.3 24.9
Living 2.2 2.4
Other 3.0 2.8
30.5 30.1
Costs Nursing and administrative costs – 8.5 – 8.4
Staff expenses – 14.7 – 14.6
– 23.2 – 23.0
segment earnings 7.3 7.1
Attributable current interest – 2.0 – 2.1
5.3 5.0
In the first nine months of the fiscal year 2011 segment earnings (earnings before interest, taxes, depreciation and amortisation) of EUR 7.3 million were achieved (same period of the previous year: EUR 7.1 million). This is particularly attributable to an increased occupancy rate, which increased from 93.8 % to 94.6 %. The occu-pancy rate as at the current reporting date is 95.2 %.
Corporate expenses
The corporate expenses include staff and general and administration expenses (excluding the Nursing and Assisted Living segment) and are broken down as follows:
in eur m 9m/2011 9m/2010
Property Management (Deutsche Wohnen Management GmbH) – 12.2 – 12.0
Asset Management/Disposals (Deutsche Wohnen Corporate Real Estate GmbH) – 2.3 – 2.6
Holding company function (Deutsche Wohnen AG) – 8.5 – 7.9
total – 23.0 – 22.5
The personnel policy of Deutsche Wohnen is committed to sustainable staff development and a fair, performance-related remuneration system. Overall, the base salary for all staff (excluding senior managers) was increased as at 1 April 2011 by 3 %. The annual salaries of the trainees (from the start of the new training year: 32 trainees) were increased at the beginning of the year by 9 %.1)
1) All data excludes the Nursing and Assisted Living segment
Interim management report
11
Business development of the segments

Notes on financial performance and financial position
Financial performance
in eur m 9m/2011 9m/2010
Revenue 226.3 224.8
Gains/losses from disposals before costs1) 12.6 13.2
Expenses for purchased goods and services – 89.7 – 92.3
Staff expenses including Nursing and Assisted Living – 28.7 – 27.9
Other operating expenses/ income – 11.7 – 13.2
operating result 108.8 104.6Depreciation and amortisation – 2.5 – 2.4
Financial result – 68.9 – 77.7
Profit/loss before taxes 37.4 24.5Current taxes – 2.1 – 2.8
Deferred taxes – 15.6 – 11.6
Profit/loss for the period 19.7 10.1
1) Not including cost of sales of EUR 5.4 million in 2011 (2010: EUR 4.4 million)
In the first nine months of 2011 we succeeded in increa-sing the profit for the period by EUR 9.6 million in comparison to the same period of the previous year, and the adjusted profit before taxes even rose by EUR 10.7 million. Very good performance in the area of letting with a very low vacancy rate, a constant exploitation of opportunities to optimise rents, and sustainable and efficient management and maintenance, was the found-ation for this successful development. Furthermore, the acquisitions and lower interest charges, thanks to the improved financing structure, made a significant con-tribution to this result.
We have set out in detail our notes on the development of the EBITDA with reference to the segments under the heading “Business development of the segments” on pages 9f.
The financial result is made up as follows:
in eur m 9m/2011 9m/2010
Current interest expenses – 59.8 – 64.5
Accrued interest on liabilities and pensions – 9.3 – 11.2
Fair value adjustments of derivative financial instruments – 0.2 – 2.4
– 69.3 – 78.1
Interest income 0.4 0.4
Financial result – 68.9 – 77.7
Through the reduction of the hedging ratio which is presently around 75 %, at the end of 2010 (on the reporting date of the pre vious year: approx. 95 %), we profited in our interest expenses from the current low interest rate. Thus, the average interest rate is currently around 4.08 % compared to 4.42 % at 30 September 2010.
The accrued interest on liabilities and pensions has decreased mainly due to repayments at EK-02 and the liabilities to limited partners in funds.
The result before income taxes – adjusted for valuation and special effects – were made up as follows:
in eur m 9m/2011 9m/2010
earnings before taxes 37.4 24.5Gains/losses from fair value adjustments of derivative financial instruments 0.2 2.4
Adjusted earnings before taxes 37.6 26.9
Interim management report
12
Notes on financial performance and financial position
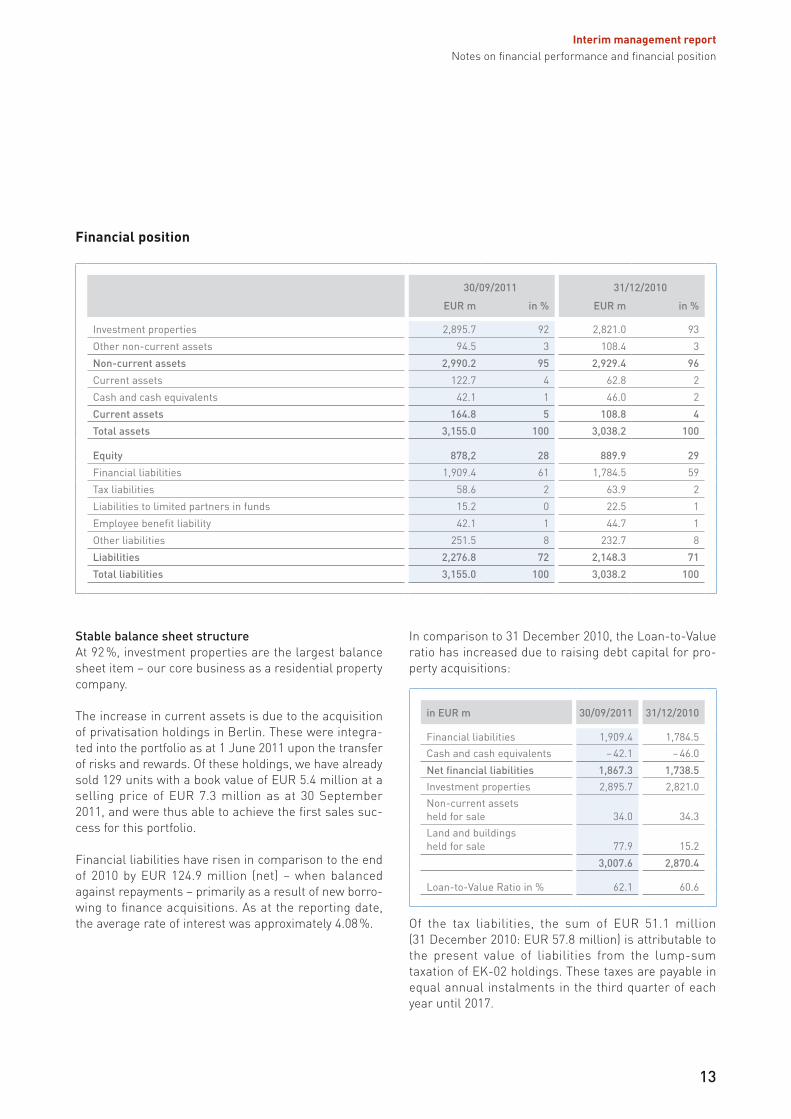
Financial position
30/09/2011 31/12/2010
eur m in % eur m in %
Investment properties 2,895.7 92 2,821.0 93
Other non-current assets 94.5 3 108.4 3
non-current assets 2,990.2 95 2,929.4 96
Current assets 122.7 4 62.8 2
Cash and cash equivalents 42.1 1 46.0 2
Current assets 164.8 5 108.8 4
total assets 3,155.0 100 3,038.2 100
equity 878,2 28 889.9 29
Financial liabilities 1,909.4 61 1,784.5 59
Tax liabilities 58.6 2 63.9 2
Liabilities to limited partners in funds 15.2 0 22.5 1
Employee benefit liability 42.1 1 44.7 1
Other liabilities 251.5 8 232.7 8
Liabilities 2,276.8 72 2,148.3 71
total liabilities 3,155.0 100 3,038.2 100
stable balance sheet structureAt 92 %, investment properties are the largest balance sheet item – our core business as a residential property company.
The increase in current assets is due to the acquisition of privatisation holdings in Berlin. These were integra-ted into the portfolio as at 1 June 2011 upon the transfer of risks and rewards. Of these holdings, we have already sold 129 units with a book value of EUR 5.4 million at a selling price of EUR 7.3 million as at 30 September 2011, and were thus able to achieve the first sales suc-cess for this portfolio.
Financial liabilities have risen in comparison to the end of 2010 by EUR 124.9 million (net) – when balanced against repayments – primarily as a result of new borro-wing to finance acquisitions. As at the reporting date, the average rate of interest was approximately 4.08 %.
In comparison to 31 December 2010, the Loan-to-Value ratio has increased due to raising debt capital for pro-perty acquisitions:
in eur m 30/09/2011 31/12/2010
Financial liabilities 1,909.4 1,784.5
Cash and cash equivalents – 42.1 – 46.0
net financial liabilities 1,867.3 1,738.5Investment properties 2,895.7 2,821.0
Non-current assets held for sale 34.0 34.3
Land and buildings held for sale 77.9 15.2
3,007.6 2,870.4
Loan-to-Value Ratio in % 62.1 60.6
Of the tax liabilities, the sum of EUR 51.1 million (31 December 2010: EUR 57.8 million) is attributable to the present value of liabilities from the lump-sum taxation of EK-02 holdings. These taxes are payable in equal annual instalments in the third quarter of each year until 2017.
Interim management report
13
Notes on financial performance and financial position

The liabilities to limited partners in funds have been reduced as a result of the payments made for the DB 14 shares which were acquired in 2009 and 2010. As at the reporting date Deutsche Wohnen held approximately 84 % of the shares in DB 14. As at 30 June 2011 a further 9 % of the shares had been acquired, and they will be transfer red by 31 December 2011. As a result, Deutsche Wohnen will own approximately 93 % of the shares in the DB 14 by the end of the year.
The other liabilities consist of the following items:
in eur m 30/09/2011 31/12/2010
Derivative financial instruments 85.6 70.3
Deferred tax liabilities 96.2 92.0
Miscellaneous 69.7 70.4
total 251.5 232.7
The change in other liabilities is mainly attributable to the increase in derivative financial instruments (interest rate swaps) which is linked to market valuation. The interest rate swaps serve to hedge interest rate risks. Because the interest rate level has fallen in comparison to 31 December 2010, negative market values have been increased.
The cash flows of the Group are made up as follows:
in eur m 9m/2011 9m/2010
Net cash flows from operating activities before EK-02 payments 36.6 24.4
EK-02 payments – 8.5 – 23.8
Net cash flows from investing activities – 133.1 121.1
Net cash flows from financing activities 101.1 – 113.6
net change in cash and cash equivalents – 3.9 8.1
Opening balance cash and cash equivalents 46.0 57.1
Closing balance cash and cash equivalents 42.1 65.2
Cash flows from operating activities have improved due to the increased net profit before tax and interest as well as lower interest payments.
The EK-02 payments in 2011 are the instalments of EUR 9.6 million which are payable every third quarter until 2017, of which the tax authorities responsible ret-rieved EUR 1.1 million at the beginning of October 2011. Furthermore, in the same period of the previous year, payments of EUR 15.2 million for previous periods, which were only payable upon receipt of the tax assess-ments, were included.
Cash flows from investment activities of the first nine months of 2011 include EUR 90.6 million cash from dis-posals in the form of purchase prices and deposits for residential units. In contrast, EUR 216.4 million was spent mainly on investments and acquisitions.
Cash flows from financing activities contain inflows in the amount of EUR 117.5 million arising from an increase in financial liabilities. This sum is the balance of repayments at EUR 469.6 million and new borrowing in an amount of EUR 587.1 million. Included in this is the refinancing of a portfolio in the amount of approx. EUR 400 million. This refinancing measure was completed before 31 December 2010 and executed in January 2011. In the second quarter of 2011, the dividend of EUR 16.4 million, which had been agreed by the Annual General Meeting for the financial year 2010, was paid out.
In addition to cash and cash equivalents of EUR 42.1 million the Group has access to credit facilities from banks in the amount of EUR 60.4 million as at reporting date.
Interim management report
14
Notes on financial performance and financial position

Once again it was possible to increase Funds from Operations (FFO) in comparison to the equivalent period of the previous year:
in eur m 9m/2011 9m/2010
Profit/loss for the period 19.7 10.1
Earnings from Disposals – 7.2 – 8.8
Depreciation and amortisation 2.5 2.4
Fair value adjustments of derivative financial instruments 0.2 2.4
Non-cash financial expenses 9.3 11.2
Deferred taxes 15.6 11.6
FFo (without disposals) 40.1 28.9
FFO (without disposals) per share in EUR 0.49 0.35
FFO (incl. disposals) 47.3 37.7
FFO (incl. disposals) per share in EUR 0.58 0.46
The recurringly generated FFO (without disposals) has increased in a year-on-year comparison by 40.0 % from EUR 0.35 per share to EUR 0.49 per share.
ePrA net Asset Value (ePrA nAV)Due to the profit for the period, the equity and therefore the EPRA NAV have increased:
in eur m 30/09/2011 31/12/2010
Equity (before non-controlling interest) 877.9 889.6
Diluted NAV 877.9 889.6
Fair values of derivative financial instruments 85.6 61.1
Deferred taxes (net) 22.1 13.3
ePrA nAV 985.6 964.0
Number of shares (in m) 81.84 81.84
ePrA nAV in eur per share 12.04 11.78
The equity as at 30 September 2011 was reduced by the dividend of EUR 16.4 million, which was paid out in the second quarter of 2011.
Stock market and the Deutsche Wohnen share
Economic situation and financial markets
To a large degree, the first nine months of 2011 were particularly volatile for the financial markets:
After the economic situation in Germany had a GDP growth rate (price adjusted) of 5.0 %, which was the greatest increase since the reunification of Germany, in the second quarter it was still at +2.8 % (price adjusted).1) While the ifo business climate index rose in the first months of the year, it has levelled off since spring and fallen since the summer. In a joint forecast of leading economic research institutes in the autumn of 2011, GDP is expected to increase by 2.9 % this year and by 0.8 % next year.2) Economic growth will thereby level off in the coming years, but will not come to a standstill so a crash in a recession is not imminent.
While the major stock market indices still showed gains at the end of the first half of 2011 compared to the beginning of the year, attention was increasingly turned to the high sovereign debt of many advanced industrial nations in the summer of 2011. The sovereign debt crisis in Europe and the debate about the debt ceiling in the U.S. consequently became noticeable to the equity mar-kets through increased uncertainty and sharply falling prices. Listings on the financial markets fell during the further course of summer within a few days, partly by 20 % and reached levels of the crisis year 2009. From late July to early August, the DAX declined on eleven consecutive days. At the end of the third quarter, the DAX was at around 5,500 points, which is a loss of over 20 % compared to the beginning of the year. The MDAX, where the Deutsche Wohnen share is listed, also closed the first nine months of 2011 with a stock market loss of around 18 %.
1) Federal Statistical Office Germany, Press Release No. 3142) Joint diagnosis of autumn 2011 from the Institute of Economic
Research, Halle, ifo Institute, Munich, Institute for the World Economy, Kiel, Rhine-Westphalia Institute for Economic Research, Essen
Interim management report
15
Notes on financial performance and financial positionStock market and the Deutsche Wohnen share

120
110
100
90
80
70
share price performance 9m/2011
in %
Deutsche Wohnen AG EPRA Europe EPRA Germany MDAX60
80
100
120
01/01/2011 01/02/2011 01/05/2011 01/06/2011 30/09/201101/03/2011 01/04/2011 01/07/2011 01/08/2011 01/09/2011
Key share figures 9m/2011 9m/2010
Number of shares outstanding in m 81.84 81.84
Share price as at end of nine months1) in EUR 10.00 8.73
Market capitalisation in EUR m 818 714
Highest share price during nine months1) in EUR 12.00 8.73
Lowest share price during nine months1) in EUR 9.33 6.13
Average daily turnover2) 231,812 133,6101) Xetra closing price2) Xetra daily turnover (traded shares)
Market capitalisation of the company, at EUR 818 mil-lion, was around EUR 100 million higher than the same reporting period of the previous year. During the same
The Deutsche Wohnen AG share
Although the Deutsche Wohnen share could not escape the macroeconomic factors and sharp downward move-ments of financial markets in the first nine months, with a comparatively small loss of 4.8 % (compared to the beginning of the year with a closing price of EUR 10.00
as at 30 September 2011) it has performed significantly better than the benchmark indices DAX, MDAX, EPRA Europe and EPRA Germany. Compared to the closing price as at 30 September 2010, the share even increased by almost 15 %.
The comparatively good performance of the share is firstly based on the robustness of the asset class of resi-dential property in German metropolitan regions, even in
economically unfavourable conditions, and secondly on the overall positive view of our company, also from the perspective of the capital market.
period, the average daily turnover in traded shares increased significantly to 231,812 shares and was 73 % higher than the same period of 2010.
Interim management report
16
Stock market and the Deutsche Wohnen share

Analyst coverage
The share of Deutsche Wohnen is still followed by 20 analysts; and is rated very positively by the majority. The target prices of the analysts are between EUR 9.20 and EUR 13.00.
In the following table you can see an overview of the current ratings1) of the 20 analysts.
rating number2)
Buy/Add/Overweight 12
Neutral/Hold 5
Underweight/Sell/Underperform 3
1) Status: 4 November 20112) Analyst ratings as at 4 November 2011
Investor Relations activities
We have continued our work in Investor Relations to sup-port an objective and appropriate valuation of the share. Our aim is to promptly and regularly report on the com-pany, market potential and strategy, and to maintain an intensive contact to our existing and future shareholders. For this purpose, we held a great number of one-on-one meetings in the third quarter of 2011. We participated in several national and international investor conferences, and we also met investors in person on-site at road-shows. In the first nine months of 2011 we took part in roadshows in London, New York, Boston, Munich, Dusseldorf, Cologne, Vienna and Milan. In addition, the Management Board presented at two conferences in Frankfurt, three in London and one each in Amsterdam, New York and Munich. We will continue to be in the intensive dialogue with our investors in the future.
Events after the reporting date
Significant events occurring after the reporting date are not known.
Risk report
With regard to the risks which exist for future business development we refer you to the information presented in the risk report in the consolidated financial state-ments as at 31 December 2010.
Forecast
At year-end we will achieve a FFO (without disposals) of at least EUR 45 million (EUR 0.55 per share). This represents an increase of a minimum of approx. 37 % compared to the previous year (EUR 0.40 per share).
There will be a lower FFO contribution from disposals compared to the previous year despite a higher gross margin. In 2011 the focus is on streamlining structurally weak regions in order to further improve the quality of our portfolio.
Interim management report
17
Stock market and the Deutsche Wohnen shareEvents after the reporting date
Risk reportForecast

CONSOLIDATED bALANCE ShEET 19
CONSOLIDATED PROFIT AND LOSS STATEMENT 21
CONSOLIDATED STATEMENT OF COMPREhENSIvE INCOME 22
CONSOLIDATED STATEMENT OF CASh FLOWS 23
CONSOLIDATED STATEMENT OF ChANGES IN EquITy 24
APPENDIx 25
as at 30 September 2011
InterIMFInAnCIALstAteMents
IFs
18
19
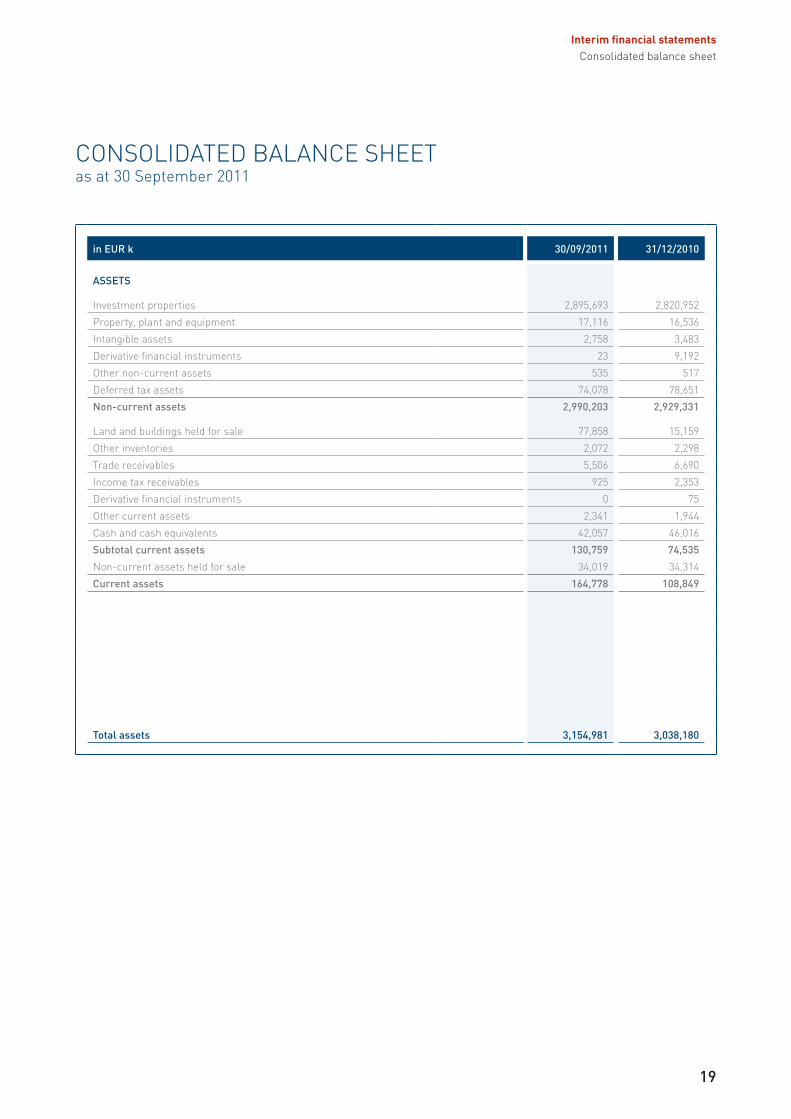
CONSOLIDATED BALANCE SHEETas at 30 September 2011
in eur k 30/09/2011 31/12/2010
Assets
Investment properties 2,895,693 2,820,952
Property, plant and equipment 17,116 16,536
Intangible assets 2,758 3,483
Derivative financial instruments 23 9,192
Other non-current assets 535 517
Deferred tax assets 74,078 78,651
non-current assets 2,990,203 2,929,331
Land and buildings held for sale 77,858 15,159
Other inventories 2,072 2,298
Trade receivables 5,506 6,690
Income tax receivables 925 2,353
Derivative financial instruments 0 75
Other current assets 2,341 1,944
Cash and cash equivalents 42,057 46,016
subtotal current assets 130,759 74,535
Non-current assets held for sale 34,019 34,314
Current assets 164,778 108,849
total assets 3,154,981 3,038,180
Consolidated balance sheetInterim financial statements

in eur k 30/09/2011 31/12/2010
eQuIty AnD LIABILItIes
Equity attributable to shareholders of the parent company
Issued share capital 81,840 81,840
Capital reserve 370,048 370,048
Retained earnings 426,010 437,682
877,898 889,570
Non-controlling interests 302 302
total equity 878,200 889,872
Non-current financial liabilities 1,816,985 1,338,954
Employee benefit liability 42,105 44,747
Liabilities to limited partners in funds 0 476
Tax liabilities 40,799 48,496
Derivative financial instruments 60,967 43,922
Other provisions 8,775 9,789
Deferred tax liabilities 96,247 92,021
total non-current liabilities 2,065,878 1,578,405
Current financial liabilities 92,395 445,565
Trade payables 35,472 29,236
Liabilities to limited partners in funds 15,151 22,011
Other provisions 3,498 3,465
Derivative financial instruments 24,620 26,416
Tax liabilities 17,790 15,433
Other liabilities 21,977 27,777
total current liabilities 210,903 569,903
total equity and liabilities 3,154,981 3,038,180
Consolidated balance sheet
20
Interim financial statements
21
Interim financial statements
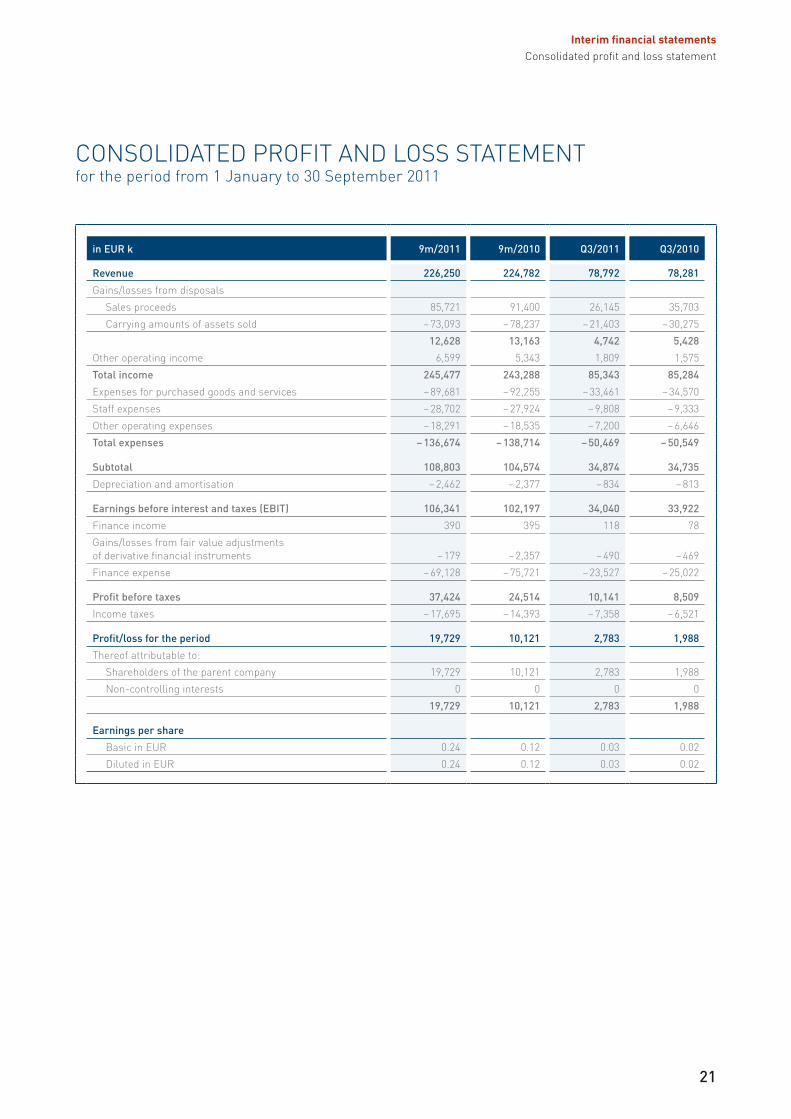
CONSOLIDATED PROFIT AND LOSS STATEMENTfor the period from 1 January to 30 September 2011
in eur k 9m/2011 9m/2010 Q3/2011 Q3/2010
revenue 226,250 224,782 78,792 78,281
Gains/losses from disposals
Sales proceeds 85,721 91,400 26,145 35,703
Carrying amounts of assets sold – 73,093 – 78,237 – 21,403 – 30,275
12,628 13,163 4,742 5,428Other operating income 6,599 5,343 1,809 1,575
total income 245,477 243,288 85,343 85,284
Expenses for purchased goods and services – 89,681 – 92,255 – 33,461 – 34,570
Staff expenses – 28,702 – 27,924 – 9,808 – 9,333
Other operating expenses – 18,291 – 18,535 – 7,200 – 6,646
total expenses – 136,674 – 138,714 – 50,469 – 50,549
subtotal 108,803 104,574 34,874 34,735
Depreciation and amortisation – 2,462 – 2,377 – 834 – 813
earnings before interest and taxes (eBIt) 106,341 102,197 34,040 33,922
Finance income 390 395 118 78
Gains/losses from fair value adjustments of derivative financial instruments – 179 – 2,357 – 490 – 469
Finance expense – 69,128 – 75,721 – 23,527 – 25,022
Profit before taxes 37,424 24,514 10,141 8,509Income taxes – 17,695 – 14,393 – 7,358 – 6,521
Profit/loss for the period 19,729 10,121 2,783 1,988Thereof attributable to:
Shareholders of the parent company 19,729 10,121 2,783 1,988
Non-controlling interests 0 0 0 0
19,729 10,121 2,783 1,988
earnings per share Basic in EUR 0.24 0.12 0.03 0.02
Diluted in EUR 0.24 0.12 0.03 0.02
Consolidated profit and loss statement

CONSOLIDATED STATEMENT OF COMPREHENSIVE INCOMEfor the period from 1 January to 30 September 2011
in eur k 9m/2011 9m/2010 Q3/2011 Q3/2010
Profit/loss for the period 19,729 10,121 2,783 1,988
other comprehensive income
Net gain/loss from derivative financial instruments – 24,314 – 39,935 – 41,649 – 3,320
Income tax effects 7,566 12,751 12,955 1,945
– 16,748 – 27,184 – 28,694 – 1,375
Net gains from pensions 2,450 0 0 0
Income tax effects – 735 0 0 0
1,715 0 0 0
other comprehensive income after taxes – 15,033 – 27,184 – 28,694 – 1,375
total comprehensive income, net of tax 4,696 – 17,063 – 25,911 613
Thereof attributable to:
Shareholders of the parent company 4,696 – 17,063 – 25,911 613
Non-controlling interests 0 0 0 0
Interim financial statements
22
Consolidated statement of comprehensive income

in eur k 9m/2011 9m/2010
operating activities
Profit/loss for the period 19,729 10,121
Finance income – 390 – 395
Finance expense 69,128 75,721
Income taxes 17,695 14,393
Profit/loss for the period before interest and taxes 106,162 99,840
Non-cash expenses/income
Depreciation and amortisation 2,462 2,377
Fair value adjustments to interest rate swaps 179 2,357
Other non-cash expenses/income – 15,338 – 17,551
Change in net working capital
Change in receivables, inventories and other current assets 4,787 4,414
Change in operating liabilities – 4,717 – 1,649
net operating cash flows 93,535 89,789
Interest paid – 57,788 – 64,045
Interest received 390 395
Taxes paid excluding EK-02 payments 481 – 1,702
net cash flows from operating activities before eK-02 payments 36,618 24,437EK-02 payments – 8,506 – 23,839
net cash flows from operating activities 28,112 598
Investing activites Sales proceeds 90,638 145,331
Purchase of property, plant and equipment/ investment property and other non-current assets – 216,445 – 21,446
Receipt of investment subsidies 366 2,525
Payments to limited partners in funds – 7,739 – 5,336
net cash flows from investing activites – 133,180 121,074
Financing activities Proceeds from borrowings 587,096 32,561
Repayment of borrowings – 469,619 – 146,111
Dividends paid to shareholders – 16,368 0
net cash flows from financing activities 101,109 – 113,550
net change in cash and cash equivalents – 3,959 8,122
Opening balance of cash and cash equivalents 46,016 57,095
Closing balance of cash and cash equivalents 42,057 65,217
CONSOLIDATED STATEMENT OF CASH FLOWSfor the period from 1 January to 30 September 2011
Consolidated statement of cash flowsInterim financial statements
23

CONSOLIDATED STATEMENT OF CHANGES IN EQUITY for the period from 1 January to 30 September 2011
in eur k retained earnings
Issued share capital
Capital reserve
Pensions reserve for cash
flow hedge
other reserves
subtotal non- controlling
interests
equity
equity as at 1 January 2010 81,840 455,761 204 – 44,805 368,670 861,670 302 861,972Profit/loss for the period 10,121 10,121 10,121
Other comprehen-sive income – 27,184 – 27,184 – 27,184
total comprehen-sive income 0 – 27,184 10,121 – 17,063 0 – 17,063
equity as at 30 september 2010 81,840 455,761 204 – 71,989 378,791 844,607 302 844,909
equity as at 1 January 2011 81,840 370,048 – 2,333 – 38,173 478,188 889,570 302 889,872Profit/loss for the period 19,729 19,729 0 19,729
Other comprehen-sive income 1,715 – 16,748 – 15,033 – 15,033
total comprehen-sive income 1,715 – 16,748 19,729 4,696 0 4,696
Dividends paid – 16,368 – 16,368 – 16,368
equity as at 30 september 2011 81,840 370,048 – 618 – 54,921 481,549 877,898 302 878,200
24
Consolidated statement of changes in equityInterim financial statements

General information
The business activities of Deutsche Wohnen AG are limi-ted to its role as the holding company for the companies in the Group. These activities include the following func-tions: Legal, Human Resources, Finance/Controlling/Accounting, Communication/Marketing and Investor Relations. The operating subsidiaries focus on Residen-tial Property Management and Disposals relating to pro-perties mainly situated in Berlin and the Rhine-Main area, as well as on Nursing and Assisted Living.
The consolidated financial statements are presented in Euros (EUR). Unless otherwise stated, all figures are rounded to the nearest thousand (k) or the nearest million (m) EUR. For arithmetical reasons there may be rounding differences between tables and references and the exact mathematical figures.
Basis of preparation and accounting policies applied to the consolidated financial statementsThe condensed consolidated interim financial state-ments for the period from 1 January to 30 September 2011 were prepared in accordance with International Accounting Standards (IAS) 34 for interim reporting as applicable in the European Union (EU).
These interim financial statements do not contain all the information and details required for consolidated financial statements and should therefore be read in conjunction with the consolidated financial statements as at 31 December 2010.
The consolidated financial statements have been pre-pared on a historical cost basis with the exception of, in particular, investment properties and derivative financial instruments, which are measured at fair value.
The consolidated financial statements include the finan-cial statements of Deutsche Wohnen and its subsidia-ries as at 30 September 2011. The financial statements of the subsidiaries are prepared using consistent accounting and valuation methods as at the same reporting date as the financial statement of the parent company.
The preparation of the Group’s consolidated financial statements requires the management to make judge-ments, estimates and assumptions which affect the reported amounts of revenues, expenses, assets and liabilities and the disclosure of contingent liabilities at the end of the reporting period. However, the uncer-tainty connected with these assumptions and estimates could result in outcomes which in future require consi-derable adjustments to the carrying amounts of the assets or liabilities affected.
The business activities of Deutsche Wohnen are basi-cally unaffected by seasonal influences and economic cycles.
Since 1 June 2011 Promontoria Holding XVI N.V., based in Baarn, the Netherlands (formerly: Promontoria Hol-ding XVI B.V., based in Baarn, the Netherlands), and since 30 September 2011 AGG Auguste-Viktoria-Allee Grundstücks GmbH, Berlin, SGG Scharnweberstraße Grundstücks GmbH, Berlin, and Holzmindener Straße/Tempelhofer Weg Grundstücks GmbH, Berlin were fully consolidated as wholly owned indirect subsidiaries. Those transactions do not constitute business combina-tions in accordance with IFRS 3. There have been no further changes to the basis of consolidation.
Changes to accounting policies
As a basic principle Deutsche Wohnen has applied the same accounting policies as for the equivalent reporting period in the previous year.
In the first nine months of the fiscal year 2011 the new standards and interpretations which must be applied for fiscal years commencing after 1 January 2011 have been applied in full.
APPENDIX
Appendix
25
Interim financial statements

Selected notes on the consolidated balance sheet
Investment properties comprise 92 % of the assets of the Deutsche Wohnen Group.
The item “property, plant and equipment” covers mainly technical facilities as well as office furniture and equipment.
The derivative financial instruments are interest rate swaps recorded at fair value. These swaps were not concluded for speculative purposes but solely in order to minimise the interest rate risks and consequent cash flow risks of floating rate loans. Compared with 31 De-cember 2010, the negative market value (net) rose from EUR 61.1 million to EUR 85.6 million due to decreasing interest rate levels.
The developments in equity can be found in the state-ment of changes in equity on p.24.
Financial liabilities have increased in comparison to 31 December 2010, particularly because new borro-wings exceeded repayments. Regular repayments for the first nine months amounted to EUR 23.0 million. In addition, the loan which was recorded as a current loan as at 31 December 2010 was completely refinanced in January 2011, so it is now recorded as a non-current financial liability.
The employee benefit liabilities were valued as at the reporting date with a discount rate of 5.0 % p.a. (31 De-cember 2010: 4.51 % p.a.), which is derived from the yield of fixed interest rate corporate bonds.
The tax liabilities mainly refer to liabilities from the lump-sum taxation of EK-02 holdings.
Selected notes on the consolidated profit and loss statement
Revenues are made up as follows:
in eur m 9m/2011 9m/2010
Residential Property Management 200.9 199.7
Nursing and Assisted Living 25.2 24.7
Other services 0.2 0.4
226.3 224.8
Expenses for purchased goods and services cover prima rily expenses for Residential Property Manage-ment (EUR 84.5 million, equivalent period in previous year: EUR 86.4 million).
Finance expenses are made up as follows:
in eur m 9m/2011 9m/2010
Current interest expenses – 59.8 – 64.5
Accrued interest on liabilities and pensions – 9.3 – 11.2
– 69.1 – 75.7
Notes on the consolidated statement of cash flows
The cash fund is made up of cash at hand and bank deposits. In addition, we have readily available credit facilities with banks in an amount of EUR 60.4 million.
Appendix
26
Interim financial statements
Notes on segment reporting
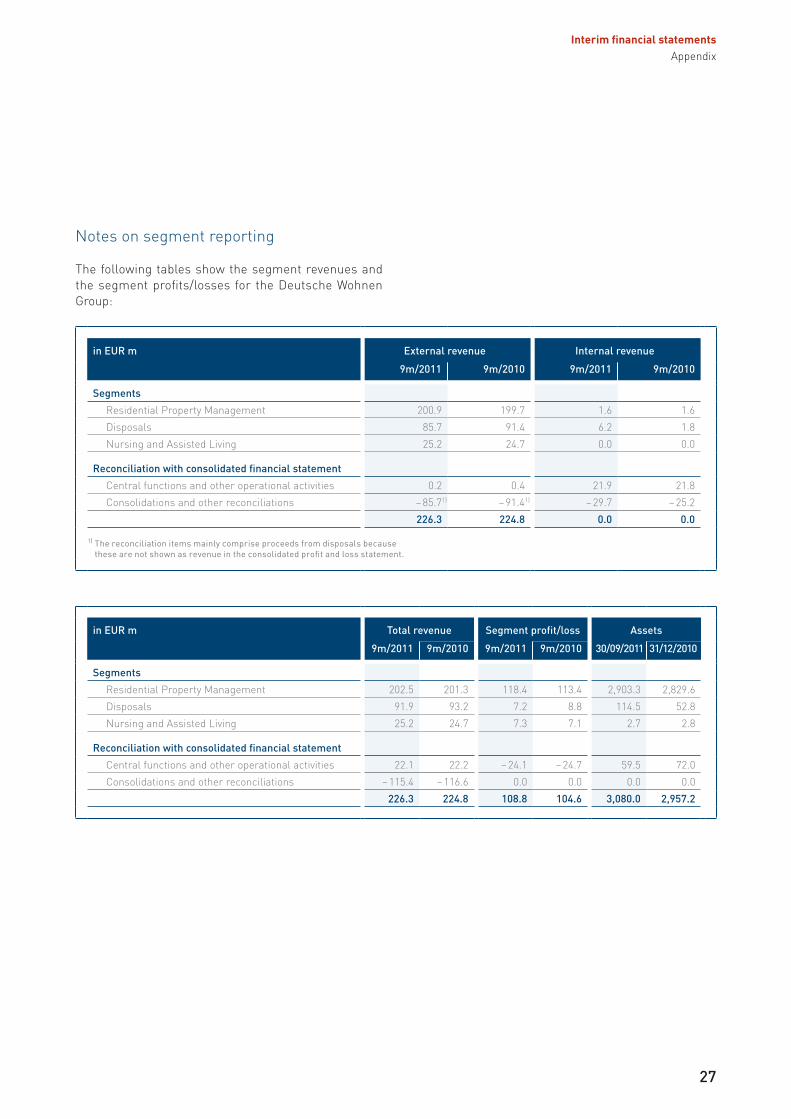
The following tables show the segment revenues and the segment profits/losses for the Deutsche Wohnen Group:
in eur m external revenue Internal revenue
9m/2011 9m/2010 9m/2011 9m/2010
segments
Residential Property Management 200.9 199.7 1.6 1.6
Disposals 85.7 91.4 6.2 1.8
Nursing and Assisted Living 25.2 24.7 0.0 0.0
reconciliation with consolidated financial statement
Central functions and other operational activities 0.2 0.4 21.9 21.8
Consolidations and other reconciliations – 85.71) – 91.41) – 29.7 – 25.2
226.3 224.8 0.0 0.0
1) The reconciliation items mainly comprise proceeds from disposals because these are not shown as revenue in the consolidated profit and loss statement.
in eur m total revenue segment profit/loss Assets
9m/2011 9m/2010 9m/2011 9m/2010 30/09/2011 31/12/2010
segments
Residential Property Management 202.5 201.3 118.4 113.4 2,903.3 2,829.6
Disposals 91.9 93.2 7.2 8.8 114.5 52.8
Nursing and Assisted Living 25.2 24.7 7.3 7.1 2.7 2.8
reconciliation with consolidated financial statement
Central functions and other operational activities 22.1 22.2 – 24.1 – 24.7 59.5 72.0
Consolidations and other reconciliations – 115.4 – 116.6 0.0 0.0 0.0 0.0
226.3 224.8 108.8 104.6 3,080.0 2,957.2
Appendix
27
Interim financial statements
Other information
Associated parties and companiesIn March 2011 the Supervisory Board of Deutsche Wohnen AG decided unanimously to extend the term of appointment of Mr Helmut Ullrich as member of the Management Board of the company by a further year until 31 December 2012. The Supervisory Board also decided unanimously to appoint Lars Wittan as a further member of the Management Board. His term of appoint-ment will run for a period of three years from 1 October 2011 to 30 September 2014. Furthermore, Dr Kathrin Wolff has been appointed as the fully authorised representative of Deutsche Wohnen AG.
At the Annual General Meeting on 31 May 2011 the Chair-man of the Supervisory Board at that time, Mr Hermann T. Dambach, resigned from his Supervisory Board post with effect from 30 June 2011. On 5 July 2011 the Super-visory Board voted for Mr Uwe E. Flach to be its new Chairman.
On 6 July 2011 the District Court of Frankfurt/Main appointed Mr Wolfgang Clement, federal minister (retired) and minister-president (retired), to the Super-visory Board for the period up to the conclusion of the ordinary Annual General Meeting for the fiscal year 2011.
In comparison to the information provided as at 31 De-cember 2010 there have been no further major changes in respect of associated persons or companies.
Risk report
With regard to the risks which exist for future business development we refer you to the information presented in the risk report in the consolidated financial statement as at 31 December 2010.
Frankfurt/Main, November 2011
Deutsche Wohnen AGManagement Board
Michael Zahn Helmut Ullrich Lars WittanChief Executive Chief Financial Member of theOfficer Officer Management Board
Appendix
28
Interim financial statements

“To the best of our knowledge, and in accordance with the applicable accounting standards, the consolidated interim financial statements as at 30 September 2011 give a true and fair view of net assets, financial and earnings position of the Group, and that the interim report presents a fair view of the development of the business including the business result and the posi-tion of the Group and describes the main opportunities and risks associated with the Group’s expected future development.”
Frankfurt/Main, November 2011
Deutsche Wohnen AGManagement Board
Michael Zahn Helmut Ullrich Lars WittanChief Executive Chief Financial Member of theOfficer Officer Management Board
DisclaimerThis interim report contains statements of a predictive nature, and such statements involve risks and imponderables. In future, the actual development of the business and the results of Deutsche Wohnen AG and of the Group may in certain circum stances deviate substantially from the assumptions made in this interim report. This interim report represents neither an offer to sell nor a request to submit an offer to buy shares in Deutsche Wohnen AG. This interim report does not create an obligation to update the statements it contains.
RESPONSIBILITY STATEMENT
29
Interim financial statementsResponsibility statement

Publication of Interim Report as at 30 September 2011 / 1st – 3rd quarter 14 November 2011
WestLB Deutschland Konferenz, Frankfurt/Main 16–17 November 2011
UBS Global Real Estate Conference, London 29–30 November 2011
F2011FInAnCIAL CALenDAr
30
Interim report as at 30 September 2011Financial calendar

IMPrInt
PublisherDeutsche Wohnen AGRegistered officePfaffenwiese 30065929 Frankfurt/Main
Phone +49 (0)69 976 970 0Fax +49 (0)69 976 970 4980
Berlin officeMecklenburgische Straße 5714197 Berlin
Phone +49 (0)30 897 86 0Fax +49 (0)30 897 86 100
Concept, consulting and design
HGB Hamburger Geschäftsberichte GmbH & Co. KG, Hamburg
The German version of this report is legally binding. The company cannot be held responsible for any misunderstanding or misinterpretation arising from this translation.
31
Interim report as at 30 September 2011Imprint