interim report second quarter 2021
TRANSCRIPT

Q2 SANDVIK INTERIM REPORT 2021
FOR ADDITIONAL INFORMATION, PLEASE CALL SANDVIK INVESTOR RELATIONS +46 8 456 11 00 OR VISIT HOME.SANDVIK 1
PRESS RELEASE JULY 16 2021
INTERIM REPORTSECOND QUARTER 2021AND FIRST SIX MONTHS 2021

Q2 SANDVIK INTERIM REPORT 2021
FOR ADDITIONAL INFORMATION, PLEASE CALL SANDVIK INVESTOR RELATIONS +46 8 456 11 00 OR VISIT HOME.SANDVIK 2
1) Change from the preceding year at fixed exchange rates for comparable units. 2) Adjusted for items affecting comparability of SEK 285 million in Q2 2021 (-1,329) and SEK 371 million YTD 2021 (-2,295). Q2 2021 is mainly related to closure of a defined benefit pension plan in US, partially offset by SMT separation costs. 2020 is primarily related to savings measures and by costs related to Varel Oil & Gas disposal in Q1. See page 23. 3) There are no items affecting comparability reported on net financial items for 2021 (0). 4) Quarter is quarterly annualized and year-to-date numbers are based on a four quarter average.
Tables and calculations in the report do not always agree exactly with the totals due to rounding. Comparisons refer to the year-earlier period, unless otherwise stated. Comments and numbers in the report relate to continuing operations, unless otherwise stated. Alternative performance measures and definitions used in this report are explained on page 26. For more information see home.sandvik. N/M = not meaningful
STRONG EXECUTION IN A HIGH-DEMAND ENVIRONMENT
FINANCIAL OVERVIEW
• Order intake increased organically by 43% to SEK 25,857 million (18,971), driven by strong demand across the business compared to the year earlier period that was significantly impacted by the pan-demic
• Organic revenues increased by 22% and amounted to SEK 23,460 million (20,230)
• Book-to-bill ratio was at 110%
• Adjusted operating profit amounted to SEK 4,469 million (2,837), corresponding to an adjusted operat-ing profit margin of 19.1% (14.0)
• Adjusted operating profit excluding metal price effects on a rolling 12-months basis was at SEK 16,364 million (16,297), corresponding to an adjusted operating profit margin of 18.7% (17.0)
• The permanent savings and cost measures initiated in 2020 generated a positive impact of SEK 190 million in the second quarter. Reversal of temporary savings had a negative year on year impact of SEK -765 million
• Earnings per share, diluted were SEK 2.80 (0.88)
• Adjusted earnings per share, diluted were SEK 2.69 (1.73)
• Free operating cash flow was SEK 3,088 million (2,531)
• Execution on the shift to growth strategy with an increased M&A pace led to five announced acquisi-tions during and after the quarter
MSEK Q2 2020 Q2 2021 CHANGE % Q1-Q2 2020 Q1-Q2 2021 CHANGE %
Order intake 18,971 25,857 36 44,327 51,704 17
Organic growth, % 1) -23 43 – -17 26 –
Revenues 20,230 23,460 16 43,851 45,151 3
Organic growth, % 1) -20 22 – -14 11 –
Operating profit 1,508 4,754 N/M 4,270 9,010 N/M
Adjusted operating profit 2) 2,837 4,469 58 6,565 8,639 32
% of revenues 14.0 19.1 – 15.0 19.1 –
Adjusted profit after net financial items 2, 3) 2,858 4,372 53 6,169 8,272 34
Profit for the period 1,098 3,514 N/M 2,933 6,700 N/M
Adjusted profit for the period 2, 3) 2,165 3,374 56 4,839 6,468 34
Earnings per share, diluted, SEK 0.88 2.80 N/M 2.35 5.33 N/M
Adjusted earnings per share, diluted, SEK 2, 3) 1.73 2.69 56 3.87 5.15 33
Return on capital employed, % 4) 6.9 21.3 – 9.3 18.5 –
Free operating cash flow 2,531 3,088 22 5,706 6,035 6
Net working capital % 4) 31.0 24.2 – 27.5 25.9 –

Q2 SANDVIK INTERIM REPORT 2021
FOR ADDITIONAL INFORMATION, PLEASE CALL SANDVIK INVESTOR RELATIONS +46 8 456 11 00 OR VISIT HOME.SANDVIK 3
q
CEO'S COMMENT
Following a solid start to the year, we concluded yet another quarter with positive momentum. We delivered strong growth in order intake and revenues on the back of a solid order backlog and with some increased pressure in the global supply chain. Organic order intake and revenues for the Group grew year on year by 43% and 22%, respectively. The adjusted operating profit margin was a solid 19.1% (14.0%), supported by increased volumes and good underlying operating leverage. I am also very pleased with the high pace of M&A activities carried out by all our business areas during this period, which resulted in five signed agreements during and after the quarter.
We continued to see strong demand in our mining business, with orders now well above pre-covid levels and, consequently, Sand-vik Mining and Rock Solutions reported order intake above SEK 10 billion for the second consecutive quarter. I am also happy with the SEK140 million battery-electric vehicle (BEV) orders we received in June, which was a significant record for BEV orders in a month. Organic order intake growth was 31% year on year and 38% excluding major orders. On June 23, we announced the intention to acquire the Australian rock tools supplier Tricon, and on July 7, we closed the DSI Underground acquisition.
Sandvik Rock Processing Solutions delivered a strong quarter with organic order intake and revenue growth of 61%, and 29% respectively. Revenues were supported by a strong order back-log, both in mining and construction. Sandvik Rock Processing Solutions also announced its first acquisition as a standalone business area: Kwatani, a South African-based supplier of large multi-slope screens and feeders.
Sandvik Manufacturing and Machining Solution's organic order intake and revenues grew year on year by 44% and 33% respec-tively. The daily order intake in the first two weeks of July was up ~20% compared with the first two weeks of July last year. During June and July we announced three acquisitions: Cambrio, a leading company with an end-to-end portfolio in CAD/CAM software for manufacturing industries, DWFritz Automation, a global provider of precision metrology,
inspection- and assembly solutions for advanced manufacturing and Fanar, a round tools company in Poland. These acquisitions will play an important role in our ambition to expand our digital offering and enhance our position within design, planning and metrology, and to increase our market share in round tools.
Sandvik Materials Technology’s order intake was SEK 4 billion, a significant sequential improvement driven by our short-cycle businesses and with the receipt of some additional umbilical orders. Organic order intake grew by 74%, on the back of a very challenging second quarter last year, but also strong underlying demand in most customer segments.
We are indeed operating in a different business environment compared with a year ago, with stronger momentum for both our short and long-cycle businesses. The economic recovery and high demand are posing some challenges on a global scale, with raw material and component shortages, as well as container and port imbalances to name a few. While the impact of this is difficult to predict I feel confident in the underlying business momentum. We are seeing strong demand for our products and services, and are combining this with solid operational execution and profitabil-ity levels. We are also stepping up the pace of acquisitions, firmly executing on our shift to growth ambition.
Stefan WidingPresident and CEO

Q2 SANDVIK INTERIM REPORT 2021
FOR ADDITIONAL INFORMATION, PLEASE CALL SANDVIK INVESTOR RELATIONS +46 8 456 11 00 OR VISIT HOME.SANDVIK 4
Q2 UNDERLYING MARKET DEVELOPMENT
MINING GENERAL ENGINEERING
AUTOMOTIVE ENERGY CONSTR. AERO
% of 2020Group revenue
Order intake Y/Y(excl. large orders)
Europe 37% +63% (+63%)
North America 21% +49% (+49%)
Asia 21% +34% (+28%)
Africa/ Middle East 8% +15% (+34%)
Australia 8% +1% (+22%)
South America 5% +88% (+88%)
5%
Organic order intake increased by 43% year on year driven by strong development across the Group. Revenues increased organically by 22% year on year.
The positive momentum in the mining and the construction segments continued with strong underlying demand. Sandvik Mining and Rock Solutions (SMR) and Sandvik Rock Processing Solutions (SRP) reported strong organic order intake growth year on year, of 31% and 61%, respectively. Revenues in the quarter were solid, despite the impact from global supply chain bottlenecks and longer lead times in both businesses.
Organic order intake increased by 44% year on year in Sandvik Manufacturing and Machining Solutions. Demand was on par with the first quarter with a slight acceleration at the end of the quarter which was noted across US and Europe, in particular Germany. Automotive and general engineering remained on robust levels. The oil and gas segment continued its slow recovery, and positive signals in the aerospace segment was noted, although with limited impact on the business to date. Revenues increased by 33% year on year.
Sandvik Materials Technology reported a strong organic order intake growth of 74% year on year. The growth was driven by a broad-based positive development across all divisions and demand in several of the customer segments is now well above pre-covid levels. The oil and gas segment continued to recover with some minor umbilical orders. Revenues remained negatively impacted by the weak umbilical backlog.
The Group's demand strengthened both year on year and sequentially across most regions, with the largest increase noted in Europe and North America. Asia, mainly driven by China, grew strongly year on year, albeit at a lower rate due to more challenging comparables than in the other regions.
Changed exchange rates had a negative impact of -6% on both order intake and revenues.
ORDER INTAKE AND REVENUES
REVENUE GROWTH
GROWTH
40% of 2020 revenues 23% 11%
10%
ORDER INTAKE AND REVENUES
8%
Q2 ORDER INTAKE REVENUESOrganic, % 43 22Structure, % 1 1Currency, % -6 -6TOTAL, % 36 16
Change compared to same quarter last year. The table is multiplicative, i.e. the different components must be multiplied to determine the total effect.
90%
95%
100%
105%
110%
115%
120%
10 000
15 000
20 000
25 000
30 000
2019 2020 2021
Order intake Revenues Book-to-bill
PERCENTMSEK
-25%-20%-15%-10%
-5%0%5%
10%15%20%25%30%
2019 2020 2021
Structure Organic growth
PERCENT

Q2 SANDVIK INTERIM REPORT 2021
FOR ADDITIONAL INFORMATION, PLEASE CALL SANDVIK INVESTOR RELATIONS +46 8 456 11 00 OR VISIT HOME.SANDVIK 5
Reported gross profit amounted to SEK 9,845 million (6,597). Adjusted gross profit increased by 31% to SEK 9,780 million (7,451) mainly due to higher volumes and the adjusted gross margin increased to 41.7% (36.8).
Sales, administration and R&D costs excluding items affecting comparability increased by 16% year on year mainly due to reversals of temporary savings in the preceding year. The overall ratio to revenues on a reported basis de-creased to 21.2% (23.2).
Adjusted operating profit increased by 58% and amounted to SEK 4,469 million (2,837) and the adjusted operating margin increased to 19.1% (14.0). Adjusted operating profit, excluding positive metal price effects in Sandvik Materials Technology of SEK 50 million in the period, increased by 52% to SEK 4,420 million (2,913). The adjusted operating margin excluding metal price ef-fects was 18.8% (14.4) for the second quarter, and 18.7% (17.0) for the rolling twelve-month period. The impact from changed exchange rates was negative at SEK -659 million year on year.
Reported operating profit of SEK 4,754 million (1,508) was positively impacted by items affecting comparability of SEK 285 million.
The interest net was reduced slightly to SEK -88 million (-90) due to debt repayments and higher interest on deposits. Net financial items amounted to SEK -97 million (20), with lower impact from temporary revaluations effects.
The tax rate, excluding items affecting comparability, for continuing operations was 22.8% (24.3). The reported tax rate for continuing operations was 24.5% (28.1) and 24.6% (28.2) for the Group in total.
Profit for the period amounted to SEK 3,514 million (1,098), corresponding to earnings per share, diluted, of SEK 2.80 (0.88) and adjusted earnings per share, diluted of SEK 2.69 (1.73). Cost and savings initiativesThe permanent savings and cost initiatives that were announced in 2020 had a positive impact of SEK 190 million in the quarter, corresponding to an annu-alized run-rate of SEK 760 million out of the total SEK 1,300 million in targeted savings. The majority of savings from these iniatives will be realized this year. Reversal of temporary savings had a negative impact in the quarter of approx-imately SEK -765 million year on year, due to higher discretionary spend and lower work time reductions compared to the same period last year.
ADJUSTED OPERATING PROFIT AND MARGIN
ADJUSTED EARNINGS PER SHARE, DILUTED
*Excluding metal price effects
ADJUSTED GROSS PROFIT AND MARGIN
EARNINGS
30%
32%
34%
36%
38%
40%
42%
44%
0
2 000
4 000
6 000
8 000
10 000
12 000
2019 2020 2021
Adj. gross profit Adj. gross margin
PERCENTMSEK
0%
5%
10%
15%
20%
0
1 000
2 000
3 000
4 000
5 000
6 000
2019 2020 2021Adj. operating profitAdj. operating marginAdj. operating margin, rolling 12 months*
PERCENTMSEK
0,0
2,0
4,0
6,0
8,0
10,0
12,0
0,0
0,5
1,0
1,5
2,0
2,5
3,0
3,5
2019 2020 2021
Adj. earnings per share
Adj. earnings per share, rolling 12 months
SEK 12 months rolling
SEK quarter

Q2 SANDVIK INTERIM REPORT 2021
FOR ADDITIONAL INFORMATION, PLEASE CALL SANDVIK INVESTOR RELATIONS +46 8 456 11 00 OR VISIT HOME.SANDVIK 6
BALANCE SHEET AND CASH FLOWCapital employed decreased slightly year on year due to a lower cash position. Capital employed decreased sequentially and amounted to SEK 89.9 billion (95.2), mainly due to a lower cash position. Adjusted return on capital employed improved sequentially to 18.5% (18.0) explained by lower capital employed and higher earnings.
Net working capital decreased year on year and amounted to SEK 22.9 billion (24.5) mainly due to changed exchange rates, and increased sequentially explained by higher inventories and accounts receivables somewhat offset by higher liabilities. Net working capital in relation to revenues decreased to 24.2% compared to the first quarter (24.7%).
Investments in tangible and intangible assets were in line with the preceding year and amounted to SEK 0.9 billion (0.9), corresponding to 76% of scheduled depreciations.
The financial net cash position of SEK 4.9 billion (3.5) was higher compared to last year and lower sequentially (10.7) due to the dividend payout of SEK 8 bil-lion, partly offset by positive cash flow from operations. The net pension liability decreased year on year to SEK 5.5 billion (7.3), and sequentially (6.5), mainly due to higher discount rates, and the closure of a US pension plan. Total net debt amounted to SEK 3.9 billion (7.0) and increased sequentially from SEK -1.2 billion in the first quarter. The net debt to equity ratio was 0.06 (0.11), improving year on year and declining sequentially (-0.02).
Free operating cash flow increased year on year to SEK 3.1 billion (2.5).
NET DEBT, GROUP TOTAL
FREE OPERATING CASH FLOW
NET WORKING CAPITAL
FREE OPERATING CASH FLOW, MSEK Q2 2020 Q2 2021EBITDA + non-cash items 3,514 5,162Net Working Capital change -89 -1,152Capex 1) -894 -921FREE OPERATING CASH FLOW 2) 2,531 3,088
1) Including investments and disposals of rental equipment of SEK -239 million (-185) and tangible and intangible assets of SEK -683 million (-709). 2) Free operating cash flow before acquisitions and disposals of companies, financial net items and paid taxes.
20
25
30
35
10 000
15 000
20 000
25 000
30 000
2019 2020 2021
Net Working Capital Percent of revenues
PERCENTMSEK
-0,1
0,0
0,1
0,2
0,3
0,4
0,5
-5 000
0
5 000
10 000
15 000
20 000
2019 2020 2021
Net debt Net debt/Equity
MSEK Net debt/Equity
0
5 000
10 000
15 000
20 000
0
1 000
2 000
3 000
4 000
5 000
6 000
7 000
2019 2020 2021Free operating cash flow
Free operating cash flow, rolling 12 months
MSEK 12 months rolling
MSEK

Q2 SANDVIK INTERIM REPORT 2021
FOR ADDITIONAL INFORMATION, PLEASE CALL SANDVIK INVESTOR RELATIONS +46 8 456 11 00 OR VISIT HOME.SANDVIK 7
Order intake and revenuesKey items impacting order intake and revenues year on year:• Continued strong momentum in mining with two consec-
utive quarters with order intake above SEK 10 billion and a record month for orders of battery-electric mining vehicles (BEVs) of SEK 140 million
• Organic order intake well above pre-covid levels, with strong demand in Load and Haul, Underground Drilling and Surface Drilling
• One major order received in the quarter totaling SEK 248 million. Excluding major orders, total organic order intake increased by 38%
• Organic order intake for equipment grew by 44% and after-market order intake grew organically by 22%
• All major regions reported strong growth rates, with South America noting an increase of 93%, Europe 50%, North Amer-ica 39% and Africa/ Middle East 15%
• The aftermarket business accounted for 59% (62) of revenues while the equipment business accounted for 41% (38)
Adjusted operating profit:• Adjusted operating margin was on par with the preceding year
with increased volumes offset by negative currency impact and reversals of temporary savings
• Adjusted operating margin was slightly down sequentially with increased volumes negatively offset by an unfavorable mix, ramp-up costs and logistics challenges, and pricing not yet fully compensating for inflationary pressure
• Reversal of temporary savings had a negative impact of SEK -195 million year on year
• Exchange rates had a negative impact of SEK -236 million year on year
SANDVIK MINING AND ROCK SOLUTIONS
Shift to growthSandvik received orders for battery-electric mining vehicles (BEVs) amounting to about SEK 140 million in June, combined with commitments for battery-as-a-service (BaaS) contracts. This represents an important step in the ambition to grow the share of automation and electrification. During the quarter, Sandvik signed an agreement to acquire Tricon Drilling Solutions Pty. Ltd, a pri-vately-owned supplier of rock tools for the mining industry, based in Perth, Australia. On July 7, Sandvik completed the previously announced acquisition of DSI Underground, the global leader in ground support and reinforcement products, systems and solu-tions for the underground mining and tunneling industries.
ORDER INTAKE, REVENUES AND BOOK-TO-BILL
ADJUSTED OPERATING PROFIT
GROWTH
CONTINUED STRONG ORDER INTAKE
RECORD ORDER MONTH FOR BAT-TERY ELECTRIC VEHICLE ORDERS
ACQUISITION OF DSI CLOSED JULY 7
* Change at fixed exchange rates for comparable units. ** Last years figures has been restated due the new BA structure as of January 1, 2021.1) Operating profit adjusted for items affecting comparability of SEK 0 million Q2 2021 (-667) and for YTD 2021 the impact was SEK 0 million (-667). For 2020 primarily related to structural and volume related saving measures. See page 23. 2) Quarter is quarterly annualized and the year to date numbers are based on a four quarter average. 3) Full-time equivalent.
Q2ORDER INTAKE REVENUES
Organic, % 31 21Structure, % 0 0Currency, % -6 -5TOTAL, % 24 15Change compared to same quarter last year. The table is multiplicative, i.e. the different components must be multiplied to determine the total effect.
FINANCIAL OVERVIEW, MSEK Q2 2020** Q2 2021 CHANGE % Q1-Q2 2020** Q1-Q2 2021 CHANGE %Order intake * 8,400 10,399 31 16,998 20,868 33Revenues * 7,899 9,090 21 16,143 17,109 15Operating profit 934 1,827 96 2,387 3,471 45
% of revenues 11.8 20.1 14.8 20.3Adjusted operating profit 1) 1,601 1,827 14 3,055 3,471 14
% of revenues 20.3 20.1 18.9 20.3Return on capital employed 2) 16.7 33.6 28.3 34.7Number of employees 3) 11,741 13,230 13 11,741 13,230 13
60%
80%
100%
120%
140%
0
3 000
6 000
9 000
12 000
2019 2020 2021
Order intake Revenues Book-to-bill
PERCENTMSEK
0%
5%
10%
15%
20%
25%
30%
0
1 000
2 000
3 000
2019 2020 2021
Adj. operating profitAdj. operating marginAdj. operating margin, rolling 12 months
PERCENTMSEK

Q2 SANDVIK INTERIM REPORT 2021
FOR ADDITIONAL INFORMATION, PLEASE CALL SANDVIK INVESTOR RELATIONS +46 8 456 11 00 OR VISIT HOME.SANDVIK 8
Order intake and revenuesKey items impacting order intake and revenues year on year:• Strong organic order intake growth in both the mining and
construction segments due to low comparables and good underlying demand
• Order intake for equipment increased organically by 92% year on year, mainly driven by stationary crushers
• Organic order intake in aftermarket increased by 38% • All regions reported strong development in organic order in-
take compared with the preceding year, with Europe increas-ing 67%, North America 70% and Asia 68%
• The aftermarket business accounted for 52% (49) of reve-nues while the equipment business accounted for 48% (51)
Adjusted operating profit: • Record high adjusted operating profit for a second quarter• The adjusted operating profit margin was 17.0% (14.6), mainly
driven by higher revenues and a favorable product mix • Permanent savings had a positive impact of SEK 5 million and
reversal of temporary savings had a negative impact of SEK -20 million compared with the preceding year
• Exchange rates had a negative impact of SEK -101 million year on year
SANDVIK ROCK PROCESSING SOLUTIONS
Shift to growthSAM by Sandvik, our rock processing digital service, was announced in April. SAM will drive collaboration, connectivity and productivity across customers' entire operation. It will provide customers with direct access to data, analytics, communications, e-commerce, in-spection tools, custom on-site reporting, information and predictions based on our AI modeling for customers' connected equipment. During the quarter, an agreement to acquire South African based Kwatani was signed. Kwatani’s strong offering in large multi slope screens for the mining industry will add to Sandvik’s existing portfo-lio while also strengthening Sandvik’s capabilities in comminution.
ORDER INTAKE, REVENUES AND BOOK-TO-BILL
ADJUSTED OPERATING PROFIT
GROWTHCONTINUED STRONG UNDERLYING DEMAND
STRONG PROFITABILITY
AGREEMENT TO ACQUIRE KWATANI
* Change at fixed exchange rates for comparable units. ** Last years figures has been restated due to the new BA structure as of January 1, 2021.1) There are no items affecting comparability for 2021 (0). See page 23. 2) Quarter is quarterly annualized and the year to date numbers are based on a four quarter average. 3) Full-time equivalent.
Q2ORDER INTAKE REVENUES
Organic, % 61 29
Structure, % 6 4
Currency, % -7 -7TOTAL, % 56 23Change compared to same quarter last year. The table is multiplicative, i.e. the different components must be multiplied to determine the total effect.
FINANCIAL OVERVIEW, MSEK Q2 2020** Q2 2021 CHANGE % Q1-Q2 2020** Q1-Q2 2021 CHANGE %Order intake * 1,373 2,147 61 3,346 4,505 42Revenues * 1,590 1,964 29 3,121 3,691 25Operating profit 232 334 44 439 617 40
% of revenues 14.6 17.0 14.1 16.7Adjusted operating profit 1) 232 334 44 439 617 40
% of revenues 14.6 17.0 14.1 16.7Return on capital employed 2) 19.8 30.7 21.4 26.8Number of employees 3) 1,636 1,869 14 1,636 1,869 14
50%
100%
150%
0
500
1 000
1 500
2 000
2 500
3 000
2019 2020 2021
Order intake Revenues Book-to-bill
PERCENTMSEK
0%
5%
10%
15%
20%
25%
30%
0
100
200
300
400
2019 2020 2021Adj. operating profitAdj. operating marginAdj. operating margin, rolling 12 months
PERCENTMSEK

Q2 SANDVIK INTERIM REPORT 2021
FOR ADDITIONAL INFORMATION, PLEASE CALL SANDVIK INVESTOR RELATIONS +46 8 456 11 00 OR VISIT HOME.SANDVIK 9
Order intake and revenuesKey items impacting order intake and revenues year on year:• Revenues were up 33% year on year with a currency impact
of SEK -700 million • Organic order intake growth was strong year on year driven
by automotive and general engineering• Strongest year on year growth in order intake was noted in
North America and Europe of 48% and 50%, respectively. Growth of 23% recorded in Asia
• Daily order intake in the first two weeks of July improved by ~20% compared to the first two weeks in July last year
• The number of working days had a +0.9% impact on orders and revenues year on year
• Wolfram, the tungsten powder business, continued to note a strong improvement in order intake
Adjusted operating profit:• The adjusted operating margin improved significantly support-
ed by increased volumes • Permanent savings had a SEK 105 million positive impact
whilst reversal of temporary savings impacted the quarter negatively with SEK -485 million compared with last year
• Changed exchange rates had a negative impact of SEK -300 million year on year
SANDVIK MANUFACTURING AND MACHINING SOLUTIONS
Shift to growthThree acquisitions were announced during and after the quarter; Sandvik Manufacturing Solutions signed an agreement to ac-quire Cambrio, a company with an end-to-end portfolio in CAD/CAM software for manufacturing industries and DWFritz, a global provider of precision metrology, inspection and assembly solu-tions for advanced manufacturing. Sandvik Machining Solutions signed a deal to acquire Fanar, a manufacturer of round tools in Poland.
ORDER INTAKE, REVENUES AND BOOK-TO-BILL
ADJUSTED OPERATING PROFIT
GROWTHREVENUES UP 33% YEAR ON YEAR
SOLID PROFIT MARGIN
THREE ACQUSITIONS ANNOUNCED DURING AND AFTER THE QUARTER
Q2ORDER INTAKE REVENUES
Organic, % 44 33Structure, % 2 2Currency, % -7 -7TOTAL, % 36 25
Change compared to same quarter last year. The table is multiplicative, i.e. the different components must be multiplied to determine the total effect.
FINANCIAL OVERVIEW, MSEK Q2 2020 Q2 2021 CHANGE % Q1-Q2 2020 Q1-Q2 2021 CHANGE %Order intake * 6,821 9,270 44 16,945 18,649 18Revenues * 7,247 9,083 33 17,013 17,865 13Operating profit 645 2,096 N/M 2,335 4,109 76
% of revenues 8.9 23.1 13.7 23.0Adjusted operating profit 1) 927 2,097 N/M 2,981 4,109 38
% of revenues 12.8 23.1 17.5 23.0Return on capital employed 2) 8.0 25.9 17.1 20.4Number of employees 3) 15,079 18,028 20 15,079 18,028 20* Change at fixed exchange rates for comparable units.1) Operating profit adjusted for items affecting comparability of SEK -1 million in Q2 2021 (-282) and SEK -1 million YTD 2021 (-646). For 2020 all are related to savings measures. See page 23. 2) Quarter is quarterly annualized and the year to date numbers are based on a four quarter average. 3) Full-time equivalent.
75%
100%
125%
0
3 000
6 000
9 000
12 000
2019 2020 2021
Order intake Revenues Book-to-bill
PERCENTMSEK
0%
5%
10%
15%
20%
25%
30%
0
1 000
2 000
3 000
2019 2020 2021Adj. operating profitAdj. operating marginAdj. operating margin, rolling 12 months
PERCENTMSEK

Q2 SANDVIK INTERIM REPORT 2021
FOR ADDITIONAL INFORMATION, PLEASE CALL SANDVIK INVESTOR RELATIONS +46 8 456 11 00 OR VISIT HOME.SANDVIK 10
SANDVIK MATERIALS TECHNOLOGY
Order intake and revenuesKey items impacting order intake and revenues year on year:• Strong organic order intake growth and solid absolute levels
across most segments and divisions • Improved sentiment in oil & gas and to some extent also in the
aerospace segments, with some minor orders being placed, although levels are still low
• Organic revenues negatively impacted by weak backlog for umbilicals, which was somewhat offset by strong development in consumer-related segments, industrial heating and applica-tion tubing
• Strong development noted in order intake in all regions com- pared with the corresponding period in the preceding year
Adjusted operating profit:• Solid adjusted operating margin despite low invoicing of umbili-
cals, supported by strong invoicing and favorable mix in Kanthal and Strip
• Inventory build-up in line with normal seasonality had a positive year on year impact of ~200 bps on margin
• Permanent savings had a positive impact of SEK 75 million and reversal of temporary savings impacted negatively by SEK -40 million compared with the preceding year
• Exchange rates had a negative impact of SEK -15 million year on year
• Changed metal prices had a positive impact of SEK 50 million (-76) in the quarter
• Adjusted operating profit excluding metal price effects totaled SEK 344 million (324), corresponding to an underlying margin of 10.4% (9.3)
Shift to growthThe quest to produce fossil-free steel creates growth opportunities for Kanthal. During the second quarter, the Kanthal division within Sandvik Materials Technology signed a strategic partnership with HYBRIT (Hydrogen Breakthrough Ironmaking Technology). Fossil free heating is an important component in the groundbreaking technological development towards a completely fossil free value chain from mine to steel.
ORDER INTAKE, REVENUES AND BOOK-TO-BILL
ADJUSTED OPERATING PROFIT
GROWTHSTRONG YOY ORDER INTAKEGROWTH ACROSS ALL DIVISIONS
SOLID MARGIN
SOMEWHAT IMPROVED SENTIMENT IN OIL & GAS AND AEROSPACE
FINANCIAL OVERVIEW, MSEK Q2 2020 Q2 2021 CHANGE % Q1-Q2 2020 Q1-Q2 2021 CHANGE %Order intake * 2,377 4,041 74 6,742 7,681 18Revenues * 3,495 3,324 -4 7,277 6,486 -9Operating profit -83 355 N/M 11 692 N/M
% of revenues -2.4 10.7 0.2 10.7Adjusted operating profit 1) 248 394 59 388 749 93
% of revenues 7.1 11.8 5.3 11.5Return on capital employed, % 2) -2.5 11.8 4.2 9.7Number of employees 3) 5,193 5,283 2 5,193 5,283 2* Change at fixed exchange rates for comparable units.1) Operating profit adjusted for items affecting comparability of SEK -39 million in Q2 2021 (-331) and SEK -57 million YTD 2021 (-377), primarily related to the internal separation of Sandvik Materi-als Technology offset by a partial release of structural initiative from 2020. For 2020 it is related to savings measures and the internal separation. See page 23. 2) Quarterly number is annualized and the year-to-date number is based on four quarter average. 3) Full-time equivalent.
Q2ORDER INTAKE REVENUES
Organic, % 74 -4Structure, % 0 0Currency, % -5 -5TOTAL, % 70 -5Change compared to same quarter last year. The table is multiplicative, i.e. the different components must be multiplied to determine the total effect. Alloy surcharges accounts for 4% of order intake and revenues respectively.
60%
80%
100%
120%
140%
0
1 000
2 000
3 000
4 000
5 000
2019 2020 2021Order intake Revenues Book-to-bill
PERCENTMSEK
0%
5%
10%
15%
20%
25%
30%
0
200
400
600
800
2019 2020 2021Adj. operating profitAdj. operating marginAdj. operating margin, rolling 12 monthsAdj. operating margin ex metal prices
PERCENTMSEK

Q2 SANDVIK INTERIM REPORT 2021
FOR ADDITIONAL INFORMATION, PLEASE CALL SANDVIK INVESTOR RELATIONS +46 8 456 11 00 OR VISIT HOME.SANDVIK 11
CIRCULARITY - WASTE*
CLIMATE - CO2 EMISSIONS
FAIR PLAY - DIVERSITY
SAFETY CAMPAIGNS INITIATED IN THE QUARTER
INCREASE IN GHG EMISSIONS DUE TO HIGHER PRODUCTION LEVELS
DIVERSITY CONTINUED TO IMPROVE
The quarter marked a period with continued focus on making the sustainability shift. Safety campaigns were initiated and we continued to pursue our clean electricity project for example. However, key figures in the quarter met difficult comparisons with same period last year when production activities was significantly lower as a consequence of the pandemic. As operations have now returned to more normal levels, the trend was negative year on year, although the long-term trend is moving in the right direction. Second quarter 2021 • Injury rates deteriorated during the quarter and the TRIFR was 3.6, up from 3.2 at the
end of last year, corresponding to nearly 15% higher injury rate. Compared to a year ago the rate was also slightly higher (3.4)
• Greenhouse gas (GHG) emissions were higher than in the corresponding quarter last year, which was a period impacted by slowdowns caused by the pandemic. When production levels now rise again, we are noting higher emissions. Asia accounted for the main part of the increase, with India in particular standing out, reporting an increase that corresponded to more than 80% of the total increase in the quarter. In Europe and North America, a similar pattern was noted, although with a smaller contribution to the total reported increase
• The share of circular waste amounted to 65% in the quarter, a significant drop com-pared with a year ago (76). This was mainly related to timing issues due to irregular disposal patterns for some waste types at our largest production unit in Sandviken, Sweden. The total amount of circular waste was almost constant, while the amount of non-circular waste increased
• The share of female managers continued its upwards trend, and at the end of the quarter the ratio was 19.3% compared to 18.5% at the end of last year and 18.3% a year ago
Case of the quarterTogether with their customers, our divisions Rock Tools (within Sandvik Mining and Rock Solutions) and Wolfram (within Sandvik Manufacturing and Machining Solutions) have created a value- adding new ecosystem that brings both sustainability and finan-cial benefits.The initiative consists of a sustainable supply chain for circular mining bits whereby a bespoke chemical recycling process enables the extraction of key minerals, such as tungsten and wolfram carbide, using a locally installed separation unit for min-ing bits. Sandvik repurchases the used mining bits and uses a local supplier to extract the minerals needed to produce new mining bits, which not only yields increased circularity of raw materials, but also CO2 and cost reductions, in addition to important local societal and economic impacts resulting from the establishment of new local sustainable businesses. The CO2 reductions are achieved in transportation and the production of new mining bits.
SHIFTING TO A MORE SUSTAINABLE BUSINESS
* Excluding tailings and slag to other disposal
For definitions see home.sandvik
PEOPLE - ZERO HARM
SUSTAINABILITY OVERVIEW Q2 2020 Q2 2021 CHANGE % Rolling 12 months
Circularity Total waste, thousand tonnes* 16 19 18.4 75
Circularity Waste recovered, % of total 76 65 -3 71.6
Climate Total CO2, thousand tonnes* 64 77 2.9 286
PeopleTotal recordable injury frequency rate, R12M frequency / million working hours
3.5 3.6 14.7 3.6
PeopleLost time injury frequency rate, R12M frequency / million working hours
1.5 1.5 8.9 1.5
Fair play Share of female managers, % 18.3 19.3 4.6 19.3
* ) Excluding tailings and slag
0
1
2
3
4
5
0
20
40
60
80
100
2019 2020 2021Medical Treatment Injuries (number of)Restricted Work Injuries (number of)Lost Time Injuries (number of)Fatal Injuries (number of)LTIFR (LTI/Mhr) R12MTRIFR (TRI/Mhr) R12M
No. injuries in quarter Frequency rate R12M
050100150200250300350400
0
20
40
60
80
100
2019 2020 2021
Direct CO₂ (quarter) Indirect CO₂ (quarter)
Total CO₂ (R12M)
kton/quarter kton/R12M
17
18
19
20
0
1000
2000
3000
4000
5000
6000
2019 2020 2021
Male Managers (number of)
Female Managers (number of)
Share of Female Managers (%)
%No. managers
0
20
40
60
80
100
0
5
10
15
20
25
30
2019 2020 2021
Non-circular waste (quarter)Circular waste (quarter)Total Waste (R12M)
kton/quarter kton/R12M

Q2 SANDVIK INTERIM REPORT 2021
FOR ADDITIONAL INFORMATION, PLEASE CALL SANDVIK INVESTOR RELATIONS +46 8 456 11 00 OR VISIT HOME.SANDVIK 12
PARENT COMPANYThe parent company's invoiced sales for the first sixth months of 2021 amounted to SEK 6,414 million (5,241) and the operat-ing result was SEK 2,643 million (2,075). Result from shares in Group companies of SEK -772 million (-1,776) primarily con-sists of result from disposal of intragroup shares to establish
the legal structure of SMT offset by dividends. Interest-bearing liabilities, less cash and cash equivalents and interest-bearing assets, amounted to SEK 14,203 million (8,068). Investments in property, plant and machinery amounted to SEK 351 million (161).
FIRST SIX MONTHS 2021For the first six months of 2021, demand for Sandvik’s products increased compared to the same period in the preceding year, with organic order intake growth of 26%. Excluding the impact of large orders, organic order intake growth was 27%. Revenues increased organically by 11%.
Underlying customer activity increased in most of the seg-ments with an strong underlying demand in the mining and construction segments. Demand in the aerospace and energy segments remained subdued during the period, but positive signs of improvement was noted, while demand in both general engineering and automotive increased. Organic order intake grew at a double digit rate in all regions. Changed exchange rates had a negative impact of -8% and -7% on order intake and revenues, respectively. Sandvik’s order intake amounted to SEK 51,704 million (44,327), and revenues were SEK 45,151 million (43,851), implying a book-to-bill ratio of 115%.
Adjusted operating profit increased by 32% year on year to SEK 8,639 million (6,565) and the adjusted operating margin was 19.1% (14.0).
The reported operating profit increased by 111% to SEK 9,010 million (4,270) and the operating margin was 20.0% (9.7). Changed metal prices had a positive impact of SEK 169 million (-277) in the period.
Net financial items amounted to SEK -368 million (-396) and profit after financial items was SEK 8,642 million (3,874).
The tax rate, excluding items affecting comparability, for con-tinuing operations was 21.8% (21.6). The reported tax rate for continuing operations was 22.5% (24.3) and 22.5% (24.4) for the Group in total.
Profit for the period amounted to SEK 6,700 million (2,933)for continuing operations and SEK 6,693 million (2,917) forthe Group total Earnings per share for continuing operations amounted to SEK 5.34 (2.35) while earnings per share for the Group total amounted to SEK 5.33 (2.34).
Net debt decreased year-on-year to SEK 3.9 billion (7.0) result-ing in a net debt to equity ratio of 0.06 (0.11).
During the first six months two acquisitions were announced, screens and feeders manufacturer Kwatani and rock tools supplier Tricon.

Q2 SANDVIK INTERIM REPORT 2021
FOR ADDITIONAL INFORMATION, PLEASE CALL SANDVIK INVESTOR RELATIONS +46 8 456 11 00 OR VISIT HOME.SANDVIK 13
DIVESTMENTS DURING LAST 12 MONTHS
COMPANY/UNIT CLOSING DATE REVENUESNO. OF
EMPLOYEES
2020
Sandvik Rock Processing Solutions Allied Construction Partners LLC October 2, 2020 29 MUSD in 2019 38
Sandvik Manufacturing and Machining Solutions
Miranda Tools December 23, 2020 200 MSEK in 2019 580
Sandvik Manufacturing and Machining Solutions
Oqton 1) December 30, 2020 N/A N/A
Sandvik Manufacturing and Machining Solutions
CGTech December 31, 2020 470 MSEK in 2019 180
ACQUISITIONS DURING THE LAST 12 MONTHS
Purchase price on cash and debt free basis
Preliminary goodwill and other intangible assets
Acquisitions 2021 – –
ACQUISITIONS AND DIVESTMENTS
COMPANY/UNIT CLOSING DATE REVENUESNO. OF
EMPLOYEES
2020
Sandvik Manufacturing and Machining Solutions
Xiamen Golden Egret Special Alloy Co., Ltd. (Gesac) 1) July 15, 2020 N/A N/A
1) Sandvik divested its 10% minority holding.
1) Sandvik is a minority owner and the investment is reported as a financial asset.

Q2 SANDVIK INTERIM REPORT 2021
FOR ADDITIONAL INFORMATION, PLEASE CALL SANDVIK INVESTOR RELATIONS +46 8 456 11 00 OR VISIT HOME.SANDVIK 14
FIRST SIX MONTHS
- On January 15, Sandvik Manufacturing and Machining Solutions announced that it had acquired a minority stake in Oqton, a leading provider of AI-powered manufacturing solutions.
- On May 7, Sandvik Rock Processing Solutions announced the acquisition of Kwatani, a leading supplier of screens and feeders for the mining industry. The transaction is expected to close during Q4 2021.
- On June 23, Sandvik Mining and Rock Solutions an-nounced the acquisition of Tricon, a supplier of rock tools for the mining industry. The transaction is expected to close during Q3 2021.
- On June 30, Sandvik Mining and Rock Solutions an-nounced it had received orders for battery-electric mining vehicles (BEVs) amounting to about SEK 140 million in June, marking Sandvik’s highest ever order intake for mining BEVs in a single month.
AFTER THE SECOND QUARTER
- On July 1, Sandvik Manufacturing and Machining Solutions announced the acquisition of Cambrio, a leading company with an end-to-end portfolio in CAD/CAM software. The transaction is expected to close during the second half of 2021.
- On July 7, Sandvik Mining and Rock Solutions announced the completion of the acquisition of DSI Underground. In 2020, DSI Underground had revenues of about EUR 516 million (excluding the four joint ventures included in the acquisition) and around 2,000 employees. The purchase price is approximately EUR 943 million on a cash and debt free basis.
On July 8, it was announced that Christophe Sut has been appointed as President of the Sandvik Manufacturing Solutions Business Area segment and a new member of the Sandvik Group Executive Management, effective no later than 1 January 2022.
- On July 12, Sandvik Manufacturing and Machining Solu-tions announced the acquisition of DWFritz Automation Inc., a leading global provider of precision metrology, inspection- and assembly solutions for advanced manufacturing. The transaction is expected to close during the second half of 2021.
- On July 15, Sandvik Machining Solutions within business area Sandvik Manufacturing and Machining Solutions announced the acquisition of Fabryka Narzędzi FANAR S.A. (Fanar). The transaction is expected to close during the fourth quarter of 2021.
CAPEX (CASH) Estimated at SEK <4.0 billion for 2021.
CURRENCY EFFECTSBased on currency rates at the end of June 2021, it is estimated that transaction and translation currency effects will have an impact of about SEK +/- 0 million on operating profit for the third quarter of 2021, compared with the year-earlier period.
METAL PRICE EFFECTS In view of currency rates, inventory levels and metal prices at the end of June 2021, it is estimated that there will be an impact of about SEK +200 million on operating profit in Sandvik Materials Technology for the third quarter of 2021.
INTEREST NET Estimated at about SEK -0.4 billion in 2021.
TAX RATE Estimated at 22% - 24% for 2021, excluding items affecting comparability
Guidance below relates to continuing operations.Sandvik does not provide a market outlook or business perfor-mance forecasts. However, guidance relating to certain
non-operational key figures considered useful when modeling financial outcome is provided in the table below:
GUIDANCE AND FINANCIAL TARGETS
SIGNIFICANT EVENTS
Sandvik has four long-term financial targets, defined in 2019:
GROWTHA growth of at least 5% through a business cycle.
TROUGH EBIT MARGINA trough EBIT margin of at least 16% rolling 12 months, adjust-ed for IAC and metal prices.
DIVIDEND PAYOUT RATIOA dividend payout ratio of 50% of EPS, adjusted for IAC, through a business cycle.
NET DEBT/EQUITY RATIOA net debt/equity ratio below 0.5.
The 2030 sustainability targets focus on the areas of circulari-ty, climate, people and ethics. These targets are reported on a quarterly basis and can be found on page 11.

Q2 SANDVIK INTERIM REPORT 2021
FOR ADDITIONAL INFORMATION, PLEASE CALL SANDVIK INVESTOR RELATIONS +46 8 456 11 00 OR VISIT HOME.SANDVIK 15
This interim report was prepared in accordance with IFRS, ap-plying IAS 34, Interim Financial Reporting. The same accounting and valuation policies were applied as in the most recent annual report with the exception of new and revised standards and interpretations effective as of January 1, 2021.
The interim report for the Parent Company has been prepared in accordance with the Annual Accounts Act and the Securities Market Act, which is in line with standard RFR 2 Reporting by a legal entity issued by the Swedish Financial Reporting Board.
IASB has published amendments of standards that are effec-tive as of January 1, 2021 or later. The standards have not had any material impact on the financial reports.
TRANSACTIONS WITH RELATED PARTIES
No transactions between Sandvik and related parties that significantly affected the company’s position and results took place.
IMPACT ON THE FINANCIAL REPORTING DUE TO COVID-19
As of June 30, there has been no significant impact on the financial reporting due to Covid-19 related to valuation of good-will, expected credit losses, valuation of inventory or govern-ment grants.
ACCOUNTING POLICIES
As an international group with a wide geographic spread, Sandvik is exposed to several strategic, business and financial risks. Strategic risk at Sandvik is defined as emerging risks affecting the business long-term, such as industry shifts, technological shifts and macro-economic developments. The business risks can be divided into operational, sustainability, compliance, legal and commercial risks. The financial risks include currency risks, interest rates, raw mate-rial prices, tax risks and more. These risk areas can all impact the business negatively both long and short-term but often also create business opportunities if managed well. Risk management at Sandvik begins with an assessment in operational management teams where the material risks for their operations are first identified, followed by an evaluation of the probability of the risks occurring and their potential impact on the Group. Once the key risks have been identified and evaluated risk mitigating activities to eliminate or reduce the risks are agreed on. For a more detailed description of Sandvik’s analysis of risks and risk universe, see the Annual Report for 2020.
Impacts from Covid-19The second quarter noted a strong year on year increase in both order intake and revenues, explained by easier comparables as the second quarter last year was heavily impacted by the pandemic. Sequentially, the demand remained on par with the first quarter, indicating an underlying solid demand. With the general business environment improving with higher demand and hence higher market activities as a consequence, imbalances in the global supply chain has to a certain extent had an impact on Sandvik's operations. Fur-thermore, despite an improved covid situation, risks and uncertainties connected to the pandemic do remain and are monitored closely by Sandvik. Sandvik is also continuously following up on risks related to the Covid-19 pandemic and take necessary measures to protect employees, and other stakeholders.
RISK ASSESSMENT

Q2 SANDVIK INTERIM REPORT 2021
FOR ADDITIONAL INFORMATION, PLEASE CALL SANDVIK INVESTOR RELATIONS +46 8 456 11 00 OR VISIT HOME.SANDVIK 16
THE GROUPINCOME STATEMENT
FINANCIAL REPORTS SUMMARY
N/M = not meaningful. For definitions see home.sandvik
MSEK Q2 2020 Q2 2021 CHANGE % Q1-Q2 2020 Q1-Q2 2021 CHANGE %
Continuing operations
Revenues 20,230 23,460 16 43,851 45,151 3
Cost of goods sold -13,634 -13,615 0 -28,068 -26,241 -7
Gross profit 6,597 9,845 49 15,783 18,910 20
% of revenues 32.6 42.0 36.0 41.9
Selling expenses -2,496 -2,865 15 -5,695 -5,509 -3
Administrative expenses -1,374 -1,207 -12 -2,967 -2,630 -11
Research and development costs -819 -912 11 -1,734 -1,753 1
Other operating income and expenses -400 -107 -73 -1,117 -7 -99
Operating profit 1,508 4,754 N/M 4,270 9,010 N/M
% of revenues 7.5 20.3 9.7 20.0
Financial income 83 164 96 357 264 -26
Financial expenses -63 -261 N/M -754 -632 -16
Net financial items 20 -97 N/M -396 -368 -7
Profit after net financial items 1,528 4,657 N/M 3,874 8,642 N/M
% of revenues 7.6 19.9 8.8 19.1
Income tax -430 -1,143 N/M -941 -1,943 N/M
Profit for the period, continuing operations 1,098 3,514 N/M 2,933 6,700 N/M
% of revenues 5.4 15.0 6.7 14.8
Loss for the period, discontinued operations -4 -3 -28 -16 -6 -62
Profit for the period, Group total 1,094 3,511 N/M 2,917 6,693 N/M
Profit (loss) for the period attributable to
Owners of the parent company 1,101 3,513 2,930 6,690
Non-controlling interest -7 3 -13 3
Earnings per share, SEK
Continuing operations, basic 0.88 2.80 N/M 2.35 5.34 N/M
Continuing operations, diluted 0.88 2.80 N/M 2.35 5.33 N/M
Group total, basic 0.88 2.80 N/M 2.34 5.33 N/M
Group total, diluted 0.88 2.80 N/M 2.33 5.33 N/M
OTHER COMPREHENSIVE INCOMEItems that will not be reclassified to profit (loss)
Actuarial gains (losses) on defined benefit pension plans 1,687 758 169 2,963
Tax relating to items that will not be reclassified -366 -162 -34 -623
Total items that will not be reclassified to profit (loss) 1,321 596 135 2,340
Items that will be reclassified subsequently to profit (loss)
Foreign currency translation differences -2,943 -632 -881 1,673
Cash flow hedges 7 12 8 24
Tax relating to items that may be reclassified -3 -2 -3 -6
Total items that may be reclassified subsequently to profit (loss)
-2,939 -623 -876 1,691
Total other comprehensive income -1,618 -26 -741 4,031
Total comprehensive income -524 3,485 2,176 10,724
Total comprehensive income attributable to
Owners of the parent company -517 3,481 2,189 10,720
Non-controlling interest -7 3 -13 4

Q2 SANDVIK INTERIM REPORT 2021
FOR ADDITIONAL INFORMATION, PLEASE CALL SANDVIK INVESTOR RELATIONS +46 8 456 11 00 OR VISIT HOME.SANDVIK 17
THE GROUPBALANCE SHEET CONTINUING AND DISCONTINUED OPERATIONS
NET DEBT
CHANGES IN EQUITY
For definitions see home.sandvik
MSEK DEC 31, 2020 JUN 30, 2020 JUN 30, 2021
Intangible assets 21,004 19,289 21,136
Property, plant and equipment 23,975 25,048 24,087
Right-of-use assets 2,891 3,083 3,245
Financial assets 7,285 7,342 7,953
Inventories 21,473 24,780 24,662
Current receivables 18,387 19,548 21,968
Cash and cash equivalents 23,752 18,952 17,251
Assets held for sale 361 152 203
Total assets 119,128 118,192 120,506
Total equity 65,082 64,241 67,707
Non-current interest-bearing liabilities 22,358 22,648 19,033
Non-current non-interest-bearing liabilities 3,741 3,802 3,896
Current interest bearing liabilities 4,352 3,755 3,163
Current non-interest-bearing liabilities 23,424 23,568 26,537
Liabilities related to assets held for sale 171 178 169
Total equity and liabilities 119,128 118,192 120,506
Group total
Net working capital 1) 20,096 24,491 22,878
Loans 14,900 15,450 12,297
Non-controlling interests in total equity 1 2 5
1) Total inventories, trade receivables, accounts payable and other current non-interest bearing receivables and liabilities, excluding tax assets and liabilities
MSEK DEC 31, 2020 JUN 30, 2020 JUN 30, 2021
Interest-bearing liabilities excluding pension liabilities and leases 14,923 15,467 12,314
Less cash and cash equivalents -23,752 -18,952 -17,251
Financial net cash -8,829 -3,485 -4,937
Net pensions liabilities 8,509 7,314 5,484
Leases 2,965 3,157 3,338
Net debt 2,645 6,986 3,885
Net debt to equity ratio 0.04 0.11 0.06
MSEKEQUITY RELATED TO OWNERS OF THE
PARENT COMPANYNON-CONTROLLING
INTEREST TOTAL EQUITY
Opening equity January 1, 2020 61,844 14 61,858
Adjustment on correction of error -53 – -53
Opening equity January 1, 2020 61,791 14 61,805
Changes in non-controlling interest 2 -2 0
Total comprehensive income for the period 3,077 -11 3,066
Share based program 210 – 210
Closing equity December 31, 2020 65,081 1 65,082
Opening equity January 1, 2021 65,081 1 65,082
Changes in non-controlling interest 0 0 0
Total comprehensive income for the period 10,720 4 10,724
Share based program 41 0 41
Dividends -8,140 – -8,140
Closing equity June 30, 2021 67,703 5 67,707

Q2 SANDVIK INTERIM REPORT 2021
FOR ADDITIONAL INFORMATION, PLEASE CALL SANDVIK INVESTOR RELATIONS +46 8 456 11 00 OR VISIT HOME.SANDVIK 18
THE GROUPCASH FLOW STATEMENT
For definitions see home.sandvik
1) Figures have been restated due to reclassification of payment to pension fund from financing activities to operating activities.
MSEK Q2 2020 Q2 2021 Q1-Q2 2020 Q1-Q2 2021
Continuing operations
Cash flow from operating activities
Income after net financial items 1,528 4,657 3,874 8,642
Adjustment for depreciation, amortization and impairment losses 1,637 1,355 3,108 2,687
Other adjustments for non-cash items 583 -443 1,491 -541
Payment to pension fund -81 -95 -273 -204
Income tax paid -614 -1,136 -1,642 -2,161
Cash flow from operating activities before changes in working capital 3,0531) 4,338 6,5581) 8,423
Changes in working capital
Change in inventories 267 -1,299 -863 -2,630
Change in operating receivables 2,284 -1,363 1,061 -2,773
Change in operating liabilities -2,640 1,510 -984 3,095
Cash flow from changes in working capital -89 -1,152 -786 -2,308
Investments in rental equipment -307 -313 -436 -498
Proceeds from sale of rental equipment 122 74 157 118
Cash flow from operating activities, net 2,7801) 2,948 5,4941) 5,735
Cash flow from investing activities
Acquisitions of companies and shares, net of cash acquired -132 4 -221 7
Proceeds from sale of companies and shares, net of cash disposed 32 374 799 385
Acquisitions of tangible assets -719 -570 -1,317 -1,104
Proceeds from sale of tangible assets 111 41 235 64
Acquisitions of intangible assets -100 -154 -215 -301
Other investments, net -37 -60 -29 -72
Cash flow from investing activities, net -846 -364 -747 -1,021
Cash flow from financing activities
Repayment of borrowings -137 -19 -2,184 -2,746
Proceeds from borrowings 145 16 162 24
Amortization, lease liabilities -231 -263 -481 -516
Dividends paid – -8,140 – -8,140
Cash flow from financing activities, net -2231) -8,406 -2,5031) -11,378
Total cash flow from continuing operations 1,711 -5,823 2,244 -6,664
Total cash flow from discontinued operations -54 -10 -60 -14
Cash flow for the period, Group total 1,657 -5,833 2,184 -6,678
Cash and cash equivalents at beginning of the period 17,469 23,137 16,987 23,752
Foreign exchange rate differences in cash and cash equivalents -175 -53 -219 177
Cash and cash equivalents at the end of the period 18,952 17,251 18,952 17,251
Group Total
Cash flow from operations 2,725 2,940 5,433 5,723
Cash flow from investing activities -845 -366 -746 -1,023
Cash flow from financing activities -223 -8,406 -2,503 -11,378
Group total cash flow 1,657 -5,833 2,184 -6,678

Q2 SANDVIK INTERIM REPORT 2021
FOR ADDITIONAL INFORMATION, PLEASE CALL SANDVIK INVESTOR RELATIONS +46 8 456 11 00 OR VISIT HOME.SANDVIK 19
THE PARENT COMPANYINCOME STATEMENT
BALANCE SHEET
MSEK Q2 2020 Q2 2021 Q1-Q2 2020 Q1-Q2 2021
Revenues 2,227 3,300 5,241 6,414
Cost of sales and services -500 -825 -849 -1,506
Gross profit 1,727 2,475 4,392 4,908
Selling expenses -236 -229 -508 -435
Administrative expenses -342 -421 -804 -761
Research and development costs -312 -354 -633 -680
Other operating income and expenses -263 -222 -372 -389
Operating profit 574 1,249 2,075 2,643
Result from shares in group companies -12 -814 -1,766 -772
Interest income/expenses and similar items -32 -113 -71 -77
Profit after net financial items 530 322 238 1,794
Appropriations 398 -9 2,559 -44
Income tax expenses -187 -333 -525 -537
Profit for the period 741 -20 2,272 1,213
MSEK DEC 31, 2020 JUN 30, 2020 JUN 30, 2021
Intangible assets 39 57 170
Property, plant and equipment 3,219 3,183 3,232
Financial assets 54,107 54,492 51,818
Inventories 676 806 729
Current receivables 6,294 4,269 5,179
Cash and cash equivalents – – 0
Total assets 64,335 62,807 61,128
Total equity 37,731 37,132 30,846
Untaxed reserves 937 663 982
Provisions 750 593 606
Non-current interest-bearing liabilities 11,346 12,461 9,936
Non-current non-interest-bearing liabilities 123 154 97
Current interest-bearing liabilities 10,466 8,060 15,873
Current non-interest-bearing liabilities 2,982 3,744 2,788
Total equity and liabilities 64,335 62,807 61,128
Interest-bearing liabilities and provisions minus cash and cash equivalents and interest-bearing assets 7,057 8,068 14,203
Investments in fixed assets 430 161 351
For definitions see home.sandvik

Q2 SANDVIK INTERIM REPORT 2021
FOR ADDITIONAL INFORMATION, PLEASE CALL SANDVIK INVESTOR RELATIONS +46 8 456 11 00 OR VISIT HOME.SANDVIK 20
MARKET OVERVIEW, THE GROUPORDER INTAKE BY REGION
CHANGE * SHARE CHANGE * SHAREMSEK Q2 2021 % % 1) % Q1-Q2 2021 % % 1) %
THE GROUP
Europe 9,451 63 63 37 18,406 24 28 36
North America 5,554 49 49 21 10,878 23 24 21
South America 1,337 88 88 5 2,691 50 50 5
Africa/Middle East 2,133 15 34 8 4,620 22 31 9
Asia 5,347 34 28 21 10,847 30 24 21
Australia 2,036 1 22 8 4,262 17 16 8
Total Continuing Operations 2) 25,857 43 47 100 51,704 26 27 100
SANDVIK MINING AND ROCK SOLUTIONS**
Europe 1,440 50 50 14 2,562 40 40 12
North America 2,219 39 39 21 4,377 37 37 21
South America 877 93 93 8 1,777 60 60 9
Africa/Middle East 1,825 15 37 18 4,005 27 38 19
Asia 2,228 46 30 21 4,328 40 25 21
Australia 1,809 -3 19 17 3,818 15 14 18
Total 2) 10,399 31 38 100 20,868 33 32 100
SANDVIK ROCK PROCESSING SOLUTIONS**
Europe 684 67 67 32 1,361 49 49 30
North America 471 70 70 22 1,028 24 24 23
South America 159 28 28 7 325 30 30 7
Africa/Middle East 163 27 27 8 352 3 3 8
Asia 533 68 68 25 1,167 71 71 26
Australia 137 88 88 6 273 63 63 6
Total 2,147 61 61 100 4,505 42 42 100
SANDVIK MANUFACTURING AND MACHINING SOLUTIONS
Europe 5,088 50 50 55 10,283 20 20 55
North America 1,989 48 48 21 3,901 13 13 21
South America 199 118 118 2 375 69 69 2
Africa/Middle East 71 58 58 1 142 8 8 1
Asia 1,856 23 23 20 3,820 14 14 20
Australia 67 4 4 1 128 0 0 1
Total 9,270 44 44 100 18,649 18 18 100
SANDVIK MATERIALS TECHNOLOGY
Europe 2,238 117 117 55 4,199 17 40 55
North America 875 73 73 22 1,572 17 24 20
South America 101 151 151 3 214 -0 -0 3
Africa/Middle East 73 -21 -21 2 121 -14 -14 2
Asia 730 16 16 18 1,532 26 26 20
Australia 23 166 166 1 43 65 65 1
Total 4,041 74 74 100 7,681 18 31 100
*At fixed exchange rates for comparable units compared with the year-earlier period. ** Last years figures has been restated due to the new BA structure as of January 1, 2021.
1) Excluding major orders which is defined as above SEK 400 million in Sandvik Rock Processing solutions and above SEK 200 million in Sandvik Mining and Rock Solutions and Sandvik Materials Technology. 2) Includes rental fleet order intake in Q2 of SEK 193 million and for the first six months SEK 383 million recognized according to IFRS 16.

Q2 SANDVIK INTERIM REPORT 2021
FOR ADDITIONAL INFORMATION, PLEASE CALL SANDVIK INVESTOR RELATIONS +46 8 456 11 00 OR VISIT HOME.SANDVIK 21
REVENUES BY REGION
MSEK Q2 2021 CHANGE*, % SHARE % Q1-Q2 2021 CHANGE*, % SHARE %
THE GROUP
Europe 8 276 19 35 16 034 5 36
North America 5 082 23 22 9 603 5 21
South America 1 125 51 5 2 191 29 5
Africa/Middle East 2 185 29 9 4 306 24 10
Asia 4 768 21 20 9 276 19 21
Australia 2 025 9 9 3 741 3 8
Total Continuing Operations 23 460 22 100 45 151 11 100
Discontinued Operations 0 0 0 0 0 0
Group total 1) 23 460 22 100 45 151 11 100
SANDVIK MINING AND ROCK SOLUTIONS**
Europe 1 014 -6 11 1 765 -10 10
North America 1 947 34 21 3 562 19 21
South America 726 64 8 1 417 33 8
Africa/Middle East 1 872 27 21 3 690 25 22
Asia 1 696 21 19 3 305 20 19
Australia 1 835 10 20 3 370 3 20
Total 1) 9 090 21 100 17 109 15 100
SANDVIK ROCK PROCESSING SOLUTIONS**
Europe 581 20 30 1 140 16 31
North America 482 30 25 842 29 23
South America 153 46 8 289 15 8
Africa/Middle East 178 42 9 350 30 9
Asia 468 40 24 866 40 23
Australia 102 -11 5 203 7 6
Total 1 964 29 100 3 691 25 100
SANDVIK MANUFACTURING AND MACHINING SOLUTIONS
Europe 4 985 37 55 9 844 14 55
North America 1 931 39 21 3 697 7 21
South America 189 112 2 364 57 2
Africa/Middle East 70 40 1 139 6 1
Asia 1 841 14 20 3 696 10 21
Australia 67 7 1 126 2 1
Total 9 083 33 100 17 865 13 100
SANDVIK MATERIALS TECHNOLOGY
Europe 1 697 -6 51 3 285 -11 51
North America 722 -20 22 1 502 -26 23
South America 57 -48 2 120 -22 2
Africa/Middle East 64 37 2 128 11 2
Asia 762 34 23 1 409 32 22
Australia 22 17 1 42 32 1
Total 3 324 -4 100 6 486 -9 100
* At fixed exchange rates for comparable units compared with the year-earlier period. ** Last years figures has been restated due to the new BA structure as of January 1, 2021.
1) Includes rental fleet revenues in Q2 of SEK 231 million and for the first six months SEK 402 million recognized according to IFRS 16.
Q2 SANDVIK INTERIM REPORT 2021
FOR ADDITIONAL INFORMATION, PLEASE CALL SANDVIK INVESTOR RELATIONS +46 8 456 11 00 OR VISIT HOME.SANDVIK 22
THE GROUP
* Change at fixed exchange rates for comparable units compared with the year-earlier period. ** Last years figures has been restated due to the new BA structure as of January 1, 2021.
1) Internal transactions had negligible effect on business area profits.
N/M = Non-meaningful.
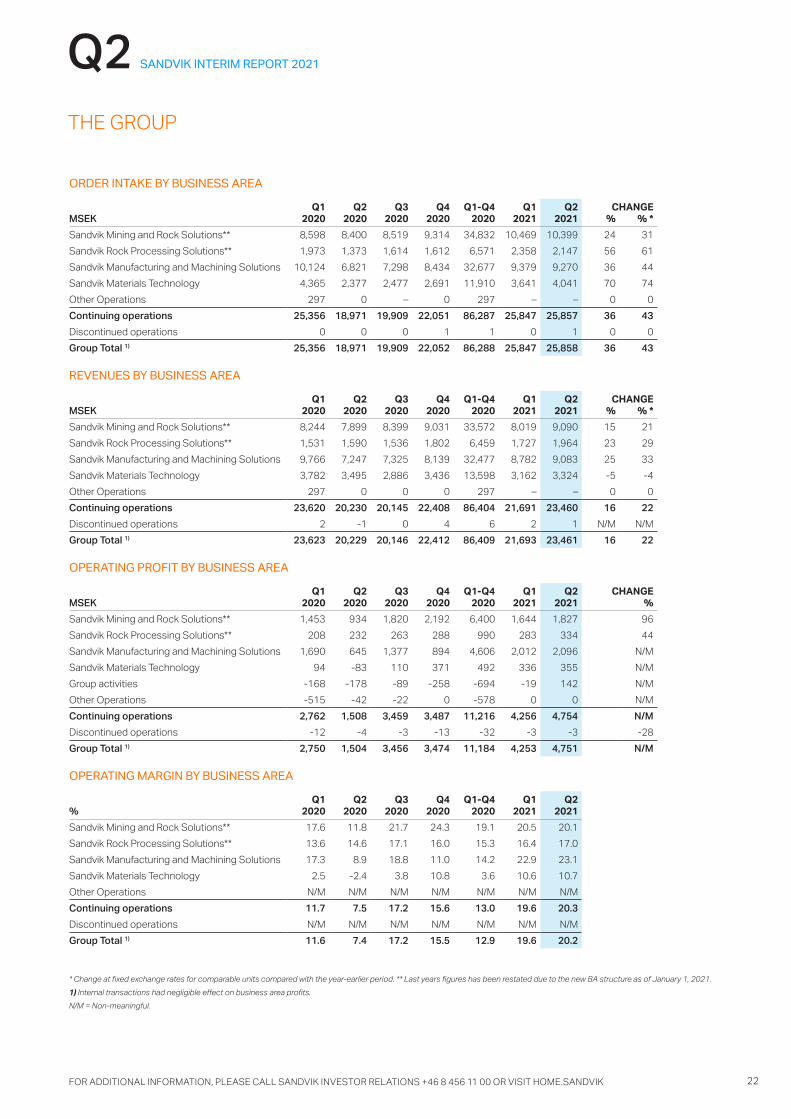
ORDER INTAKE BY BUSINESS AREA
Q1 Q2 Q3 Q4 Q1-Q4 Q1 Q2 CHANGE MSEK 2020 2020 2020 2020 2020 2021 2021 % % *
Sandvik Mining and Rock Solutions** 8,598 8,400 8,519 9,314 34,832 10,469 10,399 24 31
Sandvik Rock Processing Solutions** 1,973 1,373 1,614 1,612 6,571 2,358 2,147 56 61
Sandvik Manufacturing and Machining Solutions 10,124 6,821 7,298 8,434 32,677 9,379 9,270 36 44
Sandvik Materials Technology 4,365 2,377 2,477 2,691 11,910 3,641 4,041 70 74
Other Operations 297 0 – 0 297 – – 0 0
Continuing operations 25,356 18,971 19,909 22,051 86,287 25,847 25,857 36 43
Discontinued operations 0 0 0 1 1 0 1 0 0
Group Total 1) 25,356 18,971 19,909 22,052 86,288 25,847 25,858 36 43
REVENUES BY BUSINESS AREA
Q1 Q2 Q3 Q4 Q1-Q4 Q1 Q2 CHANGE MSEK 2020 2020 2020 2020 2020 2021 2021 % % *
Sandvik Mining and Rock Solutions** 8,244 7,899 8,399 9,031 33,572 8,019 9,090 15 21
Sandvik Rock Processing Solutions** 1,531 1,590 1,536 1,802 6,459 1,727 1,964 23 29
Sandvik Manufacturing and Machining Solutions 9,766 7,247 7,325 8,139 32,477 8,782 9,083 25 33
Sandvik Materials Technology 3,782 3,495 2,886 3,436 13,598 3,162 3,324 -5 -4
Other Operations 297 0 0 0 297 – – 0 0
Continuing operations 23,620 20,230 20,145 22,408 86,404 21,691 23,460 16 22
Discontinued operations 2 -1 0 4 6 2 1 N/M N/M
Group Total 1) 23,623 20,229 20,146 22,412 86,409 21,693 23,461 16 22
OPERATING PROFIT BY BUSINESS AREA
Q1 Q2 Q3 Q4 Q1-Q4 Q1 Q2 CHANGE MSEK 2020 2020 2020 2020 2020 2021 2021 %
Sandvik Mining and Rock Solutions** 1,453 934 1,820 2,192 6,400 1,644 1,827 96
Sandvik Rock Processing Solutions** 208 232 263 288 990 283 334 44
Sandvik Manufacturing and Machining Solutions 1,690 645 1,377 894 4,606 2,012 2,096 N/M
Sandvik Materials Technology 94 -83 110 371 492 336 355 N/M
Group activities -168 -178 -89 -258 -694 -19 142 N/M
Other Operations -515 -42 -22 0 -578 0 0 N/M
Continuing operations 2,762 1,508 3,459 3,487 11,216 4,256 4,754 N/M
Discontinued operations -12 -4 -3 -13 -32 -3 -3 -28
Group Total 1) 2,750 1,504 3,456 3,474 11,184 4,253 4,751 N/M
OPERATING MARGIN BY BUSINESS AREA
Q1 Q2 Q3 Q4 Q1-Q4 Q1 Q2% 2020 2020 2020 2020 2020 2021 2021
Sandvik Mining and Rock Solutions** 17.6 11.8 21.7 24.3 19.1 20.5 20.1
Sandvik Rock Processing Solutions** 13.6 14.6 17.1 16.0 15.3 16.4 17.0
Sandvik Manufacturing and Machining Solutions 17.3 8.9 18.8 11.0 14.2 22.9 23.1
Sandvik Materials Technology 2.5 -2.4 3.8 10.8 3.6 10.6 10.7
Other Operations N/M N/M N/M N/M N/M N/M N/M
Continuing operations 11.7 7.5 17.2 15.6 13.0 19.6 20.3
Discontinued operations N/M N/M N/M N/M N/M N/M N/M
Group Total 1) 11.6 7.4 17.2 15.5 12.9 19.6 20.2

Q2 SANDVIK INTERIM REPORT 2021
FOR ADDITIONAL INFORMATION, PLEASE CALL SANDVIK INVESTOR RELATIONS +46 8 456 11 00 OR VISIT HOME.SANDVIK 23
THE GROUP
* Last years figures has been restated due to the new BA structure as of January 1, 2021.
1) Internal transactions had negligible effect on business area profits.
Items affecting comparability on operating profit
Q1 2020 - Sandvik reported items affecting comparability of total SEK -965
million, comprising of costs of SEK -364 million related to Sandvik Manufac-
turing and Machining Solutions (SMM) and the closure of a manufacturing
plant in Germany. Other operations included a negative impact of SEK -526
million related to the realized effect from reversal of the accumulated cur-
rency translation in Other Comprehensive Income due to the divestment of
Varel. An additional SEK -75 million of costs related to the internal separation
of Sandvik Materials Technology (SMT), out of which SEK -45 million in SMT
and SEK -30 million in Group activities.
Q2 2020 - Sandvik reported items affecting comparability of SEK -1,329
million , comprising of cost related to structural and volume related savings
measures of SEK -1,334 million. As well as costs related to the separation of
SMT of SEK -24 million and a capital gain of SEK 29 million in SMT.
Q3 2020 - Sandvik reported items affecting comparability of SEK -35 million,
comprising of SEK -21 million of final purchase price adjustment of the divest-
ment of Varel. As well as cost related to the separation of SMT of SEK -13 million.
Q4 2020 - reported EBIT was impacted by one-off costs totaling SEK -1,018
million, comprising long-term savings measures announced in December at
a net cost of SEK -1,010 million, including a reversal of a provision made in
Q2 2020 for Sandvik Mining and Rock Technology (SMR) and costs related
to the separation of SMT of SEK -7 million.
Q1 2021 - Sandvik reported items affecting comparability of SEK 86 million,
comprising of a net gain of a divested property SEK 115 million and costs
related to the separation of SMT of SEK -29 million.
Q2 2021- Sandvik reported items affecting comparability of SEK 285 million,
comprising of a positive impact from closure of a pension plan in US of SEK
343 million and a release of SEK 39 million related to a structural initiative
during 2020 in SMT, offset by costs related to the separation of SMT of SEK
-97 in total.
ADJUSTED OPERATING PROFIT BY BUSINESS AREA
Q1 Q2 Q3 Q4 Q1-Q4 Q1 Q2 CHANGE MSEK 2020 2020 2020 2020 2020 2021 2021 %
Sandvik Mining and Rock Solutions* 1,453 1,601 1,820 2,011 6,885 1,644 1,827 14
Sandvik Rock Processing Solutions* 208 232 263 335 1,038 283 334 44
Sandvik Manufacturing and Machining Solutions 2,054 927 1,377 1,742 6,100 2,013 2,097 N/M
Sandvik Materials Technology 139 248 116 528 1,032 355 394 59
Group activities -138 -129 -82 -112 -461 -124 -182 42
Other Operations 11 -42 0 – -31 – 0 N/M
Continuing operations 3,728 2,837 3,494 4,505 14,563 4,170 4,469 58
Discontinued operations -12 -4 -3 -13 -32 -3 -3 -28
Group Total 1) 2,750 1,504 3,456 3,474 11,184 4,253 4,751 N/M
ADJUSTED OPERATING MARGIN BY BUSINESS AREA
Q1 Q2 Q3 Q4 Q1-Q4 Q1 Q2% 2020 2020 2020 2020 2020 2021 2021
Sandvik Mining and Rock Solutions* 17.6 20.3 21.7 22.3 20.5 20.5 20.1
Sandvik Rock Processing Solutions* 13.6 14.6 17.1 18.6 16.1 16.4 17.0
Sandvik Manufacturing and Machining Solutions 21.0 12.8 18.8 21.4 18.8 22.9 23.1
Sandvik Materials Technology 3.7 7.1 4.0 15.4 7.6 11.2 11.8
Other Operations 3.8 N/M N/M N/M -10.4 N/M N/M
Continuing operations 15.8 14.0 17.3 20.1 16.9 19.2 19.1
Discontinued operations N/M N/M N/M N/M N/M N/M N/M
Group Total 1) 15.7 14.0 17.3 20.0 16.8 19.2 19.0
ITEMS AFFECTING COMPARABILITY ON OPERATING PROFIT
Q1 Q2 Q3 Q4 Q1-Q4 Q1 Q2MSEK 2020 2020 2020 2020 2020 2021 2021
Sandvik Mining and Rock Solutions* – -667 0 182 -485 – –
Sandvik Rock Processing Solutions* – – – -48 -48 – –
Sandvik Manufacturing and Machining Solutions -364 -282 – -848 -1,494 0 -1
Sandvik Materials Technology -45 -331 -6 -157 -540 -19 -39
Group activities -30 -49 -7 -146 -233 105 324
Other Operations -526 – -21 – -547 – –
Continuing operations -965 -1,329 -35 -1,018 -3,347 86 285
Discontinued operations – – – – – – –
Group Total -965 -1,329 -35 -1,018 -3,347 86 285

Q2 SANDVIK INTERIM REPORT 2021
FOR ADDITIONAL INFORMATION, PLEASE CALL SANDVIK INVESTOR RELATIONS +46 8 456 11 00 OR VISIT HOME.SANDVIK 24
Items affecting comparability on net financial items
Q3 2020 - Sandvik reported items affecting comparability of SEK 588
million on net financial items related to the disposal of the minority holding in
Xiamen Golden Egret Special Alloy Co., Ltd. (Gesac).
ITEMS AFFECTING COMPARABILITY ON NET FINANCIAL ITEMS
Q1 Q2 Q3 Q4 Q1-Q4 Q1 Q2
MSEK 2020 2020 2020 2020 2020 2021 2021
Group activities – – 588 – 588 – –
Group Total – – 588 – 588 – –
TAXES EXCLUDING ITEMS AFFECTING COMPARABILITY
Q2 2020Reported tax,
MSEK Reported tax, % IAC, MSEK IAC, %Tax excluding
IAC, MSEKTax excluding
IAC, %
Continued operations -430 28.1 263 19.8 -693 24.3
Discontinued operations – – – – – –
Group total -430 28.2 263 19.8 -693 24.3
Q2 2021Reported tax,
MSEK Reported tax, % IAC, MSEK IAC, %Tax excluding
IAC, MSEKTax excluding
IAC, %
Continued operations -1,143 24.5 -145 50.9 -998 22.8
Discontinued operations – – – – – –
Group total -1,143 24.6 -145 50.9 -998 22.8
MSEK DEC 31, 2020 JUN 30, 2020 JUN 30, 2021
Inventories 21,718 24,780 24,743
Trade receivables 12,369 12,934 14,729
Account payables -7,024 -6,495 -8,579
Other receivables 3,128 3,725 3,964
Other liabilities -9,862 -10,453 -11,908
Net working capital 20,330 24,491 22,949
Tangible assets 23,975 25,048 24,087
Intangible assets 21,006 19,289 21,137
Other assets (incl. cash and cash equivalents) 74,032 73,703 75,161
Other liabilities -27,184 -27,370 -30,449
Capital employed 91,830 90,670 89,936
NET WORKING CAPITAL & CAPITAL EMPLOYED

Q2 SANDVIK INTERIM REPORT 2021
FOR ADDITIONAL INFORMATION, PLEASE CALL SANDVIK INVESTOR RELATIONS +46 8 456 11 00 OR VISIT HOME.SANDVIK 25
KEY FIGURES
CONTINUING OPERATIONS Q2 2020 Q2 2021 Q1-Q4 2020
Tax rate, % 28.1 24.5 22.3
Return on capital employed, % 1, 2) 6.9 21.3 13.3
Return on total equity, % 1) 6.8 20.1 13.6
Return on total capital, % 1) 5.3 16.1 10.2
Shareholders’ equity per share, SEK 51.2 54.0 51.9
Net debt/equity ratio 0.11 0.06 0.04
Net debt/EBITDA 0.72 0.14 0.41
Equity/assets ratio, % 54 56 55
Net working capital, % 1, 2) 31.0 24.2 27.5
Earnings per share, basic, SEK 0.88 2.80 6.99
Earnings per share, diluted, SEK 0.88 2.80 6.98
EBITDA, MSEK 3,146 6,109 17,180
Cash flow from operations, MSEK 2,780 2,948 15,414
Funds from operations (FFO), MSEK 3,053 4,338 14,063
Interest coverage ratio, % 4,828 1,662 1,497
Number of employees 3) 34,174 38,995 37,122
1) Quarter is quarterly annualized and the annual number is based on a four quarter average. 2) 12-month rolling 2Q 2021 ROCE reported at 18.5% (9.3%) and NWC % reported at 25.9 (27.5). 3) Full-time equivalent.
GROUP TOTAL Q2 2020 Q2 2021 Q1-Q4 2020
Tax rate, % 28.2 24.6 22.4
Return on capital employed, % 1, 2) 6.9 21.2 13.3
Return on total equity, % 1) 6.8 20.1 13.6
Return on total capital, % 1) 5.2 16.0 10.1
Shareholders’ equity per share, SEK 51.2 54.0 51.9
Net debt/equity ratio 0.11 0.06 0.04
Net debt/EBITDA 0.72 0.14 0.41
Equity/assets ratio, % 54 56 55
Net working capital, % 1, 2) 31.1 24.2 27.5
Earnings per share, basic, SEK 0.88 2.80 6.96
Earnings per share diluted, SEK 0.88 2.80 6.95
EBITDA, MSEK 3,141 6,106 17,149
Cash flow from operations, MSEK 2,725 2,940 15,347
Funds from operations (FFO), MSEK 2,982 4,330 13,935
Interest coverage ratio, % 4,714 1,658 906
Number of employees 3) 34,179 38,994 37,125
No. of shares outstanding at end of period (‘000) 1,254,386 1,254,386 1,254,386
Average no. of shares, (‘000) 1,254,386 1,254,386 1,254,386
Average no. of shares, diluted, (‘000) 1,256,213 1,255,882 1,256,055
1) Quarter is quarterly annualized and the annual number is based on a four quarter average. 2) 12-month rolling 2Q 2021 ROCE reported at 18.5% (9.1%) and NWC % reported at 25.9 (27.6). 3) Full-time equivalent.

Q2 SANDVIK INTERIM REPORT 2021
FOR ADDITIONAL INFORMATION, PLEASE CALL SANDVIK INVESTOR RELATIONS +46 8 456 11 00 OR VISIT HOME.SANDVIK 26
ADJUSTED EPS, DILUTED Profit/loss adjusted for items affecting comparability attribut-able to equity holders of the Parent Company divided by the average number of shares outstanding during the year including shares that will be allotted in the long-term incentive programs.
ADJUSTED OPERATING PROFIT Earnings before interest and taxes adjusted for items affecting comparability.
ADJUSTED OPERATING PROFIT EXCLUDING METAL PRICE
EFFECTSEarnings before interest and taxes adjusted for items affecting comparability and metal price effects. Metal price effects are one of the non-operational key figures that Sandvik provides quarterly guidance for, as the metal price effects are volatile and difficult for the investors to predict.
ADJUSTED PROFIT AFTER NET FINANCIAL ITEMS Profit after net financial items adjusted from items affecting comparability.
CAPITAL EMPLOYEDCapital employed is defined as total net working capital plus tangible and intangible assets, other current assets (incl. cash and cash equivalents) less other current liabilities.
FREE OPERATING CASH FLOWEarnings before interest, taxes and depreciation adjusted for non-cash items plus the change in net working capital minus investments and disposals of rental equipment and tangible and intangible assets.
ITEMS AFFECTING COMPARABILITY (IAC)Sandvik reports operating profit, profit after net financial items and earnings per share adjusted for IAC. IAC includes capital gains and losses from divestments and larger restructuring initiatives, impairments, capital gains and losses from divest-ments of financial assets as well as other material items having a significant impact on the comparability.
OPERATING PROFITEarnings before interest and taxes.
ORGANIC GROWTH Change in order intake and revenues after adjustments for exchange rate effects and structural changes such as divest-ments and acquisitions. Sandvik generates the majority of its revenues in currencies other than in the reporting currency (i.e. SEK, Swedish Krona) and divest and acquire companies. Organ-ic growth is used to analyze the underlying sales performance in the Group.
NET DEBTInterest-bearing current and non-current liabilities, including net pension liabilities and leases, less cash and cash equivalents.
NET DEBT TO EQUITY RATIOInterest-bearing current and non-current liabilities, including net pension liabilities and leases, less cash and cash equivalents divided by total equity.
NET WORKING CAPITAL (NWC)Total of inventories, trade receivables, account payables and other current non-interest-bearing receivables and liabilities, including those classified as liabilities and assets held for sale, but excluding tax assets and liabilities and provisions.
RETURN ON CAPITAL EMPLOYED (ROCE)Operating profit/loss plus financial income, as a percentage of a four quarter average capital employed.
DEFINITIONS OF ALTERNATIVE PERFORMANCE MEASURES
Sandvik presents certain financial measures that are not defined in the interim report in accordance with IFRS. Sandvik believes that these measures have an important purpose of providing useful supplemental information to investors and the company’s manage-ment when they allow evaluation of trends and the company’s performance. As not all companies calculate the financial measures in the same way, these are not always comparable to measures used by other companies. These financial measures should not be seen as a substitute for measures defined under IFRS. For definitions of alternative performance measures that Sandvik uses see below.

Q2 SANDVIK INTERIM REPORT 2021
FOR ADDITIONAL INFORMATION, PLEASE CALL SANDVIK INVESTOR RELATIONS +46 8 456 11 00 OR VISIT HOME.SANDVIK 27
DISCLAIMER STATEMENTSome statements herein are forward-looking and the actual outcome could be materially different. In addition to the factors explicitly commented upon, the actual outcome could be materially affected by other factors, for example the effect of economic conditions, exchange-rate and interest-rate movements, political risks, impact of competing products and their pricing, product development, commercialization and technological difficulties, supply disturbances, and major customer credit losses.
This information is information that Sandvik AB is obliged to make public pursuant to the EU Market Abuse Regulation and the Securities Markets Act. The information was submitted for publication, through the agency of the contact person set out below, at 11.30 CEST on July 16, 2021.
Additional information may be obtained from Sandvik Investor Relations on +46 70 782 63 74 (Louise Tjeder) or tel +46 79 060 87 17 (Emelie Alm).
A telephone conference will be held on July 16, 2021 at 13.00 CEST.
Information is available at home.sandvik/ir
CALENDAR
October 18, 2021 Report, third quarter 2021
January 19, 2022 Report, fourth quarter 2021
April 20, 2022 Report, first quarter 2022
July 15, 2022 Report, second quarter 2022
October 17, 2022 Report, third quarter 2022
Sandvik AB, Corp Reg. No: 556000-3468Box 510SE-101 30 Stockholm+46 8 456 11 00
Stockholm July 16, 2021Sandvik Aktiebolag (publ)
Stefan WidingPresident and CEO
Board member
The Company’s Auditor has not reviewed the report for the first six months of 2021.
CERTIFICATIONThe Board of Directors and the CEO certify that the six-month report gives a fair overview of the Parent Company’s and the Group’s operations, financial position and results, and describes the significant risks and uncertainties facing the Parent Company and the companies included in the Group.
Johan MolinChairman of the Board
Jennifer AllertonBoard member
Claes BoustedtBoard member
Marika FredrikssonBoard member
Andreas NordbrandtBoard member
Helena StjernholmBoard member
Kai WärnBoard member
Tomas KärnströmBoard member
Thomas LiljaBoard member