interim report third quarter
TRANSCRIPT

PRESS RELEASE 23 OCTOBER 2015
INTERIM REPORT THIRD QUARTERAND NINE MONTHS 2015

SANDVIK INTERIM REPORT 2015Q3
FOR ADDITIONAL INFORMATION, PLEASE CALL SANDVIK INVESTOR RELATIONS +46 8 456 11 00 OR VISIT SANDVIK.COM 2
WEAK DEMAND, STRONG CASH FLOW,PORTFOLIO REVIEW
1) Change from the preceding year at fixed exchange rates for comparable units2) Operating profit adjusted for nonrecurring charges of 1.8 billion SEK for the first quarter 2015, and by 4 million SEK for the third quarter 2014 and 75 million SEK for the second quarter 2014.3) Calculated on the basis of the shareholders’ share of profit for the period No dilutive impact during the period
4) Rolling 12 months
Tables and calculations do not always agree exactly with the totals due to rounding
Comparisons refer to the year-earlier period, unless stated otherwise
CEO’S COMMENT: “In the third quarter, all business areas noted weaker order intake year-on-year, prompting negative organic growth of 8%. Invoicing declined by 6% organically, with only Sandvik Mining reporting growth supported by deliveries on the solid order intake for equipment during the fi rst six months of 2015. Operating profi t declined by 7% and the operating margin contracted to 11.2%, as the positive impact from changed exchange rates and savings generated by ongoing cost-reducing actions did not off -set the negative impact on operations from lower volumes” says Mats Backman, CFO and acting President and CEO of Sandvik. “The balance sheet was strengthened as the net debt to equity ratio was reduced to 0.77 (0.85 in the preceding quarter), below our long term target of 0.8. Quarterly cash fl ow remained strong at 4 billion SEK, for a year-to-date cash fl ow of 9.4 billion SEK which is the strongest ever for a nine-month period for Sandvik, supported by a continuous focus on net working capital management. Net working capital in relation to invoiced sales was reduced signifi cantly year-on-year.”
“We made further progress with the supply chain optimization program, which targets consolidation of the manufacturing set-up, increased best country sourcing and moving closer to customers. This will also support our journey toward improved capital management by reducing inventory over the long term.” “On 1 October, we announced our intention to divest the Mining Systems operations, a separate product area within Sandvik Mining, supplying design and engineering of material handling systems for the mining industry. This on-going change to the product portfolio will make Sandvik Mining more transparent and focused on its core operations - mining equipment and the aftermarket off erings for both underground and surface mines - which we will continue to develop to ensure improved long-term value creation”. “During the quarter, a change to the Group’s manage-ment was announced and our new CEO, Björn Rosengren, will join Sandvik on 1 November. Björn is recognized for his vast industrial experience and we look forward to him joining Sandvik”.
Comments and numbers in the report relate to continuing operations, unless otherwise stated
FINANCIAL OVERVIEW, MSEK Q3 2014 Q3 2015 CHANGE % Q1-3 2014 Q1-3 2015 CHANGE %
Continuing operations
Order intake1) 20 346 19 726 -8 61 573 64 066 -6
Invoiced sales 1) 20 907 20 745 -6 60 829 64 905 -4
Gross profi t 7 719 7 519 -3 23 178 23 494 +1
% of invoiced sales 36.9 36.2 38.1 36.2
Operating profi t 2 488 2 325 -7 7 521 6 501 -14
% of invoiced sales 11.9 11.2 12.4 10.0
Adjusted operating profi t 2) 2 492 2 325 -7 7 600 8 279 +9
% of invoiced sales 2) 11.9 11.2 12.5 12.8
Profi t after fi nancial items 2 033 1 871 -8 6 182 5 043 -18
% of invoiced sales 9.7 9.0 10.2 7.8
Profi t for the period 1 489 1 251 -16 4 527 3 621 -20
% of invoiced sales 7.1 6.0 7.4 5.6
of which shareholders’ interest 1 498 1 261 -16 4 531 3 644 -20
Earnings per share, SEK 3) 1.19 1.01 3.61 2.90
Return on capital employed, % 4) 12.2 11.9 12.2 11.9
Cash fl ow from operations +3 538 +3 953 +12 +5 873 +9 389 +60
Net working capital, % 32 30 32 30
Discontinued operations
Profi t for the period -31 - 1 015 N/M -39 -1 255 N/M
Earnings per share, SEK 3) -0.02 -0.81 -0.03 -1.00
Group Total
Profi t for the period 1 458 236 -84 4 488 2 366 -47
Earnings per share, SEK 3) 1.17 0.20 3.58 1.90

SANDVIK INTERIM REPORT 2015Q3
FOR ADDITIONAL INFORMATION, PLEASE CALL SANDVIK INVESTOR RELATIONS +46 8 456 11 00 OR VISIT SANDVIK.COM 3
MARKET DEVELOPMENT AND EARNINGS
In the third quarter, organic order intake deteriorated by 8%, excluding major orders, and a decline was reported for all geographical regions and business areas. Invoicing declined by 6% organically, with only Sandvik Mining reporting growth. In the automotive segment, lower demand was noted in Asia, while North America and Europe remained stable compared with the year-earlier period. In the energy segment, the low oil price continued to adversly impact order intake for Sandvik Materials Technology’s capex related off ering. It also triggered increased competition within the more standardized tubular product off ering. Furthermore, an indirect negative impact on demand within the general engineering segment was noted. The underlying market for mining equipment remained largely stable although market uncertainty increased. Business conditions softened slightly in the mining aftermarket for consumables, Rock Tools. Demand in the aerospace segment increased and activity among customers in the nuclear power segment increased although the order intake is still on a low level. European order intake declined by 6% on a mixed market development, for example Germany was stable, the UK and Sweden weakened and Italy and France reported positive growth. In North America order intake declined by 10%, with the low single-digit growth for Sandvik Materials Technology and Sandvik Mining failing to off -set the double-digit declines in other business areas. In Asia order intake declined by 5% excluding major orders, adversely impacted by China. The contribution from changed exchange rates was signifi cant at 6% for order intake and 7% for invoiced sales.
Operating earnings declined by 7% year-on-year as the negative impact from lower volumes more than off -set the positive impact from changed exchange rates and savings measures. Within the scope of the supply chain optimization program one additional unit was closed, and the program generated savings of 139 million SEK in the quarter, for an annual run-rate of 559 million SEK. In parallel, the ongoing program for cost base adjustments generated savings of 63 million SEK in the quarter, for an annual run-rate of 285 million SEK. Changed exchange rates contributed approximately by 370 million SEK to earnings as the SEK depreciated against several major trading currencies year-on-year. Changed metal prices adversely impacted results by about 135 million SEK. Administrative and selling expenses decreased year-on-year in all business areas. The tax rate in the third quarter was 33.1% (26.7), however the write-down of 1 billion SEK in discontinued operations implied Group total tax rate of 72.4% in the quarter.
Change compared to same quarter last year. The table is multiplicative, i.e. the different components must be multiplied to determine the total effect.
Price/volume, % -8 -6Structure, % -1 -1Currency, % +6 +7
TOTAL, % -3 -1
Q3 ORDER INTAKE INVOICED SALES
GROWTHINVOICED SALES AND BOOK-TO-BILL
0.0
6.0
12.0
18.0
24.0
30.0
0
1 000
2 000
3 000
4 000
2013 2014 2015
Adj. operating profitOperating profitOperating marginAdj. op. marginReturn on capital employed
PERCENTMSEK
OPERATING PROFIT & RETURN
EARNINGS PER SHARE
80
90
100
110
120
130
0
6 000
12 000
18 000
24 000
30 000
2013 2014 2015
Invoicing Book-to-bill
MSEK PERCENT
0.0
2.0
4.0
6.0
8.0
0.0
0.5
1.0
1.5
2.0
2013 2014 2015
Adjusted quarterQuarterRolling 12 monthsAdj. rolling 12 months
SEK rollingSEK quarter

SANDVIK INTERIM REPORT 2015Q3
FOR ADDITIONAL INFORMATION, PLEASE CALL SANDVIK INVESTOR RELATIONS +46 8 456 11 00 OR VISIT SANDVIK.COM 4
Total assets for the Group were largely fl at compared with the pre-ceding quarter. Inventories and receivables decreased, resulting in a higher cash balance.
Net working capital decreased by about 1.8 billion SEK compared with the preceding quarter, to a total of 23.7 billion SEK. The sequential change was driven by volume reduction, primarily in inventory and accounts receivable, but also by the impact of changed exchange rates. The net working capital in relation to sales was 29.6%, down signifi cantly year-on-year (32.2) due to persistant focus on net working capital management, although it increased slightly compared with the preceding quarter (28.9), in line with seasonal pattern.
Capital expenditure in the third quarter amounted to 1 billion SEK (1.1)and 2.8 billion SEK (3.1) in the fi rst nine months of 2015. Investments are expected to increase in the fourth quarter of 2015 in line with the historical pattern. The updated guidance for capital expenditure during 2015 is set at about 4 billion SEK, compared with the previous guidance of about 4.5 billion SEK.
Net debt decreased to 30.2 billion SEK compared with 32.9 billion SEK in the preceding quarter. The decrease was attributable to continued strong cash fl ow in the quarter. Consequently, the net debt to equity ratio decreased to 0.77, below the long term target of 0.8, and down from 0.85 in the preceding quarter. Interest-bearing debt with short-term maturity accounted for 11% of total debt. Net pension liability was 6 billion SEK. Since the adoption of IAS 19R, the accumulated actuarial losses have reduced the equity by approximately 4 billion SEK, net of tax.
Cash fl ow from operations amounted to 4 billion SEK (3.5) which represented a strong level for the third-quarter, supported by quarterly earnings and a continued decrease of the net working capital.
CASH FLOW AND BALANCE SHEET
Cash flow Q3 2013 and Rolling 12 months adjusted for tax payment related to Intellectual Property rights, about -5,800 million SEK.
NET DEBT
CASH FLOW FROM OPERATIONS
NET WORKING CAPITAL
0
3 000
6 000
9 000
12 000
15 000
0
1 000
2 000
3 000
4 000
5 000
2013 2014 2015
Cash flow per quarterCash flow rolling 12 months
MSEK rollingMSEK
0.0
0.2
0.4
0.6
0.8
1.0
1.2
0
6 000
12 000
18 000
24 000
30 000
36 000
2013 2014 2015
Net debt Net debt/Equity
MSEK Net debt/Equity
20
23
26
29
32
35
38
41
15 000
17 000
19 000
21 000
23 000
25 000
27 000
29 000
2013 2014 2015
Net Working Capital
Percent of invoicing
PERCENTMSEK

SANDVIK INTERIM REPORT 2015Q3
FOR ADDITIONAL INFORMATION, PLEASE CALL SANDVIK INVESTOR RELATIONS +46 8 456 11 00 OR VISIT SANDVIK.COM 5
SANDVIK MACHINING SOLUTIONS
CHALLENGING MARKET CONDITIONS
SAVINGS SUPPORT EARNINGS
COST SAVING ACTIONS ONGOING
Market activity deteriorated in the energy and general engi-neering segments during the quarter, while remaining stable or positive in automotive and aerospace, year-on-year. Demand in the automotive segment remained stable in Europe and North America, while it declined in Asia due to a softening in China. A harsher environment was noted in the energy seg-ment due to the low oil price, which triggered a negative indirect impact on demand in the general engineering segment. Europe reported negative invoicing growth of 3% with mixed develop-ment between countries. North America declined by 11%, not least due to continued weak demand in the energy segment. Asia declined by 6%, as negative growth in China more than off -set the positive development in Japan.
Operating profi t was primarily adversely impacted by negative organic growth of 5%, in addition to a certain level of underproduction resulting from continuous eff orts to reduce inventory. The negative impact from the volume down-turn more than off -set the positive impact from changed exchange rates of 140 million SEK, structural savings of 47 mil-lion SEK generated by the supply chain optimization program and 13 million SEK from adjustment of cost base, totalling an annual run-rate of 241 million SEK. Consequently operating profi t declined by 2% compared with the year-earlier period and the operating margin amounted to 18.6% (19.5). During and following the close of the third quarter, and as a part of the previously announced actions to adjust the cost base, effi ciency measures impacting more than 300 employees globally have been initiated. In addition, some 100 employees from newly identifi ed cost savings actions were initiated. In total
more than 400 employees are impacted. Employees are within production as well as sales, administration and R&D, and the initiative is related to general ongoing effi ciency measures and softer than expected market development in 2015.
FINANCIAL OVERVIEW, MSEK Q3 2014 Q3 2015 CHANGE % Q1-3 2014 Q1-3 2015 CHANGE %
Order intake 7 711 7 841 -6 * 23 199 24 792 -4 *
Invoiced sales 7 658 7 836 -5 * 22 734 24 613 -3 *
Operating profit 1 496 1 459 -2 4 537 4 288 -5
% of invoiced sales 19.5 18.6 20.0 17.4
Adjusted operating profit** 1 496 1 459 -2 4 537 4 968 +10
% of invoiced sales** 19.5 18.6 20.0 20.2
Return on capital employed, %*** 27.7 26.9 27.7 26.9
Number of employees 18 906 18 577 -2 18 906 18 577 -2
* At fixed exchange rates for comparable units. ** Operating profit adjusted for nonrecurring charges of 680 million SEK in Q1 2015. *** Rolling 12 months
Change compared to same quarter last year. The table is multiplicative, i.e. the different components must be multiplied to determine the total effect.
Price/volume, % -6 -5Structure, % +0 +0Currency, % +8 +8
TOTAL, % +2 +2
Q3 ORDERINTAKE
INVOICED SALES
GROWTH
ORDER INTAKE, INVOICED SALES AND BOOK-TO-BILL
OPERATING PROFIT AND RETURN
10
15
20
25
30
0
500
1 000
1 500
2 000
2013 2014 2015Operating profit Adj. operating profitOperating margin Adj. operating marginROCE (12M rolling)
PERCENTMSEK
0
40
80
120
160
200
0
2 000
4 000
6 000
8 000
10 000
2013 2014 2015
Order intake Invoicing Book-to-bill
PERCENTMSEK
100

SANDVIK INTERIM REPORT 2015Q3
FOR ADDITIONAL INFORMATION, PLEASE CALL SANDVIK INVESTOR RELATIONS +46 8 456 11 00 OR VISIT SANDVIK.COM 6
SANDVIK MINING
While invoicing was strong in the quarter, the underlying mining market was characterized by increased uncertainty. The strong order intake for equipment in the fi rst half of the year, supported organic invoicing growth of 7% year-on-year, as orders were converted in to deliveries. Organic order intake declined by 3%, yielding a book-to-bill of 0.87 for the period. The underlying market for equipment remained largely stable, although uncertainty regarding demand increased during the period. Slight softening of customer activity for consumables, Rock Tools, in the aftermarket business was noted.
Operating profi t amounted to 847 million SEK which is an improvement of 32% on the year-earlier period. This was supported by improved absorption of costs in production due to the recent healthy order intake for equipment, savings from structural effi ciency measures, and the positive impact of 130 million SEK from changed exchange rates. Combined, these more than off -set the negative impact from provisions for stock obsolescence. During the period one more unit was closed within the scope of the supply chain optimization program, which generated total savings of 59 million SEK during the quarter, yielding an annual run-rate of 236 million SEK.
Following a review of the business portfolio, the intention to divest Mining Systems was announced on 1 October. Mining Systems is a business for large projects, focused on design, engineering and assembly of material handling systems. It is a separate unit with no signifi cant ties to the core equipment
or aftermarket off ering. Mining System is reported as discontinued operations in the fi nancial statements.
* At fixed exchange rates for comparable units. ** Operating profit adjusted for nonrecurring charges of 626 million in Q1 2015. *** Rolling 12 months.
FINANCIAL OVERVIEW, MSEK Q3 2014 Q3 2015 CHANGE % Q1-3 2014 Q1-3 2015 CHANGE %
Continuing operations
Order intake 4 931 4 977 -3 * 14 740 16 427 +1 *
Invoiced sales 5 121 5 712 +7 * 15 193 16 912 +1 *
Operating profit 640 847 +32 1 778 1 922 +8
% of invoiced sales 12.5 14.8 11.7 11.4
Adjusted operating profit** 640 847 +32 1 778 2 547 +43
% of invoiced sales** 12.5 14.8 11.7 15.1
Return on capital employed, %*** 12.6 19.8 12.6 19.8
Number of employees 10 577 10 488 -1 10 577 10 488 -1
MARGIN IMPROVEMENT FROM INTERNAL MEASURES
HIGHER MARKET UNCERTAINTY
PLAN TO DIVEST MINING SYSTEMS Change compared to same quarter last year.
The table is multiplicative, i.e. the different components must be multiplied to determine the total effect.
Price/volume, % -3 +7Structure, % +0 +0Currency, % +4 +4
TOTAL, % +1 +12
Q3 ORDERINTAKE
INVOICED SALES
GROWTH
ORDER INTAKE, INVOICED SALES AND BOOK-TO-BILL
OPERATING PROFIT AND RETURN
-10
3
16
29
42
- 500
0
500
1 000
1 500
2013 2014 2015
Operating profit Adj. operating profitOperating margin Adj. op. marginReturn on capital employed
PERCENTMSEK
0
40
80
120
160
0
2 000
4 000
6 000
8 000
2013 2014 2015
Order intake Invoicing Book-to-bill
PERCENTMSEK PERCENTMSEK
100

SANDVIK INTERIM REPORT 2015Q3
FOR ADDITIONAL INFORMATION, PLEASE CALL SANDVIK INVESTOR RELATIONS +46 8 456 11 00 OR VISIT SANDVIK.COM 7
FINANCIAL OVERVIEW, MSEK Q3 2014 Q3 2015 CHANGE % Q1-3 2014 Q1-3 2015 CHANGE %
Order intake 4 931 4 977 -3 * 14 740 16 427 +1 *
Invoiced sales 5 121 5 712 +7 * 15 193 16 912 +1 *
Operating profit 640 847 +32 1 778 1 922 +8
% of invoiced sales 12.5 14.8 11.7 11.4
Adjusted operating profit** 640 847 +32 1 778 2 547 +43
% of invoiced sales** 12.5 14.8 11.7 15.1
CONTINUING OPERATIONS
* At fixed exchange rates for comparable units. ** Operating profit adjusted for nonrecurring charges of 626 million in Q1 2015.
SANDVIK MINING
DISCONTINUED OPERATIONS
FINANCIAL OVERVIEW, MSEK Q3 2014 Q3 2015 CHANGE % Q1-3 2014 Q1-3 2015 CHANGE %
Order intake 635 466 -23 * 3 099 2 036 -38 *
Invoiced sales 1 685 1 347 -14 * 4 599 3 919 -16 *
Operating profit -26 -1 004 N/M -24 -1 225 N/M
% of invoiced sales -1.6 -74.6 -0.5 -31.3
Adjusted operating profit** -26 -6 +75 -24 -123 N/M
% of invoiced sales** -1.6 -0.5 -0.5 -3.2
FINANCIAL OVERVIEW, MSEK Q3 2014 Q3 2015 CHANGE % Q1-3 2014 Q1-3 2015 CHANGE %
Order intake 5 566 5 443 -5 * 17 838 18 463 -6 *
Invoiced sales 6 806 7 059 +2 * 19 792 20 831 -3 *
Operating profit 614 -157 N/M 1 754 697 -60
% of invoiced sales 9.0 -2.2 8.9 3.3
Adjusted operating profit** 614 841 +37 1 754 2 424 +38
% of invoiced sales** 9.0 11.9 8.9 11.6
SANDVIK MINING TOTAL
* At fixed exchange rates for comparable units. ** Operating profit adjusted for nonrecurring charges of 998 million in Q3 2015 and 730 million in Q1 2015.
* At fixed exchange rates for comparable units. ** Operating profit adjusted for nonrecurring charges of 998 million in Q3 2015 and 104 million in Q1 2015.
The market for Mining Systems (discontinued operations) remained weak as customers continue to postpone projects, and consequently price pressure remained tangible. No large orders were received in the third quarter and both order intake and invoicing declined by double digits year-on-year.
Mining Systems is reported as discontinued operations and reported a break-even operating result adjusted for the earlier announced write-down of 1 billion SEK, covering project-related write-downs, other provisions for project-related costs and impairment. Changed exchange rates positively impacted earnings by 30 million SEK.

SANDVIK INTERIM REPORT 2015Q3
FOR ADDITIONAL INFORMATION, PLEASE CALL SANDVIK INVESTOR RELATIONS +46 8 456 11 00 OR VISIT SANDVIK.COM 8
FINANCIAL OVERVIEW, MSEK Q3 2014 Q3 2015 CHANGE % Q1-3 2014 Q1-3 2015 CHANGE %
Order intake 3 335 2 847 -12 * 11 417 9 626 -17 *
Invoiced sales 3 735 3 161 -13 * 11 148 10 511 -7 *
Operating profit 482 49 -90 1 550 435 -72
% of invoiced sales 12.9 1.5 13.9 4.1
Adjusted operating profit** 482 49 -90 1 550 700 -55
% of invoiced sales** 12.9 1.5 13.9 6.7
Return on capital employed, %*** 14.1 5.7 14.1 5.7
Number of employees 7 132 6 610 -7 7 132 6 610 -7
SANDVIK MATERIALS TECHNOLOGY
* At fixed exchange rates for comparable units. ** Operating profit adjusted for nonrecurring charges of 265 million SEK in Q1 2015. *** Rolling 12 months
CHALLENGING CONDITIONS PERSIST IN OIL & GAS INDUSTRY
COST SAVING ACTIONS ONGOING
NET WORKING CAPITAL AT ALL-TIME-LOW LEVEL
Change compared to same quarter last year. The table is multiplicative, i.e. the different components must be multiplied to determine the total effect.
Price/volume, % -12 -13Structure, % -8 -8Currency, % +7 +7
TOTAL, % -15 -15
Q3 ORDERINTAKE
INVOICED SALES
GROWTH
Subdued demand in the oil and gas industry prevailed in the third quarter and competition intensifi ed for the more standardized tubular off ering as competitors shifted focus to adjacent areas outside of the oil & gas industry, resulting in price pressure. The lower nickel price also trig-gered customers to place orders at a shorter notice. All major geographical regions except North America noted negative development compared with the corresponding period in 2014. No major orders were received in the quarter, thus negatively aff ecting order intake compared with the year-earlier period.
Earnings continued to be negatively aff ected as weak demand in the oil and gas industry resulted in underutiliza-tion in production. The contribution from changed exchange rates was 65 million SEK, while movements in metal prices had an adverse impact of about 135 million SEK on earnings. Excluding metal price eff ects, earnings amounted to 184 million SEK (311) or 5.8% (8.3). The seasonally weak third quarter was furthermore slightly adversly impacted by the price pressure in the more standardized tubular off ering.
Net working capital was reduced to a historically low level. How-ever the ratio to sales increased sequentially to 30.1% (28.6), in line with the normal seasonal pattern. Savings from the ongoing programs for cost base adjustment and supply chain optimiza-tion, initiated in the fi rst quarter 2015, amounted to an annual run-rate of 67 million SEK. Additional actions to mitigate the downturn were taken through the utilization of time banks, gen-
eral cost containment, reducing shift forms and the temporary work force, while also increasing the emphasis on additional sales in areas outside of the oil and gas industry.
ORDER INTAKE, INVOICED SALES AND BOOK-TO-BILL
OPERATING PROFIT AND RETURN
0
40
80
120
160
200
0
1 000
2 000
3 000
4 000
5 000
2013 2014 2015
Order intake Invoicing Book-to-bill
PERCENTMSEK
100
0
5
10
15
20
0
200
400
600
800
2013 2014 2015Adj. operating profit Operating profitOperating margin Adj. op. marginReturn on capital employed
PERCENTMSEK

SANDVIK INTERIM REPORT 2015Q3
FOR ADDITIONAL INFORMATION, PLEASE CALL SANDVIK INVESTOR RELATIONS +46 8 456 11 00 OR VISIT SANDVIK.COM 9
The market remained generally challenging as both order intake and invoicing declined compared with the year-earlier period. However a positive book-to-bill of 1.07 was reported. Overall, the underlying market continued to be relatively stronger in the US. Europe remained largely stable at a low level, while demand remained weak in China, Brazil, Russia and Southeast Asia. Order intake was supported by positive development for tunneling, particularly in Australia, although it declined for surface drilling and mobile crushing and screening. Furthermore the timing of orders negatively aff ected the overall order intake, despite receiving one large tunneling order for about 220 million SEK in Australia. Demand for rock tools, consumables and services remained largely stable. Negative growth in invoicing was driven by declines in all product areas except for breaking.
Earnings continued to improve versus the year-earlier period and the operating margin amounted to 4.9%, supported by the positive impact from changed exchange rates, the successful implementation of the supply chain optimization program and the ongoing effi ciency measures in the sales organization. Changed exchange rates had a positive impact on operating profi t of about 45 million SEK compared with the year-earlier period. Net working capital continued to decrease and reached the lowest level in several years. However the ratio to sales increased sequentially to 24.9%, due to lower demand and seasonally lower sales. In total, structural savings of 57 million SEK were achieved in the quarter for an annual run-rate of 228 million SEK – 124 million SEK from the previously
announced supply chain optimization program as well as 104 million SEK from the ongoing cost base adjustment program.
SANDVIK CONSTRUCTION
* At fixed exchange rates for comparable units, ** Operating profit adjusted for nonrecurring charges of 160 million SEK in Q1 2015,*** Rolling 12 months
FINANCIAL OVERVIEW, MSEK Q3 2014 Q3 2015 CHANGE % Q1-3 2014 Q1-3 2015 CHANGE %
Order intake 2 184 2 179 -6 * 6 533 6 902 -5 *
Invoiced sales 2 232 2 037 -15 * 6 384 6 464 -9 *
Operating profit 1 99 N/M 41 156 N/M
% of invoiced sales 0.0 4.9 0.6 2.4
Adjusted operating profit** 1 99 N/M 41 316 N/M
% of invoiced sales** 0.0 4.9 0.6 4.9
Return on capital employed, %*** -3.1 2.8 -3.1 2.8
Number of employees 2 967 2 944 -1 2 967 2 944 -1
CHALLENGING MARKETS
SIGNIFICANT MARGIN IMPROVEMENT
LARGE ORDER RECEIVEDChange compared to same quarter last year. The table is multiplicative, i.e. the different components must be multiplied to determine the total effect.
Price/volume, % -6 -15Structure, % +0 +0Currency, % +6 +7
TOTAL, % -0 -9
Q3 ORDERINTAKE
INVOICED SALES
GROWTH
ORDER INTAKE, INVOICED SALES AND BOOK-TO-BILL
OPERATING PROFIT AND RETURN
-20
-12
-4
4
12
20
-250
-150
-50
50
150
250
2013 2014 2015
Adj. operating profit Operating profitOperating margin Adj. op. marginReturn on capital employed
PERCENTMSEK
0
50
100
150
200
0
750
1 500
2 250
3 000
2013 2014 2015
Order intake Invoicing Book-to-bill
PERCENTMSEK

SANDVIK INTERIM REPORT 2015Q3
FOR ADDITIONAL INFORMATION, PLEASE CALL SANDVIK INVESTOR RELATIONS +46 8 456 11 00 OR VISIT SANDVIK.COM 10
SANDVIK VENTURE
Demand softened across all product areas and geographies except for Wolfram where the volume demand remained robust while declining tungsten prices adversely impacted order intake and invoicing compared with the year-earlier period. For Drilling and Completions (Varel) business activity weakened compared with the year-earlier period. However, signs of market stabilization in the US was noted during the latter part of the third quarter, although signifi cant price pressure persisted. Hyperion was also adversely impacted by the soft demand in mining, oil & gas, tungsten carbide powder and abrasives.
Earnings for the quarter were negatively impacted by persistently low demand and price pressure in the energy segment, underabsorption of costs in Wolfram due to seasonality involving planned production shut-down, as well as lower invoicing in Process Systems where weaker order intake in recent quarters fi ltered through. Changed exchange rates had a negative impact of 35 million SEK on earnings compared with the year-earlier period. In the quarter total savings of 37 million SEK were achieved, for an annual run-rate of 148 million SEK. This marks the achievement of the targeted annual savings (25 million SEK) in the previously announced program for cost base adjustment in parallel with additional cost saving actions taken to mitigate lower demand, in particular within oil and gas.
During the quarter Process Systems acquired SGL Technology B.V (SGL), a manufacturer of industrial steel-belt based processing equipment for the food processing
industry. In 2014, SGL’s invoicing amounted to about 60 million SEK and the company had 20 employees. SGL was incorporated in Venture as of 15 September 2015 and will strengthen Process Systems’ market position particularly in the food processing industry.
FINANCIAL OVERVIEW, MSEK Q3 2014 Q3 2015 CHANGE % Q1-3 2014 Q1-3 2015 CHANGE %
Order intake 2 182 1 878 -21 * 5 672 6 305 -16 *
Invoiced sales 2 155 1 994 -14 * 5 357 6 392 -9 *
Operating profit 133 91 -31 553 493 -11
% of invoiced sales 6.2 4.6 10.3 7.7
Adjusted operating profit** 137 91 -33 632 504 -20
% of invoiced sales** 6.3 4.6 11.8 7.9
Return on capital employed, %*** 9.6 6.0 9.6 6.0
Number of employees 4 149 3 938 -6 4 149 3 938 -6
* At fixed exchange rates for comparable units. ** Operating profit adjusted for nonrecurring charges of 10 million SEK in Q1 2015 and of 75 million SEK in Q2 2014 and 4 million SEK in Q3 2014. *** Rolling 12 months.
WEAK OVERALL DEMAND
UNDERUTILIZATION IMPACTS EARNINGS
ACQUISITION IN PROCESS SYSTEMS Change compared to same quarter last year.
The table is multiplicative, i.e. the different components must be multiplied to determine the total effect.
Price/volume, % -21 -14Structure, % +1 +0Currency, % +8 +8
TOTAL, % -14 -7
Q3 ORDERINTAKE
INVOICED SALES
GROWTH
ORDER INTAKE, INVOICED SALES AND BOOK-TO-BILL
OPERATING PROFIT AND RETURN
0
50
100
150
200
0
750
1 500
2 250
3 000
2013 2014 2015
Order intake Invoicing Book-to-bill
PERCENTMSEK
-10
0
10
20
30
-50
50
150
250
350
2013 2014 2015Adj. operating profit Operating profitOperating margin Adj. op. marginReturn on capital employed
PERCENTMSEK
SANDVIK INTERIM REPORT 2015Q3
FOR ADDITIONAL INFORMATION, PLEASE CALL SANDVIK INVESTOR RELATIONS +46 8 456 11 00 OR VISIT SANDVIK.COM 11
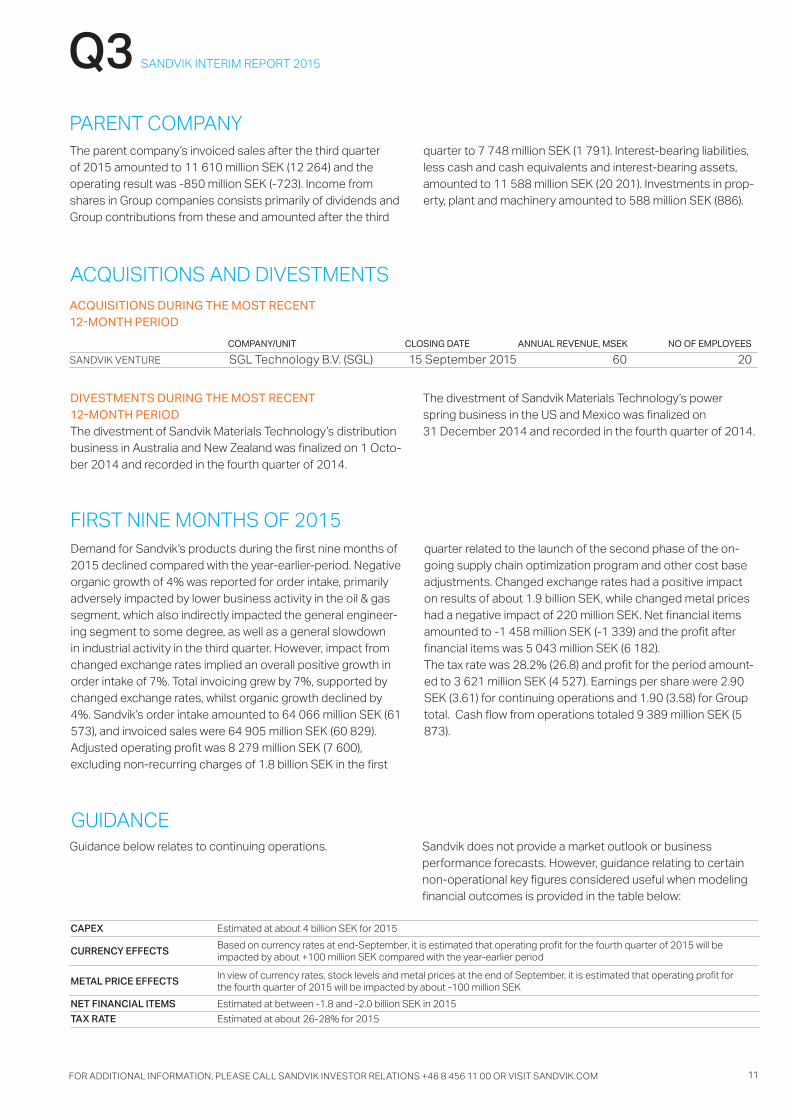
ACQUISITIONS DURING THE MOST RECENT 12-MONTH PERIOD
COMPANY/UNIT CLOSING DATE ANNUAL REVENUE, MSEK NO OF EMPLOYEES
SANDVIK VENTURE SGL Technology B.V. (SGL) 15 September 2015 60 20
The parent company’s invoiced sales after the third quarter of 2015 amounted to 11 610 million SEK (12 264) and the operating result was -850 million SEK (-723). Income from shares in Group companies consists primarily of dividends and Group contributions from these and amounted after the third
quarter to 7 748 million SEK (1 791). Interest-bearing liabilities, less cash and cash equivalents and interest-bearing assets, amounted to 11 588 million SEK (20 201). Investments in prop-erty, plant and machinery amounted to 588 million SEK (886).
PARENT COMPANY
DIVESTMENTS DURING THE MOST RECENT 12-MONTH PERIODThe divestment of Sandvik Materials Technology’s distribution business in Australia and New Zealand was fi nalized on 1 Octo-ber 2014 and recorded in the fourth quarter of 2014.
The divestment of Sandvik Materials Technology’s power spring business in the US and Mexico was fi nalized on 31 December 2014 and recorded in the fourth quarter of 2014.
ACQUISITIONS AND DIVESTMENTS
CAPEX Estimated at about 4 billion SEK for 2015
CURRENCY EFFECTSBased on currency rates at end-September, it is estimated that operating profi t for the fourth quarter of 2015 will be impacted by about +100 million SEK compared with the year-earlier period
METAL PRICE EFFECTSIn view of currency rates, stock levels and metal prices at the end of September, it is estimated that operating profi t for the fourth quarter of 2015 will be impacted by about -100 million SEK
NET FINANCIAL ITEMS Estimated at between -1.8 and -2.0 billion SEK in 2015
TAX RATE Estimated at about 26-28% for 2015
GUIDANCE
Demand for Sandvik’s products during the fi rst nine months of 2015 declined compared with the year-earlier-period. Negative organic growth of 4% was reported for order intake, primarily adversely impacted by lower business activity in the oil & gas segment, which also indirectly impacted the general engineer-ing segment to some degree, as well as a general slowdown in industrial activity in the third quarter. However, impact from changed exchange rates implied an overall positive growth in order intake of 7%. Total invoicing grew by 7%, supported by changed exchange rates, whilst organic growth declined by 4%. Sandvik’s order intake amounted to 64 066 million SEK (61 573), and invoiced sales were 64 905 million SEK (60 829).Adjusted operating profi t was 8 279 million SEK (7 600), excluding non-recurring charges of 1.8 billion SEK in the fi rst
quarter related to the launch of the second phase of the on-going supply chain optimization program and other cost base adjustments. Changed exchange rates had a positive impact on results of about 1.9 billion SEK, while changed metal prices had a negative impact of 220 million SEK. Net fi nancial items amounted to -1 458 million SEK (-1 339) and the profi t after fi nancial items was 5 043 million SEK (6 182). The tax rate was 28.2% (26.8) and profi t for the period amount-ed to 3 621 million SEK (4 527). Earnings per share were 2.90 SEK (3.61) for continuing operations and 1.90 (3.58) for Group total. Cash fl ow from operations totaled 9 389 million SEK (5 873).
FIRST NINE MONTHS OF 2015
Guidance below relates to continuing operations. Sandvik does not provide a market outlook or business performance forecasts. However, guidance relating to certain non-operational key fi gures considered useful when modeling fi nancial outcomes is provided in the table below:

SANDVIK INTERIM REPORT 2015Q3
FOR ADDITIONAL INFORMATION, PLEASE CALL SANDVIK INVESTOR RELATIONS +46 8 456 11 00 OR VISIT SANDVIK.COM 12
This interim report was prepared in accordance with IFRS, ap-plying IAS 34, Interim Financial Reporting. The same accounting and valuation policies were applied as in the most recent annual report with the exception of new and revised standards and interpretations eff ective from 1 January 2015.
The interim report for the Parent Company has been prepared in accordance with the Annual Accounts Act and the Securities Market Act, which is in line with standard RFR 2 Reporting by a legal entity, issued by the Swedish Financial Reporting Board.
IASB has published amendments of standards that are eff ec-tive as of 1 January 2015 or later. The standards have not had any material impact on the consolidated accounts.
The Mining Systems operations, which the Group intends to divest, have been classifi ed as discontinued operations in ac-cordance with IFRS 5. Comparative fi gures have been adjusted where necessary. In connection with the ongoing divestment, a write-down of assets has been made to a value that cor-responds to the estimated sale price less selling costs. The divestment is expected to be completed during 2016.
ACCOUNTING POLICIES
No transactions between Sandvik and related parties that signifi cantly aff ected the company´s position and results took place.
TRANSACTIONS WITH RELATED PARTIES
RISK ASSESSMENT
Sandvik is a global group represented in 150 countries and as such is exposed to a number of commercial and fi nancial risks. Accordingly, risk management is an important process for Sandvik in its work to achieve established targets. Effi cient risk management forms part of the ongoing review of the business
and forward-looking assessment of operations. Sandvik’s long-term risk exposure is assumed not to deviate from the inherent exposure associated with Sandvik’s ongoing business opera-tions. For a more in-depth analysis of risks, refer to Sandvik’s Annual Report for 2014.
– During the quarter, a change to the Group’s management was announced and the new CEO, Björn Rosengren, will join Sandvik on 1 November.
– On 1 October Sandvik announced its intention to divest the product area Mining Systems, which is a separate product area within Sandvik Mining and a supplier of design and engineering of material handling systems for the mining industry. In 2014 the Mining Systems operations, with 1,300 employees, had an-nual sales of 6.3 billion SEK representing 7% of Sandvik Group invoicing, and an operating loss was reported at a low single digit margin level.
As from the third quarter 2015 and until closure of the divest-ment, Mining Systems operations will be reported as discontin-ued operations in the Sandvik Group fi nancial statements.
A nonrecurring charge of 1 billion SEK related to Mining Sys-tems impacted the result for the discontinued operations in the third quarter 2015. This includes write-downs related to proj-ects, other provisions for project related costs and impairment.
– After the close of the third quarter Sandvik signed an agree-ment to divest its interest in the commercial business jet com-pany, Bromma Business Jet AB.
SIGNIFICANT EVENTS

SANDVIK INTERIM REPORT 2015Q3
FOR ADDITIONAL INFORMATION, PLEASE CALL SANDVIK INVESTOR RELATIONS +46 8 456 11 00 OR VISIT SANDVIK.COM 13
MSEK Q3 2014 Q3 2015 CHANGE % Q1-3 2014 Q1-3 2015 CHANGE %
Continuing operations
Invoiced sales 20 907 20 745 -1 60 829 64 905 +7
Cost of sales and services -13 188 -13 226 +0 -37 651 -41 411 +10
Gross profit 7 719 7 519 -3 23 178 23 494 +1
% of revenues 36.9 36.2 38.1 36.2
Selling expenses -3 024 -3 005 -1 -8 553 -9 634 +13
Administrative expenses -1 562 -1 452 -7 -4 864 -5 185 +7
Research and development costs -594 -622 +5 -1 891 -2 097 +11
Other operating income and expenses -51 -115 +125 -349 -77 -78
Operating profit 2 488 2 325 -7 7 521 6 501 -14
% of revenues 11.9 11.2 12.4 10.0
Net financial items -455 -454 -0 -1 339 -1 458 +9
Profit after financial items 2 033 1 871 -8 6 182 5 043 -18
% of revenues 9.7 9.0 10.2 7.8
Income tax -544 -620 +14 -1 655 -1 422 -14
Profit for the period, continuing operations 1 489 1 251 -16 4 527 3 621 -20
% of revenues 7.1 6.0 7.4 5.6
Discontinued operations
Invoiced sales 1 686 1 347 -20 4 598 3 919 -15
Operating profit -26 -1 004 N/M -24 -1 225 N/M
Profit after financial items -31 -1 015 N/M -39 -1 255 N/M
Profit for the period for the period, discontinued operations -31 -1 015 N/M -39 -1 255 N/M
Group total
Invoiced sales 22 593 22 092 -2 65 427 68 824 +5Operating profit 2 462 1 321 -46 7 497 5 276 -30Profit after financial items 2 001 856 -57 6 143 3 787 -38Profit for the period, Group total 1 458 236 -84 4 488 2 366 -47
Items that will not be reclassified to profit or loss
Actuarial gains/(losses) on defined benefit pension plans -588 957 -1 135 492
Tax relating to items that will not be reclassified 130 -185 281 -121
-458 772 -854 371
Items that will be reclassified subsequently to profit or loss
Foreign currency translation differences 652 252 1 717 4
Cash flow hedges -89 -21 -286 8
Tax relating to items that may be reclassified 12 3 62 -1
575 234 1 493 11
Total other comprehensive income 117 1 006 639 382
Total comprehensive income 1 575 1 243 5 128 2 748
Profit for the period attributable to
Owners of the Parent 1 467 247 4 492 2 388
Non-controlling interests -9 -11 -4 -23
Total comprehensive income attributable to
Owners of the Parent 1 580 1 232 5 127 2 747
Non-controlling interests -4 12 1 1
Earnings per share, SEK *
Continuing operations 1.19 1.01 3.61 2.90
Discontinued operations -0.02 -0.81 -0.03 -1.00
Group Total 1.17 0.20 3.58 1.90
* No dilution effects during the periodN/M = non-meaningful
FINANCIAL REPORTS SUMMARYTHE GROUP INCOME STATEMENT

SANDVIK INTERIM REPORT 2015Q3
FOR ADDITIONAL INFORMATION, PLEASE CALL SANDVIK INVESTOR RELATIONS +46 8 456 11 00 OR VISIT SANDVIK.COM 14
* Inventories plus trade receivables excl. prepaid income taxes, reduced by non-interest-bearing liabilities excl. tax liabilities** Current and non-current interest-bearing liabilities excluding net provisions for pensions, less cash and cash equivalents. *** Equity excluding accumulated actuarial gains/losses on defined benefit pension plans after tax
THE GROUP
MSEK 31 DEC 2014 30 SEP 2014 30 SEP 2015
Intangible assets 18 323 17 455 18 826
Property, plant and equipment 27 609 26 586 26 902
Financial assets 8 279 8 499 8 166
Inventories 24 056 24 972 23 073
Current receivables 21 725 22 151 19 931
Cash and cash equivalents 6 327 4 988 5 890
Assets held for sale - - 2 282
Total assets 106 319 104 651 105 070
Total equity 36 672 34 490 35 088
Non-current interest-bearing liabilities 41 426 40 763 38 537
Non-current non-interest-bearing liabilities 3 584 3 846 4 427
Current interest-bearing liabilities 2 679 3 596 3 867
Current non-interest-bearing liabilities 21 958 21 956 20 865
Liabilities held for sale - - 2 286
Total equity and liabilities 106 319 104 651 105 070
Group total
Net working capital* 25 250 26 762 23 476
Loans 36 907 37 985 35 934
Net debt ** 30 742 33 194 30 160
Net debt to equity ratio*** 0.75 0.87 0.77
Non-controlling interests in total equity 134 157 132
CHANGE IN TOTAL EQUITYMSEK EQUITY RELATED TO
OWNERS OF THE PARENTNON-CONTROLLING INTEREST
TOTALEQUITY
Opening equity, 1 January 2014 33 510 100 33 610
Total comprehensive income for the period 7 432 -17 7 415
Non-controlling interest in acquired companies - 33 33
Non-controlling interest new stock issue - 23 23
Personnel options program -80 - -80
Hedge of personnel options program 66 - 66
Dividends -4 390 -5 -4 395
Closing equity, 31 December 2014 36 538 134 36 672
Opening equity, 1 January 2015 36 538 134 36 672
Total comprehensive income for the period 2 747 1 2 748
Personnel options program 20 - 20
Hedge of personnel options program 41 - 41
Dividends -4 390 -3 -4 393
Closing equity, 30 September 2015 34 956 132 35 088
Opening equity, 1 January 2014 33 510 100 33 610
Total comprehensive income for the period 5 127 1 5 128
Non-controlling interest in acquired companies - 33 33
Non-controlling interest new stock issue - 23 23Personnel options program 33 - 33
Hedge of personnel options program 53 - 53
Dividends -4 390 - -4 390
Closing equity, 30 September 2014 34 333 157 34 490
BALANCE SHEET CONTINUING AND DISCONTINUED OPERATIONS

SANDVIK INTERIM REPORT 2015Q3
FOR ADDITIONAL INFORMATION, PLEASE CALL SANDVIK INVESTOR RELATIONS +46 8 456 11 00 OR VISIT SANDVIK.COM 15
THE GROUP
MSEK Q3 2014 Q3 2015 Q1-3 2014 Q1-3 2015
Continuing operations
Cash flow from operating activities
Income after financial income and expenses 2 033 1 871 6 182 5 043
Adjustment for depreciation, amortization and impairment losses 1 113 1 087 3 046 3 475
Adjustment for items that do not require the use of cash etc. -339 -171 -691 946
Income tax paid -342 -406 -1 368 -1 358
Cash flow from operations before changes in working capital, continuing operations 2 464 2 381 7 170 8 105
Changes in working capital
Change in inventories 976 712 2 998
Change in operating receivables 600 903 -654 34
Change in operating liabilities -373 103 -398 570
Cash flow from changes in working capital, continuing operations 1 203 1 719 -1 050 1 601
Investments in rental equipment -170 -189 -382 -472
Divestments of rental equipment 40 42 136 154
Cash flow from operations, continuing operations 3 538 3 953 5 873 9 389
Cash flow from investing activities
Acquisitions of companies and shares, net of cash -47 -7 -2 834 -7
Investments in tangible assets -902 -722 -2 529 -2 075
Proceeds from sale of tangible assets 94 52 226 111
Investments in intangible assets -157 -264 -569 -687
Proceeds from sale of intangible assets 0 2 5 3
Other investments, net -19 -16 -39 -27
Cash flow from investing activities, continuing operations -1 031 -954 -5 740 -2 683
Net cash flow after investing activities 2 507 2 999 134 6 706
Cash flow from financing activities
Change in interest-bearing debt 158 383 4 507 -2 119
Dividends paid 0 0 -4 390 -4 393
Cash flow from financing activities, continuing operations 158 383 117 -6 512
Cash flow from continuing operations 2 665 3 382 251 194
Cash flow from discontinued operations -239 -399 -470 -648
Cash flow for the period, Group total 2 426 2 983 -219 -453
Cash and cash equivalents at beginning of the period 2 490 2 936 5 076 6 327
Exchange-rate differences in cash and cash equivalents 72 -28 131 17
Cash and cash equivalents at the end of the period 4 988 5 890 4 988 5 890
Discontinued operations
Cash flow from operations -242 -385 -463 -668
Cash flow from investing activities 3 -14 -6 20
Group Total
Cash flow from operations 3 296 3 568 5 410 8 722
Cash flow from investing activities -1 028 -968 -5 746 -2 663
Cash flow from financing activities 158 383 117 -6 512
Group total cash flow 2 426 2 983 -219 -453
CASH FLOW STATEMENT

SANDVIK INTERIM REPORT 2015Q3
FOR ADDITIONAL INFORMATION, PLEASE CALL SANDVIK INVESTOR RELATIONS +46 8 456 11 00 OR VISIT SANDVIK.COM 16
THE PARENT COMPANY
BALANCE SHEET
MSEK 31 DEC 2014 30 SEP 2014 30 SEP 2015
Intangible assets 8 8 12
Property, plant and equipment 7 740 7 610 7 635
Financial assets 46 370 45 876 46 999
Inventories 3 591 3 980 3 500
Current receivables 17 279 17 001 15 139
Cash and cash equivalents 1 5 1
Total assets 74 989 74 480 73 286
Total equity 28 196 22 775 30 505
Untaxed reserves 4 4 4
Provisions 600 558 557
Non-current interest-bearing liabilities 25 761 26 690 23 489
Non-current non-interest-bearing liabilities 47 69 104
Current interest-bearing liabilities 8 478 18 895 13 095
Current non-interest-bearing liabilities 11 903 5 489 5 532
Total equity and liabilities 74 989 74 480 73 286
Pledged assets - - -
Contingent liabilities 15 938 15 886 15 628
Interest-bearing liabilities and provisions minus cash and cash equivalents and interest-bearing assets 9 561 20 201 11 588
Investments in fixed assets 1 227 886 588
MSEK Q1-3 2014 Q1-3 2015Revenue 12 264 11 610
Cost of sales and services -8 794 -7 891
Gross profit 3 470 3 719
Selling expenses -490 -391
Administrative expenses -1 653 -2 181
Research and development costs -967 -1 038
Other operating income and expenses -1 083 -959
Operating profit -723 -850
Income from shares in Group companies 1 791 7 748
Income from shares in associated companies 5 10
Interest income/expenses and similar items -747 -293
Profit after financial items 326 6 615
Income tax expense 2 23
Profit for the period 328 6 638
INCOME STATEMENT
The classification of certain profit and loss items has changed as from 2015 affecting administrative expenses and other operating income and expenses. Comparative figures have been adjusted accordingly.

SANDVIK INTERIM REPORT 2015Q3
FOR ADDITIONAL INFORMATION, PLEASE CALL SANDVIK INVESTOR RELATIONS +46 8 456 11 00 OR VISIT SANDVIK.COM 17
MARKET OVERVIEW, THE GROUP
* At fixed exchange rates for comparable units compared with the year-earlier period1) Excluding major orders
ORDER INTAKE
CHANGE * SHARE INVOICED SALES
CHANGE * SHARE
MARKET AREA MSEK % %1) % MSEK % %
THE GROUP
Europe 7 472 -6 -6 39 7 838 -4 39
North America 4 188 -10 -10 21 4 441 -12 21
South America 1 207 -9 -9 6 1 124 -12 5
Africa/Middle East 1 968 -18 -18 10 2 178 +13 10
Asia 3 846 -10 -5 19 4 268 -5 21
Australia 1 045 +16 -4 5 896 -12 4
Total continuing operations 19 726 -8 -8 100 20 745 -6 100
Discontinued operations 466 -23 -23 - 1 347 -14 -Group total 20 192 -8 -8 - 22 092 -6 -
SANDVIK MACHINING SOLUTIONS
Europe 4 006 -4 -4 51 4 051 -3 52
North America 1 785 -13 -13 23 1 804 -11 23
South America 188 -17 -17 2 186 -19 2
Africa/Middle East 118 +120 +120 2 107 +93 1
Asia 1 684 -4 -4 21 1 625 -6 21
Australia 60 -2 -2 1 63 -0 1
Total 7 841 -6 -6 100 7 836 -5 100
SANDVIK MINING
Europe 429 -11 -11 9 589 +24 10
North America 861 +4 +4 17 925 +16 16
South America 719 -6 -6 14 654 -5 11
Africa/Middle East 1 371 -10 -10 28 1 577 +17 28
Asia 956 +20 +20 19 1 230 +10 22
Australia 641 -11 -11 13 737 -16 13
Total continuing operations 4 977 -3 -3 100 5 712 +7 100
Discontinued operations 466 -23 -23 - 1 347 -14 -Sandvik Mining total 5 443 -5 -5 - 7 059 +2 -
SANDVIK MATERIALS TECHNOLOGY
Europe 1 432 -5 -5 51 1 511 -8 48
North America 781 +2 +2 27 826 -27 26
South America 56 +2 +2 2 61 +6 2
Africa/Middle East 35 -59 -59 1 69 +21 2
Asia 527 -39 -16 18 678 -16 21
Australia 16 -2 -2 1 16 -4 1
Total 2 847 -12 -7 100 3 161 -13 100
SANDVIK CONSTRUCTION
Europe 787 -5 -5 35 797 -14 39
North America 328 -13 -13 15 441 +3 22
South America 149 -12 -12 7 127 -37 6
Africa/Middle East 251 -52 -52 12 237 -9 12
Asia 366 -14 -14 17 388 -21 19
Australia 298 N/M +173 14 47 -16 2
Total 2 179 -6 -15 100 2 037 -15 100
SANDVIK VENTURE
Europe 819 -10 -10 43 890 -4 45
North America 430 -33 -33 23 440 -36 22
South America 95 -18 -18 5 97 +3 5
Africa/Middle East 192 -19 -19 10 188 -8 9
Asia 312 -28 -28 17 346 -7 17
Australia 30 -47 -47 2 33 -41 2
Total 1 878 -21 -21 100 1 994 -14 100
ORDER INTAKE AND INVOICED SALES PER MARKET AREA THIRD QUARTER 2015

SANDVIK INTERIM REPORT 2015Q3
FOR ADDITIONAL INFORMATION, PLEASE CALL SANDVIK INVESTOR RELATIONS +46 8 456 11 00 OR VISIT SANDVIK.COM 18
1) Change compared with preceding year at fixed exchange rates for comparable units2) Internal transactions had negligible effect on business area profitsN/M = non-meaningful
Q1 Q2 Q3 Q4 Q1-4 Q1 Q2 Q3 CHANGE Q3MSEK 2014 2014 2014 2014 2014 2015 2015 2015 % % 1)
Continuing operations
Sandvik Machining Solutions 7 719 7 768 7 711 8 129 31 328 8 596 8 355 7 841 +2 -6
Sandvik Mining 4 840 4 968 4 931 4 894 19 633 5 610 5 840 4 977 +1 -3
Sandvik Materials Technology 4 633 3 449 3 335 3 296 14 713 3 725 3 054 2 847 -15 -12
Sandvik Construction 2 336 2 013 2 184 2 038 8 571 2 376 2 348 2 179 -0 -6
Sandvik Venture 1 749 1 741 2 182 2 123 7 795 2 263 2 165 1 878 -14 -21
Group activities 4 6 3 5 17 4 4 4
Continuing operations 21 281 19 945 20 346 20 485 82 057 22 574 21 766 19 726 -3 -8
Discontinued operations 1 215 1 248 635 802 3 900 592 977 466 -27 -23
Group total 22 496 21 194 20 981 21 286 85 957 23 167 22 743 20 192 -4 -8
Q1 Q2 Q3 Q4 Q1-4 Q1 Q2 Q3 CHANGE Q3MSEK 2014 2014 2014 2014 2014 2015 2015 2015 % % 1)
Continuing operations
Sandvik Machining Solutions 7 400 7 676 7 658 8 122 30 856 8 438 8 339 7 836 +2 -5
Sandvik Mining 5 104 4 969 5 121 5 349 20 543 5 489 5 710 5 712 +12 +7
Sandvik Materials Technology 3 547 3 866 3 735 3 758 14 907 3 712 3 639 3 161 -15 -13
Sandvik Construction 1 871 2 281 2 232 2 169 8 553 2 144 2 283 2 037 -9 -15
Sandvik Venture 1 362 1 841 2 155 2 301 7 658 2 172 2 226 1 994 -7 -14Group activities 2 2 7 5 16 5 3 5
Continuing operations 19 286 20 635 20 908 21 704 82 533 21 960 22 200 20 745 -1 -6
Discontinued operations 1 497 1 416 1 685 1 689 6 288 1 374 1 198 1 347 -20 -14
Group total 20 783 22 051 22 593 23 394 88 821 23 334 23 398 22 092 -2 -6
Q1 Q2 Q3 Q4 Q1-4 Q1 Q2 Q3 CHANGE Q3MSEK 2014 2014 2014 2014 2014 2015 2015 2015 %
Continuing operations
Sandvik Machining Solutions 1 480 1 561 1 496 1 622 6 159 1 129 1 701 1 459 -2
Sandvik Mining 657 481 640 705 2 483 215 860 847 +32
Sandvik Materials Technology 421 647 482 330 1 880 100 286 49 -90
Sandvik Construction -11 51 1 4 45 -95 151 99 N/M
Sandvik Venture 233 187 133 335 888 192 210 91 -31
Group activities -333 -342 -264 -312 -1 250 -342 -231 -220Continuing operations 2 447 2 585 2 488 2 684 10 205 1 199 2 977 2 325 -7Discontinued operations 31 -29 -26 -61 -85 -147 -74 -1 004 N/M
Group total 2) 2 478 2 556 2 462 2 623 10 120 1 052 2 903 1 321 -46
Q1 Q2 Q3 Q4 Q1-4 Q1 Q2 Q3% 2014 2014 2014 2014 2014 2015 2015 2015
Continuing operations
Sandvik Machining Solutions 20.0 20.3 19.5 20.0 20.0 13.4 20.4 18.6
Sandvik Mining 12.9 9.7 12.5 13.2 12.1 3.9 15.1 14.8
Sandvik Materials Technology 11.9 16.7 12.9 8.8 12.6 2.7 7.9 1.5
Sandvik Construction -0.6 2.3 0.0 0.2 0.5 -4.4 6.6 4.9
Sandvik Venture 17.1 10.2 6.2 14.6 11.6 8.8 9.5 4.6Continuing operations 12.7 12.5 11.9 12.4 12.4 5.5 13.4 11.2Discontinued operations 2.1 -2.0 -1.6 -3.6 -1.3 -10.7 -6.2 -74.6
Group total 11.9 11.6 10.9 11.2 11.4 4.5 12.4 6.0
OPERATING MARGIN BY BUSINESS AREA
OPERATING PROFIT BY BUSINESS AREA
INVOICED SALES BY BUSINESS AREA
ORDER INTAKE BY BUSINESS AREA
THE GROUP

SANDVIK INTERIM REPORT 2015Q3
FOR ADDITIONAL INFORMATION, PLEASE CALL SANDVIK INVESTOR RELATIONS +46 8 456 11 00 OR VISIT SANDVIK.COM 19
Q1 Q2 Q3 Q4 Q1-4 Q1 Q2 Q3 CHANGE Q3MSEK 2014 2014 2014 2014 2014 2015 2015 2015 %
Continuing operations
Sandvik Machining Solutions 1 480 1 561 1 496 1 622 6 159 1 809 1 701 1 459 -2
Sandvik Mining 657 481 640 705 2 483 841 860 847 +32
Sandvik Materials Technology 421 647 482 259 1 809 365 286 49 -90
Sandvik Construction -11 51 1 4 45 65 151 99 N/M
Sandvik Venture 233 262 137 335 967 202 210 91 -31
Group activities -333 -342 -264 -312 -1 250 -306 -231 -220Continuing operations 2 447 2 660 2 492 2 613 10 213 2 977 2 977 2 325 -7Discontinued operations 31 -29 -26 -61 -85 -43 -74 -6 -75
Group total 2) 2 478 2 631 2 466 2 552 10 128 2 934 2 903 2 319 -6
Q1 Q2 Q3 Q4 Q1-4 Q1 Q2 Q3% 2014 2014 2014 2014 2014 2015 2015 2015
Continuing operations
Sandvik Machining Solutions 20.0 20.3 19.5 20.0 20.0 21.4 20.4 18.6
Sandvik Mining 12.9 9.7 12.5 13.2 12.1 15.3 15.1 14.8
Sandvik Materials Technology 11.9 16.7 12.9 6.9 12.1 9.8 7.9 1.5
Sandvik Construction -0.6 2.3 0.0 0.2 0.5 3.0 6.6 4.9
Sandvik Venture 17.1 14.2 6.4 14.6 12.6 9.3 9.5 4.6Continuing operations 12.7 12.9 11.9 12.0 12.4 13.6 13.4 11.2Discontinued operations 2.1 -2.0 -1.6 -3.6 -1.3 -3.1 -6.2 -0.5
Group total 11.9 11.9 10.9 10.9 11.4 12.6 12.4 10.5
THE GROUPADJUSTED OPERATING PROFIT BY BUSINESS AREA
ADJUSTED OPERATING MARGIN BY BUSINESS AREA
1) Change compared with preceding year at fixed exchange rates for comparable units2) Internal transactions had negligible effect on business area profitsN/M = non-meaningful
SANDVIK INTERIM REPORT 2015Q3
FOR ADDITIONAL INFORMATION, PLEASE CALL SANDVIK INVESTOR RELATIONS +46 8 456 11 00 OR VISIT SANDVIK.COM 20
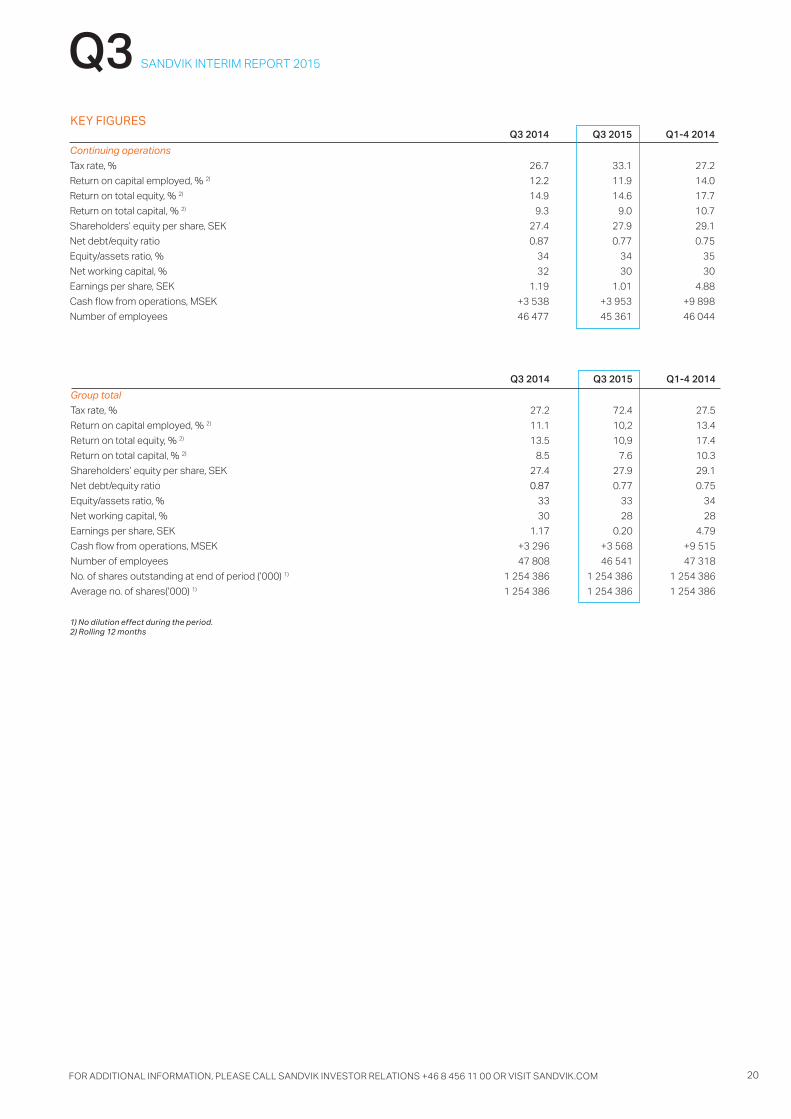
Q3 2014 Q3 2015 Q1-4 2014
Continuing operations
Tax rate, % 26.7 33.1 27.2
Return on capital employed, % 2) 12.2 11.9 14.0
Return on total equity, % 2) 14.9 14.6 17.7
Return on total capital, % 2) 9.3 9.0 10.7
Shareholders’ equity per share, SEK 27.4 27.9 29.1
Net debt/equity ratio 0.87 0.77 0.75
Equity/assets ratio, % 34 34 35
Net working capital, % 32 30 30
Earnings per share, SEK 1.19 1.01 4.88
Cash flow from operations, MSEK +3 538 +3 953 +9 898
Number of employees 46 477 45 361 46 044
1) No dilution effect during the period. 2) Rolling 12 months
KEY FIGURES
Q3 2014 Q3 2015 Q1-4 2014
Group total
Tax rate, % 27.2 72.4 27.5
Return on capital employed, % 2) 11.1 10,2 13.4
Return on total equity, % 2) 13.5 10,9 17.4
Return on total capital, % 2) 8.5 7.6 10.3
Shareholders’ equity per share, SEK 27.4 27.9 29.1
Net debt/equity ratio 0.87 0.77 0.75
Equity/assets ratio, % 33 33 34
Net working capital, % 30 28 28
Earnings per share, SEK 1.17 0.20 4.79
Cash flow from operations, MSEK +3 296 +3 568 +9 515
Number of employees 47 808 46 541 47 318
No. of shares outstanding at end of period (’000) 1) 1 254 386 1 254 386 1 254 386
Average no. of shares(’000) 1) 1 254 386 1 254 386 1 254 386

SANDVIK INTERIM REPORT 2015Q3
FOR ADDITIONAL INFORMATION, PLEASE CALL SANDVIK INVESTOR RELATIONS +46 8 456 11 00 OR VISIT SANDVIK.COM 21
Sandvik AB discloses the information provided herein pursuant to the Securities Markets Act and/or the Financial Instruments Trading Act. The information is submitted for publication on 23 October 2015 at 08:00 CET. The report for the fourth quarter 2015 will be published on 3 February 2016.
Additional information may be obtained from Sandvik Investor Relations at tel +46 8 456 14 94 (Ann-Sofie Nordh), +46 8 456 12 30 (Oskar Lindberg), +46 8 456 11 94 (Anna Vilogorac) or by [email protected].
A presentation and teleconference will be held on 23 October 2015 at 11:00 CET at the World Trade Center in Stockholm.
Information is available at www.sandvik.com/ir
CALENDAR 2016:3 February Fourth-quarter report 201528 April Annual General Meeting in Sandviken
Sandvik AB, Corp. Reg. No.: 556000-3468Box 510SE-101 30 Stockholm+46 8 456 11 00
AUDITORS’ REVIEW REPORT
IntroductionWe have reviewed the interim report of Sandvik AB as of 30 Sep-tember, 2015 and the nine-month period then ended. The Board of Directors and the President are responsible for the prepara-tion and presentation of this interim report in accordance with IAS 34 and the Annual Accounts Act. Our responsibility is to express a conclusion on this interim report based on our review.
Scope of reviewWe conducted our review in accordance with International Standard on review engagements ISRE 2410 Review of Interim Financial Information Performed by the Independent Auditor of the Entity. A review of interim financial information consists of making inquiries, primarily of persons responsible for financial and accounting matters, and applying analytical and other review procedures. A review is substantially less in scope than an audit conducted in accordance with International Standards on Audit-
ing and other generally accepted auditing practices and conse-quently does not enable us to obtain assurance that we would become aware of all significant matters that might be identified in an audit. Accordingly, we do not express an audit opinion.
ConclusionBased on our review, nothing has come to our attention that causes us to believe that the accompanying interim report is not prepared, in all material respects, for the Group in accordance with IAS 34 and the Annual Accounts Act, and for the Parent Company, in accordance with the Annual Accounts Act.
Stockholm, 23 October 2015KPMG AB
George PetterssonAuthorized public accountant
Stockholm, 23 October 2015Sandvik Aktiebolag (publ)
Mats BackmanActing President and CEO
Some statements herein are forward-looking and the actual outcome could be materially diff erent. In addition to the factors explicitly commented upon, the actual outcome could be materially aff ected by other factors, for example the eff ect of economic conditions, exchange-rate and interest-rate move-
ments, political risks, impact of competing products and their pricing, product development, commercialization and techno-logical diffi culties, supply disturbances, and major customer credit losses.
DISCLAIMER STATEMENT
The Board of Directors has decided that the 2016 Annu-al General Meeting will be held in Sandviken, Sweden, on
28 April 2016. The notice to convene the AGM will be made in the prescribed manner.
ANNUAL GENERAL MEETING