interim report y - june 2018 / nitro games oyj · game on mobile. with heroes of warland, nitro...
TRANSCRIPT
Interim Report
JANUARY - JUNE 2018 / NITRO GAMES OYJ
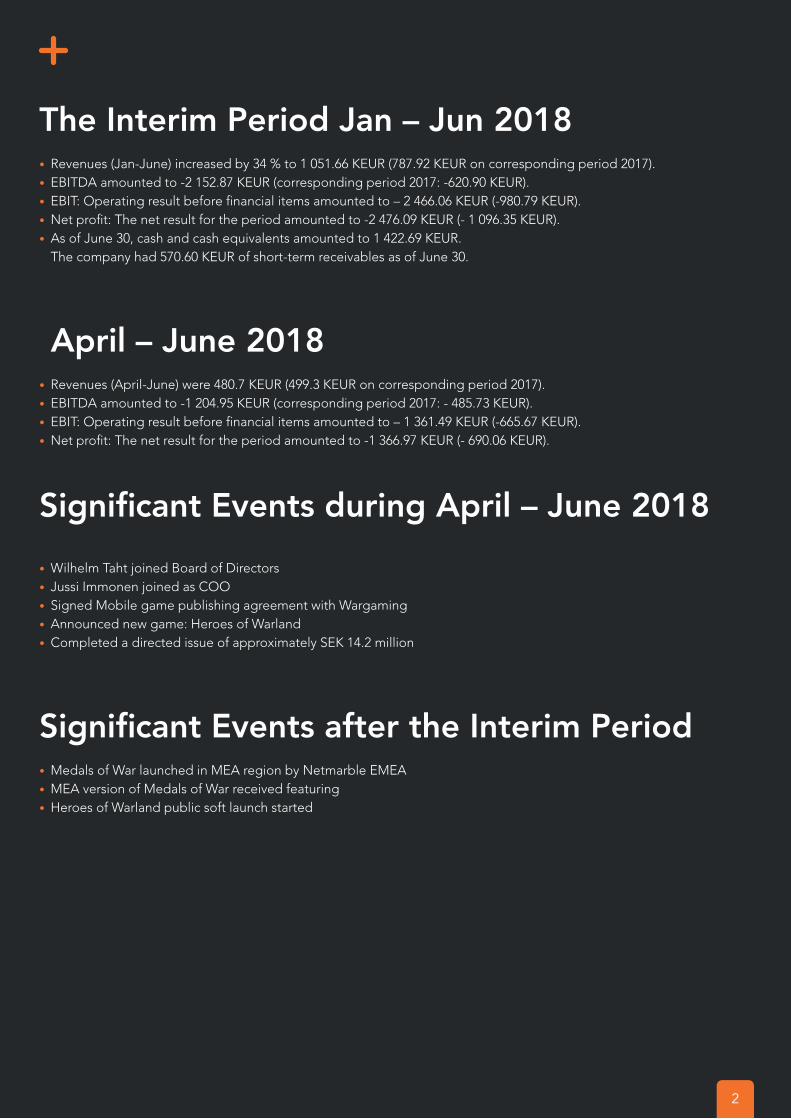
The Interim Period Jan – Jun 2018• Revenues (Jan-June) increased by 34 % to 1 051.66 KEUR (787.92 KEUR on corresponding period 2017).• EBITDA amounted to -2 152.87 KEUR (corresponding period 2017: -620.90 KEUR).• EBIT: Operating result before financial items amounted to – 2 466.06 KEUR (-980.79 KEUR). • Net profit: The net result for the period amounted to -2 476.09 KEUR (- 1 096.35 KEUR).• As of June 30, cash and cash equivalents amounted to 1 422.69 KEUR.
The company had 570.60 KEUR of short-term receivables as of June 30.
April – June 2018 • Revenues (April-June) were 480.7 KEUR (499.3 KEUR on corresponding period 2017).• EBITDA amounted to -1 204.95 KEUR (corresponding period 2017: - 485.73 KEUR).• EBIT: Operating result before financial items amounted to – 1 361.49 KEUR (-665.67 KEUR). • Net profit: The net result for the period amounted to -1 366.97 KEUR (- 690.06 KEUR).
Significant Events during April – June 2018
• Wilhelm Taht joined Board of Directors• Jussi Immonen joined as COO• Signed Mobile game publishing agreement with Wargaming• Announced new game: Heroes of Warland• Completed a directed issue of approximately SEK 14.2 million
Significant Events after the Interim Period • Medals of War launched in MEA region by Netmarble EMEA• MEA version of Medals of War received featuring• Heroes of Warland public soft launch started
2
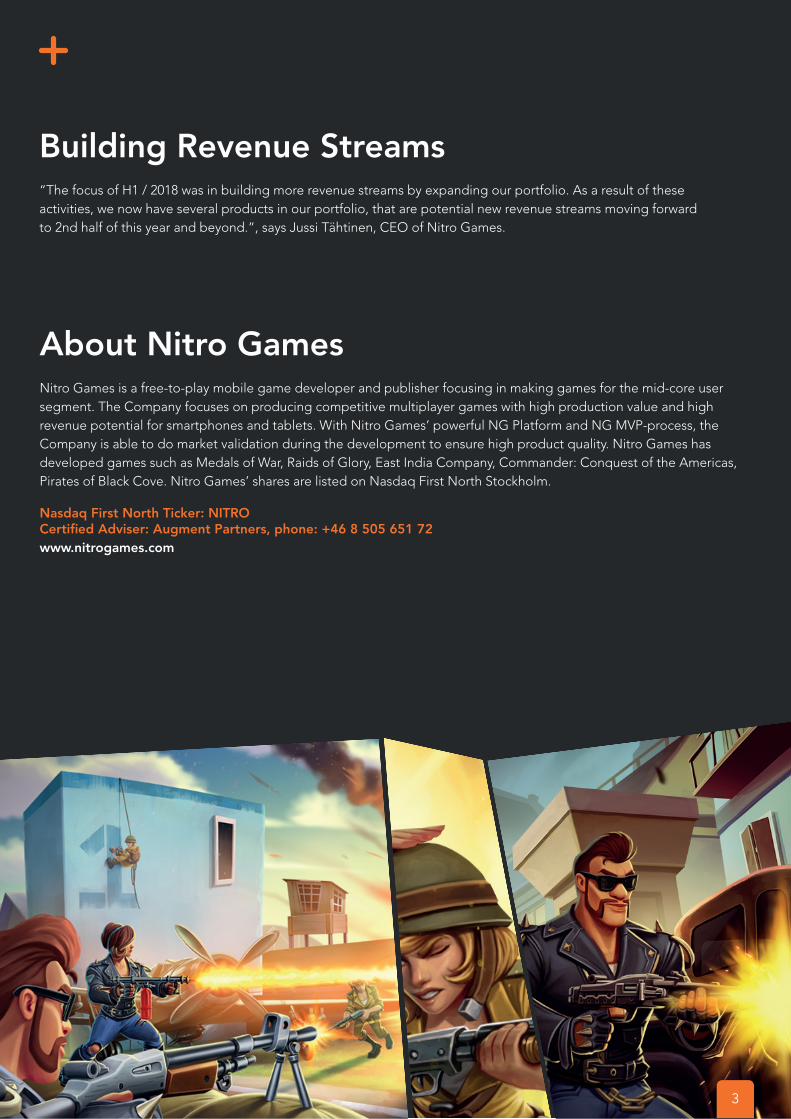
Building Revenue Streams“The focus of H1 / 2018 was in building more revenue streams by expanding our portfolio. As a result of these activities, we now have several products in our portfolio, that are potential new revenue streams moving forward to 2nd half of this year and beyond.”, says Jussi Tähtinen, CEO of Nitro Games.
About Nitro GamesNitro Games is a free-to-play mobile game developer and publisher focusing in making games for the mid-core user segment. The Company focuses on producing competitive multiplayer games with high production value and high revenue potential for smartphones and tablets. With Nitro Games’ powerful NG Platform and NG MVP-process, the Company is able to do market validation during the development to ensure high product quality. Nitro Games has developed games such as Medals of War, Raids of Glory, East India Company, Commander: Conquest of the Americas, Pirates of Black Cove. Nitro Games’ shares are listed on Nasdaq First North Stockholm.
Nasdaq First North Ticker: NITROCertified Adviser: Augment Partners, phone: +46 8 505 651 72www.nitrogames.com
3
Key FinancialsApr - Jun
2018Apr - Jun
2017Jan - Jun
2018Jan - Jun
2017Full Year
2017Unaudited Audited Unaudited Audited Audited
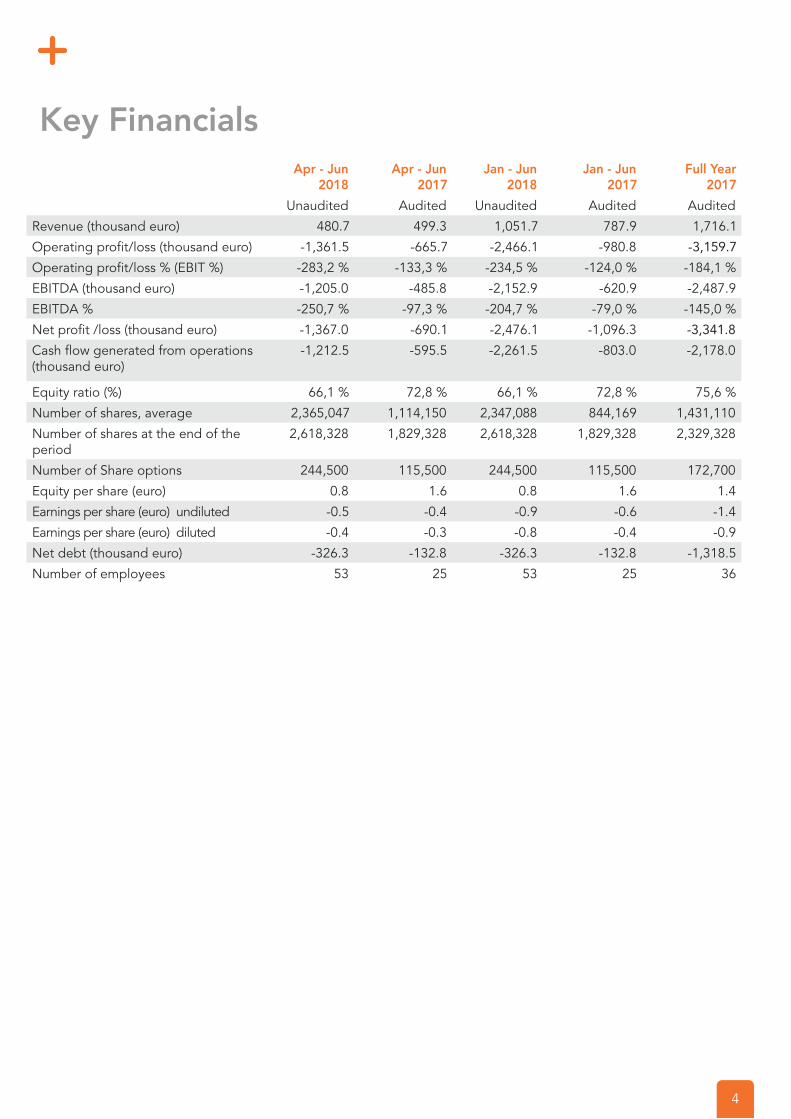
Revenue (thousand euro) 480.7 499.3 1,051.7 787.9 1,716.1Operating profit/loss (thousand euro) -1,361.5 -665.7 -2,466.1 -980.8 -3,159.7
Operating profit/loss % (EBIT %) -283,2 % -133,3 % -234,5 % -124,0 % -184,1 %EBITDA (thousand euro) -1,205.0 -485.8 -2,152.9 -620.9 -2,487.9EBITDA % -250,7 % -97,3 % -204,7 % -79,0 % -145,0 %Net profit /loss (thousand euro) -1,367.0 -690.1 -2,476.1 -1,096.3 -3,341.8
Cash flow generated from operations (thousand euro)
-1,212.5 -595.5 -2,261.5 -803.0 -2,178.0
Equity ratio (%) 66,1 % 72,8 % 66,1 % 72,8 % 75,6 %Number of shares, average 2,365,047 1,114,150 2,347,088 844,169 1,431,110Number of shares at the end of the period
2,618,328 1,829,328 2,618,328 1,829,328 2,329,328
Number of Share options 244,500 115,500 244,500 115,500 172,700Equity per share (euro) 0.8 1.6 0.8 1.6 1.4Earnings per share (euro) undiluted -0.5 -0.4 -0.9 -0.6 -1.4Earnings per share (euro) diluted -0.4 -0.3 -0.8 -0.4 -0.9Net debt (thousand euro) -326.3 -132.8 -326.3 -132.8 -1,318.5Number of employees 53 25 53 25 36
4
A Word from Jussi Tähtinen, CEO
Expanding the portfolio to build more revenue streams
The focus of H1 / 2018 was in building more revenue streams by expanding our portfolio. This is in line with our strategy, that consists of two key operations: 1) Self-publishing a portfolio of mobile games, based on our own IPs and 2) Offering our development services to leading companies in the industry as part of our service business model. As a result of these activities, we now have several products in our portfolio, that are potential new revenue streams moving forward to 2nd half of this year and beyond.
In our self-publishing business, the highlight was announcing our new game Heroes of Warland. This is the 2nd game in our new portfolio focusing on competitive multiplayer. With Heroes of Warland we’re making a big leap from 1vs1 games to team vs team multiplayer. This type of game opens a world of new opportunities for growth, by for example enabling us to have new approaches to marketing. To support the upcoming launch we’ve teamed up with Gamingzone to develop a reality TV format called Heroes & Superstars, where nine successful gaming superstars from different games and three sports champions will battle out in HoW against each other. We completed a directed issue of approx 1,37 M EUR in June to support the launch of this game. Heroes of Warland public soft launch started in July with technical testing. We are very excited developing this game launch further and continuing to explore new opportunities for growth.
The 1st game in our new portfolio, Medals of War, progressed on several fronts. Overall, we continued with solid progress on performance metrics during 2nd quarter on a monthly basis. We scaled down the spending on user acquisition, while the focus was in improving the performance of the game and preparing the MEA version launch. This resulted in decreased revenue during this quarter. After March we succeeded in almost doubling the ARPDAU and more importantly, increasing ARPU significantly. This is due to the big economy update that we launched in March combined with continuous efforts on user acquisition, where the goal is to find scalability with sustainable ROAS (Return On Advertising Spend). After H1 the progress has continued, and we’ve now reached a point where the game overall is returning more revenue than what goes into user acquisition. The next step is for us to deliver more updates to the game and optimize the marketing and user acquisition to find ways to scale up the game while maintaining sustainable ROAS. These are also valuable learnings and moving forward we can apply these to other games in our portfolio.
Another big focus point was expanding Medals of War to MEA region with Netmarble EMEA. The launch happened after the interim period in July, but naturally a lot of the work for that was done during 2nd quarter. Our plan is to develop the western version together with the MEA version and bring best practices from one version to another. Netmarble EMEA acts as the publisher in MEA region and Netmarble has the first right of refusal for Asia. I’m excited to see how things progress with Medals of War moving forward to second half of the year.
5
In our Service business we continued our co-operation with Wargaming. We achieved significant milestone here, as we signed a new agreement with them. This new agreement is about Wargaming publishing the game that we’ve been working on, while our team continues further developing the game and supporting the live operations. The important achievement with this new agreement is that it contains the potential for scalable revenues in our Service business, since in addition to fees against our services it also contains a profit-sharing component after the commercial launch. Our strategy is about growth, and focus this year is building more revenue streams. This progress goes well in line with our goals and I’m excited to see how things develop further now that the game is in soft launch.
During H1 we’ve seen an increase in revenues, compared to previous year. This was the first time we exceed one million EUR in revenues during a half year period. The revenues during H1 were 1,05 million EUR, compared to 0,79 million EUR in H1 2017 (34% growth). Overall H1 was about investing in team building and product development, with the goal of building more revenue streams for future. However, worth noting that this means that most of the games we worked on during H1 only resulted in costs, as they’re planned for launch after H1 and the revenue generation is expected to start after launch.
Our strategy is about growth, and that’s what we’re focusing on delivering. During H1 we succeeded in building several new opportunities for growth, resulting in us now having two games in our self-publishing pipeline and two games that we work on with Netmarble and Wargaming. I’m excited to see how we monetize these opportunities during H2 and beyond.
Jussi TähtinenCEO, Co-Founder
6
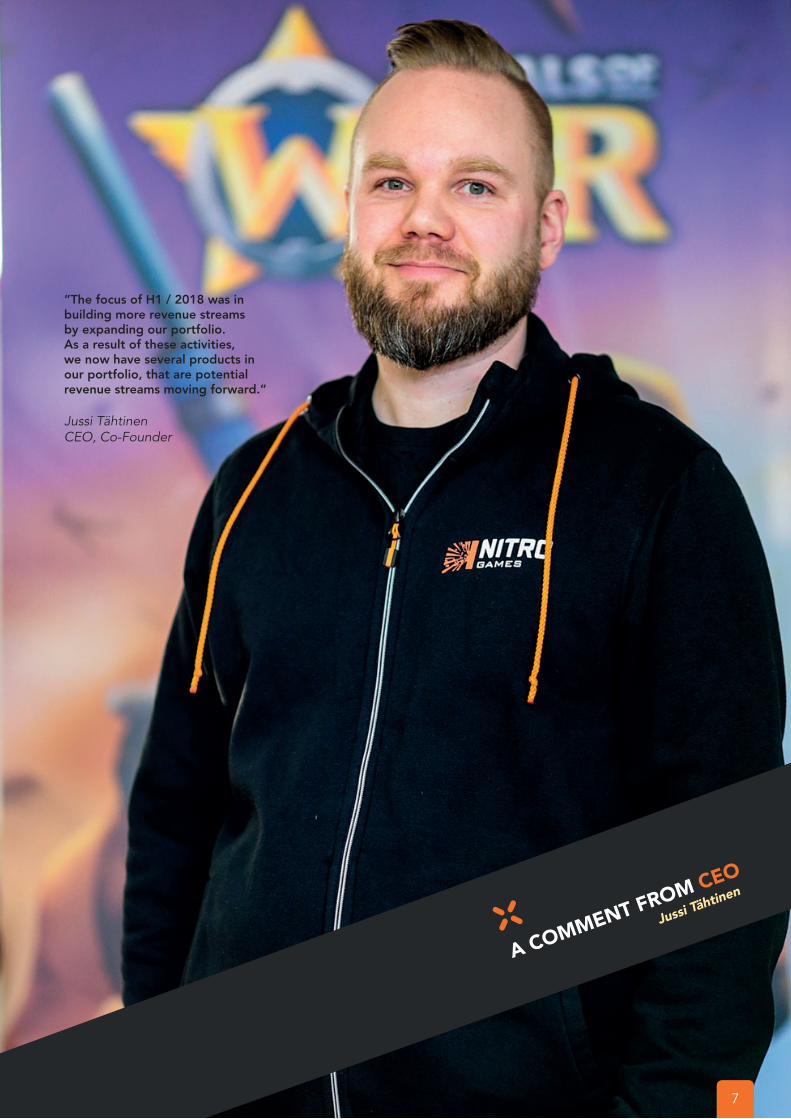
”The focus of H1 / 2018 was in building more revenue streams by expanding our portfolio. As a result of these activities, we now have several products in our portfolio, that are potential revenue streams moving forward.”
Jussi TähtinenCEO, Co-Founder
A COMMENT FROM CEO
Jussi Tähtinen
7
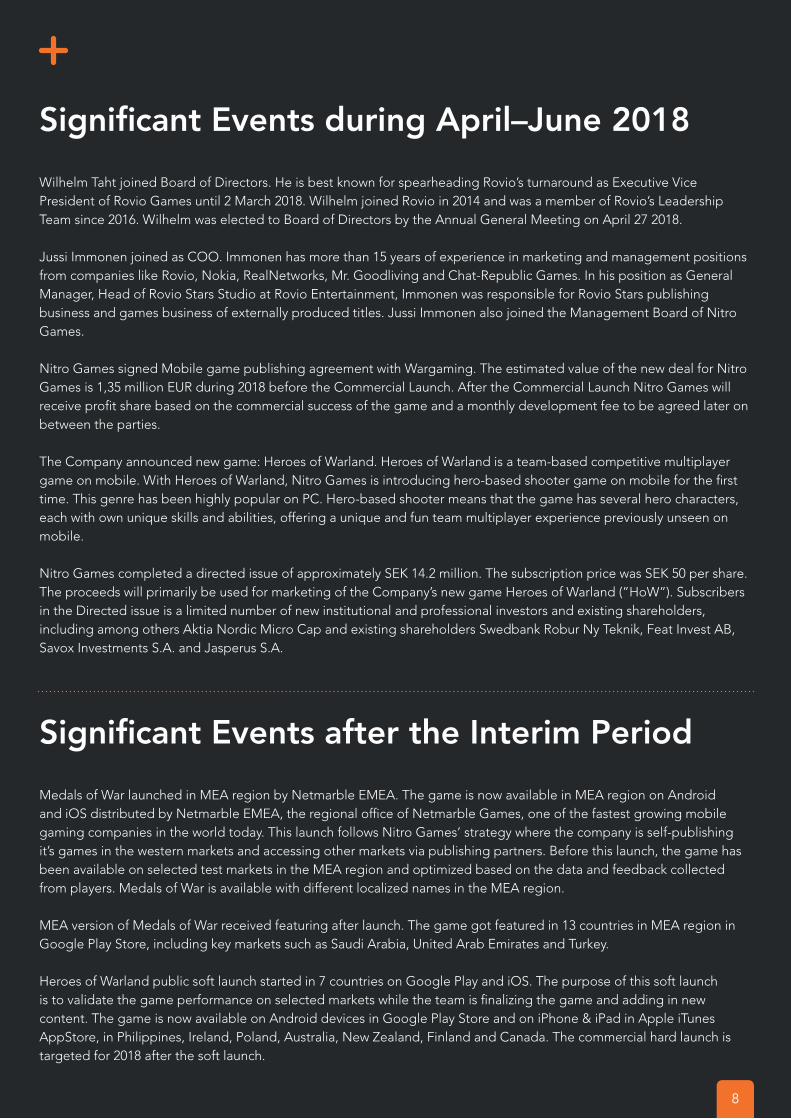
Significant Events during April–June 2018
Wilhelm Taht joined Board of Directors. He is best known for spearheading Rovio’s turnaround as Executive Vice President of Rovio Games until 2 March 2018. Wilhelm joined Rovio in 2014 and was a member of Rovio’s Leadership Team since 2016. Wilhelm was elected to Board of Directors by the Annual General Meeting on April 27 2018.
Jussi Immonen joined as COO. Immonen has more than 15 years of experience in marketing and management positions from companies like Rovio, Nokia, RealNetworks, Mr. Goodliving and Chat-Republic Games. In his position as General Manager, Head of Rovio Stars Studio at Rovio Entertainment, Immonen was responsible for Rovio Stars publishing business and games business of externally produced titles. Jussi Immonen also joined the Management Board of Nitro Games.
Nitro Games signed Mobile game publishing agreement with Wargaming. The estimated value of the new deal for Nitro Games is 1,35 million EUR during 2018 before the Commercial Launch. After the Commercial Launch Nitro Games will receive profit share based on the commercial success of the game and a monthly development fee to be agreed later on between the parties.
The Company announced new game: Heroes of Warland. Heroes of Warland is a team-based competitive multiplayer game on mobile. With Heroes of Warland, Nitro Games is introducing hero-based shooter game on mobile for the first time. This genre has been highly popular on PC. Hero-based shooter means that the game has several hero characters, each with own unique skills and abilities, offering a unique and fun team multiplayer experience previously unseen on mobile.
Nitro Games completed a directed issue of approximately SEK 14.2 million. The subscription price was SEK 50 per share. The proceeds will primarily be used for marketing of the Company’s new game Heroes of Warland (”HoW”). Subscribers in the Directed issue is a limited number of new institutional and professional investors and existing shareholders, including among others Aktia Nordic Micro Cap and existing shareholders Swedbank Robur Ny Teknik, Feat Invest AB, Savox Investments S.A. and Jasperus S.A.
Significant Events after the Interim Period
Medals of War launched in MEA region by Netmarble EMEA. The game is now available in MEA region on Android and iOS distributed by Netmarble EMEA, the regional office of Netmarble Games, one of the fastest growing mobile gaming companies in the world today. This launch follows Nitro Games’ strategy where the company is self-publishing it’s games in the western markets and accessing other markets via publishing partners. Before this launch, the game has been available on selected test markets in the MEA region and optimized based on the data and feedback collected from players. Medals of War is available with different localized names in the MEA region.
MEA version of Medals of War received featuring after launch. The game got featured in 13 countries in MEA region in Google Play Store, including key markets such as Saudi Arabia, United Arab Emirates and Turkey.
Heroes of Warland public soft launch started in 7 countries on Google Play and iOS. The purpose of this soft launch is to validate the game performance on selected markets while the team is finalizing the game and adding in new content. The game is now available on Android devices in Google Play Store and on iPhone & iPad in Apple iTunes AppStore, in Philippines, Ireland, Poland, Australia, New Zealand, Finland and Canada. The commercial hard launch is targeted for 2018 after the soft launch.
8
Revenues & Profit / Loss
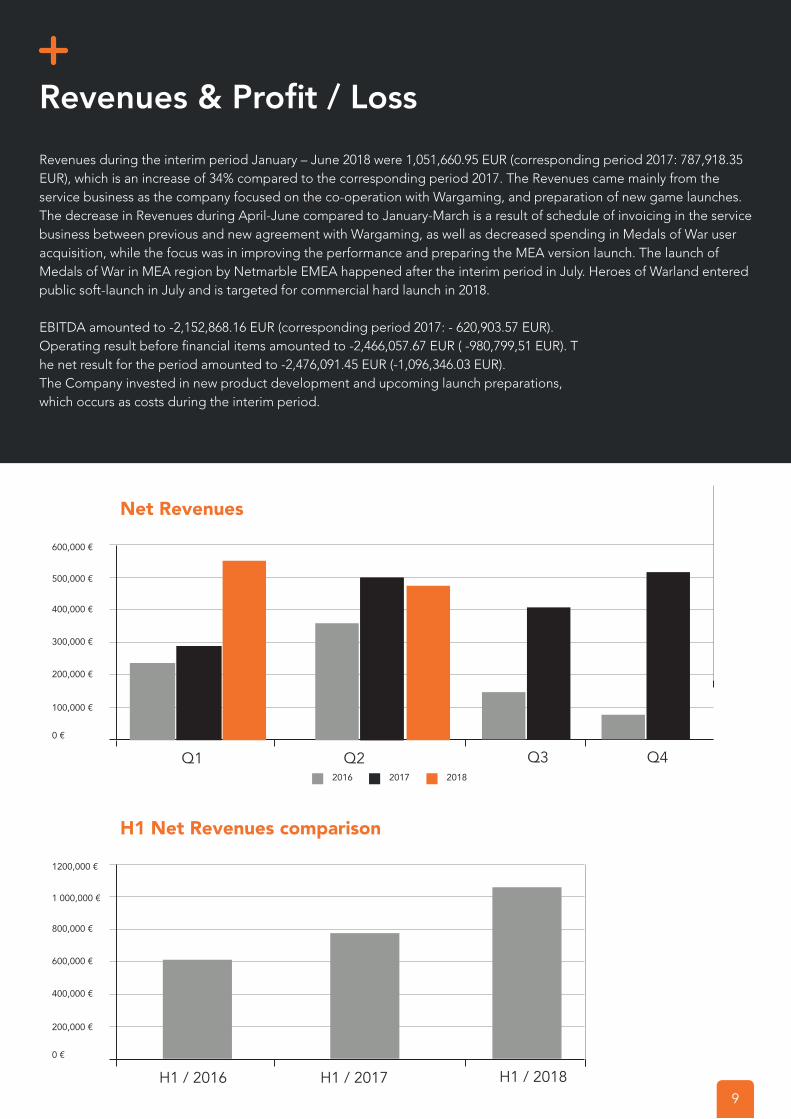
Revenues during the interim period January – June 2018 were 1,051,660.95 EUR (corresponding period 2017: 787,918.35 EUR), which is an increase of 34% compared to the corresponding period 2017. The Revenues came mainly from the service business as the company focused on the co-operation with Wargaming, and preparation of new game launches. The decrease in Revenues during April-June compared to January-March is a result of schedule of invoicing in the service business between previous and new agreement with Wargaming, as well as decreased spending in Medals of War user acquisition, while the focus was in improving the performance and preparing the MEA version launch. The launch of Medals of War in MEA region by Netmarble EMEA happened after the interim period in July. Heroes of Warland entered public soft-launch in July and is targeted for commercial hard launch in 2018.
EBITDA amounted to -2,152,868.16 EUR (corresponding period 2017: - 620,903.57 EUR).Operating result before financial items amounted to -2,466,057.67 EUR ( -980,799,51 EUR). The net result for the period amounted to -2,476,091.45 EUR (-1,096,346.03 EUR). The Company invested in new product development and upcoming launch preparations, which occurs as costs during the interim period.
Net Revenues
Q1 Q22017 2018
600,000 €
500,000 €
400,000 €
300,000 €
200,000 €
100,000 €
0 €
Q3 Q42016
H1 Net Revenues comparison
H1 / 2016 H1 / 2017
1200,000 €
1 000,000 €
800,000 €
600,000 €
400,000 €
200,000 €
0 €
H1 / 20189
Medals of War Performance Metrics
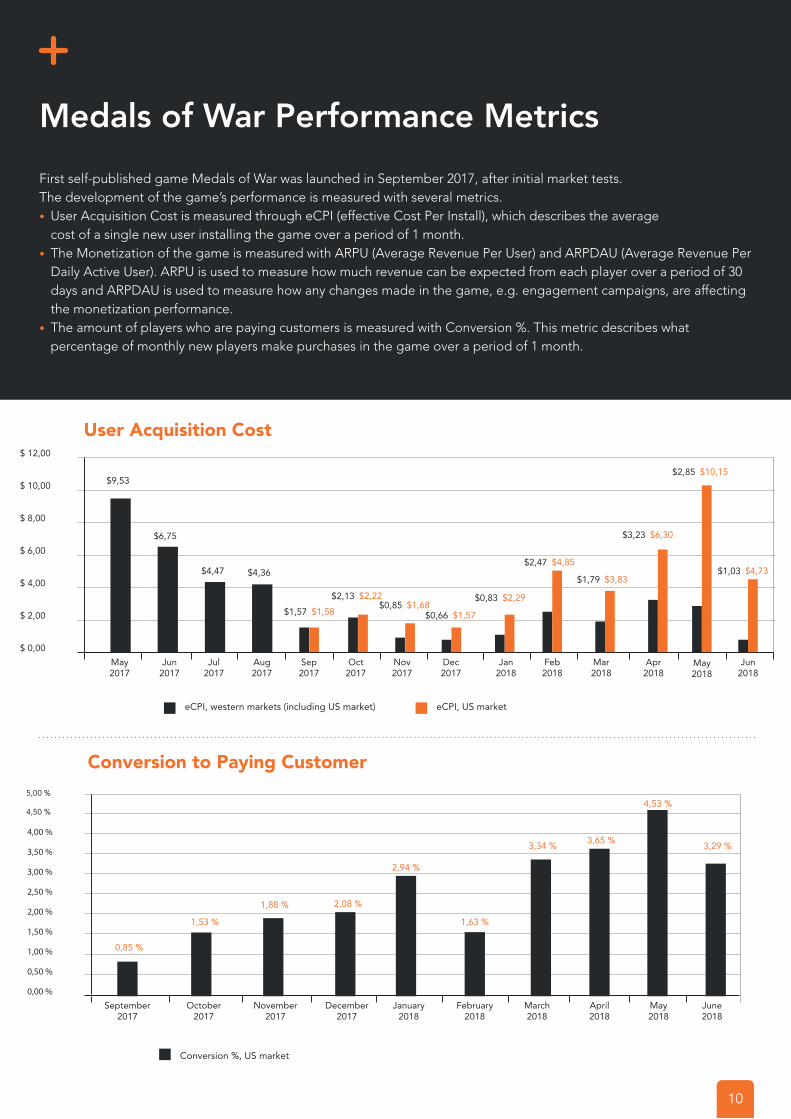
First self-published game Medals of War was launched in September 2017, after initial market tests. The development of the game’s performance is measured with several metrics. • User Acquisition Cost is measured through eCPI (effective Cost Per Install), which describes the average
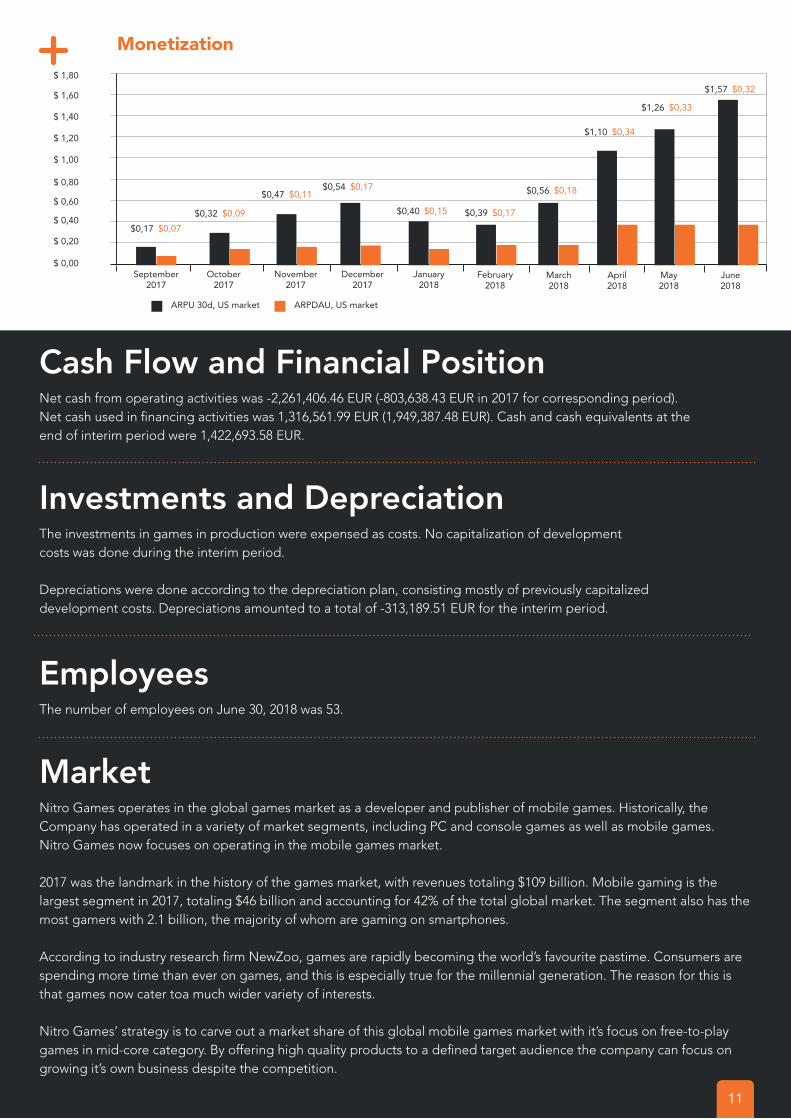
cost of a single new user installing the game over a period of 1 month.• The Monetization of the game is measured with ARPU (Average Revenue Per User) and ARPDAU (Average Revenue Per
Daily Active User). ARPU is used to measure how much revenue can be expected from each player over a period of 30 days and ARPDAU is used to measure how any changes made in the game, e.g. engagement campaigns, are affecting the monetization performance.
• The amount of players who are paying customers is measured with Conversion %. This metric describes what percentage of monthly new players make purchases in the game over a period of 1 month.
User Acquisition Cost
eCPI, western markets (including US market) eCPI, US market
$ 12,00
$ 10,00
$ 8,00
$ 6,00
$ 4,00
$ 2,00
$ 0,00May2017
Jun2017
Jul2017
Aug2017
Sep2017
Oct2017
Nov2017
Dec2017
Jan2018
Feb2018
Mar2018
Conversion to Paying Customer
Conversion %, US market
September2017
October2017
November2017
December2017
January2018
February2018
March2018
Apr2018
May2018
Jun2018
April2018
May2018
June2018
4,50 %
5,00 %
0,85 %
1,53 %
1,88 % 2,08 %
2,94 %
1,63 %
3,34 % 3,65 %
4,53 %
3,29 %
$9,53
$6,75
$4,47 $4,36
$1,57 $1,58
$2,13 $2,22$0,85 $1,68
$0,66 $1,57
$0,83 $2,29
$2,47 $4,85
$1,79 $3,83
$3,23 $6,30
$2,85 $10,15
$1,03 $4,73
10
Cash Flow and Financial PositionNet cash from operating activities was -2,261,406.46 EUR (-803,638.43 EUR in 2017 for corresponding period). Net cash used in financing activities was 1,316,561.99 EUR (1,949,387.48 EUR). Cash and cash equivalents at the end of interim period were 1,422,693.58 EUR.
Investments and Depreciation The investments in games in production were expensed as costs. No capitalization of development costs was done during the interim period.
Depreciations were done according to the depreciation plan, consisting mostly of previously capitalized development costs. Depreciations amounted to a total of -313,189.51 EUR for the interim period.
EmployeesThe number of employees on June 30, 2018 was 53.
MarketNitro Games operates in the global games market as a developer and publisher of mobile games. Historically, the Company has operated in a variety of market segments, including PC and console games as well as mobile games. Nitro Games now focuses on operating in the mobile games market.
2017 was the landmark in the history of the games market, with revenues totaling $109 billion. Mobile gaming is the largest segment in 2017, totaling $46 billion and accounting for 42% of the total global market. The segment also has the most gamers with 2.1 billion, the majority of whom are gaming on smartphones.
According to industry research firm NewZoo, games are rapidly becoming the world’s favourite pastime. Consumers are spending more time than ever on games, and this is especially true for the millennial generation. The reason for this is that games now cater toa much wider variety of interests.
Nitro Games’ strategy is to carve out a market share of this global mobile games market with it’s focus on free-to-play games in mid-core category. By offering high quality products to a defined target audience the company can focus on growing it’s own business despite the competition.
Monetization
ARPU 30d, US market ARPDAU, US market
$ 1,20
$ 1,00
$ 0,80
$ 0,60
$ 0,40
$ 0,20
$ 0,00September
2017October
2017November
2017December
2017January
2018February
2018March 2018
$ 1,40
$ 1,60
$ 1,80
April2018
May2018
June2018
$0,17 $0,07
$0,32 $0,09
$0,47 $0,11$0,54 $0,17
$0,40 $0,15 $0,39 $0,17
$0,56 $0,18
$1,10 $0,34
$1,26 $0,33
$1,57 $0,32
11
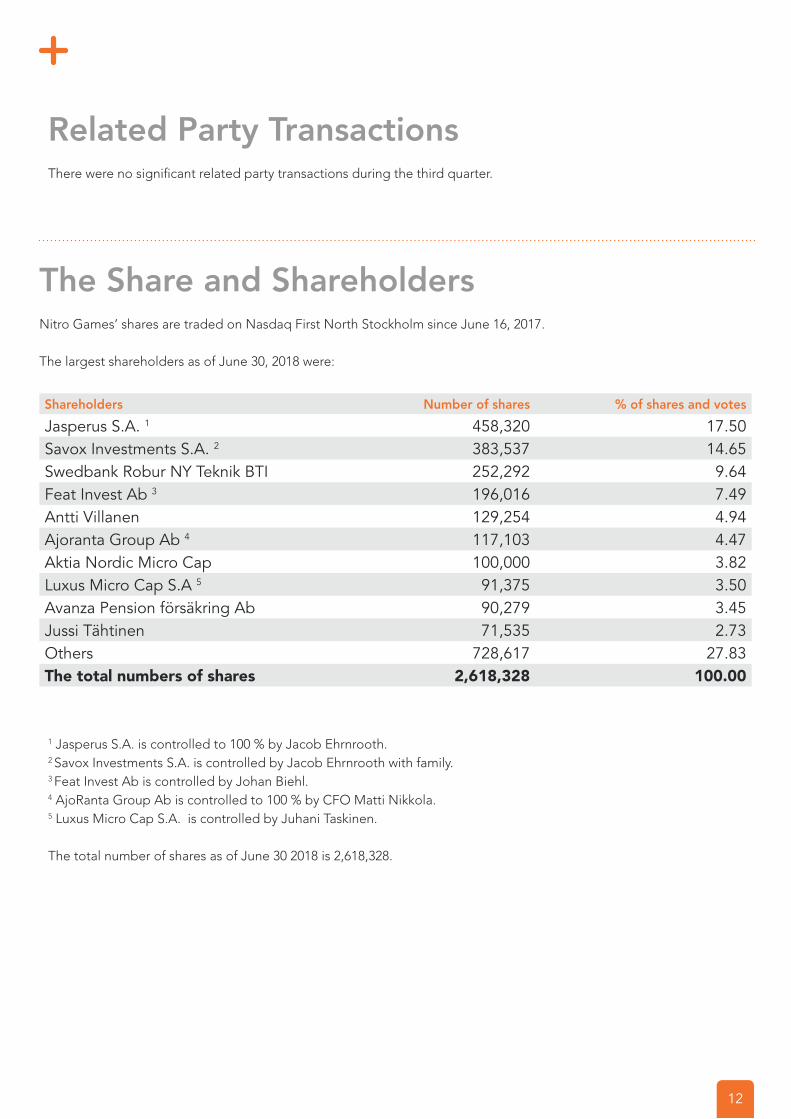
The Share and ShareholdersNitro Games’ shares are traded on Nasdaq First North Stockholm since June 16, 2017.
The largest shareholders as of June 30, 2018 were:
Shareholders Number of shares % of shares and votes
Jasperus S.A. 1 458,320 17.50Savox Investments S.A. 2 383,537 14.65Swedbank Robur NY Teknik BTI 252,292 9.64Feat Invest Ab 3 196,016 7.49Antti Villanen 129,254 4.94Ajoranta Group Ab 4 117,103 4.47Aktia Nordic Micro Cap 100,000 3.82Luxus Micro Cap S.A 5 91,375 3.50Avanza Pension försäkring Ab 90,279 3.45Jussi Tähtinen 71,535 2.73Others 728,617 27.83The total numbers of shares 2,618,328 100.00
1 Jasperus S.A. is controlled to 100 % by Jacob Ehrnrooth. 2 Savox Investments S.A. is controlled by Jacob Ehrnrooth with family. 3 Feat Invest Ab is controlled by Johan Biehl. 4 AjoRanta Group Ab is controlled to 100 % by CFO Matti Nikkola. 5 Luxus Micro Cap S.A. is controlled by Juhani Taskinen.
The total number of shares as of June 30 2018 is 2,618,328.
Related Party TransactionsThere were no significant related party transactions during the third quarter.
12
Accounting and Valuation PrinciplesThe Company prepares its financial statements in accordance with the Finnish Accounting Act (31.12.1997/1336, as amended), Finnish Accounting Ordinance (31.12.1997/1337, as amended), and instructions and statements of the Accounting Board operating under the Ministry of Employment and the Economy (the “Finnish Accounting Standards”, “FAS”).
In applicable cases The Company capitalizes the expenses used for development of products and technology, including personnel costs and procurement, subtracted with subsidies and grants received for these, to the extent that they are expected to generate economic benefits in the future. Amortization and depreciation for intangible and tangible assets are calculated by using the estimated useful life of the asset. For tangible assets depreciation according to plan starts during the calendar month when the commodity was taken into use and for intangible assets when revenue starts to accrue from the development work, typically during the year after the development work.
The Company’s capitalized development costs are amortized over a five (5) year period on a straight-line basis. For machines and equipment a 25 % expenditure residue depreciation is made yearly.
ReviewThis report has not been reviewed by the company’s auditors.
Certified AdviserNitro Games’ Certified Adviser is Augment Partners AB, phone: +46 8 505 651 72.
Investor ContactThe latest information on the company is published on the company’s website www.nitrogames.com/investors. The company can be contacted by email [email protected], or by phone +358 44 388 1071.
Financial CalendarInterim Report, April - June 2018, 20 August 2018Interim Report, July – September 2018, 29 October 2018
13
NoteThis company announcement contains information that Nitro Games Oyj is obliged to make public pursuant to the EU Market Abuse Regulation. The information was submitted for publication by contact person mentioned below on 20 August 2018 at 09:00 (EEST).
For further information, please contact:
Jussi Tähtinen, CEO Sverker Littorin, Board member+358 44 388 1071 +46 70 875 53 [email protected] [email protected]
Board Declaration
The Board of Directors and the Chief Executive Officer hereby certify that this Interim Report gives a true and fair view of the company’s and the group’s operations, financial position and results of operations, and describes significant risks and uncertainties faced by the company and the companies in the group.
Kotka, Finland, August 20 2018
Antti Villanen, Chairman
Jacob Ehrnrooth Ilkka Lassila Sverker Littorin
Juhani Taskinen Wilhelm Taht Jussi Tähtinen, CEO
14
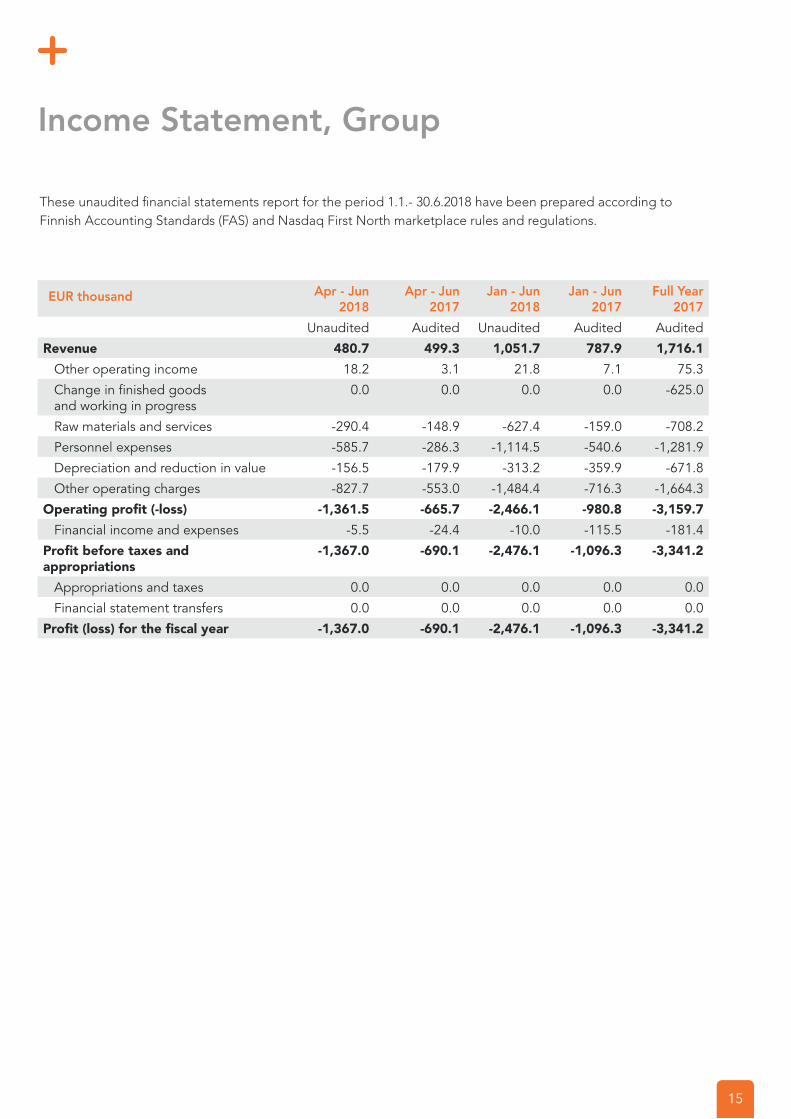
Income Statement, Group
EUR thousand Apr - Jun2018
Apr - Jun2017
Jan - Jun2018
Jan - Jun2017
Full Year2017
Unaudited Audited Unaudited Audited AuditedRevenue 480.7 499.3 1,051.7 787.9 1,716.1 Other operating income 18.2 3.1 21.8 7.1 75.3 Change in finished goods and working in progress
0.0 0.0 0.0 0.0 -625.0
Raw materials and services -290.4 -148.9 -627.4 -159.0 -708.2 Personnel expenses -585.7 -286.3 -1,114.5 -540.6 -1,281.9 Depreciation and reduction in value -156.5 -179.9 -313.2 -359.9 -671.8 Other operating charges -827.7 -553.0 -1,484.4 -716.3 -1,664.3Operating profit (-loss) -1,361.5 -665.7 -2,466.1 -980.8 -3,159.7 Financial income and expenses -5.5 -24.4 -10.0 -115.5 -181.4Profit before taxes and appropriations
-1,367.0 -690.1 -2,476.1 -1,096.3 -3,341.2
Appropriations and taxes 0.0 0.0 0.0 0.0 0.0 Financial statement transfers 0.0 0.0 0.0 0.0 0.0Profit (loss) for the fiscal year -1,367.0 -690.1 -2,476.1 -1,096.3 -3,341.2
These unaudited financial statements report for the period 1.1.- 30.6.2018 have been prepared according to Finnish Accounting Standards (FAS) and Nasdaq First North marketplace rules and regulations.
15
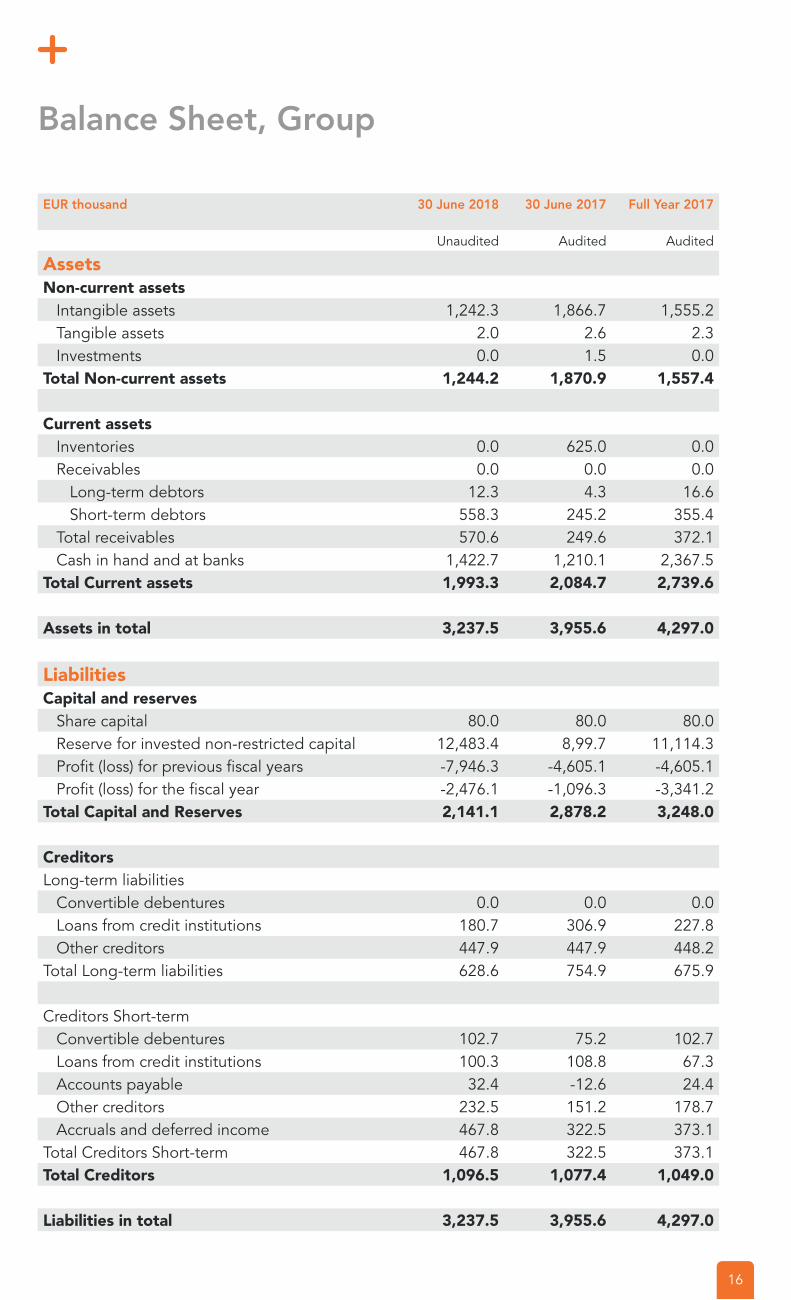
Balance Sheet, Group
16
EUR thousand 30 June 2018 30 June 2017 Full Year 2017
Unaudited Audited Audited
AssetsNon-current assets Intangible assets 1,242.3 1,866.7 1,555.2 Tangible assets 2.0 2.6 2.3 Investments 0.0 1.5 0.0Total Non-current assets 1,244.2 1,870.9 1,557.4
Current assets Inventories 0.0 625.0 0.0 Receivables 0.0 0.0 0.0 Long-term debtors 12.3 4.3 16.6 Short-term debtors 558.3 245.2 355.4 Total receivables 570.6 249.6 372.1 Cash in hand and at banks 1,422.7 1,210.1 2,367.5Total Current assets 1,993.3 2,084.7 2,739.6
Assets in total 3,237.5 3,955.6 4,297.0
LiabilitiesCapital and reserves Share capital 80.0 80.0 80.0 Reserve for invested non-restricted capital 12,483.4 8,99.7 11,114.3 Profit (loss) for previous fiscal years -7,946.3 -4,605.1 -4,605.1 Profit (loss) for the fiscal year -2,476.1 -1,096.3 -3,341.2Total Capital and Reserves 2,141.1 2,878.2 3,248.0
CreditorsLong-term liabilities Convertible debentures 0.0 0.0 0.0 Loans from credit institutions 180.7 306.9 227.8 Other creditors 447.9 447.9 448.2Total Long-term liabilities 628.6 754.9 675.9
Creditors Short-term Convertible debentures 102.7 75.2 102.7 Loans from credit institutions 100.3 108.8 67.3 Accounts payable 32.4 -12.6 24.4 Other creditors 232.5 151.2 178.7 Accruals and deferred income 467.8 322.5 373.1Total Creditors Short-term 467.8 322.5 373.1Total Creditors 1,096.5 1,077.4 1,049.0
Liabilities in total 3,237.5 3,955.6 4,297.0
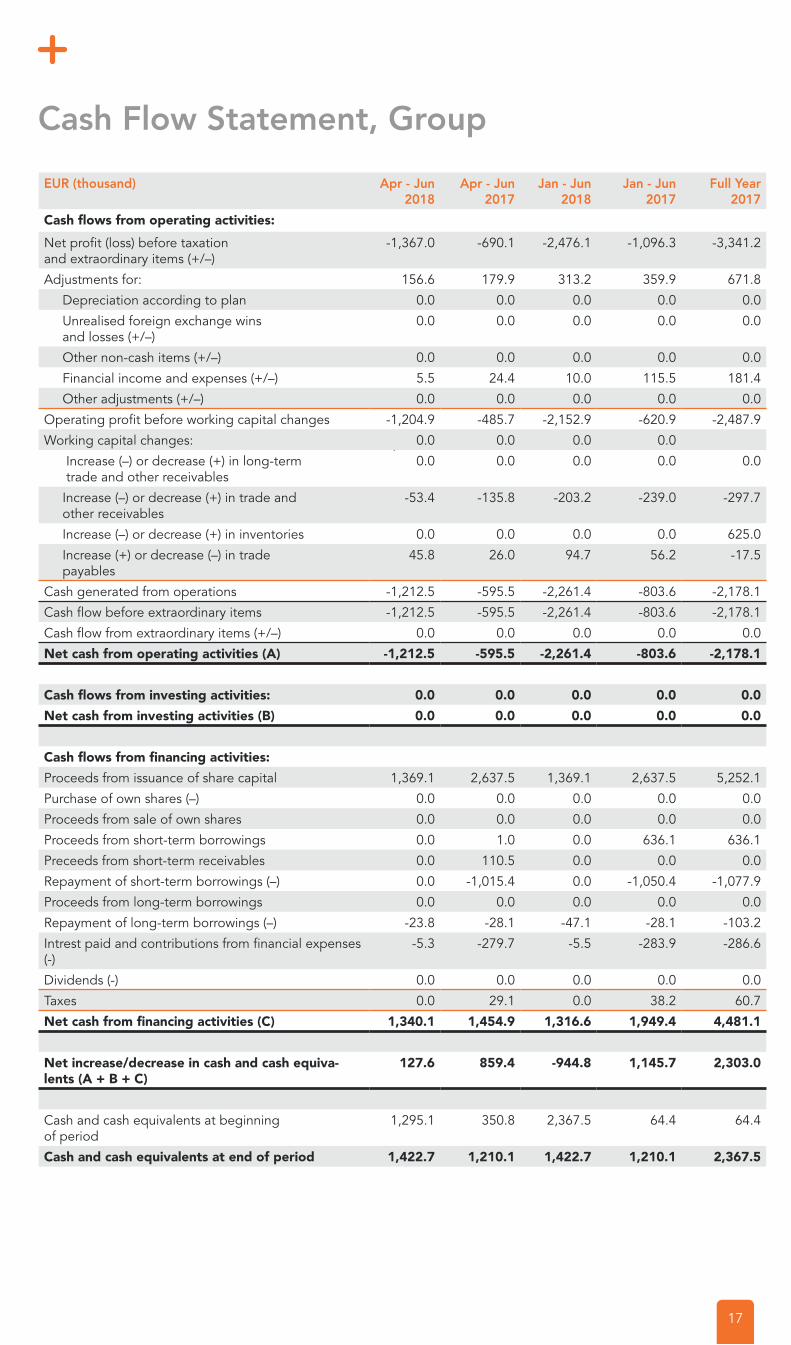
Cash Flow Statement, Group
-1,460.98
17
EUR (thousand) Apr - Jun2018
Apr - Jun2017
Jan - Jun2018
Jan - Jun2017
Full Year2017
Cash flows from operating activities:
Net profit (loss) before taxationand extraordinary items (+/–)
-1,367.0 -690.1 -2,476.1 -1,096.3 -3,341.2
Adjustments for: 156.6 179.9 313.2 359.9 671.8 Depreciation according to plan 0.0 0.0 0.0 0.0 0.0 Unrealised foreign exchange wins and losses (+/–)
0.0 0.0 0.0 0.0 0.0
Other non-cash items (+/–) 0.0 0.0 0.0 0.0 0.0 Financial income and expenses (+/–) 5.5 24.4 10.0 115.5 181.4 Other adjustments (+/–) 0.0 0.0 0.0 0.0 0.0Operating profit before working capital changes -1,204.9 -485.7 -2,152.9 -620.9 -2,487.9Working capital changes: 0.0 0.0 0.0 0.0 Increase (–) or decrease (+) in long-term trade and other receivables
0.0 0.0 0.0 0.0 0.0
Increase (–) or decrease (+) in trade and other receivables
-53.4 -135.8 -203.2 -239.0 -297.7
Increase (–) or decrease (+) in inventories 0.0 0.0 0.0 0.0 625.0 Increase (+) or decrease (–) in trade payables
45.8 26.0 94.7 56.2 -17.5
Cash generated from operations -1,212.5 -595.5 -2,261.4 -803.6 -2,178.1Cash flow before extraordinary items -1,212.5 -595.5 -2,261.4 -803.6 -2,178.1Cash flow from extraordinary items (+/–) 0.0 0.0 0.0 0.0 0.0Net cash from operating activities (A) -1,212.5 -595.5 -2,261.4 -803.6 -2,178.1
Cash flows from investing activities: 0.0 0.0 0.0 0.0 0.0Net cash from investing activities (B) 0.0 0.0 0.0 0.0 0.0
Cash flows from financing activities:Proceeds from issuance of share capital 1,369.1 2,637.5 1,369.1 2,637.5 5,252.1Purchase of own shares (–) 0.0 0.0 0.0 0.0 0.0Proceeds from sale of own shares 0.0 0.0 0.0 0.0 0.0Proceeds from short-term borrowings 0.0 1.0 0.0 636.1 636.1Preceeds from short-term receivables 0.0 110.5 0.0 0.0 0.0Repayment of short-term borrowings (–) 0.0 -1,015.4 0.0 -1,050.4 -1,077.9Proceeds from long-term borrowings 0.0 0.0 0.0 0.0 0.0Repayment of long-term borrowings (–) -23.8 -28.1 -47.1 -28.1 -103.2Intrest paid and contributions from financial expenses (-)
-5.3 -279.7 -5.5 -283.9 -286.6
Dividends (-) 0.0 0.0 0.0 0.0 0.0Taxes 0.0 29.1 0.0 38.2 60.7Net cash from financing activities (C) 1,340.1 1,454.9 1,316.6 1,949.4 4,481.1
Net increase/decrease in cash and cash equiva-lents (A + B + C)
127.6 859.4 -944.8 1,145.7 2,303.0
Cash and cash equivalents at beginning of period
1,295.1 350.8 2,367.5 64.4 64.4
Cash and cash equivalents at end of period 1,422.7 1,210.1 1,422.7 1,210.1 2,367.5
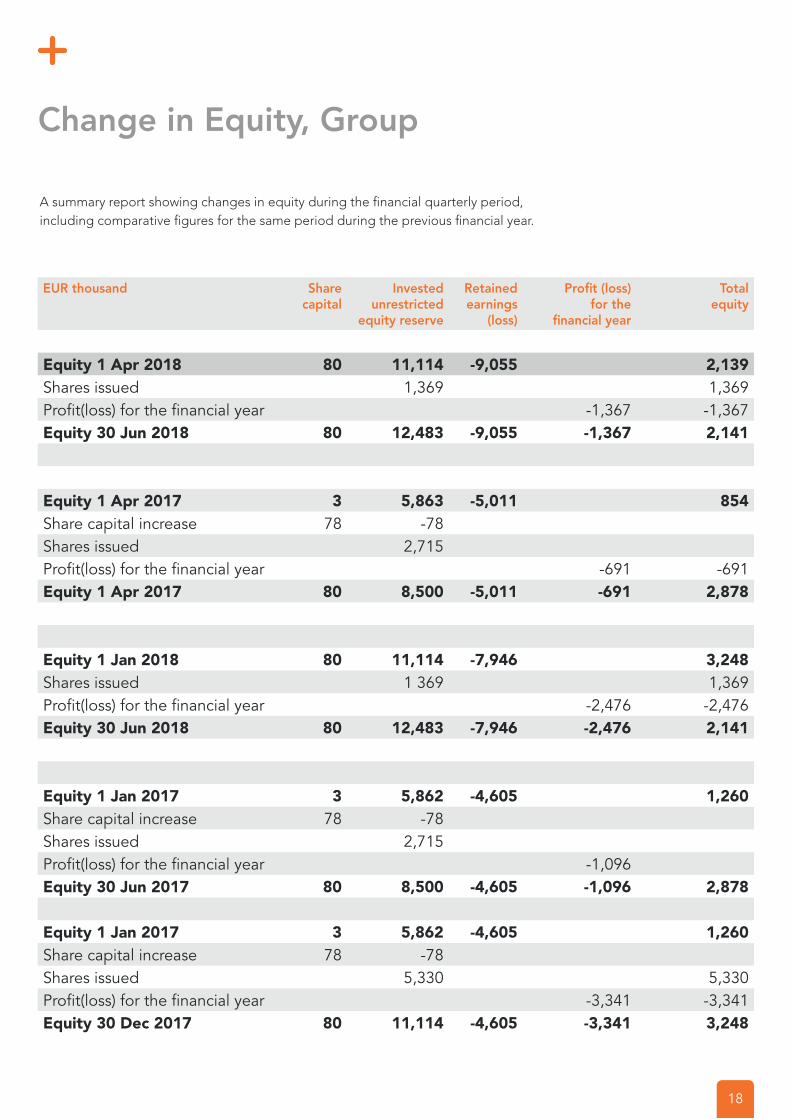
Change in Equity, Group
A summary report showing changes in equity during the financial quarterly period, including comparative figures for the same period during the previous financial year.
EUR thousand Share capital
Invested unrestricted
equity reserve
Retained earnings
(loss)
Profit (loss) for the
financial year
Total equity
Equity 1 Apr 2018 80 11,114 -9,055 2,139Shares issued 1,369 1,369Profit(loss) for the financial year -1,367 -1,367Equity 30 Jun 2018 80 12,483 -9,055 -1,367 2,141
Equity 1 Apr 2017 3 5,863 -5,011 854Share capital increase 78 -78Shares issued 2,715Profit(loss) for the financial year -691 -691Equity 1 Apr 2017 80 8,500 -5,011 -691 2,878
Equity 1 Jan 2018 80 11,114 -7,946 3,248Shares issued 1 369 1,369Profit(loss) for the financial year -2,476 -2,476Equity 30 Jun 2018 80 12,483 -7,946 -2,476 2,141
Equity 1 Jan 2017 3 5,862 -4,605 1,260Share capital increase 78 -78Shares issued 2,715Profit(loss) for the financial year -1,096Equity 30 Jun 2017 80 8,500 -4,605 -1,096 2,878
Equity 1 Jan 2017 3 5,862 -4,605 1,260Share capital increase 78 -78Shares issued 5,330 5,330Profit(loss) for the financial year -3,341 -3,341Equity 30 Dec 2017 80 11,114 -4,605 -3,341 3,248
18
Kotka office:Juha Vainion katu 2
48100 Kotka
Finland
Helsinki office:Salomonkatu 17 D, 2nd floor 00100 HelsinkiFinland
Nitro Games Oyjwww.nitrogames.com/investorsVAT: FI21348196