interim results fy2021 - seeking alpha
TRANSCRIPT

INTERIM RESULTS FY202125 February 2021

2IMPLATS
INTERIM RESULTS FY2021
FORWARD-LOOKING AND CAUTIONARY STATEMENT
Certain statements contained in this presentation, other than the statements of historical fact, contain forward-looking statements regarding Implats’
operations, economic performance or financial condition, including, without limitation, those concerning the economic outlook for the platinum
industry, expectations regarding metal prices, production, cash costs and other operating results, growth prospects and the outlook of Implats’
operations, including the completion and commencement of commercial operations of certain of Implats’ exploration and production projects, its
liquidity and capital resources and expenditure and the outcome and consequences of any pending litigation, regulatory approvals and/or legislative
frameworks currently in the process of amendment, or any enforcement proceedings. Although Implats believes that the expectations reflected in
such forward-looking statements are reasonable, no assurance can be given that such expectations will prove to be correct. Accordingly, results
may differ materially from those set out in the forward-looking statements as a result of, among other factors, changes in economic and market
conditions, success of business and operating initiatives, changes in the regulatory environment and other government actions, fluctuations in metal
prices, levels of global demand and exchange rates and business and operational risk management. For a discussion on such factors, refer to the
risk management section of the company’s Integrated Annual Report. Implats is not obliged to update publicly or release any revisions to these
forward-looking statements to reflect events or circumstances after the dates of the Annual Report or to reflect the occurrence of unanticipated
events.
Disclaimer: This entire presentation and all subsequent written or oral forward-looking statements attributable to Implats or any person acting on its
behalf are qualified by caution. Recipients hereof are advised the presentation is prepared for general information purposes and not intended to
constitute a recommendation to buy- or offer to sell shares or securities in Implats or any other entity. Sections of this presentation are not defined
and assured under IFRS, but included to assist in demonstrating Implats’ underlying financial performance. Implats recommend you address any
doubts in this regard with an authorised independent financial advisor, stockbroker, tax advisor, accountant or suitably qualified professional.

3IMPLATS
INTERIM RESULTS FY2021
AGENDA
01 02 03 04 05Group overview
Operationaloverview
Financialreview
Marketreview
Businessoutlook
Nico Muller Mark Munroe
Gerhard Potgieter
Meroonisha Kerber Sifiso Sibiya Nico Muller
IMPLATS
INTERIM RESULTS FY2021
GROUP OVERVIEW Nico Muller
01

5IMPLATS
INTERIM RESULTS FY2021
6 Shaft 3.07 million
20 Shaft 2.93 million
16 Shaft 2.85 million
Mineral Processes 1.17 million
10 Shaft 1.09 million
E&F Shaft 1.03 million
GROUP SAFETY OVERVIEW
8
7
5 5
0
6.356.01
5.30
4.54 5.13
0
1
2
3
4
5
6
7
8
0
2
4
6
8
10
12
14
FY2017 FY2018 FY2019 FY2020 H1 FY2021
LTIFR**
FATALITIES
Rtb Services 13.74 million
Refineries 12.39 million
14 Shaft 5.43 million
9 Shaft 3.36 million
Zimplats 3.33 million
Marula 3.21 million
FATALITY FREE SHIFTS*
Implats reported no fatal incidents during the period
*as at 31 December 2020
**per million man hours worked
FATALITIES AND LOST-TIME INJURY FREQUENCY RATE
Description H1 FY2021 H1 FY2020 FY2020
Fatalities No. 0 3 5
FIFR pmmhw 0.000 0.055 0.050
LTIFR pmmhw 5.13 4.84 4.54
TIFR pmmhw 9.34 11.91 11.30
Impala Rustenburg 5.69 million Implats 7.83 million
6IMPLATS
INTERIM RESULTS FY2021
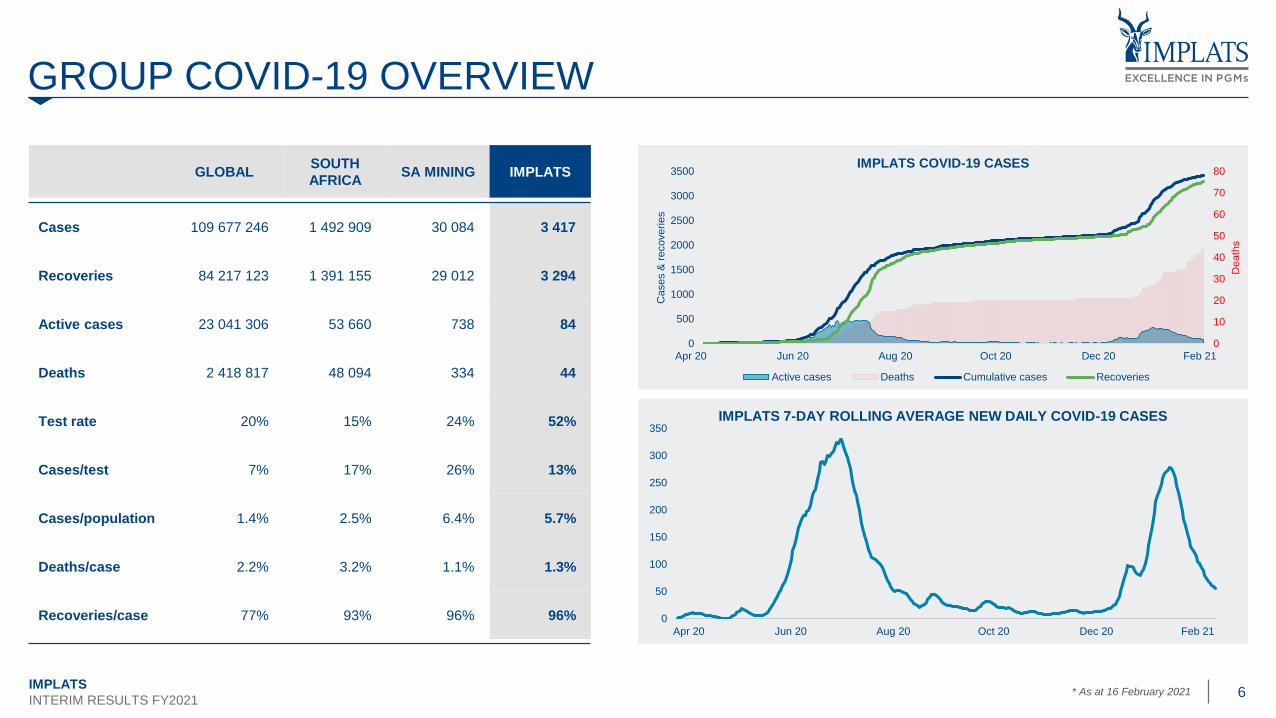
GROUP COVID-19 OVERVIEW
GLOBALSOUTH
AFRICASA MINING IMPLATS
Cases 109 677 246 1 492 909 30 084 3 417
Recoveries 84 217 123 1 391 155 29 012 3 294
Active cases 23 041 306 53 660 738 84
Deaths 2 418 817 48 094 334 44
Test rate 20% 15% 24% 52%
Cases/test 7% 17% 26% 13%
Cases/population 1.4% 2.5% 6.4% 5.7%
Deaths/case 2.2% 3.2% 1.1% 1.3%
Recoveries/case 77% 93% 96% 96%
* As at 16 February 2021
0
50
100
150
200
250
300
350IMPLATS 7-DAY ROLLING AVERAGE NEW DAILY COVID-19 CASES
0
10
20
30
40
50
60
70
80
0
500
1000
1500
2000
2500
3000
3500
Death
s
Cases &
recoverie
s
IMPLATS COVID-19 CASES
Active cases Deaths Cumulative cases Recoveries
Apr 20 Jun 20 Aug 20 Oct 20 Dec 20 Feb 21
Apr 20 Jun 20 Aug 20 Oct 20 Dec 20 Feb 21

7IMPLATS
INTERIM RESULTS FY2021
GROUP ESG OVERVIEW
Included for the
Bloomberg Gender-Equality Index
for the second year in a row
‘A’ rating for disclosures, awareness
and management of
water security risk
‘B’ rating for climate change
action and disclosures
IMPLATS
INTERIM RESULTS FY2021
Recognised by the
London Platinum and Palladium Market (LPPM)
for responsible sourcing of platinum and palladium
PLEASING PROGRESS ON OUR
SUSTAINABILITY EXCELLENCE
JOURNEY
• Zero Level 4 or 5 environmental
incidents
• 67% reduction in Level 3 incidents
• 18% increase in water recycled or
reused
• 11% reduction in scope 1 and 2
carbon emissions per tonne milled
• 26% increase in local procurement
spend to R1.8 billion
• R355 million spent on Covid-19
interventions across Group
operations in the period

8IMPLATS
INTERIM RESULTS FY2021
GROUP OPERATIONAL OVERVIEW
Description H1 FY2021 H1 FY2020 Var (%)
Tonnes Milled# kt 11 789 10 305 14%
Concentrate production 6E koz 1 684 1 539 9%
Managed operations 6E koz 1 205 1 090 11%
Impala 6E koz 660 653 1%
Zimplats 6E koz 297 299 (1%)
Marula 6E koz 121 124 (2%)
Impala Canada 6E koz 127 14 >100%
JV operations 6E koz 283 258 9%
Mimosa 6E koz 132 120 10%
Two Rivers 6E koz 150 138 9%
Third-party purchased 6E koz 196 190 3%
Refined production 6E koz 1 694 1 317 29%
Unit cost (to concentrate)# R/t 1 259 1 157 (9%)
Unit cost (refined stock-adjusted) R/oz 6E 14 292 13 157 (9%)
Capital expenditure# Rm 2 667 1 925 (39%)
Impala Rm 982 998 2%
Zimplats Rm 930 686 (36%)
Marula Rm 105 204 49%
Impala Canada Rm 640 37 (>100%)
#managed operations
1 5891 485
1 317
1 496
1 694
FY2019 FY2020 FY2021
6E
koz
REFINED PRODUCTION
11 41312 366
13 157 13 65714 292
FY2019 FY2020 FY2021
R/6
E o
z
UNIT COST
1 706
2 0801 925
2 5632 667
FY2019 FY2020 FY2021
Rm
CAPITAL EXPENDITURE
1 5611 449
1 539
1 311
1 684
FY2019 FY2020 FY2021
6E
koz
CONCENTRATE PRODUCTION
Managed JVs 3rd Party

9IMPLATS
INTERIM RESULTS FY2021
1 539
1 684
113
12 12
7 6
2 3
1 450
1 500
1 550
1 600
1 650
1 700
H1 FY20 Impala Canada Mimosa Two Rivers Impala 3rd party receipts Zimplats Marula H1 FY21
6E
koz
in c
oncentr
ate
MOVEMENT IN 6E CONCENTRATE PRODUCTION VS H1 FY2020
9
297(1%)
127>100%
1509%
6601%
1963%
121(2%)
13210%
koz 6E in concentrate
% variance from H1 FY2020
10IMPLATS
INTERIM RESULTS FY2021
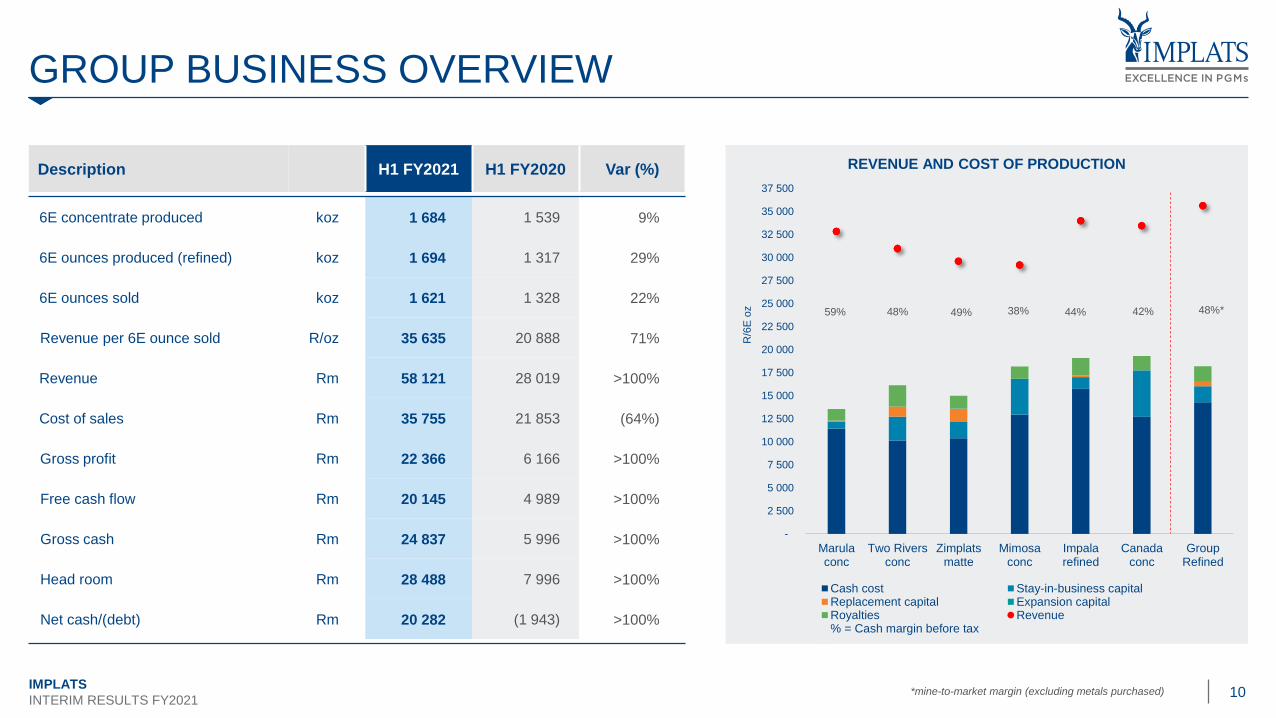
GROUP BUSINESS OVERVIEW
Description H1 FY2021 H1 FY2020 Var (%)
6E concentrate produced koz 1 684 1 539 9%
6E ounces produced (refined) koz 1 694 1 317 29%
6E ounces sold koz 1 621 1 328 22%
Revenue per 6E ounce sold R/oz 35 635 20 888 71%
Revenue Rm 58 121 28 019 >100%
Cost of sales Rm 35 755 21 853 (64%)
Gross profit Rm 22 366 6 166 >100%
Free cash flow Rm 20 145 4 989 >100%
Gross cash Rm 24 837 5 996 >100%
Head room Rm 28 488 7 996 >100%
Net cash/(debt) Rm 20 282 (1 943) >100%
59% 48% 49% 38% 44% 42%
-
2 500
5 000
7 500
10 000
12 500
15 000
17 500
20 000
22 500
25 000
27 500
30 000
32 500
35 000
37 500
Marulaconc
Two Riversconc
Zimplatsmatte
Mimosaconc
Impalarefined
Canadaconc
GroupRefined
R/6
E o
z
REVENUE AND COST OF PRODUCTION
Cash cost Stay-in-business capitalReplacement capital Expansion capitalRoyalties Revenue% = Cash margin before tax
48%*
*mine-to-market margin (excluding metals purchased)

IMPLATS
INTERIM RESULTS FY2021
OPERATIONS REVIEW Mark Munroe
02

12IMPLATS
INTERIM RESULTS FY2021
IMPALA
12
Description H1 FY2021 H1 FY2020 Var (%) Remarks
Tonnes milled kt 5 577 5 739 (3%) • Effective Covid-19 protocols; 9 Shaft closure
6E head grade g/t 4.03 3.91 3% • Reduced waste from 16 Shaft
6E in concentrate koz 660 653 1% • Higher yields
6E refined (Stock
adjusted)koz 670 645 4% • Improved recoveries
6E refined koz 729 761 (4%) • Previous year benefitted from IRS re-allocation
Cash cost Rm 10 560 9 358 (13%)• Covid-related expenditure and costs incurred on
development and asset integrity
Cost per 6E oz (Stock adjusted)
R/oz 15 754 14 515 (9%) • Volume benefits offset cost inflation
Capital expenditure Rm 982 998 2%
Free cash flow Rm 10 656 7 083 50%• Previous period benefitted from metal prepayment
and stock reallocation
*6E refined production (stock-adjusted)
**Cost per 6E ounce (stock-adjusted)
682617 645
470
670
FY2019 FY2020 FY2021
koz
PRODUCTION*
12 461 13 868 14 515 15 735 15 754
FY2019 FY2020 FY2021
R/o
z
COST**
2 228
-352
7 083
1 363
10 656
FY2019 FY2020 FY2021
Rm
FREE CASH FLOW

13IMPLATS
INTERIM RESULTS FY2021
6E OUNCES STOCK-ADJUSTED – H1 FY2021 / H1 FY2020
*costs including SIB capital**cash profit (after tax) after replacement capital
1includes the treatment of dumps, slag and sludge
Production 6E koz 37 45 120 104 7 102 68 66 20 62 27 13
Revenue R/6E oz 34 074 32 053 32 741 25 901 32 996 30 713 35 164 35 556 34 571 35 582 35 556
Cost* R/6E oz 19 075 17 068 17 068 12 626 20 621 20 393 15 814 13 650 18 707 15 266 17 187
Cash Profit / (Loss)** Rm 435 1 171 1 063 72 723 391 845 292 648 289 155
645
670
22
10
5
4 2
1
0 0 0 1
2
15
620
630
640
650
660
670
680
690
H1 FY2020 Other 1# 14# 11# Re-mining 16# 20# 12# E&F 10# 6# 9# H1 FY20211

IMPLATS
INTERIM RESULTS FY2021
OPERATIONS REVIEW Gerhard Potgieter
02

15IMPLATS
INTERIM RESULTS FY2021
MARULA
Description H1 FY2021 H1 FY2020 Var (%) Remarks
Tonnes milled kt 934 970 (4%)• Weak Q2 FY2021 due to Covid-related staffing
challenges
6E head grade g/t 4.40 4.60 (4%) • Negative variance in ratio of stoping to development
6E in concentrate koz 121 124 (2%) • Benefitted from higher recoveries
Cash Cost Rm 1 388 1 276 (9%) • Covid-19 expenditure including shift changes
Cost per 6E oz R/oz 11 433 10 265 (11%)
Capital expenditure Rm 105 204 49% • Slowing spend as TSF project nears completion
Free cash flow Rm 897 431 >100%• Higher basket price partially offset by impact of IRS
contractual payment lag
*6E concentrate production
**Cost per 6E ounce in concentrate
118 99
124
86
121
FY2019 FY2020 FY2021
koz
PRODUCTION*
9 779
11 493
10 265
11 354 11 433
FY2019 FY2020 FY2021
R/o
z
COST**
162 218 431
1 721
897
FY2019 FY2020 FY2021
Rm
FREE CASH FLOW

16IMPLATS
INTERIM RESULTS FY2021
TWO RIVERS
Description H1 FY2021 H1 FY2020 Var (%) Remarks
Tonnes milled kt 1 631 1 646 (1%)• Resolution of milling challenges offset by delayed
return of foreign employees
6E head grade g/t 3.37 3.45 (2%) • Mining from lower grade areas
6E in concentrate koz 150 138 9% • Improved plant performance
Cash Cost Rm 1 526 1 329 (15%) • Mining volumes increased to build ROM stockpile
Cost per 6E oz R/oz 10 153 9 616 (6%)
Capital expenditure Rm 552 391 (41%) • Acceleration of project spend
Free cash flow Rm 721 154 >100%• Higher basket price partially offset by impact of
IRS contractual payment lag
*6E concentrate production
**Cost per 6E ounce in concentrate
161 152 138
123150
FY2019 FY2020 FY2021
koz
PRODUCTION*
7 727 8 568
9 616 9 403 10 153
FY2019 FY2020 FY2021
R/o
z
COST**
64
382
154
1 131
721
FY2019 FY2020 FY2021
Rm
FREE CASH FLOW
17IMPLATS
INTERIM RESULTS FY2021
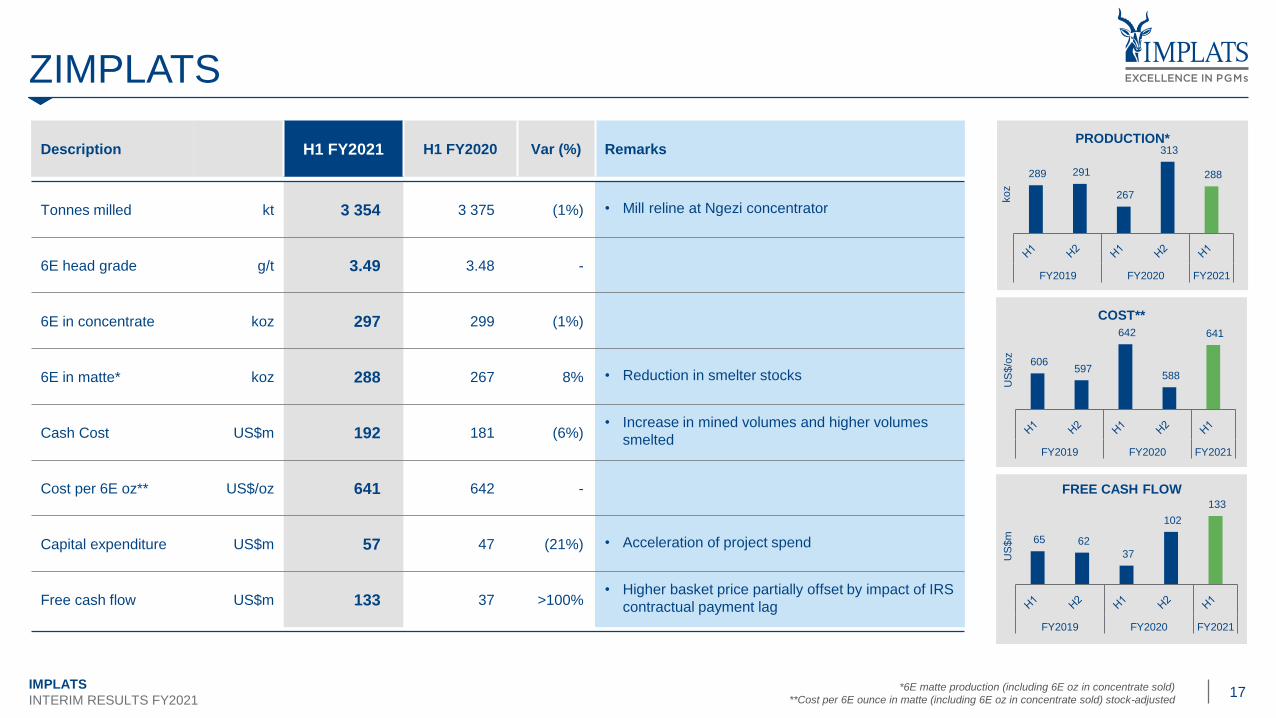
ZIMPLATS
17
Description H1 FY2021 H1 FY2020 Var (%) Remarks
Tonnes milled kt 3 354 3 375 (1%) • Mill reline at Ngezi concentrator
6E head grade g/t 3.49 3.48 -
6E in concentrate koz 297 299 (1%)
6E in matte* koz 288 267 8% • Reduction in smelter stocks
Cash Cost US$m 192 181 (6%)• Increase in mined volumes and higher volumes
smelted
Cost per 6E oz** US$/oz 641 642 -
Capital expenditure US$m 57 47 (21%) • Acceleration of project spend
Free cash flow US$m 133 37 >100%• Higher basket price partially offset by impact of IRS
contractual payment lag
*6E matte production (including 6E oz in concentrate sold)
**Cost per 6E ounce in matte (including 6E oz in concentrate sold) stock-adjusted
606 597
642
588
641
FY2019 FY2020 FY2021
US
$/o
z
COST**
65 62
37
102
133
FY2019 FY2020 FY2021
US
$m
FREE CASH FLOW
289 291
267
313
288
FY2019 FY2020 FY2021
koz
PRODUCTION*

18IMPLATS
INTERIM RESULTS FY2021
MIMOSA
Description H1 FY2021 H1 FY2020 Var (%) Remarks
Tonnes milled kt 1 433 1 306 10% • Prior period impacted by mill breakdown
6E head grade g/t 3.89 3.84 1%
6E in concentrate koz 132 120 10%
Cash Cost US$m 106 100 (6%) • Higher mined, milled and sold volumes
Cost per 6E oz US$/oz 798 830 4%
Capital expenditure US$m 32 25 (29%) • Plant optimisation
Free cash flow US$m 29 9 >100%• Higher sales and basket price partially offset by
impact of IRS contractual payment lag
*6E concentrate production
**Cost per 6E ounce in concentrate
132 129
120
128
132
FY2019 FY2020 FY2021
koz
PRODUCTION*
741
802 830
709
798
FY2019 FY2020 FY2021
US
$/o
z
COST**
-5
-
9
15
29
FY2019 FY2020 FY2021
US
$m
FREE CASH FLOW
19IMPLATS
INTERIM RESULTS FY2021
IMPALA CANADA
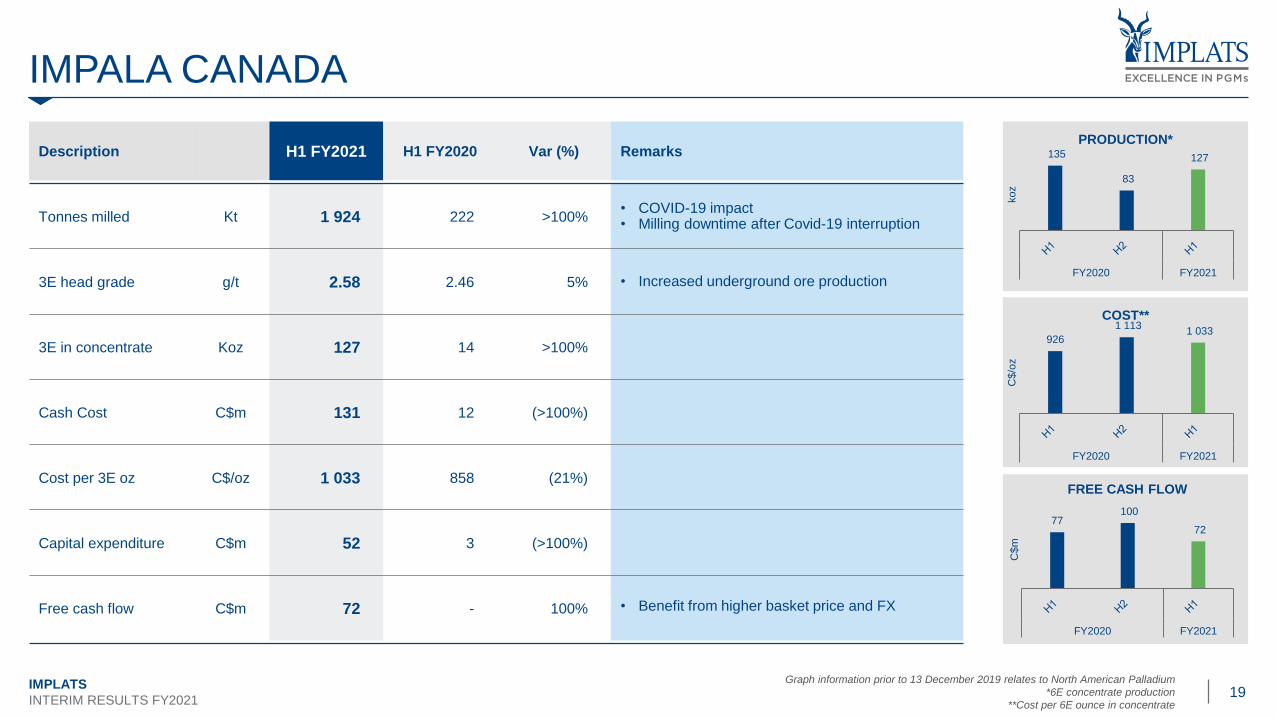
Description H1 FY2021 H1 FY2020 Var (%) Remarks
Tonnes milled Kt 1 924 222 >100%• COVID-19 impact• Milling downtime after Covid-19 interruption
3E head grade g/t 2.58 2.46 5% • Increased underground ore production
3E in concentrate Koz 127 14 >100%
Cash Cost C$m 131 12 (>100%)
Cost per 3E oz C$/oz 1 033 858 (21%)
Capital expenditure C$m 52 3 (>100%)
Free cash flow C$m 72 - 100% • Benefit from higher basket price and FX
Graph information prior to 13 December 2019 relates to North American Palladium
*6E concentrate production
**Cost per 6E ounce in concentrate
135
83
127
FY2020 FY2021
koz
PRODUCTION*
926
1 113 1 033
FY2020 FY2021
C$/o
z
COST**
77100
72
FY2020 FY2021
C$m
FREE CASH FLOW

20IMPLATS
INTERIM RESULTS FY2021
Description H1 FY2021 H1 FY2020 Var (%) Remarks
Receipts 6Ekoz 943 822 15%• High deliveries from Mimosa, Two Rivers and
Zimplats
Mine-to-market
3rd Party
6Ekoz
6Ekoz
747
196
631
190
18%
3%
Refined output 6Ekoz 845 549 54%• Prior period impacted by IRS/Impala stock
reallocation
Refined metal returned 6Ekoz 0.2 0.6 (67%) • No major toll refining contracts
Free cash flow Rm 4 762 (3 381) >100%• Prior period impacted by metal reallocation
(R5bn)
IRS
696 657 631 582
747
FY2019 FY2020 FY2021
koz
MINE-TO-MARKET RECEIPTS
184 175 190
136
196
FY2019 FY2020 FY2021
koz
THIRD PARTY RECEIPTS
743
2 632
-3 381
3 265 4 762
FY2019 FY2020 FY2021
Rm
FREE CASH FLOW
IMPLATS
INTERIM RESULTS FY2021
FINANCIAL REVIEW Meroonisha Kerber
03

22IMPLATS
INTERIM RESULTS FY2021
INCOME STATEMENT
• Revenue up 107% to R58 billion on higher sales volumes and rand pricing
• 22% increase in 6E sales volumes: ~R6.4 billion
• 55% increased in dollar revenue basket: ~R18.2 billion
• 10% weaker rand exchange rate: ~R5.4 billion
• Cost of sales increased by 64% to R35.8 billion
• Increase in cost of metals purchased ~R7.7 billion
on higher receipts and rand PGM pricing
• Inclusion of Impala Canada cost of sales ~R2.3 billion
• Higher royalties on improved ~R1.5 billion
profitability and revenue
• Impairment reversal of R14.7 billion included in basic earnings
• PPE ~R10.4 billion
• Prepaid royalties ~R4.3 billion
• Other net expenses includes R1.5 billion Marula IFRS 2 BEE non-cash charge.
• No tax impact and included in both EBITDA and headline earnings (-194cps)
• EBITDA > 3x to R25 billion at EBITDA margin of 43%
• Headline earnings improved from 436 to 1 855 cps
R MILLION H1 FY2021 H1 FY2020VARIANCE
(%)
Revenue 58 121 28 019 >100
Cost of sales (35 755) (21 853) (64)
Cash costs (17 648) (14 268) (24)
Royalties (2 021) (488) >100
Metals purchased (16 055) (8 364) (92)
Change in stock 3 519 3 613 3
Other cost of sales (3 550) (2 346) (51)
Gross profit 22 366 6 166 >100
Impairment reversal 14 728 - -
Net foreign exchange (losses)/gains (521) (222) >100
Other net (expenses)/income (1 534) (1 066) (44)
Net finance costs (155) (346) 55
Share of associates income 1 003 247 >100
Profit before tax 35 887 4 779 >100
Tax (10 470) (1 312) >100
Profit after tax 25 417 3 467 >100
GP margin (%) 38 22 75
EBITDA 25 064 7 569 >100
Headline earnings 14 441 3 378 >100

23IMPLATS
INTERIM RESULTS FY2021
STOCK-ADJUSTED UNIT COSTS
Stock adjusted unit costs increased by 9% to R14 292 per ounce
• Overall Implats mining inflation of 6.7%
• SA +5.9%
• Zimbabwe (US$) +0.7%
• Weaker rand on the translation of Zimplats US dollar costs
• Covid-19 related direct expenditure of R283 million
Implats incurred additional spend on:
• Higher production bonuses in line with above-budget volume achievements
at all operations
• Additional development at Impala to improve mining flexibility, and
• Targeted spend on asset integrity
23
13 157
14 292
633
248
237
16
H1 FY2020 Inflation TranslationZimplats USdollar costs
Covid-19 costs Other H1 FY2021
(R/6
E o
z)
STOCK-ADJUSTED UNIT COST

24IMPLATS
INTERIM RESULTS FY2021
EXCESS INVENTORY
• Excess in-process 6E stock of 100 000 oz 6E unchanged from June 2020
• Material stockpiled in Zimbabwe in FY2020 due to force majeure was delivered
to the refineries
• All excess IRS pre-smelter stock was treated
• BMR processing impacted in December 2020 due to impurities in the feed
• Planned furnace maintenance at Zimplats and Rustenburg in Q3 FY2020
• All excess stock is expected to be refined by the end of FY2021
• Financial impact of excess stock at period-end metal prices:
• Gross profit c.R2.1 billion
• Cash flow c.R2.6 billion 215
350
100 100
0
0
50
100
150
200
250
300
350
FY2019 H1 FY2020 FY2020 H1 FY2021 FY2021
000 o
z 6
E
EXCESS WORK IN PROCESS STOCK AT PERIOD END
25IMPLATS
INTERIM RESULTS FY2021
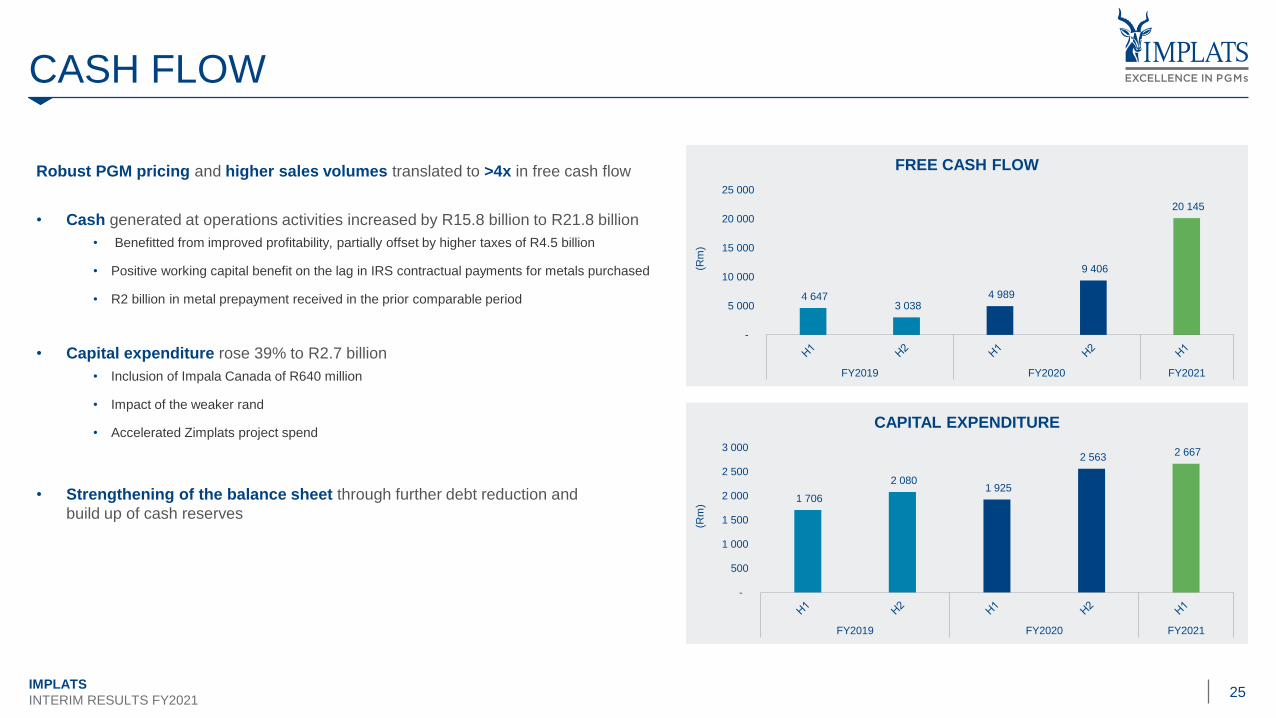
CASH FLOW
Robust PGM pricing and higher sales volumes translated to >4x in free cash flow
• Cash generated at operations activities increased by R15.8 billion to R21.8 billion
• Benefitted from improved profitability, partially offset by higher taxes of R4.5 billion
• Positive working capital benefit on the lag in IRS contractual payments for metals purchased
• R2 billion in metal prepayment received in the prior comparable period
• Capital expenditure rose 39% to R2.7 billion
• Inclusion of Impala Canada of R640 million
• Impact of the weaker rand
• Accelerated Zimplats project spend
• Strengthening of the balance sheet through further debt reduction and
build up of cash reserves
4 647 3 038
4 989
9 406
20 145
-
5 000
10 000
15 000
20 000
25 000
FY2019 FY2020 FY2021
(Rm
)
FREE CASH FLOW
1 706
2 080 1 925
2 563 2 667
-
500
1 000
1 500
2 000
2 500
3 000
FY2019 FY2020 FY2021
(Rm
)
CAPITAL EXPENDITURE

26IMPLATS
INTERIM RESULTS FY2021
CASH NET OF DEBT
• Cash net of debt of R20.3 billion
• Reduction in debt:
• Expedited repayment of Impala Canada term loan of R1.4 billion
• Scheduled payment of Marula BEE debt of R885 million
• Reduced carrying value of ZAR convertible bond following repurchase
and conversion
• Group headroom at period end of R28.5 billion:
• R24.8 billion cash, excluding restricted cash R349 million
• Undrawn RCF of R4 billion in place until June 2021
• RCF successfully refinanced post period-end:
• R6 billion and US$125m
• Group of domestic and international banks
• Effective increase in headroom to c.R32.3 billion
2
6
R MILLION H1 FY2021 H1 FY2020 FY2020
South African cash 20 713 5 256 9 689
Offshore cash 4 124 740 3 642
Gross cash 24 837 5 996 13 331
ZAR Convertible bond (2 533) (2 838) (2 914)
Marula BEE debt - (886) (885)
Zimplats overdraft (174) - (126)
Impala Canada term loan (1 848) (4 215) (3 658)
Gross debt (excluding leases) (4 555) (7 939) (7 583)
Net cash / (debt) excluding leases 20 282 (1 943) 5 748
(976)
1 075
(1 943)
5 748
20 282
-5 000
0
5 000
10 000
15 000
20 000
25 000
FY2019 FY2020 FY2021
(Rm
)
NET CASH / (DEBT)

27IMPLATS
INTERIM RESULTS FY2021
CAPITAL ALLOCATION FRAMEWORK AND H1 FY2021 DIVIDEND
BALANCE SHEET STRENGTH
• Repayment of Marula BEE loan (R0.9 billion)
• Repayment of borrowings (R1.5 billion)
• Repurchase of ZAR bonds liability portion (R0.2 billion)
• Provision for future rehabilitation obligations (R1.0
billion)
• Retained cash (R5.7 billion)
RETURNS TO SHAREHOLDERS
• Interim dividend – proposed (R7.9 billion)
• Zimplats minorities (R0.1 billion)
• Repurchase of ZAR bonds equity portion (R0.8 billion)
GROWTH AND INVESTMENT
• Investment in AP Ventures (R0.1 billion)
R9.3bn
R8.8bn
R0.1bn
FR
EE
CA
SH
FL
OW
* O
F R
18.2
BIL
LIO
N
DISCIPLINED AND TRANSPARENT CAPITAL ALLOCATION TO ENSURE A SUSTAINABLE BUSINESS AND CREATE VALUE FOR ALL STAKEHOLDERS
STAY-IN-BUSINESS CAPEX
• Required infrastructure
replacement investment
• Required spend on regulatory
capitalCash from operations of
R27.0bn
R 2.5bn outflowOTHER NET INCOME
• Interest received of +R0.4bn
• Dividends of +R0.5bn
R0.9bn inflow
TAXES PAID
R 5.0bn outflow
INTEREST PAID
R 0.3bn outflow
OTHER OUTFLOWS*
• Share scheme - R1.3bn
• FX cash adjustment –R0.6bn
R 1.9bn outflow
* Free cash flow adjusted for outflows/impacts relating to foreign exchange translation adjustment on
cash and cost of purchasing of shares for the Implats share schemes (included under “other outflows”

IMPLATS
INTERIM RESULTS FY2021
MARKET REVIEW Sifiso Sibiya
04

29IMPLATS
INTERIM RESULTS FY2021
METAL PRICE PERFORMANCE - MARKET
Description H1 FY2021 H1 FY2020 Var (%)
Platinum US$/oz 921 895 3%
Palladium US$/oz 2 258 1 666 35%
Rhodium US$/oz 12 824 4 849 164%
Nickel US$/t 15 086 15 489 (3%)
Exchange rate US$/oz 16.26 14.69 11%
Basket price index R/6E oz 34 305 20 409 68%
Revenue per oz sold R/6E oz 35 635 20 888 71%
20 000
25 000
30 000
35 000
40 000
45 000
1 200
1 400
1 600
1 800
2 000
2 200
2 400
2 600
2 800
3 000
Rands
US
$/o
z
IMPALA BASKET PRICE PER 6E OUNCE
US$ Basket/6E oz Rand Basket/6E oz

30IMPLATS
INTERIM RESULTS FY2021
21%
29%
44%
6%
IMPALA
18%
35%
36%
3%8%
IRS
18%
37%
36%
2%7%
IMPLATS
14%
34%40%
1%9%
2%
MARULA
18%
25%
44%
1%10%
2%
TWO RIVERS
17%
36%20%
4%
17%
6%
ZIMPLATS
20%
38%
17%
9%
11%
5%
MIMOSA
2%
88%
3%7%
IMPALA CANADA
PGM REVENUE BASKETS H1 FY2021
REVENUE CONTRIBUTION BY METAL
Platinum OtherFV pricesNickelRhodiumPalladium
Revenue of
R23.1bn
Revenue of
R4.5bnRevenue of
R5.3bn
Revenue of
R10.7bn
Revenue of
R58.1bnRevenue of
R5.3bn
Revenue of
R4.4bn
Revenue of
R30.4bn

31IMPLATS
INTERIM RESULTS FY2021
MARKET DEVELOPMENT
Anticipate and
respond to
medium and
longer term
market forces
ANTICIPATE
1
Defend markets
or metals where
fundamental
support is
waning
DEFEND
2
De-risk expected
growth to ensure
successful
adoption of
PGM bearing
technologies and
uses
DE-RISK
3
Target spend and
seek
collaboration
across peer
group and
customer base
TARGET
4
Support
sustainable
patterns of
demand for our
primary products
SUPPORT
5
Harness the
benefits of PGM
demand growth
for all our
stakeholders
HARNESS
6
In December 2020 Implats announced its investment in AP Ventures
- Limited Partner and Advisory Board Member
- Total commitment of US$61m with 1H 2021 spend of R130m
- Core linkages and strong developmental commitment to South Africa

32IMPLATS
INTERIM RESULTS FY2021
SUPPLY AND DEMAND BALANCES
2021 platinum market to return to surplus
- Demand expected to rebound by 17%
• European automotive production recovery
• Catalyst loadings to rise on HDD legislation, initial switching
• Jewellery rebound on pent-up demand, Indian recovery and ‘reboot’ in China
• Industrial recovery bolstered by investment in capacity
- Supply to grow by 28% on South African recovery and de-stocking of producer inventory
- Continued momentum in physical investment demand could tighten market
2021 palladium market to remain in deficit
- Demand estimated to rise by 12%
• Automotive production in excess of sales to replenish inventories
• Thrifting on loadings ahead of next phase of legislative tightening
• Industrial demand reflects ongoing price elasticity of demand
• Further clarity on rate and scope of switching
- Supply to grow by 18% with rebound in secondary flows and South African recovery
- Deficit despite destocking of peer group inventory
2021 rhodium market balanced by inventory release
- Demand growth of 12% on automotive production growth
- South African supplies temporarily elevated on inventory release
- Supply side concerns likely to lead to opportunistic accumulation of metal where possible
-1 500
-1 000
-500
0
500
1 000
1 500
2019 2020 2021
koz
SUPPLY/DEMAND BALANCES*
Platinum Palladium Rhodium
* 2019 balance includes 1.15Moz of Pt investment and 75koz of Pd disinvestment
* 2020 balance includes 1.18Moz of Pt investment and 90koz Pd disinvestment

33IMPLATS
INTERIM RESULTS FY2021
Platinum fundamentals set to improve in the medium-term - price
will be dictated by investor sentiment
Our supply outlook is largely unaltered
Palladium and rhodium demand underpinned by resurgent
automotive production in excess of sales
Iridium and ruthenium demand growth from industrial application
and strong linkages to hydrogen economy
The impact of Covid-19 will be cyclical rather than structural
PGM MARKET OUTLOOK
Ir
Ru
Pt
Pd
Rh
IMPLATS
INTERIM RESULTS FY2021
BUSINESS OUTLOOK Nico Muller
05

35IMPLATS
INTERIM RESULTS FY2021
GROUP OUTLOOK
ACTUAL PREV GUIDANCE NEW GUIDANCE
Business area Unit FY2020 FY2021 FY2021
REFINED PRODUCTION:
Group6E koz 2 813 2 800 – 3400 3 200 – 3 460
CONCENTRATE PRODUCTION:
Impala 6E koz 1 109 1 100 – 1 270 1 200 – 1 300
Zimplats 6E koz 597 570 – 600 580 – 600
Two Rivers 6E koz 261 260 – 300 280 – 300
Mimosa 6E koz 248 230 – 260 250 – 270
Marula 6E koz 210 220 – 260 220 – 260
Impala Canada 6E koz 97 250 – 280 260 – 280
IRS (third party) 6E koz 327 300 – 380 360 – 400
GROUP UNIT COST* R/oz 6E 13 345 14 500 – 15 500 14 600 – 15 100
GROUP CAPITAL EXPENDITURE* Rm 4 488 6 000 – 6 750 5 800 – 6 200
* guidance premised on R/US$ 15.62 and R/C$ 12.00

INTERIM RESULTS FY202125 February 2021
37IMPLATS
INTERIM RESULTS FY2021
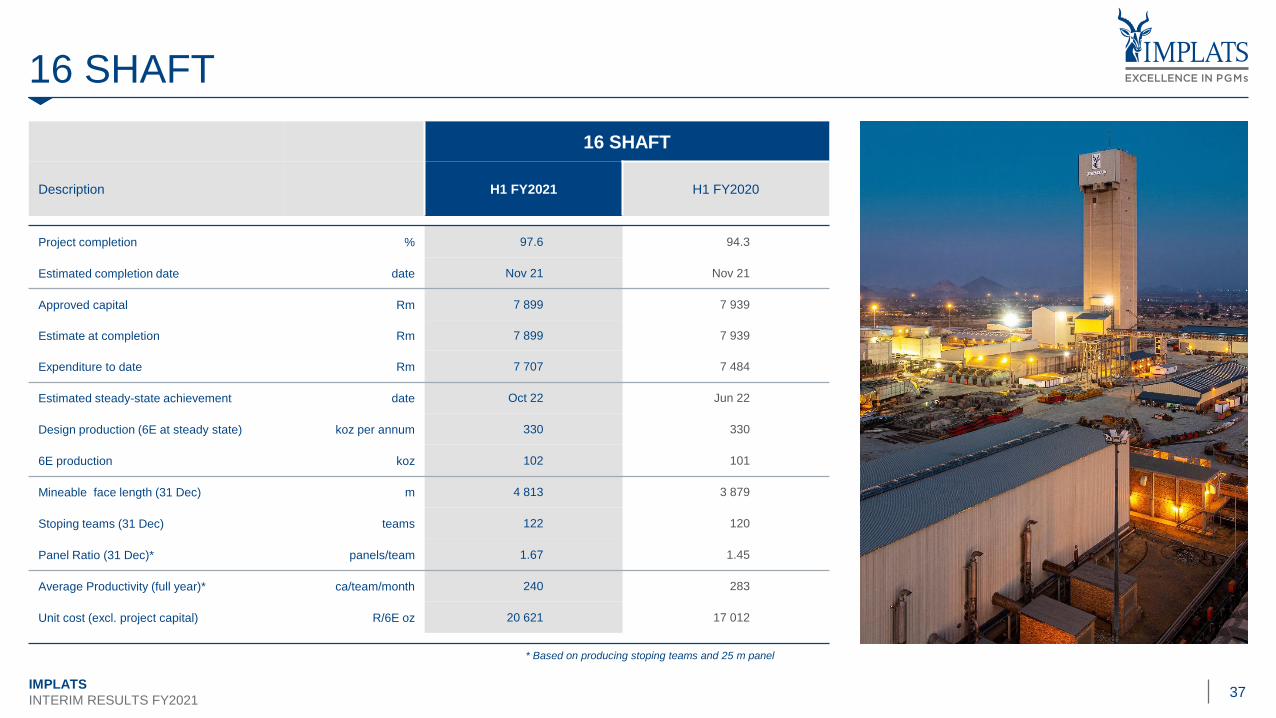
16 SHAFT
16 SHAFT
Description H1 FY2021 H1 FY2020
Project completion % 97.6 94.3
Estimated completion date date Nov 21 Nov 21
Approved capital Rm 7 899 7 939
Estimate at completion Rm 7 899 7 939
Expenditure to date Rm 7 707 7 484
Estimated steady-state achievement date Oct 22 Jun 22
Design production (6E at steady state) koz per annum 330 330
6E production koz 102 101
Mineable face length (31 Dec) m 4 813 3 879
Stoping teams (31 Dec) teams 122 120
Panel Ratio (31 Dec)* panels/team 1.67 1.45
Average Productivity (full year)* ca/team/month 240 283
Unit cost (excl. project capital) R/6E oz 20 621 17 012
* Based on producing stoping teams and 25 m panel
38IMPLATS
INTERIM RESULTS FY2021
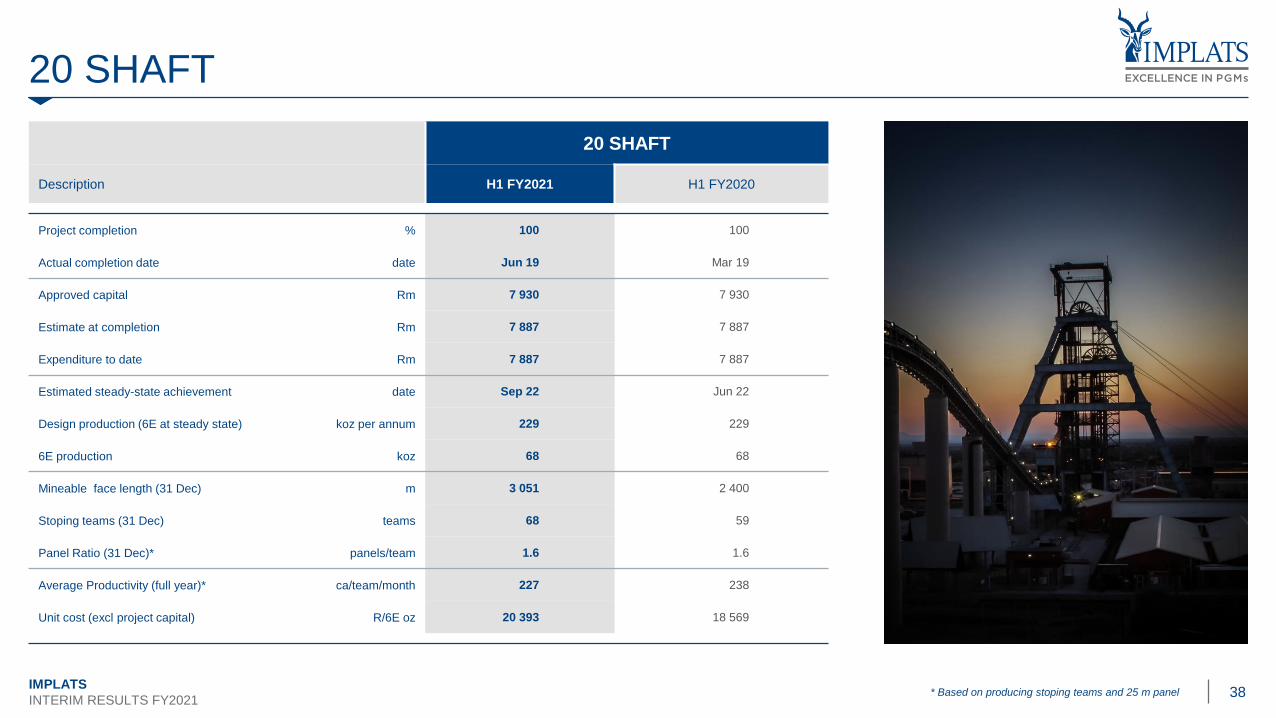
20 SHAFT
20 SHAFT
Description H1 FY2021 H1 FY2020
Project completion % 100 100
Actual completion date date Jun 19 Mar 19
Approved capital Rm 7 930 7 930
Estimate at completion Rm 7 887 7 887
Expenditure to date Rm 7 887 7 887
Estimated steady-state achievement date Sep 22 Jun 22
Design production (6E at steady state) koz per annum 229 229
6E production koz 68 68
Mineable face length (31 Dec) m 3 051 2 400
Stoping teams (31 Dec) teams 68 59
Panel Ratio (31 Dec)* panels/team 1.6 1.6
Average Productivity (full year)* ca/team/month 227 238
Unit cost (excl project capital) R/6E oz 20 393 18 569
Photo: Jacques McCarthy* Based on producing stoping teams and 25 m panel

39IMPLATS
INTERIM RESULTS FY2021
MUPANI
MUPANI
Description H1 FY2021 H1 FY2020
Project completion % 47 39
Estimated completion date date Jul-24 Jul-24
Approved capital US$m 264 264
Estimate at completion US$m 260 258
Expenditure to date US$m 123 80
Design production (nominal 6E value
in matte at steady state )
koz per
annum192 192
Estimated steady-state achievement date Sep-24 Jul-24
Planned 6E production (in ore) koz 8.8 7.4

40IMPLATS
INTERIM RESULTS FY2021
ESG INDICATORS
H1
FY2021 H1 FY2020 Var (%) Remarks
Level 4 or 5
environmental incidentscount 0 0 0% • Maintained
Level 3 environmental
incidentsCount 3 9 67%
• Group-wide environmental awareness
initiatives continue to be rolled-out at all
operations
Water recycled or
reused% 47 40 18%
• Above 44% target (2021)
• Inclusion of Impala Canada (higher recycling
rates (>70%))
Energy consumption GJ/t milled 0.81 0.83 3%• Load shedding and curtailments from Eskom
• Benefit of inclusion of tonnage from Impala
Canada and hydro power electricity supplyScope 1 and 2 carbon
emissionsCO2 t/t milled 0.17 0.19 11%
Local procurement
spendRm 1 836 1 459 26%
• Increase in expenditure to direct production-
related suppliers (predominantly local
Tier 1 and 2).
ESG
• Marula, Impala Refineries and Zimplats operations were recertified ISO 14001:2015 compliant (Canada developing a
gap analysis)
• Refineries, Marula and Zimplats were certified ISO 45001:2018 (safety management systems standard) compliant
• Ongoing initiatives to support host communities during the Covid-19 pandemic
• Additional R10 million donated to Gift of the Givers Foundation to assist host communities and labour-sending areas

41IMPLATS
INTERIM RESULTS FY2021
ITEMS IMPLATS IMPALA ZIMPLATSIMPALA
CANADAMARULA MIMOSA TWO RIVERS TOTAL
Rm Rm US$000 C$000 Rm US$000 Rm Rm
1. Isolation facilities - 50.9 1 460 - 1.4 151 0.3 78.8
2. Employee related costs - 50.8 108 326 13.8 89 6.0 77.8
3. Medical equipment / medicine - 35.7 87 1 0.0 202 1.0 41.4
4. Protective clothing and equipment - 14.9 48 78 0.6 1 350 0.9 40.0
5. Donations 10.0 5.0 111 - 2.1 1 004 0.3 35.5
6. Cleaning consumables / services - 8.0 247 536 1.0 188 1.6 24.3
7. Expenses for staff in quarantine - 7.2 352 67 1.8 43 5.0 21.2
8. Awareness campaigns - 5.4 40 142 0.5 99 0.2 10.1
9. Other - 12.6 293 - 2.3 337 0.2 25.5
TOTAL 10.0 190.6 2 745 1 150 23.5 3 463 15.5
R354.8mTOTAL RAND MILLION 10.0 190.6 44.6 14.1 23.5 56.6 15.5
COVID-19 RELATED COST (H1 FY2021)
41