interim results half year ended 30 june 2004 -...
TRANSCRIPT
Interim resultsHalf year ended 30 June 2004
August 2004
1
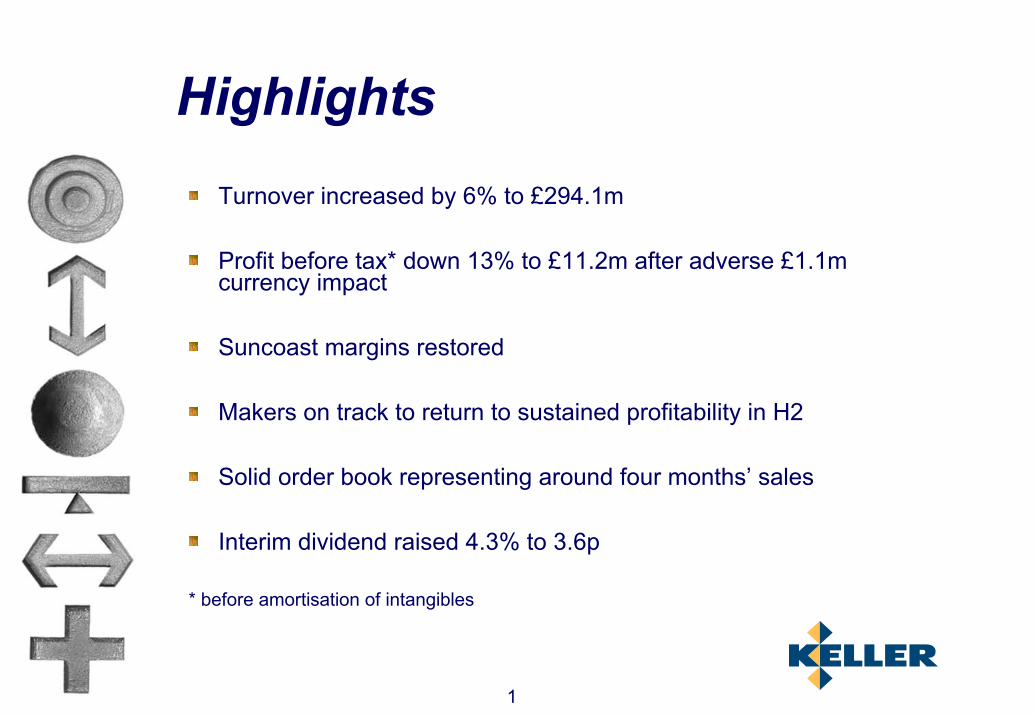
HighlightsTurnover increased by 6% to £294.1m
Profit before tax* down 13% to £11.2m after adverse £1.1m currency impact
Suncoast margins restored
Makers on track to return to sustained profitability in H2
Solid order book representing around four months’ sales
Interim dividend raised 4.3% to 3.6p
* before amortisation of intangibles

2
£m
Half Year2004
Half Year2003
%Change
Full Year 2003
Turnover 294.1 278.7 +6% 567.5
Operating profit* 13.3 14.9 -11% 32.8 Interest (2.1) (2.1) (4.1)
Profit before tax* 11.2 12.8 -13% 28.7 Exceptional items - (0.7) (3.1)Amortisation (1.4) (1.9) (10.8)
9.8 10.2 14.8 Taxation (4.4) (4.1) (10.7)
Profit after tax 5.4 6.1 4.1 Minority interests (0.9) (1.0) (1.8)
4.5 5.1 2.3
Adjusted earnings per share* 9.2p 11.6p -21% 24.1pDividend per share 3.6p 3.45p +4.3% 10.4p
* before amortisation of intangibles and 2003 exceptionals
Adverse currency impact of £18m on turnover and £1.1m on PBTMakers loss of £0.8m (2003: £0.4m profit)Half year effective tax rate* up to 39% (H1 2003: 33%)
Profit and Loss Account

3
Operating Profit and Margin(before amortisation of intangibles and 2003 exceptionals)
£m Half Year 2004 Half Year 2003 Full Year 2003 Operating
Profit
Margin Operating
Profit
Margin Operating
Profit
Margin UK (0.3) -0.6% 0.9 1.6% 0.5 0.5% USA 9.2 6.9% 9.1 7.0% 19.3 7.1% Europe/Overseas 5.0 5.7% 5.5 6.9% 13.8 8.4% Australia 0.9 4.7% 0.8 6.6% 2.0 7.2% 14.8 5.0% 16.3 5.8% 35.6 6.3% Central costs (1.5) (1.4) (2.8) 13.3 4.5% 14.9 4.8% 32.8 5.8%
Makers loss of £0.8m (2003: £0.4m profit) Group margin excluding Makers was 5.4% (2003: 5.9%)Suncoast margins restoredEurope/Overseas margin affected by German performance and£0.4m restructuring costs in Portugal

4
Balance Sheet£m June 2004 June 2003 Dec 2003 Goodwill/intangibles 58.1 66.6 57.0 Tangible assets 79.3 83.6 82.2 137.4 150.2 139.2 Stocks 21.8 17.4 16.9 Debtors 161.9 152.7 137.9 Creditors (129.1) (116.9) (113.0) Working capital 54.6 53.2 41.8 Provisions/long-term creditors (8.9) (8.5) (8.7) Capital employed 183.1 194.9 172.3 Tax/dividends (13.0) (10.1) (11.9) Deferred consideration (1.3) (3.2) (2.1) Net debt (71.8) (76.8) (60.7) Net assets 97.0 104.8 97.6
5
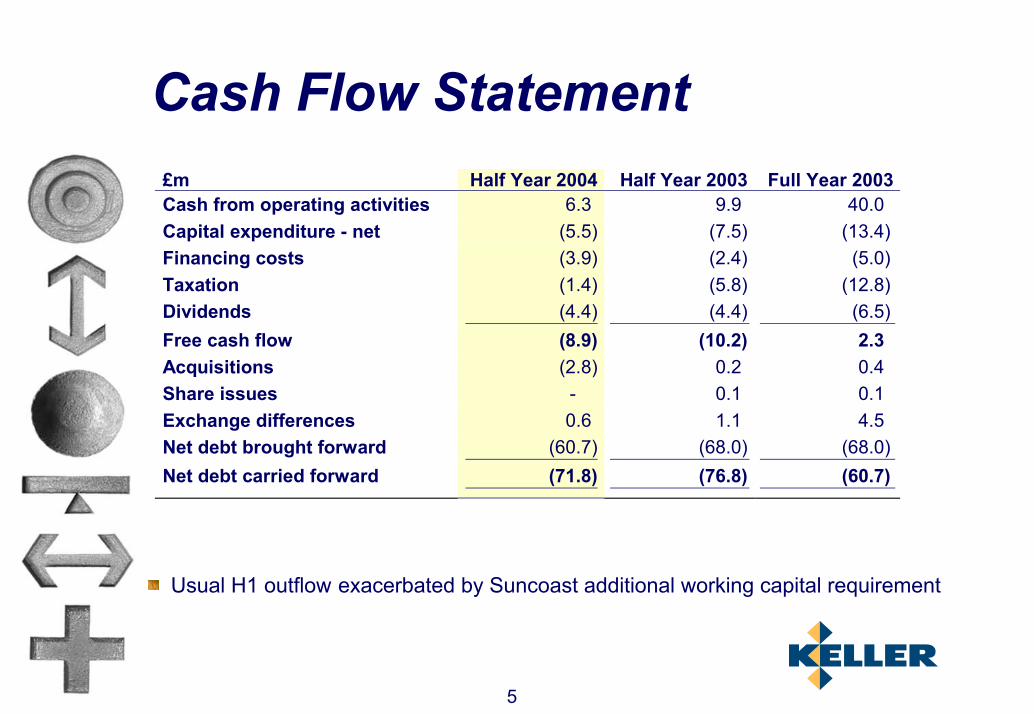
Cash Flow Statement £m Half Year 2004 Half Year 2003 Full Year 2003Cash from operating activities 6.3 9.9 40.0 Capital expenditure - net (5.5) (7.5) (13.4)Financing costs (3.9) (2.4) (5.0)Taxation (1.4) (5.8) (12.8)Dividends (4.4) (4.4) (6.5)Free cash flow (8.9) (10.2) 2.3 Acquisitions (2.8) 0.2 0.4 Share issues - 0.1 0.1 Exchange differences 0.6 1.1 4.5 Net debt brought forward (60.7) (68.0) (68.0)Net debt carried forward (71.8) (76.8) (60.7)
Usual H1 outflow exacerbated by Suncoast additional working capital requirement

6
2004 Guidance2004 H1: H2 profit split consistent with earlier years
typically 35%-40% in H1
Translation impact
US$ 5c change = £0.5m impact€ 5c change = £0.4m impact
Full year tax rate similar to last year
Working capital inflow in H2
Net debt expected to reduce in H2 in line with usual seasonality

7
North America
Results £m Half
Year 2004
Half
Year 2003
%
Change£
%Change
$
Full Year 2003
Sales 133.1
130.6 +2% +15% 270.4
Operating profit 9.2
9.1 +1% +14% 19.3
Operating margin 6.9%
7.0%
7.1% $ exchange rate 1.82
1.61 1.64
8
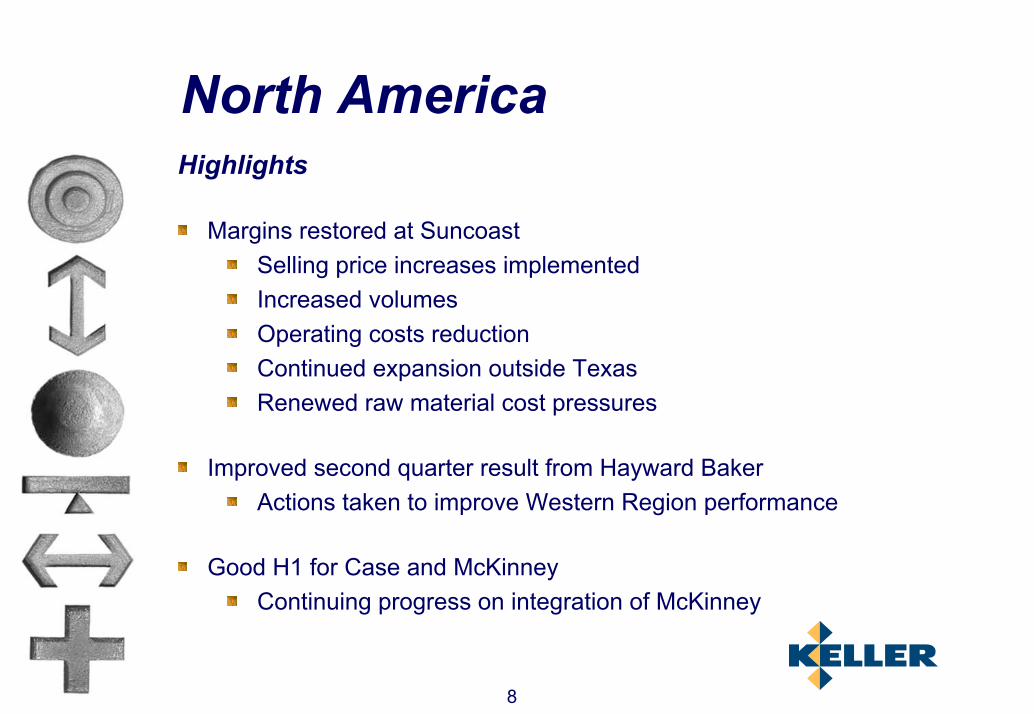
North AmericaHighlights
Margins restored at SuncoastSelling price increases implemented Increased volumes Operating costs reduction Continued expansion outside TexasRenewed raw material cost pressures
Improved second quarter result from Hayward BakerActions taken to improve Western Region performance
Good H1 for Case and McKinneyContinuing progress on integration of McKinney
9
North AmericaCurrent position on steel and cement
Steel Products
Steel strand and rebar prices increased in H1Recent sharp increase in steel scrapFurther selling price increases to be implemented in H2
Cement Shortages
A regional rather than a national problemFlorida, California and North East most affectedNot significantly affecting Keller to date
Small average contract size limits riskPrice escalation clauses sought on larger bids

10
Results £m Half
Year 2004
Half
Year 2003
%Change
£
%Change
€
Full Year 2003
Sales 87.9 78.8 + 12% + 14%
165.2
Operating profit 5.0 5.4 - 8% - 6%
13.8
Operating margin 5.7% 6.9%
8.4%
€ exchange rate 1.49 1.46
1.45
Continental Europe & Overseas
11
Continental Europe & OverseasHighlights
Strong result from Keller-Terra in Spain
Action taken to cut costs in Portugal
Continued geographical expansion in Italy and Poland
Market share maintained in Germany on reduced margins
Remaining 50% of LCM in Sweden purchased for £2.5m
Strong contribution from Malaysia
Organic expansion of new products
12
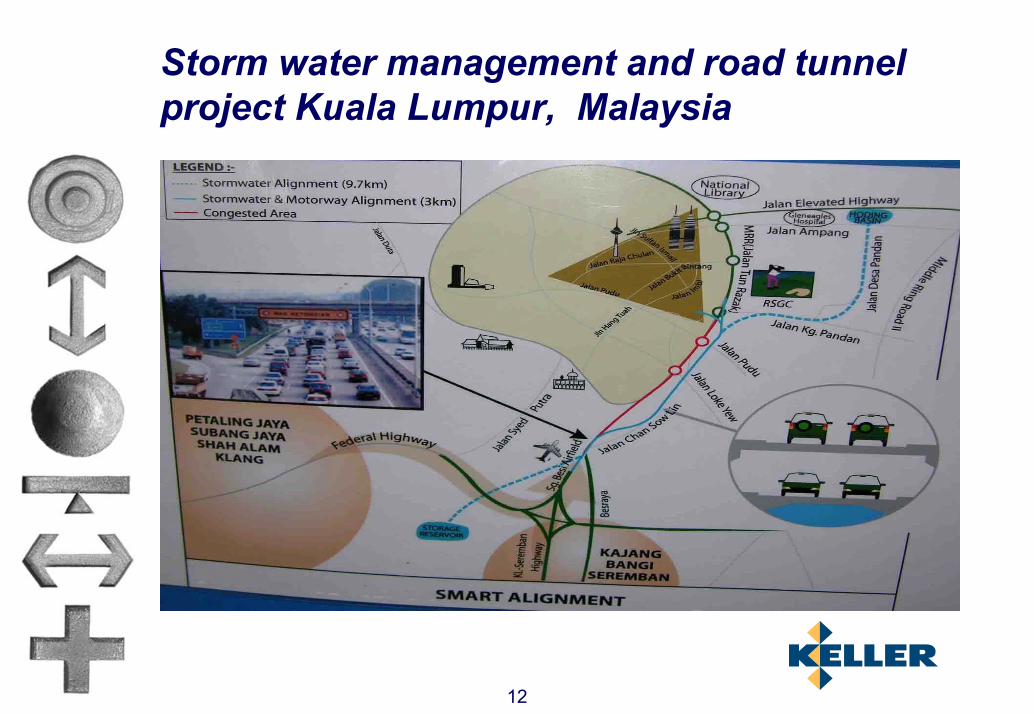
Storm water management and road tunnel project Kuala Lumpur, Malaysia

13
Storm water management and road tunnel project Kuala Lumpur, Malaysia
14
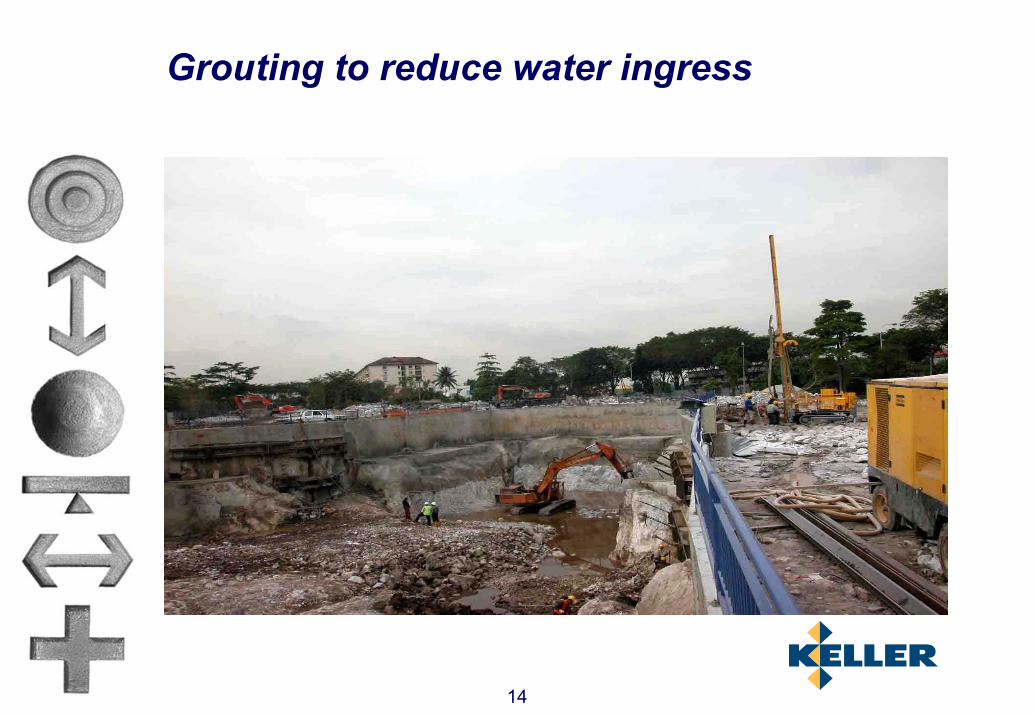
Grouting to reduce water ingress

15
Micropile wall and jet grouting in low headroom

16
Keller has now successfully extended itsproduct range in Malaysia

17
United KingdomHighlights
Makers result improved in the second quarter
H1 adversely affected by old contracts in discontinued areas
Volumes increased in the Social Housing business
Business more focused; management strengthened; morale improved
KGE sales declined, reflecting withdrawal from heavy piling in 2003
Foundation support division had a particularly good H1
18
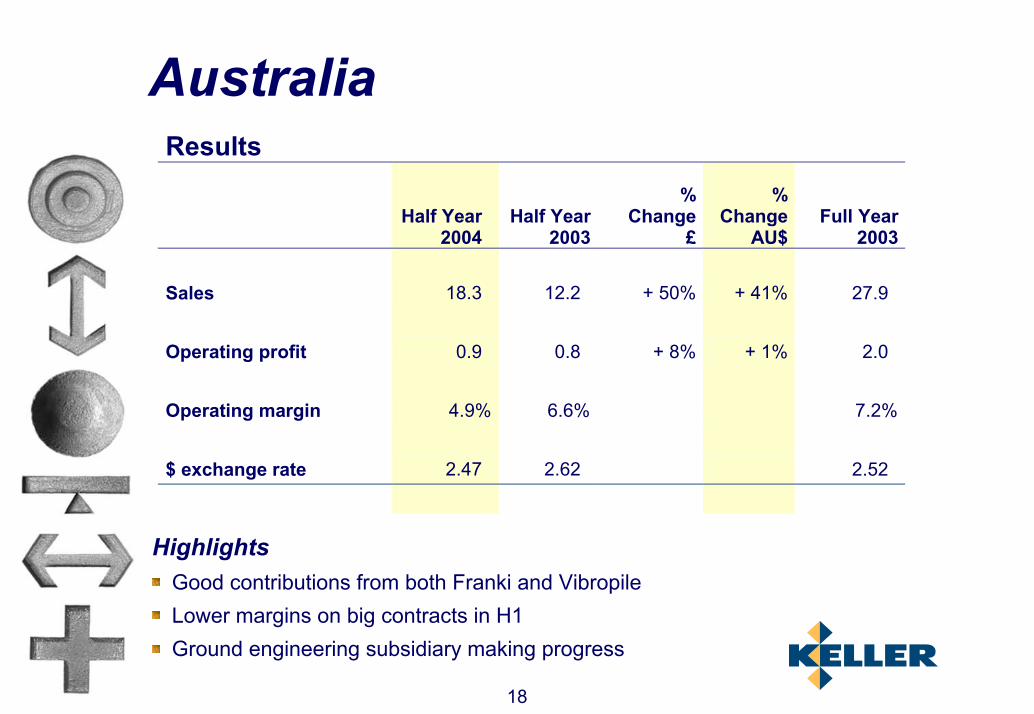
Results
Half Year
2004
Half Year 2003
%Change
£
%Change
AU$Full Year
2003 Sales 18.3 12.2 + 50% + 41%
27.9
Operating profit 0.9 0.8 + 8% + 1%
2.0
Operating margin 4.9% 6.6%
7.2%
$ exchange rate 2.47 2.62
2.52
HighlightsGood contributions from both Franki and VibropileLower margins on big contracts in H1Ground engineering subsidiary making progress
Australia
19
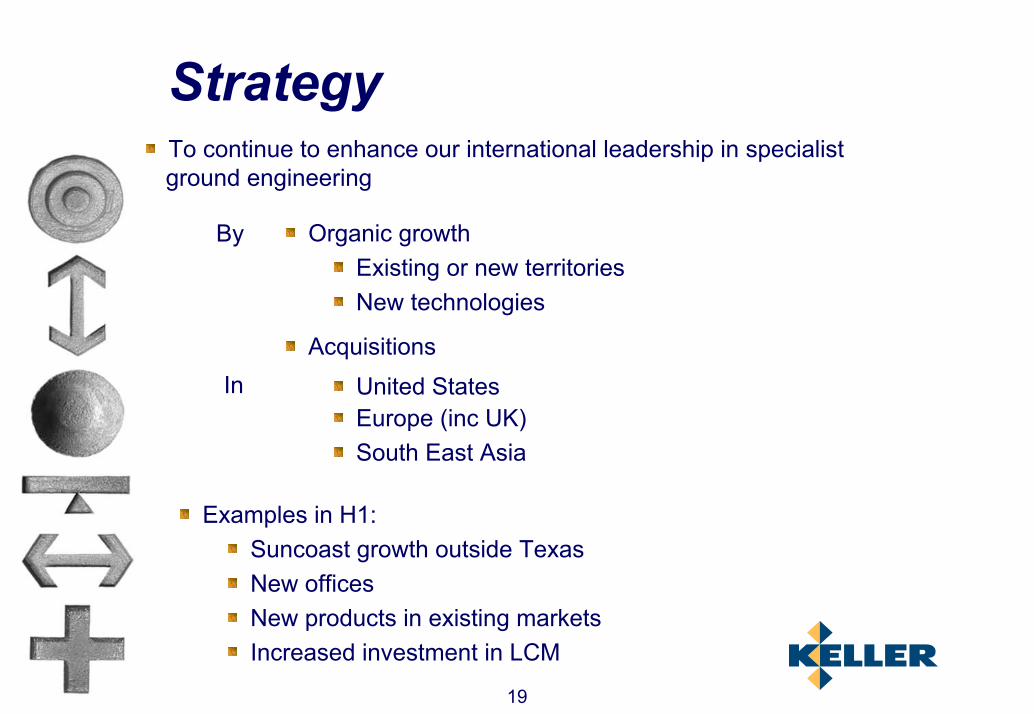
StrategyTo continue to enhance our international leadership in specialist ground engineering
Organic growthExisting or new territoriesNew technologies
Acquisitions
United StatesEurope (inc UK)South East Asia
By
In
Examples in H1:Suncoast growth outside TexasNew officesNew products in existing marketsIncreased investment in LCM
20
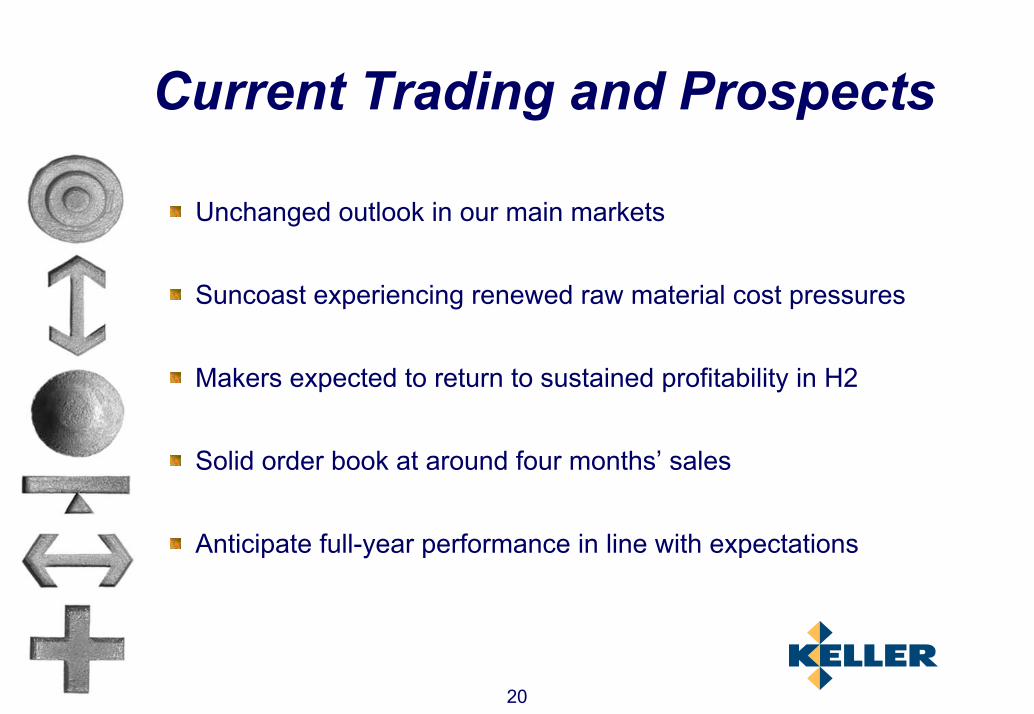
Current Trading and Prospects
Unchanged outlook in our main markets
Suncoast experiencing renewed raw material cost pressures
Makers expected to return to sustained profitability in H2
Solid order book at around four months’ sales
Anticipate full-year performance in line with expectations
Appendix
August 2004

22
Ground Engineering WorldwideActivities
Specialty grouting
Ground improvement
Caisson & piling in specific
Post-tension concrete
Applications
Control of building settlement Groundwater control Cavity filling
Seismic risk protection Foundation support
Foundation support Earth retention
Slab-on-grade foundations High rise structures

23
Ground Engineering Worldwide
Makers
Refurbishment Local authority housingCar parksWater related structures
24
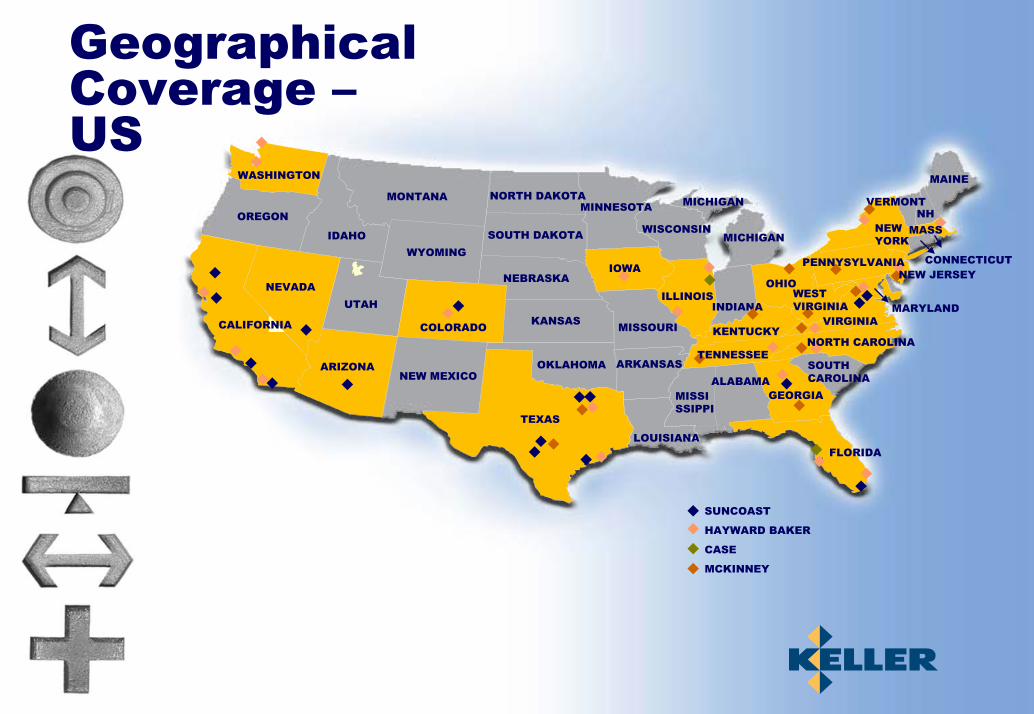
Geographical Coverage –US
WASHINGTON
OREGON
NEVADA
CALIFORNIA
ARIZONA
UTAH
IDAHO
MONTANA
WYOMING
COLORADO
NEW MEXICO
TEXAS
OKLAHOMA
KANSAS
NEBRASKA
SOUTH DAKOTA
NORTH DAKOTAMINNESOTA
WISCONSIN
ILLINOIS
MISSOURI
ARKANSAS
LOUISIANA
KENTUCKY
INDIANA
OHIO
MICHIGAN
MICHIGAN
NEW YORK
MAINE
VERMONTNH
CONNECTICUT
VIRGINIA
SOUTH CAROLINA
GEORGIAALABAMA
MISSISSIPPI
FLORIDA
SUNCOAST
HAYWARD BAKER
CASE
MCKINNEY
TENNESSEE
PENNYSYLVANIANEW JERSEY
WESTVIRGINIA
MASS
MARYLAND
NORTH CAROLINA
IOWA
25
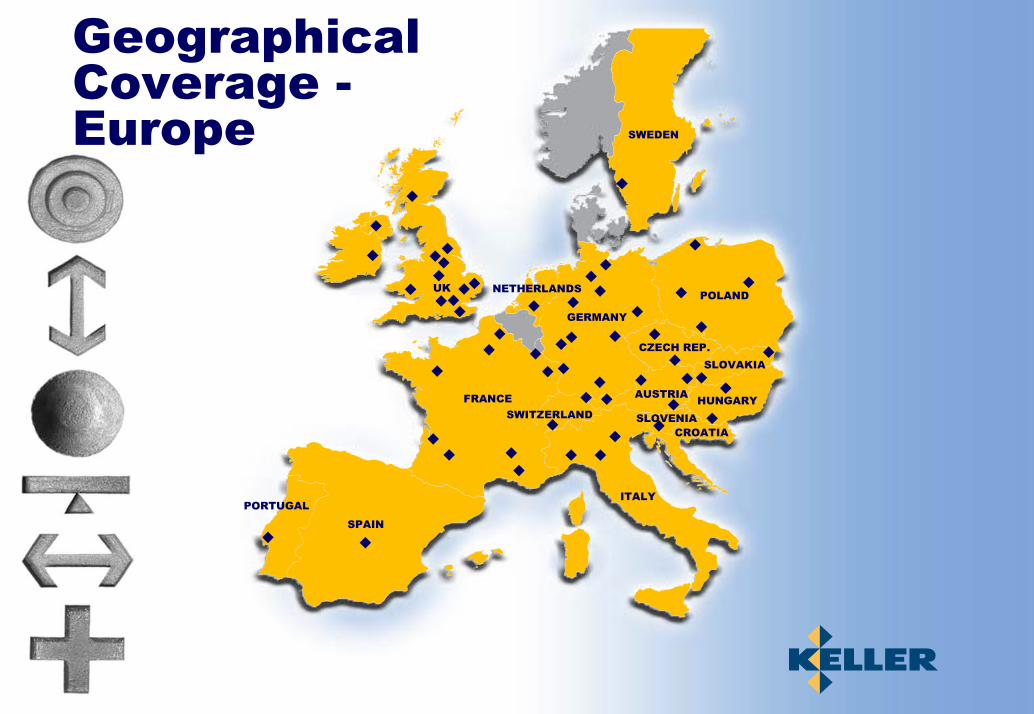
SPAIN
PORTUGAL
FRANCE
ITALY
SWITZERLANDCROATIA
AUSTRIA
CZECH REP.
HUNGARY
SLOVAKIA
POLAND
GERMANY
NETHERLANDS
SWEDEN
UK
Geographical Coverage -Europe
SLOVENIA

26
PHILIPPINES
HONG KONGTAIWAN
MALAYSIA
INDONESIA
SINGAPORE
AUSTRALIA
INDIA
PAKISTAN
SAUDI ARABIAU.A.E
BAHRAIN
EGYPT
Geographical Coverage –ROW

27
Business Model
Technological leadership, specialised equipment and people
Autonomous and well incentivised business units
Regionalisation offers clients a local presence
Contract mix spreads risk and enhances margins
Acquisitions sourced and integrated on a local basis

28
Competitive positioning
Competition
GlobalNationalLocal
No UK or US quoted peer
Specialist contractor (people and equipment)
Balanced contract portfolio

29
Ten Year Track RecordTurnover 1994 - 2003
110 . 0 12 0 . 1 110 . 1 9 4 . 4 8 8 . 4 10 4 . 4 9 7 . 7 115 . 0 13 5 . 616 5 . 2
5 8 . 76 9 . 1 8 7 . 2
8 5 . 1 9 8 . 510 7 . 4 110 . 1
18 8 . 8
2 4 2 . 6
2 7 0 . 4
3 3 . 33 5 . 8
4 1. 7 6 5 . 1 6 7 . 7
8 2 . 3 9 1. 0
10 0 . 1
10 6 . 7
10 4 . 0
12 . 3
2 0 . 8 14 . 2
2 6 . 1
2 7 . 9
18 . 3
0
100
200
300
400
500
600
1994 1995 1996 1997 1998 1999 2000 2001 2002 2003
£m
Continental Europe & Overseas The Americas UK Australia
202.0225.0
239.0244.6
266.9314.9 313.0
422.2
511.0
567.5
12% compound growth in turnover 1994 - 2003
30
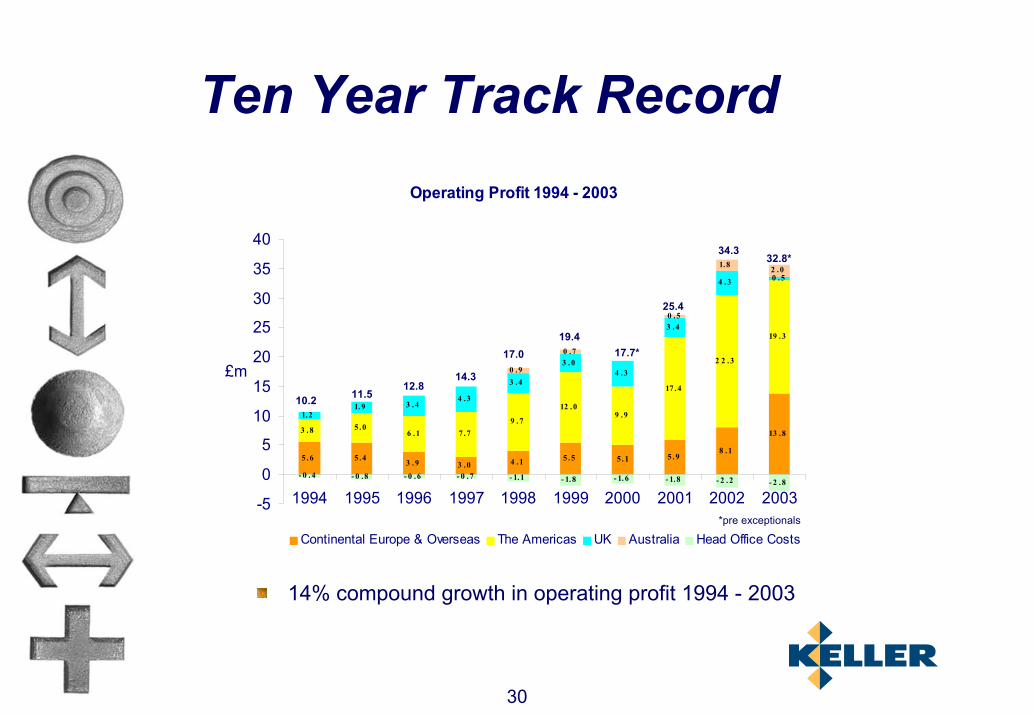
Ten Year Track RecordOperating Profit 1994 - 2003
5 .6 5 .4 3 . 9 3 .0 4 . 1 5 . 5 5 . 1 5 .98 .1
13 .83 . 8 5 .06 .1 7 .7
9 . 7
12 . 09 .9
17 . 4
2 2 .3
19 .3
1.21. 9 3 . 4
4 .3
3 .4
3 . 04 .3
3 .4
4 . 3 0 . 5
0 .9
0 .7
1.8 2 .0
- 0 . 4 - 0 .8 - 0 .6 - 0 . 7 - 1.1 - 1.8 - 1. 6 - 1.8 - 2 . 2 - 2 .8
0 .5
-5
0
5
10
15
20
25
30
35
40
1994 1995 1996 1997 1998 1999 2000 2001 2002 2003
£m
Continental Europe & Overseas The Americas UK Australia Head Office Costs*pre exceptionals
10.2 11.512.8
14.3
17.019.4
17.7*
34.332.8*
25.4
14% compound growth in operating profit 1994 - 2003