interim results - sea harvestseaharvest.co.za/wp-content/uploads/2017/08/job013657...sea harvest...
TRANSCRIPT

INTERIM RESULTSFOR THE PERIOD ENDED 30 JUNE 2017


SEA HARVEST group Limited INTERIM RESULTS for the SIX MONTHS ended 30 JUNE 2017
1
2 SEA HARVEST GROUP INTERIM RESULTS 2017
Legal disclaimer and basis of preparation
For the purposes of this notice, the presentation (the “Presentation”) shall mean and include the slides that follow, the oral presentation of the slides by Sea Harvest Group Limited (“Sea Harvest” or the “Company” or the “Group”) and/or itsadvisers, any question‐and‐answer session that follows that oral presentation, hard copies of this document and any materials distributed at, or in connection with, that oral presentation.
By attending the meeting at which the Presentation is made, or by reading the Presentation slides, you will be deemed to have (i) agreed to all of the following restrictions and made the following undertakings and (ii) acknowledged that youunderstand the legal and regulatory sanctions attached to the misuse, disclosure or improper circulation of the Presentation.
This Presentation is provided to you solely for information purposes and its contents are confidential and may not be reproduced, redistributed, published or passed on to any person, directly or indirectly, in whole or in part, for any purpose.The maintenance of the absolute secrecy of the information contained in the Presentation is of paramount importance to the Company. If this Presentation has been received in error, it must be returned immediately to the Company.
Your obligations as set out in this notice will continue in respect of the information contained in the Presentation until such time as, and then only to the extent that, any such information is made available to the public. The Company may notbe making the information contained herein public, except to the extent required by law or regulation. If this is not acceptable to you, you should not receive the information contained in the Presentation.
This Presentation is not directed to, or intended for distribution to or use by, any person or entity that is a citizen or resident of, or located in, any locality, state, country or other jurisdiction where such distribution or use would be contrary tolaw or regulation or which would require any action (including registration or licensing) within such jurisdiction for such purpose.
This Presentation does not constitute or form part of, and should not be construed as, an advertisement, invitation, solicitation and/or offer to sell, issue, purchase or subscribe for, any shares and/or securities in the Company or any of itssubsidiaries in any jurisdiction, or an inducement to enter into investment activity. No part of this Presentation, nor the fact of its distribution, should form the basis of, or be relied on in connection with, any contract or commitment orinvestment decision whatsoever. No representation, warranty or undertaking, express or implied, is made as to, and no reliance should be placed on, the fairness, accuracy, completeness or correctness of the information or the opinionscontained herein. None of the Company or any of its affiliates, advisers or representatives shall have any liability whatsoever (in negligence or otherwise) for any loss howsoever arising from any use of this Presentation or its contents orotherwise arising in connection with the Presentation.
The information contained herein has been prepared using information available to the Company at the time of preparation of the Presentation. External or other factors may have impacted on the business of the Company and the content ofthis Presentation, since its preparation. In addition all relevant information about the Company may not be included in this Presentation. The information in this Presentation has not been independently verified. No representation or warranty,expressed or implied, is made as to the accuracy, completeness or reliability of the information contained herein and no reliance should be placed on such information. Neither the Company, nor any of its advisers, connected persons or anyother person accepts any liability for any loss howsoever arising, directly or indirectly, from this Presentation or its contents.
This Presentation contains forward‐looking statements, which include all statements other than statements of historical facts, including, without limitation, any statements preceded by, followed by or including the words “targets”, “believes”,“expects”, “aims”, “intends”, “may”, “anticipates”, “would”, “could” or similar expressions or the negative thereof. Forward‐looking statements by their nature involve known and unknown risks, uncertainties, assumptions and other importantfactors because they relate to events and depend on circumstances that might occur in the future whether or not outside the control of the Company. Such factors may cause the Company’s actual results, performance or achievements to bematerially different from future results, performance, developments or achievements expressed or implied by such forward‐looking statements. Such forward‐looking statements are based on numerous assumptions regarding the Company’spresent and future business strategies and the environment in which it will operate in the future. Accordingly, no assurance is given that any such forward‐looking statements will prove to have been correct. These forward‐looking statementsspeak only as at the date of this Presentation. The Company expressly disclaims any obligation or undertaking to disseminate any updates or revisions to any forward‐looking statements contained herein to reflect any change in itsexpectations with regard thereto or any change in events, conditions or circumstances on which any of such statements are based.

3 SEA HARVEST GROUP INTERIM RESULTS 2017
FELIX RATHEBChief Executive Officer
Today’s presentation team
JOHN PAUL DE FREITASChief Financial Officer
MUHAMMAD BREYChief Investment Officer

SEA HARVEST group Limited INTERIM RESULTS for the SIX MONTHS ended 30 JUNE 2017
3
4 SEA HARVEST GROUP INTERIM RESULTS 2017
Presentation outline
• Group overview
• Group financial and operating performance› Sea Harvest Group
› SA operations
› International operations: Mareterram
• Strategy and outlook
• Questions

Group overview

SEA HARVEST group Limited INTERIM RESULTS for the SIX MONTHS ended 30 JUNE 2017
5
6 SEA HARVEST GROUP INTERIM RESULTS 2017
Sea Harvest Group overview
1. Including access to six Vuna vessels2. Including access to one Vuna factory3. Frozen fish volume share 12 MM including Woolworths (Nielsen)
SOUTH AFRICA
INTERNATIONAL (AUSTRALIA)
OfficesFishing and processing
Offices
GAUTENG
DURBAN
MOSSEL BAY
SALDANHA BAYCAPE TOWN
BRISBANE
SYDNEY
MELBOURNE
ADELAIDEPERTH
CARNARVON
Fishing and processing
The principal business of the Sea Harvest Group is fishing of Cape Hake and Shark Bay prawns, processing of the catch into frozen and chilled seafood, and the marketing of these products, locally and internationally
Key indicators H1 F17Established 1964
Industry Fishing, Food, Agri
% of Hake TAC (SA) 25.2% (plus 3% from Vuna)
% of Shark Bay prawn licenses (Aus) 56% (10 of 18)
No. of people employed ~3 000
No. of vessels¹ 29
Factories² 3
Fishing and processing operations Saldanha Bay, Mossel Bay, Carnarvon (Australia)
Number of countries selling Sea Harvest products 22
Local market share³ 41%
Vision: to be a leading and responsible diversified global fishing and agri business

7 SEA HARVEST GROUP INTERIM RESULTS 2017
Global demand for natural wild-caught seafood from sustainable fisheries leads to premium pricing
Key strengths
1
Market leading brands2
Broad and innovative range of products that are difficult to substitute3
Geographically diverse, international customer base leads to strong ZAR hedge4
Vertically integrated business with well located, world-class facilities5
An industry with high barriers to entry6
Strong B-BBEE credentials7
A good platform for growth in South Africa and Australia8

SEA HARVEST group Limited INTERIM RESULTS for the SIX MONTHS ended 30 JUNE 2017
7
8 SEA HARVEST GROUP INTERIM RESULTS 2017
Revenue and currency diversification
61%
39%
InternationalDomestic
41%
36%
21%
2%
ZAREUROAUDOther
REVENUE CURRENCY MIX

9 SEA HARVEST GROUP INTERIM RESULTS 2017
Market and product diversification
48%
36%
13%
3%
Southern EuropeAustraliaNorthern EuropeOther Markets
67%8%
6%
11%
5% 3%
Cape HakePrawnsHigh value by-catchTradingVeg and MealsScallops and Crabs
INTERNATIONAL REVENUE MIX PRODUCT REVENUE MIX

SEA HARVEST group Limited INTERIM RESULTS for the SIX MONTHS ended 30 JUNE 2017
9
10 SEA HARVEST GROUP INTERIM RESULTS 2017
Key financial metrics
REVENUE
25%to R1,06bn
2016: R845m
EBIT
147%to R206m
2016: R83m
PROFITAFTER TAX
268%to R136m
2016: R37m
HEPS
130%to 56.6c per share
2016: 24.6cper share
33% 32%
H1 F17 H1 F16
GROSS PROFITMARGIN
25% 16%
H1 F17 H1 F16
EBITDAMARGIN
17% 9%
H1 F17 H1 F16
OPERATING PROFITMARGIN

11 SEA HARVEST GROUP INTERIM RESULTS 2017
2017 H1 highlights
Listed successfully on the JSE on 23 Mar 2017, raising R1,329m
B-BBEE ownership post listing at c.80%
Catches have remained stable
Strong markets and firm demand globally
Positive forex hedges offsetting stronger ZAR
Fuel price has remained at reasonably low levels
Operations performing well post investments over the last three years
Mareterram performance in line with expectations
Investment approved for the acquisition of the fillet factory freezer trawler, “MV Therney” for $13.5m

SEA HARVEST group Limited INTERIM RESULTS for the SIX MONTHS ended 30 JUNE 2017
11
12 SEA HARVEST GROUP INTERIM RESULTS 2017
2017 H1 challenges
5% Cape Hake quota reduction
Small size mix
Stronger and volatile Rand
Weak SA economy
Hake inshore interdict

Financial and Operating Performance

SEA HARVEST group Limited INTERIM RESULTS for the SIX MONTHS ended 30 JUNE 2017
13
Sea Harvest Group

15 SEA HARVEST GROUP INTERIM RESULTS 2017
Sea Harvest Group – income statement
Year-to-date (R’000) FY17 vs. FY16 H1 F17 H1 F16Revenue 25% 1 056 961 844 515 Gross profit 31% 353 515 270 282 Gross profit margin 33% 32%Net operating expenses -11% (172 073) (192 851)Operating profit 134% 181 442 77 431 Operating profit margin 17% 9%EBIT 147% 205 597 83 253 Net finance costs -18% (24 183) (29 504)Taxation 171% (45 526) (16 806)Profit after tax 268% 135 888 36 943
Non-controlling interest 4 933 -Attributable profit 130 955 36 943
EBITDA 264 419 139 183 EBITDA margin 25% 16%Normalised opex margin 18.7% 16.9%HEPS (cents) 56.6 24.6 WAN shares in issue (‘000) 195 380 141 540

SEA HARVEST group Limited INTERIM RESULTS for the SIX MONTHS ended 30 JUNE 2017
15
16 SEA HARVEST GROUP INTERIM RESULTS 2017
Group revenue and operating profit
51 63 80 77181
593675 689
845
1 057
2013 H1 2014 H1 2015 H1 2016 H1 2017 H1
R’m
Group operating profitGroup revenue

17 SEA HARVEST GROUP INTERIM RESULTS 2017
Sea Harvest Group revenue waterfall
845
1 057121
2272
86
48
HY F16 Price and sales mix Sales volumes Exchange rate Mareterram Intercompany sales HY F17
R’m
IncreaseDecrease
SEA HARVEST group Limited INTERIM RESULTS for the SIX MONTHS ended 30 JUNE 2017
17
18 SEA HARVEST GROUP INTERIM RESULTS 2017
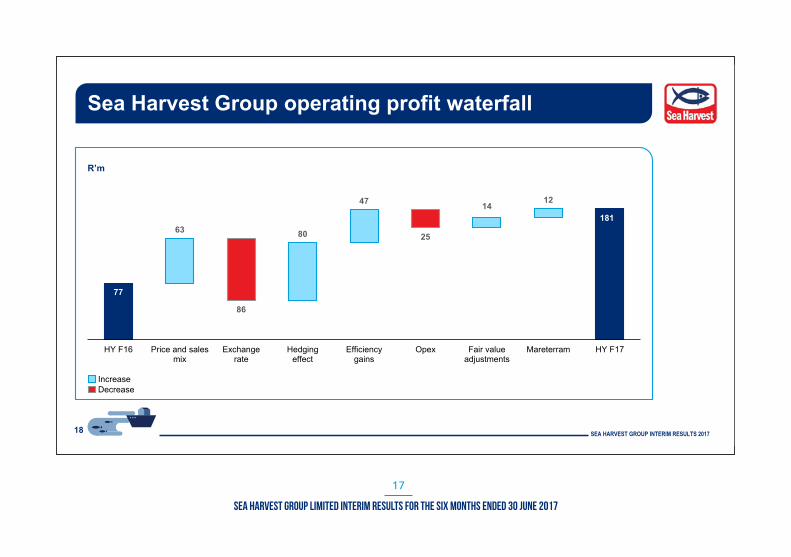
Sea Harvest Group operating profit waterfall
77
18163 80
47 1412
86
25
HY F16 Price and salesmix
Exchangerate
Hedgingeffect
Efficiencygains
Opex Fair valueadjustments
Mareterram HY F17
R’m
IncreaseDecrease
19 SEA HARVEST GROUP INTERIM RESULTS 2017
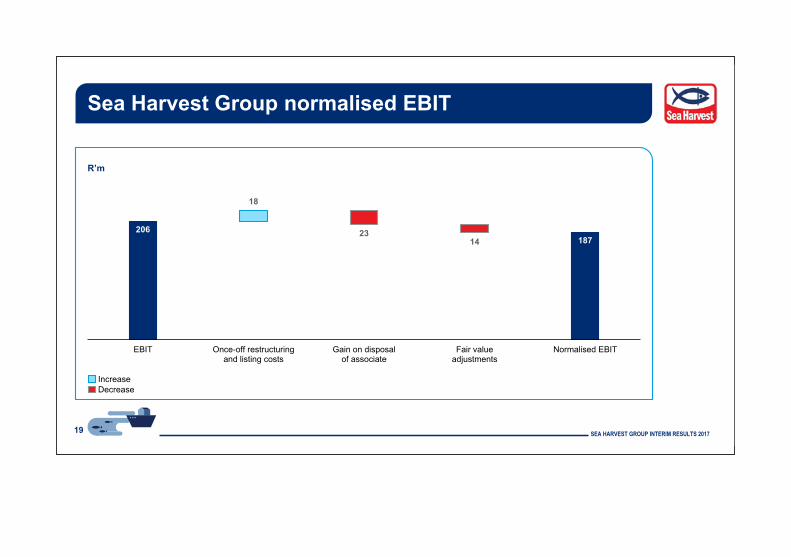
Sea Harvest Group normalised EBIT
206187
18
2314
EBIT Once-off restructuringand listing costs
Gain on disposalof associate
Fair valueadjustments
Normalised EBIT
R’m
IncreaseDecrease

SEA HARVEST group Limited INTERIM RESULTS for the SIX MONTHS ended 30 JUNE 2017
19
20 SEA HARVEST GROUP INTERIM RESULTS 2017
Sea Harvest Group - Balance sheet
• Mareterram property, plant and equipment of R106mAssets (R’000) June 2017 June 2016
Property, plant and equipment 531 180 449 522
Intangible assets and goodwill 469 743 84 441
Investments - 68 495
Available-for-sale investments 25 264 25 264
Other non-current assets 134 767 4 357
Current assets 1 028 171 578 140
2 189 125 1 210 219
Balance sheet movements largely as a result of the listing on the JSE on 23 March 2017 and consolidation of Mareterram from 1 July 2016
• Mareterram fishing licenses of R289m and goodwill of R106m
• Investment in Desert Diamond
Movement in current assets:• Higher levels of inventory in SA• Mareterram current assets of R211m• Cash on hand of R316m
Other non-current assets includes:• Loan to related party of R70m• Deferred tax asset of R50m

21 SEA HARVEST GROUP INTERIM RESULTS 2017
Sea Harvest Group - Balance sheet
• Capital raise of R1,329m at listingEquity and liabilities (R’000) June 2017 June 2016
Stated capital 1 295 771 849
Reserves (19 284) 40 510
Preference share capital - 168 409
NCI (incl treasury shares) 138 636 4 428
Non-current liabilities 345 405 598 632
Current liabilities 428 597 397 391
2 189 125 1 210 219
• Mareterram current liabilities of R148m - peak of working capital cycle
• Redemption of all preference shares and accrued dividends and settlement of all shareholder loans at listing
• 44% minority shareholding in Mareterram
• Mareterram liabilities of R182m • Total deferred tax liabilities of R123m
Balance sheet movements largely as a result of the listing on the JSE on 23 March 2017 and consolidation of Mareterram from 1 July 2016

SEA HARVEST group Limited INTERIM RESULTS for the SIX MONTHS ended 30 JUNE 2017
21
22 SEA HARVEST GROUP INTERIM RESULTS 2017
Sea Harvest Group cash flow waterfall
154316142
1 240
59 50
301
782
27
Cash & cashequivalents1 Jan 2017
Cash generatedfrom operations
Net interestand tax paid
Acquisitionof PPE &
intangibles
Sharesissued
Repaymentof third partyborrowings
Settlement ofshareholder
loans
Net loansextended
Cash & cashequivalents30 Jun 2017
R’m
IncreaseDecrease

South African operations

SEA HARVEST group Limited INTERIM RESULTS for the SIX MONTHS ended 30 JUNE 2017
23
24 SEA HARVEST GROUP INTERIM RESULTS 2017
33% 32%
H1 F17 H1 F16
28% 16%
H1 F17 H1 F16
19% 9%
H1 F17 H1 F16
Key features – SA Operations
REVENUE
4%to R878m
2016: R845m
GROSS PROFIT
8%to R291m
2016: R270m
OPERATING PROFIT GROWTH
120%to R170m
2016: R77m
PROFITAFTER TAX
238%to R125m
2016: R37m
GROSS PROFITMARGIN
EBITDAMARGIN
OPERATING PROFITMARGIN

25 SEA HARVEST GROUP INTERIM RESULTS 2017
Sea Harvest volumes mix
Notes: 1. 2017 volumes YTD annualised
H1 F17 H1 F16
ExportLocal
SALES VOLUME
57%
43%
61%
39%
2012 2013 2014 2015 2016 2017
Sea Harvest quota volumesSales volumes
IMPACT OF GLOBAL SOURCING

SEA HARVEST group Limited INTERIM RESULTS for the SIX MONTHS ended 30 JUNE 2017
25
26 SEA HARVEST GROUP INTERIM RESULTS 20171. Frozen fish volume share 12 month MM including Woolworths (Nielsen)
Pricing mix
Channel %
Local market
Volume growth -7%
Average selling prices +14%
Revenue growth +6%
Market share (12mm)¹ 41%
Export market
Volume growth +11%
Average selling prices -8%
FX effect -16%
Constant currency selling price +8%
Revenue growth +3%

International operations: Mareterram

SEA HARVEST group Limited INTERIM RESULTS for the SIX MONTHS ended 30 JUNE 2017
27
28 SEA HARVEST GROUP INTERIM RESULTS 2017
Mareterram overview
1. At 30 June 2017 closing share price of A$0.285 and 139,535,198 shares in issue
Overview of MareterramListed ASX, January 2016 (Nor-West was founded in 1952 and CMG Foodservice in 1964)Market cap¹ A$39.8mSea Harvest shareholding 56%Locations Head office in Perth, fishing ops in Carnarvon, WA, sales offices in Sydney, Adelaide, Melbourne and BrisbaneLeasehold Slipway, engineering, cold store, workshops, fuel infrastructureVessels 11 factory freezersEmployees 110 Quota 10 of 18 (55.6%) Shark Bay Prawn Managed Fishery Licenses
Products Fishing: prawns (tiger and king), scallops, crab, by-catchTrading: prawns, crab, hake, potato, convenience foods
Brands Mareterram, Nor-West Seafoods, Cape Haddie, High Seas and Sea HarvestSustainability MSC certification
Vision: To be a safe, market-led diversified agribusiness delivering sustainable, high quality food products with the highest TSRin the Agri sector

29 SEA HARVEST GROUP INTERIM RESULTS 2017
Key metrics
REVENUE
42%to AUD 23m
2016: AUD 16m
GROSS PROFIT
101%to AUD 6.4m
2016: AUD 3.2m
EBIT
to AUD 1.3m
2016: AUD -2.9m
PROFITAFTER TAX
to AUD 1.2m
2016: AUD -2.9m
60%22%
7%6%5%
King prawnTiger prawnScallopBy-catchCrab
CATCH VOLUMESBY PRODUCT
37%
25%
13%
10%
8%4%
3%
Prawns Cape HakeOther PotatoScallop CrabBy-catch
REVENUEBY CATEGORY
80%
10%10%
FoodserviceRetailExport
CHANNELMIX
SEA HARVEST group Limited INTERIM RESULTS for the SIX MONTHS ended 30 JUNE 2017
29
30 SEA HARVEST GROUP INTERIM RESULTS 2017
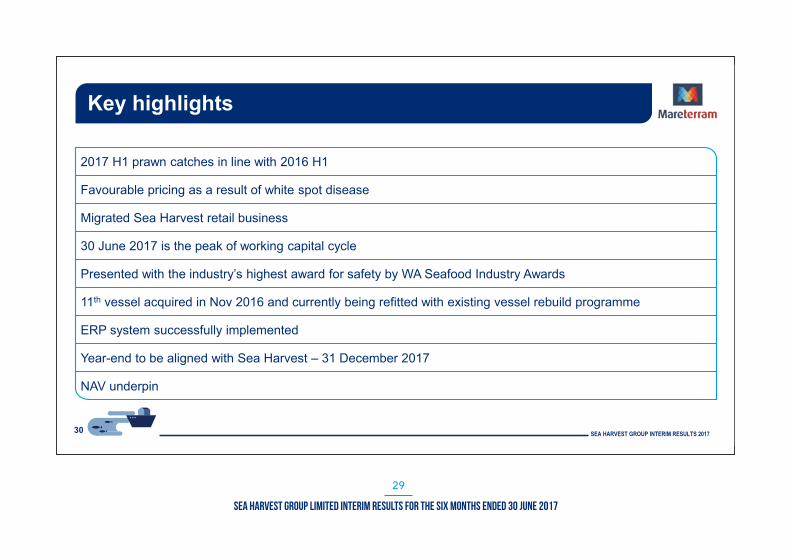
Key highlights
2017 H1 prawn catches in line with 2016 H1
Favourable pricing as a result of white spot disease
Migrated Sea Harvest retail business
30 June 2017 is the peak of working capital cycle
Presented with the industry’s highest award for safety by WA Seafood Industry Awards
11th vessel acquired in Nov 2016 and currently being refitted with existing vessel rebuild programme
NAV underpin
ERP system successfully implemented
Year-end to be aligned with Sea Harvest – 31 December 2017

Strategy and outlook

SEA HARVEST group Limited INTERIM RESULTS for the SIX MONTHS ended 30 JUNE 2017
31
32 SEA HARVEST GROUP INTERIM RESULTS 2017
Sea Harvest Group strategy
Vision: to be a leading and responsible diversified global fishing and agri business
ORGANIC GROWTH VOLUME GROWTH
Investments in land based operations yield positive results, gain of R47m over 2016 H1
MARGIN OPTIMISATION Acquisition of MV Therney factory freezer trawler
Increased SA operations export allocation from 39% to 43%
ACQUISITIVE GROWTH FISHING
AQUACULTURE Pipeline of opportunities under consideration
AGRI
Global sourcing offsetting quota reduction of 5%
33 SEA HARVEST GROUP INTERIM RESULTS 2017
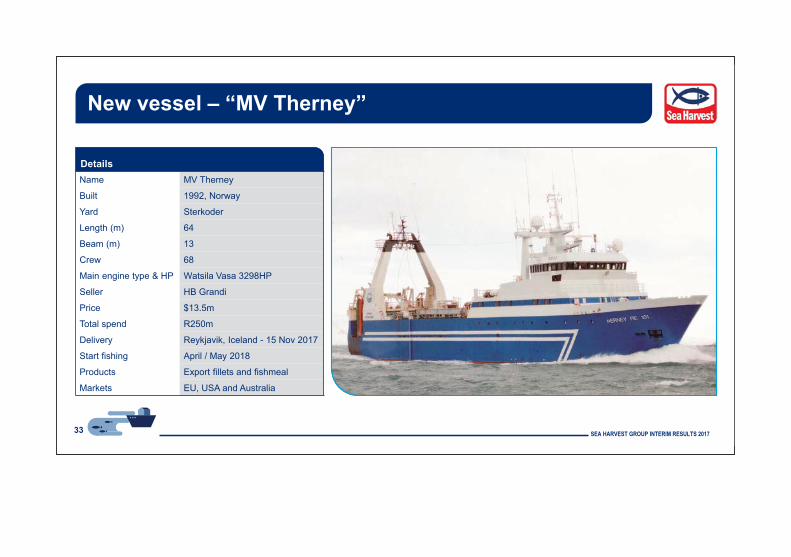
New vessel – “MV Therney”
DetailsName MV Therney
Built 1992, Norway
Yard Sterkoder
Length (m) 64
Beam (m) 13
Crew 68
Main engine type & HP Watsila Vasa 3298HP
Seller HB Grandi
Price $13.5m
Total spend R250m
Delivery Reykjavik, Iceland - 15 Nov 2017
Start fishing April / May 2018
Products Export fillets and fishmeal
Markets EU, USA and Australia

SEA HARVEST group Limited INTERIM RESULTS for the SIX MONTHS ended 30 JUNE 2017
33
34 SEA HARVEST GROUP INTERIM RESULTS 2017
Outlook
Consistent demand
50% hedged for the remainder of 2017
Remains firm
Better H2 compared to H150% hedged for the remainder of 2017
Platform for growth Seasonal
Healthy SA and Australian pipeline, supported by cash on hand and facilities
Invested in MV TherneyMareterram rebuild programme underway and within budget
Intention to declare annual dividend, no interim at this stage
Pricing
Forex
Fuel
Capex
Acquisition pipeline
Markets
Dividend
Mareterram

35 SEA HARVEST GROUP INTERIM RESULTS 2017
In conclusion the Sea Harvest Group offers a strong and defensive propositionfor investors with good growth prospects
An established business with a proven operating model...
… in a sector with high barriers to entry...
…selling organic wild caught products…
…of premium species and high provenance…
…of which there is a limited supply…
...to a growing population…
...seeking healthy, low fat proteins...… to address obesity and a desire for wellness…
… resulting in above inflation price increases…
… locally and internationally…
… where the Group haslong standing relationships…
… market leading brands and reputation…
… supplying major retailers andmultinational food companies…
… and consumers
SEA HARVEST group Limited INTERIM RESULTS for the SIX MONTHS ended 30 JUNE 2017
35
Thank You

Questions
FOR THE SIX MONTHS ENDED 30 JUNE 2017
Unaudited Interim results

CORPORATE INFORMATION
Sea Harvest Group Limited(Formerly Sea Harvest Holdings Proprietary Limited)(Incorporated in the Republic of South Africa)Registration number: 2008/001066/06JSE Code: SHGISIN: ZAE000240198“Sea Harvest” or “the Company” or “the Group”
Registered address: The Boulevard Office Park 1st Floor, Block C Searle Street Woodstock Cape Town 7925 South Africa
Directors: F Robertson * (Chairperson) BM Rapiya ** WA Hanekom * L Penzhorn * MI Khan * T Moodley *** F Ratheb (Chief Executive Officer) JP de Freitas (Chief Financial Officer) Mo Brey (Chief Investment Officer) * Non-Executive ** Lead Independent Non-Executive *** Non-Executive Alternative There have been no changes to the board of directors since listing.
Company Secretary: Nana Aston Transfer Secretary: Computershare Investor Services Proprietary Limited 15 Biermann Avenue, Rosebank, 2196 Sponsor: The Standard Bank of South Africa Limited Auditors: Deloitte & Touche
SEA HARVEST group Limited INTERIM RESULTS for the SIX MONTHS ended 30 JUNE 2017

Commentary
Key performance indicatorsYear ended Six months ended Six months ended
31 December 2016 30 June 2017 30 June 2016R’000 R’000 R’000
1,931,979 Revenue 1,056,961 844,51559% International revenue mix (%) 61% 54%
605,458 Gross profit 353,515 270,28231.3% Gross profit margin (%) 33.4% 32.0%
250,188Profit before net finance costs and taxation (EBIT) 205,597 83,253
12.9% EBIT margin (%) 19.5% 9.9%131,514 Profit for the period 135,888 36,943
86.1 Earnings per share (cents) 67.0 26.180,142 Headline earnings 110,664 34,874
56.6 Headline earnings per share (cents) 56.6 24.660.9 Net asset value per share (cents) 531.9 24.7
365.6 Adjusted net asset value per share (cents)1 531.9 148.216.19 ZAR: Euro average exchange rate2 14.29 17.1210.98 ZAR: AUD average exchange rate2 10.06 11.29
– Closing share price (cents) 1,370 –
1 Prior period shares in issue adjusted for 1:6 share consolidation2 Average spot exchange rate at which sales were recorded
Trading and financial performanceThe period was dominated by the successful listing on the JSE of Sea Harvest Group Limited on 23 March 2017. The Group issued 106,333,334 shares at a price of R12.50 per share, raising R1.329 billion of capital. The Company’s shares have traded positively since listing, ending the period 9% up at R13.70 per share.Sea Harvest delivered headline earnings of R111 million for the six months to 30 June 2017 (2016: R35 million), up 217% on the same period last year, benefiting from the improved performance of its South African operations as a result of investments in both fleet and land-based operations; continued strong global demand for Cape Hake; the acquisition of a controlling interest in ASX listed Mareterram in July 2016; and the deleveraging effect on the balance sheet post listing the Group on the JSE.Sea Harvest acquired an initial stake of 19.9% in Mareterram Limited in January 2016 and during the six months ended 30 June 2016 Mareterram was accounted for as an associate. In July 2016, Sea Harvest acquired a controlling stake in Mareterram and it was consolidated into the Group’s results. The comparability of the financial information for six months ended 30 June 2017 with the same period in 2016 is impacted by the consolidation of Mareterram into the Group with effect from 1 July 2016.Group revenue for the period increased by 25% to R1.06 billion compared to the same period last year (2016: R845 million).
1
SEA HARVEST group Limited INTERIM RESULTS for the SIX MONTHS ended 30 JUNE 2017
1

The Rand strengthened by 16% in the period compared with the same period last year, which impacted South African operations’ revenue. However this was offset by firm pricing and strong demand across all channels and markets, resulting in South African operations’ revenue decreasing marginally by 2%. Sales volumes were in line with the same period last year, after a 5% quota reduction.South African operations’ export volumes increased by 11% and export volume mix grew to 43% from 39% in the same period last year, as the business continued to focus on higher margin sales. Export revenue increased by 3% after a 16% strengthening of the Rand across the currencies in which Sea Harvest trades.Revenue from Mareterram, which was consolidated from July 2016, contributed R227 million to the Group’s revenue for the period. Mareterram’s revenue for the period increased by 42% compared to the first half of 2016, which was its first six months of trading since listing on the ASX in January 2016, driven by volume growth and favourable pricing.The Group delivered gross profit of R354 million for the period (2016: R270 million) and the gross profit margin improved to 33% (2016: 32%), despite the impact of the stronger Rand. The South African operations contributed R291 million to gross profit. The expansion in gross profit margin was driven by efficiency improvements as a result of the investments in factory freezer vessel capacity and land-based factory efficiency improvements, together with higher export volumes and price increases across the board, which buffered the impact of the stronger Rand. Mareterram contributed R63 million to gross profit, with a gross profit margin of 28%.Other operating income of R44 million (2016: R5 million) includes a R30 million foreign exchange hedge gain and a R14 million fair value gain.Group operating expenses for the period increased by 9% from R198 million in 2016 to R216 million in 2017. This increase included once-off costs of R18 million relating to the restructuring of the Group and the listing on the JSE.
The Group delivered EBIT of R206 million during the period (2016: R83 million), an increase of 147% over 2016, and an EBIT margin of 19.5% (2016: 9.9%). Mareterram contributed R13 million to EBIT for the period. In addition, Group EBIT for the period included a R23 million gain on the disposal of Sea Harvest’s 49.81% interest in a joint venture on 1 January 2017.The Group reported earnings per share (EPS) of 67.0 cents (2016: 26.1 cents) and headline earnings per share (HEPS) of 56.6 cents (2016: 24.6 cents), an increase of 157% and 130% respectively, with both measures benefiting from the improved operating performance of the South African operation and the inclusion of Mareterram’s result.The weighted average number of shares (WANOS) for the period used for the calculation of EPS and HEPS is 195,379,525 and there were 239,973,603 shares (excluding treasury shares) in issue at the reporting date. At the beginning of the period, there were 849,242,000 shares (excluding treasury shares) in issue. During the period, there was a 1:6 share consolidation and 3,500,000 shares (excluding treasury shares) were repurchased. On 23 March 2017, the Group listed on the JSE and 101,933,269 shares (excluding treasury shares) were issued.
Cash flow and financial positionGroup cash generated from operations for the period of R142 million, was 8% higher than the prior year, with the improved operating performance being partly offset by higher levels of working capital. The Group utilised R48 million in investing activities relating to the acquisition of property, plant and equipment during the period. At the end of the period the group had a positive cash balance of R316 million. Following the listing and capital raise, the Group is well capitalised. All preference share capital, including accrued dividends, shareholder loans and third party debt in the South African operations were settled at listing.To supplement the cash on hand, Sea Harvest has concluded a revolving credit facility, the proceeds of which are earmarked for internal projects and acquisitions in South Africa and Australia.
COMMENTARY (CONTINUED)
SEA HARVEST group Limited INTERIM RESULTS for the SIX MONTHS ended 30 JUNE 2017
22

DividendsNo interim dividend is declared or proposed for the six months ended 30 June 2017.
OutlookInternational demand continues to be strong for high value wild caught species such as Cape Hake and Shark Bay Prawns. The Rand has weakened compared to the average for the first half of the year and the hedges in place for the second half of the year are more favourable than the first half of the year. Local market volumes have declined as a result of a stagnant economic environment, but this is expected to be offset by continued inflation in the category due to limited supply.Revenue from Mareterram in the second half of the year is expected to be higher than the first half of the year due to the seasonal nature of the business.All bank debt and shareholder loans within the South African operations were settled on listing and as a result, finance costs in the second half of the year are expected to reduce considerably, unless cash on hand and available facilities are utilised to fund growth.There is a good pipeline of organic growth projects. The Group has announced the acquisition of a new freezer trawler (M.V. Therney) from listed Icelandic Fishing Company, HB Grandi, for $13.5 million. The M.V. Therney was built in the Sterkoder yard in Norway, and is a sister vessel to the Harvest Atlantic Peace which was acquired by Sea Harvest in 2014. Delivery of the vessel is expected in mid-November this year, at a total cost of R250 million, and is anticipated to commence fishing in April/May 2018.
On behalf of the board
F Robertson F RathebChairman Chief Executive Officer
Cape Town23 August 2017
3
SEA HARVEST group Limited INTERIM RESULTS for the SIX MONTHS ended 30 JUNE 2017
3

CONDENSED CONSOLIDATED STATEMENT OF PROFIT OR LOSSfor the six months ended 30 June 2017
Audited Year Unaudited Unaudited ended six months ended six months ended
31 December 30 June 30 June2016 2017 2016
R’000 R’000 R’000
1,931,979 Revenue 1,056,961 844,515(1,326,521) Cost of sales (703,446) (574,233)
605,458 Gross profit 353,515 270,28231,607 Other operating income 43,899 5,141
(111,704) Selling and distribution expenses (62,301) (50,023)(13,372) Marketing expenses (6,662) (5,405)
(314,810) Other operating expenses (147,009) (142,564)
197,179Operating profit before joint venture and associate profit 181,442 77,431
13,369Share of profit of joint venture and associate 1,000 5,822
–Gain on the disposal of interest in joint venture 23,155 –
39,640Gain on remeasurement of previously held interest in subsidiary – –
250,188Profit before net finance costs and taxation 205,597 83,253
2,075 Investment income 5,862 516(77,892) Finance costs (30,045) (30,020)
174,371 Net profit before taxation 181,414 53,749(42,857) Taxation (45,526) (16,806)
131,514 Profit for the period 135,888 36,943
Profit for the period attributable to: 121,876 Shareholders of Sea Harvest Group Limited 130,955 36,943
9,638 Non-controlling interest 4,933 –
131,514 135,888 36,943
Earnings per share (cents) 86.1 – Basic 67.0 26.175.1 – Diluted 66.1 22.8
SEA HARVEST group Limited INTERIM RESULTS for the SIX MONTHS ended 30 JUNE 2017
4

Audited Year Unaudited Unaudited ended six months ended six months ended
31 December 30 June 30 June2016 2017 2016
R’000 R’000 R’000
131,514 Profit for the period 135,888 36,943
Other comprehensive income
Items that may be reclassified subsequently to profit or loss:
94,728 Movement on cash flow hedging reserve (17,917) 47,041(44,361) Exchange differences on foreign operations 7,382 –
50,367Other comprehensive (loss)/income, net of tax (10,535) 47,041
181,881Total comprehensive income for the period 125,353 83,984
Total comprehensive income/(loss) attributable to:
186,670 Shareholders of Sea Harvest Group Limited 119,050 83,984(4,789) Non-controlling interest 6,303 –
181,881 125,353 83,984
CONDENSED CONSOLIDATED STATEMENT OF OTHER COMPREHENSIVE INCOMEfor the six months ended 30 June 2017
SEA HARVEST group Limited INTERIM RESULTS for the SIX MONTHS ended 30 JUNE 2017
5

CONDENSED CONSOLIDATED STATEMENT OF FINANCIAL POSITIONAs at 30 June 2017
Audited Unaudited Unaudited 31 December 30 June 30 June
2016 2017 2016R’000 Notes R’000 R’000
ASSETS
541,513Property, plant, equipment and vehicles 531,180 449,522
359,346 Intangible assets 363,742 84,441104,224 Goodwill 106,001 –
21,845 Investment in joint venture – 13,953– Investment in associate – 54,542
25,264 Available-for-sale investment 4 25,264 25,2641,233 Financial assets 4 13,953 –4,389 Loans to related parties 5 70,501 4,357
33,545 Deferred tax assets 50,313 –
1,091,359 Non-current assets 1,160,954 632,079
291,758 Inventories 324,982 174,069282,750 Trade and other receivables 359,280 274,69446,629 Financial assets 4 27,687 –
6,370 Tax assets – –154,404 Cash and bank balances 316,222 129,377
781,911 Current assets 1,028,171 578,140
1,873,270 TOTAL ASSETS 2,189,125 1,210,219
SEA HARVEST group Limited INTERIM RESULTS for the SIX MONTHS ended 30 JUNE 2017
6

Audited Unaudited Unaudited 31 December 30 June 30 June
2016 2017 2016R’000 Notes R’000 R’000
EQUITY AND LIABILITIES 849 Stated capital 6 1,295,771 849
368,409 Preference share capital and premium – 168,409– FSP reserve (55,000) –
17,309 Revaluation reserve 17,309 17,30922,079 Cash flow hedging reserve 5,264 (25,539)
6,507 Share-based payment reserve (5,203) –(29,865) Foreign currency translation reserve (24,956) –132,116 Retained earnings 43,302 48,740
517,404Attributable to shareholders of Sea Harvest Group Limited 1,276,487 209,768
137,687 Non-controlling interest 138,636 4,428
655,091 Capital and reserves 1,415,123 214,196
371,917Long-term interest-bearing borrowings 121,398 285,648
54,664 Loans from related parties 5 – 54,66431,209 Employee related liabilities 26,703 25,42713,733 Deferred grant income 12,920 14,77882,450 Financial liabilities 4 61,267 –
133,410 Deferred tax liabilities 123,117 94,589135,404 Shareholders for dividends – 123,526
822,787 Non-current liabilities 345,405 598,632
52,536Short-term interest bearing borrowings 72,150 41,931
291 568 Trade and other payables 310,695 277,1291,551 Short-term deferred grant income 1,581 1,555
21,121 Financial liabilities 4 22,548 53,86217,843 Short-term provisions – 5,7252,431 Short-term shareholders for dividends – –8,342 Tax liabilities 21,623 17,189
395,392 Current liabilities 428,597 397,391
1,873,270 TOTAL EQUITY AND LIABILITIES 2,189,125 1,210,219
60.9 NAV per share (cents) 531.9 24.7
849,242Net shares in issue at end of period (000’s) 239,974 849,242
365.61 Adjusted NAV per share (cents)1 531.9 148.21
141,5401Adjusted shares in issue at end of period (000’s)1 239,974 141,5401
1 Prior period shares in issue adjusted for 1:6 share consolidation.
SEA HARVEST group Limited INTERIM RESULTS for the SIX MONTHS ended 30 JUNE 2017
7

CONDENSED CONSOLIDATED STATEMENTOF CHANGES IN EQUITYfor the six months ended 30 June 2017
Audited Year Unaudited Unaudited ended six months ended six months ended
31 December 30 June 30 June2016 2017 2016
R’000 R’000 R’000
130,092 Balance at the beginning of the period 655,091 130,092 Attributable to:
130,092 Shareholders of Sea Harvest Group Limited 517,404 130,092– Non-controlling interests 137,687 –
186,670
Total comprehensive income for the period attributable to shareholders of Sea Harvest Group Limited 119,050 83,984
121,876 Profit for the period 130,955 36,943
64,794Movements in other items of comprehensive income, net of tax (11,905) 47,041
Movements attributable to shareholders of Sea Harvest Group Limited
– Shares issued1 1,294,943 –– Shares repurchased2 (51,450) –– Recognition of FSP reserve3 (55,000) –
200,000 Preference shares issued – –– Redemption of preference shares4 (368,409) –
–Distributions to participants of share trusts5 (167,321) –
(4,308) Recognition of treasury shares – (4,308)
(1,557)Recognition of share option liability directly in equity – –
6,507 Share-based payment expense 10,403 –
–Reclassification of share-based payment reserve6 (23,133) –
137,687Movement attributable to non-controlling interests 949 4,428
655,091 Balance at the end of the period 1,415,123 214,196
1 Following the listing on 23 March 2017, Sea Harvest successfully placed 101,933,269 ordinary shares (excluding shares referred to in footnote 3) at a price of R12.50 per share. Listing costs of R34 million were charged against equity.
2 100% of the ordinary shares held by The New Sea Harvest Management Investment Trust were repurchased and cancelled.
SEA HARVEST group Limited INTERIM RESULTS for the SIX MONTHS ended 30 JUNE 2017
8

3 4,400,065 ordinary shares were awarded to key Sea Harvest employees in terms of a long-term Forfeitable Share Plan ("FSP") incentive scheme and R55 million representing the market value of the shares was debited to a reserve and credited to stated capital.
4 During the period, Sea Harvest redeemed all of the issued B and C redeemable preference shares, including all accrued preference dividends, all of which were held by Brimco Proprietary Limited.
5 In accordance with the repurchase and amendment agreements entered into during the period, 75% of the ordinary shares held by The Sea Harvest Management Investment Trust No.2 and 50% of the ordinary shares held by The Sea Harvest Employee Share Trust, both controlled entities of the Group, were repurchased and cancelled.
6 During the period, The Sea Harvest Management Investment Trust No. 2 and The Sea Harvest Employee Share Trust were reclassified from equity-settled share-based payment schemes to cash-settled share-based payment schemes. The IFRS 2 calculated liability was raised and debited to the equity-settled share-based payment reserve at the reclassification date.
SEA HARVEST group Limited INTERIM RESULTS for the SIX MONTHS ended 30 JUNE 2017
9
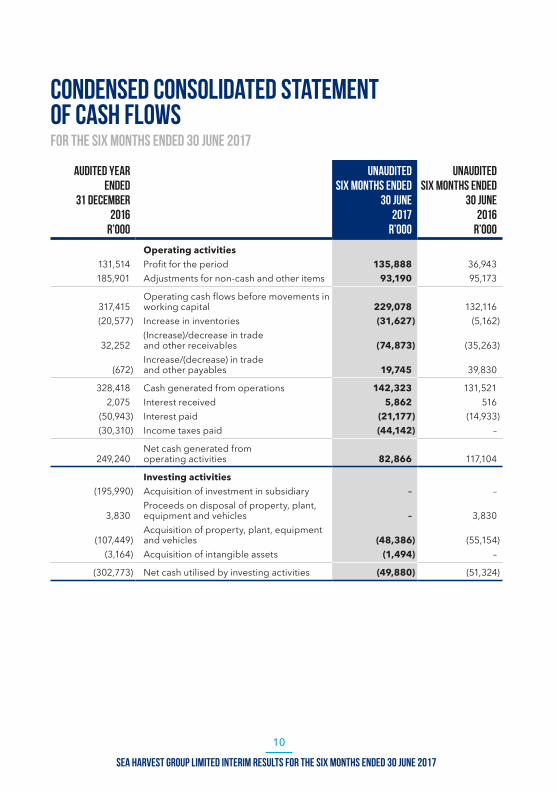
CONDENSED CONSOLIDATED STATEMENTOF CASH FLOWSfor the six months ended 30 June 2017
Audited Year Unaudited Unaudited ended six months ended six months ended
31 December 30 June 30 June2016 2017 2016
R’000 R’000 R’000
Operating activities 131,514 Profit for the period 135,888 36,943185,901 Adjustments for non-cash and other items 93,190 95,173
317,415Operating cash flows before movements in working capital 229,078 132,116
(20,577) Increase in inventories (31,627) (5,162)
32,252(Increase)/decrease in trade and other receivables (74,873) (35,263)
(672)Increase/(decrease) in trade and other payables 19,745 39,830
328,418 Cash generated from operations 142,323 131,5212,075 Interest received 5,862 516
(50,943) Interest paid (21,177) (14,933)(30,310) Income taxes paid (44,142) –
249,240Net cash generated from operating activities 82,866 117,104
Investing activities (195,990) Acquisition of investment in subsidiary – –
3,830Proceeds on disposal of property, plant, equipment and vehicles – 3,830
(107,449)Acquisition of property, plant, equipment and vehicles (48,386) (55,154)
(3,164) Acquisition of intangible assets (1,494) –
(302,773) Net cash utilised by investing activities (49,880) (51,324)
SEA HARVEST group Limited INTERIM RESULTS for the SIX MONTHS ended 30 JUNE 2017
10

Audited Year Unaudited Unaudited ended six months ended six months ended
31 December 30 June 30 June2016 2017 2016
R’000 R’000 R’000
Financing activities – Shares issued 1,239,943 –– Shares repurchased (51,450) –
200,000Proceeds on the issue of C class preference shares – –
–Redemption of B and C preference share capital (368,409) –
–Repayment of B and C preference dividends (144,269) –
(55,806) Repayment of borrowings (301,478) (10,375)– Borrowings raised 67,886 –
(12,519) Payments of financial liabilities (25,284) –– Distributions to participants of share trusts (167,321) (2,446)
(103)Amounts (advanced) and/or (repaid) to related parties (120,776) –
131,572Net cash generated from/(utilised by) financing activities 128,842 (12,821)
78,039 Net increase in cash and cash equivalents 161,828 52,959
76,418Cash and cash equivalents at the beginning of the period 154,404 76,418
(53)Effects of exchange rates on the balance of cash held in foreign operations (10) –
154,404Cash and cash equivalents at the end of the period 316,222 129,377
SEA HARVEST group Limited INTERIM RESULTS for the SIX MONTHS ended 30 JUNE 2017
11

NOTES TO THE CONDENSED CONSOLIDATED FINANCIAL STATEMENTSfor the six months ended 30 June 2017
1. BASIS OF PREPARATIONThe condensed consolidated interim financial statements have been prepared in accordance with International Financial Reporting Standards, IAS 34: Interim Financial Reporting, the SAICA Financial Reporting Guides as issued by the Accounting Practices Committee and Financial Reporting Pronouncements as issued by the Financial Reporting Standards Council, the Listings Requirements of the JSE Limited and the requirements of the Companies Act of South Africa, No. 71 of 2008. The report has been prepared using accounting policies that comply with International Financial Reporting Standards which are consistent with those applied in the financial statements for the year ended 31 December 2016. The condensed financial information has been prepared under the supervision of the Chief Financial Officer, JP de Freitas CA(SA).The information has not been audited or reviewed by the Group’s auditors, Deloitte & Touche.
2. DETERMINATION OF HEADLINE EARNINGS
Audited Year Unaudited Unaudited ended six months ended six months ended
31 December 30 June 30 June2016 2017 2016
R’000 R’000 R’000
121,876
Profit for the period attributable to shareholders of Sea Harvest Group Limited 130,955 36,943
(2,992)Loss/(profit) on disposal of property, plant, equipment and vehicles 408 (2,874)
–Impairment of property, plant, equipment and vehicles 1,230 –
–Reversal of impairment of property, plant, equipment and vehicles (436) –
(39,640)Gain on remeasurement of previously held interest in subsidiary – –
–Realised profit on disposal of interest in joint venture (23,155) –
898 Total tax effects of adjustments 1,662 805
80,142 Headline earnings for the period 110 664 34,874
141,540
Weighted average number of shares on which earnings and headline earning per share is based (000’s) 195,379 141,540
162,400
Weighted average number of shares on which diluted earnings and diluted headline earnings per share is based (000’s) 198,154 162,400
Headline earnings per share (cents) 56.6 – Basic 56.6 24.649.3 – Diluted 55.8 21.5
SEA HARVEST group Limited INTERIM RESULTS for the SIX MONTHS ended 30 JUNE 2017
12

Audited Year Unaudited Unaudited ended six months ended six months ended
31 December 30 June 30 June2016 2017 2016
R’000 R’000 R’000
3. SEGMENTAL RESULTS
The Groups’ reportable segments under IFRS 8: Operating Segments, are the South African operations and the Australian operations.
Segment revenue from external customers
1,652,236 SA Operations1 829,890 844,515279,743 Australia Operations 227,071 –
1,931,979 Total revenue 1,056,961 844,515
Segment profit from operations 171,250 SA Operations 169,836 77,43125,929 Australia Operations 11,606 –
197,179 Operating profit before joint venture and associate profits 181,442 77,431
– Gain on the disposal of interest in joint venture 23,155 –
39,640 Gain on remeasurement of previously held interest in subsidiary – –
13,369 Share of profits of joint venture and associate 1,000 5,822
2,075 Investment income 5,862 516(77,892) Finance costs (30,045) (30,020)
174,371 Net profit before taxation 181,414 53,749
Total assets 1,183,021 SA Operations 1,677,271 1,210,219
690,249 Australia Operations 511,854 –
1,873,270 2,189,125 1,210,219
Total liabilities 945,267 SA Operations 430,746 996,023272,912 Australia Operations 343,256 –
1,218,179 774,002 996,023
1 Revenue excludes intra-segmental revenue of R18,2 million in SA Operations and inter-segmental revenue of R47,8 million which are eliminated on consolidation.
SEA HARVEST group Limited INTERIM RESULTS for the SIX MONTHS ended 30 JUNE 2017
13

NOTES TO THE CONDENSED CONSOLIDATED FINANCIAL STATEMENTSfor the SIX months ended 30 June 2017
Audited Year Unaudited Unaudited ended six months ended six months ended
31 December 30 June 30 June2016 2017 2016
R’000 R’000 R’000
4. FINANCIAL ASSETS AND LIABILITIES
47,862 Financial derivative assets 41,640 –
1,233 Non-current portion of financial assets 13,953 –46,629 Current portion of financial assets 27,687 –
Other financial asset 25,264 Available-for-sale investment 25,264 25,264
2,698 Financial derivative liabilities – 53,862
2,698 Current portion of liabilities held at fair value through profit or loss – –
– Current portion of financial liabilities – 53,862
Other financial liability 100,873 Fishing licence liability 83,815 –
82,450 Non-current portion of fishing licence liability 61,267 –
18,423 Current portion of fishing licence liability 22,548 –
SEA HARVEST group Limited INTERIM RESULTS for the SIX MONTHS ended 30 JUNE 2017
14

FINANCIAL DERIvATIvE ASSETS AND LIABILITIESFinancial assets and liabilities arise from hedging contracts entered into by the Group for the purpose of minimising the Group’s exposure to foreign currency volatility. Hedging contracts are regarded as level 2 financial instruments for fair value measurement purposes. Level 2 fair value measurements are those derived from inputs that are observable for the asset or liability, either directly (i.e. as prices) or indirectly (i.e. derived from prices).
CALL OPTION DERIvATIvEIncluded in non-current financial assets is a call option, entered into on 1 January 2017, to acquire 100% of the shareholding in Vuna Fishing Company Proprietary Limited from Vuna Fishing Group Proprietary Limited. The fair value was independently determined by an expert using the Black-Scholes option pricing model. The call option financial asset has been classified as a non-current asset at 30 June 2017 due to the expected exercise date thereof exceeding 12 months from the reporting date. The call option disclosed in financial assets is regarded as a level 3 financial instrument for fair value measurement purposes. Level 3 fair value measurements are those derived from valuation techniques that include inputs for the asset or liability that are not based on observable market data (unobservable inputs).
AvAILABLE-FOR-SALE INvESTmENTThe Group holds 10% of the ordinary share capital of Desert Diamond Fishing Proprietary Limited, a company involved in the fishing and fishing processing industries. The directors of the Group do not consider that the Group is able to exercise significant influence over Desert Diamond Fishing Proprietary Limited.The Group reassesses the valuation of the available-for-sale investment annually, by using an asset valuation method performed by an independent valuator.The available-for-sale investment is regarded as a level 3 financial instrument. Level 3 fair value measurements are those derived from valuation techniques that include inputs for the asset or liability that are not based on observable market data (unobservable inputs).
OTHER FINANCIAL LIABILITIESThe fishing licence liabilities relate to the Shark Bay Prawn Managed Fishery Voluntary Fisheries Adjustment Scheme (“VFAS”). The VFAS operates from 12 November 2010 until 1 July 2021. Mareterram owns ten fishing licences in the Shark Bay region. The liabilities shown represent present values discounted at the 5 year Australian Corporate Bond rate. Fishing licence liabilities are carried at amortised cost.
SEA HARVEST group Limited INTERIM RESULTS for the SIX MONTHS ended 30 JUNE 2017
15
NOTES TO THE CONDENSED CONSOLIDATED FINANCIAL STATEMENTSfor the SIX months ended 30 June 2017
Audited Year Unaudited Unaudited ended six months ended six months ended
31 December 30 June 30 June2016 2017 2016
R’000 R’000 R’000
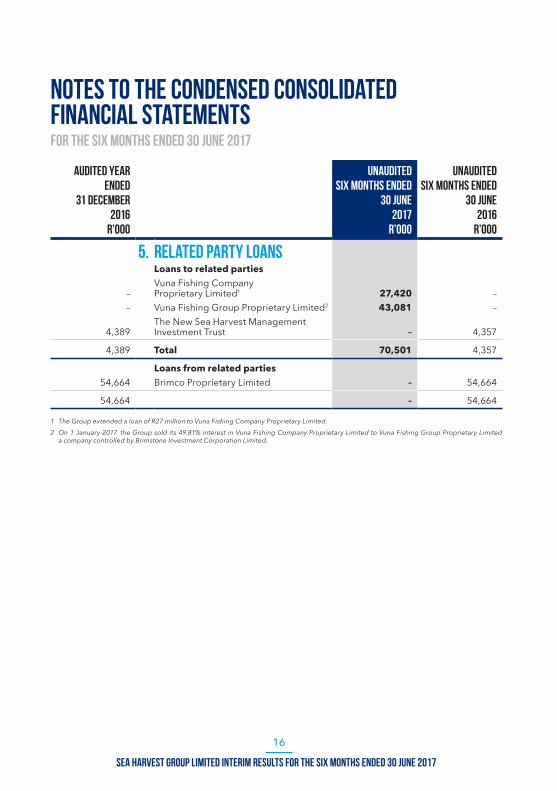
5. RELATED PARTY LOANS Loans to related parties
– Vuna Fishing Company Proprietary Limited1 27,420 –
– Vuna Fishing Group Proprietary Limited2 43,081 –
4,389 The New Sea Harvest Management Investment Trust – 4,357
4,389 Total 70,501 4,357
Loans from related parties 54,664 Brimco Proprietary Limited – 54,664
54,664 – 54,664
1 The Group extended a loan of R27 million to Vuna Fishing Company Proprietary Limited. 2 On 1 January 2017, the Group sold its 49.81% interest in Vuna Fishing Company Proprietary Limited to Vuna Fishing Group Proprietary Limited
a company controlled by Brimstone Investment Corporation Limited.
SEA HARVEST group Limited INTERIM RESULTS for the SIX MONTHS ended 30 JUNE 2017
16

Audited Year Unaudited Unaudited ended six months ended six months ended
31 December 30 June 30 June2016 2017 2016
6. STATED CAPITAL (number) In issue (number)
974,402,360 Ordinary shares 251,362,907 974,402,360(125,160,360) Held as treasury shares (11,389,304) (125,160,360)
849,242,000 239,973,603 849,242,000
141,540,333
Weighted average number of shares on which earnings and headline earnings per share is based: 195,379,525 141,540,333
162,400,393
Weighted average number of shares on which diluted earnings and diluted headline earnings per share is based: 198,154,129 162,400,393
Reconciliation of weighted average number of shares used in the calculation of basic and diluted earnings per share and headline earnings and diluted headline earnings per share:
141,540,333 Basic 195,379,525 141,540,33320,860,060 Dilutive instruments 2,774,604 20,860,060
162,400,393 Diluted 198,154,129 162,400,393
The following share movements occurred during the period under review:
Total Shares In Issue
Less Treasury Shares
Total Net Shares In Issue
Opening balance 974,402,360 125,160,360 849,242,000
Share consolidation — 15 February 2017 (1:6) (812,001,966) (104,300,300) (701,701,666)
Shares repurchased (17,370,821) (13,870,821) (3,500,000) Shares issued 106,333,334 4,400,065 101,933,269
Closing balance 251,362,907 11,389,304 239,973,603
SEA HARVEST group Limited INTERIM RESULTS for the SIX MONTHS ended 30 JUNE 2017
17

NOTES TO THE CONDENSED CONSOLIDATED FINANCIAL STATEMENTSfor the SIX months ended 30 June 2017
7. SHARE-BASED PAYMENTSThe Group has two controlled trusts which have been established as vehicles through which certain executives, senior management and employees have made an investment in or acquired an economic exposure to an investment in shares in the Group. During the six months ended 30 June 2017, The Sea Harvest Management Investment Trust No. 2 and The Sea Harvest Employee Share Trust share incentive schemes were reclassified from equity-settled share-based payment schemes to cash-settled share-based payment schemes.On 23 March 2017, the Group established a forfeitable share plan. In terms of the forfeitable share plan, executive directors and senior managers will be awarded performance shares in the Group. The performance shares are linked to a requirement of continued employment over the prescribed period, the Group's performance and strategic, individual performance conditions which have to be met. Shares are granted to participants for no consideration. These shares participate in dividends and shareholder rights from grant date. The scheme is accounted for as an equity-settled share scheme.
The Sea Harvest The Sea Harvest Management Investment Employee Share Forfeitable Trust No. 2 Trust share plan
Grant date 31 March 2014 31 March 2014 23 March 2017Number of shares granted 8,257,898 4,258,138 4,400,065Fair value of shares at grant date (R) 8,788,000 5,155,000 46,283,566Expiry date 31 March 2022 31 March 2022 23 March 2020
Vesting conditions Service ServiceService and
Performance
The Sea Harvest The Sea Harvest Management Investment Employee Share Forfeitable Trust No. 2 Trust share plan
Number of shares held at the beginning of the period 82,578,980 42,581,380 –Share consolidation — 15 February 2017 (1:6) (68,815,817) (35,484,483) –Shares repurchased (10,322,373) (3,548,448) –Granted – – 4,400,065
Number of shares held at the end of the period 3,440,790 3,548,449 4,400,065
Effect on financial statements R R R
Share-based payment expense for the period 3,568,404 1,769,347 5,590,181Liability for cash-settled share-based payments 13,012,744 8,389,323 –Equity-settled share-based payment reserve (5,348,791) (4,845,338) 5,590,181
SEA HARVEST group Limited INTERIM RESULTS for the SIX MONTHS ended 30 JUNE 2017
18

NOTES
SEA HARVEST group Limited INTERIM RESULTS for the SIX MONTHS ended 30 JUNE 2017
19

NOTES
SEA HARVEST group Limited INTERIM RESULTS for the SIX MONTHS ended 30 JUNE 2017
20

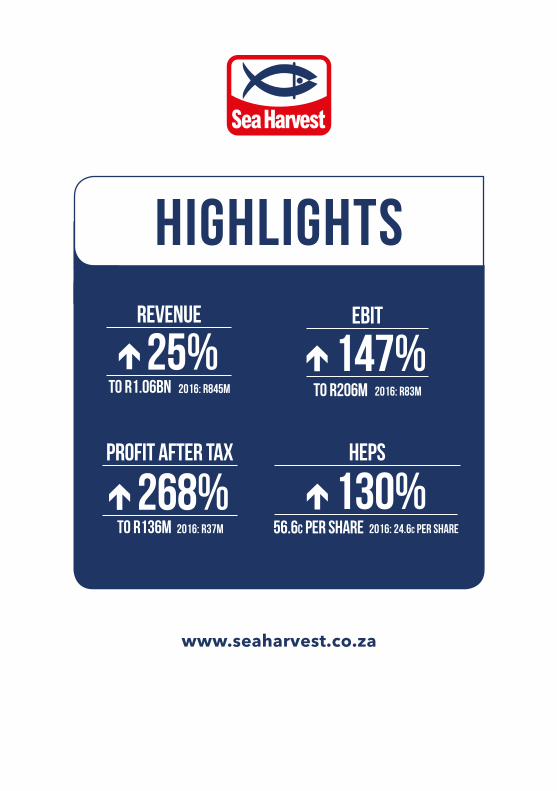
REVENUE
25%To R1.06bn 2016: R845m
PROFIT AFTER TAX
268%To R136m 2016: R37m
EBIT
147%To R206m 2016: R83m
HEPS
130%56.6c per share 2016: 24.6c per share
HIGHLIGHTS
www.seaharvest.co.za