interim results, six months ended 31 december 2016 … · 1 interim results, six months ended 31...
TRANSCRIPT
1
Interim results, six months ended 31 December 2016 26 January 2017
Stronger performance reflects continued effective execution against our strategy
Reported net sales (£6,421 million) and operating profit (£2,065 million) were up 14.5% and 28.0% respectively, reflecting accelerated organic growth and favourable exchange
Organic growth, across all regions, with 1.8% volume growth and 4.4% net sales growth
Organic operating profit grew 4.4%, in line with top line growth, driven by gross margin improvement, good progress on productivity offset by implementation costs and the profit on sale of the UB shares in the prior period
Free cash flow continued to be strong at £1,084 million, increasing by £245 million compared to the prior period with net cash from operating activities up £230 million to £1,267 million
Basic eps of 60.3 pence. Pre-exceptional eps was 62.0 pence, up 21%, as higher operating profit and associate income along with favourable exchange more than offset the impact of disposals and a higher tax rate
Interim dividend up 5% at 23.7 pence per share See page 44 for explanation of the use of non-GAAP measures.
Ivan Menezes, Chief Executive, commenting on the results said:
“We have delivered a strong set of results with broad based improvement in both organic volume and top line growth
and this positive momentum demonstrates continued effective execution of our strategy. Highlights this half include improved performance in our US Spirits business and across our scotch portfolio, driven by our focus on marketing with impact, innovating at scale, expanding our route to consumer, and winning in reserve. Progress on productivity supports growth, margin improvement and consistent strong cash flow generation as well as improving our agility.
Diageo is building a stronger, more consistent, better performing company. We are identifying consumer trends faster, expanding the reach of our products across markets and developing trade channels to capture these growth opportunities. Our productivity work is on track, driving efficiency and effectiveness across the business. Our work on trade and marketing spend gives us better data enabling smarter, quicker decisions that generate higher returns.
Our expectations of delivering stronger financial performance this year are unchanged. We are confident of achieving our medium term objective of consistent mid-single digit top line growth and 100bps of organic operating margin improvement in the three years ending 30 June 2019.”
2
Key financial information Six months ended 31 December 2016
Summary financial information
F17 H1 F16 H1
Organic growth
%
Reported growth
%
Volume EUm 129.4 130.3 2 (1)
Net sales £ million 6,421 5,606 4 15
Marketing £ million 908 822 (2) 10
Operating profit before exceptional items £ million 2,065 1,717 4 20
Exceptional operating items £ million - (104)
Operating profit £ million 2,065 1,613 28
Share of associate and joint venture profit after tax £ million 171 136 26
Exceptional non-operating items(i) £ million 20 211
Net finance charges £ million 182 176
Tax rate % 21.0 16.6 27
Tax rate before exceptional items % 20.9 19.0 10
Discontinued operations (after tax)(i) £ million (55) -
Profit attributable to parent company’s shareholders £ million 1,514 1,406 8
Basic earnings per share pence 60.3 56.1 7
Earnings per share before exceptional items pence 62.0 51.3 21
Interim dividend pence 23.7 22.6 5 (i) For further details of exceptional and discontinued operations items see page 34.
Outlook for exchange Using exchange rates £1 = $1.24; £1 = €1.16, the exchange rate movement for the year ending 30 June 2017 is estimated to favourably impact net sales by approximately £1.4 billion and operating profit by approximately £460 million and have an adverse impact of approximately £36 million on net interest. This is primarily driven by the strenghtening of the US dollar and the euro.
Outlook for tax The tax rate before exceptional items for the six months ended 31 December 2016 was 20.9% compared with 19.0% in the prior period. It is expected that the tax rate before exceptional items for the year ending 30 June 2017 will be approximately 21%.
Dividend Interim dividend at 23.7 pence per share is up 5%. Diageo has agreed with its ADR depositary bank that from the beginning of fiscal 2017, a dividend fee will be charged at the rate of 1 cent per ADR per dividend payment. Acquisitions and disposals The impact of acquisitions and disposals on the reported figures was primarily attributable to the prior period disposals of non-core assets, including the Desnoes & Geddes Limited beer business based in Jamaica and the group’s wine businesses in the United States and United Kingdom. The year on year net impact from acquisitions and disposals on net sales was £(236) million and on operating profit was £(42) million. For further details on the impact of acquisitions and disposals see page 47. Shares in issue The issued share capital at 31 December 2016 was 2,754,440,635 ordinary shares, including 237,763,765 held as treasury shares. Excluding those shares the issued share capital at 31 December 2016 was 2,516,676,870 ordinary shares. The weighted average number of shares used for the basic eps calculation for the six months ended 31 December 2016 was 2,511 million.
3
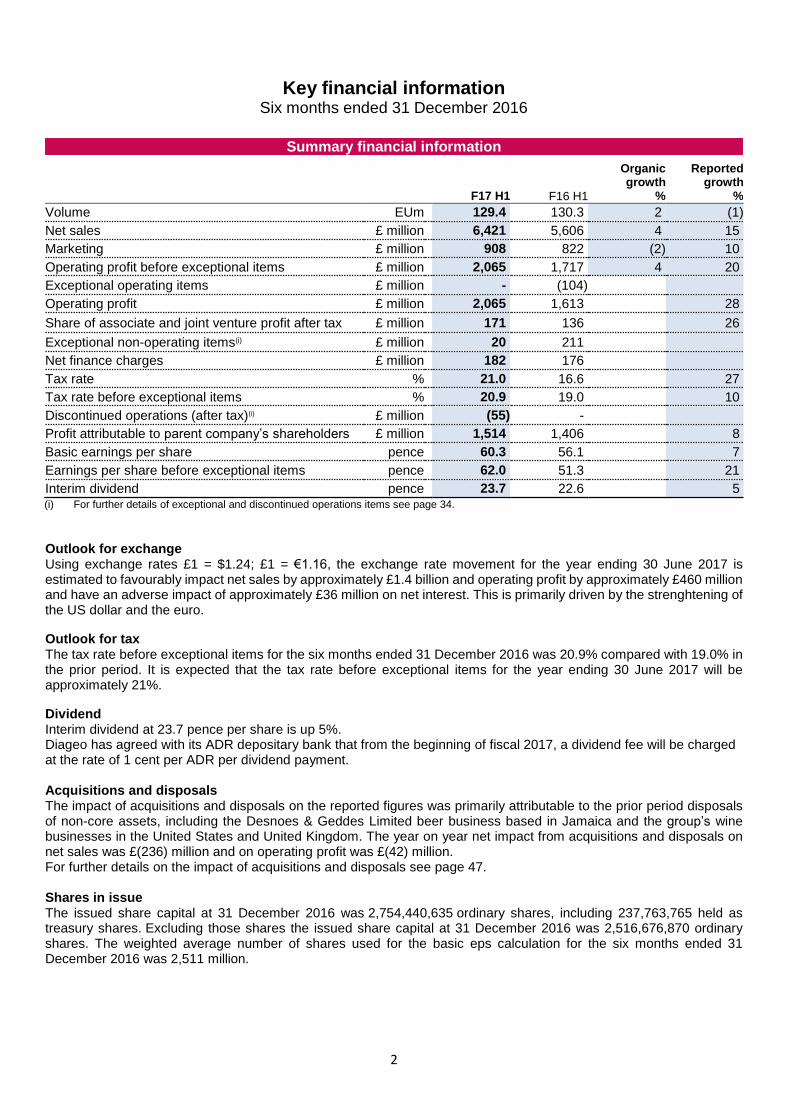
Net sales (£ million)
14.5% increase in reported net sales with favourable exchange
Organic net sales growth of 4.4% with 1.8% volume growth and positive mix
(i)
(i) Adjustment for the impact of an accounting change made by USL to account for sales by third party manufacturers to a net sales basis in the prior period. See page 21 for more details.
(ii) Exchange rate movements reflect the translation of prior period reported results at current exchange rates.
Net sales grew 14.5%, driven by favourable exchange and organic net sales growth offset by the disposal of non-core assets and the accounting change in India. Organic volume growth of 1.8% and positive mix drove 4.4% net sales growth, with organic net sales growth across all regions.
Operating profit (£ million)
Reported operating profit growth of 28%
Organic operating profit growth of 4.4%
Reported operating profit was up 28% as a result of favourable exchange, organic growth and comparison against an exceptional charge in the prior period. Organic operating profit was was up 4.4%, in line with organic net sales growth.
5,606
6,421
(72)
853
(260)
24 107 163
F16 H1 Asia Pacific netsales
adjustment(i)
Exchange(ii) Disposals Acquisitions Volume Price/mix F17 H1
Organic movement
1,613
2,065
104
303
(33) (9)
87
F16 H1 Exceptionaloperating items
Exchange Disposals Acquisitions Organic movement F17 H1
4
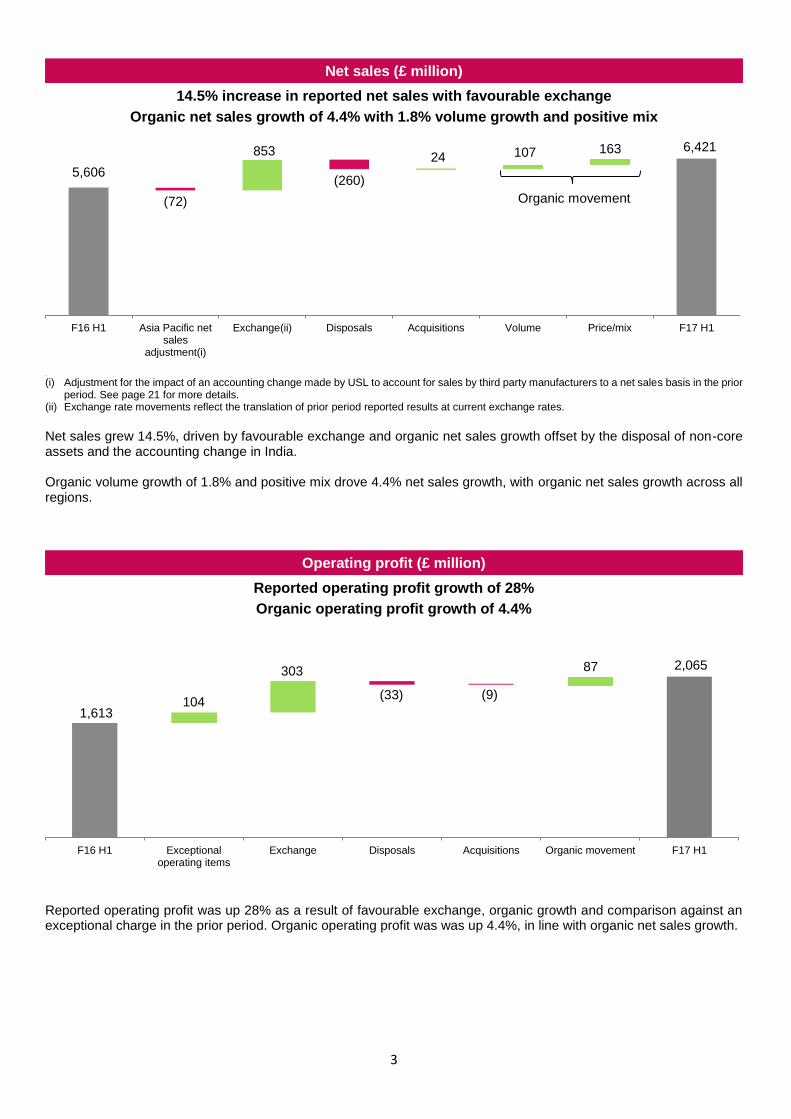
Operating margin (%)
Reported operating margin growth of 339bps
Organic margin declined (1) bps
(i) Adjustment for the impact of an accounting change made by USL to account for sales by third party manufacturers to a net sales basis in the prior period. See page 21 for more details.
Operating margin improved by 339bps mainly driven by the comparison against the prior period exceptional charge, favourable exchange, the disposal of lower margin non-core assets and the net sales adjustment in Asia Pacific. Organic operating margin was broadly flat. Improvement in gross margin was driven primarily by positive mix. Procurement savings and cost efficiencies drove 90bps of margin improvement on marketing spend despite increased activity in line with net sales growth. The increase in other operating expenses resulted from lapping the profit on the sale of UB shares, as well as incremental productivity related costs and non-recurring costs in the period. These costs were partially offset by benefits related to the productivity programme.
Basic earnings per share (pence)
Basic eps increased from 56.1 pence to 60.3 pence
Eps before exceptional items increased from 51.3 pence to 62.0 pence
(i) Exceptional items net of tax for the six months ended 31 December 2015 included a net gain from the sale of non-core assets. (ii) Excluding exchange
Basic eps was impacted by lower exceptional income compared to the prior period and a discontinued operations charge in respect of an agreement with the UK Thalidomide Trust. Favourable exchange and operating profit growth also contributed to overall eps growth, although eps was negatively impacted by the increased tax rate.
28.77%
32.16%35bps
64bps
55bps
90bps
(130)bps
39bps
186bps
F16 H1 Exceptionaloperating items
Exchange Asia Pacific netsales
adjustment(i)
Acquisitionsand disposals
Gross margin Marketing Other operatingexpenses
F17 H1
56.1
60.3
(4.32)(2.19)
12.05
(1.68)
3.501.39
(0.22)
(4.43)
0.09
F16 H1 Exceptionalitems after
tax(i)
Discontinuedoperationsafter tax
Exchange onoperating profit
Acquisitionsand disposals
Organicoperating profit
growth (ii)
Associatesand jointventures
Net financecharges
Tax Non-controllinginterests
F17 H1
Organic movement
5
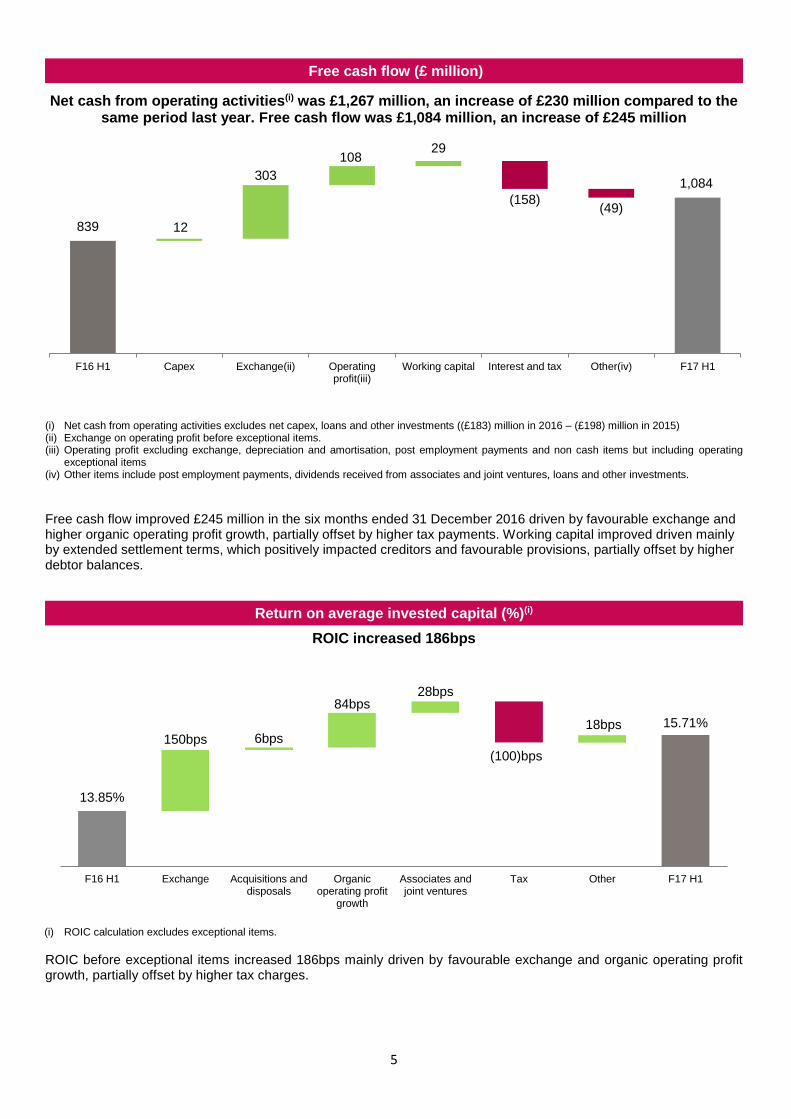
Free cash flow (£ million)
Net cash from operating activities(i) was £1,267 million, an increase of £230 million compared to the same period last year. Free cash flow was £1,084 million, an increase of £245 million
(i) Net cash from operating activities excludes net capex, loans and other investments ((£183) million in 2016 – (£198) million in 2015) (ii) Exchange on operating profit before exceptional items. (iii) Operating profit excluding exchange, depreciation and amortisation, post employment payments and non cash items but including operating
exceptional items (iv) Other items include post employment payments, dividends received from associates and joint ventures, loans and other investments.
Free cash flow improved £245 million in the six months ended 31 December 2016 driven by favourable exchange and higher organic operating profit growth, partially offset by higher tax payments. Working capital improved driven mainly by extended settlement terms, which positively impacted creditors and favourable provisions, partially offset by higher debtor balances.
Return on average invested capital (%)(i)
ROIC increased 186bps
(i) ROIC calculation excludes exceptional items.
ROIC before exceptional items increased 186bps mainly driven by favourable exchange and organic operating profit growth, partially offset by higher tax charges.
12
303
10829
(158)(49)
F16 H1 Capex Exchange(ii) Operatingprofit(iii)
Working capital Interest and tax Other(iv) F17 H1
839
1,084
13.85%
15.71%
150bps 6bps
84bps28bps
(100)bps
18bps
F16 H1 Exchange Acquisitions anddisposals
Organicoperating profit
growth
Associates andjoint ventures
Tax Other F17 H1
6
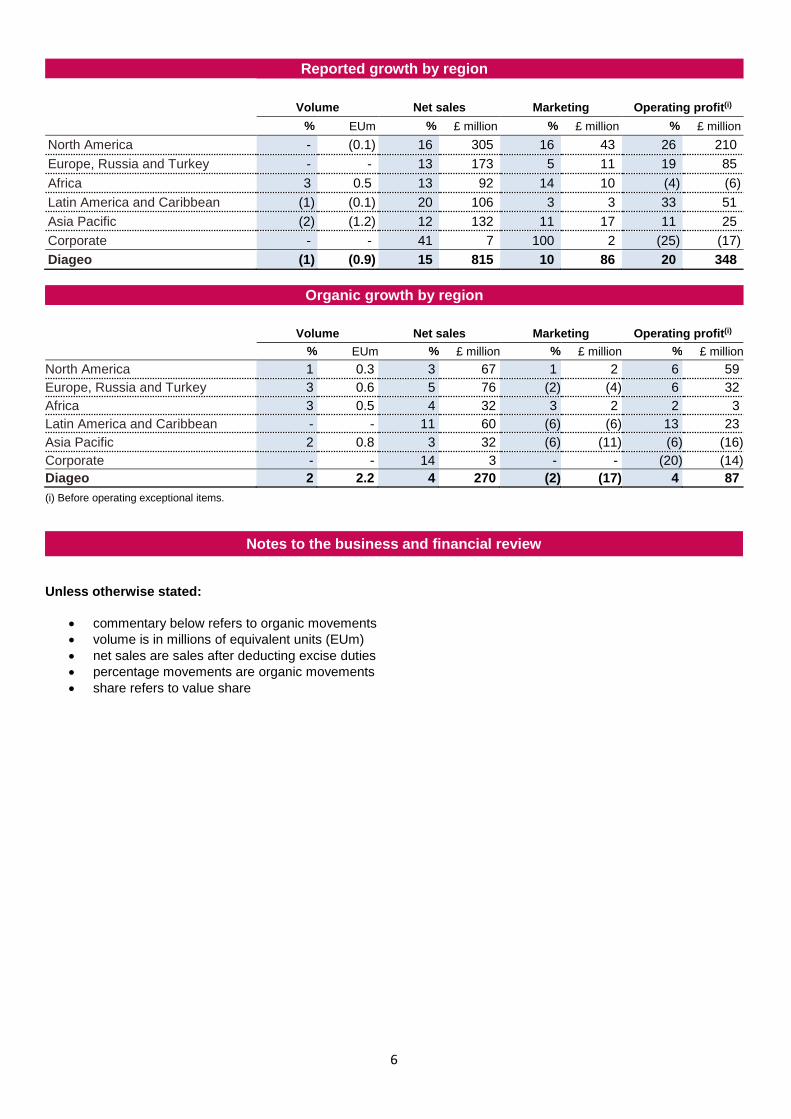
Reported growth by region
Volume Net sales Marketing Operating profit(i) % EUm % £ million % £ million % £ million North America - (0.1) 16 305 16 43 26 210
Europe, Russia and Turkey - - 13 173 5 11 19 85
Africa 3 0.5 13 92 14 10 (4) (6)
Latin America and Caribbean (1) (0.1) 20 106 3 3 33 51
Asia Pacific (2) (1.2) 12 132 11 17 11 25
Corporate - - 41 7 100 2 (25) (17)
Diageo (1) (0.9) 15 815 10 86 20 348
Organic growth by region
Volume Net sales Marketing Operating profit(i)
% EUm % £ million % £ million % £ million
North America 1 0.3 3 67 1 2 6 59
Europe, Russia and Turkey 3 0.6 5 76 (2) (4) 6 32
Africa 3 0.5 4 32 3 2 2 3
Latin America and Caribbean - - 11 60 (6) (6) 13 23
Asia Pacific 2 0.8 3 32 (6) (11) (6) (16)
Corporate - - 14 3 - - (20) (14)
Diageo 2 2.2 4 270 (2) (17) 4 87
(i) Before operating exceptional items.
Notes to the business and financial review
Unless otherwise stated:
commentary below refers to organic movements
volume is in millions of equivalent units (EUm)
net sales are sales after deducting excise duties
percentage movements are organic movements
share refers to value share
7
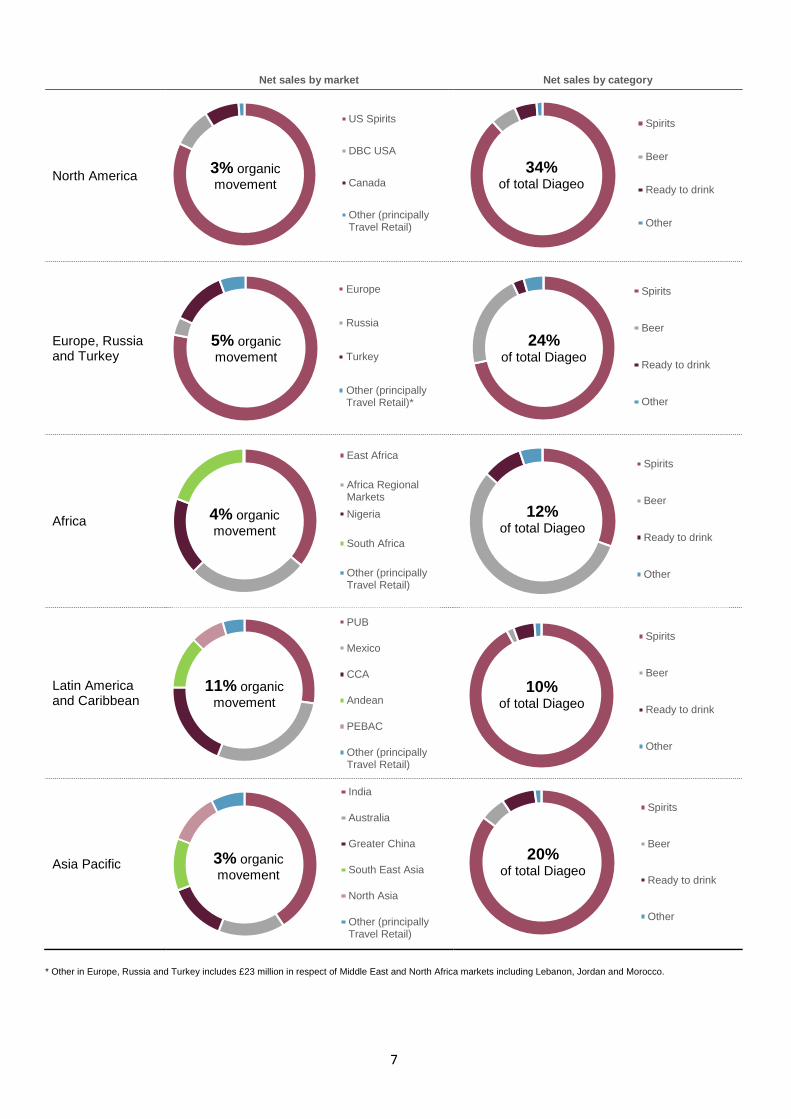
Net sales by market Net sales by category
North America
Europe, Russia and Turkey
Africa
Latin America and Caribbean
Asia Pacific
* Other in Europe, Russia and Turkey includes £23 million in respect of Middle East and North Africa markets including Lebanon, Jordan and Morocco.
US Spirits
DBC USA
Canada
Other (principallyTravel Retail)
3% organic
movement
Spirits
Beer
Ready to drink
Other
Europe
Russia
Turkey
Other (principallyTravel Retail)*
5% organic
movement
Spirits
Beer
Ready to drink
Other
East Africa
Africa RegionalMarkets
Nigeria
South Africa
Other (principallyTravel Retail)
4% organic
movement
Spirits
Beer
Ready to drink
Other
12%of total Diageo
PUB
Mexico
CCA
Andean
PEBAC
Other (principallyTravel Retail)
Spirits
Beer
Ready to drink
Other
10%of total Diageo
India
Australia
Greater China
South East Asia
North Asia
Other (principallyTravel Retail)
3% organic
movement
Spirits
Beer
Ready to drink
Other
20%of total Diageo
11% organic
movement
34% of total Diageo
24% of total Diageo
8
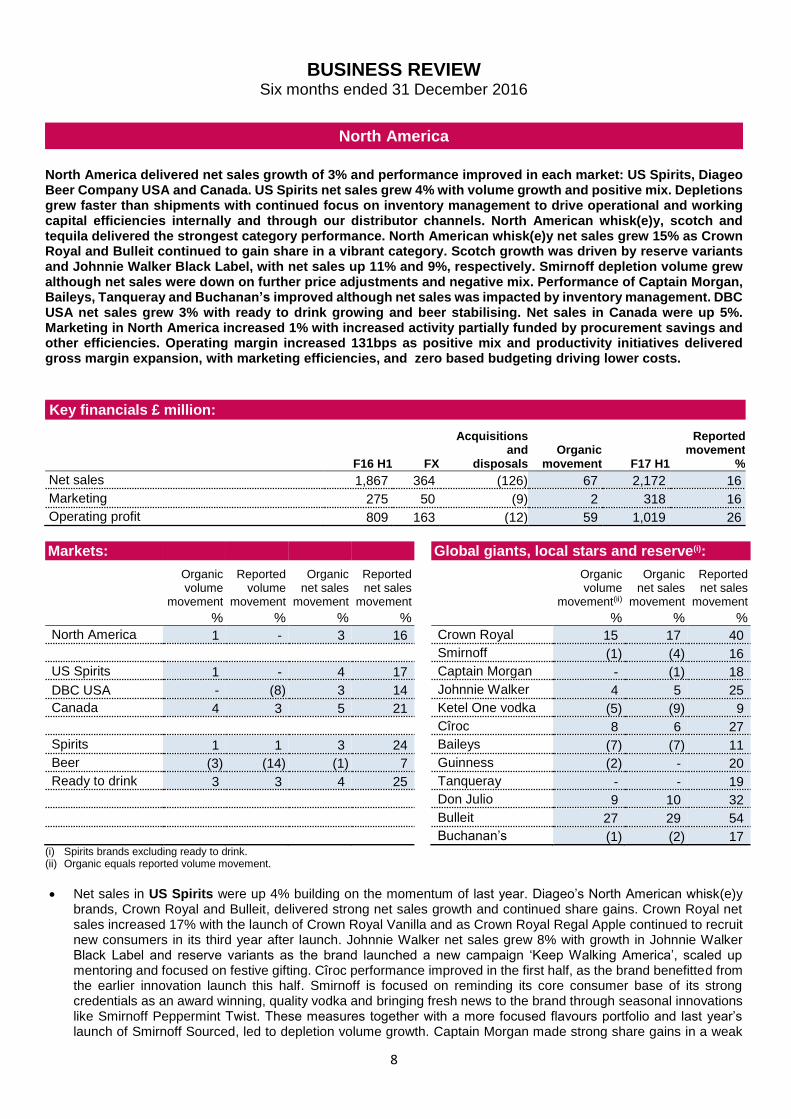
BUSINESS REVIEW Six months ended 31 December 2016
North America
North America delivered net sales growth of 3% and performance improved in each market: US Spirits, Diageo Beer Company USA and Canada. US Spirits net sales grew 4% with volume growth and positive mix. Depletions grew faster than shipments with continued focus on inventory management to drive operational and working capital efficiencies internally and through our distributor channels. North American whisk(e)y, scotch and tequila delivered the strongest category performance. North American whisk(e)y net sales grew 15% as Crown Royal and Bulleit continued to gain share in a vibrant category. Scotch growth was driven by reserve variants and Johnnie Walker Black Label, with net sales up 11% and 9%, respectively. Smirnoff depletion volume grew although net sales were down on further price adjustments and negative mix. Performance of Captain Morgan, Baileys, Tanqueray and Buchanan’s improved although net sales was impacted by inventory management. DBC USA net sales grew 3% with ready to drink growing and beer stabilising. Net sales in Canada were up 5%. Marketing in North America increased 1% with increased activity partially funded by procurement savings and other efficiencies. Operating margin increased 131bps as positive mix and productivity initiatives delivered gross margin expansion, with marketing efficiencies, and zero based budgeting driving lower costs.
Key financials £ million:
F16 H1 FX
Acquisitions and
disposals Organic
movement F17 H1
Reported movement
%
Net sales 1,867 364 (126) 67 2,172 16
Marketing 275 50 (9) 2 318 16
Operating profit 809 163 (12) 59 1,019 26
Markets: Global giants, local stars and reserve(i):
Organic volume
movement
Reported volume
movement
Organic net sales
movement
Reported net sales
movement
Organic volume
movement(ii)
Organic net sales
movement
Reported net sales
movement
% % % % % % %
North America 1 - 3 16 Crown Royal 15 17 40
Smirnoff (1) (4) 16
US Spirits 1 - 4 17 Captain Morgan - (1) 18
DBC USA - (8) 3 14 Johnnie Walker 4 5 25
Canada 4 3 5 21 Ketel One vodka (5) (9) 9
Cîroc 8 6 27
Spirits 1 1 3 24 Baileys (7) (7) 11
Beer (3) (14) (1) 7 Guinness (2) - 20
Ready to drink 3 3 4 25 Tanqueray - - 19
Don Julio 9 10 32
Bulleit 27 29 54
Buchanan’s (1) (2) 17 (i) Spirits brands excluding ready to drink. (ii) Organic equals reported volume movement.
Net sales in US Spirits were up 4% building on the momentum of last year. Diageo’s North American whisk(e)y brands, Crown Royal and Bulleit, delivered strong net sales growth and continued share gains. Crown Royal net sales increased 17% with the launch of Crown Royal Vanilla and as Crown Royal Regal Apple continued to recruit new consumers in its third year after launch. Johnnie Walker net sales grew 8% with growth in Johnnie Walker Black Label and reserve variants as the brand launched a new campaign ‘Keep Walking America’, scaled up mentoring and focused on festive gifting. Cîroc performance improved in the first half, as the brand benefitted from the earlier innovation launch this half. Smirnoff is focused on reminding its core consumer base of its strong credentials as an award winning, quality vodka and bringing fresh news to the brand through seasonal innovations like Smirnoff Peppermint Twist. These measures together with a more focused flavours portfolio and last year’s launch of Smirnoff Sourced, led to depletion volume growth. Captain Morgan made strong share gains in a weak
9
rum category with continued focus in the on-trade, activation to recruit multi-cultural consumers and the launch of Jack-O’Blast, a limited edition pumpkin spiced rum shot for the holiday season. Pricing adjustments continued on Smirnoff and Captain Morgan, and were also made on Ketel One vodka to ensure competitiveness. Smirnoff also experienced negative mix from higher sales of its largest format. Don Julio net sales grew 10% building on the momentum of last year. Buchanan’s, Tanqueray and Baileys share gains accelerated in the half. Inventory changes impacted net sales performance of Captain Morgan, Buchanan’s, Crown Royal Deluxe, Baileys and Tanqueray.
DBC USA (Diageo Beer Company USA) net sales increased 3% with ready to drink growing 5% and beer performance stabilising. Ready to drink growth was driven by the recent launch of Smirnoff Spiked Sparkling Seltzer and Smirnoff Electric which was launched last year, and the solid performance of Smirnoff Ice, which benefitted from a packaging and liquid renovation and a football programme focused on women. Guinness net sales grew 1% while Smithwicks and Harp were weaker.
Net sales in Canada grew 5%, largely driven by growth in Crown Royal, Smirnoff and ready to drink. Crown Royal continued to benefit from the ‘We Make Whisky The Canadian Way’ campaign, which highlights the brand’s quality and craftmanship and from the launch of Crown Royal Vanilla and Crown Royal Northern Harvest Rye. Smirnoff continued its association with music integrating the Smirnoff Sound Collective programme into festival and on-premise activations. Ready to drink growth was driven by the launch of Smirnoff Electric and Smirnoff Bellini.
Marketing spend grew 1% as increased activity on key brands was funded by procurement savings and other efficiencies.
10
Europe, Russia and Turkey
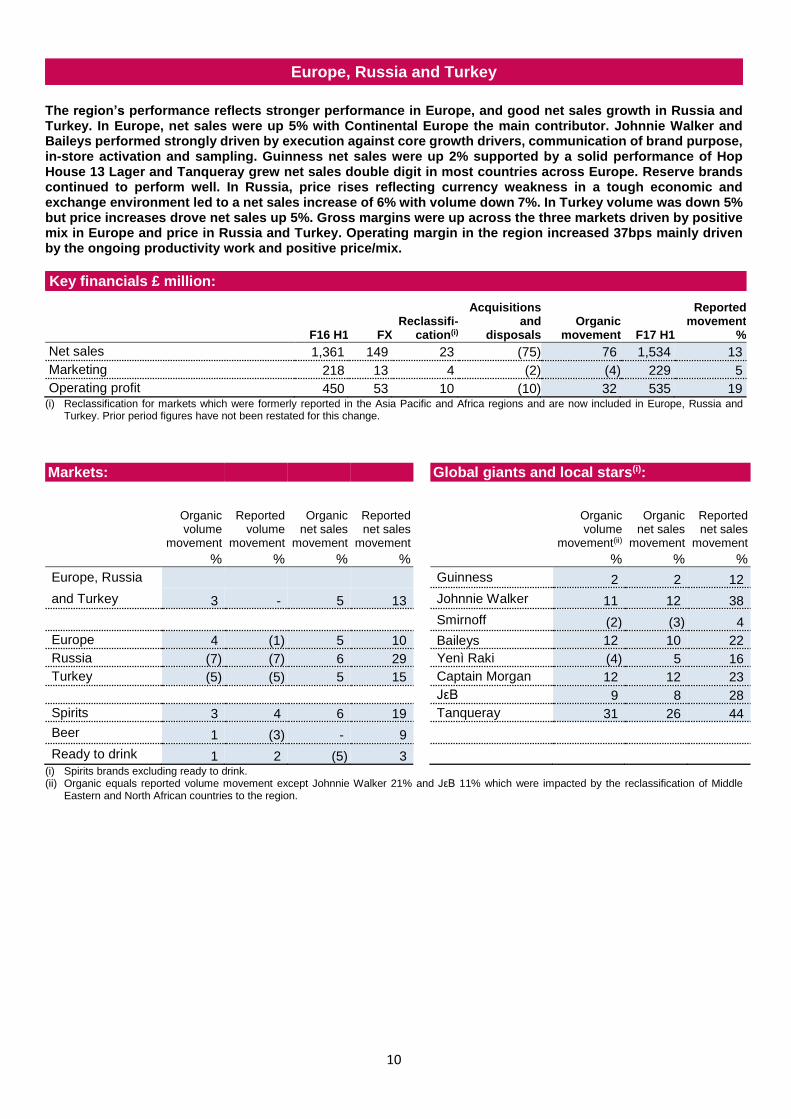
The region’s performance reflects stronger performance in Europe, and good net sales growth in Russia and Turkey. In Europe, net sales were up 5% with Continental Europe the main contributor. Johnnie Walker and Baileys performed strongly driven by execution against core growth drivers, communication of brand purpose, in-store activation and sampling. Guinness net sales were up 2% supported by a solid performance of Hop House 13 Lager and Tanqueray grew net sales double digit in most countries across Europe. Reserve brands continued to perform well. In Russia, price rises reflecting currency weakness in a tough economic and exchange environment led to a net sales increase of 6% with volume down 7%. In Turkey volume was down 5% but price increases drove net sales up 5%. Gross margins were up across the three markets driven by positive mix in Europe and price in Russia and Turkey. Operating margin in the region increased 37bps mainly driven by the ongoing productivity work and positive price/mix.
Key financials £ million:
F16 H1 FX Reclassifi-
cation(i)
Acquisitions and
disposals Organic
movement F17 H1
Reported movement
%
Net sales 1,361 149 23 (75) 76 1,534 13
Marketing 218 13 4 (2) (4) 229 5
Operating profit 450 53 10 (10) 32 535 19 (i) Reclassification for markets which were formerly reported in the Asia Pacific and Africa regions and are now included in Europe, Russia and
Turkey. Prior period figures have not been restated for this change.
Markets: Global giants and local stars(i):
Organic volume
movement
Reported volume
movement
Organic net sales
movement
Reported net sales
movement
Organic volume
movement(ii)
Organic net sales
movement
Reported net sales
movement
% % % % % % %
Europe, Russia Guinness 2 2 12
and Turkey 3 - 5 13 Johnnie Walker 11 12 38
Smirnoff (2) (3) 4
Europe 4 (1) 5 10 Baileys 12 10 22
Russia (7) (7) 6 29 Yenì Raki (4) 5 16
Turkey (5) (5) 5 15 Captain Morgan 12 12 23
JεB 9 8 28
Spirits 3 4 6 19 Tanqueray 31 26 44
Beer 1 (3) - 9
Ready to drink 1 2 (5) 3 (i) Spirits brands excluding ready to drink. (ii) Organic equals reported volume movement except Johnnie Walker 21% and JεB 11% which were impacted by the reclassification of Middle
Eastern and North African countries to the region.
11
In Europe net sales were up 5%:
In Great Britain, focus on route to consumer led to share gains, although net sales were broadly flat as changes in the commercial footprint led to efficiencies, including inventory reduction. Baileys performance improved with net sales up 2% driven by increased on-trade activations especially around Christmas in the off-trade. Guinness net sales were flat, lapping last year’s ‘Rugby World Cup’, but it gained 10bps of share driven by improved distribution and innovation success with Hop House 13 Lager. Tanqueray net sales grew 42% due to expanded distribution. Reserve brands experienced solid growth driven by scotch and Tanqueray No. TEN. Smirnoff recovered momentum gaining share both in off-trade and on-trade, but net sales were down 6%.
In Ireland, net sales grew 1%. High double digit growth in the premium and reserve brands contributed to a share gain in spirits. Guinness net sales were up 3%, driven by the continued success of Hop House 13 Lager which had a strong performance in the on-trade and more recently in the off-trade.
In France, net sales were up 1%. Continued strong performance of Captain Morgan and the scotch malts Cardhu and Knockando, was partially offset by weakness in Smirnoff including ready to drink.
In Continental Europe net sales were up 11%:
Net sales in Iberia were up 15%, driven by a stronger on-trade but primarily the comparison to the prior period, when inventory was reduced following changes to the commercial footprint. JεB and Johnnie Walker net sales grew in the high teens and Baileys performed strongly, supported by increased investment. Smirnoff performance also improved with net sales up 21% which contributed to on-trade share gain.
In Germany, Austria and Switzerland, net sales grew 17% driven by double digit growth in Baileys, Johnnie Walker and Tanqueray. Diageo’s scotch and liqueur brands grew strongly resulting in overall share gains in Germany.
Benelux net sales were down 6% impacted by a significant tax increase implemented in November last year in Belgium.
In Italy, net sales were up single digit driven by solid momentum in the off-trade. Scotch declined 2%. Gin continued its double digit growth momentum and Captain Morgan delivered growth contributing to a 2pps share gain in rum.
In Greece, net sales were flat. Johnnie Walker and single malts performed well driven by consistent shopper focused activity which effectively communicated brand benefits and contributed to increased in-store activation.
Net sales in Poland were up 13% due to the performance improvement of the scotch and reserve brands.
Europe Partner Markets grew 19% due to the implementation of new route to market capabilities which expanded the distributors’ footprints and improved in-store execution. Johnnie Walker and JεB grew 22% and 49%, respectively.
Performance in Russia continued to be impacted by the economy. Price increases were implemented to offset currency devaluation with net sales growth of 6% driven by Bell’s and Johnnie Walker. However, this resulted in a 7% loss of volume and share declined as the price increases on scotch were higher relative to the competition.
In Turkey, net sales grew 5% driven by growth in all raki variants and the continued premiumisation trend of the category together with price increases. Johnnie Walker net sales increased 14%.
Marketing spend declined 2% as a result of productivity initiatives which improved the effectiveness of the brand investment, driving in store execution and activations in the on-trade and off-trade channels. Marketing investment continues to focus on key growth opportunities for the region in reserve, gin, beer, rum and innovation.
12
Africa
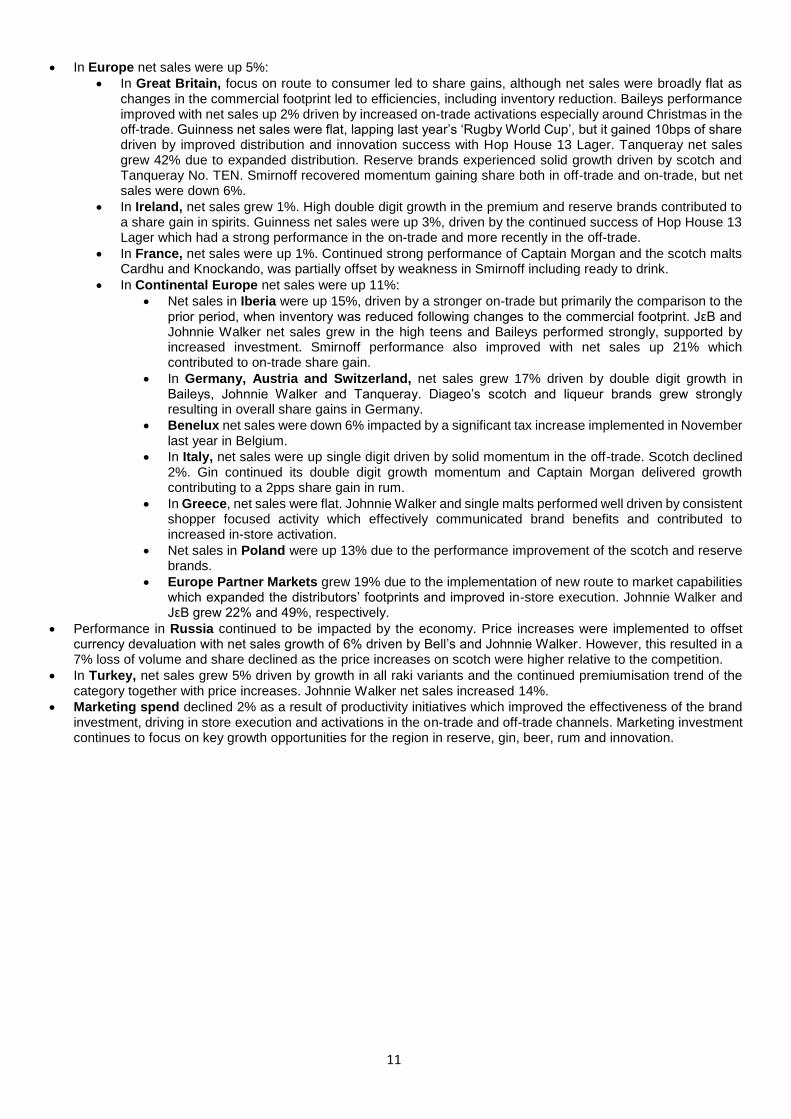
In Africa, performance improved with net sales up 4%. Beer performance was impacted by the significant increase in duty on bottled beer in Kenya with Guinness down 22%, Tusker down 15% and the comparison against the double digit growth in Guinness in Nigeria in the prior period. This offset the strong growth of, Satzenbrau, up 108%, and Senator, up 17% and net sales growth of beer in Africa Regional Markets of 7% with the relaunch of Meta in Ethiopia and the growth of Guinness supported by the ‘Made of Black’ Guinness campaign. Across the region, mainstream spirits net sales grew 20%, driven by the strong performance of Smirnoff 1818 and Kenya Cane which benefited from a consumer shift from beer to mainstream spirits. Premium spirits grew 13% with growth coming from Johnnie Walker Black Label in Africa Regional Markets and Nigeria. Operating margin decreased 37bps due primarily to the impact of adverse mix in Nigeria and East Africa. This was partially offset by COGS savings, changes to improve organisational effectiveness and benefits from zero based budgeting across the region.
Key financials £ million:
F16 H1 FX Reclassifi-
cation(i)
Acquisitions and
disposals Organic
movement F17 H1
Reported movement
%
Net sales 716 54 (8) 14 32 808 13
Marketing 74 4 (1) 5 2 84 14
Operating profit 138 10 (5) (14) 3 132 (4) (i) Reclassifications comprise Algeria and Morocco which were formerly reported in the Africa region and are now included in Europe, Russia and
Turkey. Prior period figures have not been restated for this change.
Markets: Global giants and local stars(i):
Organic volume
movement
Reported volume
movement
Organic net sales
movement
Reported net sales
movement
Organic volume
movement(ii)
Organic net sales
movement
Reported net sales
movement
% % % % % % %
Africa 3 3 4 13 Guinness (8) (8) (7)
Johnnie Walker 1 12 11
East Africa 5 5 - 19 Smirnoff 5 33 56
ARM - - 6 22
Nigeria 7 7 6 (19) Other beer:
South Africa (2) 4 10 42
Malta Guinness (13) (5) (13)
Spirits 7 4 17 26 Tusker (12) (13) -
Beer 1 1 (1) 5 Senator 13 17 42
Ready to drink (11) 15 (6) 25 Satzenbrau 72 108 59 (i) Spirits brands excluding ready to drink. (ii) Organic equals reported volume movement except for Johnnie Walker (11)% which was impacted by the reclassification of Algeria and Morocco
to the Europe, Russia and Turkey region.
13
In Nigeria, net sales increased 6% with spirits growth of 47% being the main driver. This was built on mainstream spirits, up 135%, driven by the successful launch of brands including McDowell’s, which is now produced locally at Benin with increased focus and support behind mainstream brands. Increased investment behind Johnnie Walker delivered 22% growth. Beer net sales grew 1% as the performance of Satzenbrau, where net sales doubled following targeted investment, offset the decline in Guinness of 11% and Malta Guinness of 14%, which grew strongly in the prior period with sales up 41%. Within ready to drink Smirnoff grew strongly but it did not offset the decline in Orijin, now also available in smaller formats to help realign pricing and improve competiveness. The recent launch of Orijin Zero is extending reach into the non-alcoholic drinks market.
East Africa, net sales were flat with 17% increase in Senator net sales and strong spirits growth of 24% offset by the impact of the duty increase on bottled beer which was down 16%. Mainstream spirits grew 26% led by Kenya Cane and the innovation, Kenya Cane Coconut. In value beer, strong growth in Senator and Pilsner was supplemented by Ngule a new value price point innovation in Uganda. Reserve brands grew 11% following enhanced outlet partnerships and activation supported by brand ambassadors.
In Africa Regional Markets, net sales grew 6% reflecting the strong growth in Ethiopia and Cameroon, supported by Ghana. Markets continued to benefit from the enhanced route to consumer delivering improved distribution, availability and execution.
In Ethiopia, net sales increased 46% driven by Meta, up 44%, following the relaunch last year and the Azmera innovation.
In Cameroon, net sales growth of 5% was driven largely by ready to drink up 114%. This was led by Orijin ready to drink following the launch last year. Spirits also contributed to the good performance driven predominately by Johnnie Walker Black Label, up 79%, which offset the decline on Malta Guinness of 38% arising from strong competition in this category. In beer, Guinness grew 2%.
Ghana net sales increased 4% as net sales growth in beer and ready to drink offset a decline in spirits driven by Orijin Bitters which lapped its launch. In beer, Guinness net sales were up 14% as the brand benefitted from the ‘First Beer On Us’ campaign. Growth in Malta Guinness, up 14%, has offset declines in other beer brands, predominantly Star. Momentum continued in ready to drink, with net sales up 27% driven by Orijin.
South Africa net sales grew 10% driven by growth in mainstream spirits led by Smirnoff 1818. In premium spirits, scotch returned to growth with all brands contributing and Johnnie Walker benefiting from significant focus and investment as well as the launch of Johnnie Walker Green Label and up weighted gifting activity on Johnnie Walker Blue Label.
Marketing was up 3% in the region with investment prioritised behind the biggest growth opportunities and with proven sales drivers. In Nigeria, marketing has been focused on key campaigns including Satzenbrau Smart Choice. In Africa Regional Markets, marketing campaigns and activation programmes behind Guinness and Orijin contributed to the increase in marketing. South Africa increased investment behind Johnnie Walker and the reserve portfolio.
14
Latin America and Caribbean
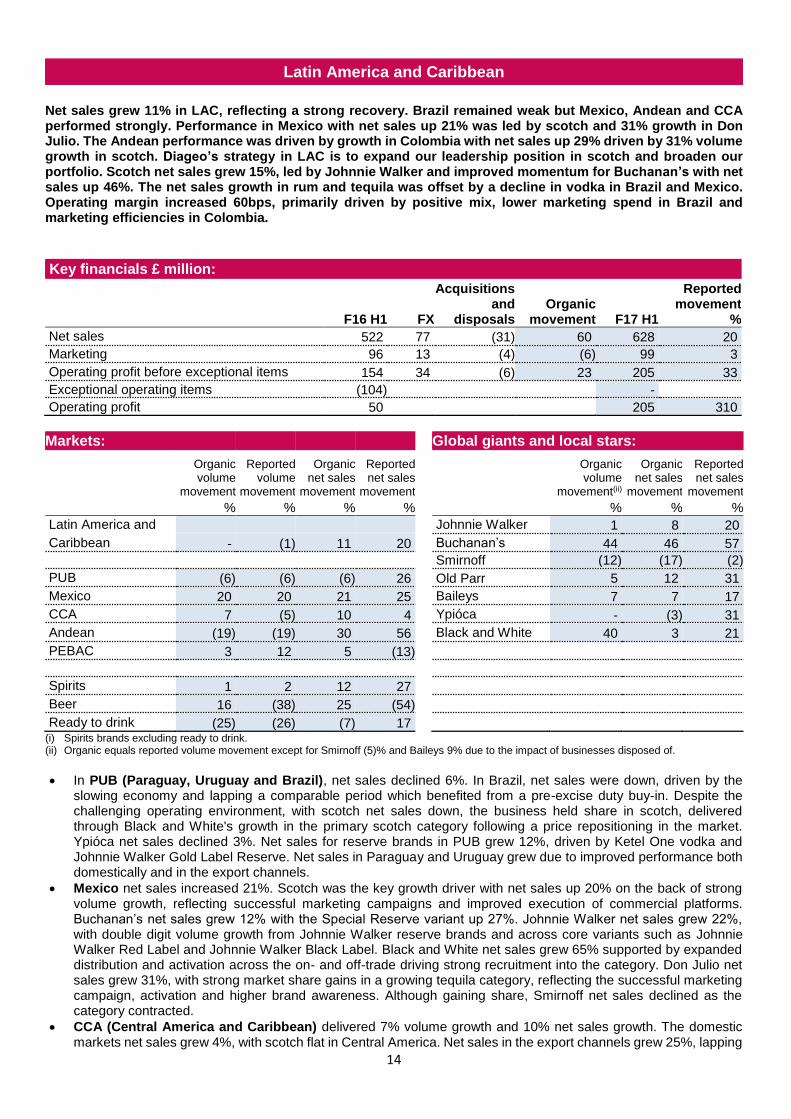
Net sales grew 11% in LAC, reflecting a strong recovery. Brazil remained weak but Mexico, Andean and CCA performed strongly. Performance in Mexico with net sales up 21% was led by scotch and 31% growth in Don Julio. The Andean performance was driven by growth in Colombia with net sales up 29% driven by 31% volume growth in scotch. Diageo’s strategy in LAC is to expand our leadership position in scotch and broaden our portfolio. Scotch net sales grew 15%, led by Johnnie Walker and improved momentum for Buchanan’s with net sales up 46%. The net sales growth in rum and tequila was offset by a decline in vodka in Brazil and Mexico. Operating margin increased 60bps, primarily driven by positive mix, lower marketing spend in Brazil and marketing efficiencies in Colombia.
Key financials £ million:
F16 H1 FX
Acquisitions and
disposals Organic
movement F17 H1
Reported movement
%
Net sales 522 77 (31) 60 628 20
Marketing 96 13 (4) (6) 99 3
Operating profit before exceptional items 154 34 (6) 23 205 33
Exceptional operating items (104) -
Operating profit 50 205 310
Markets: Global giants and local stars:
Organic volume
movement
Reported volume
movement
Organic net sales
movement
Reported net sales
movement
Organic volume
movement(ii)
Organic net sales
movement
Reported net sales
movement
% % % % % % %
Latin America and Johnnie Walker 1 8 20
Caribbean - (1) 11 20 Buchanan’s 44 46 57
Smirnoff (12) (17) (2)
PUB (6) (6) (6) 26 Old Parr 5 12 31
Mexico 20 20 21 25 Baileys 7 7 17
CCA 7 (5) 10 4 Ypióca - (3) 31
Andean (19) (19) 30 56 Black and White 40 3 21
PEBAC 3 12 5 (13)
Spirits 1 2 12 27
Beer 16 (38) 25 (54)
Ready to drink (25) (26) (7) 17 (i) Spirits brands excluding ready to drink. (ii) Organic equals reported volume movement except for Smirnoff (5)% and Baileys 9% due to the impact of businesses disposed of.
In PUB (Paraguay, Uruguay and Brazil), net sales declined 6%. In Brazil, net sales were down, driven by the slowing economy and lapping a comparable period which benefited from a pre-excise duty buy-in. Despite the challenging operating environment, with scotch net sales down, the business held share in scotch, delivered through Black and White's growth in the primary scotch category following a price repositioning in the market. Ypióca net sales declined 3%. Net sales for reserve brands in PUB grew 12%, driven by Ketel One vodka and Johnnie Walker Gold Label Reserve. Net sales in Paraguay and Uruguay grew due to improved performance both domestically and in the export channels.
Mexico net sales increased 21%. Scotch was the key growth driver with net sales up 20% on the back of strong volume growth, reflecting successful marketing campaigns and improved execution of commercial platforms. Buchanan’s net sales grew 12% with the Special Reserve variant up 27%. Johnnie Walker net sales grew 22%, with double digit volume growth from Johnnie Walker reserve brands and across core variants such as Johnnie Walker Red Label and Johnnie Walker Black Label. Black and White net sales grew 65% supported by expanded distribution and activation across the on- and off-trade driving strong recruitment into the category. Don Julio net sales grew 31%, with strong market share gains in a growing tequila category, reflecting the successful marketing campaign, activation and higher brand awareness. Although gaining share, Smirnoff net sales declined as the category contracted.
CCA (Central America and Caribbean) delivered 7% volume growth and 10% net sales growth. The domestic markets net sales grew 4%, with scotch flat in Central America. Net sales in the export channels grew 25%, lapping
15
the prior year inventory reduction programme in the market, however conditions remain challenging given the continued currency weakness against the US dollar.
Andean (Colombia and Venezuela) net sales grew 30%. Colombia delivered 26% volume growth and 29% net sales increase on stronger consumer demand and improved execution standards at the point of sale. There was strong growth in scotch with net sales up 31%. Old Parr grew net sales 9% with strong double digit growth for Johnnie Walker and Buchanan’s, which contributed to reserve brands net sales growth of 44%. This was driven by a focused reserve model targeting distribution, visibility, staff training and mentorship. In Venezuela, volume decreased 43% as volatility in the market continued. Although net sales grew significantly faster, with price increases in the high inflation environment, the business remains small with net sales of £6 million in the half.
PEBAC (Peru, Ecuador, Bolivia, Argentina and Chile) delivered net sales growth of 5%. The growth in Chile and Bolivia was partially offset by a decline in Peru where economic conditions have impacted domestic demand. In Chile, net sales grew 16%, led by Johnnie Walker which grew 21%, driven by Johnnie Walker Black Label and Johnnie Walker Red Label, and the standard scotch brands. Leveraging the 'Celebrate Together' platform to drive recruitment into reserve brands, whilst diversifying the portfolio has delivered 8% net sales growth for reserve brands.
Marketing declined 6% with reductions in Brazil partially offset by increased spend in Mexico which was focused on driving scotch performance through Johnnie Walker.
16
Asia Pacific
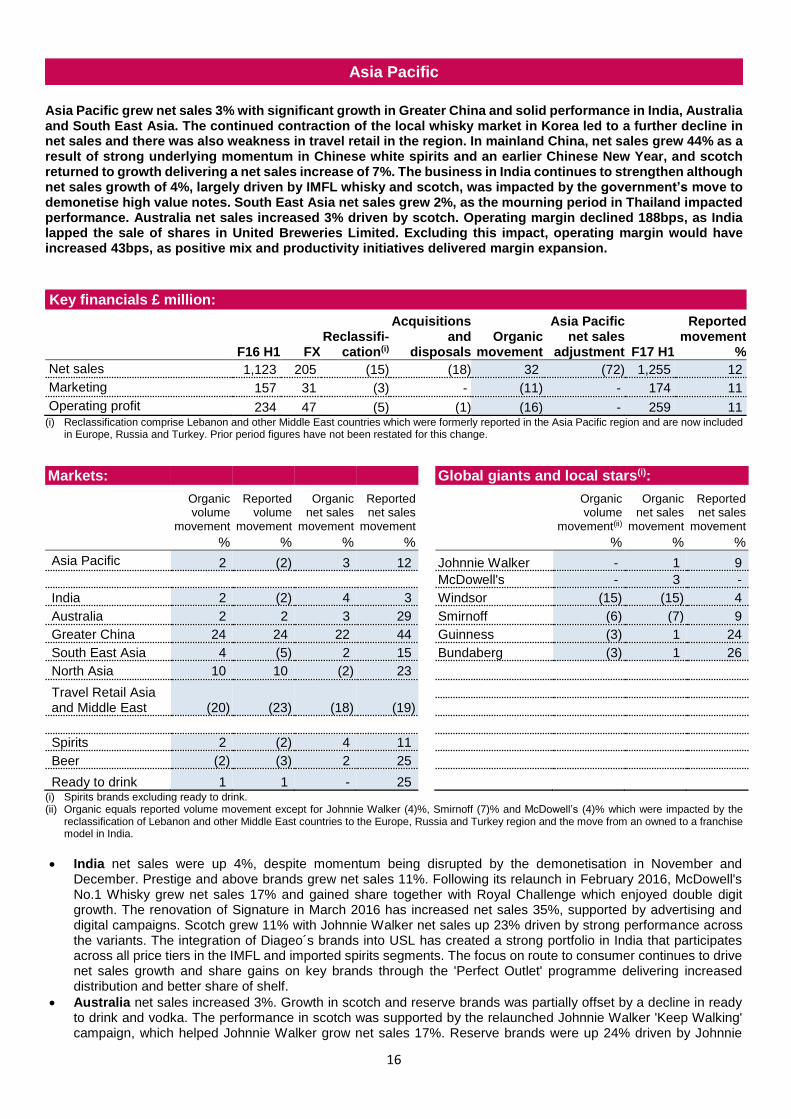
Asia Pacific grew net sales 3% with significant growth in Greater China and solid performance in India, Australia and South East Asia. The continued contraction of the local whisky market in Korea led to a further decline in net sales and there was also weakness in travel retail in the region. In mainland China, net sales grew 44% as a result of strong underlying momentum in Chinese white spirits and an earlier Chinese New Year, and scotch returned to growth delivering a net sales increase of 7%. The business in India continues to strengthen although net sales growth of 4%, largely driven by IMFL whisky and scotch, was impacted by the government’s move to demonetise high value notes. South East Asia net sales grew 2%, as the mourning period in Thailand impacted performance. Australia net sales increased 3% driven by scotch. Operating margin declined 188bps, as India lapped the sale of shares in United Breweries Limited. Excluding this impact, operating margin would have increased 43bps, as positive mix and productivity initiatives delivered margin expansion.
Key financials £ million:
F16 H1 FX Reclassifi-
cation(i)
Acquisitions and
disposals Organic
movement
Asia Pacific net sales
adjustment F17 H1
Reported movement
%
Net sales 1,123 205 (15) (18) 32 (72) 1,255 12
Marketing 157 31 (3) - (11) - 174 11
Operating profit 234 47 (5) (1) (16) - 259 11 (i) Reclassification comprise Lebanon and other Middle East countries which were formerly reported in the Asia Pacific region and are now included
in Europe, Russia and Turkey. Prior period figures have not been restated for this change.
Markets: Global giants and local stars(i):
Organic volume
movement
Reported volume
movement
Organic net sales
movement
Reported net sales
movement
Organic volume
movement(ii)
Organic net sales
movement
Reported net sales
movement
% % % % % % %
Asia Pacific 2 (2) 3 12 Johnnie Walker - 1 9
McDowell's - 3 -
India 2 (2) 4 3 Windsor (15) (15) 4
Australia 2 2 3 29 Smirnoff (6) (7) 9
Greater China 24 24 22 44 Guinness (3) 1 24
South East Asia 4 (5) 2 15 Bundaberg (3) 1 26
North Asia 10 10 (2) 23
Travel Retail Asia and Middle East (20) (23) (18) (19)
Spirits 2 (2) 4 11
Beer (2) (3) 2 25
Ready to drink 1 1 - 25 (i) Spirits brands excluding ready to drink. (ii) Organic equals reported volume movement except for Johnnie Walker (4)%, Smirnoff (7)% and McDowell’s (4)% which were impacted by the
reclassification of Lebanon and other Middle East countries to the Europe, Russia and Turkey region and the move from an owned to a franchise model in India.
India net sales were up 4%, despite momentum being disrupted by the demonetisation in November and December. Prestige and above brands grew net sales 11%. Following its relaunch in February 2016, McDowell's No.1 Whisky grew net sales 17% and gained share together with Royal Challenge which enjoyed double digit growth. The renovation of Signature in March 2016 has increased net sales 35%, supported by advertising and digital campaigns. Scotch grew 11% with Johnnie Walker net sales up 23% driven by strong performance across the variants. The integration of Diageo´s brands into USL has created a strong portfolio in India that participates across all price tiers in the IMFL and imported spirits segments. The focus on route to consumer continues to drive net sales growth and share gains on key brands through the 'Perfect Outlet' programme delivering increased distribution and better share of shelf.
Australia net sales increased 3%. Growth in scotch and reserve brands was partially offset by a decline in ready to drink and vodka. The performance in scotch was supported by the relaunched Johnnie Walker 'Keep Walking' campaign, which helped Johnnie Walker grow net sales 17%. Reserve brands were up 24% driven by Johnnie
17
Walker Blue Label, Lagavulin and Cîroc as consumers continue to premiumise within the spirits category. Whilst the ready to drink category remains challenged, the innovation launches of Bundaberg Lazy Bear, Pimm's RTD and Smirnoff Pure have seen early success in addressing consumer demand for low tempo refreshing drinks.
Greater China net sales grew 22%, driven by strong growth in mainland China. Chinese white spirits grew, benefitting significantly from an earlier Chinese New Year, with strong performance from Wellbay and Master Distiller No.8. Scotch grew net sales 5%, with share gains in deluxe and super deluxe categories in mainland China, driven by the performance of the Johnnie Walker portfolio in mainland China and Taiwan, partially offset by a decline in Hong Kong where the tough economic conditions have impacted the traditional on-trade.
South East Asia net sales grew 2%, with growth in Key Accounts and Indonesia, partially offset by declining net sales in Thailand and Vietnam. Indonesia net sales grew 5%, driven by growth in Johnnie Walker and the ready to drink category. The mourning period in Thailand impacted performance, with net sales declining 17% following the closure of on-trade outlets for the initial 30 days of mourning. Scotch saw marginal growth, driven by Key Accounts which lapped a period of planned inventory reduction.
North Asia net sales were down 2%. In Korea, net sales declined 8%, as Windsor suffered from the continued contraction of the traditional on-trade, and increased competition in lower alcohol by volume local whisky segments. This is partially offset by net sales growth of 44% for W ICE by Windsor, a low alcohol by volume variant, and in Guinness as the international beer category grows. In Japan, net sales were up 11% largely driven by scotch net sales growing 29%, capitalising on the growth of brown spirits.
Travel Retail Asia and Middle East net sales declined 18%, with lower spend by travellers and currency volatility having impacted performance. Geopolitical developments continue to impact the domestic and travel retail business in the Middle East.
Marketing reduced 6% with efficiencies reported across the region, a decline in Korea in line with the contracting scotch category and delayed activities in Thailand due to the mourning period. These reductions were partially offset by an increased spend on Chinese white spirits in Greater China to further strengthen brand equity and drive sustainable growth.
18
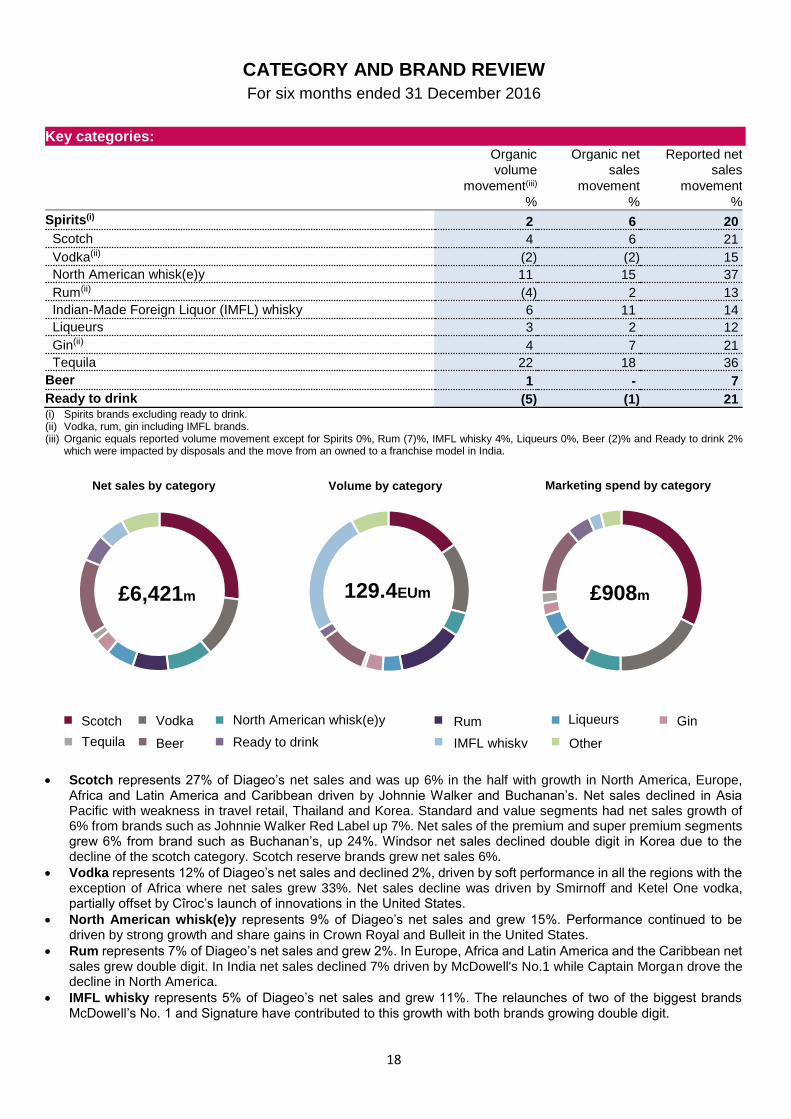
Net sales by category
£6,421m
Marketing spend by category
£908m
Volume by category
129.4EUm
CATEGORY AND BRAND REVIEW
For six months ended 31 December 2016
Key categories: Organic Organic net Reported net
volume sales sales
movement(iii) movement movement
% % %
Spirits(i) 2 6 20
Scotch 4 6 21
Vodka(ii) (2) (2) 15
North American whisk(e)y 11 15 37
Rum(ii) (4) 2 13
Indian-Made Foreign Liquor (IMFL) whisky 6 11 14
Liqueurs 3 2 12
Gin(ii) 4 7 21
Tequila 22 18 36
Beer 1 - 7
Ready to drink (5) (1) 21 (i) Spirits brands excluding ready to drink. (ii) Vodka, rum, gin including IMFL brands. (iii) Organic equals reported volume movement except for Spirits 0%, Rum (7)%, IMFL whisky 4%, Liqueurs 0%, Beer (2)% and Ready to drink 2%
which were impacted by disposals and the move from an owned to a franchise model in India.
Scotch represents 27% of Diageo’s net sales and was up 6% in the half with growth in North America, Europe, Africa and Latin America and Caribbean driven by Johnnie Walker and Buchanan’s. Net sales declined in Asia Pacific with weakness in travel retail, Thailand and Korea. Standard and value segments had net sales growth of 6% from brands such as Johnnie Walker Red Label up 7%. Net sales of the premium and super premium segments grew 6% from brand such as Buchanan’s, up 24%. Windsor net sales declined double digit in Korea due to the decline of the scotch category. Scotch reserve brands grew net sales 6%.
Vodka represents 12% of Diageo’s net sales and declined 2%, driven by soft performance in all the regions with the exception of Africa where net sales grew 33%. Net sales decline was driven by Smirnoff and Ketel One vodka, partially offset by Cîroc’s launch of innovations in the United States.
North American whisk(e)y represents 9% of Diageo’s net sales and grew 15%. Performance continued to be driven by strong growth and share gains in Crown Royal and Bulleit in the United States.
Rum represents 7% of Diageo’s net sales and grew 2%. In Europe, Africa and Latin America and the Caribbean net sales grew double digit. In India net sales declined 7% driven by McDowell's No.1 while Captain Morgan drove the decline in North America.
IMFL whisky represents 5% of Diageo’s net sales and grew 11%. The relaunches of two of the biggest brands McDowell’s No. 1 and Signature have contributed to this growth with both brands growing double digit.
Rum Liqueurs Gin
IMFL whisky Other
Scotch Vodka
Tequila Beer Ready to drink
North American whisk(e)y
19
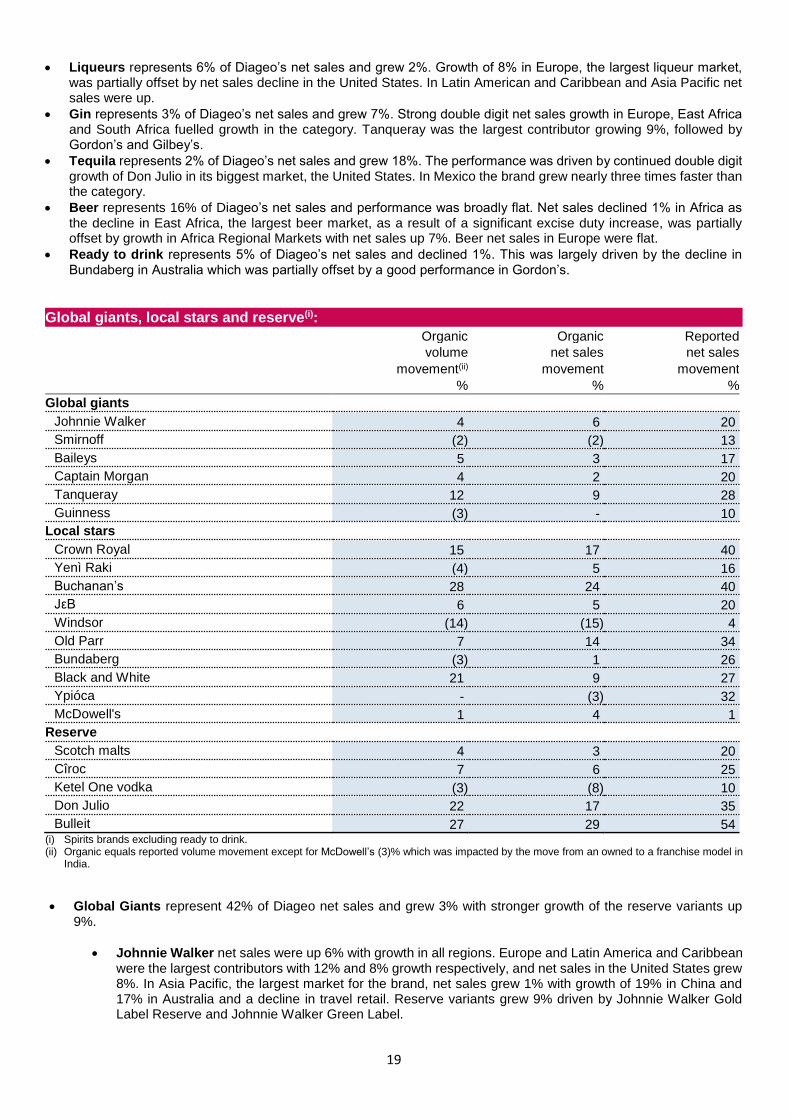
Liqueurs represents 6% of Diageo’s net sales and grew 2%. Growth of 8% in Europe, the largest liqueur market, was partially offset by net sales decline in the United States. In Latin American and Caribbean and Asia Pacific net sales were up.
Gin represents 3% of Diageo’s net sales and grew 7%. Strong double digit net sales growth in Europe, East Africa and South Africa fuelled growth in the category. Tanqueray was the largest contributor growing 9%, followed by Gordon’s and Gilbey’s.
Tequila represents 2% of Diageo’s net sales and grew 18%. The performance was driven by continued double digit growth of Don Julio in its biggest market, the United States. In Mexico the brand grew nearly three times faster than the category.
Beer represents 16% of Diageo’s net sales and performance was broadly flat. Net sales declined 1% in Africa as the decline in East Africa, the largest beer market, as a result of a significant excise duty increase, was partially offset by growth in Africa Regional Markets with net sales up 7%. Beer net sales in Europe were flat.
Ready to drink represents 5% of Diageo’s net sales and declined 1%. This was largely driven by the decline in Bundaberg in Australia which was partially offset by a good performance in Gordon’s.
Global giants, local stars and reserve(i):
Organic Organic Reported
volume net sales net sales
movement(ii) movement movement
% % %
Global giants
Johnnie Walker 4 6 20
Smirnoff (2) (2) 13
Baileys 5 3 17
Captain Morgan 4 2 20
Tanqueray 12 9 28
Guinness (3) - 10
Local stars
Crown Royal 15 17 40
Yenì Raki (4) 5 16
Buchanan’s 28 24 40
JεB 6 5 20
Windsor (14) (15) 4
Old Parr 7 14 34
Bundaberg (3) 1 26
Black and White 21 9 27
Ypióca - (3) 32
McDowell's 1 4 1
Reserve
Scotch malts 4 3 20
Cîroc 7 6 25
Ketel One vodka (3) (8) 10
Don Julio 22 17 35
Bulleit 27 29 54 (i) Spirits brands excluding ready to drink. (ii) Organic equals reported volume movement except for McDowell’s (3)% which was impacted by the move from an owned to a franchise model in
India.
Global Giants represent 42% of Diageo net sales and grew 3% with stronger growth of the reserve variants up 9%.
Johnnie Walker net sales were up 6% with growth in all regions. Europe and Latin America and Caribbean were the largest contributors with 12% and 8% growth respectively, and net sales in the United States grew 8%. In Asia Pacific, the largest market for the brand, net sales grew 1% with growth of 19% in China and 17% in Australia and a decline in travel retail. Reserve variants grew 9% driven by Johnnie Walker Gold Label Reserve and Johnnie Walker Green Label.
20
Smirnoff net sales declined 2%. In US Spirits depletions performance improved but net sales were down 5% following price adjustments to improve competitiveness and some negative mix. In Great Britain net sales declined as changes to the commercial footprint led efficiencies including inventory reduction. In Africa net sales grew 33% driven by the strong performance of innovations like Smirnoff 1818 in South Africa.
Baileys net sales grew 3%, driven by 10% growth in its biggest market, Europe, following an exceptional on-trade execution and positive results of the ‘Don’t mind if I Baileys’ advertising campaign. In US Spirits net sales declined 7%.
Captain Morgan net sales grew 2% due to a strong performance in Europe driven by the base variant Original Spiced growing double digit. In US Spirits net sales declined 1% with depletions growing faster than shipments as we continued to focus on inventory management to drive working capital efficiencies internally and through our distribution channels.
Tanqueray net sales grew 9% with Europe and Latin America and Caribbean largely driving the growth and other regions delivering good performance.
Guinness net sales were broadly flat. A decline in Africa with the exception of Africa Regional Markets which grew net sales up 5%, was partially offset by growth in Ireland driven by the success of Hop House 13 Lager, an innovation of the ‘Brewers Project’. In Latin America and Caribbean net sales were up high teens.
Local stars represent 21% of net sales and grew 12%, due to Crown Royal in North America growing 17% and Buchanan’s up 24%, largely in Latin America and Caribbean. Solid growth in Yenì Raki in Turkey and McDowell’s more than offset the declines in Windsor in Korea.
Reserve brands represent 16% of net sales and grew 9%. There was double digit growth in Chinese white spirits and strong performance in Don Julio with double digit sales growth in United States and Mexico. Scotch reserve brands grew 6% with Johnnie Walker driving the growth. Bulleit continued its strong growth with net sales up 29%. Tanqueray No. TEN grew 23%.
21
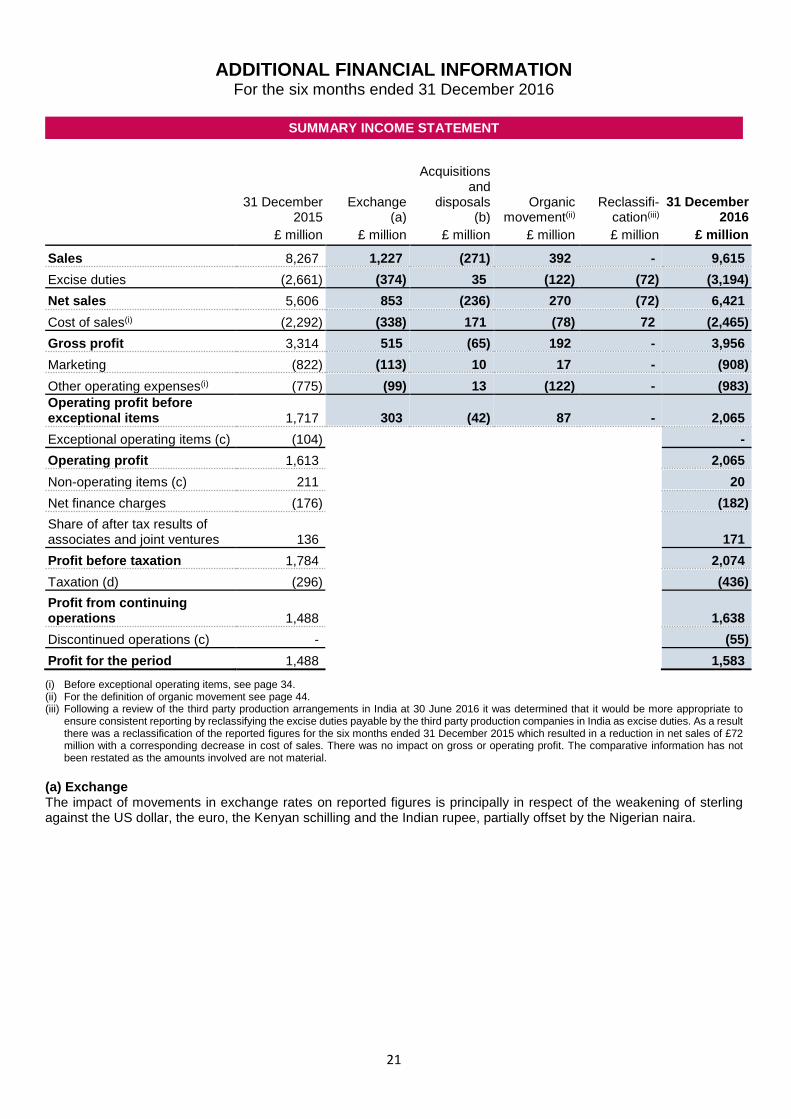
ADDITIONAL FINANCIAL INFORMATION
For the six months ended 31 December 2016
SUMMARY INCOME STATEMENT
31 December
2015 Exchange
(a)
Acquisitions and
disposals (b)
Organic movement(ii)
Reclassifi- cation(iii)
31 December 2016
£ million £ million £ million £ million £ million £ million
Sales 8,267 1,227 (271) 392 - 9,615
Excise duties (2,661) (374) 35 (122) (72) (3,194)
Net sales 5,606 853 (236) 270 (72) 6,421
Cost of sales(i) (2,292) (338) 171 (78) 72 (2,465)
Gross profit 3,314 515 (65) 192 - 3,956
Marketing (822) (113) 10 17 - (908)
Other operating expenses(i) (775) (99) 13 (122) - (983)
Operating profit before exceptional items 1,717 303 (42) 87 - 2,065
Exceptional operating items (c) (104) -
Operating profit 1,613 2,065
Non-operating items (c) 211 20
Net finance charges (176) (182)
Share of after tax results of associates and joint ventures 136 171
Profit before taxation 1,784 2,074
Taxation (d) (296) (436)
Profit from continuing operations 1,488 1,638
Discontinued operations (c) - 1 (55)
Profit for the period 1,488 1,583
(i) Before exceptional operating items, see page 34. (ii) For the definition of organic movement see page 44. (iii) Following a review of the third party production arrangements in India at 30 June 2016 it was determined that it would be more appropriate to
ensure consistent reporting by reclassifying the excise duties payable by the third party production companies in India as excise duties. As a result there was a reclassification of the reported figures for the six months ended 31 December 2015 which resulted in a reduction in net sales of £72 million with a corresponding decrease in cost of sales. There was no impact on gross or operating profit. The comparative information has not been restated as the amounts involved are not material.
(a) Exchange The impact of movements in exchange rates on reported figures is principally in respect of the weakening of sterling against the US dollar, the euro, the Kenyan schilling and the Indian rupee, partially offset by the Nigerian naira.
22
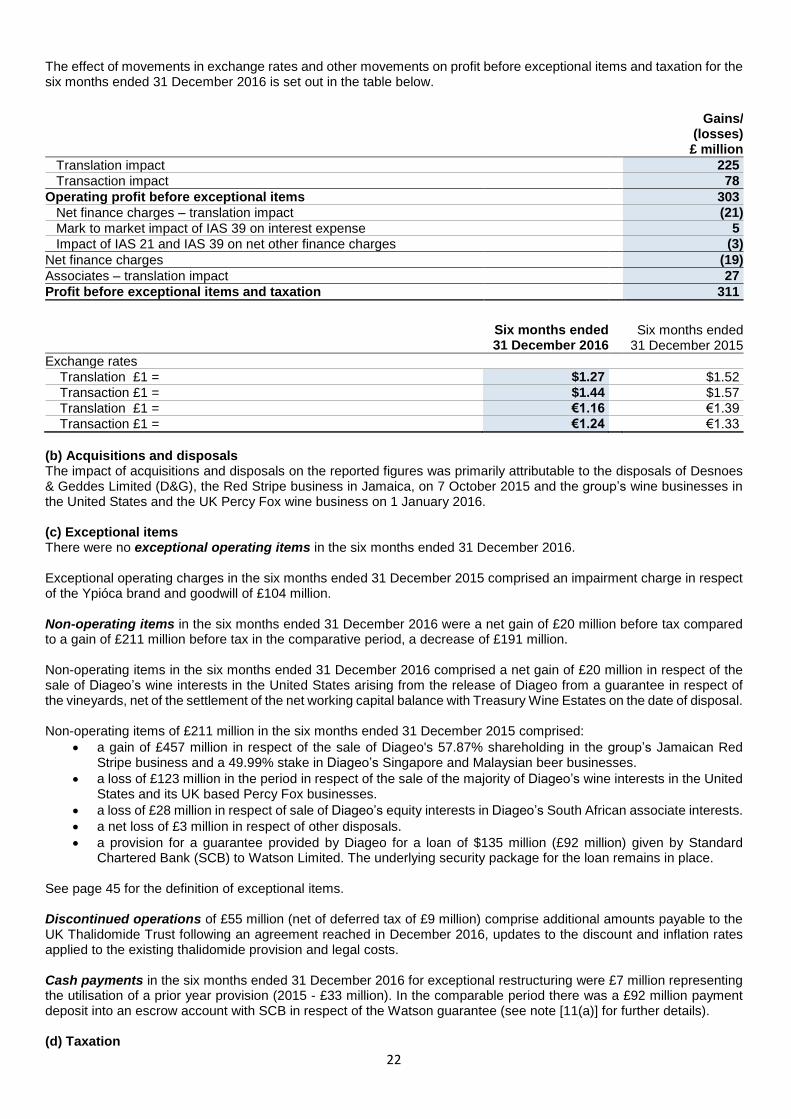
The effect of movements in exchange rates and other movements on profit before exceptional items and taxation for the six months ended 31 December 2016 is set out in the table below.
Gains/ (losses)
£ million
Translation impact 225
Transaction impact 78
Operating profit before exceptional items 303
Net finance charges – translation impact (21)
Mark to market impact of IAS 39 on interest expense 5
Impact of IAS 21 and IAS 39 on net other finance charges (3)
Net finance charges (19)
Associates – translation impact 27
Profit before exceptional items and taxation 311
Six months ended Six months ended 31 December 2016 31 December 2015
Exchange rates
Translation £1 = $1.27 $1.52
Transaction £1 = $1.44 $1.57
Translation £1 = €1.16 €1.39
Transaction £1 = €1.24 €1.33
(b) Acquisitions and disposals The impact of acquisitions and disposals on the reported figures was primarily attributable to the disposals of Desnoes & Geddes Limited (D&G), the Red Stripe business in Jamaica, on 7 October 2015 and the group’s wine businesses in the United States and the UK Percy Fox wine business on 1 January 2016. (c) Exceptional items There were no exceptional operating items in the six months ended 31 December 2016. Exceptional operating charges in the six months ended 31 December 2015 comprised an impairment charge in respect of the Ypióca brand and goodwill of £104 million. Non-operating items in the six months ended 31 December 2016 were a net gain of £20 million before tax compared to a gain of £211 million before tax in the comparative period, a decrease of £191 million. Non-operating items in the six months ended 31 December 2016 comprised a net gain of £20 million in respect of the sale of Diageo’s wine interests in the United States arising from the release of Diageo from a guarantee in respect of the vineyards, net of the settlement of the net working capital balance with Treasury Wine Estates on the date of disposal. Non-operating items of £211 million in the six months ended 31 December 2015 comprised:
a gain of £457 million in respect of the sale of Diageo's 57.87% shareholding in the group’s Jamaican Red Stripe business and a 49.99% stake in Diageo’s Singapore and Malaysian beer businesses.
a loss of £123 million in the period in respect of the sale of the majority of Diageo’s wine interests in the United States and its UK based Percy Fox businesses.
a loss of £28 million in respect of sale of Diageo’s equity interests in Diageo’s South African associate interests.
a net loss of £3 million in respect of other disposals.
a provision for a guarantee provided by Diageo for a loan of $135 million (£92 million) given by Standard Chartered Bank (SCB) to Watson Limited. The underlying security package for the loan remains in place.
See page 45 for the definition of exceptional items. Discontinued operations of £55 million (net of deferred tax of £9 million) comprise additional amounts payable to the UK Thalidomide Trust following an agreement reached in December 2016, updates to the discount and inflation rates applied to the existing thalidomide provision and legal costs. Cash payments in the six months ended 31 December 2016 for exceptional restructuring were £7 million representing the utilisation of a prior year provision (2015 - £33 million). In the comparable period there was a £92 million payment deposit into an escrow account with SCB in respect of the Watson guarantee (see note [11(a)] for further details). (d) Taxation
23
The reported tax rate for the six months ended 31 December 2016 was 21.0% compared with 16.6% for the six months ended 31 December 2015. The increase is mainly driven by exceptional items in the six months period ended 31 December 2015. The tax rate before exceptional items for the six months ended 31 December 2016 was 20.9% compared with 19.0% in the six months ended 31 December 2015. It is expected that the tax rate before exceptional items for the year ending 30 June 2017 will be approximately 21%. (e) Dividend The group aims to increase the dividend at each half-year and the decision as to the rate of the dividend increase is made with reference to dividend cover as well as the current performance trends including top and bottom line together with cash generation. Diageo targets dividend cover (the ratio of basic earnings per share before exceptional items to dividend per share) within the range of 1.8-2.2 times. For the year ended 30 June 2016 dividend cover was 1.5 times. It is expected that dividend increases will be maintained at roughly a mid-single digit rate until cover is back in range. An interim dividend of 23.7 pence per share will be paid to holders of ordinary shares and ADRs on the register as of 24 February 2017. The ex-dividend date is 23 February 2017. This represents an increase of 5% on last year’s interim dividend. The interim dividend will be paid to shareholders on 6 April 2017. Payment to US ADR holders will be made on 11 April 2017. A dividend reinvestment plan is available to holders of ordinary shares in respect of the interim dividend and the plan notice date is 16 March 2017.
24
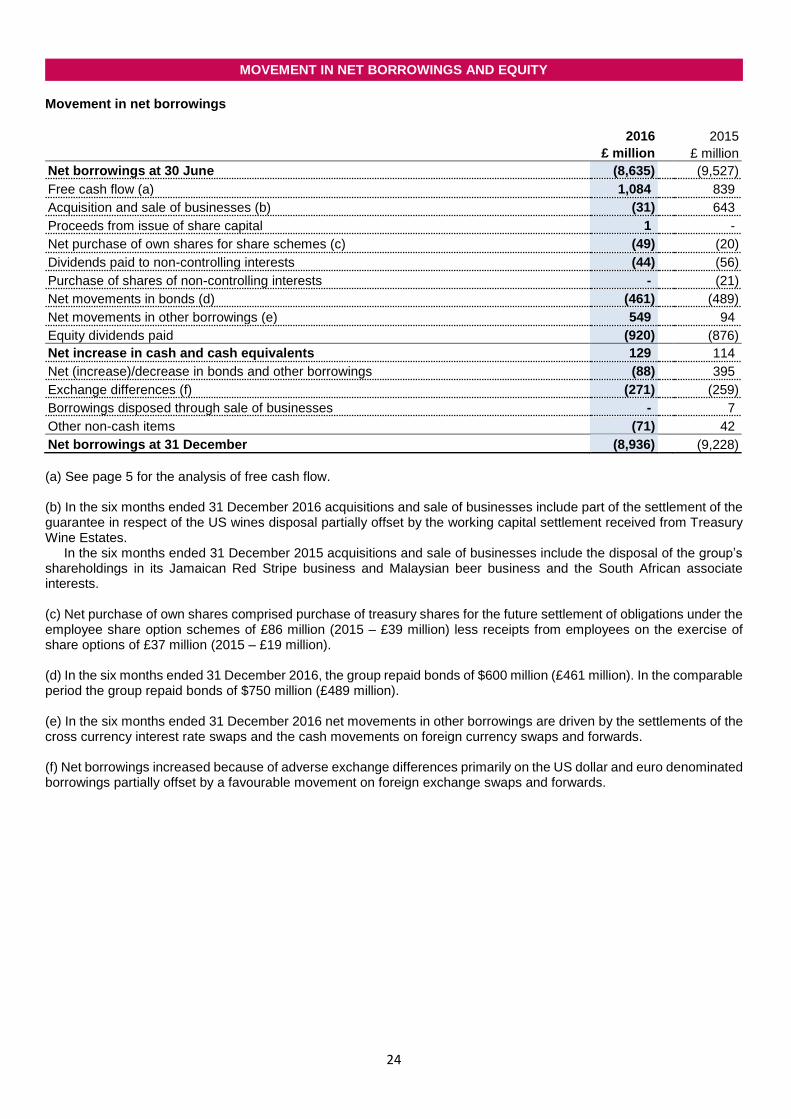
MOVEMENT IN NET BORROWINGS AND EQUITY
Movement in net borrowings
2016 2015
£ million £ million
Net borrowings at 30 June (8,635) (9,527)
Free cash flow (a) 1,084 839
Acquisition and sale of businesses (b) (31) 643
Proceeds from issue of share capital 1 -
Net purchase of own shares for share schemes (c) (49) (20)
Dividends paid to non-controlling interests (44) (56)
Purchase of shares of non-controlling interests - 1 (21)
Net movements in bonds (d) (461) (489)
Net movements in other borrowings (e) 549 94
Equity dividends paid (920) (876)
Net increase in cash and cash equivalents 129 114
Net (increase)/decrease in bonds and other borrowings (88) 395
Exchange differences (f) (271) (259)
Borrowings disposed through sale of businesses - 7
Other non-cash items (71) 42
Net borrowings at 31 December (8,936) (9,228)
(a) See page 5 for the analysis of free cash flow. (b) In the six months ended 31 December 2016 acquisitions and sale of businesses include part of the settlement of the guarantee in respect of the US wines disposal partially offset by the working capital settlement received from Treasury Wine Estates.
In the six months ended 31 December 2015 acquisitions and sale of businesses include the disposal of the group’s shareholdings in its Jamaican Red Stripe business and Malaysian beer business and the South African associate interests. (c) Net purchase of own shares comprised purchase of treasury shares for the future settlement of obligations under the employee share option schemes of £86 million (2015 – £39 million) less receipts from employees on the exercise of share options of £37 million (2015 – £19 million). (d) In the six months ended 31 December 2016, the group repaid bonds of $600 million (£461 million). In the comparable period the group repaid bonds of $750 million (£489 million). (e) In the six months ended 31 December 2016 net movements in other borrowings are driven by the settlements of the cross currency interest rate swaps and the cash movements on foreign currency swaps and forwards. (f) Net borrowings increased because of adverse exchange differences primarily on the US dollar and euro denominated borrowings partially offset by a favourable movement on foreign exchange swaps and forwards.
25
Movement in equity
2016 2015
£ million £ million
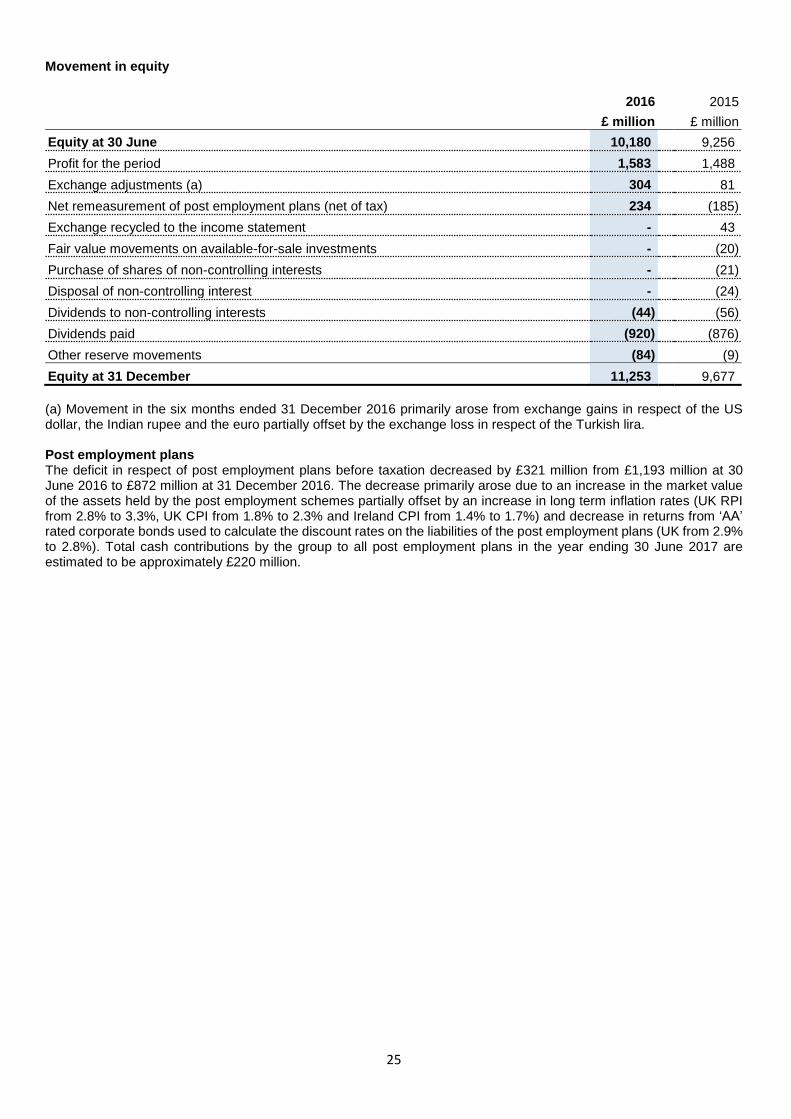
Equity at 30 June 10,180 9,256
Profit for the period 1,583 1,488
Exchange adjustments (a) 304 81
Net remeasurement of post employment plans (net of tax) 234 (185)
Exchange recycled to the income statement - 43
Fair value movements on available-for-sale investments - (20)
Purchase of shares of non-controlling interests - (21)
Disposal of non-controlling interest - (24)
Dividends to non-controlling interests (44) (56)
Dividends paid (920) (876)
Other reserve movements (84) (9)
Equity at 31 December 11,253 9,677
(a) Movement in the six months ended 31 December 2016 primarily arose from exchange gains in respect of the US dollar, the Indian rupee and the euro partially offset by the exchange loss in respect of the Turkish lira. Post employment plans The deficit in respect of post employment plans before taxation decreased by £321 million from £1,193 million at 30 June 2016 to £872 million at 31 December 2016. The decrease primarily arose due to an increase in the market value of the assets held by the post employment schemes partially offset by an increase in long term inflation rates (UK RPI from 2.8% to 3.3%, UK CPI from 1.8% to 2.3% and Ireland CPI from 1.4% to 1.7%) and decrease in returns from ‘AA’ rated corporate bonds used to calculate the discount rates on the liabilities of the post employment plans (UK from 2.9% to 2.8%). Total cash contributions by the group to all post employment plans in the year ending 30 June 2017 are estimated to be approximately £220 million.
26
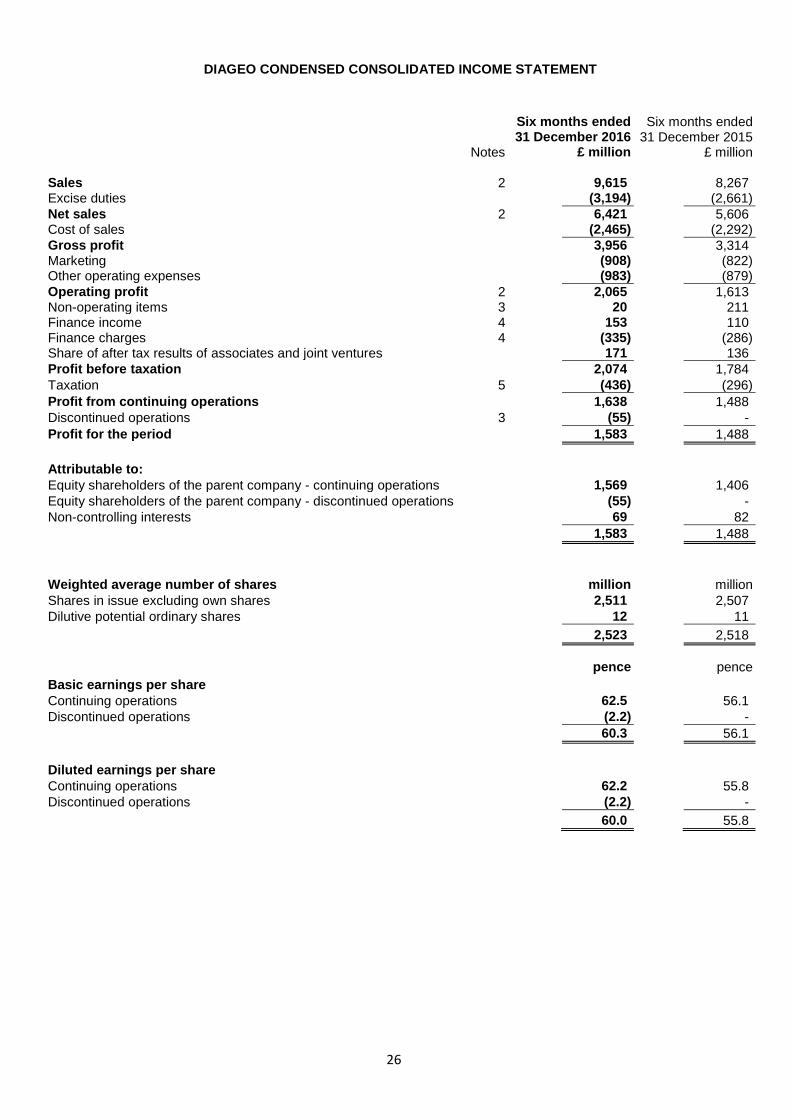
DIAGEO CONDENSED CONSOLIDATED INCOME STATEMENT
Six months ended Six months ended 31 December 2016 31 December 2015
Notes £ million £ million
Sales 2 9,615 8,267 Excise duties (3,194) (2,661)
Net sales 2 6,421 5,606 Cost of sales (2,465) (2,292)
Gross profit 3,956 3,314 Marketing (908) (822) Other operating expenses (983) (879)
Operating profit 2 2,065 1,613 Non-operating items 3 20 211 Finance income 4 153 110 Finance charges 4 (335) (286) Share of after tax results of associates and joint ventures 171 136
Profit before taxation 2,074 1,784
Taxation 5 (436) (296)
Profit from continuing operations 1,638 1,488
Discontinued operations 3 (55) -
Profit for the period 1,583 1,488
Attributable to:
Equity shareholders of the parent company - continuing operations 1,569 1,406
Equity shareholders of the parent company - discontinued operations (55) -
Non-controlling interests 69 82
1,583 1,488
Weighted average number of shares million million
Shares in issue excluding own shares 2,511 2,507
Dilutive potential ordinary shares 12 11
2,523 2,518
pence pence
Basic earnings per share Continuing operations 62.5 56.1
Discontinued operations (2.2) -
60.3 56.1
Diluted earnings per share Continuing operations 62.2 55.8
Discontinued operations (2.2) -
60.0 55.8
27
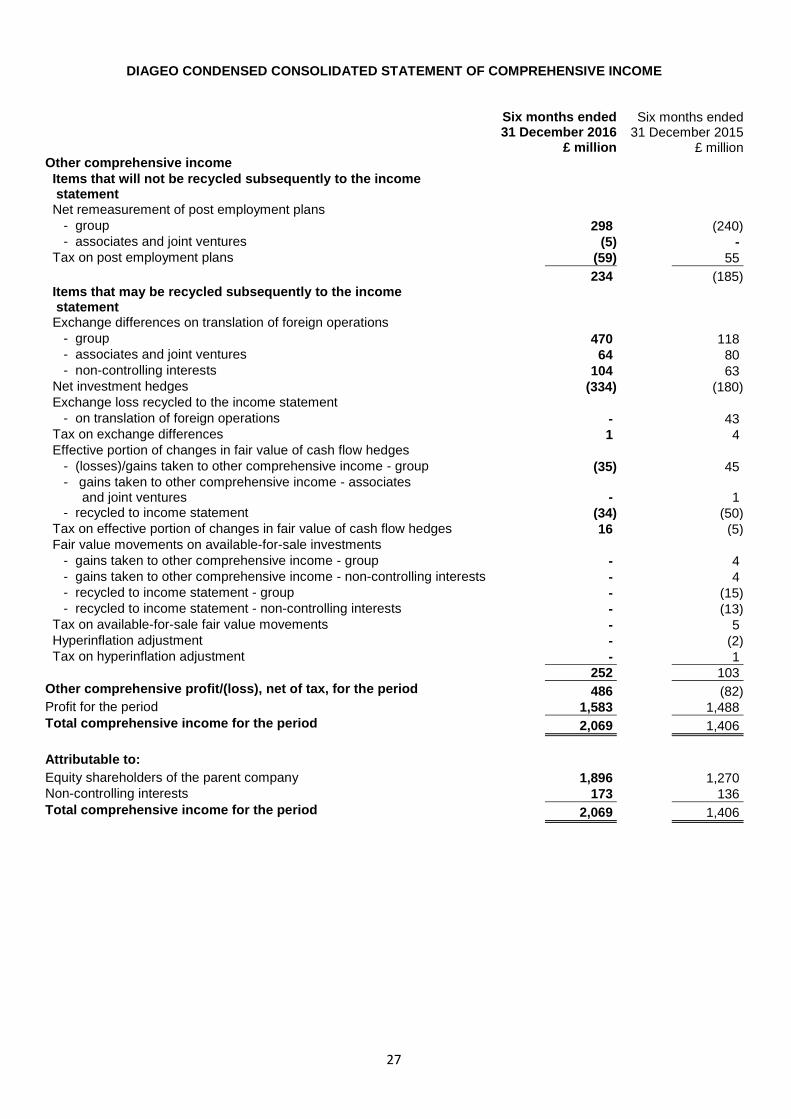
DIAGEO CONDENSED CONSOLIDATED STATEMENT OF COMPREHENSIVE INCOME
Six months ended Six months ended 31 December 2016 31 December 2015 £ million £ million Other comprehensive income
Items that will not be recycled subsequently to the income statement Net remeasurement of post employment plans
- group 298 (240) - associates and joint ventures (5) - Tax on post employment plans (59) 55
234 (185) Items that may be recycled subsequently to the income statement Exchange differences on translation of foreign operations - group 470 118 - associates and joint ventures 64 80 - non-controlling interests 104 63 Net investment hedges (334) (180) Exchange loss recycled to the income statement - on translation of foreign operations - 43 Tax on exchange differences 1 4 Effective portion of changes in fair value of cash flow hedges - (losses)/gains taken to other comprehensive income - group (35) 45 - gains taken to other comprehensive income - associates and joint ventures
- 1
- recycled to income statement (34) (50) Tax on effective portion of changes in fair value of cash flow hedges 16 (5) Fair value movements on available-for-sale investments - gains taken to other comprehensive income - group - 4 - gains taken to other comprehensive income - non-controlling interests - 4 - recycled to income statement - group - (15) - recycled to income statement - non-controlling interests - (13) Tax on available-for-sale fair value movements - 5 Hyperinflation adjustment - (2) Tax on hyperinflation adjustment - 1
252 103
Other comprehensive profit/(loss), net of tax, for the period 486 (82) Profit for the period 1,583 1,488
Total comprehensive income for the period 2,069 1,406
Attributable to: Equity shareholders of the parent company 1,896 1,270 Non-controlling interests 173 136
Total comprehensive income for the period 2,069 1,406
28
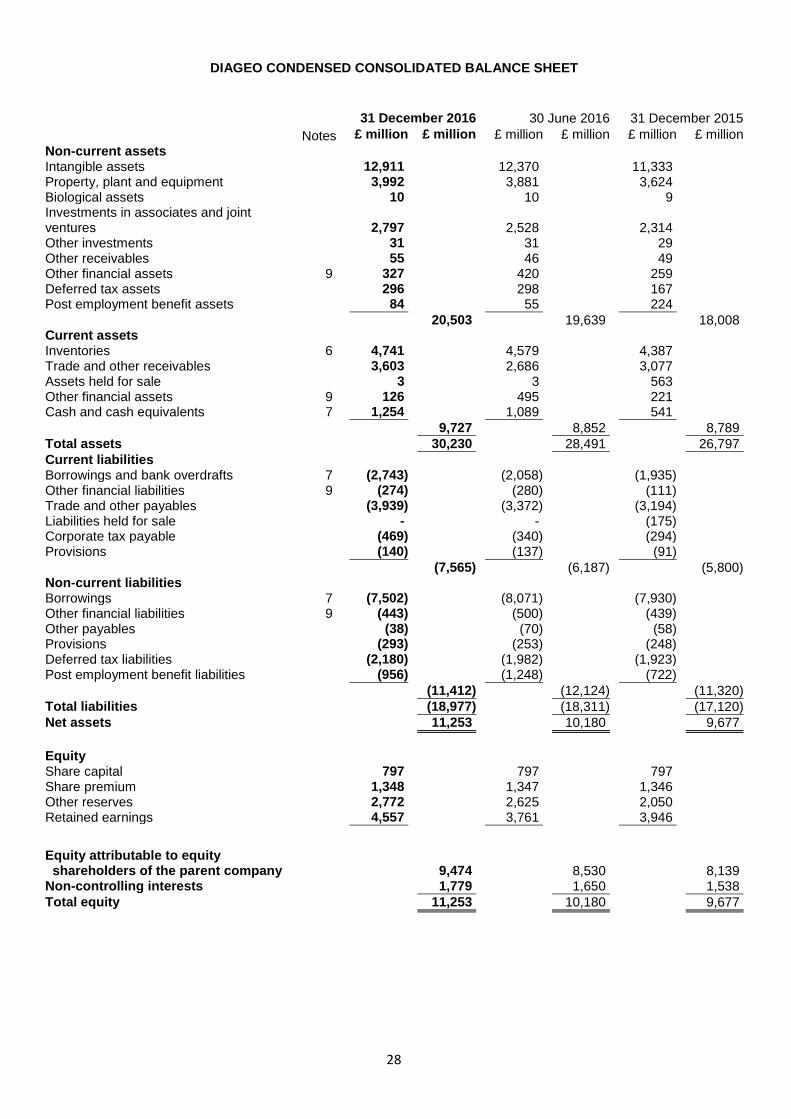
DIAGEO CONDENSED CONSOLIDATED BALANCE SHEET
31 December 2016 30 June 2016 31 December 2015
Notes £ million £ million £ million £ million £ million £ million
Non-current assets Intangible assets 12,911 12,370 11,333 Property, plant and equipment 3,992 3,881 3,624 Biological assets 10 10 9 Investments in associates and joint ventures
2,797 2,528 2,314
Other investments 31 31 29 Other receivables 55 46 49 Other financial assets 9 327 420 259 Deferred tax assets 296 298 167 Post employment benefit assets 84 55 224
20,503 19,639 18,008 Current assets Inventories 6 4,741 4,579 4,387 Trade and other receivables 3,603 2,686 3,077 Assets held for sale 3 3 563 Other financial assets 9 126 495 221 Cash and cash equivalents 7 1,254 1,089 541
9,727 8,852 8,789
Total assets 30,230 28,491 26,797
Current liabilities Borrowings and bank overdrafts 7 (2,743) (2,058) (1,935) Other financial liabilities 9 (274) (280) (111) Trade and other payables (3,939) (3,372) (3,194) Liabilities held for sale - - (175) Corporate tax payable (469) (340) (294) Provisions (140) (137) (91)
(7,565) (6,187) (5,800) Non-current liabilities Borrowings 7 (7,502) (8,071) (7,930) Other financial liabilities 9 (443) (500) (439) Other payables (38) (70) (58) Provisions (293) (253) (248) Deferred tax liabilities (2,180) (1,982) (1,923) Post employment benefit liabilities (956) (1,248) (722)
(11,412) (12,124) (11,320)
Total liabilities (18,977) (18,311) (17,120)
Net assets 11,253 10,180 9,677
Equity Share capital 797 797 797 Share premium 1,348 1,347 1,346 Other reserves 2,772 2,625 2,050 Retained earnings 4,557 3,761 3,946
Equity attributable to equity shareholders of the parent company
9,474 8,530 8,139 Non-controlling interests 1,779 1,650 1,538
Total equity 11,253 10,180 9,677
29
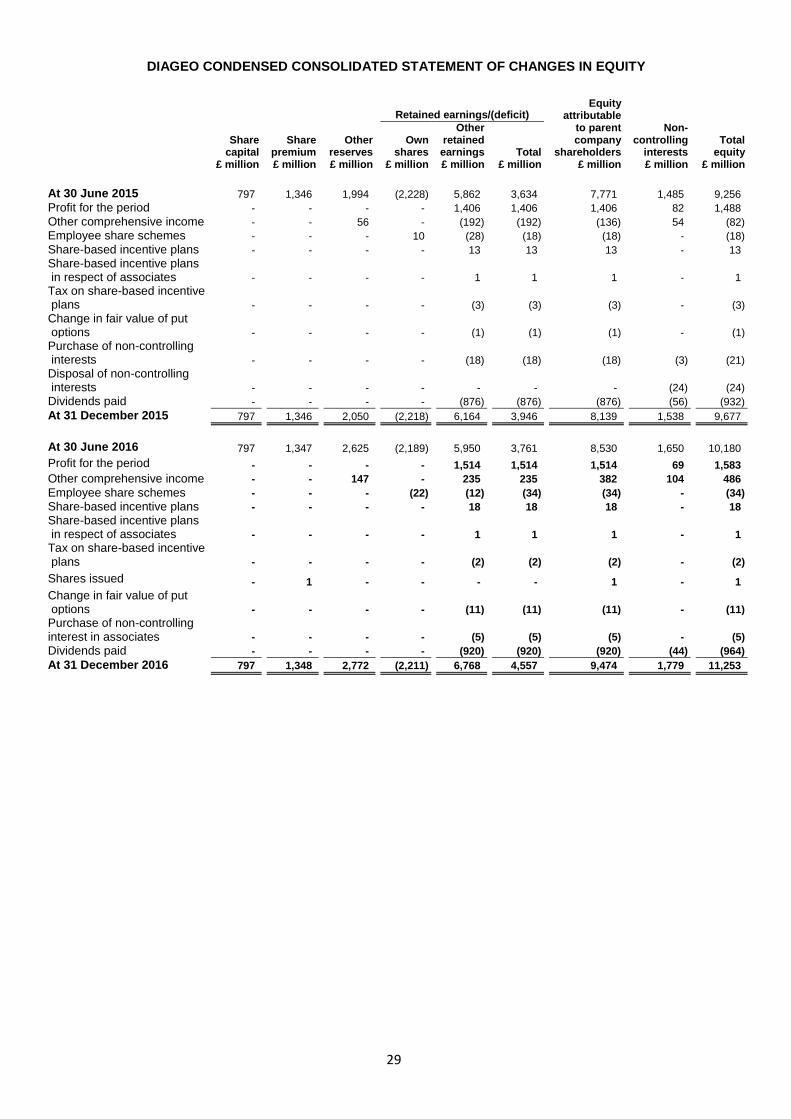
DIAGEO CONDENSED CONSOLIDATED STATEMENT OF CHANGES IN EQUITY
Equity attributable
to parent company
shareholders
Retained earnings/(deficit)
Share capital
Share premium
Other reserves
Own shares
Other retained earnings Total
Non- controlling
interests Total
equity £ million £ million £ million £ million £ million £ million £ million £ million £ million
At 30 June 2015 797 1,346 1,994 (2,228) 5,862 3,634 7,771 1,485 9,256
Profit for the period - - - - 1,406 1,406 1,406 82 1,488
Other comprehensive income - - 56 - (192) (192) (136) 54 (82)
Employee share schemes - - - 10 (28) (18) (18) - (18)
Share-based incentive plans - - - - 13 13 13 - 13
Share-based incentive plans in respect of associates -
-
-
-
1
1
1
-
1
Tax on share-based incentive plans -
-
-
-
(3)
(3)
(3)
-
(3)
Change in fair value of put options -
-
-
-
(1)
(1)
(1)
-
(1)
Purchase of non-controlling interests - - - - (18) (18) (18) (3) (21)
Disposal of non-controlling interests -
-
-
-
-
-
-
(24)
(24)
Dividends paid - - - - (876) (876) (876) (56) (932)
At 31 December 2015 797 1,346 2,050 (2,218) 6,164 3,946 8,139 1,538 9,677
1
At 30 June 2016 797 1,347 2,625 (2,189) 5,950 3,761 8,530 1,650 10,180
Profit for the period - - - - 1,514 1,514 1,514 69 1,583
Other comprehensive income - - 147 - 235 235 382 104 486
Employee share schemes - - - (22) (12) (34) (34) - (34)
Share-based incentive plans - - - - 18 18 18 - 18
Share-based incentive plans in respect of associates -
-
-
-
1
1
1
-
1
Tax on share-based incentive plans -
-
-
-
(2)
(2)
(2)
-
(2)
Shares issued - 1 - - - - 1 - 1
Change in fair value of put options -
-
-
-
(11)
(11)
(11)
-
(11)
Purchase of non-controlling interest in associates -
-
-
-
(5)
(5)
(5)
-
(5)
Dividends paid - - - - (920) (920) (920) (44) (964)
At 31 December 2016 797 1,348 2,772 (2,211) 6,768 4,557 9,474 1,779 11,253
30
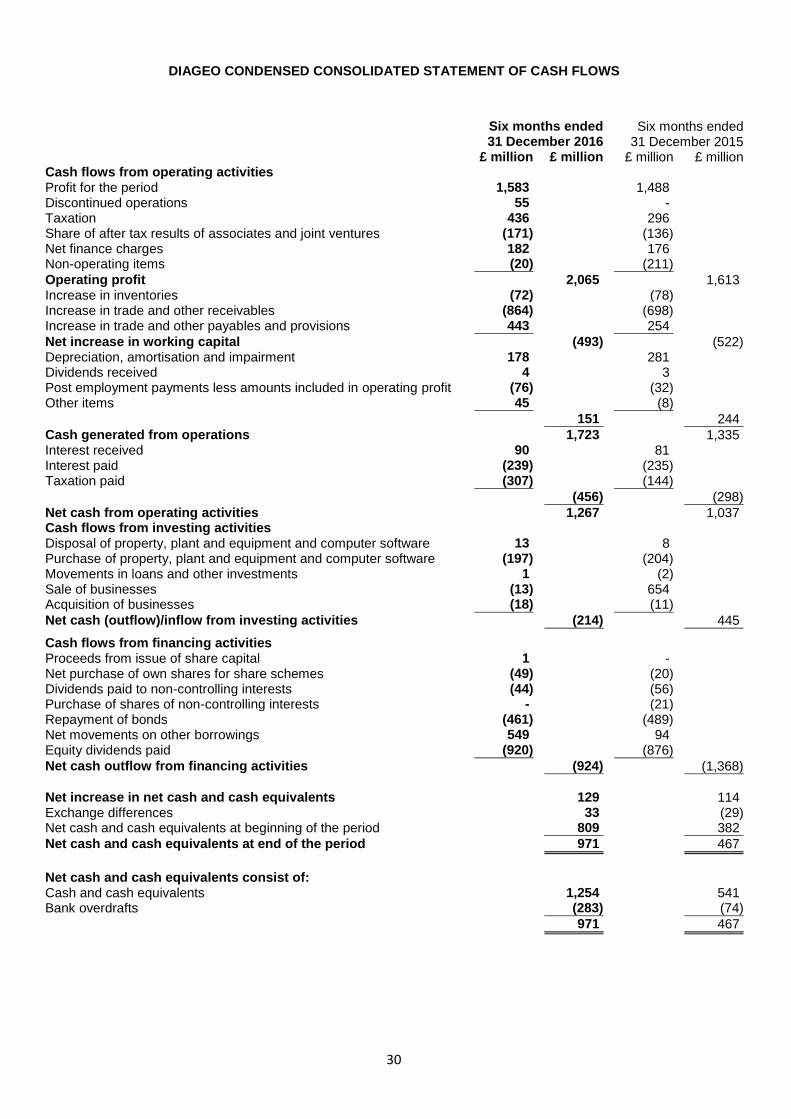
DIAGEO CONDENSED CONSOLIDATED STATEMENT OF CASH FLOWS
Six months ended Six months ended 31 December 2016 31 December 2015 £ million £ million £ million £ million Cash flows from operating activities Profit for the period 1,583 1,488 Discontinued operations 55 - Taxation 436 296 Share of after tax results of associates and joint ventures (171) (136) Net finance charges 182 176 Non-operating items (20) (211)
Operating profit 2,065 1,613 Increase in inventories (72) (78) Increase in trade and other receivables (864) (698) Increase in trade and other payables and provisions 443 254
Net increase in working capital (493) (522) Depreciation, amortisation and impairment 178 281 Dividends received 4 3 Post employment payments less amounts included in operating profit (76) (32) Other items 45 (8)
151 244
Cash generated from operations 1,723 1,335 Interest received 90 81 Interest paid (239) (235) Taxation paid (307) (144)
(456) (298)
Net cash from operating activities 1,267 1,037 Cash flows from investing activities Disposal of property, plant and equipment and computer software 13 8 Purchase of property, plant and equipment and computer software (197) (204) Movements in loans and other investments 1 (2) Sale of businesses (13) 654 Acquisition of businesses (18) (11)
Net cash (outflow)/inflow from investing activities (214) 445
Cash flows from financing activities
Proceeds from issue of share capital 1 - Net purchase of own shares for share schemes (49) (20) Dividends paid to non-controlling interests (44) (56) Purchase of shares of non-controlling interests - (21) Repayment of bonds (461) (489) Net movements on other borrowings 549 94 Equity dividends paid (920) (876)
Net cash outflow from financing activities (924) (1,368)
Net increase in net cash and cash equivalents 129 114 Exchange differences 33 (29) Net cash and cash equivalents at beginning of the period 809 382
Net cash and cash equivalents at end of the period 971 467
Net cash and cash equivalents consist of: Cash and cash equivalents 1,254 541 Bank overdrafts (283) (74)
971 467
31
NOTES
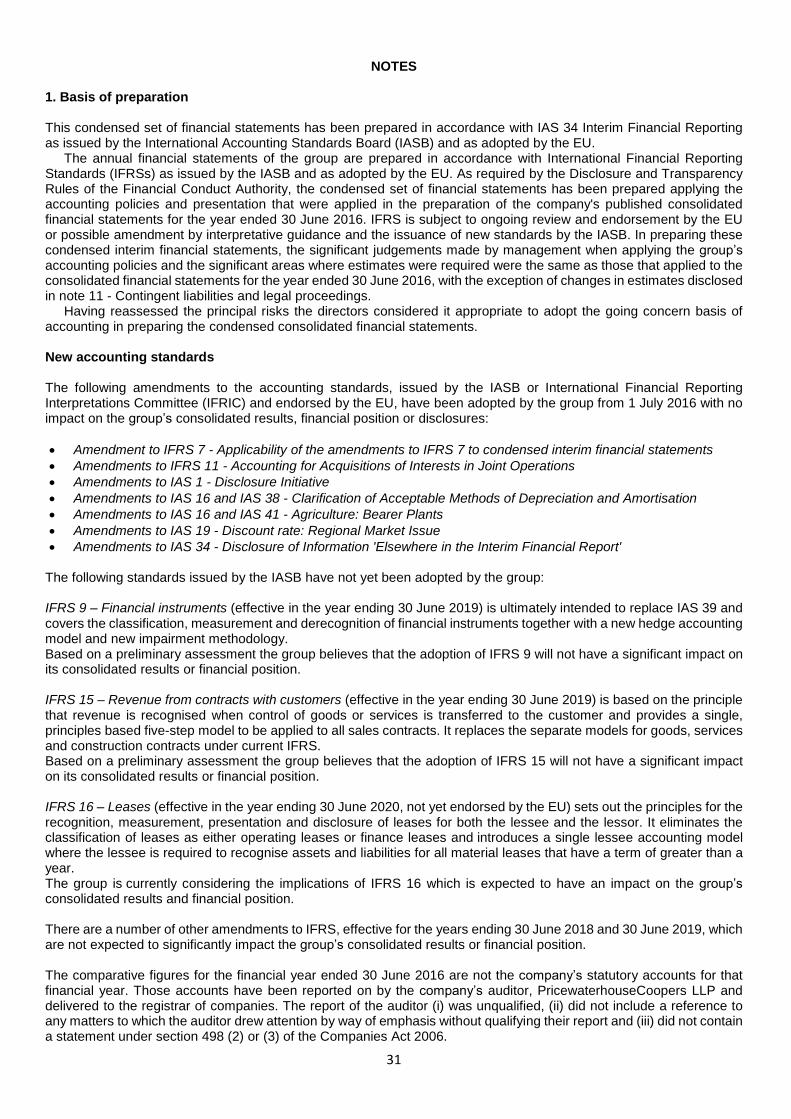
1. Basis of preparation This condensed set of financial statements has been prepared in accordance with IAS 34 Interim Financial Reporting as issued by the International Accounting Standards Board (IASB) and as adopted by the EU.
The annual financial statements of the group are prepared in accordance with International Financial Reporting Standards (IFRSs) as issued by the IASB and as adopted by the EU. As required by the Disclosure and Transparency Rules of the Financial Conduct Authority, the condensed set of financial statements has been prepared applying the accounting policies and presentation that were applied in the preparation of the company's published consolidated financial statements for the year ended 30 June 2016. IFRS is subject to ongoing review and endorsement by the EU or possible amendment by interpretative guidance and the issuance of new standards by the IASB. In preparing these condensed interim financial statements, the significant judgements made by management when applying the group’s accounting policies and the significant areas where estimates were required were the same as those that applied to the consolidated financial statements for the year ended 30 June 2016, with the exception of changes in estimates disclosed in note 11 - Contingent liabilities and legal proceedings.
Having reassessed the principal risks the directors considered it appropriate to adopt the going concern basis of accounting in preparing the condensed consolidated financial statements. New accounting standards The following amendments to the accounting standards, issued by the IASB or International Financial Reporting Interpretations Committee (IFRIC) and endorsed by the EU, have been adopted by the group from 1 July 2016 with no impact on the group’s consolidated results, financial position or disclosures:
Amendment to IFRS 7 - Applicability of the amendments to IFRS 7 to condensed interim financial statements
Amendments to IFRS 11 - Accounting for Acquisitions of Interests in Joint Operations
Amendments to IAS 1 - Disclosure Initiative
Amendments to IAS 16 and IAS 38 - Clarification of Acceptable Methods of Depreciation and Amortisation
Amendments to IAS 16 and IAS 41 - Agriculture: Bearer Plants
Amendments to IAS 19 - Discount rate: Regional Market Issue
Amendments to IAS 34 - Disclosure of Information 'Elsewhere in the Interim Financial Report' The following standards issued by the IASB have not yet been adopted by the group: IFRS 9 – Financial instruments (effective in the year ending 30 June 2019) is ultimately intended to replace IAS 39 and covers the classification, measurement and derecognition of financial instruments together with a new hedge accounting model and new impairment methodology. Based on a preliminary assessment the group believes that the adoption of IFRS 9 will not have a significant impact on its consolidated results or financial position. IFRS 15 – Revenue from contracts with customers (effective in the year ending 30 June 2019) is based on the principle that revenue is recognised when control of goods or services is transferred to the customer and provides a single, principles based five-step model to be applied to all sales contracts. It replaces the separate models for goods, services and construction contracts under current IFRS. Based on a preliminary assessment the group believes that the adoption of IFRS 15 will not have a significant impact on its consolidated results or financial position. IFRS 16 – Leases (effective in the year ending 30 June 2020, not yet endorsed by the EU) sets out the principles for the recognition, measurement, presentation and disclosure of leases for both the lessee and the lessor. It eliminates the classification of leases as either operating leases or finance leases and introduces a single lessee accounting model where the lessee is required to recognise assets and liabilities for all material leases that have a term of greater than a year. The group is currently considering the implications of IFRS 16 which is expected to have an impact on the group’s consolidated results and financial position. There are a number of other amendments to IFRS, effective for the years ending 30 June 2018 and 30 June 2019, which are not expected to significantly impact the group’s consolidated results or financial position. The comparative figures for the financial year ended 30 June 2016 are not the company’s statutory accounts for that financial year. Those accounts have been reported on by the company’s auditor, PricewaterhouseCoopers LLP and delivered to the registrar of companies. The report of the auditor (i) was unqualified, (ii) did not include a reference to any matters to which the auditor drew attention by way of emphasis without qualifying their report and (iii) did not contain a statement under section 498 (2) or (3) of the Companies Act 2006.
32
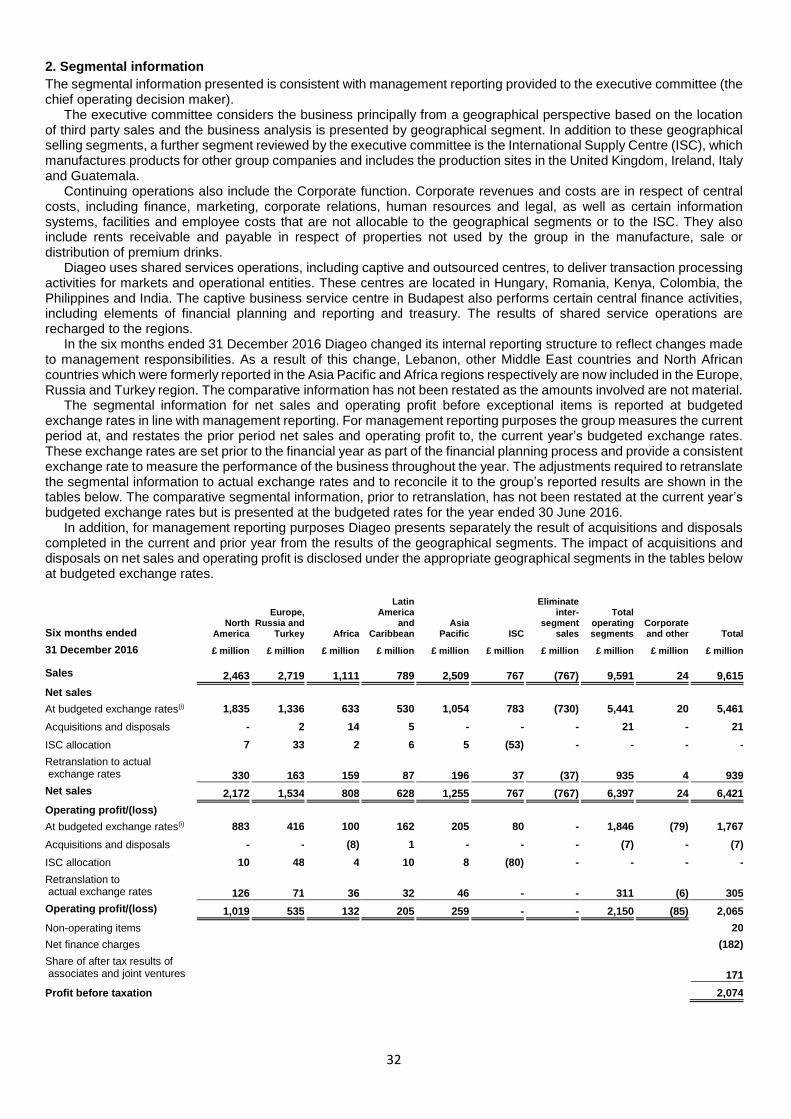
2. Segmental information
The segmental information presented is consistent with management reporting provided to the executive committee (the chief operating decision maker).
The executive committee considers the business principally from a geographical perspective based on the location of third party sales and the business analysis is presented by geographical segment. In addition to these geographical selling segments, a further segment reviewed by the executive committee is the International Supply Centre (ISC), which manufactures products for other group companies and includes the production sites in the United Kingdom, Ireland, Italy and Guatemala.
Continuing operations also include the Corporate function. Corporate revenues and costs are in respect of central costs, including finance, marketing, corporate relations, human resources and legal, as well as certain information systems, facilities and employee costs that are not allocable to the geographical segments or to the ISC. They also include rents receivable and payable in respect of properties not used by the group in the manufacture, sale or distribution of premium drinks.
Diageo uses shared services operations, including captive and outsourced centres, to deliver transaction processing activities for markets and operational entities. These centres are located in Hungary, Romania, Kenya, Colombia, the Philippines and India. The captive business service centre in Budapest also performs certain central finance activities, including elements of financial planning and reporting and treasury. The results of shared service operations are recharged to the regions.
In the six months ended 31 December 2016 Diageo changed its internal reporting structure to reflect changes made to management responsibilities. As a result of this change, Lebanon, other Middle East countries and North African countries which were formerly reported in the Asia Pacific and Africa regions respectively are now included in the Europe, Russia and Turkey region. The comparative information has not been restated as the amounts involved are not material.
The segmental information for net sales and operating profit before exceptional items is reported at budgeted exchange rates in line with management reporting. For management reporting purposes the group measures the current period at, and restates the prior period net sales and operating profit to, the current year’s budgeted exchange rates. These exchange rates are set prior to the financial year as part of the financial planning process and provide a consistent exchange rate to measure the performance of the business throughout the year. The adjustments required to retranslate the segmental information to actual exchange rates and to reconcile it to the group’s reported results are shown in the tables below. The comparative segmental information, prior to retranslation, has not been restated at the current year’s budgeted exchange rates but is presented at the budgeted rates for the year ended 30 June 2016.
In addition, for management reporting purposes Diageo presents separately the result of acquisitions and disposals completed in the current and prior year from the results of the geographical segments. The impact of acquisitions and disposals on net sales and operating profit is disclosed under the appropriate geographical segments in the tables below at budgeted exchange rates.
Six months ended North
America
Europe, Russia and
Turkey Africa
Latin America
and Caribbean
Asia Pacific ISC
Eliminate inter-
segment sales
Total operating segments
Corporate and other Total
31 December 2016 £ million £ million £ million £ million £ million £ million £ million £ million £ million £ million 1 1 1 1 1 1 1 1 1 1
Sales 2,463 2,719 1,111 789 2,509 767 (767) 9,591 24 9,615
Net sales
At budgeted exchange rates(i) 1,835 1,336 633 530 1,054 783 (730) 5,441 20 5,461
Acquisitions and disposals - 2 14 5 - - - 21 - 21
ISC allocation 7 33 2 6 5 (53) - - - -
Retranslation to actual exchange rates 330 163 159 87 196 37 (37) 935 4 939
Net sales 2,172 1,534 808 628 1,255 767 (767) 6,397 24 6,421
Operating profit/(loss)
At budgeted exchange rates(i) 883 416 100 162 205 80 - 1,846 (79) 1,767
Acquisitions and disposals - - (8) 1 - - - (7) - (7)
ISC allocation 10 48 4 10 8 (80) - - - -
Retranslation to actual exchange rates 126 71 36 32 46 - - 311 (6) 305
Operating profit/(loss) 1,019 535 132 205 259 - - 2,150 (85) 2,065
Non-operating items 20
Net finance charges (182)
Share of after tax results of associates and joint ventures
171
Profit before taxation 2,074
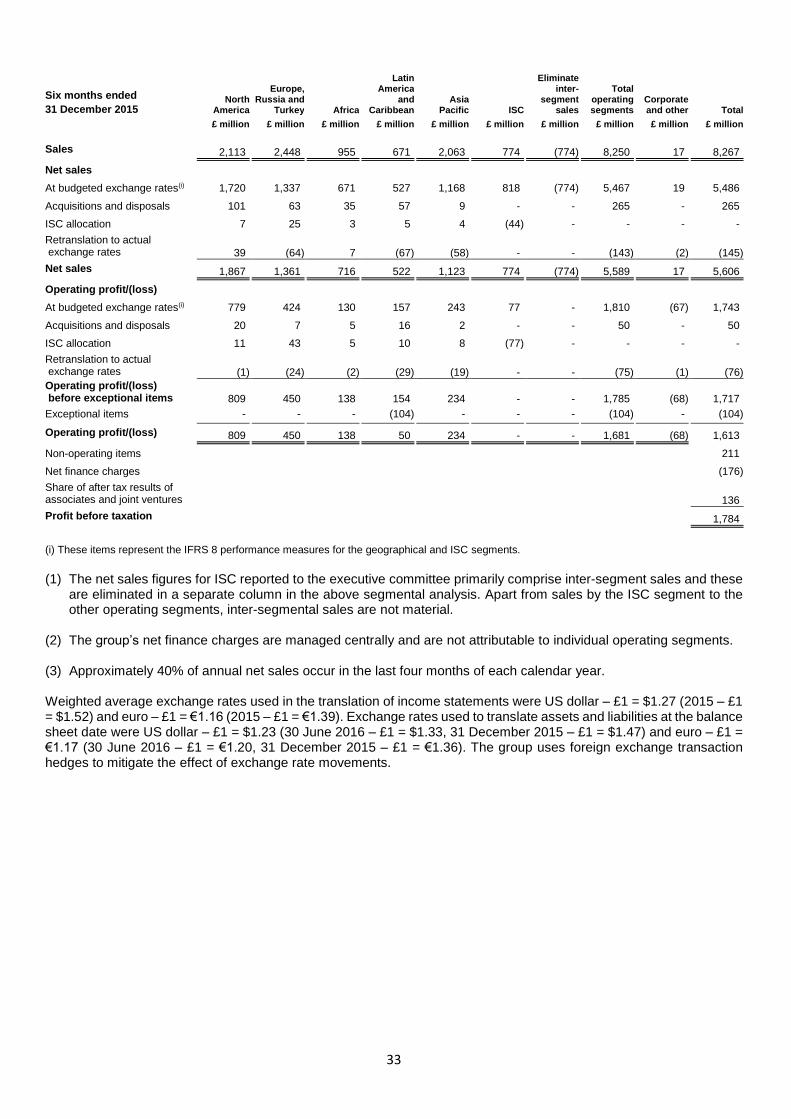
33
Six months ended North America
Europe,
Russia and Turkey
Africa
Latin America
and Caribbean
Asia Pacific
ISC
Eliminate inter-
segment sales
Total
operating segments
Corporate and other
Total 31 December 2015
£ million £ million £ million £ million £ million £ million £ million £ million £ million £ million
Sales 2,113 2,448 955 671 2,063 774 (774) 8,250 17 8,267
Net sales
At budgeted exchange rates(i) 1,720 1,337 671 527 1,168 818 (774) 5,467 19 5,486
Acquisitions and disposals 101 63 35 57 9 - - 265 - 265
ISC allocation 7 25 3 5 4 (44) - - - -
Retranslation to actual exchange rates 39 (64) 7 (67) (58) - - (143) (2) (145)
Net sales 1,867 1,361 716 522 1,123 774 (774) 5,589 17 5,606
Operating profit/(loss)
At budgeted exchange rates(i) 779 424 130 157 243 77 - 1,810 (67) 1,743
Acquisitions and disposals 20 7 5 16 2 - - 50 - 50
ISC allocation 11 43 5 10 8 (77) - - - -
Retranslation to actual exchange rates (1) (24) (2) (29) (19) - - (75) (1) (76)
Operating profit/(loss) before exceptional items 809 450 138 154 234 - - 1,785 (68) 1,717
Exceptional items - - - (104) - - - (104) - (104)
Operating profit/(loss) 809 450 138 50 234 - - 1,681 (68) 1,613
Non-operating items 211
Net finance charges (176)
Share of after tax results of associates and joint ventures
136
Profit before taxation 1,784
(i) These items represent the IFRS 8 performance measures for the geographical and ISC segments.
(1) The net sales figures for ISC reported to the executive committee primarily comprise inter-segment sales and these
are eliminated in a separate column in the above segmental analysis. Apart from sales by the ISC segment to the other operating segments, inter-segmental sales are not material.
(2) The group’s net finance charges are managed centrally and are not attributable to individual operating segments. (3) Approximately 40% of annual net sales occur in the last four months of each calendar year. Weighted average exchange rates used in the translation of income statements were US dollar – £1 = $1.27 (2015 – £1 = $1.52) and euro – £1 = €1.16 (2015 – £1 = €1.39). Exchange rates used to translate assets and liabilities at the balance sheet date were US dollar – £1 = $1.23 (30 June 2016 – £1 = $1.33, 31 December 2015 – £1 = $1.47) and euro – £1 = €1.17 (30 June 2016 – £1 = €1.20, 31 December 2015 – £1 = €1.36). The group uses foreign exchange transaction hedges to mitigate the effect of exchange rate movements.
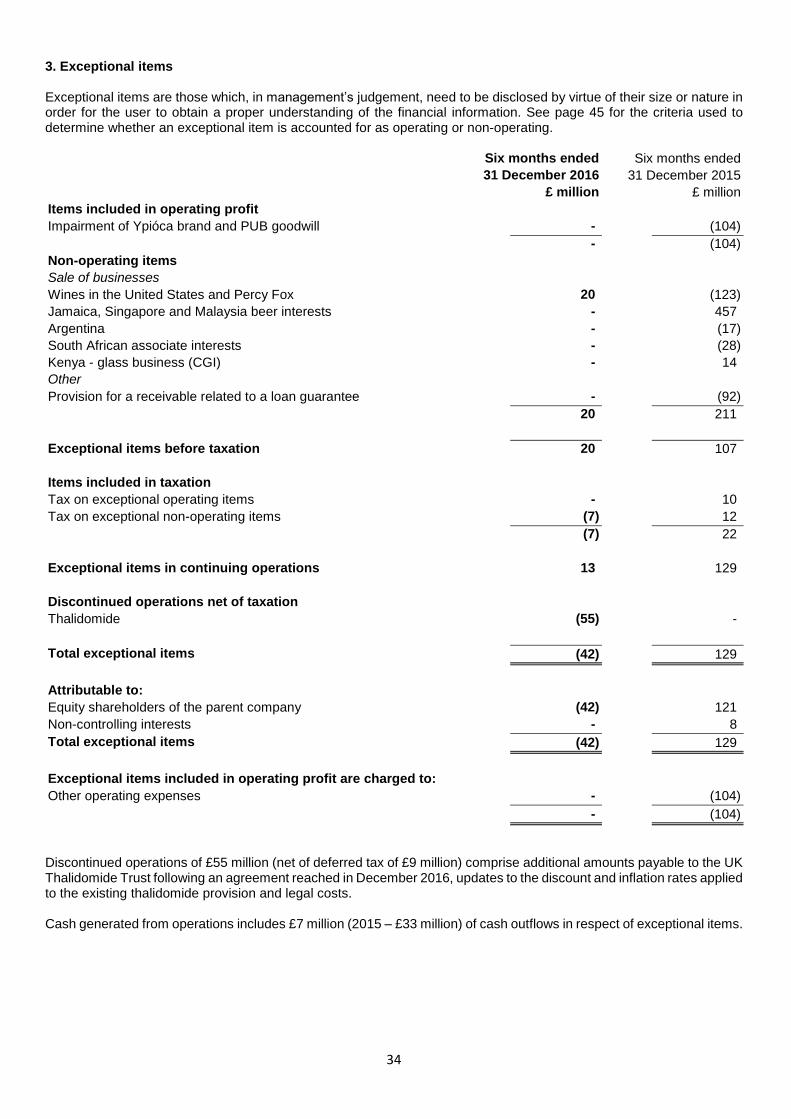
34
3. Exceptional items Exceptional items are those which, in management’s judgement, need to be disclosed by virtue of their size or nature in order for the user to obtain a proper understanding of the financial information. See page 45 for the criteria used to determine whether an exceptional item is accounted for as operating or non-operating. Six months ended Six months ended
31 December 2016 31 December 2015
£ million £ million
Items included in operating profit
Impairment of Ypióca brand and PUB goodwill - (104)
- (104)
Non-operating items
Sale of businesses
Wines in the United States and Percy Fox 20 (123)
Jamaica, Singapore and Malaysia beer interests - 457
Argentina - (17)
South African associate interests - (28)
Kenya - glass business (CGI) - 14
Other
Provision for a receivable related to a loan guarantee - (92)
20 211
Exceptional items before taxation 20 107
Items included in taxation
Tax on exceptional operating items - 10
Tax on exceptional non-operating items (7) 12
(7) 22
Exceptional items in continuing operations 13 129
Discontinued operations net of taxation Thalidomide (55) -
Total exceptional items (42) 129
Attributable to:
Equity shareholders of the parent company (42) 121
Non-controlling interests - 8
Total exceptional items (42) 129
Exceptional items included in operating profit are charged to:
Other operating expenses - (104)
- (104)
Discontinued operations of £55 million (net of deferred tax of £9 million) comprise additional amounts payable to the UK Thalidomide Trust following an agreement reached in December 2016, updates to the discount and inflation rates applied to the existing thalidomide provision and legal costs. Cash generated from operations includes £7 million (2015 – £33 million) of cash outflows in respect of exceptional items.
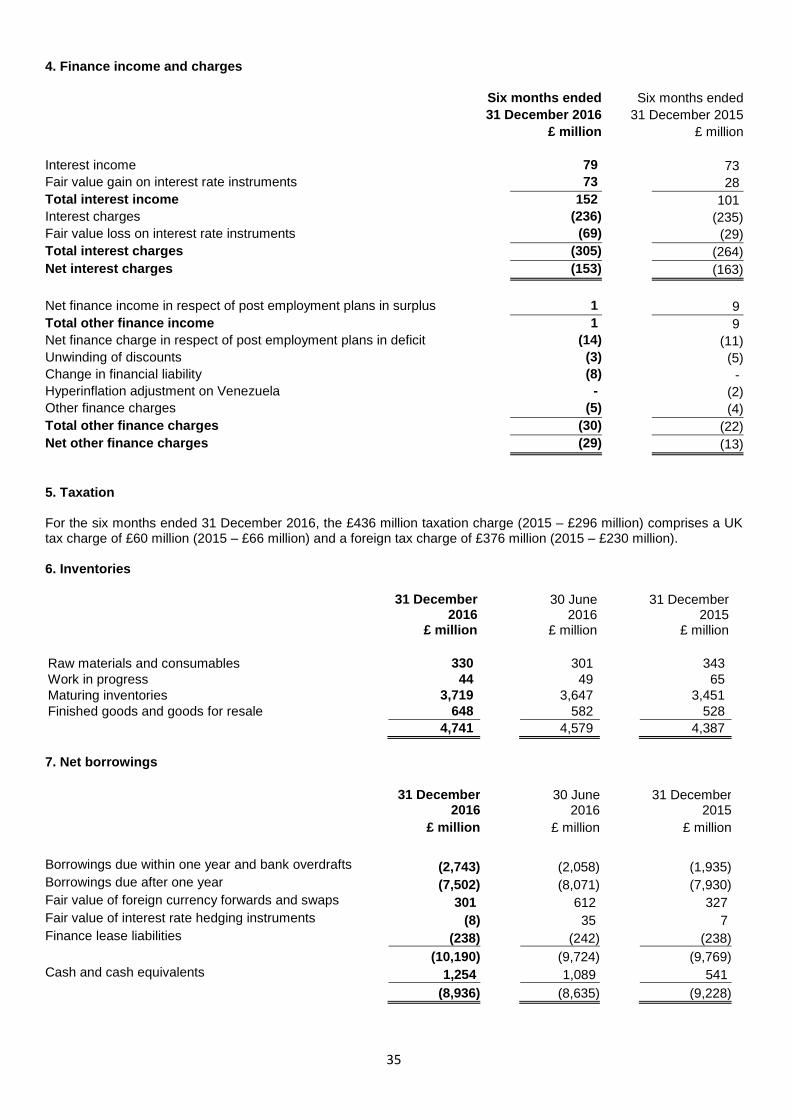
35
4. Finance income and charges Six months ended Six months ended
31 December 2016 31 December 2015
£ million £ million
Interest income 79 73
Fair value gain on interest rate instruments 73 28
Total interest income 152 101
Interest charges (236) (235)
Fair value loss on interest rate instruments (69) (29)
Total interest charges (305) (264)
Net interest charges (153) (163)
Net finance income in respect of post employment plans in surplus 1 9
Total other finance income 1 9
Net finance charge in respect of post employment plans in deficit (14) (11)
Unwinding of discounts (3) (5)
Change in financial liability (8) -
Hyperinflation adjustment on Venezuela - (2)
Other finance charges (5) (4)
Total other finance charges (30) (22)
Net other finance charges (29) (13)
5. Taxation For the six months ended 31 December 2016, the £436 million taxation charge (2015 – £296 million) comprises a UK tax charge of £60 million (2015 – £66 million) and a foreign tax charge of £376 million (2015 – £230 million). 6. Inventories
31 December
2016
30 June 2016
31 December 2015
£ million £ million £ million
Raw materials and consumables 330 301 343
Work in progress 44 49 65
Maturing inventories 3,719 3,647 3,451
Finished goods and goods for resale 648 582 528
4,741 4,579 4,387
7. Net borrowings
31 December 2016
30 June 2016
31 December
2015
£ million £ million £ million
Borrowings due within one year and bank overdrafts (2,743) (2,058) (1,935) Borrowings due after one year (7,502) (8,071) (7,930) Fair value of foreign currency forwards and swaps 301 612 327 Fair value of interest rate hedging instruments (8) 35 7 Finance lease liabilities (238) (242) (238)
(10,190) (9,724) (9,769) Cash and cash equivalents 1,254 1,089 541
(8,936) (8,635) (9,228)
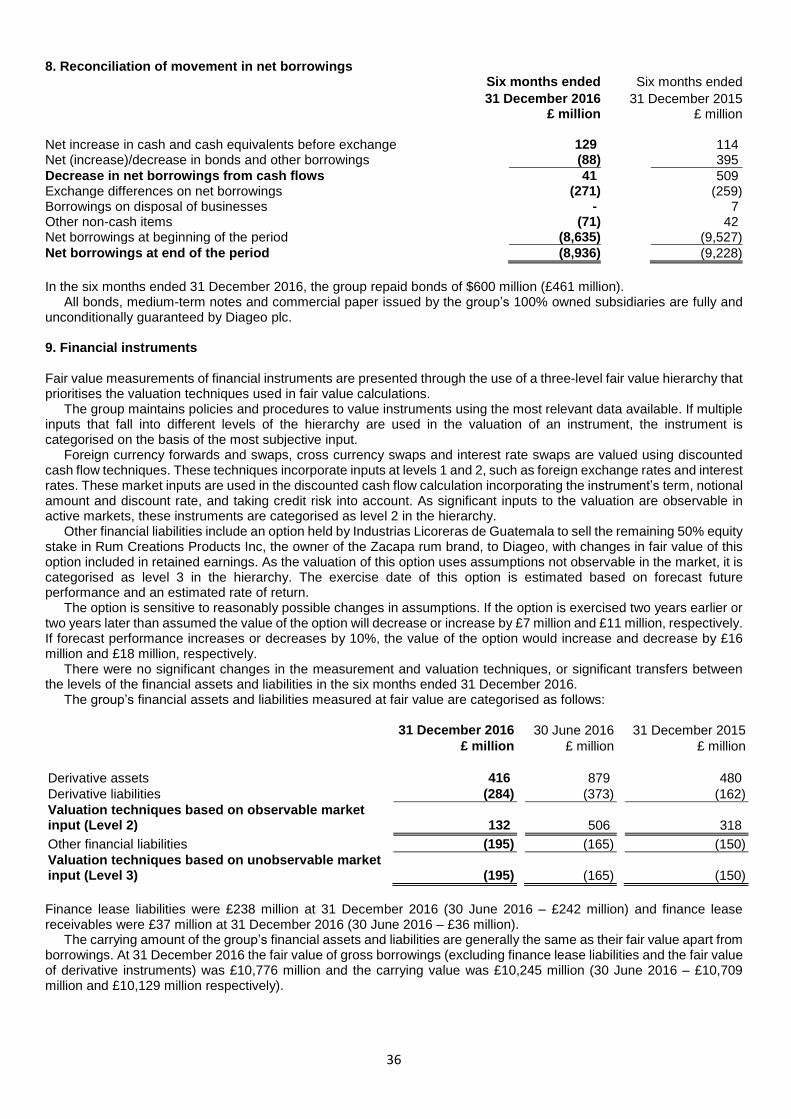
36
8. Reconciliation of movement in net borrowings Six months ended Six months ended
31 December 2016 31 December 2015 £ million £ million
Net increase in cash and cash equivalents before exchange 129 114 Net (increase)/decrease in bonds and other borrowings (88) 395
Decrease in net borrowings from cash flows 41 509 Exchange differences on net borrowings (271) (259) Borrowings on disposal of businesses - 7 Other non-cash items (71) 42 Net borrowings at beginning of the period (8,635) (9,527)
Net borrowings at end of the period (8,936) (9,228)
In the six months ended 31 December 2016, the group repaid bonds of $600 million (£461 million).
All bonds, medium-term notes and commercial paper issued by the group’s 100% owned subsidiaries are fully and unconditionally guaranteed by Diageo plc. 9. Financial instruments Fair value measurements of financial instruments are presented through the use of a three-level fair value hierarchy that prioritises the valuation techniques used in fair value calculations.
The group maintains policies and procedures to value instruments using the most relevant data available. If multiple inputs that fall into different levels of the hierarchy are used in the valuation of an instrument, the instrument is categorised on the basis of the most subjective input.
Foreign currency forwards and swaps, cross currency swaps and interest rate swaps are valued using discounted cash flow techniques. These techniques incorporate inputs at levels 1 and 2, such as foreign exchange rates and interest rates. These market inputs are used in the discounted cash flow calculation incorporating the instrument’s term, notional amount and discount rate, and taking credit risk into account. As significant inputs to the valuation are observable in active markets, these instruments are categorised as level 2 in the hierarchy.
Other financial liabilities include an option held by Industrias Licoreras de Guatemala to sell the remaining 50% equity stake in Rum Creations Products Inc, the owner of the Zacapa rum brand, to Diageo, with changes in fair value of this option included in retained earnings. As the valuation of this option uses assumptions not observable in the market, it is categorised as level 3 in the hierarchy. The exercise date of this option is estimated based on forecast future performance and an estimated rate of return.
The option is sensitive to reasonably possible changes in assumptions. If the option is exercised two years earlier or two years later than assumed the value of the option will decrease or increase by £7 million and £11 million, respectively. If forecast performance increases or decreases by 10%, the value of the option would increase and decrease by £16 million and £18 million, respectively.
There were no significant changes in the measurement and valuation techniques, or significant transfers between the levels of the financial assets and liabilities in the six months ended 31 December 2016.
The group’s financial assets and liabilities measured at fair value are categorised as follows:
31 December 2016 30 June 2016 31 December 2015
£ million £ million £ million
Derivative assets 416 879 480
Derivative liabilities (284) (373) (162)
Valuation techniques based on observable market input (Level 2) 132 506 318
Other financial liabilities (195) (165) (150)
Valuation techniques based on unobservable market input (Level 3) (195) (165) (150)
Finance lease liabilities were £238 million at 31 December 2016 (30 June 2016 – £242 million) and finance lease receivables were £37 million at 31 December 2016 (30 June 2016 – £36 million).
The carrying amount of the group’s financial assets and liabilities are generally the same as their fair value apart from borrowings. At 31 December 2016 the fair value of gross borrowings (excluding finance lease liabilities and the fair value of derivative instruments) was £10,776 million and the carrying value was £10,245 million (30 June 2016 – £10,709 million and £10,129 million respectively).
37
10. Dividends and other reserves
Six months ended Six months ended
31 December 2016 31 December 2015
£ million £ million Amounts recognised as distributions to equity shareholders in the period
Final dividend for the year ended 30 June 2016 of 36.6 pence per share (2015 – 34.9 pence)
920
876
An interim dividend of 23.7 pence per share (2015 - 22.6 pence) was approved by the board on 25 January 2017. As the approval was after the balance sheet date, it has not been included as a liability.
Other reserves of £2,772 million at 31 December 2016 (2015 – £2,050 million) include a capital redemption reserve of £3,146 million (2015 – £3,146 million), a hedging reserve of £134 million deficit (2015 – £22 million surplus) and an exchange reserve of £240 million deficit (2015 – £1,118 million deficit). 11. Contingent liabilities and legal proceedings (a) Guarantees and related matters
As of 31 December 2016, the group has no material guarantees or indemnities in respect of liabilities of third parties. The following matters relate to guarantees previously discharged.
Diageo Holdings Netherlands B.V. (DHN) issued a conditional backstop guarantee to Standard Chartered Bank (Standard Chartered) pursuant to a guarantee commitment agreement (the Guarantee Agreement). The guarantee was in respect of the liabilities of Watson Limited (Watson), a company affiliated with Dr Vijay Mallya (Dr Mallya), under a $135 million (£92 million) facility from Standard Chartered. The Guarantee Agreement was entered into as part of the arrangements put in place and announced at closing of the United Spirits Limited (USL) transaction on 4 July 2013. DHN’s provision of the Guarantee Agreement enabled the refinancing of certain existing borrowings of Watson from a third party bank and facilitated the release by that bank of rights over certain USL shares that were to be acquired by Diageo as part of the USL transaction. The facility matured and entered into default in May 2015. Whilst the guarantee was not payable immediately, DHN and Standard Chartered agreed to extend the date on which the guarantee was payable to 29 January 2016 to allow additional time for enforcement of the security package underlying the facility. As part of this agreement, in August 2015 DHN deposited $135 million (£92 million) in an escrow account with Standard Chartered. The loan remained in default and the guarantee was paid on 29 January 2016. In aggregate DHN paid Standard Chartered $141 million (£96 million) under this guarantee, i.e. including payments of default interest and various fees and expenses.
While the guarantee amount has been fully provided for, Watson remains liable for all amounts paid by DHN under the guarantee. Under the documentation with Standard Chartered, DHN was entitled to the benefit of the underlying security package for the loan, including certain shares in United Breweries Limited (UBL) held solely by Dr Mallya and certain other shares in UBL held by Dr Mallya jointly with his son Siddharth Mallya, Watson’s interest in Orange India Holdings S.a.r.l. (Orange), the joint venture that owns the Force India Formula One (F1) team, and the shareholding in Watson. On 19 June 2015, a consortium of banks led by State Bank of India (SBI) obtained an ex-parte order from the Debt Recovery Tribunal (DRT) in Bangalore preventing the sale or any other transfer of such UBL shares as part of the enforcement process pending further orders from the DRT. This order was passed following the filing of a memorandum by Dr Mallya with the tribunal that he had no objection to it issuing the order in respect of the UBL shares. There was a further ex-parte order of the DRT on 15 July 2015 restraining the UBL shares being handed over to DHN or to any other party pending further orders of the DRT. DHN filed a writ petition before the High Court of Karnataka (the High Court) against such orders of the DRT, and on 7 November 2015, the High Court passed an interim order granting an interim stay of the order of the DRT dated 15 July 2015 and directing that the UBL shares shall not be dealt with until further orders. Subsequently, DHN was joined in the proceedings before the DRT.
Further, in a separate application filed by the SBI-led consortium before the DRT, on 17 May 2016 the DRT passed another ex-parte order attaching the shares held by Dr Mallya in Watson and directing Watson not to disburse amounts including dividends on shares held by Watson in Orange until further orders of the DRT. DHN and Standard Chartered (who were not named as parties in the above mentioned application filed by the SBI-led consortium) filed applications before the DRT to lift this order.
On 19 January 2017, the Presiding Officer of the DRT passed an order holding that, amongst other things, the creation of a pledge over UBL shares by Dr Mallya in favour of DHN and Standard Chartered is not legally valid, and set aside the pledge. However, this order clarified that it will not affect the rights of Siddharth Mallya, DHN and Standard Chartered in so far as the UBL shares jointly held by Siddharth and Dr Mallya are concerned, to the extent of Siddharth Mallya’s rights in those shares. The order also allowed certain applications filed by the SBI-led consortium before the DRT, including the application seeking an order of attachment before judgment to attach, amongst other things, certain shares of Orange held by Watson (in respect of which an ex-parte order was passed by the DRT on 17 May 2016), and dismissing the applications filed by DHN and Standard Chartered to lift the ex-parte order.
38
DHN and Diageo intend to appeal against this order of the DRT before the Debt Recovery Appellate Tribunal, Chennai (DRAT) in order to set aside the order as part of its efforts for enforcement of the underlying security and recovery of outstanding amounts.
Further, on 3 September 2016, the Deputy Director, Directorate of Enforcement made a provisional attachment order attaching, amongst other things, the above mentioned UBL shares under the Prevention of Money Laundering Act, 2002 (PMLA), and a notice to show cause was issued, amongst other parties, to Standard Chartered by the Adjudicating Authority (PMLA). DHN is not a party to this proceeding. On being provided with the copy of the show cause notice by Standard Chartered, on 18 November 2016, DHN filed written submissions before the Adjudicating Authority (PMLA) explaining why the provisional attachment order should not be confirmed in respect of the UBL shares, and subsequently it filed a formal application to be joined as a party in these proceedings. On 12 January 2017, the Adjudicating Authority (PMLA) joined DHN as a party to these proceedings, and the matter is next scheduled for hearing on 7 February 2017. DHN will continue to vigorously pursue this matter in order to lift the above provisional attachment order as part of the efforts for enforcement of the underlying security and recovery of outstanding amounts.
Diageo believes that the existence of any prior rights or dispute in relation to the security would be in breach of representations and warranties given by Dr Mallya to Standard Chartered at the time the security was granted and further believes that Dr Mallya’s filing of the memorandum with the tribunal in relation to the UBL shares and his failure to object to the order for status quo in that regard are breaches of his obligations to Standard Chartered.
Under the terms of the guarantee and as a matter of law, there are arrangements to pass on to DHN the benefit of the security package upon payment under the guarantee of all amounts owed to Standard Chartered. Payment under the guarantee has now occurred as described above. Standard Chartered has taken certain recovery steps and is working with DHN in relation to the DRT proceedings. DHN is actively monitoring the security package and is discussing with Standard Chartered steps to continue enforcement against the background of the DRT proceedings described above as well as in relation to the other elements of the security package. DHN’s ability to assume or enforce security over some elements of the security package is also subject to regulatory consent. It is not at this stage possible to determine whether such consent would be forthcoming. In addition, DHN has the benefit of a counter-indemnity from Watson in respect of payments in connection with the guarantee.
The agreement with Dr Mallya referenced in paragraph (d) below does not impact the security package, which includes shares in UBL and Watson’s interest in Orange, the joint venture that owns the F1 team. Watson remains liable for all amounts paid pursuant to the guarantee. DHN is entitled to the benefit of the security package underlying the facility and the security providers have undertaken to take all necessary actions in that regard. (b) Thalidomide litigation
In June 2014, claim forms alleging product liability and negligence for injuries arising from the consumption of thalidomide were filed in the High Court in London against Distillers Company (Biochemicals) Limited, its parent Diageo Scotland Limited (formerly Distillers Company Limited), as well as against Grϋnenthal GmbH, the developer of the drug (not a member of the group). On 4 December 2014 these claims forms were served by lawyers acting for the claimants. Since then the proceedings in respect of the 28 individuals that have now issued claims in the United Kingdom have been stayed until 31 March 2017 while discussions are ongoing between Diageo and the claimants’ lawyers.
Distillers Company (Biochemicals) Limited distributed thalidomide in the United Kingdom for a period in the late 1950s and early 1960s. Diageo has worked voluntarily for many years with various thalidomide organisations and has provided significant financial support.
In the six months ended 31 December 2016 a charge of £55 million after tax was made to discontinued operations in the income statement in respect of thalidomide. (c) Acquisition of USL shares from UBHL, winding-up petitions against UBHL and other proceedings in relation to the USL transaction (i) On 4 July 2013 Diageo completed its acquisition, under a share purchase agreement with UBHL and various other sellers (the SPA), of 21,767,749 shares (14.98%) in USL for a total consideration of INR 31.3 billion (£349 million), including 10,141,437 shares (6.98%) from UBHL. The SPA was signed on 9 November 2012 and was part of the transaction announced by Diageo in relation to USL on that day (the Original USL Transaction). Through a series of further transactions, as of 2 July 2014, Diageo has a 54.78% investment in USL (excluding 2.38% owned by the USL Benefit Trust).
Prior to the acquisition from UBHL on 4 July 2013, the High Court had granted leave to UBHL under sections 536 and 537 of the Indian Companies Act 1956 (the Leave Order) to enable the sale by UBHL to Diageo to take place (the UBHL Share Sale) notwithstanding the continued existence of five winding-up petitions that were pending against UBHL on 9 November 2012, being the date of the SPA. Additional winding-up petitions have been brought against UBHL since 9 November 2012, and the Leave Order did not extend to them. At the time of the completion of the UBHL Share Sale, the Leave Order remained subject to review on appeal. However, as stated by Diageo at the time of closing on 4 July 2013, it was considered unlikely that any appeal process in respect of the Leave Order would definitively conclude on a timely basis and, accordingly, Diageo waived the conditionality under the SPA relating to the absence of insolvency proceedings in relation to UBHL and acquired the 10,141,437 USL shares from UBHL at that time.
Following closing of the UBHL Share Sale, appeals were filed by various petitioners in respect of the Leave Order. On 20 December 2013, the division bench of the High Court set aside the Leave Order (the 20 December Order).
39
Following the 20 December Order, Diageo filed special leave petitions (SLPs) in the Supreme Court of India against the 20 December Order.
On 10 February 2014, the Supreme Court of India issued an order giving notice in respect of the SLPs and ordering that the status quo be maintained with regard to the UBHL Share Sale pending a hearing on the matter in the Supreme Court. Following a number of adjournments, the next firm hearing date for the SLPs (in respect of which leave has since been granted and which have been converted to civil appeals) is yet to be fixed.
In separate proceedings, various winding-up petitions against UBHL have been admitted by the High Court. These petitions and certain related proceedings have been progressing through the High Court since closing of the UBHL Share Sale. Following the last hearing of the various winding-up proceedings on 11 January 2017, the High Court has reserved its orders on the matter.
Diageo continues to believe that the acquisition price of INR 1,440 per share paid to UBHL for the USL shares is fair and reasonable as regards UBHL, UBHL’s shareholders and UBHL’s secured and unsecured creditors. However, adverse results for Diageo in the proceedings referred to above could, absent leave or relief in other proceedings, ultimately result in Diageo losing title to the 10,141,437 USL shares acquired from UBHL. Diageo believes it would remain in control of USL and be able to consolidate USL as a subsidiary regardless of the outcome of this litigation. There can be no certainty as to the outcome of the existing or any further related legal proceedings or the timeframe within which they would be concluded.
Diageo also has the benefit of certain contractual undertakings and commitments from the relevant sellers in relation to potential challenges to its unencumbered title to the USL shares acquired on 4 July 2013, including relating to the winding-up petitions described above and/or certain losses and costs that may be incurred in the event of third party actions relating to the acquisition of the USL shares.
(ii) Separately, Diageo’s contractual rights in relation to the acquisition of an additional 3,459,090 USL shares (representing 2.38% of the share capital of USL) under the SPA from the USL Benefit Trust have not been capable of completion. Currently certain lenders to USL are refusing to release security that they hold over those shares notwithstanding that they have been repaid in full. USL filed a petition against such lenders before the High Court for release of the security and the High Court granted a stay order in favour of USL in December 2015 restraining the lenders from dealing with the 3,459,090 pledged USL shares until further order of the High Court. As previously disclosed, while those shares are held by the USL Benefit Trust pending any sale, they are subject to an undertaking that the trustees would only vote the shares at the direction of USL.
(iii) Diageo has notified UBHL and its subsidiary, KFinvest, of certain claims that it believes it has against such parties under the SPA in relation to the matters revealed by the Initial Inquiry described in paragraph (d) below, including under provisions requiring the discharge of inter-group balances and also as a result of the non-disclosure of these matters to it during the due diligence exercise that preceded the Original USL Transaction. Diageo also believes that it may have additional claims against those parties under the SPA in relation to the matters revealed by the Additional Inquiry described in paragraph (d) below. (d) Continuing matters relating to the resignation of Dr Vijay Mallya from USL and USL internal inquiries
On 25 February 2016, Diageo and USL each announced that they had entered into arrangements with Dr Mallya under which he had agreed to resign from his position as a director and as chairman of USL and from his positions in USL's subsidiaries. As specified by Diageo in its announcement at that time, these arrangements ended its prior agreement with Dr Mallya regarding his position at USL, therefore bringing to an end the uncertainty relating to the governance of USL, and put in place a five-year global non-compete (excluding the United Kingdom), non-interference, non-solicitation and standstill arrangement with Dr Mallya. As part of those arrangements, USL, Diageo and Dr Mallya agreed a mutual release in relation to matters arising out of an inquiry into certain matters referred to in USL’s financial statements and the qualified auditor’s report for the year ended 31 March 2014 (the Initial Inquiry) which had revealed, among other things, certain diversions of USL funds. Dr Mallya also agreed not to pursue any claims against Diageo, USL and their affiliates (including under the prior agreement with Diageo). In evaluating entering into such arrangements, Diageo considered the impact of the arrangements on USL and all of USL’s shareholders, and came to the view that the arrangements were in the best interests of USL and its shareholders.
Diageo’s agreement with Dr Mallya (the 25 February Agreement) provided for a payment of $75 million (£53 million) to Dr Mallya over a five year period in consideration for the five-year global non-compete, non-interference, non-solicitation and standstill commitments referred to above, his resignation from USL and the termination of his USL-related appointment and governance rights, the relinquishing of rights and benefits attached to his position at USL, and his agreement not to pursue claims against Diageo and USL. The 25 February Agreement also provided for the release of Dr Mallya’s personal obligations to indemnify DHN and Diageo Finance in respect of any liabilities under the guarantee arrangements described in paragraph (a) above and his personal obligation to indemnify Diageo Finance in respect of its earlier liability (£30 million) under a guarantee of certain borrowings of United Breweries Overseas Limited. $40 million (£28 million) of the $75 million (£53 million) amount was paid on signing of the 25 February Agreement with the balance being payable in equal instalments of $7 million (£5 million) a year over five years, subject to and conditional on Dr Mallya’s compliance with certain terms of the agreement.
On 7 March 2016, a consortium of banks led by SBI obtained an order from the DRT in Bangalore attaching the sum of $75 million (£53 million) payable to Dr Mallya under the 25 February Agreement. The order provides that Dr Mallya is not to draw on that sum, Diageo is not to disburse such sum to Dr Mallya and Diageo is to deposit such
40
sum with the DRT. Diageo filed an affidavit in the DRT on 5 April 2016 explaining that the sum of $40 million (£28 million) was paid on 25 February 2016, prior to the order dated 7 March 2016. Diageo further explained that no sum is presently due and payable by Diageo to Dr Mallya under the terms of the 25 February Agreement, and there can be no certainty that any amount will become due and payable under the terms of the 25 February Agreement in the future because of the conditional nature of the obligation. Pursuant to an order of the DRT dated 29 April 2016, on 12 May 2016 Diageo and USL filed memos with the DRT furnishing copies of their respective agreements with Dr Mallya. On 16 July 2016, the DRT issued a clarification in relation to its order dated 7 March 2016 (which forms part of that order), stating that: (i) if Diageo is liable to pay any amount under the 25 February Agreement to Dr Mallya, such amount shall be deposited in the DRT under the 7 March order; and (ii) if Diageo is not liable to pay any amount under the 25 February Agreement to Dr Mallya, Diageo does not need to deposit any amount in the DRT. The aforementioned order of the DRT dated 16 July 2016 was challenged by Diageo by way of an appeal filed on 1 September 2016 before DRAT primarily on the ground that the order was passed without jurisdiction. The matter is currently pending before the DRAT and is next listed for hearing on 16 March 2017.
As previously announced by USL, the Initial Inquiry identified certain additional parties and matters indicating the possible existence of other improper transactions. These transactions could not be fully analysed during the Initial Inquiry and, accordingly, USL, as previously announced, mandated that its Managing Director & CEO conduct a further inquiry into the transactions involving the additional parties and the additional matters to determine whether they also suffered from improprieties (the Additional Inquiry). USL announced the results of the Additional Inquiry in a notice to the Indian Stock Exchange dated 9 July 2016.
As stated in that announcement, the Additional Inquiry revealed: (a) further instances of actual or potential fund diversions amounting to approximately INR 9,135 million (£102 million) as well as other potentially improper transactions involving USL and its Indian and overseas subsidiaries amounting to approximately INR 3,118 million (£35 million); (b) that these transactions occurred during the period from October 2010 to July 2014, although certain transactions appear to have been initiated prior to that period; and (c) that these improper transactions involved the diversion of funds to certain non-Indian entities in which Dr Mallya appears to have a material direct or indirect interest (including Force India Formula One, Watson Limited, Continental Administrative Services, Modall Securities Limited, Ultra Dynamix Limited and Lombard Wall Corporate Services Inc) as well as certain Indian entities (including, in most cases, Kingfisher Airlines Limited).
The USL board has, in light of these findings, and based on expert advice, directed that copies of the Additional Inquiry report be provided to the relevant authorities and its auditors, in the same way as the Initial Inquiry report had been. The USL board also directed that USL should conduct a detailed review of each indicated case of fund diversion to assess its legal position and then take such action as is necessary to recover its funds from the relevant parties and individuals, to the extent possible. The mutual release in relation to the Initial Inquiry agreed by Diageo and USL with Dr Mallya and announced on 25 February 2016 does not extend to matters arising out of the Additional Inquiry. In addition to the notification sent by Diageo to UBHL and KFinvest in relation to the claims it believes it has against such parties under the SPA in relation to the matters revealed in the Initial Inquiry, as noted in paragraph (c)(iii) above, Diageo also believes it may have claims against UBHL and KFinvest under the SPA in relation to the matters revealed by the Additional Inquiry, including under certain provisions requiring the discharge of inter-group balances and also as a result of the non-disclosure of these matters to it during the due diligence exercise that preceded the Original USL Transaction.
Almost all of the amounts identified in the Additional Inquiry have been previously provided for or expensed in the financial statements of USL or its subsidiaries for prior periods (including by way of provisions made in relation to impairment in the value of or loss on sale of USL’s overseas subsidiaries). With an additional charge of INR 217 million (£2 million) in respect of a write down in the value of certain items of plant and machinery made by USL in the quarter ended 30 June 2016, there are no other improper transactions identified by the Additional Inquiry which have not been expensed or provided. Based on the information currently available, Diageo believes that no further provisions are required at this stage.
(e) Regulatory notices in relation to USL
Following USL’s earlier updates concerning the Initial Inquiry as well as in relation to the arrangements with Dr Mallya that were the subject of the 25 February 2016 announcement, USL and Diageo have received various notices from Indian regulatory authorities, including the Ministry of Corporate Affairs, Serious Fraud Investigation Office, National Stock Exchange, Income Tax Department, Enforcement Directorate, Securities and Exchange Board of India, Bangalore police, Central Excise Intelligence and the Institute of Chartered Accountants of India. Diageo and USL are cooperating fully with the authorities in relation to these matters, and, as noted in paragraph (d) above, USL itself reported the matters covered by the Initial Inquiry and the Additional Inquiry to the relevant authorities.
Diageo and USL have also received notices from the Securities and Exchange Board of India (SEBI) requesting information in relation to, and explanation of the reasons for, the arrangements with Dr Mallya that were the subject of the 25 February 2016 announcement as well as, in the case of USL, in relation to the Initial Inquiry, and, in the case of Diageo, whether such arrangements with Dr Mallya or the Watson backstop guarantee arrangements described in paragraph (a) above were part of agreements previously made with Dr Mallya at the time of the Original USL Transaction announced on 9 November 2012 and the open offer made as part of the Original USL Transaction. Diageo and USL have complied with such information requests and Diageo has confirmed that, consistent with prior disclosures, the Watson backstop guarantee arrangements and the matters described in the 25 February 2016 announcement were not the subject of any earlier agreement with Dr Mallya. In respect of the Watson backstop guarantee arrangements, SEBI
41
issued a further notice to Diageo on 16 June 2016 that if there is any net liability incurred by Diageo (after any recovery under relevant security or other arrangements, which matters remain pending as noted in paragraph (a) above) on account of the Watson backstop guarantee, such liability, if any, would be considered to be part of the price paid for the acquisition of USL shares under the SPA which formed part of the Original USL Transaction and that, in that case, additional equivalent payments would be required to be made to those shareholders (representing 0.04% of the shares in USL) who tendered in the open offer made as part of the Original USL Transaction. Diageo is clear that the Watson backstop guarantee arrangements were not part of the price paid or agreed to be paid for any USL shares under the Original USL Transaction and therefore believes the decision in the SEBI notice to be misconceived and wrong in law and has appealed against it before the Securities Appellate Tribunal, Mumbai (SAT) on 29 July 2016. The matter was last listed before SAT on 6 December 2016, on which date no substantive hearing took place and is next posted for 15 February 2017.
Diageo is unable to assess if the notices or enquiries referred to above will result in enforcement action or, if this were to transpire, to quantify meaningfully the possible loss or range of loss, if any, to which any such action might give rise if determined against Diageo or USL. (f) SEC Inquiry
Diageo has received requests for information from the US Securities and Exchange Commission (SEC) regarding its distribution in and public disclosures regarding the United States as well as additional context about the Diageo group globally. Diageo is currently responding to the SEC’s requests for information in this matter. Diageo is unable to assess if the inquiry will evolve into further information requests or an enforcement action or, if this were to transpire, to quantify meaningfully the possible loss or range of loss, if any, to which any such action might give rise. (g) Tax
Diageo has been discussing with HM Revenue & Customs (HMRC), the UK tax authority, its transfer pricing position and related issues. Diageo has recently entered into a process of collaborative working to seek clarity on these issues. Diageo is unable to quantify meaningfully the possible loss if any to which any action deriving from the HMRC review might give rise.
Diageo has also been in discussions with the French Tax Authorities over the deductibility of certain interest costs for periods from 1 July 2012. At this stage of discussions Diageo is unable to meaningfully quantify the possible financial impact, if any, which might arise.
(h) Other
The group has extensive international operations and is a defendant in a number of legal, customs and tax proceedings incidental to these operations, the outcome of which cannot at present be foreseen. In particular, the group is currently a defendant in various customs proceedings that challenge the declared customs value of products imported by certain Diageo companies. Diageo continues to defend its position vigorously in these proceedings.
Save as disclosed above, neither Diageo, nor any member of the Diageo group, is or has been engaged in, nor (so far as Diageo is aware) is there pending or threatened by or against it, any legal or arbitration proceedings which may have a significant effect on the financial position of the Diageo group. 12. Related party transactions The group’s significant related parties are its associates, joint ventures, key management personnel and pension plans. There have been no transactions with these related parties during the six months ended 31 December 2016 on terms other than those that prevail in arm’s length transactions.
42
INDEPENDENT REVIEW REPORT TO DIAGEO PLC Report on the condensed set of financial statements
Our conclusion
We have reviewed Diageo plc's condensed set of financial statements (the “interim financial statements”) in the half-yearly financial report of Diageo plc for the six months ended 31 December 2016. Based on our review, nothing has come to our attention that causes us to believe that the interim financial statements are not prepared, in all material respects, in accordance with International Accounting Standard 34, ‘Interim Financial Reporting’, as adopted by the European Union and the Disclosure Guidance and Transparency Rules sourcebook of the United Kingdom’s Financial Conduct Authority. What we have reviewed
The interim financial statements comprise:
the condensed consolidated balance sheet as at 31 December 2016;
the condensed consolidated income statement and condensed consolidated statement of comprehensive income for the period then ended;
the condensed consolidated statement of cash flows for the period then ended;
the condensed consolidated statement of changes in equity for the period then ended; and
the explanatory notes to the interim financial statements.
The interim financial statements included in the half-yearly financial report have been prepared in accordance with International Accounting Standard 34, ‘Interim Financial Reporting’, as adopted by the European Union and the Disclosure Guidance and Transparency Rules sourcebook of the United Kingdom’s Financial Conduct Authority.
As disclosed in note 1 to the interim financial statements, the financial reporting framework that has been applied in the preparation of the full annual financial statements of the group is applicable law and International Financial Reporting Standards (IFRSs) as adopted by the European Union. Responsibilities for the interim financial statements and the review
Our responsibilities and those of the directors
The half-yearly financial report, including the interim financial statements, is the responsibility of, and has been approved by, the directors. The directors are responsible for preparing the half-yearly financial report in accordance with the Disclosure Guidance and Transparency Rules sourcebook of the United Kingdom’s Financial Conduct Authority.
Our responsibility is to express a conclusion on the interim financial statements in the half-yearly financial report based on our review. This report, including the conclusion, has been prepared for and only for the company for the purpose of complying with the Disclosure Guidance and Transparency Rules sourcebook of the United Kingdom’s Financial Conduct Authority and for no other purpose. We do not, in giving this conclusion, accept or assume responsibility for any other purpose or to any other person to whom this report is shown or into whose hands it may come save where expressly agreed by our prior consent in writing.
43
What a review of interim financial statements involves
We conducted our review in accordance with International Standard on Review Engagements (UK and Ireland) 2410, ‘Review of Interim Financial Information Performed by the Independent Auditor of the Entity’ issued by the Auditing Practices Board for use in the United Kingdom. A review of interim financial information consists of making enquiries, primarily of persons responsible for financial and accounting matters, and applying analytical and other review procedures.
A review is substantially less in scope than an audit conducted in accordance with International Standards on Auditing (UK and Ireland) and, consequently, does not enable us to obtain assurance that we would become aware of all significant matters that might be identified in an audit. Accordingly, we do not express an audit opinion.
We have read the other information contained in the half-yearly financial report and considered whether it contains any apparent misstatements or material inconsistencies with the information in the interim financial statements.
PricewaterhouseCoopers LLP Chartered Accountants London 25 January 2017
a) The maintenance and integrity of the Diageo plc website is the responsibility of the directors; the work carried out by the auditors does not involve consideration of these matters and, accordingly, the auditors accept no responsibility for any changes that may have occurred to the interim financial statements since they were initially presented on the website.
b) Legislation in the United Kingdom governing the preparation and dissemination of financial statements may differ from legislation in other jurisdictions.
44
ADDITIONAL INFORMATION FOR SHAREHOLDERS
EXPLANATORY NOTES
Comparisons are to the six months ended 31 December 2015 (2015) unless otherwise stated. Unless otherwise stated, percentage movements given throughout this announcement for volume, sales, net sales, marketing spend, operating profit and operating margin are organic movements after retranslating prior period reported numbers at current period exchange rates and after adjusting for the effect of operating exceptional items and acquisitions and disposals. This announcement contains forward-looking statements that involve risk and uncertainty. There are a number of factors that could cause actual results and developments to differ materially from those expressed or implied by these forward-looking statements, including factors beyond Diageo’s control. Please refer to page 51 – ‘Cautionary statement concerning forward-looking statements’ for more details. This announcement includes names of Diageo’s products which constitute trademarks or trade names which Diageo owns or which others own and license to Diageo for use. Definitions and reconciliation of non-GAAP measures to GAAP measures Diageo’s strategic planning process is based on the following non-GAAP measures. They are chosen for planning and reporting, and some of them are used for incentive purposes. The group’s management believes these measures provide valuable additional information for users of the financial statements in understanding the group’s performance. These non-GAAP measures should be viewed as complementary to, and not replacements for, the comparable GAAP measures and reported movements therein. Volume Volume is a non-GAAP measure that is measured on an equivalent units basis to nine-litre cases of spirits. An equivalent unit represents one nine-litre case of spirits, which is approximately 272 servings. A serving comprises 33ml of spirits, 165ml of wine, or 330ml of ready to drink or beer. Therefore, to convert volume of products other than spirits to equivalent units, the following guide has been used: beer in hectolitres, divide by 0.9; wine in nine-litre cases, divide by five; ready to drink in nine-litre cases, divide by 10; and certain pre-mixed products that are classified as ready to drink in nine-litre cases, divide by five. Organic movements In the discussion of the performance of the business, 'organic' information is presented using pounds sterling amounts on a constant currency basis excluding the impact of exceptional items and acquisitions and disposals. Organic measures enable users to focus on the performance of the business which is common to both periods and which represents those measures that local managers are most directly able to influence. Calculation of organic movements The organic movement percentage is the amount in the row titled ‘Organic movement’ in the tables below, expressed as a percentage of the amount in the row titled ‘2015 adjusted’. Organic operating margin is calculated by dividing operating profit before exceptional items by net sales after excluding the impact of exchange rate movements and acquisitions and disposals. (a) Exchange rates 'Exchange' in the organic movement calculation reflects the adjustment to recalculate the prior period results as if they had been generated at the current period’s exchange rates.
Exchange impacts in respect of the external hedging of intergroup sales of products and the intergroup recharging of third party services are allocated to the geographical segment to which they relate. Residual exchange impacts are reported in Corporate. (b) Acquisitions and disposals For acquisitions in the current period, the post acquisition results are excluded from the organic movement calculations. For acquisitions in the prior period, post acquisition results are included in full in the prior period but are included in the organic movement calculation from the anniversary of the acquisition date in the current period. The acquisition row also eliminates the impact of transaction costs that have been charged to operating profit in the current or prior period in respect of acquisitions that, in management’s judgement, are expected to complete.
Where a business, brand, brand distribution right or agency agreement was disposed of, or terminated, in the period up to the date of the external results announcement, the group, in the organic movement calculations, excludes the results for that business from the current and prior period. In the calculation of operating profit, the overheads included in disposals are only those directly attributable to the businesses disposed of, and do not result from subjective
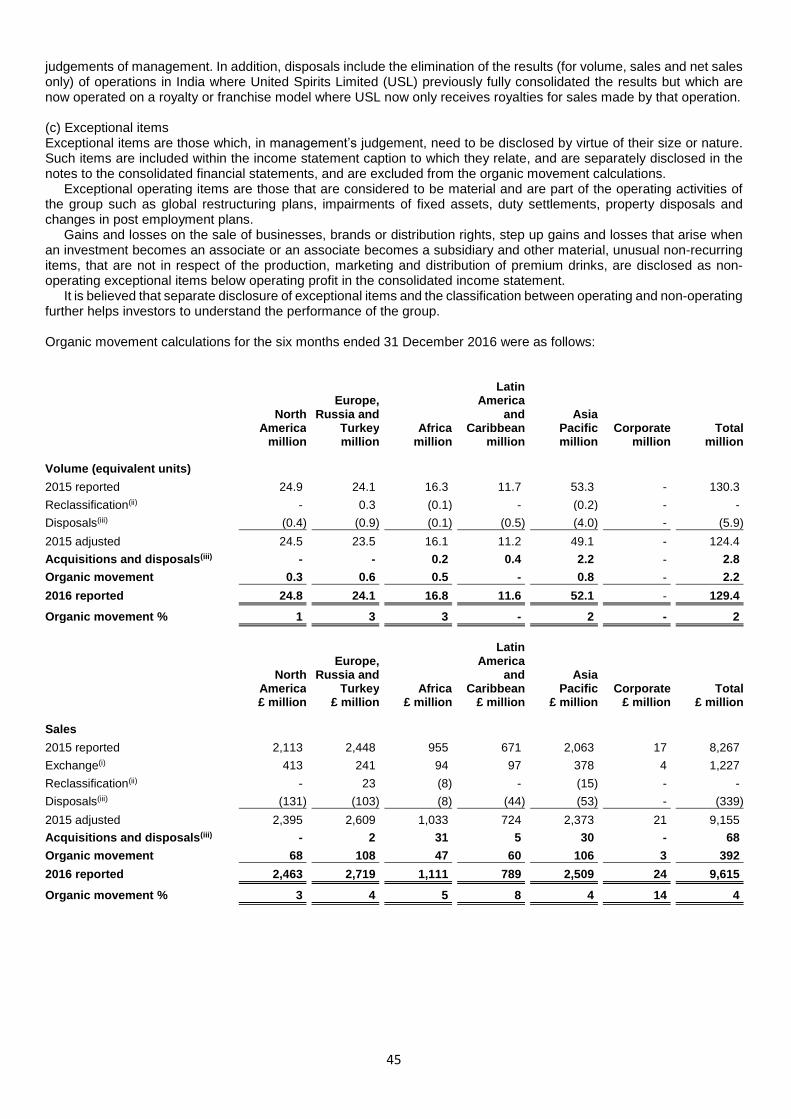
45
judgements of management. In addition, disposals include the elimination of the results (for volume, sales and net sales only) of operations in India where United Spirits Limited (USL) previously fully consolidated the results but which are now operated on a royalty or franchise model where USL now only receives royalties for sales made by that operation.
(c) Exceptional items Exceptional items are those which, in management’s judgement, need to be disclosed by virtue of their size or nature. Such items are included within the income statement caption to which they relate, and are separately disclosed in the notes to the consolidated financial statements, and are excluded from the organic movement calculations.
Exceptional operating items are those that are considered to be material and are part of the operating activities of the group such as global restructuring plans, impairments of fixed assets, duty settlements, property disposals and changes in post employment plans.
Gains and losses on the sale of businesses, brands or distribution rights, step up gains and losses that arise when an investment becomes an associate or an associate becomes a subsidiary and other material, unusual non-recurring items, that are not in respect of the production, marketing and distribution of premium drinks, are disclosed as non-operating exceptional items below operating profit in the consolidated income statement.
It is believed that separate disclosure of exceptional items and the classification between operating and non-operating further helps investors to understand the performance of the group. Organic movement calculations for the six months ended 31 December 2016 were as follows:
North America
million
Europe, Russia and
Turkey million
Africa million
Latin America
and Caribbean
million
Asia Pacific million
Corporate million
Total million
Volume (equivalent units)
2015 reported 24.9 24.1 16.3 11.7 53.3 - 130.3
Reclassification(ii) - 0.3 (0.1) - (0.2) - -
Disposals(iii) (0.4) (0.9) (0.1) (0.5) (4.0) - (5.9)
2015 adjusted 24.5 23.5 16.1 11.2 49.1 - 124.4
Acquisitions and disposals(iii) - - 0.2 0.4 2.2 - 2.8
Organic movement 0.3 0.6 0.5 - 0.8 - 2.2
2016 reported 24.8 24.1 16.8 11.6 52.1 - 129.4
Organic movement % 1 3 3 - 2 - 2
North America £ million
Europe, Russia and
Turkey £ million
Africa £ million
Latin America
and Caribbean
£ million
Asia Pacific
£ million Corporate
£ million Total
£ million
Sales
2015 reported 2,113 2,448 955 671 2,063 17 8,267
Exchange(i) 413 241 94 97 378 4 1,227
Reclassification(ii) - 23 (8) - (15) - -
Disposals(iii) (131) (103) (8) (44) (53) - (339)
2015 adjusted 2,395 2,609 1,033 724 2,373 21 9,155
Acquisitions and disposals(iii) - 2 31 5 30 - 68
Organic movement 68 108 47 60 106 3 392
2016 reported 2,463 2,719 1,111 789 2,509 24 9,615
Organic movement % 3 4 5 8 4 14 4
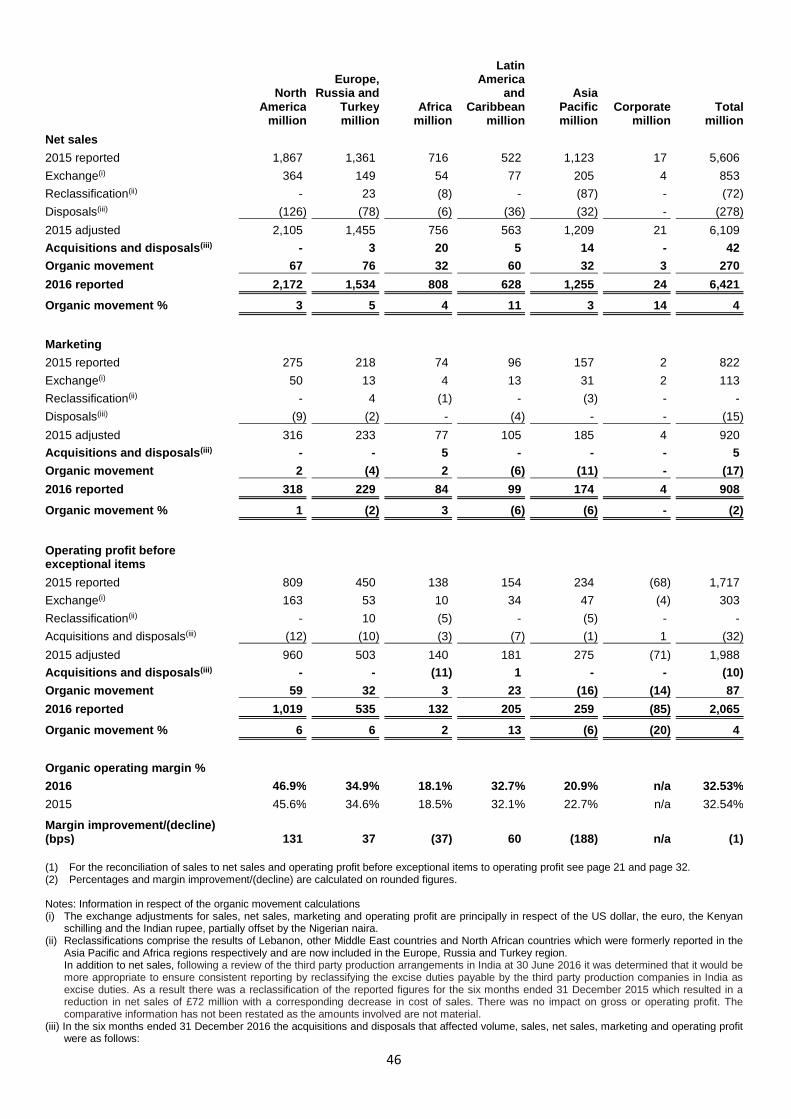
46
North America
million
Europe, Russia and
Turkey million
Africa million
Latin America
and Caribbean
million
Asia Pacific million
Corporate million
Total million
Net sales
2015 reported 1,867 1,361 716 522 1,123 17 5,606
Exchange(i) 364 149 54 77 205 4 853
Reclassification(ii) - 23 (8) - (87) - (72)
Disposals(iii) (126) (78) (6) (36) (32) - (278)
2015 adjusted 2,105 1,455 756 563 1,209 21 6,109
Acquisitions and disposals(iii) - 3 20 5 14 - 42
Organic movement 67 76 32 60 32 3 270
2016 reported 2,172 1,534 808 628 1,255 24 6,421
Organic movement % 3 5 4 11 3 14 4
Marketing
2015 reported 275 218 74 96 157 2 822
Exchange(i) 50 13 4 13 31 2 113
Reclassification(ii) - 4 (1) - (3) - -
Disposals(iii) (9) (2) - (4) - - (15)
2015 adjusted 316 233 77 105 185 4 920
Acquisitions and disposals(iii) - - 5 - - - 5
Organic movement 2 (4) 2 (6) (11) - (17)
2016 reported 318 229 84 99 174 4 908
Organic movement % 1 (2) 3 (6) (6) - (2)
Operating profit before exceptional items
2015 reported 809 450 138 154 234 (68) 1,717
Exchange(i) 163 53 10 34 47 (4) 303
Reclassification(ii) - 10 (5) - (5) - -
Acquisitions and disposals(iii) (12) (10) (3) (7) (1) 1 (32)
2015 adjusted 960 503 140 181 275 (71) 1,988
Acquisitions and disposals(iii) - - (11) 1 - - (10)
Organic movement 59 32 3 23 (16) (14) 87
2016 reported 1,019 535 132 205 259 (85) 2,065
Organic movement % 6 6 2 13 (6) (20) 4
Organic operating margin %
2016 46.9% 34.9% 18.1% 32.7% 20.9% n/a 32.53%
2015 45.6% 34.6% 18.5% 32.1% 22.7% n/a 32.54%
Margin improvement/(decline) (bps) 131 37 (37) 60 (188) n/a (1)
(1) For the reconciliation of sales to net sales and operating profit before exceptional items to operating profit see page 21 and page 32. (2) Percentages and margin improvement/(decline) are calculated on rounded figures. Notes: Information in respect of the organic movement calculations (i) The exchange adjustments for sales, net sales, marketing and operating profit are principally in respect of the US dollar, the euro, the Kenyan
schilling and the Indian rupee, partially offset by the Nigerian naira. (ii) Reclassifications comprise the results of Lebanon, other Middle East countries and North African countries which were formerly reported in the
Asia Pacific and Africa regions respectively and are now included in the Europe, Russia and Turkey region. In addition to net sales, following a review of the third party production arrangements in India at 30 June 2016 it was determined that it would be
more appropriate to ensure consistent reporting by reclassifying the excise duties payable by the third party production companies in India as excise duties. As a result there was a reclassification of the reported figures for the six months ended 31 December 2015 which resulted in a reduction in net sales of £72 million with a corresponding decrease in cost of sales. There was no impact on gross or operating profit. The comparative information has not been restated as the amounts involved are not material.
(iii) In the six months ended 31 December 2016 the acquisitions and disposals that affected volume, sales, net sales, marketing and operating profit were as follows:
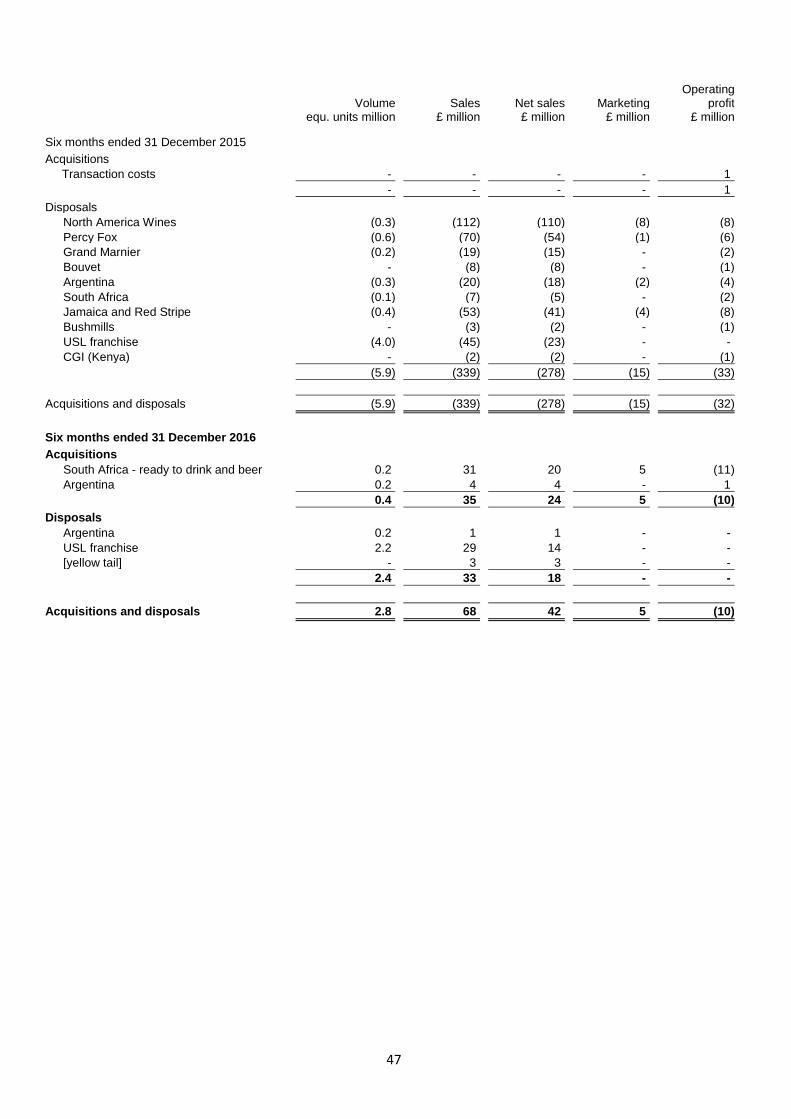
47
Operating Volume Sales Net sales Marketing profit
equ. units million £ million £ million £ million £ million
Six months ended 31 December 2015
Acquisitions
Transaction costs - - - - 1
- - - - 1
Disposals
North America Wines (0.3) (112) (110) (8) (8)
Percy Fox (0.6) (70) (54) (1) (6)
Grand Marnier (0.2) (19) (15) - (2)
Bouvet - (8) (8) - (1)
Argentina (0.3) (20) (18) (2) (4)
South Africa (0.1) (7) (5) - (2)
Jamaica and Red Stripe (0.4) (53) (41) (4) (8)
Bushmills - (3) (2) - (1)
USL franchise (4.0) (45) (23) - -
CGI (Kenya) - (2) (2) - (1)
(5.9) (339) (278) (15) (33)
Acquisitions and disposals (5.9) (339) (278) (15) (32)
Six months ended 31 December 2016
Acquisitions
South Africa - ready to drink and beer 0.2 31 20 5 (11)
Argentina 0.2 4 4 - 1
0.4 35 24 5 (10)
Disposals
Argentina 0.2 1 1 - -
USL franchise 2.2 29 14 - -
[yellow tail] - 3 3 - -
2.4 33 18 - -
Acquisitions and disposals 2.8 68 42 5 (10)
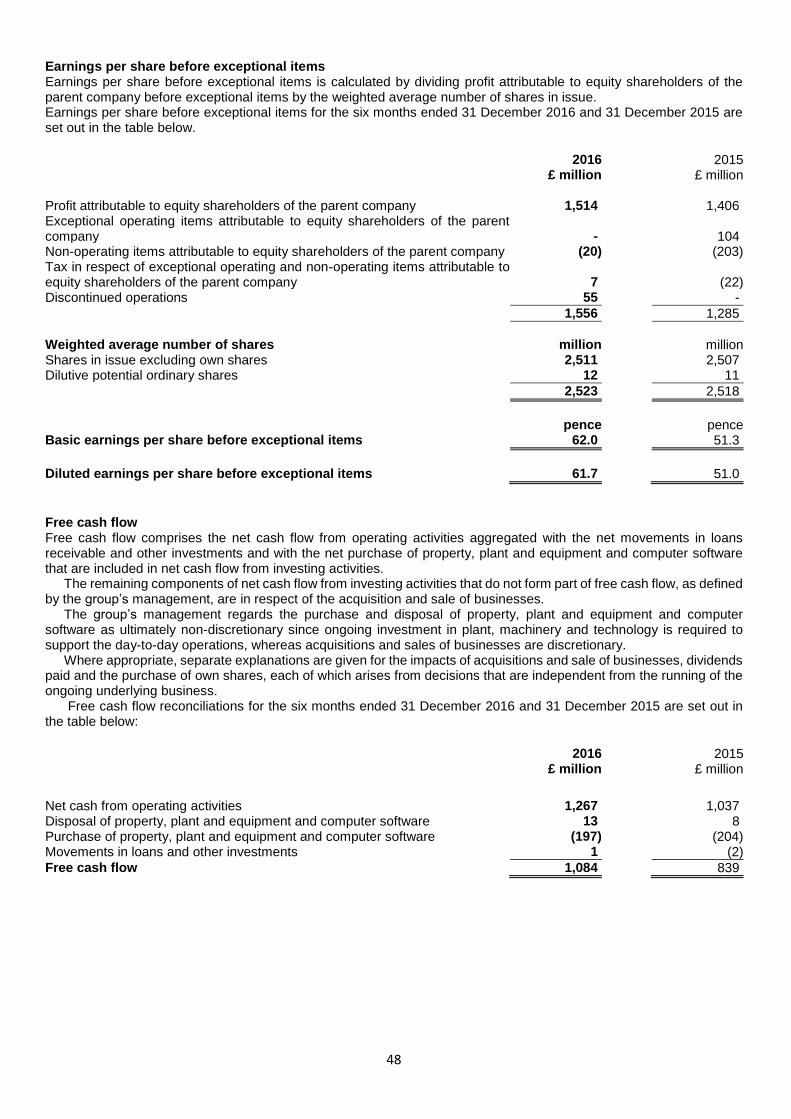
48
Earnings per share before exceptional items Earnings per share before exceptional items is calculated by dividing profit attributable to equity shareholders of the parent company before exceptional items by the weighted average number of shares in issue. Earnings per share before exceptional items for the six months ended 31 December 2016 and 31 December 2015 are set out in the table below. 2016 2015 £ million £ million Profit attributable to equity shareholders of the parent company 1,514 1,406 Exceptional operating items attributable to equity shareholders of the parent company - 104 Non-operating items attributable to equity shareholders of the parent company (20) (203) Tax in respect of exceptional operating and non-operating items attributable to equity shareholders of the parent company 7 (22) Discontinued operations 55 1 -
1,556 1,285
Weighted average number of shares million million Shares in issue excluding own shares 2,511 2,507 Dilutive potential ordinary shares 12 11
2,523 2,518
pence pence Basic earnings per share before exceptional items 62.0 51.3
Diluted earnings per share before exceptional items 61.7 51.0
Free cash flow Free cash flow comprises the net cash flow from operating activities aggregated with the net movements in loans receivable and other investments and with the net purchase of property, plant and equipment and computer software that are included in net cash flow from investing activities.
The remaining components of net cash flow from investing activities that do not form part of free cash flow, as defined by the group’s management, are in respect of the acquisition and sale of businesses.
The group’s management regards the purchase and disposal of property, plant and equipment and computer software as ultimately non-discretionary since ongoing investment in plant, machinery and technology is required to support the day-to-day operations, whereas acquisitions and sales of businesses are discretionary.
Where appropriate, separate explanations are given for the impacts of acquisitions and sale of businesses, dividends paid and the purchase of own shares, each of which arises from decisions that are independent from the running of the ongoing underlying business. Free cash flow reconciliations for the six months ended 31 December 2016 and 31 December 2015 are set out in the table below:
2016 2015
£ million £ million
Net cash from operating activities 1,267 1,037 Disposal of property, plant and equipment and computer software 13 8 Purchase of property, plant and equipment and computer software (197) (204) Movements in loans and other investments 1 (2)
Free cash flow 1,084 839
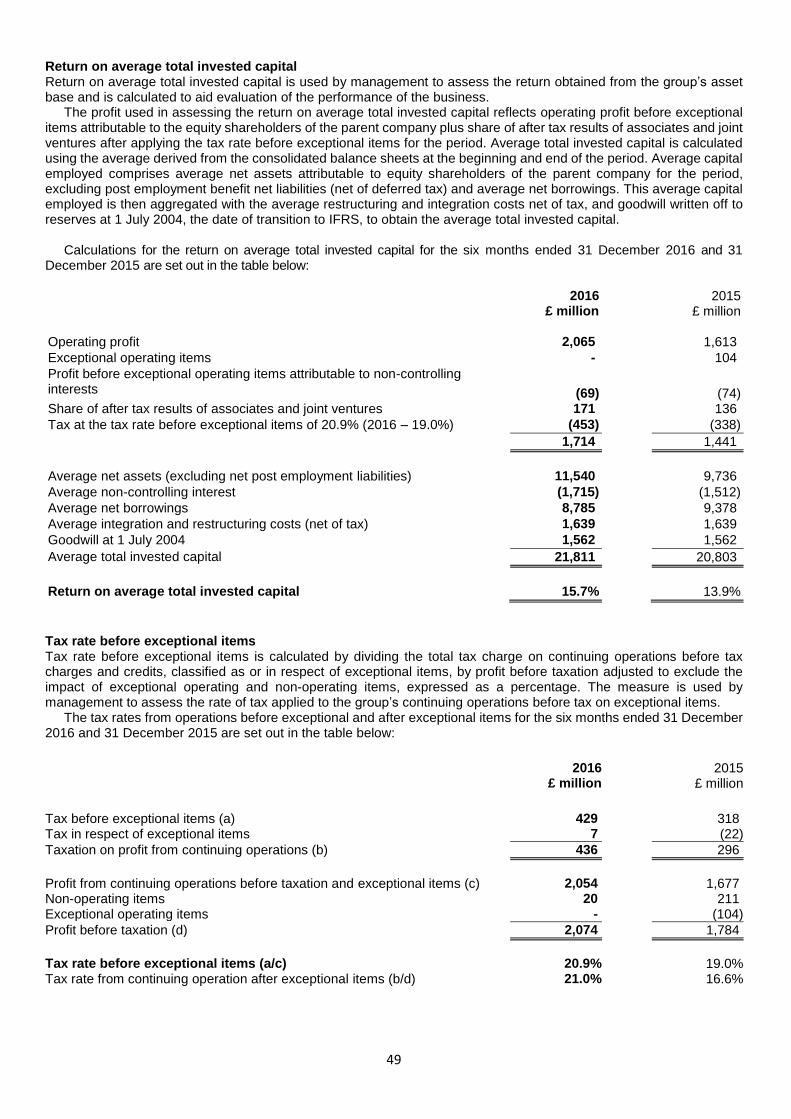
49
Return on average total invested capital Return on average total invested capital is used by management to assess the return obtained from the group’s asset base and is calculated to aid evaluation of the performance of the business.
The profit used in assessing the return on average total invested capital reflects operating profit before exceptional items attributable to the equity shareholders of the parent company plus share of after tax results of associates and joint ventures after applying the tax rate before exceptional items for the period. Average total invested capital is calculated using the average derived from the consolidated balance sheets at the beginning and end of the period. Average capital employed comprises average net assets attributable to equity shareholders of the parent company for the period, excluding post employment benefit net liabilities (net of deferred tax) and average net borrowings. This average capital employed is then aggregated with the average restructuring and integration costs net of tax, and goodwill written off to reserves at 1 July 2004, the date of transition to IFRS, to obtain the average total invested capital.
Calculations for the return on average total invested capital for the six months ended 31 December 2016 and 31 December 2015 are set out in the table below:
2016 2015 £ million £ million
Operating profit 2,065 1,613
Exceptional operating items - 104
Profit before exceptional operating items attributable to non-controlling interests
(69) (74) Share of after tax results of associates and joint ventures 171 136
Tax at the tax rate before exceptional items of 20.9% (2016 – 19.0%) (453) (338)
1,714 1,441
Average net assets (excluding net post employment liabilities) 11,540 9,736
Average non-controlling interest (1,715) (1,512)
Average net borrowings 8,785 9,378
Average integration and restructuring costs (net of tax) 1,639 1,639
Goodwill at 1 July 2004 1,562 1,562
Average total invested capital 21,811 20,803
Return on average total invested capital 15.7% 13.9%
Tax rate before exceptional items Tax rate before exceptional items is calculated by dividing the total tax charge on continuing operations before tax charges and credits, classified as or in respect of exceptional items, by profit before taxation adjusted to exclude the impact of exceptional operating and non-operating items, expressed as a percentage. The measure is used by management to assess the rate of tax applied to the group’s continuing operations before tax on exceptional items.
The tax rates from operations before exceptional and after exceptional items for the six months ended 31 December 2016 and 31 December 2015 are set out in the table below:
2016 £ million
2015 £ million
Tax before exceptional items (a) 429 318 Tax in respect of exceptional items 7 (22)
Taxation on profit from continuing operations (b) 436 296
Profit from continuing operations before taxation and exceptional items (c) 2,054 1,677 Non-operating items 20 211 Exceptional operating items - (104)
Profit before taxation (d) 2,074 1,784
Tax rate before exceptional items (a/c) 20.9% 19.0% Tax rate from continuing operation after exceptional items (b/d) 21.0% 16.6%
50
Other definitions Volume share is a brand’s retail volume expressed as a percentage of the retail volume of all brands in its segment. Value share is a brand’s retail sales value expressed as a percentage of the retail sales value of all brands in its segment. Unless otherwise stated, share refers to value share.
Price/mix is the number of percentage points by which the organic movement in net sales differs to the organic movement in volume. The difference arises because of changes in the composition of sales between higher and lower priced variants/markets or as price changes are implemented.
Shipments comprise the volume of products made to Diageo’s immediate customers. Depletions are the estimated volume of the first onward sales made by our direct customers. Both shipments and depletions are measured on an equivalent units basis.
References to emerging markets include Russia, Eastern Europe, Turkey, Africa, Latin America and Caribbean, and Asia Pacific (excluding Australia, Korea and Japan).
References to reserve brands include, but not limited to, Johnnie Walker Blue Label, Johnnie Walker Green Label, Johnnie Walker Gold Label 18 year old, Johnnie Walker Gold Label Reserve, Johnnie Walker Platinum Label 18 year old, John Walker & Sons Collection, Johnnie Walker The Gold Route, Johnnie Walker The Royal Route and other Johnnie Walker super premium brands; The Singleton, Cardhu, Talisker, Lagavulin and other malt brands; Buchanan’s Special Reserve, Buchanan’s Red Seal; Bulleit Bourbon, Bulleit Rye; Tanqueray No. TEN, Tanqueray Malacca Gin; Cîroc, Ketel One vodka; Don Julio, Zacapa, Bundaberg SDlx, Shui Jing Fang, Jinzu gin, Haig Club whisky, Orphan Barrel whiskey and DeLeón Tequila.
References to global giants include the following brand families: Johnnie Walker, Smirnoff, Captain Morgan, Baileys, Tanqueray and Guinness. Local stars spirits include Buchanan’s, Bundaberg, Crown Royal, JεB, McDowell’s, Old Parr, Yenì Raki, Black and White, Shui Jing Fang, Windsor and Ypióca. Global giants and local stars exclude ready to drink.
References to ready to drink also include ready to serve products, such as pre-mix cans in some markets, and progressive adult beverages in the United States and certain markets supplied by the United States.
References to beer include some non-alcoholic products such as Malta Guinness. References to the group include Diageo plc and its consolidated subsidiaries.
51
RISK FACTORS Diageo’s products are sold in over 180 countries worldwide, which subjects Diageo to risks and uncertainties in multiple jurisdictions across developed and developing markets. The group’s aim is to manage risk and control its business and financial activities cost-effectively and in a manner that enables it to: exploit profitable business opportunities in a disciplined way; avoid or reduce risks that can cause loss, reputational damage or business failure; manage and mitigate historic risks and exposures of the group; support operational effectiveness; and enhance resilience to external events. To achieve this, an ongoing process has been established for identifying, evaluating and managing risks faced by the group. A detailed description of the key risks and uncertainties facing the group are described in the ’Strategic report’ section of the annual report for the year ended 30 June 2016 and under ‘Risk Factors’ in the annual report on Form 20-F for the year ended 30 June 2016. These key risks and uncertainties include: unfavourable economic, social, or political or other developments and risks in the countries in which Diageo operates including the impact of the decision in the recent UK referendum to leave the European Union; changes in consumer preferences and tastes and adverse impacts of a declining economy, among many factors, may adversely affect demand; litigation directed at the beverage alcohol industry and other litigation; climate change, or legal, regulatory or market measures to address climate change; water scarcity or poor quality; increased costs of raw materials or energy; regulatory decisions and changes in the legal, international tax and regulatory environment could increase Diageo’s costs and liabilities, increase the effective tax rate or limit its business activities; consequences of failure to comply with anti-corruption laws; failure to maintain Diageo’s brand image and corporate reputation; competition may reduce Diageo’s market share and margins; expected benefits may not be derived from Diageo’s business strategies or from its acquisitions or its cost-saving and restructuring programmes designed to enhance earnings; contamination, counterfeiting or other events could harm integrity of customer support for Diageo’s brands and adversely affect the sales of those brands; increased costs or shortages of talent; disruption to production facilities, business service centres or information systems (including cyber-attacks) and change programs may not deliver the benefits intended; movements in the value of Diageo’s pension funds, fluctuations in exchange rates and interest rates; failure to maintain or renegotiate distribution, supply, manufacturing and licence agreements on favourable terms; inability to protect Diageo’s intellectual property rights; and difficulty in effecting service of US process and enforcing US legal process against the directors of Diageo. Cautionary statement concerning forward-looking statements This document contains ‘forward-looking’ statements. These statements can be identified by the fact that they do not relate only to historical or current facts. In particular, forward-looking statements include all statements that express forecasts, expectations, plans, outlook, objectives and projections with respect to future matters, including trends in results of operations, margins, growth rates, overall market trends, the impact of changes in interest or exchange rates, the availability or cost of financing to Diageo, anticipated cost savings or synergies, expected investments, the completion of Diageo's strategic transactions and restructuring programmes, anticipated tax rates, changes in the international tax environment, expected cash payments, outcomes of litigation, anticipated deficit reductions in relation to pension schemes and general economic conditions. By their nature, forward-looking statements involve risk and uncertainty because they relate to events and depend on circumstances that will occur in the future. There are a number of factors that could cause actual results and developments to differ materially from those expressed or implied by these forward-looking statements, including factors that are outside Diageo's control. These factors include, but are not limited to:
economic, political, social or other developments in countries and markets in which Diageo operates, which may contribute to reduced demand for Diageo’s products, reduced consumer spending, negative impacts on Diageo’s customer, supplier and financial counterparties or the imposition of import, investment or currency restrictions;
the results of the decision in the United Kingdom’s referendum on 23 June 2016 to leave the European Union and its stated intention to exit the single market, which may lead to a sustained period of economic and political uncertainty and complexity until the detailed terms of the United Kingdom’s exit from the European Union and any successor trading arrangements with other countries are finalised, which may negatively impact economic conditions in Europe more generally and could have an adverse impact on Diageo's business operations and financial performance;
changes in consumer preferences and tastes, including as a result of changes in demographic and social trends, public health regulations and travel, vacation or leisure activity patterns, or as a result of contamination, counterfeiting or other circumstances which could harm the integrity or sales of Diageo’s brands;
any litigation or other similar proceedings (including with tax, customs and other regulatory authorities), including that directed at the drinks and spirits industry generally or at Diageo in particular, or the impact of a product recall or product liability claim on Diageo’s profitability or reputation;
the effects of climate change and related regulations and other measures to address climate change, including any resulting impact on the cost and supply of water;
52
changes in the cost of production, including as a result of increases in the cost of commodities, labour and/or energy or as a result of inflation;
legal and regulatory developments, including changes in regulations regarding production, product liability, distribution, importation, labelling, packaging, consumption, advertising and data privacy; changes in tax law (including tax treaties), rates or requirements (including with respect to the impact of excise tax increases) or accounting standards; and changes in environmental laws, health regulations and the laws governing labour and pensions;
changes to the international tax environment such as the OECD Base Erosion and Profit Shifting Initiative and EU anti-tax abuse measures resulting in uncertainty around the application of existing and new tax laws, leading to unexpected tax exposures;
the consequences of any failure by Diageo to comply with anti-corruption and other laws and regulations or any failure of Diageo’s related internal policies and procedures to comply with applicable law;
ability to maintain Diageo’s brand image and corporate reputation or to adapt to a changing media environment, and exposure to adverse publicity, whether or not justified, and any resulting impacts on Diageo’s reputation and the likelihood that consumers choose products offered by Diageo’s competitors;
increased competitive product and pricing pressures, including as a result of actions by increasingly consolidated competitors, that could negatively impact Diageo’s market share, distribution network, costs or pricing;
the effects of Diageo’s business strategies, including in relation to expansion in emerging markets and growth of participation in international premium spirits markets, the effects of business combinations, partnerships, acquisitions or disposals, existing or future, and the ability to realise expected synergies and/or costs savings;
Diageo’s ability to benefit from its strategy, including its ability to expand into new markets, to complete and benefit from existing or future business combinations or other transactions, to implement cost saving and productivity initiatives or to forecast inventory levels successfully;
contamination, counterfeiting or other events that could adversely affect the perception of Diageo’s brands;
increased costs or shortages of talent;
disruption to production facilities or business service centres or information systems (including cyber-attack), existing or future;
fluctuations in exchange rates and interest rates, which may impact the value of transactions and assets denominated in other currencies, increase the cost of financing or otherwise affect Diageo’s financial results;
movements in the value of the assets and liabilities related to Diageo’s pension funds;
renewal of supply, distribution, manufacturing or licence agreements (or related rights) and licences on favourable terms or at all when they expire; and
failure of Diageo to protect its intellectual property rights. All oral and written forward-looking statements made on or after the date of this document and attributable to Diageo are expressly qualified in their entirety by the above factors and by the ‘Risk factors’ section above. Any forward-looking statements made by or on behalf of Diageo speak only as of the date they are made. Diageo does not undertake to update forward-looking statements to reflect any changes in Diageo's expectations with regard thereto or any changes in events, conditions or circumstances on which any such statement is based. The reader should, however, consult any additional disclosures that Diageo may make in any documents which it publishes and/or files with the US Securities and Exchange Commission (SEC). All readers, wherever located, should take note of these disclosures. This document includes names of Diageo's products, which constitute trademarks or trade names which Diageo owns, or which others own and license to Diageo for use. All rights reserved. © Diageo plc 2017. The information in this document does not constitute an offer to sell or an invitation to buy shares in Diageo plc or an invitation or inducement to engage in any other investment activities. This document may include information about Diageo’s target debt rating. A security rating is not a recommendation to buy, sell or hold securities and may be subject to revision or withdrawal at any time by the assigning rating organisation. Each rating should be evaluated independently of any other rating. Past performance cannot be relied upon as a guide to future performance.
53
STATEMENT OF DIRECTORS’ RESPONSIBILITIES Each of the directors of Diageo plc confirms, to the best of his or her knowledge, that:
the condensed set of financial statements has been prepared in accordance with IAS 34 Interim Financial Reporting as issued by the IASB and endorsed and adopted by the EU and give a true and fair view of the assets, liabilities, financial position and profit and loss of Diageo plc;
the interim management report includes a fair review of the information required by:
(a) DTR 4.2.7R of the Disclosure Guidance and Transparency Rules sourcebook of the United Kingdom’s
Financial Conduct Authority, being an indication of important events that have occurred during the first six months of the financial year and their impact on the condensed set of financial statements; and a description of the principal risks and uncertainties for the remaining six months of the year; and
(b) DTR 4.2.8R of the Disclosure Guidance and Transparency Rules sourcebook of the United Kingdom’s Financial Conduct Authority, being related party transactions that have taken place in the first six months of the current financial year and that have materially affected the financial position or performance of the group during that period; and any changes in the related party transactions described in the last annual report that could do so.
The directors of Diageo plc are as follows: Javier Ferrán (Chairman), Ivan Menezes (Chief Executive), Kathryn Mikells (Chief Financial Officer), Lord Davies of Abersoch (Senior Non-Executive Director and Chairman of the Remuneration Committee), Alan Stewart (Non-Executive Director and Chairman of the Audit Committee) and Non-Executive Directors: Peggy B Bruzelius, Betsy D Holden, Ho Kwon Ping, Nicola Mendelsohn and Philip G Scott.
54
Diageo will release its interim results for the six months ended 31 December 2016 on Thursday 26 January 2017.
Webcast, presentation slides and transcript
At 07.15 (UK time) on Thursday 26 January, Ivan Menezes, Chief Executive and Kathryn Mikells, Chief Financial Officer will present Diageo’s interim results as a webcast. This will be available to view at www.diageo.com. The presentation slides and script will also be available to download from www.diageo.com at 07.15 (UK time).
A transcript of the Q&A session will be available for download on 27 January 2017 at www.diageo.com.
Live Q&A conference call and replay
Ivan Menezes, Chief Executive and Kathryn Mikells, Chief Financial Officer will be hosting a Q&A conference call on Thursday 26 January 2017 at 09:30 (UK time). If you would like to listen to the call or ask a question, please use the dial in details below.
From the UK: 0844 571 8892
From the UK (free call): 0800 376 7922
From the USA (local): 1 631 510 7495
From the USA (free call): 1 866 966 1396
International dial in number: +44 (0) 20 7192 8000
The conference call is for analysts and investors only. To join the call please use the password already sent to you or email [email protected].
To hear a replay of the call, please use the telephone numbers below:
From the UK: 0844 338 6600
From the UK (free call): 0800 953 1533
From the USA (free call): 1 866 247 4222
International dial in number: +44 (0)1452 550 000
Investor enquiries to: Andy Ryan +44 (0) 20 8978 6504
Pier Falcione +44 (0) 20 8978 4838
Rohit Vats +44 (0) 20 8978 1064
Media enquiries to: Kirsty King +44 (0) 20 8978 6855
Clemmie Raynsford +44 (0) 20 8978 6168
Dominic Redfearn +44 (0) 20 8978 2749