intermediate, academic, & honors algebra ii 033040, 033240, 033450: intermediate, academic &...
TRANSCRIPT
FREEHOLD REGIONAL HIGH SCHOOL DISTRICT
OFFICE OF CURRICULUM AND INSTRUCTION
MATHEMATICS DEPARTMENT
INTERMEDIATE, ACADEMIC, & HONORS
ALGEBRA II
Grade Level: 9-12
Credits: 5
Course Code: 133240, 033040, 033240, & 033450
BOARD OF EDUCATION ADOPTION DATE:
AUGUST 25, 2014
FREEHOLD REGIONAL HIGH SCHOOL DISTRICT
Board of Education
Mr. Heshy Moses, President Mrs. Jennifer Sutera, Vice President
Mr. Carl Accettola Mr. William Bruno
Mrs. Elizabeth Canario Mrs. Amy Fankhauser
Mrs. Kathie Lavin Mr. Michael Messinger Ms. Maryanne Tomazic
Mr. Charles Sampson, Superintendent
Dr. Jeffrey Moore, Director of Curriculum and Instruction
Curriculum Writing Committee Ms. Lisa Boyce
Ms. Marylu Dalton Ms. Courtney Heller Ms. Jessica Marshall Ms. Kimberly Urban Ms. Kristen Yannette
Supervisors Ms. Deana Farinick
Ms. Angelique Gauthier Mr. Joseph Iacullo
Ms. Annette Kinsley Ms. Jennifer Okerson
Ms. Denise Scanga
133240, 033040, 033240, 033450: INTERMEDIATE, ACADEMIC & HONORS ALGEBRA II
COURSE PHILOSOPHY
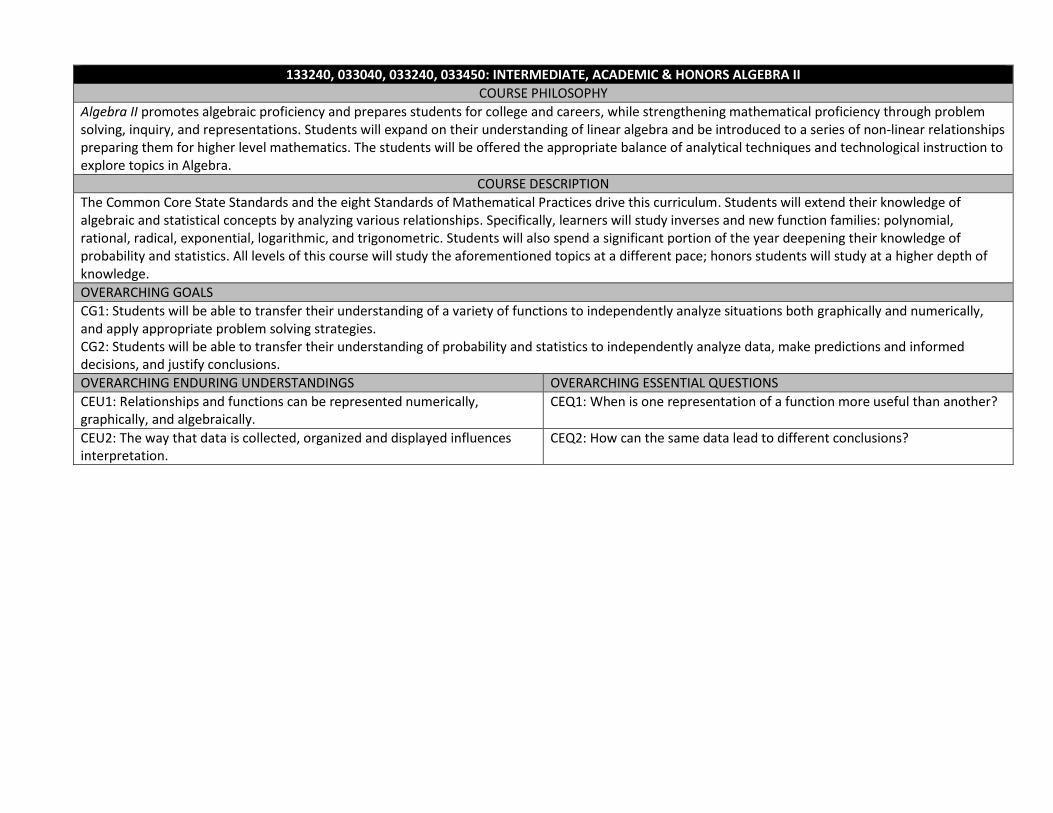
Algebra II promotes algebraic proficiency and prepares students for college and careers, while strengthening mathematical proficiency through problem solving, inquiry, and representations. Students will expand on their understanding of linear algebra and be introduced to a series of non-linear relationships preparing them for higher level mathematics. The students will be offered the appropriate balance of analytical techniques and technological instruction to explore topics in Algebra.
COURSE DESCRIPTION
The Common Core State Standards and the eight Standards of Mathematical Practices drive this curriculum. Students will extend their knowledge of algebraic and statistical concepts by analyzing various relationships. Specifically, learners will study inverses and new function families: polynomial, rational, radical, exponential, logarithmic, and trigonometric. Students will also spend a significant portion of the year deepening their knowledge of probability and statistics. All levels of this course will study the aforementioned topics at a different pace; honors students will study at a higher depth of knowledge.
OVERARCHING GOALS
CG1: Students will be able to transfer their understanding of a variety of functions to independently analyze situations both graphically and numerically, and apply appropriate problem solving strategies. CG2: Students will be able to transfer their understanding of probability and statistics to independently analyze data, make predictions and informed decisions, and justify conclusions.
OVERARCHING ENDURING UNDERSTANDINGS OVERARCHING ESSENTIAL QUESTIONS
CEU1: Relationships and functions can be represented numerically, graphically, and algebraically.
CEQ1: When is one representation of a function more useful than another?
CEU2: The way that data is collected, organized and displayed influences interpretation.
CEQ2: How can the same data lead to different conclusions?
UNIT GOALS & PACING
UNIT TITLE UNIT GOALS RECOMMENDED
DURATION
Unit 1: Linear Algebra
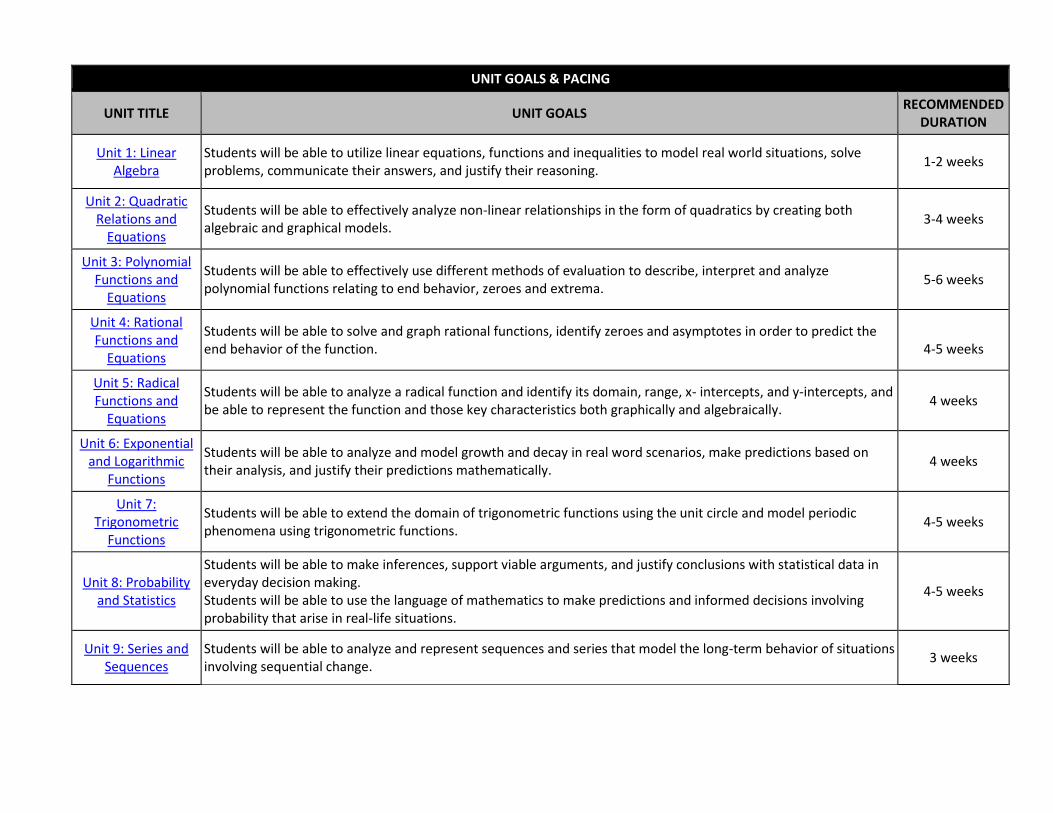
Students will be able to utilize linear equations, functions and inequalities to model real world situations, solve problems, communicate their answers, and justify their reasoning.
1-2 weeks
Unit 2: Quadratic Relations and
Equations
Students will be able to effectively analyze non-linear relationships in the form of quadratics by creating both algebraic and graphical models.
3-4 weeks
Unit 3: Polynomial Functions and
Equations
Students will be able to effectively use different methods of evaluation to describe, interpret and analyze polynomial functions relating to end behavior, zeroes and extrema.
5-6 weeks
Unit 4: Rational Functions and
Equations
Students will be able to solve and graph rational functions, identify zeroes and asymptotes in order to predict the end behavior of the function.
4-5 weeks
Unit 5: Radical Functions and
Equations
Students will be able to analyze a radical function and identify its domain, range, x- intercepts, and y-intercepts, and be able to represent the function and those key characteristics both graphically and algebraically.
4 weeks
Unit 6: Exponential and Logarithmic
Functions
Students will be able to analyze and model growth and decay in real word scenarios, make predictions based on their analysis, and justify their predictions mathematically.
4 weeks
Unit 7: Trigonometric
Functions
Students will be able to extend the domain of trigonometric functions using the unit circle and model periodic phenomena using trigonometric functions.
4-5 weeks
Unit 8: Probability and Statistics
Students will be able to make inferences, support viable arguments, and justify conclusions with statistical data in everyday decision making. Students will be able to use the language of mathematics to make predictions and informed decisions involving probability that arise in real-life situations.
4-5 weeks
Unit 9: Series and Sequences
Students will be able to analyze and represent sequences and series that model the long-term behavior of situations involving sequential change.
3 weeks
133240, 033040, 033240, 033450: INTERMEDIATE, ACADEMIC & HONORS ALGEBRA II
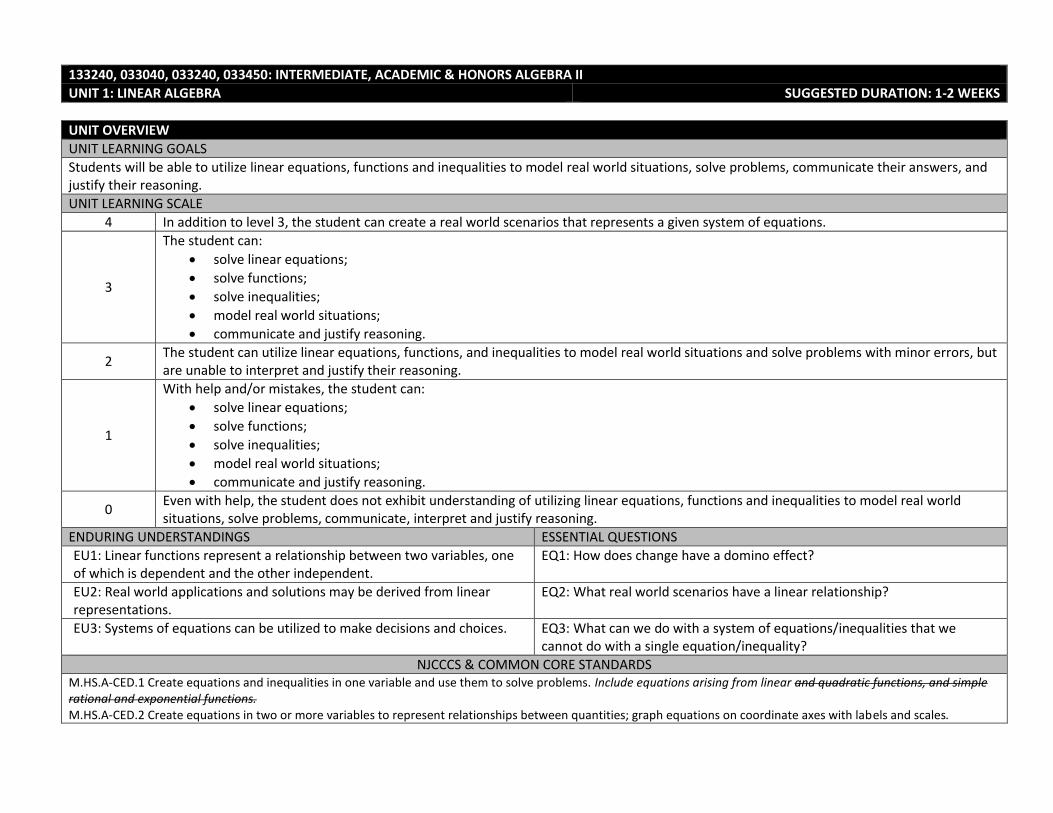
UNIT 1: LINEAR ALGEBRA SUGGESTED DURATION: 1-2 WEEKS
UNIT OVERVIEW
UNIT LEARNING GOALS
Students will be able to utilize linear equations, functions and inequalities to model real world situations, solve problems, communicate their answers, and justify their reasoning.
UNIT LEARNING SCALE
4 In addition to level 3, the student can create a real world scenarios that represents a given system of equations.
3
The student can:
solve linear equations;
solve functions;
solve inequalities;
model real world situations;
communicate and justify reasoning.
2 The student can utilize linear equations, functions, and inequalities to model real world situations and solve problems with minor errors, but are unable to interpret and justify their reasoning.
1
With help and/or mistakes, the student can:
solve linear equations;
solve functions;
solve inequalities;
model real world situations;
communicate and justify reasoning.
0 Even with help, the student does not exhibit understanding of utilizing linear equations, functions and inequalities to model real world situations, solve problems, communicate, interpret and justify reasoning.
ENDURING UNDERSTANDINGS ESSENTIAL QUESTIONS
EU1: Linear functions represent a relationship between two variables, one of which is dependent and the other independent.
EQ1: How does change have a domino effect?
EU2: Real world applications and solutions may be derived from linear representations.
EQ2: What real world scenarios have a linear relationship?
EU3: Systems of equations can be utilized to make decisions and choices. EQ3: What can we do with a system of equations/inequalities that we cannot do with a single equation/inequality?
NJCCCS & COMMON CORE STANDARDS M.HS.A-CED.1 Create equations and inequalities in one variable and use them to solve problems. Include equations arising from linear and quadratic functions, and simple rational and exponential functions. M.HS.A-CED.2 Create equations in two or more variables to represent relationships between quantities; graph equations on coordinate axes with labels and scales.

NJCCCS & COMMON CORE STANDARDS M.HS.A-CED.3 Represent constraints by equations or inequalities, and by systems of equations and/or inequalities, and interpret solutions as viable or nonviable options in a modeling context. M.HS.A-CED.4 Rearrange formulas to highlight a quantity of interest, using the same reasoning as in solving equations. For example, rearrange Ohm’s law V = IR to highlight resistance R. M.HS.A-REI.1 Explain each step in solving a simple equation as following from the equality of numbers asserted at the previous step, starting from the assumption that the original equation has a solution. Construct a viable argument to justify a solution method. M.HS.A-REI.6 Solve systems of linear equations exactly and approximately (e.g., with graphs), focusing on pairs of linear equations in two variables . M.HS.A-REI.11 Explain why the x-coordinates of the points where the graphs of the equations y=f(x), and y=g(x) intersect are the solutions of the equation f(x) = g(x); find the solutions approximately, e.g., using technology to graph the function, make tables of values, or find successive approximations. M.HS.F-IF.6 Calculate and interpret the average rate of change of a function (presented symbolically or as a table over a specified interval. Estimate the rate of change from a graph. M.HS.F-IF.7c Graph square root, cube root, and piecewise-defined functions, including step functions and absolute value functions. M.HS.A-SSE.1 Interpret expressions that represent a quantity in terms of its context.
COMMON ASSESSMENT
ALIGNMENT DESCRIPTION
LG1 EU1, EQ1 EU2, EQ2 EU3, EQ3 A.CED.1, A.CED.2, A.CED.3, A.REI.1, A.REI.11 SMP 2, 3, 4 DOK 4
Given a business or financial model, students will investigate rate of change using linear relationships and create and solve a system of linear equations in a real-world scenario (i.e. cell phone cost benefit analysis/commercial scenario/piecewise analysis of credit cards, comparing a hybrid car versus a gas car). Students will graph the linear system, interpret the data, and justify it algebraically. Students must also communicate their reasoning.
SUGGESTED STRATEGIES
ACTIVITIES DECLARATIVE KNOWLEDGE PROCEDURAL KNOWLEDGE
Piecewise Function Activity: Students will graph piecewise functions and analyze the data.
Utilize flexible grouping.
Rate of Change, Slope Intercept Form, Fixed/Variable Cost, Piecewise Functions DOK 1
Model Linear Functions
Graph Systems
Solve Systems DOK 3 SMP 1, 2, 4
133240, 033040, 033240, 033450: INTERMEDIATE, ACADEMIC & HONORS ALGEBRA II
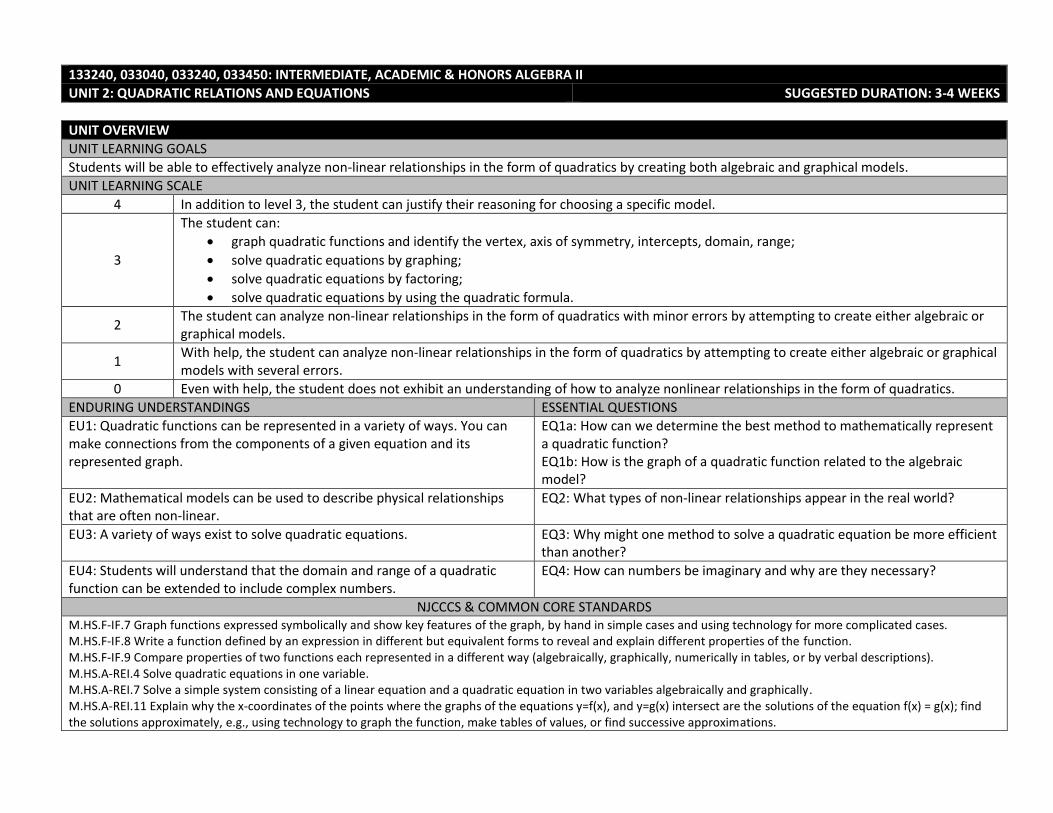
UNIT 2: QUADRATIC RELATIONS AND EQUATIONS SUGGESTED DURATION: 3-4 WEEKS
UNIT OVERVIEW
UNIT LEARNING GOALS
Students will be able to effectively analyze non-linear relationships in the form of quadratics by creating both algebraic and graphical models.
UNIT LEARNING SCALE
4 In addition to level 3, the student can justify their reasoning for choosing a specific model.
3
The student can:
graph quadratic functions and identify the vertex, axis of symmetry, intercepts, domain, range;
solve quadratic equations by graphing;
solve quadratic equations by factoring;
solve quadratic equations by using the quadratic formula.
2 The student can analyze non-linear relationships in the form of quadratics with minor errors by attempting to create either algebraic or graphical models.
1 With help, the student can analyze non-linear relationships in the form of quadratics by attempting to create either algebraic or graphical models with several errors.
0 Even with help, the student does not exhibit an understanding of how to analyze nonlinear relationships in the form of quadratics.
ENDURING UNDERSTANDINGS ESSENTIAL QUESTIONS
EU1: Quadratic functions can be represented in a variety of ways. You can make connections from the components of a given equation and its represented graph.
EQ1a: How can we determine the best method to mathematically represent a quadratic function? EQ1b: How is the graph of a quadratic function related to the algebraic model?
EU2: Mathematical models can be used to describe physical relationships that are often non-linear.
EQ2: What types of non-linear relationships appear in the real world?
EU3: A variety of ways exist to solve quadratic equations. EQ3: Why might one method to solve a quadratic equation be more efficient than another?
EU4: Students will understand that the domain and range of a quadratic function can be extended to include complex numbers.
EQ4: How can numbers be imaginary and why are they necessary?
NJCCCS & COMMON CORE STANDARDS M.HS.F-IF.7 Graph functions expressed symbolically and show key features of the graph, by hand in simple cases and using technology for more complicated cases. M.HS.F-IF.8 Write a function defined by an expression in different but equivalent forms to reveal and explain different properties of the function. M.HS.F-IF.9 Compare properties of two functions each represented in a different way (algebraically, graphically, numerically in tables, or by verbal descriptions). M.HS.A-REI.4 Solve quadratic equations in one variable. M.HS.A-REI.7 Solve a simple system consisting of a linear equation and a quadratic equation in two variables algebraically and graphically. M.HS.A-REI.11 Explain why the x-coordinates of the points where the graphs of the equations y=f(x), and y=g(x) intersect are the solutions of the equation f(x) = g(x); find the solutions approximately, e.g., using technology to graph the function, make tables of values, or find successive approximations.
NJCCCS & COMMON CORE STANDARDS
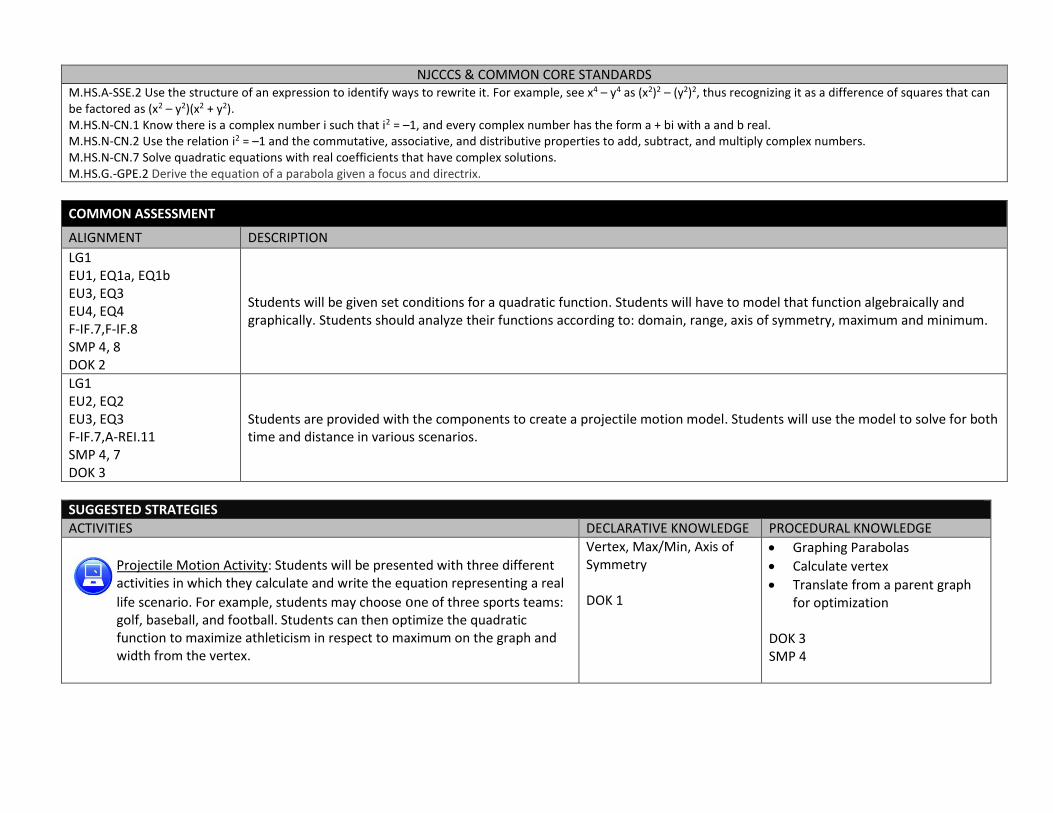
M.HS.A-SSE.2 Use the structure of an expression to identify ways to rewrite it. For example, see x4 – y4 as (x2)2 – (y2)2, thus recognizing it as a difference of squares that can be factored as (x2 – y2)(x2 + y2). M.HS.N-CN.1 Know there is a complex number i such that i2 = –1, and every complex number has the form a + bi with a and b real. M.HS.N-CN.2 Use the relation i2 = –1 and the commutative, associative, and distributive properties to add, subtract, and multiply complex numbers. M.HS.N-CN.7 Solve quadratic equations with real coefficients that have complex solutions. M.HS.G.-GPE.2 Derive the equation of a parabola given a focus and directrix.
COMMON ASSESSMENT
ALIGNMENT DESCRIPTION
LG1 EU1, EQ1a, EQ1b EU3, EQ3 EU4, EQ4 F-IF.7,F-IF.8 SMP 4, 8 DOK 2
Students will be given set conditions for a quadratic function. Students will have to model that function algebraically and graphically. Students should analyze their functions according to: domain, range, axis of symmetry, maximum and minimum.
LG1 EU2, EQ2 EU3, EQ3 F-IF.7,A-REI.11 SMP 4, 7 DOK 3
Students are provided with the components to create a projectile motion model. Students will use the model to solve for both time and distance in various scenarios.
SUGGESTED STRATEGIES
ACTIVITIES DECLARATIVE KNOWLEDGE PROCEDURAL KNOWLEDGE
Projectile Motion Activity: Students will be presented with three different activities in which they calculate and write the equation representing a real
life scenario. For example, students may choose one of three sports teams: golf, baseball, and football. Students can then optimize the quadratic function to maximize athleticism in respect to maximum on the graph and width from the vertex.
Vertex, Max/Min, Axis of Symmetry DOK 1
Graphing Parabolas
Calculate vertex
Translate from a parent graph for optimization
DOK 3 SMP 4

ACTIVITIES DECLARATIVE KNOWLEDGE PROCEDURAL KNOWLEDGE Students will design a sign that uses the largest area.
Have students split up into groups and artistically create an original marketing sign. Then students can create a second sign that would upgrade that sign in both size and creativity for marketing purpose. Have each student in that group take on a specific role, and then have the students vote for who the “project coordinator” would be for the renovation for this sign.
Area formula of a Rectangle, Roots, Zeroes, Quadratic Standard Dorm DOK 1
Calculate the vertex
Solve for zeroes or roots DOK 3 SMP 2, 4, 6

133240, 033040, 033240, 033450: INTERMEDIATE, ACADEMIC & HONORS ALGEBRA II
UNIT 3: POLYNOMIAL FUNCTIONS AND EQUATIONS SUGGESTED DURATION: 5-6 WEEKS
UNIT OVERVIEW
UNIT LEARNING GOALS
Students will be able to effectively use different methods of evaluation to describe, interpret and analyze polynomial functions relating to end behavior, zeroes and extrema.
UNIT LEARNING SCALE
4 In addition to level 3, the student can evaluate the model’s appropriateness and make predictions regarding the model.
3
The student can:
graph polynomial functions;
describe end behavior;
solve and graph zeroes;
describe extrema.
2 The student can describe polynomial functions relating to end behavior, zeroes and extrema, but are unable to interpret or analyze them.
1 With help, the student can describe polynomial functions relating to end behavior, zeroes and extrema but are unable to interpret or analyze them.
0 Even with help, the student cannot describe, interpret and analyze polynomial functions relating to end behavior, zeroes and extrema.
ENDURING UNDERSTANDINGS ESSENTIAL QUESTIONS
EU1: There are connections between graphic and algebraic representations of a polynomial function.
EQ1: How is the graph of a polynomial function related to its algebraic model?
EU2: Polynomial functions can be utilize to model real world scenarios. EQ2: Could life exist without polynomials?
NJCCCS & COMMON CORE STANDARDS M.HS.F-IF.4 For a function that models a relationship between two quantities, interpret key features of graphs and tables in terms of the quantities, and sketch graphs sowing key features given a verbal description of the relationship. Key features include: intercepts; intervals where the function is increasing, decreasing, positive, or negative; relative maximums and minimums; symmetries; end behavior; and periodicity. M.HS.F-IF.7 Graph functions expressed symbolically and show key features of the graph, by hand in simple cases and using technology for more complicated cases. M.HS.F-IF.7c Graph polynomial functions, identifying zeroes when suitable factorizations are available, and showing end behavior. M.HS.A-APR.1 Understand that polynomials form a system analogous to the integers, namely, they are closed under the operations of addition, subtraction, and multiplication; add, subtract, and multiply polynomials. M.HS.A-APR.2 Know and apply the Remainder Theorem: For a polynomial p(x) and a number a, the remainder on division by x – a is p(a), so p(a) = 0 if and only if (x – a) is a factor of p(x). M.HS.A-APR.3 Identify zeroes of polynomials when suitable factorizations are available, and use the zeroes to construct a rough graph of the function defined by the polynomial.
COMMON ASSESSMENT
ALIGNMENT DESCRIPTION
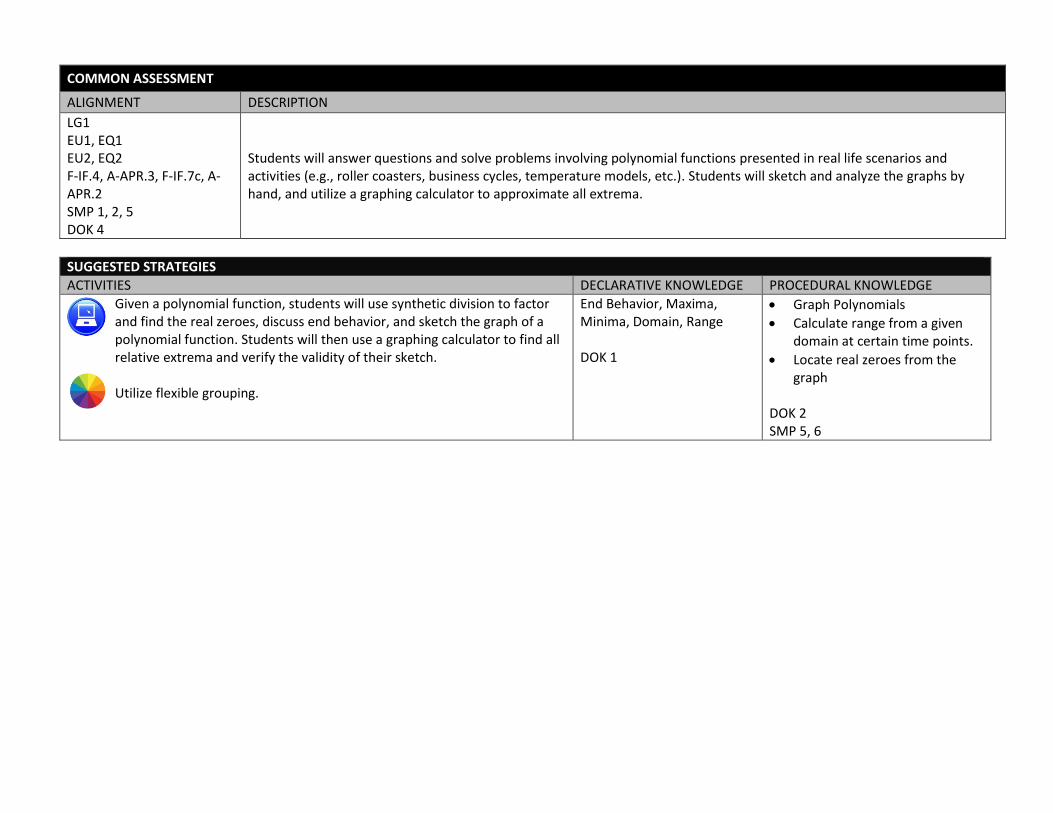
LG1 EU1, EQ1 EU2, EQ2 F-IF.4, A-APR.3, F-IF.7c, A-APR.2 SMP 1, 2, 5 DOK 4
Students will answer questions and solve problems involving polynomial functions presented in real life scenarios and activities (e.g., roller coasters, business cycles, temperature models, etc.). Students will sketch and analyze the graphs by hand, and utilize a graphing calculator to approximate all extrema.
SUGGESTED STRATEGIES
ACTIVITIES DECLARATIVE KNOWLEDGE PROCEDURAL KNOWLEDGE
Given a polynomial function, students will use synthetic division to factor and find the real zeroes, discuss end behavior, and sketch the graph of a polynomial function. Students will then use a graphing calculator to find all relative extrema and verify the validity of their sketch. Utilize flexible grouping.
End Behavior, Maxima, Minima, Domain, Range DOK 1
Graph Polynomials
Calculate range from a given domain at certain time points.
Locate real zeroes from the graph
DOK 2 SMP 5, 6
133240, 033040, 033240, 033450: INTERMEDIATE, ACADEMIC & HONORS ALGEBRA II
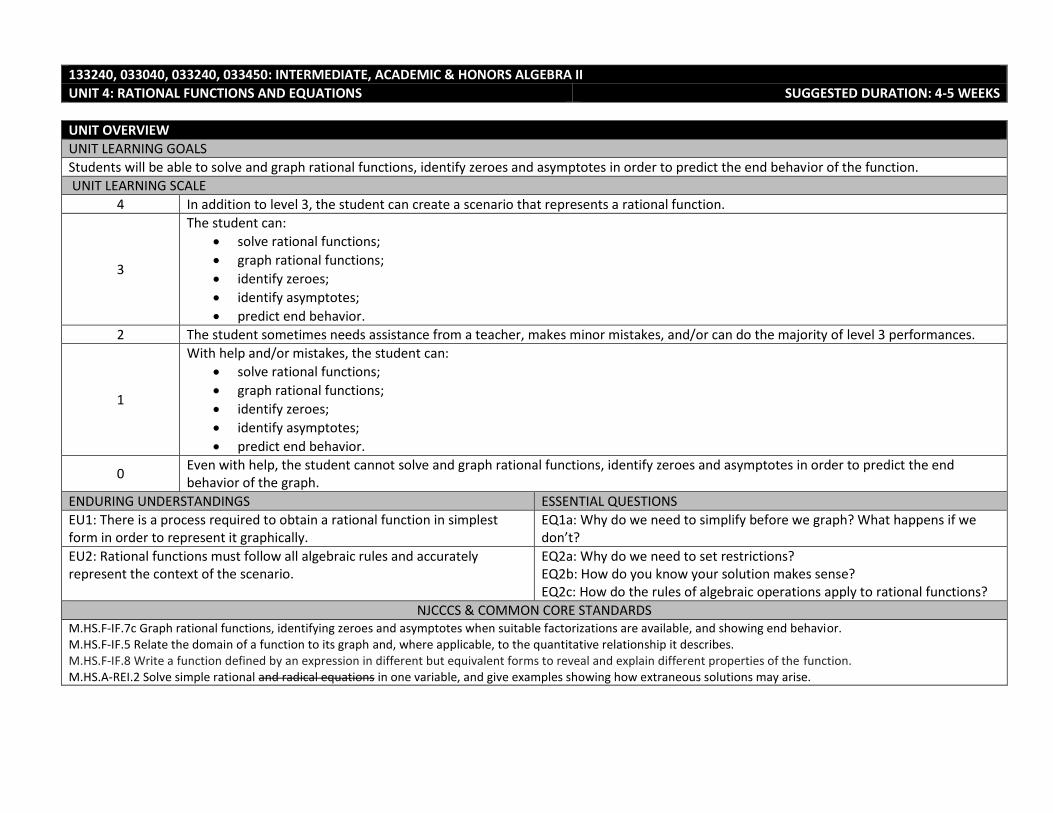
UNIT 4: RATIONAL FUNCTIONS AND EQUATIONS SUGGESTED DURATION: 4-5 WEEKS
UNIT OVERVIEW
UNIT LEARNING GOALS
Students will be able to solve and graph rational functions, identify zeroes and asymptotes in order to predict the end behavior of the function.
UNIT LEARNING SCALE
4 In addition to level 3, the student can create a scenario that represents a rational function.
3
The student can:
solve rational functions;
graph rational functions;
identify zeroes;
identify asymptotes;
predict end behavior.
2 The student sometimes needs assistance from a teacher, makes minor mistakes, and/or can do the majority of level 3 performances.
1
With help and/or mistakes, the student can:
solve rational functions;
graph rational functions;
identify zeroes;
identify asymptotes;
predict end behavior.
0 Even with help, the student cannot solve and graph rational functions, identify zeroes and asymptotes in order to predict the end behavior of the graph.
ENDURING UNDERSTANDINGS ESSENTIAL QUESTIONS
EU1: There is a process required to obtain a rational function in simplest form in order to represent it graphically.
EQ1a: Why do we need to simplify before we graph? What happens if we don’t?
EU2: Rational functions must follow all algebraic rules and accurately represent the context of the scenario.
EQ2a: Why do we need to set restrictions? EQ2b: How do you know your solution makes sense? EQ2c: How do the rules of algebraic operations apply to rational functions?
NJCCCS & COMMON CORE STANDARDS M.HS.F-IF.7c Graph rational functions, identifying zeroes and asymptotes when suitable factorizations are available, and showing end behavior. M.HS.F-IF.5 Relate the domain of a function to its graph and, where applicable, to the quantitative relationship it describes. M.HS.F-IF.8 Write a function defined by an expression in different but equivalent forms to reveal and explain different properties of the function. M.HS.A-REI.2 Solve simple rational and radical equations in one variable, and give examples showing how extraneous solutions may arise.
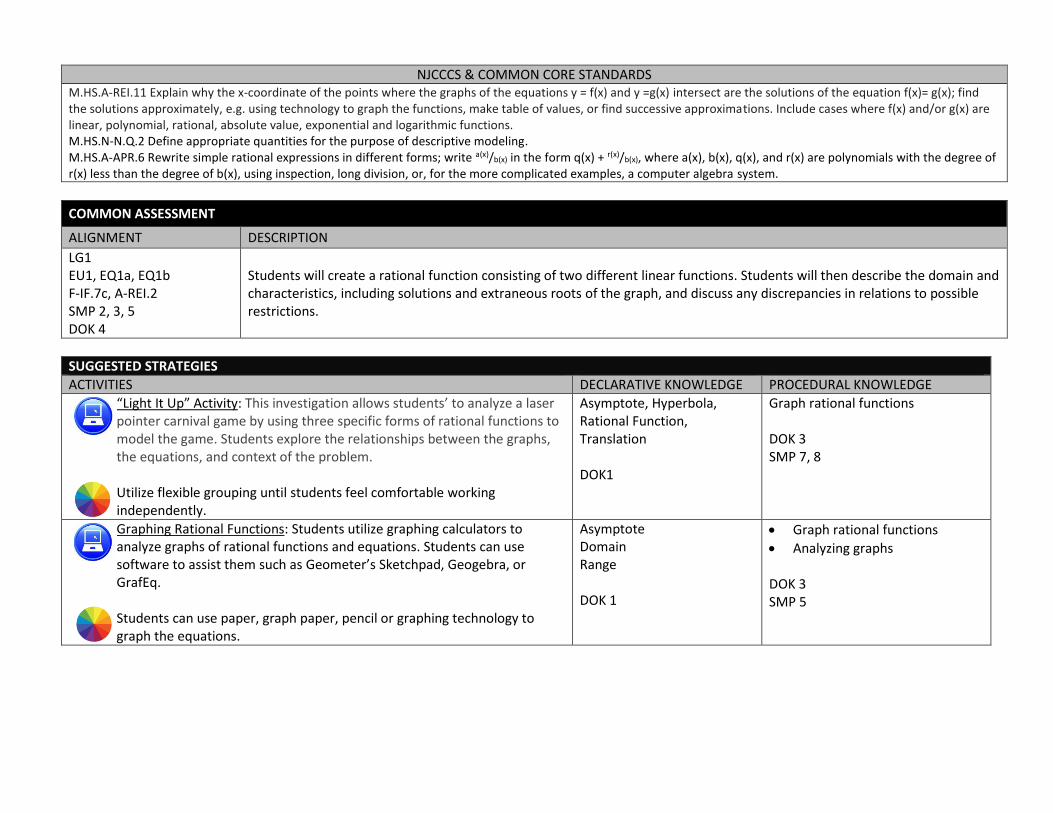
NJCCCS & COMMON CORE STANDARDS M.HS.A-REI.11 Explain why the x-coordinate of the points where the graphs of the equations y = f(x) and y =g(x) intersect are the solutions of the equation f(x)= g(x); find the solutions approximately, e.g. using technology to graph the functions, make table of values, or find successive approximations. Include cases where f(x) and/or g(x) are linear, polynomial, rational, absolute value, exponential and logarithmic functions. M.HS.N-N.Q.2 Define appropriate quantities for the purpose of descriptive modeling. M.HS.A-APR.6 Rewrite simple rational expressions in different forms; write a(x)/b(x) in the form q(x) + r(x)/b(x), where a(x), b(x), q(x), and r(x) are polynomials with the degree of r(x) less than the degree of b(x), using inspection, long division, or, for the more complicated examples, a computer algebra system.
COMMON ASSESSMENT
ALIGNMENT DESCRIPTION
LG1 EU1, EQ1a, EQ1b F-IF.7c, A-REI.2 SMP 2, 3, 5 DOK 4
Students will create a rational function consisting of two different linear functions. Students will then describe the domain and characteristics, including solutions and extraneous roots of the graph, and discuss any discrepancies in relations to possible restrictions.
SUGGESTED STRATEGIES
ACTIVITIES DECLARATIVE KNOWLEDGE PROCEDURAL KNOWLEDGE
“Light It Up” Activity: This investigation allows students’ to analyze a laser pointer carnival game by using three specific forms of rational functions to model the game. Students explore the relationships between the graphs, the equations, and context of the problem. Utilize flexible grouping until students feel comfortable working independently.
Asymptote, Hyperbola, Rational Function, Translation DOK1
Graph rational functions DOK 3 SMP 7, 8
Graphing Rational Functions: Students utilize graphing calculators to analyze graphs of rational functions and equations. Students can use software to assist them such as Geometer’s Sketchpad, Geogebra, or GrafEq.
Students can use paper, graph paper, pencil or graphing technology to graph the equations.
Asymptote Domain Range DOK 1
Graph rational functions
Analyzing graphs DOK 3 SMP 5

133240, 033040, 033240, 033450: INTERMEDIATE, ACADEMIC & HONORS ALGEBRA II
UNIT 5: RADICAL FUNCTIONS AND EQUATIONS SUGGESTED DURATION: 4 WEEKS
UNIT OVERVIEW
UNIT LEARNING GOALS
Students will be able to analyze a radical function and identify its domain, range, x-intercepts, and y-intercepts, and be able to represent the function and those key characteristics both graphically and algebraically.
UNIT LEARNING SCALE
4 In addition to level 3, the student can create problems represented by radical functions.
3
The student can:
graph a radical function;
identify the domain and range of a radical function;
identify x and y-intercepts of a radical function;
solve a radical equation.
2 The student sometimes needs assistance from a teacher, makes minor mistakes, and/or can do the majority of level 3 performances.
1
With help and/or mistakes, the student can:
graph a radical function;
identify the domain and range of a radical function;
identify x and y-intercepts of a radical function;
solve a radical equation.
0 Even with help, the student cannot identify the domain, range, x-intercepts, y-intercepts and is unable to represent the function and these key characteristics both graphically and algebraically.
ENDURING UNDERSTANDINGS ESSENTIAL QUESTIONS
EU1: A function can be created from existing parent functions using transformations and algebraic modeling.
EQ1: What characteristics are evident in the function from its parent graph?
EU2: Inverse relationships can be utilized to solve radical equations. EQ2: How are inverse relationships used to solve equations?
NJCCCS & COMMON CORE STANDARDS M.HS.F-IF.7c Graph square root, cube root, and piecewise-defined functions, including step functions and absolute value functions. M.HS.F-IF.5 Relate the domain of a function to its graph and, where applicable, to the quantitative relationship it describes. M.HS.N-RN.1 Explain how the definition of the meaning of rational exponents follows from extending the properties of integer exponents to those values, allowing for a notation for radicals in terms of rational exponents. For example, we define 51/3 to be the cube root of 5 because we want (51/3)3 = 5(1/3)3 to hold, so (51/3)3 must equal 5. M.HS.N-RN.2 Rewrite expressions involving radicals and rational exponents using the properties of exponents. M.HS.F-BF.3 Identify the effect on the graph of replacing f(x) by f(x) + k, k f(x), f(kx), and f(x + k) for specific values of k (both positive and negative); find the value of k given the graphs. Experiment with cases and illustrate an explanation of the effects on the graph using technology. Include recognizing even and odd functions from their graphs and algebraic expressions for them. M.HS.F-BF.4 Find inverse functions. M.HS.A- REI.2 -Solve simple rational and radical equations in one variable, and give examples showing how extraneous solutions may arise.
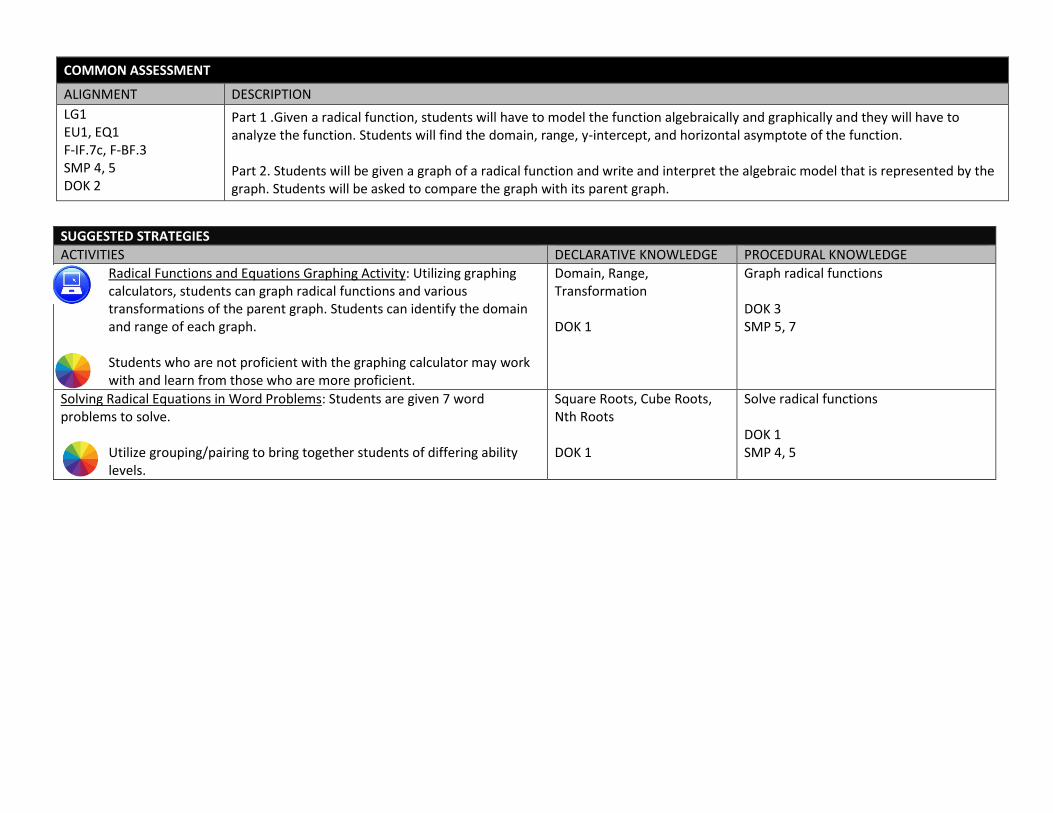
COMMON ASSESSMENT
ALIGNMENT DESCRIPTION
LG1 EU1, EQ1 F-IF.7c, F-BF.3 SMP 4, 5 DOK 2
Part 1 .Given a radical function, students will have to model the function algebraically and graphically and they will have to analyze the function. Students will find the domain, range, y-intercept, and horizontal asymptote of the function. Part 2. Students will be given a graph of a radical function and write and interpret the algebraic model that is represented by the graph. Students will be asked to compare the graph with its parent graph.
SUGGESTED STRATEGIES
ACTIVITIES DECLARATIVE KNOWLEDGE PROCEDURAL KNOWLEDGE
Radical Functions and Equations Graphing Activity: Utilizing graphing calculators, students can graph radical functions and various transformations of the parent graph. Students can identify the domain and range of each graph.
Students who are not proficient with the graphing calculator may work with and learn from those who are more proficient.
Domain, Range, Transformation DOK 1
Graph radical functions DOK 3 SMP 5, 7
Solving Radical Equations in Word Problems: Students are given 7 word problems to solve.
Utilize grouping/pairing to bring together students of differing ability levels.
Square Roots, Cube Roots, Nth Roots DOK 1
Solve radical functions DOK 1 SMP 4, 5

133240, 033040, 033240, 033450: INTERMEDIATE, ACADEMIC & HONORS ALGEBRA II
UNIT 6: EXPONENTIAL AND LOGARITHMIC FUNCTIONS SUGGESTED DURATION: 4 WEEKS
UNIT OVERVIEW
UNIT LEARNING GOALS
Students will be able to analyze and model growth and decay in real word scenarios, make predictions based on their analysis, and justify their predictions mathematically.
UNIT LEARNING SCALE
4 In addition to level 3, the student can create real world scenarios that can be modeled using logarithmic functions.
3
The student can:
graph exponential and logarithmic functions;
describe the transformations of exponential and logarithmic functions graphically and algebraically;
apply exponential growth, decay, and compound interest formulas to real world situations;
apply properties of logarithms and evaluate logarithmic expressions;
solve exponential and logarithmic equations.
2 The student sometimes needs assistance from a teacher, makes minor mistakes, and/or can do the majority of level 3 performances.
1
With help and/or mistakes, the student can:
graph exponential and logarithmic functions;
describe the transformations of exponential and logarithmic functions graphically and algebraically;
apply exponential growth, decay, and compound interest formulas to real world situations;
apply properties of logarithms and evaluate logarithmic expressions;
solve exponential and logarithmic equations.
0 Even with help, the student is not able to represent exponential and logarithmic functions algebraically and graphically in order to make calculations regarding growth and decay.
ENDURING UNDERSTANDINGS ESSENTIAL QUESTIONS
EU1: Exponential and logarithmic functions are closely related. EQ1a: How do exponential and logarithmic functions affect behavior of a graph? EQ1b: How do you model a quantity that changes regularly over time?
EU2: Exponential and logarithmic functions behave the same as other functions with respect to graphical transformations.
EQ2: How do transformations in an exponential or logarithmic function affect its graph?
M.HS.F.BF.5 Understand the inverse relationship between exponents and logarithms and use this relationship to solve problems involving logarithms and exponents M.HS.F-LE.1 Distinguish between situations that can be modeled with linear functions and with exponential functions. M.HS.F-LE.1c Recognize situations in which a quantity grows or decays by a constant percent rate per unit interval relative to another M.HS.F-LE.2 Construct and compare linear, quadratic, and exponential models and solve problems. Construct exponential functions including geometric sequences, give a graph, a description of a relationship, or two input-output pairs.
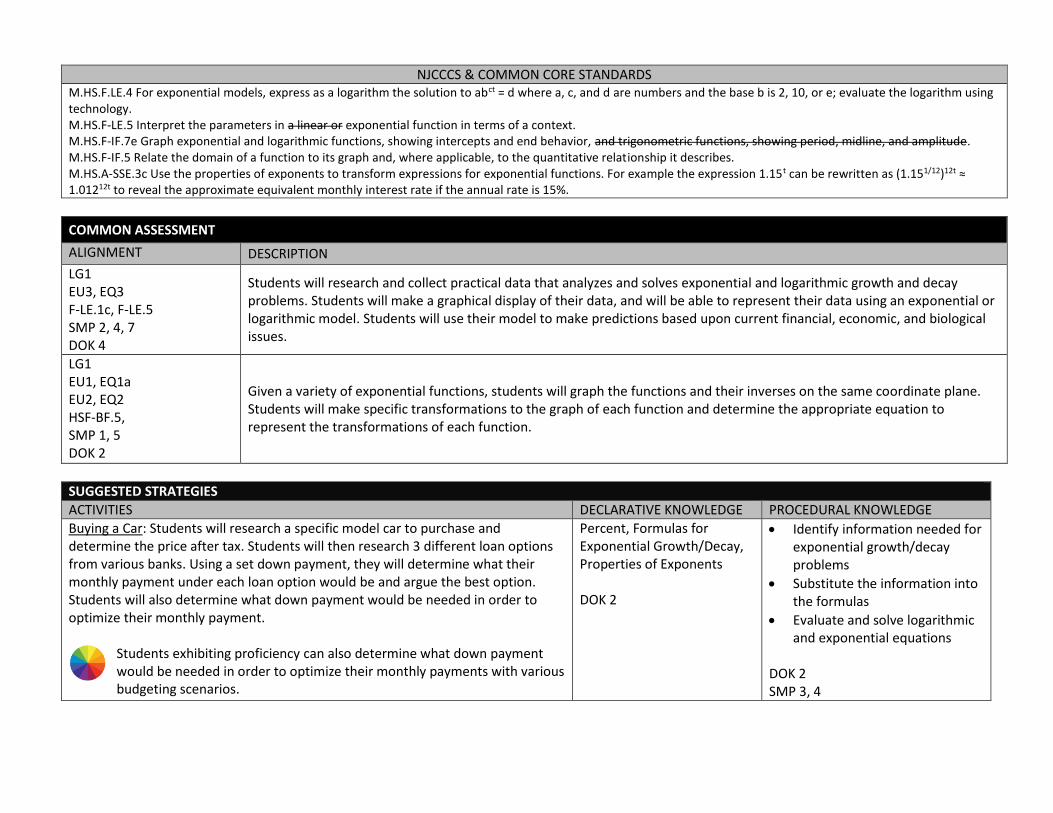
NJCCCS & COMMON CORE STANDARDS
M.HS.F.LE.4 For exponential models, express as a logarithm the solution to abct = d where a, c, and d are numbers and the base b is 2, 10, or e; evaluate the logarithm using technology. M.HS.F-LE.5 Interpret the parameters in a linear or exponential function in terms of a context. M.HS.F-IF.7e Graph exponential and logarithmic functions, showing intercepts and end behavior, and trigonometric functions, showing period, midline, and amplitude. M.HS.F-IF.5 Relate the domain of a function to its graph and, where applicable, to the quantitative relationship it describes. M.HS.A-SSE.3c Use the properties of exponents to transform expressions for exponential functions. For example the expression 1.15t can be rewritten as (1.151/12)12t ≈ 1.01212t to reveal the approximate equivalent monthly interest rate if the annual rate is 15%.
COMMON ASSESSMENT
ALIGNMENT DESCRIPTION
LG1 EU3, EQ3 F-LE.1c, F-LE.5 SMP 2, 4, 7 DOK 4
Students will research and collect practical data that analyzes and solves exponential and logarithmic growth and decay problems. Students will make a graphical display of their data, and will be able to represent their data using an exponential or logarithmic model. Students will use their model to make predictions based upon current financial, economic, and biological issues.
LG1 EU1, EQ1a EU2, EQ2 HSF-BF.5, SMP 1, 5 DOK 2
Given a variety of exponential functions, students will graph the functions and their inverses on the same coordinate plane. Students will make specific transformations to the graph of each function and determine the appropriate equation to represent the transformations of each function.
SUGGESTED STRATEGIES
ACTIVITIES DECLARATIVE KNOWLEDGE PROCEDURAL KNOWLEDGE
Buying a Car: Students will research a specific model car to purchase and determine the price after tax. Students will then research 3 different loan options from various banks. Using a set down payment, they will determine what their monthly payment under each loan option would be and argue the best option. Students will also determine what down payment would be needed in order to optimize their monthly payment.
Students exhibiting proficiency can also determine what down payment would be needed in order to optimize their monthly payments with various budgeting scenarios.
Percent, Formulas for Exponential Growth/Decay, Properties of Exponents DOK 2
Identify information needed for exponential growth/decay problems
Substitute the information into the formulas
Evaluate and solve logarithmic and exponential equations
DOK 2 SMP 3, 4
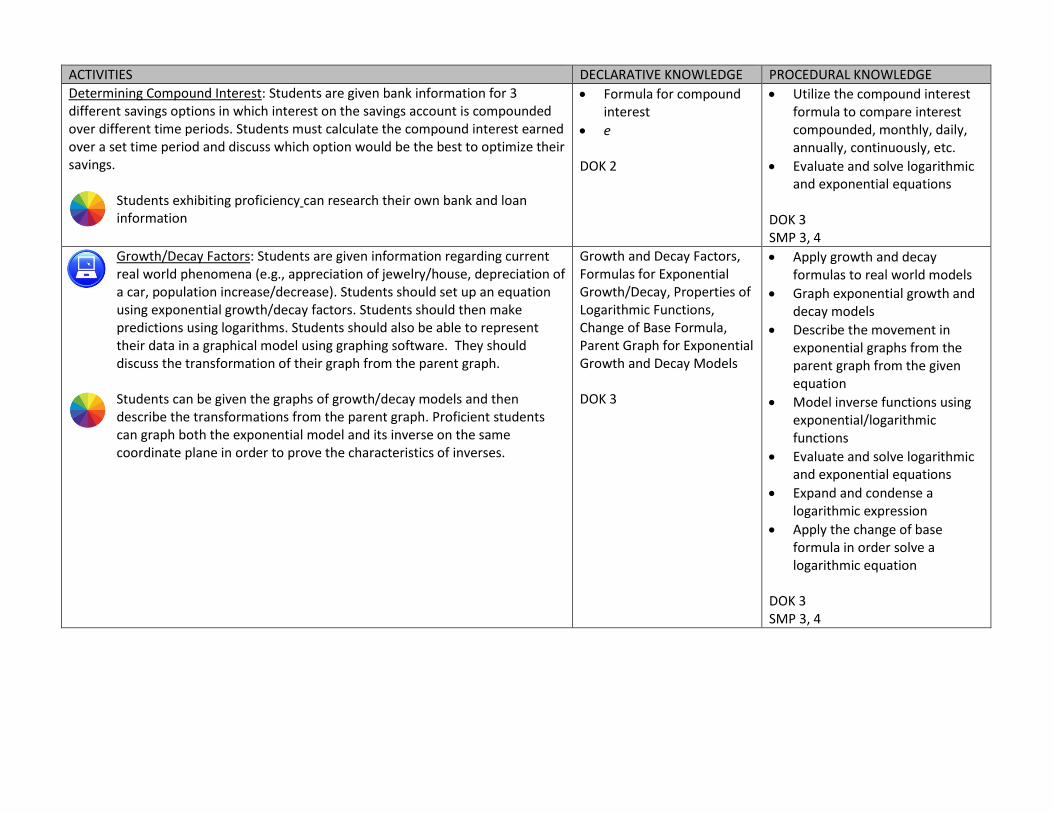
ACTIVITIES DECLARATIVE KNOWLEDGE PROCEDURAL KNOWLEDGE Determining Compound Interest: Students are given bank information for 3 different savings options in which interest on the savings account is compounded over different time periods. Students must calculate the compound interest earned over a set time period and discuss which option would be the best to optimize their savings.
Students exhibiting proficiency can research their own bank and loan information
Formula for compound interest
e DOK 2
Utilize the compound interest formula to compare interest compounded, monthly, daily, annually, continuously, etc.
Evaluate and solve logarithmic and exponential equations
DOK 3 SMP 3, 4
Growth/Decay Factors: Students are given information regarding current real world phenomena (e.g., appreciation of jewelry/house, depreciation of a car, population increase/decrease). Students should set up an equation using exponential growth/decay factors. Students should then make predictions using logarithms. Students should also be able to represent their data in a graphical model using graphing software. They should discuss the transformation of their graph from the parent graph.
Students can be given the graphs of growth/decay models and then describe the transformations from the parent graph. Proficient students can graph both the exponential model and its inverse on the same coordinate plane in order to prove the characteristics of inverses.
Growth and Decay Factors, Formulas for Exponential Growth/Decay, Properties of Logarithmic Functions, Change of Base Formula, Parent Graph for Exponential Growth and Decay Models DOK 3
Apply growth and decay formulas to real world models
Graph exponential growth and decay models
Describe the movement in exponential graphs from the parent graph from the given equation
Model inverse functions using exponential/logarithmic functions
Evaluate and solve logarithmic and exponential equations
Expand and condense a logarithmic expression
Apply the change of base formula in order solve a logarithmic equation
DOK 3 SMP 3, 4

133240, 033040, 033240, 033450: INTERMEDIATE, ACADEMIC & HONORS ALGEBRA II
UNIT 7: TRIGONOMETRIC FUNCTIONS SUGGESTED DURATION: 4-5 WEEKS
UNIT OVERVIEW
UNIT LEARNING GOALS
Students will be able to extend the domain of trigonometric functions using the unit circle and model periodic phenomena using trigonometric functions.
UNIT LEARNING SCALE
4 In addition to level 3, the student can model real world events, interpret their results, and determine their models accuracy.
3
The student will be able to:
apply trigonometry to solve problems;
use the unit circle to evaluate trigonometric functions;
model periodic phenomena using trigonometric functions.
2 The student sometimes needs assistance from a teacher, makes minor mistakes, and/or can do the majority of level 3 performances.
1
With help and/or mistakes, the student can:
apply trigonometry to solve problems;
use the unit circle to evaluate trigonometric functions;
model periodic phenomena using trigonometric functions.
0 Even with help, the student cannot extend the domain of trigonometric functions using the unit circle and model periodic phenomena using trigonometric functions.
ENDURING UNDERSTANDINGS ESSENTIAL QUESTIONS
EU1: The unit circle can be used to evaluate and solve trigonometric functions.
EQ1: How do trigonometric and circular functions model real world relationships and their solutions?
EU2: Trigonometric functions can model periodic events. EQ2: What periodic events can be modeled using trigonometry?
EU3: Algebraic rules must be applied to prove and use trigonometric identities.
EQ3: How are the rules of algebra applied to proving identities?
NJCCCS & COMMON CORE STANDARDS M.HS.F-IF.7e Graph exponential and logarithmic functions, showing intercepts and end behavior, and trigonometric functions, showing period, midline, and amplitude. M.HS.F-TF.1 Understand radian measure of an angle as the length of the arc on the unit circle subtended by the angle. M.HS.F-TF.2 Explain how the unit circle in the coordinate plane enables the extension of trigonometric functions to all real numbers, interpreted as radian measures of angles traversed counterclockwise around the unit circle. M.HS.F-IF.5 Relate the domain of a function to its graph and, where applicable, to the quantitative relationship it describes. M.HS.F-TF.5 Choose trigonometric functions to model periodic phenomena with specified amplitude, frequency, and midline. M.HS.F-TF.8 Prove the Pythagorean identity sin2(θ) + cos2(θ) = 1 and use it to find sin(θ), cos(θ), or tan(θ) given sin(θ), cos(θ), or tan(θ) and the quadrant of the angle. M.HS.A-APR.4 Prove polynomial identities and use them to describe numerical relationships. For example, the polynomial identity (x2 + y2)2 = (x2 – y2)2 + (2xy)2 can be used to generate Pythagorean triples.
COMMON ASSESSMENT
ALIGNMENT DESCRIPTION
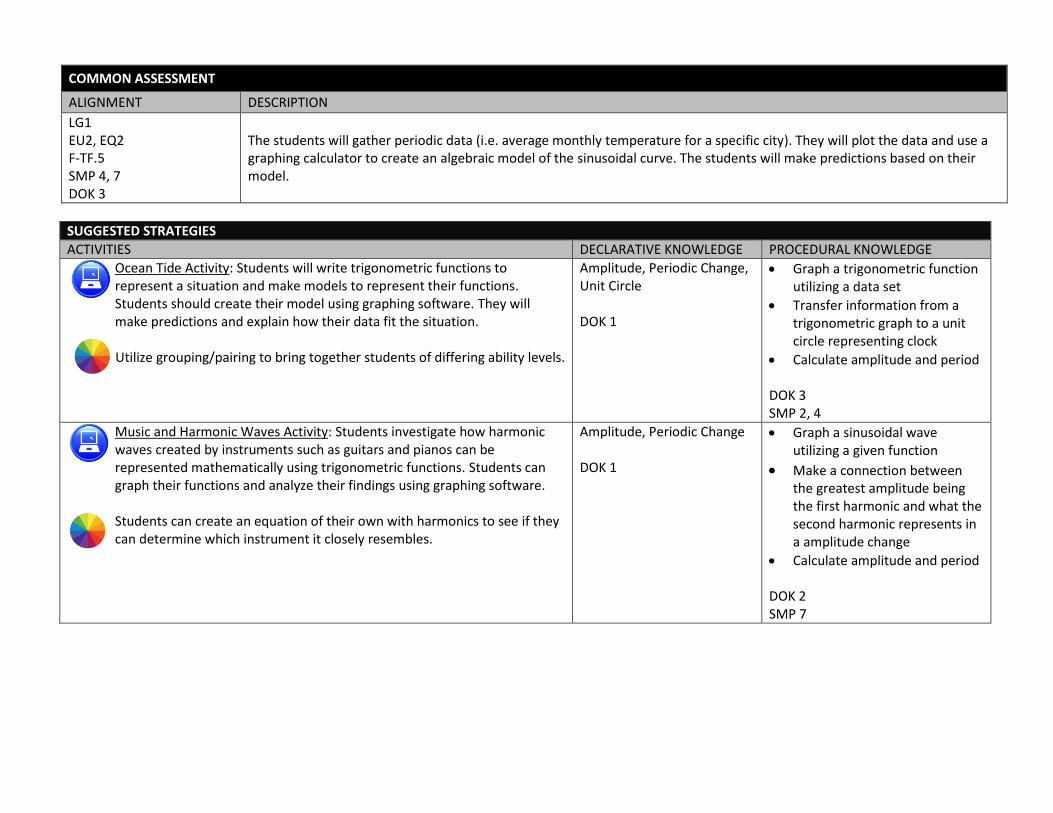
LG1 EU2, EQ2 F-TF.5 SMP 4, 7 DOK 3
The students will gather periodic data (i.e. average monthly temperature for a specific city). They will plot the data and use a graphing calculator to create an algebraic model of the sinusoidal curve. The students will make predictions based on their model.
SUGGESTED STRATEGIES
ACTIVITIES DECLARATIVE KNOWLEDGE PROCEDURAL KNOWLEDGE
Ocean Tide Activity: Students will write trigonometric functions to represent a situation and make models to represent their functions. Students should create their model using graphing software. They will make predictions and explain how their data fit the situation.
Utilize grouping/pairing to bring together students of differing ability levels.
Amplitude, Periodic Change, Unit Circle DOK 1
Graph a trigonometric function utilizing a data set
Transfer information from a trigonometric graph to a unit circle representing clock
Calculate amplitude and period DOK 3 SMP 2, 4
Music and Harmonic Waves Activity: Students investigate how harmonic waves created by instruments such as guitars and pianos can be represented mathematically using trigonometric functions. Students can graph their functions and analyze their findings using graphing software.
Students can create an equation of their own with harmonics to see if they can determine which instrument it closely resembles.
Amplitude, Periodic Change DOK 1
Graph a sinusoidal wave utilizing a given function
Make a connection between the greatest amplitude being the first harmonic and what the second harmonic represents in a amplitude change
Calculate amplitude and period DOK 2 SMP 7
133240, 033040, 033240, 033450: INTERMEDIATE, ACADEMIC & HONORS ALGEBRA II
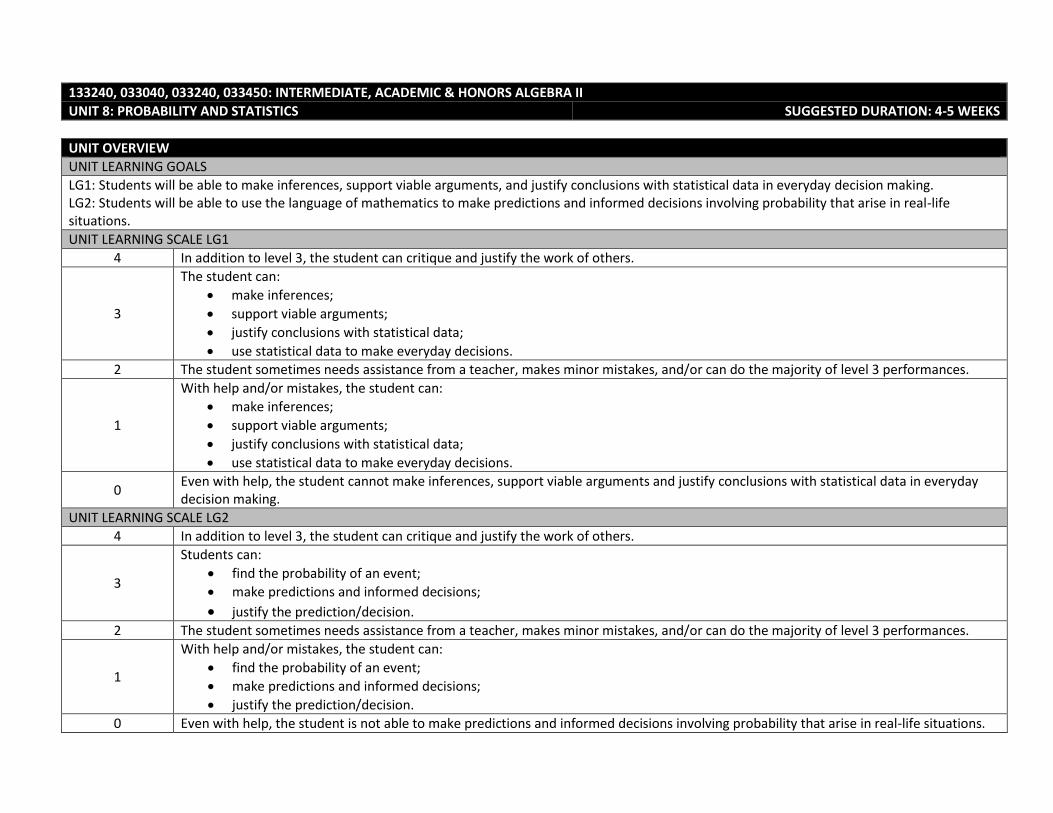
UNIT 8: PROBABILITY AND STATISTICS SUGGESTED DURATION: 4-5 WEEKS
UNIT OVERVIEW
UNIT LEARNING GOALS
LG1: Students will be able to make inferences, support viable arguments, and justify conclusions with statistical data in everyday decision making. LG2: Students will be able to use the language of mathematics to make predictions and informed decisions involving probability that arise in real-life situations.
UNIT LEARNING SCALE LG1
4 In addition to level 3, the student can critique and justify the work of others.
3
The student can:
make inferences;
support viable arguments;
justify conclusions with statistical data;
use statistical data to make everyday decisions. 2 The student sometimes needs assistance from a teacher, makes minor mistakes, and/or can do the majority of level 3 performances.
1
With help and/or mistakes, the student can:
make inferences;
support viable arguments;
justify conclusions with statistical data;
use statistical data to make everyday decisions.
0 Even with help, the student cannot make inferences, support viable arguments and justify conclusions with statistical data in everyday decision making.
UNIT LEARNING SCALE LG2
4 In addition to level 3, the student can critique and justify the work of others.
3
Students can:
find the probability of an event;
make predictions and informed decisions;
justify the prediction/decision. 2 The student sometimes needs assistance from a teacher, makes minor mistakes, and/or can do the majority of level 3 performances.
1
With help and/or mistakes, the student can:
find the probability of an event;
make predictions and informed decisions;
justify the prediction/decision.
0 Even with help, the student is not able to make predictions and informed decisions involving probability that arise in real-life situations.
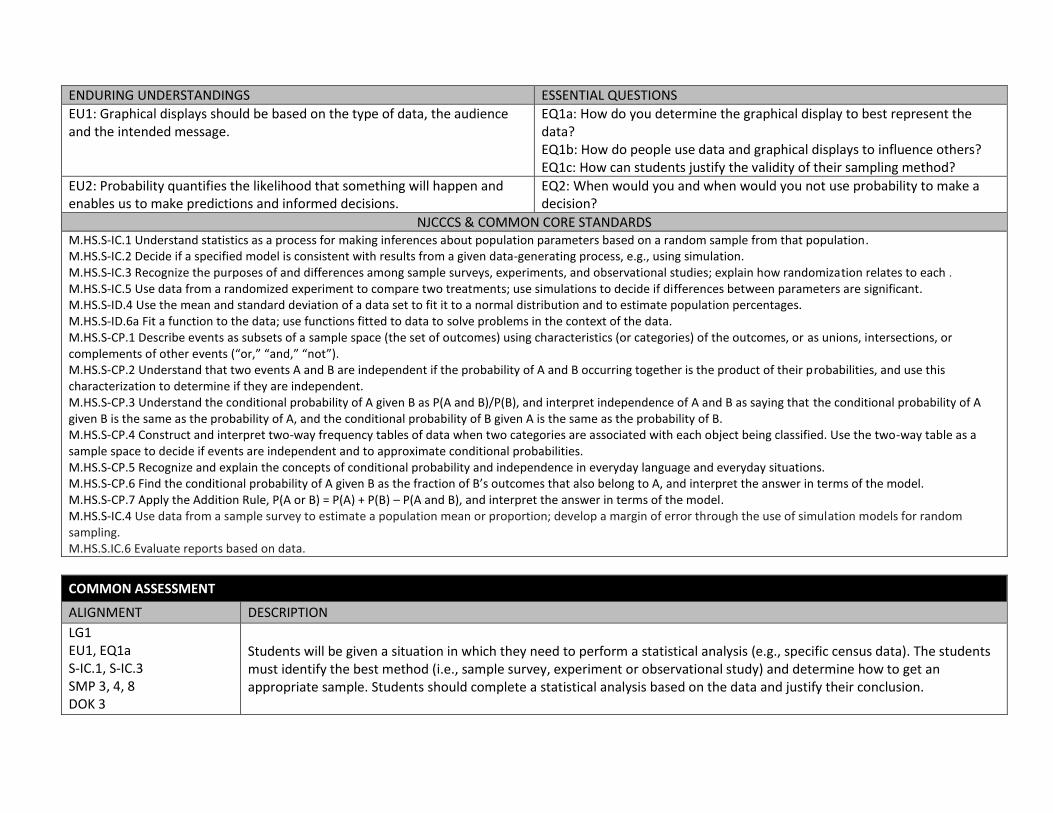
ENDURING UNDERSTANDINGS ESSENTIAL QUESTIONS
EU1: Graphical displays should be based on the type of data, the audience and the intended message.
EQ1a: How do you determine the graphical display to best represent the data? EQ1b: How do people use data and graphical displays to influence others? EQ1c: How can students justify the validity of their sampling method?
EU2: Probability quantifies the likelihood that something will happen and enables us to make predictions and informed decisions.
EQ2: When would you and when would you not use probability to make a decision?
NJCCCS & COMMON CORE STANDARDS M.HS.S-IC.1 Understand statistics as a process for making inferences about population parameters based on a random sample from that population. M.HS.S-IC.2 Decide if a specified model is consistent with results from a given data-generating process, e.g., using simulation. M.HS.S-IC.3 Recognize the purposes of and differences among sample surveys, experiments, and observational studies; explain how randomization relates to each . M.HS.S-IC.5 Use data from a randomized experiment to compare two treatments; use simulations to decide if differences between parameters are significant. M.HS.S-ID.4 Use the mean and standard deviation of a data set to fit it to a normal distribution and to estimate population percentages. M.HS.S-ID.6a Fit a function to the data; use functions fitted to data to solve problems in the context of the data. M.HS.S-CP.1 Describe events as subsets of a sample space (the set of outcomes) using characteristics (or categories) of the outcomes, or as unions, intersections, or complements of other events (“or,” “and,” “not”). M.HS.S-CP.2 Understand that two events A and B are independent if the probability of A and B occurring together is the product of their probabilities, and use this characterization to determine if they are independent. M.HS.S-CP.3 Understand the conditional probability of A given B as P(A and B)/P(B), and interpret independence of A and B as saying that the conditional probability of A given B is the same as the probability of A, and the conditional probability of B given A is the same as the probability of B. M.HS.S-CP.4 Construct and interpret two-way frequency tables of data when two categories are associated with each object being classified. Use the two-way table as a sample space to decide if events are independent and to approximate conditional probabilities. M.HS.S-CP.5 Recognize and explain the concepts of conditional probability and independence in everyday language and everyday situations. M.HS.S-CP.6 Find the conditional probability of A given B as the fraction of B’s outcomes that also belong to A, and interpret the answer in terms of the model. M.HS.S-CP.7 Apply the Addition Rule, P(A or B) = P(A) + P(B) – P(A and B), and interpret the answer in terms of the model. M.HS.S-IC.4 Use data from a sample survey to estimate a population mean or proportion; develop a margin of error through the use of simulation models for random sampling. M.HS.S.IC.6 Evaluate reports based on data.
COMMON ASSESSMENT
ALIGNMENT DESCRIPTION
LG1 EU1, EQ1a S-IC.1, S-IC.3 SMP 3, 4, 8 DOK 3
Students will be given a situation in which they need to perform a statistical analysis (e.g., specific census data). The students must identify the best method (i.e., sample survey, experiment or observational study) and determine how to get an appropriate sample. Students should complete a statistical analysis based on the data and justify their conclusion.
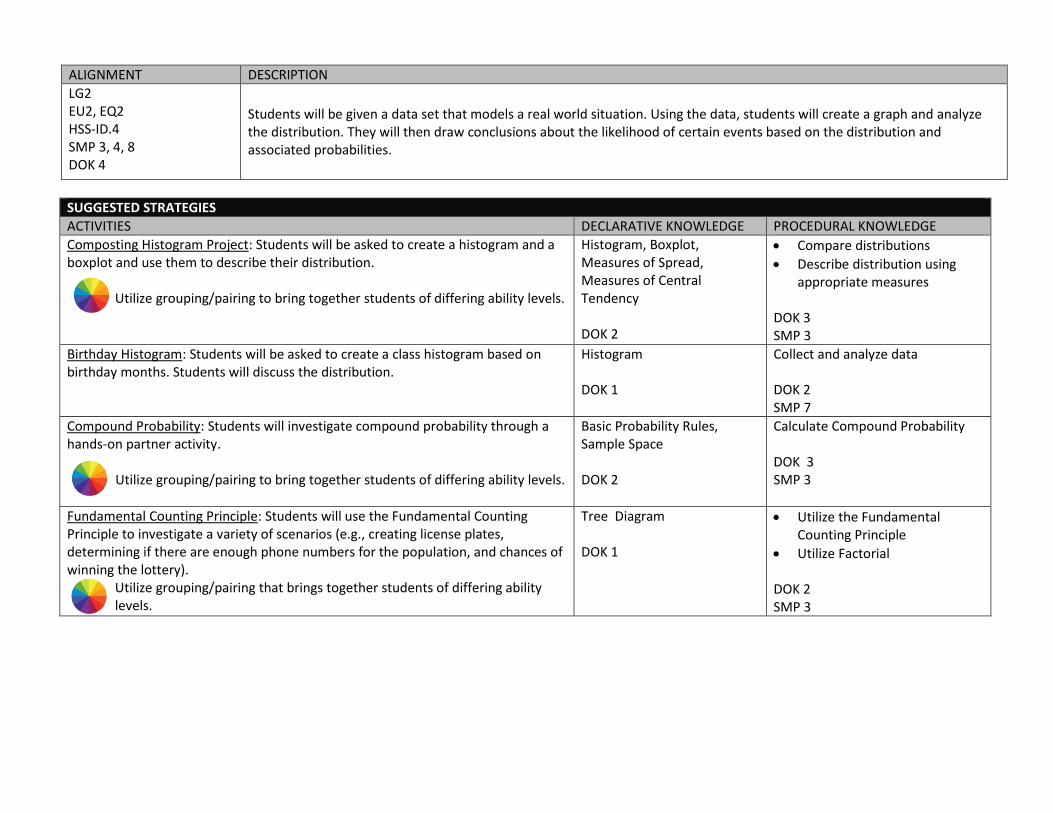
ALIGNMENT DESCRIPTION LG2 EU2, EQ2 HSS-ID.4 SMP 3, 4, 8 DOK 4
Students will be given a data set that models a real world situation. Using the data, students will create a graph and analyze the distribution. They will then draw conclusions about the likelihood of certain events based on the distribution and associated probabilities.
SUGGESTED STRATEGIES
ACTIVITIES DECLARATIVE KNOWLEDGE PROCEDURAL KNOWLEDGE
Composting Histogram Project: Students will be asked to create a histogram and a boxplot and use them to describe their distribution.
Utilize grouping/pairing to bring together students of differing ability levels.
Histogram, Boxplot, Measures of Spread, Measures of Central Tendency DOK 2
Compare distributions
Describe distribution using appropriate measures
DOK 3 SMP 3
Birthday Histogram: Students will be asked to create a class histogram based on birthday months. Students will discuss the distribution.
Histogram DOK 1
Collect and analyze data DOK 2 SMP 7
Compound Probability: Students will investigate compound probability through a hands-on partner activity.
Utilize grouping/pairing to bring together students of differing ability levels.
Basic Probability Rules, Sample Space DOK 2
Calculate Compound Probability DOK 3 SMP 3
Fundamental Counting Principle: Students will use the Fundamental Counting Principle to investigate a variety of scenarios (e.g., creating license plates, determining if there are enough phone numbers for the population, and chances of winning the lottery).
Utilize grouping/pairing that brings together students of differing ability levels.
Tree Diagram DOK 1
Utilize the Fundamental Counting Principle
Utilize Factorial DOK 2 SMP 3
133240, 033040, 033240, 033450: INTERMEDIATE, ACADEMIC & HONORS ALGEBRA II
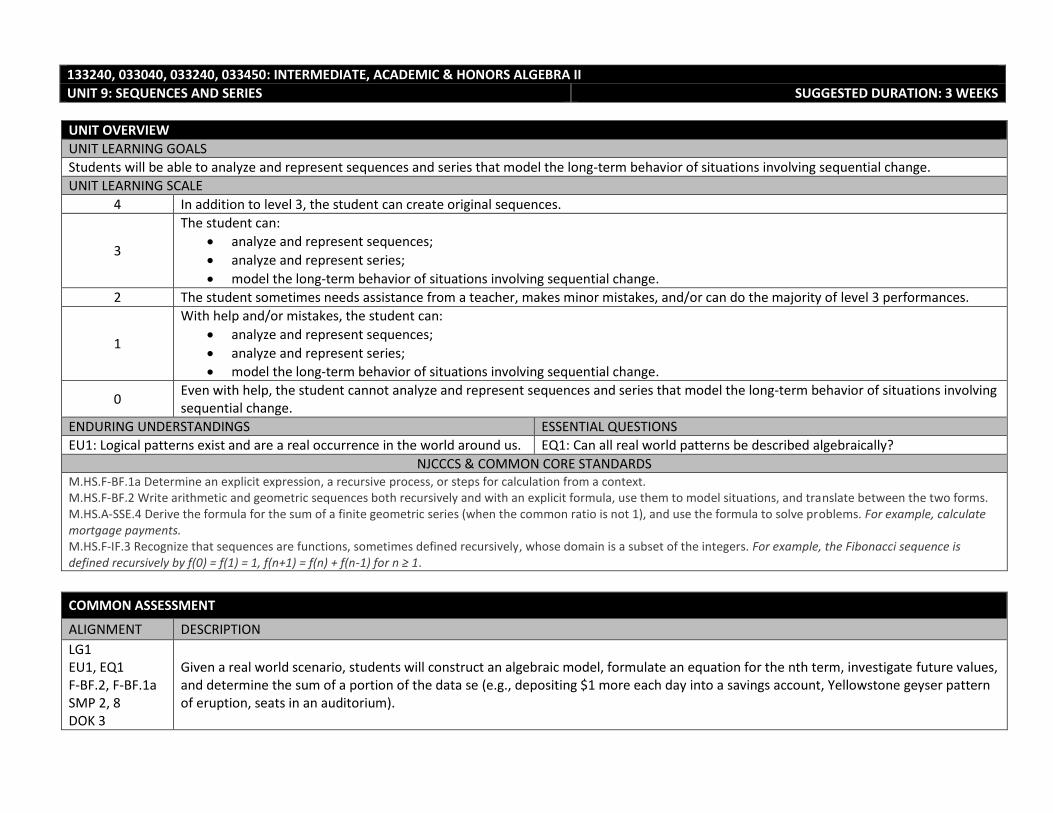
UNIT 9: SEQUENCES AND SERIES SUGGESTED DURATION: 3 WEEKS
UNIT OVERVIEW
UNIT LEARNING GOALS
Students will be able to analyze and represent sequences and series that model the long-term behavior of situations involving sequential change.
UNIT LEARNING SCALE
4 In addition to level 3, the student can create original sequences.
3
The student can:
analyze and represent sequences;
analyze and represent series;
model the long-term behavior of situations involving sequential change.
2 The student sometimes needs assistance from a teacher, makes minor mistakes, and/or can do the majority of level 3 performances.
1
With help and/or mistakes, the student can:
analyze and represent sequences;
analyze and represent series;
model the long-term behavior of situations involving sequential change.
0 Even with help, the student cannot analyze and represent sequences and series that model the long-term behavior of situations involving sequential change.
ENDURING UNDERSTANDINGS ESSENTIAL QUESTIONS
EU1: Logical patterns exist and are a real occurrence in the world around us. EQ1: Can all real world patterns be described algebraically?
NJCCCS & COMMON CORE STANDARDS M.HS.F-BF.1a Determine an explicit expression, a recursive process, or steps for calculation from a context. M.HS.F-BF.2 Write arithmetic and geometric sequences both recursively and with an explicit formula, use them to model situations, and translate between the two forms. M.HS.A-SSE.4 Derive the formula for the sum of a finite geometric series (when the common ratio is not 1), and use the formula to solve problems. For example, calculate mortgage payments. M.HS.F-IF.3 Recognize that sequences are functions, sometimes defined recursively, whose domain is a subset of the integers. For example, the Fibonacci sequence is defined recursively by f(0) = f(1) = 1, f(n+1) = f(n) + f(n-1) for n ≥ 1.
COMMON ASSESSMENT
ALIGNMENT DESCRIPTION
LG1 EU1, EQ1 F-BF.2, F-BF.1a SMP 2, 8 DOK 3
Given a real world scenario, students will construct an algebraic model, formulate an equation for the nth term, investigate future values, and determine the sum of a portion of the data se (e.g., depositing $1 more each day into a savings account, Yellowstone geyser pattern of eruption, seats in an auditorium).
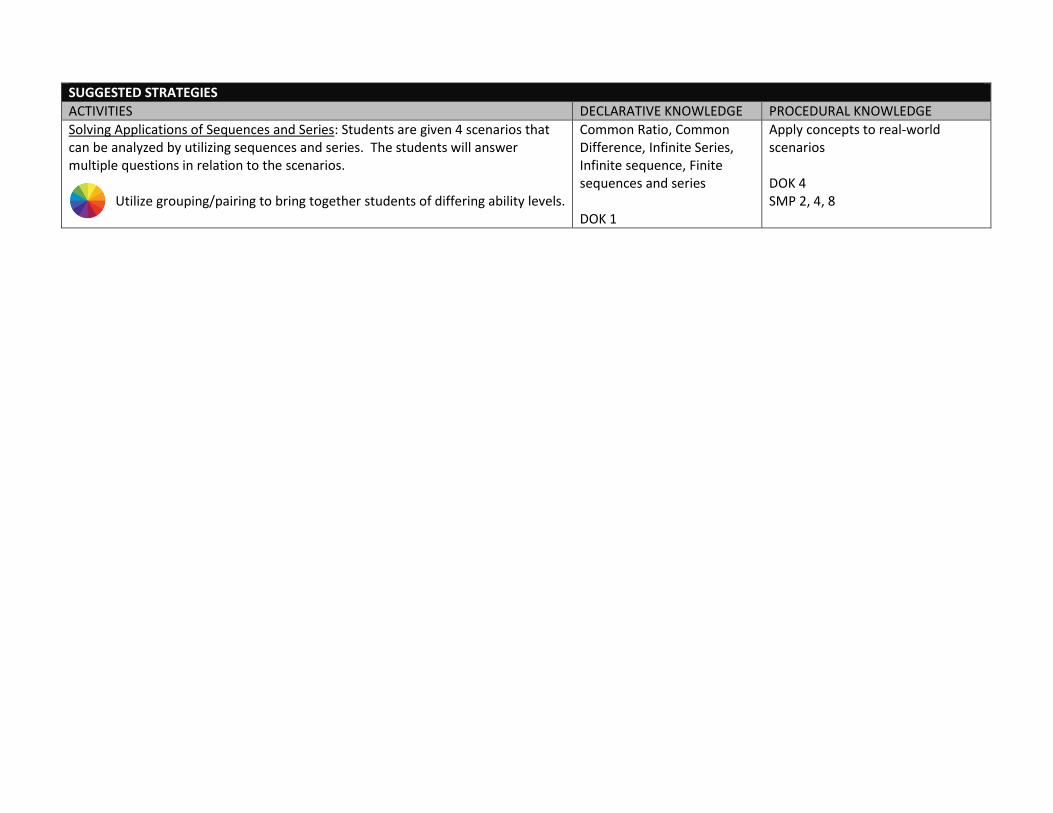
SUGGESTED STRATEGIES
ACTIVITIES DECLARATIVE KNOWLEDGE PROCEDURAL KNOWLEDGE
Solving Applications of Sequences and Series: Students are given 4 scenarios that can be analyzed by utilizing sequences and series. The students will answer multiple questions in relation to the scenarios.
Utilize grouping/pairing to bring together students of differing ability levels.
Common Ratio, Common Difference, Infinite Series, Infinite sequence, Finite sequences and series DOK 1
Apply concepts to real-world scenarios DOK 4 SMP 2, 4, 8