intern. j. of research in marketing - carnegie mellon … target cascading hierarchical bayes...
TRANSCRIPT

Intern. J. of Research in Marketing 28 (2011) 1–12
Contents lists available at ScienceDirect
Intern. J. of Research in Marketing
j ourna l homepage: www.e lsev ie r.com/ locate / i j resmar
Enhancing marketing with engineering: Optimal product line design forheterogeneous markets☆
Jeremy J. Michalek a, Peter Ebbes b,⁎, Feray Adigüzel c, Fred M. Feinberg d, Panos Y. Papalambros e
a Mechanical Engineering, Engineering and Public Policy, Carnegie Mellon University, United Statesb Smeal College of Business, Pennsylvania State University, United Statesc Economics and Business Administration, Vrije Universiteit Amsterdam, Netherlandsd Ross School of Business, University of Michigan, United Statese Mechanical Engineering, University of Michigan, United States
☆ The authors wish to thank Shapour Azarm, Abbie GKim, Peter Lenk, Laura Stojan, Michel Wedel, and Carcomments and to acknowledge support from the NationAward #0747911 and the University of Michigan's Rackproject, Reconfigurable Manufacturing Systems EngineeRoss School of Business.⁎ Corresponding author.
E-mail address: [email protected] (P. Ebbes).
0167-8116/$ – see front matter © 2010 Elsevier B.V. Aldoi:10.1016/j.ijresmar.2010.08.001
a b s t r a c t
a r t i c l e i n f oArticle history:First received in 10, February 2010 and wasunder review for 3 months
Area Editor: John H. Roberts
Keywords:Product line designHeterogeneityDecompositionAnalytical target cascadingHierarchical BayesConjoint analysisDiscrete choice analysisDesign optimization
Successful product line design and development often require a balance of technical and market tradeoffs.Quantitative methods for optimizing product attribute levels using preference elicitation (e.g., conjoint) dataare useful for many product types. However, products with substantial engineering content involve criticaltradeoffs in the ability to achieve those desired attribute levels. Technical tradeoffs in product design must bemade with an eye toward market consequences, particularly when heterogeneous market preferences makedifferentiation and strategic positioning critical to capturing a range of market segments and avoidingcannibalization.We present a unified methodology for product line optimization that coordinates positioning and designmodels to achieve realizable firm-level optima. The approach overcomes several shortcomings of priorproduct line optimization models by incorporating a general Bayesian account of consumer preferenceheterogeneity, managing attributes over a continuous domain to alleviate issues of combinatorial complexity,and avoiding solutions that are impossible to realize. The method is demonstrated for a line of dial-readoutscales, using physical models and conjoint-based consumer choice data. The results show that the optimalnumber of products in the line is not necessarily equal to the number of market segments, that an optimalsingle product for a heterogeneous market differs from that for a homogeneous one, and that therepresentational form for consumer heterogeneity has a substantial impact on the design and profitability ofthe resulting optimal product line — even for the design of a single product. The method is manageriallyvaluable because it yields product line solutions efficiently, accounting for marketing-based preferenceheterogeneity as well as engineering-based constraints with which product attributes can be realized.
riffin, Aida Khajavirad, Jin Gyoolyn Yoon for their help andal Science Foundation CAREERham Antilium interdisciplinaryring Research Center, and the
l rights reserved.
© 2010 Elsevier B.V. All rights reserved.
1. Introduction
Marketplace globalization, the proliferation of niche marketsdriven by the heterogeneity of preferences, increased competitivepressures, and demand for differentiated products have renderedisolated design and production of individual products essentiallyobsolete in many instances. Across industries, standard practiceinvolves lines of product variants that reduce cost via economies ofscale and scope, reaching multiple market segments and deterring
competitors (Urban & Hauser, 1993; Simpson, 2004). Product lineplanning requires care because each product vies not only withcompetitors but also with other products in the same line.
The scope and applicability of current methods in product lineoptimization have known limitations, both in engineering and inmanagement science. Engineering-based approaches focus on thetradeoff between increased commonality among products and theresulting decreased ability to meet (usually hypothetical andexogenous) performance targets for each product variant. Most ofthese approaches lack data-driven models of market preferences andconsequently focus on reducing cost by increasing part commonality,designing platforms, or increasing modularity for mass customization.In contrast, product line optimization methods in the managementscience and marketing literatures rarely address product designdetails not directly observable by consumers. These approachestypically presume that any combination of product attributes in aconjoint study can somehow be attained by engineering designerspost hoc. While this may be so for many simple or well-established

2 J.J. Michalek et al. / Intern. J. of Research in Marketing 28 (2011) 1–12
products, it is questionable for those with even moderately complexengineering tradeoffs, where value to consumers cannot be balancedagainst cost and constraints without the joint consideration ofmarketing and engineering factors. Furthermore, existing approacheshave not taken full advantage of recent advances in econometricmodeling of consumer preference heterogeneity, particularly hierar-chical Bayesian methods, and often require exogenous individual-level or homogeneous segment-level preference data (see Kaul & Rao,1995 for a review of the early literature).
In this article,wedevelop anovel, generalmethod fordesigning linesof products formarketswithheterogeneouspreferenceswhen technicalcomplexity restricts the attainable space of product attributes. Thismethod is modular and scalable, able to handle various sorts of productattributes, and agnostic about optimization methods selected to solvemarketing and engineering subproblems. The method makes powerfuluse of formal decomposition and coordination methods via analyticaltarget cascading to take advantage of the structure underlying thecomplete product line design problem to improve computationalefficiency, algorithmic stability, and model organization and coordina-tion. We proceed by reviewing relevant literature on product lineoptimization in the marketing and engineering domains, suggestinghow the proposed approach fills a number of extant gaps. Because thescopes, perspectives, modeling methods, and objectives differ substan-tially among product development disciplines (Krishnan & Ulrich, 2001provide a detailed overview), it is inevitable that some conflicts ofterminology will exist. In this article, we take product positioning to bethe process of choosing values for physical (as opposed to perceptual)product attributes observed directly by the consumer, whereas productdesign involves decisions about the product that are not observeddirectly but that nevertheless influence product attributes observed bythe customer.
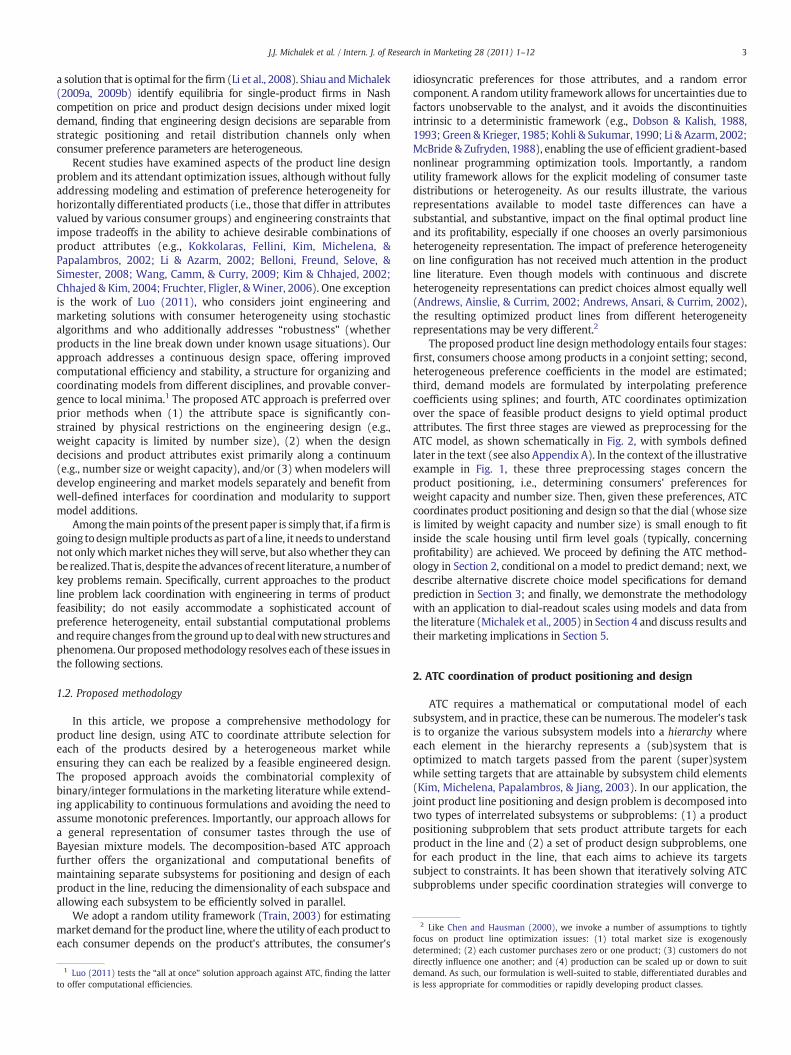
Let us first consider a concrete example, fleshed out in detail in ourapplication. Fig. 1 depicts a dial-readout bathroom scale with the coverremoved. In themarketplace, consumers observe only external productattributes such as readability (number size) and weight capacity. Forproduct positioning, we need not be concerned with how theseattributes are realized but only how consumers respond to them.However, in order to specify product attribute profiles that arerealizable, it is necessary to account for engineering tradeoffs in theproductdesign. For example, the dial in Fig. 1must be small enough tofitwithin the scale housing, so there is a limit to how large numbers on thedial can be. For a given housing, increasing the size of numbers on thedial requires reducing the weight capacity, while increasing the weightcapacity requires smaller numbers. Increasing both these consumerpreferred attributes cannot therefore be achieved simultaneously.
Fig. 1. Dial readout scale, internal view.
1.1. Product line optimization literature
Among the earliest conceptualizations for product line optimiza-tion in the marketing/management literature was that of Green andKrieger (1985), who posed the product line selection problem as abinary programming problem involving selection of products from acandidate set to be included in the line in order to maximize theseller's (or buyers') welfare. Here, the set of candidate products withtheir associated utility values is determined exogenously, and productdemand is predicted using a first choice model, where each individualis assumed to choose deterministically the alternative with thehighest associated utility. Variants of the original model were laterproposed by Dobson and Kalish (1988) and by McBride and Zufryden(1988), who offer alternative integer programming techniques andheuristics for solving the problem. Dobson and Kalish (1993) alsointroduce fixed and variable costs for each candidate product.
While these initial methods assumed each product's utility hadbeen determined exogenously, Kohli and Sukumar (1990) insteadused conjoint part-worths and introduced a single-stage binaryprogramming formulation to select product lines based on theirattribute levels. Chen and Hausman (2000) made use of choice-basedconjoint analysis, arguably most similar to the choice task consumersperform in practice and often claimed to be the best method forextracting individual-level consumer preferences (Green & Krieger,1996). Chen and Hausman proposed a binary programming formu-lation solvable by nonlinear programming techniques. Because theirapproach requires homogeneous preferences, it cannot be used todesign product lines meeting the disparate needs of most realconsumer populations. Among the more recent contributions areapplications of genetic algorithms (Steiner & Hruschka, 2002, 2003)and particle swarm algorithms (Tsafarakis, Marinakis, & Matsatsinis,2010) to locate a population of near-optimal product line designs.Other approaches have also been proposed to model productsqualitatively in terms of abstract “quality levels”, although these areprimarily used to analyze structural properties rather than offercomputational decision support tools (Krishnan & Zhu, 2006 provide arecent review).
The bulk of the engineering literature on product line designfocuses on product families and platforms and is generally designedaround stochastic methods or gradient-based constrained nonlinearprogramming techniques to handle continuous formulations. Thefocus on continuous variables increases applicability for practicalengineering problems, avoids combinatorial complexity found inmany positioning approaches and manages complex relationshipsamong attainable combinations of product attributes that cannot beeasily handled with attribute discretization. Most models focus on thetradeoff between increased commonality among products in a lineand the resulting decreases in the ability to meet distinct performancetargets set exogenously for each product variant (see Simpson, 2004;Simpson, Siddique, & Jiao, 2005 for a review).
One difficulty with integrating models from various productdevelopment disciplines is that the combined model can be large andcomplex, causing optimization difficulties. Recent efforts have linkedengineering optimization models to market demand models for singleproducts (e.g., Guet al., 2002;Wassenaar&Chen, 2003; Li&Azarm, 2000;Michalek, Feinberg, & Papalambros, 2005). Gu et al. (2002) proposed amethod for maintaining separate models for marketing and engineeringdecisions, coordinating them using the collaborative optimization (CO)technique for multidisciplinary design optimization, although they donot propose details for modeling and data collection for the marketingcomponent. Michalek et al. (2005) proposed a similar decompositionapproach using analytical target cascading (ATC) to coordinate market-ing and engineering models for a single product, assuming consumerpreferences to be homogeneous. They point out a preference for the ATCapproach over CO because ATC is defined for an arbitrary hierarchy ofsubsystems, andconvergenceproofs ensure that coordinationwill lead to
2 Like Chen and Hausman (2000), we invoke a number of assumptions to tightlyfocus on product line optimization issues: (1) total market size is exogenouslydetermined; (2) each customer purchases zero or one product; (3) customers do not
3J.J. Michalek et al. / Intern. J. of Research in Marketing 28 (2011) 1–12
a solution that is optimal for the firm (Li et al., 2008). Shiau andMichalek(2009a, 2009b) identify equilibria for single-product firms in Nashcompetition on price and product design decisions under mixed logitdemand, finding that engineering design decisions are separable fromstrategic positioning and retail distribution channels only whenconsumer preference parameters are heterogeneous.
Recent studies have examined aspects of the product line designproblem and its attendant optimization issues, although without fullyaddressing modeling and estimation of preference heterogeneity forhorizontally differentiated products (i.e., those that differ in attributesvalued by various consumer groups) and engineering constraints thatimpose tradeoffs in the ability to achieve desirable combinations ofproduct attributes (e.g., Kokkolaras, Fellini, Kim, Michelena, &Papalambros, 2002; Li & Azarm, 2002; Belloni, Freund, Selove, &Simester, 2008; Wang, Camm, & Curry, 2009; Kim & Chhajed, 2002;Chhajed & Kim, 2004; Fruchter, Fligler, &Winer, 2006). One exceptionis the work of Luo (2011), who considers joint engineering andmarketing solutions with consumer heterogeneity using stochasticalgorithms and who additionally addresses “robustness” (whetherproducts in the line break down under known usage situations). Ourapproach addresses a continuous design space, offering improvedcomputational efficiency and stability, a structure for organizing andcoordinating models from different disciplines, and provable conver-gence to local minima.1 The proposed ATC approach is preferred overprior methods when (1) the attribute space is significantly con-strained by physical restrictions on the engineering design (e.g.,weight capacity is limited by number size), (2) when the designdecisions and product attributes exist primarily along a continuum(e.g., number size or weight capacity), and/or (3) when modelers willdevelop engineering and market models separately and benefit fromwell-defined interfaces for coordination and modularity to supportmodel additions.
Among themain points of the present paper is simply that, if afirm isgoing todesignmultiple products aspart of a line, it needs to understandnot onlywhichmarket niches theywill serve, but alsowhether they canbe realized. That is, despite the advances of recent literature, a number ofkey problems remain. Specifically, current approaches to the productline problem lack coordination with engineering in terms of productfeasibility; do not easily accommodate a sophisticated account ofpreference heterogeneity, entail substantial computational problemsand require changes fromthegroundup todealwithnewstructures andphenomena. Our proposedmethodology resolves each of these issues inthe following sections.
1.2. Proposed methodology
In this article, we propose a comprehensive methodology forproduct line design, using ATC to coordinate attribute selection foreach of the products desired by a heterogeneous market whileensuring they can each be realized by a feasible engineered design.The proposed approach avoids the combinatorial complexity ofbinary/integer formulations in the marketing literature while extend-ing applicability to continuous formulations and avoiding the need toassume monotonic preferences. Importantly, our approach allows fora general representation of consumer tastes through the use ofBayesian mixture models. The decomposition-based ATC approachfurther offers the organizational and computational benefits ofmaintaining separate subsystems for positioning and design of eachproduct in the line, reducing the dimensionality of each subspace andallowing each subsystem to be efficiently solved in parallel.
We adopt a random utility framework (Train, 2003) for estimatingmarket demand for the product line, where the utility of each product toeach consumer depends on the product's attributes, the consumer's
1 Luo (2011) tests the “all at once” solution approach against ATC, finding the latterto offer computational efficiencies.
idiosyncratic preferences for those attributes, and a random errorcomponent. A random utility framework allows for uncertainties due tofactors unobservable to the analyst, and it avoids the discontinuitiesintrinsic to a deterministic framework (e.g., Dobson & Kalish, 1988,1993; Green & Krieger, 1985; Kohli & Sukumar, 1990; Li & Azarm, 2002;McBride & Zufryden, 1988), enabling the use of efficient gradient-basednonlinear programming optimization tools. Importantly, a randomutility framework allows for the explicit modeling of consumer tastedistributions or heterogeneity. As our results illustrate, the variousrepresentations available to model taste differences can have asubstantial, and substantive, impact on the final optimal product lineand its profitability, especially if one chooses an overly parsimoniousheterogeneity representation. The impact of preference heterogeneityon line configuration has not received much attention in the productline literature. Even though models with continuous and discreteheterogeneity representations can predict choices almost equally well(Andrews, Ainslie, & Currim, 2002; Andrews, Ansari, & Currim, 2002),the resulting optimized product lines from different heterogeneityrepresentations may be very different.2
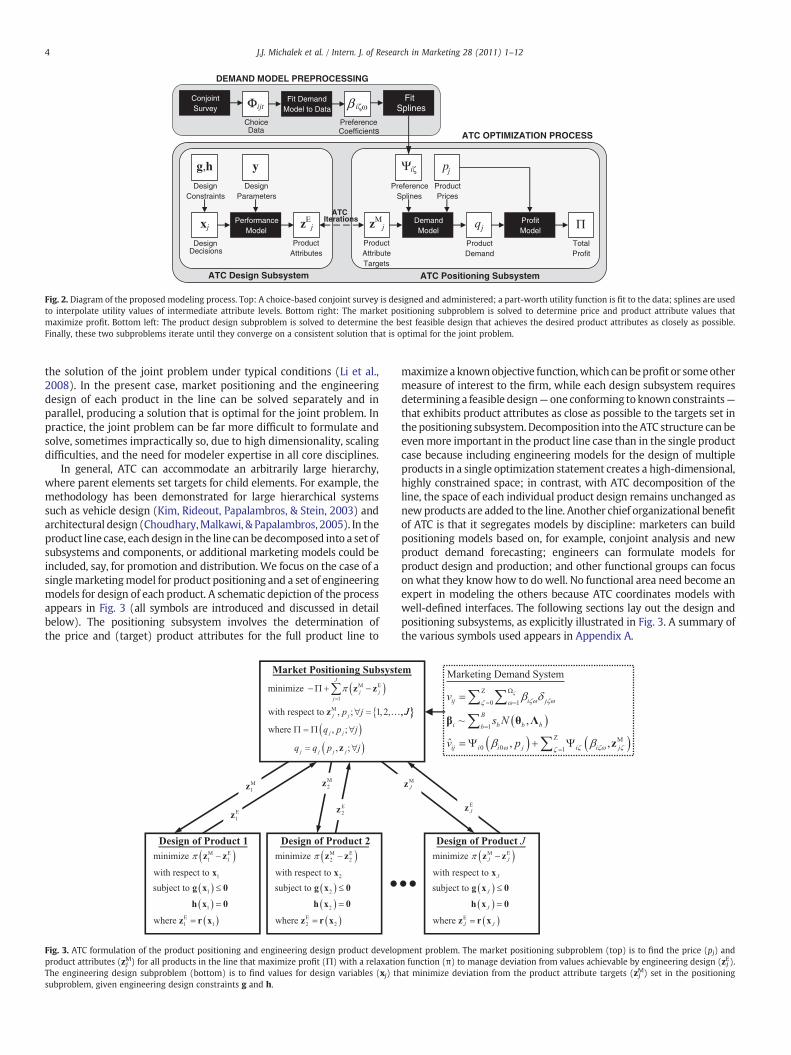
The proposed product line designmethodology entails four stages:first, consumers choose among products in a conjoint setting; second,heterogeneous preference coefficients in the model are estimated;third, demand models are formulated by interpolating preferencecoefficients using splines; and fourth, ATC coordinates optimizationover the space of feasible product designs to yield optimal productattributes. The first three stages are viewed as preprocessing for theATC model, as shown schematically in Fig. 2, with symbols definedlater in the text (see also Appendix A). In the context of the illustrativeexample in Fig. 1, these three preprocessing stages concern theproduct positioning, i.e., determining consumers' preferences forweight capacity and number size. Then, given these preferences, ATCcoordinates product positioning and design so that the dial (whose sizeis limited by weight capacity and number size) is small enough to fitinside the scale housing until firm level goals (typically, concerningprofitability) are achieved. We proceed by defining the ATC method-ology in Section 2, conditional on a model to predict demand; next, wedescribe alternative discrete choice model specifications for demandprediction in Section 3; and finally, we demonstrate the methodologywith an application to dial-readout scales using models and data fromthe literature (Michalek et al., 2005) in Section 4 and discuss results andtheir marketing implications in Section 5.
2. ATC coordination of product positioning and design
ATC requires a mathematical or computational model of eachsubsystem, and in practice, these can be numerous. Themodeler's taskis to organize the various subsystem models into a hierarchy whereeach element in the hierarchy represents a (sub)system that isoptimized to match targets passed from the parent (super)systemwhile setting targets that are attainable by subsystem child elements(Kim, Michelena, Papalambros, & Jiang, 2003). In our application, thejoint product line positioning and design problem is decomposed intotwo types of interrelated subsystems or subproblems: (1) a productpositioning subproblem that sets product attribute targets for eachproduct in the line and (2) a set of product design subproblems, onefor each product in the line, that each aims to achieve its targetssubject to constraints. It has been shown that iteratively solving ATCsubproblems under specific coordination strategies will converge to
directly influence one another; and (4) production can be scaled up or down to suitdemand. As such, our formulation is well-suited to stable, differentiated durables andis less appropriate for commodities or rapidly developing product classes.
xj
Design Decisions
Performance Model
zMj
Product Attribute Targets
Demand Model
Ψi
qj
Product Demand
Fit Demand Model to Data
g,h
Design Constraints
y
Design Parameters
Preference Splines
Φijt
Choice Data
zEj
Product Attributes
β i
Preference Coefficients
ATC Design Subsystem ATC Positioning Subsystem
DEMAND MODEL PREPROCESSING
ATC Iterations Profit
Model
pj
Product Prices
ΠTotal Profit
Conjoint Survey
Fit Splines
ATC OPTIMIZATION PROCESS
ζω
ζ
Fig. 2. Diagram of the proposed modeling process. Top: A choice-based conjoint survey is designed and administered; a part-worth utility function is fit to the data; splines are usedto interpolate utility values of intermediate attribute levels. Bottom right: The market positioning subproblem is solved to determine price and product attribute values thatmaximize profit. Bottom left: The product design subproblem is solved to determine the best feasible design that achieves the desired product attributes as closely as possible.Finally, these two subproblems iterate until they converge on a consistent solution that is optimal for the joint problem.
4 J.J. Michalek et al. / Intern. J. of Research in Marketing 28 (2011) 1–12
the solution of the joint problem under typical conditions (Li et al.,2008). In the present case, market positioning and the engineeringdesign of each product in the line can be solved separately and inparallel, producing a solution that is optimal for the joint problem. Inpractice, the joint problem can be far more difficult to formulate andsolve, sometimes impractically so, due to high dimensionality, scalingdifficulties, and the need for modeler expertise in all core disciplines.
In general, ATC can accommodate an arbitrarily large hierarchy,where parent elements set targets for child elements. For example, themethodology has been demonstrated for large hierarchical systemssuch as vehicle design (Kim, Rideout, Papalambros, & Stein, 2003) andarchitectural design (Choudhary,Malkawi, & Papalambros, 2005). In theproduct line case, each design in the line can bedecomposed into a set ofsubsystems and components, or additional marketing models could beincluded, say, for promotion and distribution. We focus on the case of asinglemarketingmodel for product positioning and a set of engineeringmodels for design of each product. A schematic depiction of the processappears in Fig. 3 (all symbols are introduced and discussed in detailbelow). The positioning subsystem involves the determination ofthe price and (target) product attributes for the full product line to
Fig. 3. ATC formulation of the product positioning and engineering design product developproduct attributes (zMj ) for all products in the line that maximize profit (Π) with a relaxatioThe engineering design subproblem (bottom) is to find values for design variables (xj) thsubproblem, given engineering design constraints g and h.
maximize a knownobjective function,which canbeprofit or someothermeasure of interest to the firm, while each design subsystem requiresdetermining a feasible design— one conforming to known constraints—that exhibits product attributes as close as possible to the targets set inthe positioning subsystem.Decomposition into the ATC structure can beevenmore important in the product line case than in the single productcase because including engineering models for the design of multipleproducts in a single optimization statement creates a high-dimensional,highly constrained space; in contrast, with ATC decomposition of theline, the space of each individual product design remains unchanged asnewproducts are added to the line. Another chief organizational benefitof ATC is that it segregates models by discipline: marketers can buildpositioning models based on, for example, conjoint analysis and newproduct demand forecasting; engineers can formulate models forproduct design and production; and other functional groups can focuson what they know how to dowell. No functional area need become anexpert in modeling the others because ATC coordinates models withwell-defined interfaces. The following sections lay out the design andpositioning subsystems, as explicitly illustrated in Fig. 3. A summary ofthe various symbols used appears in Appendix A.
ment problem. The market positioning subproblem (top) is to find the price (pj) andn function (π) to manage deviation from values achievable by engineering design (zEj ).at minimize deviation from the product attribute targets (zMj ) set in the positioning

5J.J. Michalek et al. / Intern. J. of Research in Marketing 28 (2011) 1–12
2.1. Market positioning subsystem
The market positioning objective is to maximize profit Π withrespect to the price pj and the vector of product attribute targets zMjfor each product j in the product line j={1,2,…,J}. Although firms canspecify arbitrarily sophisticated profit functions based on theirexperience, internal accounting and historical demand, we use asimple profit (Π) formulation here — revenue minus cost — so that
Π = ∑Jj = 1 pj−cVj
� �qj−cIj
� �;
where pj is the (retail) price of product j, cVj is the unit variable cost ofproduct j, c Ij is the investment cost for product j, which represents allcosts of setting up amanufacturing line for product j, and qj is quantityof product j sold (demand), which is a function of the productattributes zMk and price pk of all products k∈ {1,2,…, J}. We presumethat product commonalities enabling investment cost sharing andimproving economies of scale do not exist, so each new productdesign requires new manufacturing investment, although this canreadily be relaxed, given appropriate cost-specific information. Ingeneral, cVj and c Ij can be considered functions of market conditionsor engineering decisions, although in the example, they are taken asconstants. Alternative models for calculating the quantity of product jsold (qj) for each product jwill be developed in Section 3. To account forthe need to match product attribute targets zMj with the attributes ofrealizable engineering designs zEj , the consistency condition zMj−zEj=0 isrelaxed and moved into the objective function using a consistencyconstraint relaxation π(zMj−zEj). This relaxation can be handled in avariety of ways (see Li et al., 2008 for a review of approaches andmathematical properties), and we adopt the augmented Lagrangianapproach with diagonal quadratic approximation, described below.Finally, the positioning subsystem for a single-producer scenario,conditional on a model for demand, is written as
maximizepj ;z
Mj ∀j∈ 1;…; Jf g
∑J
j=1pj−cVj
� �qj−cIj−π zMj −zEj
� �� �
whereqj = SPj pk; zMk ∀k∈ 1;2;…; Jf g
� �
where S is the (exogenous) market size and Pj is the share of choices forproduct j. In Section 3, we address how conjoint analysis, discrete choicemodeling and Bayesian (MCMC) methods can be used to represent thefunctional relationship between Pj and the variables zM and p forpositioning a product line. The market positioning subsystem issummarized in the top part of Fig. 3.
2.2. Engineering design subsystems
Conceptually, the objective of each engineering subsysteminvolves finding a feasible design that exhibits product attributesmatching the targets set by the market positioning subproblem asclosely as possible, which is schematically depicted in the bottom partof Fig. 3. Here, the vector of product attributes zEj for product jrepresents a set of objective, measurable aspects of the product, whichare observable by the customer and result from engineering designdecisions. In each engineering design subsystem j, a search isconducted with respect to a vector of design variables xj, whichrepresents decisions made by the designer that are not directlyobservable by consumers but that affect the attributes that consumersdo observe, i.e., zEj. An engineering analysis simulation responsefunction r(xj) is used to calculate attributes zEj as a function of xj.The design variable vector xj is restricted to feasible values by a set ofconstraint functions g(xj)≤0 and h(xj)=0, and so values for productattributes zEj =r(xj) are implicitly restricted to values that canbe achieved by a feasible design. While construction of x, r(x), g(x)
and h(x) to represent a particular product is necessarily case-specific,general principals and guidelines are well established in the literature(Papalambros & Wilde, 2000; Ravindran, Ragsdell, & Reklaitis, 2006).Each engineering design subsystem minimizes the consistencyconstraint relaxation function, which works to minimize deviationbetween the positioning targets zMj set by marketing, which are heldconstant in each engineering design subsystem, and the attributesachieved by engineering zEj . The engineering optimization problemfor product j can then be written as
minimizexy
π zMj −zEj� �
subject to g xj� �
≤0;h xj� �
= 0;
where zEj = r xj� �
:
2.3. Complete ATC formulation
Fig. 3 summarizes the mathematical description of the completeformulation, showing the flow of the ATC-based product lineoptimization model for a single producer, where the number ofproducts in the line J is determined through a parametric study: i.e., Jis held fixed during optimization, separate optimization solutions arefound for each value of J∈ {1,2,…}, and the value of J that produces thesolution with the highest profit is selected. In this way, we determinenot only the optimal designs of products in a given line but theoptimal line size as well.
As stated above, coordination of the subsystems can be handledthrough a variety of approaches for relaxing the consistency constraintzMj−zEj=0. Here, we use the augmented Lagrangian approach withdiagonal quadratic approximation for improved stability and computa-tional efficiency, where π(zMj−zEj)=λT(zMj−zEj)+||w •(zMj−zEj)||22, λ isthe Lagrange multiplier vector, w is a weighting coefficient vector, • isthe Hadamard product (i.e., (A•B)i=AiBi), and the quadratic term islinearized at each iteration to enable separability of the subsystems forparallel processing (Li et al., 2008). The coordination procedure is asfollows.
1. Initialize all variables.2. Solve the market positioning subproblem and each engineering
design subproblem in parallel using an NLP solver.3. Updateλusing themethodofmultipliersλ(κ+1)=λ(κ)+2w(κ)•w(κ)•
(zMj (κ)−zEj(κ)) and update w using w(κ+1)=γw(κ) with γN1 asneeded to provide stability and reduce duality gaps, where (κ)represents the iteration number.
4. If converged, stop, else return to step 2.
3. Models of product demand
Green and Krieger's comparative study of alternative conjointmethods for eliciting consumer preferences concluded that choice-based conjoint offers the best method for the extraction of individual-level consumer preferences (Green & Krieger, 1996). We used it asfollows. Respondents are presented with a series of questions or“choice sets” t={1,2,…,T}. In each choice set t, the respondent ispresented a set of product alternatives j∈J t, with attributes set atdiscrete levels and systematically varied. The resulting data are eachrespondent's observed choices in each choice set:Φijt, whereΦijt=1 ifrespondent i chooses alternative j in choice set t and Φijt=0otherwise. These data {Φijt} are then used to estimate the parametersof the choicemodel for the positioning subsystem, as illustrated in Fig. 2.
In the random utility choice model, individuals i={1, 2,…, I}derive from each product j={1, 2,…, J} some utility value uij that iscomposed of an observable, deterministic component vij and anunobservable random error component εij, so that uij=vij+εij. Each

6 J.J. Michalek et al. / Intern. J. of Research in Marketing 28 (2011) 1–12
individual will choose the alternative that gives rise to the highestutility (i.e., alternative j is chosen by individual i if uijNuik for all k≠ j).The deterministic utility νij derived by individual i from product j iswritten as
vij = ∑Zζ=0∑
Ωζ
ω=1βjζωδjζω;
where the binary dummy δjζω=1 indicates alternative j possessesattribute ζ at levelω, and βiζω is the part-worth coefficient of attributeζ at level ω for individual i, which is estimated from the conjointchoice data Φ. The model thus accords with the typical main-effectsconjoint set-up dominant in the literature, although interactioneffects may also be included as needed. In δjζω the elements of theproduct attribute vector zMj are enumerated ζ={1, 2,…Z}, and price pis included in δjζω and labeled as element ζ=0. Each product attributeζ is either intrinsically discrete or is discretized into Ωζ levels, ω={1,2,…Ωζ}; thus, it does not presume linearity with respect to theunderlying continuous variables. For an alternative approach todiscrete attributes, see Luo (2011).3
The probability Pij that alternative j is chosen by individual idepends on the assumed error distribution. The most commondistributions for εij are the normal and double exponential, resultingin the standard probit and logit models, respectively (Train, 2003).4
We index the “no choice option” (the outside good) as alternative 0,with error εi0 and observable utility vi0 for individual i, where vi0=0;∀i for identification. The inclusion of an outside good allows overalldemand contraction when the set of products offered fails to matchthe market's preferences well.
The representation of differences in consumer tastes, as given byβi, where βi contains the elements βiζω, can be expected to beimportant in product line optimization, as heterogeneity in prefer-ences should give rise to differentiated product offerings. Failure tocorrectly model this heterogeneity can lead to biased parameterestimates, inaccurate predictions (Rossi, Allenby, & McCulloch, 2005;Andrews, Ansari, & Currim, 2002; Otter, Tuchler, & Fruhtwirth-Schnatter, 2004) and, consequently, suboptimal product line designs.Furthermore, when heterogeneity is not adequately accounted for, itis well-known that the independence from irrelevant alternatives(IIA) problem is exacerbated (Train, 2003). We therefore specify avery general continuous distributional form for βi by using a mixtureof normal distributions (Lenk & DeSarbo, 2000). The approachassumes that there are a finite number of groups or segments inwhich individuals are similar — though, importantly, not identical —with respect to their preferences and tastes. To be more specific, wehave
βi∼∑Bb=1sbN θb;Λbð Þ;
where sb is the fraction of the market in “segment” (or mixingcomponent) b∈{1,…,B}. Here, θb is the vector of means and Λb is a fullvariance–covariancematrix. Thismodel provides aflexible specification
3 For quantitative attributes that exist in a continuous space, it is appropriate tomeasure preference at discrete points and optimize over a continuous space usinginterpolation. Moreover, when constraints restrict feasible combinations of attributes,it is sometimes the case that none of the combinations of discretized attributes isfeasible (this is true in the case study presented in this paper). Interpolation is criticalin these situations. For categorical attributes (e.g., brand name), decomposition can beused in conjunction with global MINLP search algorithms (Khajavirad & Michalek,2009), or stochastic approaches can be used (Luo, 2011).
4 Each error distribution confers distinct advantages for the problem at hand:normal errors (probit) offer conjugacy in Bayesian MCMC estimation, allowing allGibbs draws and avoiding Metropolis steps, but require numerical integration in theproduct line optimization phase; Gumbel errors (logit) require Metropolis steps inBayesian estimation but entail closed-form expressions for gradients used inoptimization. Amemiya (1985) shows that very large samples are required todistinguish results produced by the Gumbel and normal error specifications andsuggests a way to translate between coefficient estimates to take advantage of theformer's optimization advantages and the latter's estimation efficiencies.
that combines both discrete and continuous heterogeneity and includesseveral well-known heterogeneity models as special cases: (i) whenB=1 the well-known standard random-effects model arises, which, incombination with Bayesian estimation, enables individual-level esti-mates by pooling information among individuals via “shrinkage” (Rossiet al., 2005); (ii)whenΛb=0 for all b∈{1,…,B}, the standard latent classor finite mixture model arises (Kamakura & Russell, 1989), andindividuals within a segment b are assumed to have identicalpreferences θb; and (iii) when Λb=0 and B=1, it is assumed that allindividuals have the same preference parameters θ1. The last,homogeneous case (iii) is overly restrictive for markets with heteroge-neouspreferences, anddemandmodels that assumehomogenous tastescan be expected to perform poorly in terms individual specific part-worth recovery and market predictions. Andrews, Ainslie, and Currim(2002); Andrews, Ansari, and Currim (2002) suggest that models withcontinuous (case i) and discrete (case ii) representations of heteroge-neity recover parameter estimates and predict choices about equallywell, except when the number of choices J is small, in which casediscrete heterogeneity (ii) outperforms the continuous model (i). Weexamine whether the optimized product lines conditional on each ofthese models produce similar results.
For the general case, model parameters are estimated via standardMarkov Chain Monte Carlo (MCMC) techniques (Gelman, Carlin,Stern, & Rubin, 2003; Rossi et al., 2005).5 We generally specifyconjugate priors, and the full conditional distributions for the MCMCsampler can be derived straightforwardly (e.g., Lenk & DeSarbo,2000). In order to choose the number of mixture components B in themixture representation for βi, we use the Deviance InformationCriterion (DIC) statistic proposed by Spiegelhalter, Best, Carlin, andvan der Linde (2002). DIC is particularly suited to complexhierarchical (Bayesian) models because the DIC statistic determinesthe “effective number of parameters” entailed by the modelspecification itself, unlike measures such as AIC.
Once the model parameters are estimated, we compute marketdemand for the positioning subproblem (Fig. 3) in three steps: First,we generate a large set of βi (say i=1,…,ID) from the hierarchicalmodel {sb, θb, Λb} that describes the mixture distribution.6 Second, weuse natural cubic splines (Boor, 2001) to flexibly interpolate βi forintermediate values of product attributes and price. Because all thelevels in our conjoint application are made explicit, are modest innumber and donot vary across respondents, there is noneed to resort tocomplex methods designed to deal with latent knot configurations,although such methods are available in the Bayesian choice modelingliterature (Kim, Menzefricke, & Feinberg, 2007). Specifically, naturalcubic spline functions Ψiζ are fit through the discrete part-worthcoefficientsβiζω for each i and ζ,whereω={1,2,…,Ωζ} to interpolate thedeterministic component of utility.7 Indexing attributes as ζ=1,…, Ζand price as ζ=0, the interpolated value of the observable componentof utility is
v̂ij = Ψi0 βi0ω;pj� �
+ ∑Zζ=1Ψiζ βiζω; z
Mjζ
� �;
where zMjζ indicates the ζth element of the vector zMj. Theseinterpolated v̂ij give rise, through the random utility specification, to
5 We are indebted to Peter Lenk for sharing both his GAUSS code and his expertise.6 Estimating the model provides a set of draws from the posterior distribution of
βiζω for each survey respondent. One could then estimate market demand using thisspecific set of individuals. We take a Bayesian perspective and use the hyperpara-meters describing the mixture distribution (after the MCMC chain has converged), asthese can be viewed as ‘giving rise’ to the individual-level βi values. Specifically, anarbitrarily large sample of new βi values from this distribution can be drawn todescribe the market.
7 It is possible to use piecewise linear interpolation as an alternative to cubic splines;however, piecewise linear formulations are non-smooth in the continuous space,requiring a mixed integer formulation and solution approach that will often producecorner solutions at the discrete levels measured in the conjoint task.

7J.J. Michalek et al. / Intern. J. of Research in Marketing 28 (2011) 1–12
expected individual choice probabilities Pij that are computed usingeither a logit or a probit distribution for the errors. Finally, theindividual choice probabilities are used to compute market demandfor each product, qj (Fig. 3). Calculating market demand for product jinvolves multiplying the probability Pij, by the market potential S foreach individual i=1,…, ID, and averaging the resulting quantitiesacross the individuals. Market potential is assumed to be exogenouslydetermined through pre-market forecasting techniques (Lilien,Kotler, & Moorthy, 1992).
4. Empirical application
In demonstrating the methodology, we adapt a product topologymodel for dial-readout bathroom scales developed previously for asimple single-product, homogeneous market example by Michaleket al. (2005) for comparison. This example was originally posed forthe design of a single product under the assumption that consumerpreferences are homogeneous. While expedient, neither assumptionaccords well with managerial practice. Furthermore, as we will see,even in those rare cases where a firm does seek to enter the marketwith a single product, the presumption of homogeneity is trouble-some; in fact, the single-product solution obtained in Michalek et al.(2005) is substantially changed once any form of preferenceheterogeneity is allowed.
The inherent modularity of the proposed methodology for productline design circumvents the need to build a joint model of the fullproduct line for each case J={1,2,…}. Instead, a model of only a singleproduct need be developed, and a duplicate can be created for eachproduct j constituting the line,8 as illustrated in Fig. 3. It is importantto note that the design space x for this product does not map one-to-one with the attributes z communicated to consumers, which comesabout because the engineering design model specifies some productattributes as functions of interactions among design variables; that is,different designs may exhibit identical product attributes, as observedby the customer. A manager could enact any number of criteria posthoc to choose from among such a continuum, or detailed cost data andpreferences for commonality could drive selection of a singleengineering design among the set of possibilities, although we donot pursue such strategies here.
The conjoint attributes came from amajor scale manufacturer whohad conducted extensive marketing research into what consumerscare about. From this list, “decorative” attributes were removed, onesthat were not part of the engineering model, had no cost implicationsand could be switched-out postproduction (e.g., color or packaging).The product attributes z “seen” by consumers are weight capacity z1,aspect ratio z2, platform area z3, tick-mark gap z4, number size z5, andprice p. For the conjoint study, the range of values for each attributewas captured by five (discrete) levels. Each respondent (n=184)made choices from 50 consecutive sets in a choice-based conjointtask, identical across respondents, each with three options (plus “nochoice”), implemented through aweb browser. Interestingly, with theATC approach, it is neither necessary nor practical to pre-restrictchoice sets to include only realizable products as long as unrealizableproduct attribute specifications describe product profiles that aremeaningful to the respondent. The goal of the conjoint task is theeffective and unbiased measurement of consumer preference drivers.Infeasible combinations of product attributes are implicitly avoidedduring optimization through coordination with the engineeringdesign subsystem.
The demand/profit function requires (exogenous) estimates ofseveral quantities, which are based here on manufacturer andpublicly-available figures: cVj =$3 cost per unit, cIj =$3 million forinitial investment, and market size S=5million, the approximate
8 All models and results are available from the authors upon request.
yearly US dial-readout scalemarket. Being completely exogenous, thesevalues are easily altered. The special cases of discrete mixture (Λ=0)and homogeneous (B=1, Λ=0) models are straightforward toestimate using maximum likelihood techniques (Train, 2003). For themixture of normal distributions, estimates from a classical mixture ofprobitswere used as starting values, and the Gibbs samplerwas iterateduntil a stationary posterior was obtained. To mitigate autocorrelation,the data were thinned by retaining every 10th draw after a burn-in of50,000 iterations. Convergence was examined through iteration plots;posterior marginals revealed no convergence problems.
In order to optimize over this posterior surface, Monte Carlointegrationwas applied as follows: when the chain has stabilized, newvalues of βi are generated as the chain continued to run, allowinghyperparameters to vary across the generated values. These values arethinned to reduce serial correlations; specifically, 10,000 values aregenerated, and every 10th is retained. The resulting set of 1000 βi
draws, with splines fit through the part-worth attribute levels of eachdraw, is used to represent the population (the posterior surface)throughout the optimization. Accuracy can be enhanced, if need be, bygenerating additional βi values, although in the case study, tests ofsolution sensitivity to additional draws (up to 24,000) show that 1000draws is sufficient to represent the “demand surface”.
5. Results
There are two main methodological components to the approachadvocated here: 1) econometric, for the extraction of individual-level preferences and generation of the preference splines, and 2)optimization-based, for the determination of the best number ofproducts, their positioning and their design conditional on thepreferencesplines. We examine each of these components in turn.
5.1. Demand model results
Table 1 lists DIC results for the normal mixture model and BICresults for the discrete mixture and homogeneous cases as well asclassical log-likelihood values for reference. The latent class modelidentified by BIC consists of seven segments, whereas the mixturemodel with a diagonally-restricted covariance matrix identified byDIC has three mixing components, and the full-covariance mixturemodel has two. It is apparent that (1) continuous heterogeneity(normal mixture) alone is superior to discrete heterogeneity (latentclass) alone, up through a fairly large number of segments (Rossi et al.,2005); (2) a correlated (random) coefficients specification for thenormal mixture is superior to an uncorrelated one; and (3) more thanone segment in the normal mixture model is supported. In short, themost general specification fares best, and each of its attributes —
correlated coefficients and both discrete and continuous heterogene-ity — is useful in accurately representing consumer preferences.9 Inthe following sections, we will refer primarily to this full model,calling on others peripherally to compare the “optimal product lines”they entail.
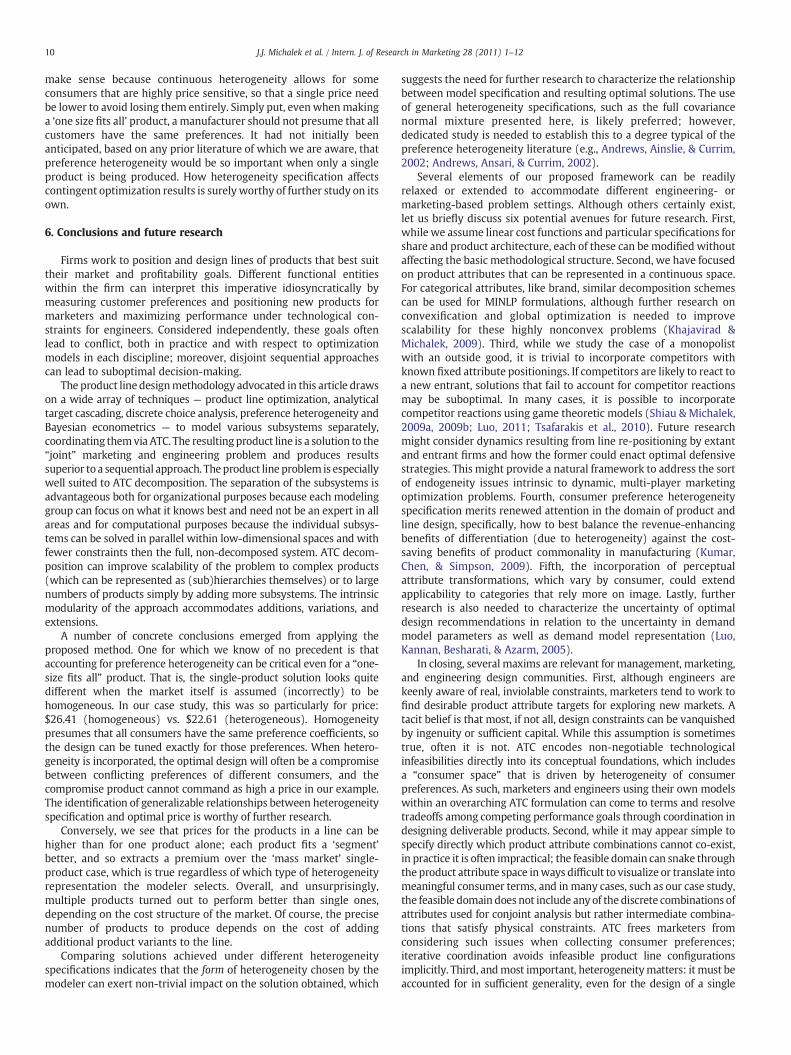
For illustration and a ‘reality check’, we briefly examine theposterior means of part-worth coefficient vectors, βi. The resultingsplines are shown graphically in Fig. 4, along with analogous splinesfor the discrete mixture and homogeneous cases. For identificationpurposes these values are scaled so that the sum in each set ofattributes is zero, making for easier visual comparison. In each of thesix attribute spline graphs, the heterogeneous model is most “arched”or highly sloped, suggesting the presence of some consumers withrelatively strong preference differentials across attribute levels. Ofcourse, part-worth values have a nonlinear mapping onto choice
9 The posterior predictive distribution (Gelman et al., 2003) may be used to furtherassess whether the various demand models and different heterogeneity representa-tions provide adequate fit to the observed data.
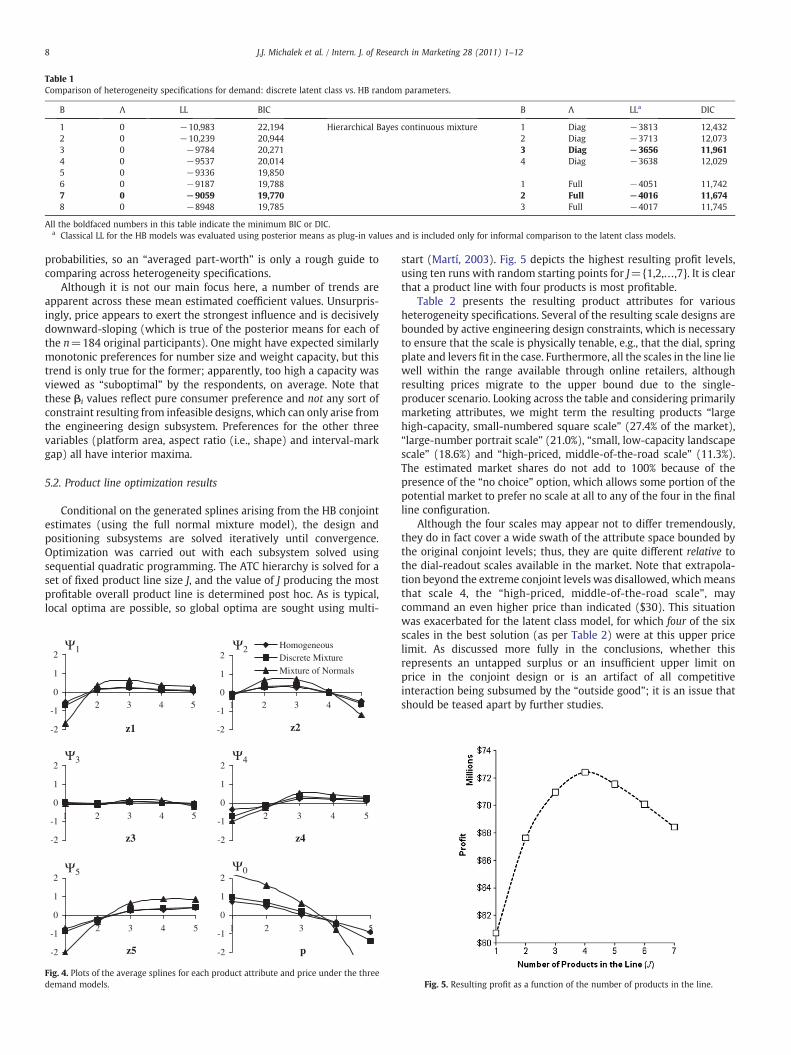
Table 1Comparison of heterogeneity specifications for demand: discrete latent class vs. HB random parameters.
B Λ LL BIC B Λ LLa DIC
1 0 −10,983 22,194 Hierarchical Bayes continuous mixture 1 Diag −3813 12,4322 0 −10,239 20,944 2 Diag −3713 12,0733 0 −9784 20,271 3 Diag −3656 11,9614 0 −9537 20,014 4 Diag −3638 12,0295 0 −9336 19,8506 0 −9187 19,788 1 Full −4051 11,7427 0 −9059 19,770 2 Full −4016 11,6748 0 −8948 19,785 3 Full −4017 11,745
All the boldfaced numbers in this table indicate the minimum BIC or DIC.a Classical LL for the HB models was evaluated using posterior means as plug-in values and is included only for informal comparison to the latent class models.
8 J.J. Michalek et al. / Intern. J. of Research in Marketing 28 (2011) 1–12
probabilities, so an “averaged part-worth” is only a rough guide tocomparing across heterogeneity specifications.
Although it is not our main focus here, a number of trends areapparent across these mean estimated coefficient values. Unsurpris-ingly, price appears to exert the strongest influence and is decisivelydownward-sloping (which is true of the posterior means for each ofthe n=184 original participants). One might have expected similarlymonotonic preferences for number size and weight capacity, but thistrend is only true for the former; apparently, too high a capacity wasviewed as “suboptimal” by the respondents, on average. Note thatthese βi values reflect pure consumer preference and not any sort ofconstraint resulting from infeasible designs, which can only arise fromthe engineering design subsystem. Preferences for the other threevariables (platform area, aspect ratio (i.e., shape) and interval-markgap) all have interior maxima.
5.2. Product line optimization results
Conditional on the generated splines arising from the HB conjointestimates (using the full normal mixture model), the design andpositioning subsystems are solved iteratively until convergence.Optimization was carried out with each subsystem solved usingsequential quadratic programming. The ATC hierarchy is solved for aset of fixed product line size J, and the value of J producing the mostprofitable overall product line is determined post hoc. As is typical,local optima are possible, so global optima are sought using multi-
-2
-1
0
1
2
1 2 3 4 5
z1 -2
-1
0
1
2
1 2 3 4 5
z2
HomogeneousDiscrete MixtureMixture of Normals
-2
-1
0
1
2
1 2 3 4 5
z3 -2
-1
0
1
2
1 2 3 4 5
z4
-2
-1
0
1
2
1 2 3 4 5
z5 -2
-1
0
1
2
1 2 3 4 5
p
Ψ1 Ψ2
Ψ3 Ψ4
Ψ5 Ψ0
Fig. 4. Plots of the average splines for each product attribute and price under the threedemand models.
start (Martí, 2003). Fig. 5 depicts the highest resulting profit levels,using ten runs with random starting points for J={1,2,…,7}. It is clearthat a product line with four products is most profitable.
Table 2 presents the resulting product attributes for variousheterogeneity specifications. Several of the resulting scale designs arebounded by active engineering design constraints, which is necessaryto ensure that the scale is physically tenable, e.g., that the dial, springplate and levers fit in the case. Furthermore, all the scales in the line liewell within the range available through online retailers, althoughresulting prices migrate to the upper bound due to the single-producer scenario. Looking across the table and considering primarilymarketing attributes, we might term the resulting products “largehigh-capacity, small-numbered square scale” (27.4% of the market),“large-number portrait scale” (21.0%), “small, low-capacity landscapescale” (18.6%) and “high-priced, middle-of-the-road scale” (11.3%).The estimated market shares do not add to 100% because of thepresence of the “no choice” option, which allows some portion of thepotential market to prefer no scale at all to any of the four in the finalline configuration.
Although the four scales may appear not to differ tremendously,they do in fact cover a wide swath of the attribute space bounded bythe original conjoint levels; thus, they are quite different relative tothe dial-readout scales available in the market. Note that extrapola-tion beyond the extreme conjoint levels was disallowed, whichmeansthat scale 4, the “high-priced, middle-of-the-road scale”, maycommand an even higher price than indicated ($30). This situationwas exacerbated for the latent class model, for which four of the sixscales in the best solution (as per Table 2) were at this upper pricelimit. As discussed more fully in the conclusions, whether thisrepresents an untapped surplus or an insufficient upper limit onprice in the conjoint design or is an artifact of all competitiveinteraction being subsumed by the “outside good”; it is an issue thatshould be teased apart by further studies.
Fig. 5. Resulting profit as a function of the number of products in the line.

Table 2Optimal product line solutions under each demand specification.
Single product solutions Product line solutions
Homogeneous Discretemixture
Normalmixture
Discrete mixture (latent class) Normal mixture
1 2 3 4 5 6 1 2 3 4
Π Profit (millions)a $ 54.10a 58.30a 60.70a 59.10a 72.40Market sharea % 48.80 57.80 65.00 25.10 8.70 8.70 8.70 6.90 4.90 27.40 21.00 18.60 11.30
z1 Weight capacity lb 255 254 256 238 257 257 257 253 248 292 262 200 255z2 Aspect ratio – 0.996 1.047 1.002 1.045 1.041 1.039 1.039 1.062 1.051 0.98 1.156 0.921 0.986z3 Platform area in.2 134 127 130 100 131 131 131 123 114 140 122 105 135z4 Tick mark gap in. 0.116 0.117 0.115 0.106 0.116 0.116 0.116 0.114 0.111 0.103 0.116 0.121 0.116z5 Number size in. 1.334 1.339 1.315 1.193 1.341 1.337 1.337 1.316 1.268 1.221 1.351 1.293 1.331p Price $ 26.41 24.21 22.61 23.96 30.00 30.00 30.00 30.00 29.37 22.89 24.53 23.84 30.00
a As calculated post-hoc using the normal mixture demand model.
9J.J. Michalek et al. / Intern. J. of Research in Marketing 28 (2011) 1–12
5.3. Effectiveness of ATC coordination
To demonstrate the importance of the proposed approach, the ATCsolution was compared to the solution obtained through a disjointsequential approach, which has been referred to as analytical targetsetting (Cooper, Georgiopoulos, Kim, & Papalambros, 2006). In thedisjoint scenario, price and product attribute positioning targets areset based on consumer preference datawithout engineering feasibilityinformation (the positioning subproblem), and these targets arepassed to the engineering design subproblems. Each engineeringsubproblem is then solved to design a feasible product that meets itstargets as closely as possible10 (the engineering subsystem) withoutfurther iteration, which can be viewed as a ‘single pass’ through ATC,similar to actual practice, where marketing studies precede engineer-ing design and subsequent iteration is costly and time-consuming.
In this disjoint scenario, marketing produces a plan for a line offour scales with a predicted combined market share (relative to fullpotential) of 83.4% and resulting profit of $81.2 million. There is noreason to believe these target product attributes will be attainablebecause they are based on consumer preferences alone. In the disjointcase, these targets are passed to the engineering subproblems, whicheach design a feasible product to achieve product attributes as close aspossible to the targets requested by marketing without furtheriteration. The resulting products differ significantly from the initialplan and so have attributes less preferred by consumers, resulting incombined 70.5% market share and $67.9 million profit: 16% less thanmarketing's original (unachievable) prediction. If ATC is instead usedto iteratively coordinate positioning and design, the resulting jointsolution is a line of four different products, resulting in a 78.2% marketshare and $72.4 million profit. In this case, coordination resulted in afeasible product line with a predicted 6% improvement in profitabilityrelative to disjoint decision-making.
In the disjoint scenario, marketing “leads” by developing theoriginal plan and engineering design “follows” by attempting to meetproduct attribute targets. The reverse situation, where engineering“leads”, is possible when all consumers have monotonic preferencesfor product attributes by first designing a set of products that arePareto-optimal in performance and then allowing marketing to pick aline from that set of products (Li & Azarm, 2002). However, in thisexample, preferences for attributes are non-monotonic, so no suchcommon Pareto set exists, and without preference information,engineering design has no single well-defined optimization objective.
5.4. Heterogeneity representation
We examine the impact of the heterogeneity specification on thejoint solution and whether simpler forms might have sufficed foroptimal feasible line design. The simple homogeneous demand model
10 We choose zero initial values for Lagrange multipliers, reducing the consistencyconstraint relaxation function to a quadratic penalty Euclidean distance metric.
is obviously ill-suited for generating product lines; moreover, becausethe IIA property is greatly exacerbated by preference homogeneity,the well-known “red bus, blue bus” problem can lead to lines withduplicate products (Train, 2003; Shiau & Michalek, 2009a). We thuscompare the discrete mixture (latent class) model with the normalmixture model. Because the discrete mixture is natively supported inmany statistical packages, it might prove convenient for lineoptimization; recent literature suggests that discrete and continuousheterogeneity can often represent preferences about equally well(Rossi et al., 2005; Andrews, Ainslie, & Currim, 2002; Andrews, Ansari,& Currim, 2002). Though fit statistics (Table 1) alone argue that thediscrete mixture is inferior to the normal mixture specification interms of representing preferences, it does not necessarily mean that,conditional on the resulting estimates, the resulting optimal line willbe similarly inferior in terms of profitability.
Table 2 lists a comparison between the resulting profitability of thebest locally-optimal solutions found using the discrete and continuousmixture demand models over ten multi-start runs with randomstarting points for each value of J. Not only do the differentheterogeneity specifications result in different product line solutions(a line of six products under the seven-class discrete mixture vs. fourunder the two-component normal mixture), but the former suffers aprofit decrement of 18% relative to the latter using the continuousmixture model to evaluate solutions post hoc. The discrete mixturesolution also entails little variation in the values across segments for agiven attribute. Furthermore, because the discrete mixture specifica-tion models all individuals within a segment as having identicalpreferences, the remaining within-segment IIA property can result insolutions with duplicate or near-duplicate products, such as the onereported in Table 2. It is important to note that such solutions areartifacts of the econometric model andmay be difficult to interpret formanagerial use. For example, simply taking the solution resultingfrom the model and eliminating product duplicates will not, ingeneral, produce a locally optimal solution in the reduced space.Furthermore, the within-segment homogeneity of preferences resultsin a profit surface containing pronounced local minima, whichimpedes the optimization process and makes global search difficult.Thus, even a relatively sophisticated heterogeneity representation canoffer very different, and potentially sub-optimal, product line results.
While it may be unsurprising that simpler heterogeneity repre-sentations can lead to suboptimal product lines, it is less obviouswhether a homogeneous model is sufficient for the design of a singleproduct (as assumed, for example, in Michalek et al., 2005). Ouranalysis strongly suggests that it is not. Table 2 lists single-productsolutions under the three demand model scenarios. Although in thiscase the more restrictive models do a fairly good job predicting someof the optimal product attributes, this is not so for price, which isnotably exaggerated (relative to the normalmixturemodel), resultingin a solution with a loss of 7% market share using the discrete mixturemodel and 14% using the homogeneous one (again, using the con-tinuous mixture model to evaluate solutions post hoc). These results
10 J.J. Michalek et al. / Intern. J. of Research in Marketing 28 (2011) 1–12
make sense because continuous heterogeneity allows for someconsumers that are highly price sensitive, so that a single price needbe lower to avoid losing them entirely. Simply put, even whenmakinga ‘one size fits all’ product, a manufacturer should not presume that allcustomers have the same preferences. It had not initially beenanticipated, based on any prior literature of which we are aware, thatpreference heterogeneity would be so important when only a singleproduct is being produced. How heterogeneity specification affectscontingent optimization results is surely worthy of further study on itsown.
6. Conclusions and future research
Firms work to position and design lines of products that best suittheir market and profitability goals. Different functional entitieswithin the firm can interpret this imperative idiosyncratically bymeasuring customer preferences and positioning new products formarketers and maximizing performance under technological con-straints for engineers. Considered independently, these goals oftenlead to conflict, both in practice and with respect to optimizationmodels in each discipline; moreover, disjoint sequential approachescan lead to suboptimal decision-making.
The product line designmethodology advocated in this article drawson a wide array of techniques — product line optimization, analyticaltarget cascading, discrete choice analysis, preference heterogeneity andBayesian econometrics — to model various subsystems separately,coordinating themvia ATC. The resultingproduct line is a solution to the“joint” marketing and engineering problem and produces resultssuperior to a sequential approach. Theproduct line problem is especiallywell suited to ATC decomposition. The separation of the subsystems isadvantageous both for organizational purposes because each modelinggroup can focus on what it knows best and need not be an expert in allareas and for computational purposes because the individual subsys-tems can be solved in parallel within low-dimensional spaces and withfewer constraints then the full, non-decomposed system. ATC decom-position can improve scalability of the problem to complex products(which can be represented as (sub)hierarchies themselves) or to largenumbers of products simply by adding more subsystems. The intrinsicmodularity of the approach accommodates additions, variations, andextensions.
A number of concrete conclusions emerged from applying theproposed method. One for which we know of no precedent is thataccounting for preference heterogeneity can be critical even for a “one-size fits all” product. That is, the single-product solution looks quitedifferent when the market itself is assumed (incorrectly) to behomogeneous. In our case study, this was so particularly for price:$26.41 (homogeneous) vs. $22.61 (heterogeneous). Homogeneitypresumes that all consumers have the same preference coefficients, sothe design can be tuned exactly for those preferences. When hetero-geneity is incorporated, the optimal design will often be a compromisebetween conflicting preferences of different consumers, and thecompromise product cannot command as high a price in our example.The identification of generalizable relationships between heterogeneityspecification and optimal price is worthy of further research.
Conversely, we see that prices for the products in a line can behigher than for one product alone; each product fits a ‘segment’better, and so extracts a premium over the ‘mass market’ single-product case, which is true regardless of which type of heterogeneityrepresentation the modeler selects. Overall, and unsurprisingly,multiple products turned out to perform better than single ones,depending on the cost structure of the market. Of course, the precisenumber of products to produce depends on the cost of addingadditional product variants to the line.
Comparing solutions achieved under different heterogeneityspecifications indicates that the form of heterogeneity chosen by themodeler can exert non-trivial impact on the solution obtained, which
suggests the need for further research to characterize the relationshipbetween model specification and resulting optimal solutions. The useof general heterogeneity specifications, such as the full covariancenormal mixture presented here, is likely preferred; however,dedicated study is needed to establish this to a degree typical of thepreference heterogeneity literature (e.g., Andrews, Ainslie, & Currim,2002; Andrews, Ansari, & Currim, 2002).
Several elements of our proposed framework can be readilyrelaxed or extended to accommodate different engineering- ormarketing-based problem settings. Although others certainly exist,let us briefly discuss six potential avenues for future research. First,while we assume linear cost functions and particular specifications forshare and product architecture, each of these can bemodified withoutaffecting the basic methodological structure. Second, we have focusedon product attributes that can be represented in a continuous space.For categorical attributes, like brand, similar decomposition schemescan be used for MINLP formulations, although further research onconvexification and global optimization is needed to improvescalability for these highly nonconvex problems (Khajavirad &Michalek, 2009). Third, while we study the case of a monopolistwith an outside good, it is trivial to incorporate competitors withknown fixed attribute positionings. If competitors are likely to react toa new entrant, solutions that fail to account for competitor reactionsmay be suboptimal. In many cases, it is possible to incorporatecompetitor reactions using game theoretic models (Shiau & Michalek,2009a, 2009b; Luo, 2011; Tsafarakis et al., 2010). Future researchmight consider dynamics resulting from line re-positioning by extantand entrant firms and how the former could enact optimal defensivestrategies. This might provide a natural framework to address the sortof endogeneity issues intrinsic to dynamic, multi-player marketingoptimization problems. Fourth, consumer preference heterogeneityspecification merits renewed attention in the domain of product andline design, specifically, how to best balance the revenue-enhancingbenefits of differentiation (due to heterogeneity) against the cost-saving benefits of product commonality in manufacturing (Kumar,Chen, & Simpson, 2009). Fifth, the incorporation of perceptualattribute transformations, which vary by consumer, could extendapplicability to categories that rely more on image. Lastly, furtherresearch is also needed to characterize the uncertainty of optimaldesign recommendations in relation to the uncertainty in demandmodel parameters as well as demand model representation (Luo,Kannan, Besharati, & Azarm, 2005).
In closing, several maxims are relevant for management, marketing,and engineering design communities. First, although engineers arekeenly aware of real, inviolable constraints, marketers tend to work tofind desirable product attribute targets for exploring new markets. Atacit belief is that most, if not all, design constraints can be vanquishedby ingenuity or sufficient capital. While this assumption is sometimestrue, often it is not. ATC encodes non-negotiable technologicalinfeasibilities directly into its conceptual foundations, which includesa “consumer space” that is driven by heterogeneity of consumerpreferences. As such, marketers and engineers using their own modelswithin an overarching ATC formulation can come to terms and resolvetradeoffs among competing performance goals through coordination indesigning deliverable products. Second, while it may appear simple tospecify directly which product attribute combinations cannot co-exist,in practice it is often impractical; the feasible domain can snake throughthe product attribute space inways difficult to visualize or translate intomeaningful consumer terms, and in many cases, such as our case study,the feasible domain does not include any of the discrete combinations ofattributes used for conjoint analysis but rather intermediate combina-tions that satisfy physical constraints. ATC frees marketers fromconsidering such issues when collecting consumer preferences;iterative coordination avoids infeasible product line configurationsimplicitly. Third, andmost important, heterogeneitymatters: it must beaccounted for in sufficient generality, even for the design of a single

11J.J. Michalek et al. / Intern. J. of Research in Marketing 28 (2011) 1–12
product. Finally, ATC was proven to converge to joint optimality acrossits various subsystems for a broad class of problems. Given its scalability,efficiency, and ability to key into a wide variety of extant modelingtechniques, we hope to see ATC-based frameworks widely adopted as across-disciplinary platform for the design of complex product lines.
Appendix A. List of symbols
• Hadamard product (element by element multiplication ofvectors)
Roman charactersb Index of mixing components (segments)B Number of mixing componentscjI Investment cost for product jcjV Unit variable cost for product jg Vector function of engineering design inequality constraintsh Vector function of engineering design equality constraintsi Consumer indexI Number of individual consumersID Number of individual consumer draws from the Bayesian
mixture modelj Product indexJ Number of products in the product linepj Price of product jPijt Probability that individual i chooses product j from choice
set tqj Demand for product jr Engineering design response function. Calculates product
attributes as a function of design variablesS Size of the marketsb Size of segment b (percentage)t Choice set index for conjoint surveyT Number of choice sets in the conjoint surveyuij Utility of alternative j for individual ivij Observable component of utility of product j for individual ivi0 Utility of the outside good for individual iw Vector of weighting coefficientsxj Vector of engineering design variables for product jzjM Vector of product characteristic targets set by marketing for
product jzjE Vector of product characteristics achieved by the engineer-
ing design of product j
Greek charactersβiζω Part-worth coefficient for consumer segment i for attribute
ζ at level ωβi Vector of part-worth coefficients compiling βiζω for all ζ
and ωδjζω Binary dummy variable indicating whether product j
possesses attribute ζ at level ωεij Random error coefficient for individual i product jζ Index of product characteristics={1,2,…,Z}. ζ=0 refers to
price.Z Number of product characteristicsθb Vector of mean values for mixture component bΛb Covariance matrix for mixture component bλ Vector of Lagrange multipliersΠ Profitπ Consistency constraint relaxation function. Relaxes the
constraint zjM=zjE
Φijt Binary dummy variable indicating observed choice ofindividual i with respect to alternative j on choice occasiont
Ψiζ Spline function of β for individual i and product attribute ζω Product characteristic level index={1,2,…,Ωζ} for product
characteristic ζΩζ Number of discrete levels for product characteristic ζ
References
Amemiya, T. (1985). Advanced econometrics. Cambridge, Mass.: Harvard UniversityPress.
Andrews, R. L., Ainslie, A., & Currim, I. S. (2002). An empirical comparison of logit choicemodels with discrete versus continuous representations of heterogeneity. Journal ofMarketing Research, 39(4), 479−487.
Andrews, R. L., Ansari, A., & Currim, I. S. (2002). Hierarchical Bayes versus finite mixtureconjoint analysis models: A comparison of fit, prediction, and partworth recovery.Journal of Marketing Research, 39(1), 87−98.
Belloni, A., Freund, R., Selove, M., & Simester, D. (2008). Optimizing product linedesigns: Efficient methods and comparisons. Management Science, September, 54(9), 1544−1552.
Boor, D. (2001). A practical guide to splines (revised ed.). New York: Springer.Chen, K. D., & Hausman, W. H. (2000). Technical note: Mathematical properties of the
optimal product line selection problem using choice-based conjoint analysis.Management Science, 46(2), 327−332.
Chhajed, K., & Kim, K. (2004). The role of inclination and part worth differences acrosssegments in designing a price-discriminating product line. International Journal ofResearch in Marketing, 21, 313−320.
Choudhary, R., Malkawi, A., & Papalambros, P. Y. (2005). Analytic target cascading insimulation-based building design. Automation in Construction, 14(4), 551−568.
Cooper, A. B., Georgiopoulos, P., Kim, H. M., & Papalambros, P. Y. (2006). Analyticaltarget setting: An enterprise context in optimal product design. Journal ofMechanical Design, 128(1), 4−13.
Dobson, G., & Kalish, S. (1988). Positioning and pricing a product line.Marketing Science,7(2), 107−125.
Dobson, G., & Kalish, S. (1993). Heuristics for pricing and positioning a product-lineusing conjoint and cost data. Management Science, 39(2), 160−175.
Fruchter, G. E., Fligler, A., & Winer, R. S. (2006). Optimal product line design: Geneticalgorithm approach to mitigate cannibalization. Journal of Optimization Theory andApplications, 131(2), 227−244.
Gelman, A., Carlin, J. B., Stern, H. S., & Rubin, D. B. (2003). Bayesian data analysis (2nded.). New York: Chapman & Hall/CRC.
Green, P. E., & Krieger, A. M. (1985). Models and heuristics for product line selection.Marketing Science, 4(1), 1−19.
Green, P. E., & Krieger, A. M. (1996). Individualized hybrid models for conjoint analysis.Management Science, 42(6), 850−867.
Gu, X. Y., Renaud, J. E., Ashe, L. M., Batill, S. M., Budhiraja, A. S., & Krajewski, L. J. (2002).Decision-based collaborative optimization. Journal of Mechanical Design, 124(1),1−13.
Kamakura, W. A., & Russell, G. J. (1989). A probabilistic choice model for market-segmentation and elasticity structure. Journal of Marketing Research, 26(4),379−390.
Kaul, A., & Rao, V. R. (1995). Research for product positioning and design decisions: Anintegrative review. International Journal of Research in Marketing, 12(4), 293−320.
Khajavirad, A., & Michalek, J. J. (2009). A deterministic Lagrangian-based globaloptimization approach for quasiseparable nonconvex mixed-integer nonlinearprograms. ASME Journal of Mechanical Design, 131(051009), p1−8.
Kim, K., & Chhajed, D. (2002). Product design with multiple quality-type attributes.Management Science, 48(11), 1502−1511.
Kim, J. G., Menzefricke, U., & Feinberg, F. M. (2007). Capturing flexible heterogeneousutility curves: A Bayesian spline approach. Management Science, 53(2), 340−354.
Kim, H. M., Michelena, N. F., Papalambros, P. Y., & Jiang, T. (2003). Target cascading inoptimal system design. Journal of Mechanical Design, 125(3), 474−480.
Kim, H. M., Rideout, D. G., Papalambros, P. Y., & Stein, J. L. (2003). Analytical targetcascading in automotive vehicle design. Journal of Mechanical Design, 125(3),481−489.
Kohli, R., & Sukumar, R. (1990). Heuristic for product line design using conjoint analysis.Management Science, 36(12), 1464−1477.
Kokkolaras, M., Fellini, R., Kim, H. M., Michelena, N. F., & Papalambros, P. Y. (2002).Extension of the target cascading formulation to the design of product families.Structural and Multidisciplinary Optimization, 24(4), 293−301.
Krishnan, V., & Ulrich, K. T. (2001). Product development decisions: A review of theliterature. Management Science, 47(1), 1−21.
Krishnan, V., & Zhu, W. (2006). Designing a family of development-intensive products.Management Science, 52(6), 813−825.
Kumar, D., Chen, W., & Simpson, T. W. (2009). A market-driven approach to productfamily design. International Journal of Production Research, 47(1), 71−104.
Lenk, P. J., & DeSarbo, W. S. (2000). Bayesian inference for finite mixtures of generalizedlinear models with random effects. Psychometrika, 65(1), 93−119.
Li, H., & Azarm, S. (2000). Product design selection under uncertainty and withcompetitive advantage. Journal of Mechanical Design, 122(4), 411−418.
Li, H., & Azarm, S. (2002). An approach for product line design selection underuncertainty and competition. Journal of Mechanical Design, 124(3), 385−392.
Li, Y., Z. Lu and J.J. Michalek (2008). Diagonal quadratic approximation forparallelization of analytical target cascading. ASME Journal of Mechanical Design,130(5), 051402:1–11.

12 J.J. Michalek et al. / Intern. J. of Research in Marketing 28 (2011) 1–12
Lilien, G., Kotler, P., & Moorthy, S. (1992). Marketing models. : Prentice-Hall.Luo, L. (2011). Product Line Design for Consumer Durables: An Integrated Marketing
and Engineering Approach. Journal of Marketing Research, 48(1), 128–139.Luo, L., Kannan, P. K., Besharati, B., & Azarm, S. (2005). Design of robust new products
under variability: Marketing meets design. Journal of Product Innovation Manage-ment, 22, 177−192.
Martí, R. (2003). Multistart methods. In F. Glover, & G. Kochenberger (Eds.), Handbookon metaheuristics (pp. 355−368). Kluwer.
McBride, R. D., & Zufryden, F. S. (1988). An integer programming approach to theoptimal product line selection problem. Marketing Science, 7(2), 126−140.
Michalek, J. J., Feinberg, F. M., & Papalambros, P. Y. (2005). Linking marketing andengineering product design decisions via analytical target cascading. Journal ofProduct Innovation Management, 22(1), 42−62.
Otter, T., Tuchler, R., & Fruhtwirth-Schnatter, S. (2004). Capturing consumerheterogeneity in metric conjoint analysis using Bayesian mixture models.International Journal of Research in Marketing, 21, 285−297.
Papalambros, P. Y., & Wilde, D. J. (2000). Principles of optimal design: Modeling andcomputation (2nd ed). Cambridge; New York: Cambridge University Press.
Ravindran, A., Ragsdell, K. M., & Reklaitis, G. V. (2006). Engineering optimization:Methods and applications (Second Ed.). Wiley.
Rossi, P. E., Allenby, G. M., & McCulloch, R. E. (2005). Bayesian statistics and marketing.Hoboken, NJ: Wiley.
Shiau, C. -S., & Michalek, J. J. (2009a). Should designers worry about market systems?ASME Journal of Mechanical Design, 131, 1−9 January.
Shiau, C. -S., & Michalek, J. J. (2009b). Optimal product design under price competition.ASME Journal of Mechanical Design, 131, 1−10 July.
Simpson, T.W. (2004). Product platform design and customization: Status and promise.Ai Edam-Artificial Intelligence for Engineering Design Analysis and Manufacturing, 18(1), 3−20.
Simpson, T. W., Siddique, Z., & Jiao, J. (Eds.). (2005). Product platform and product familydesign: Methods and applications. New York: Kluwer Academic Publishers.
Spiegelhalter, D. J., Best, N. G., Carlin, B. R., & van der Linde, A. (2002). Bayesianmeasures of model complexity and fit. Journal of the Royal Statistical Society Series B-Statistical Methodology, 64, 583−616.
Steiner, W. J., & Hruschka, H. (2002). A probabilistic one-step approach to the optimalproduct line design problem using conjoint and cost data. Review of MarketingScience, 1(4).
Steiner, W., & Hruschka, H. (2003). Genetic algorithms for product design: Howwell dothey really work? International Journal of Market Research, 45(2), 229−240.
Train, K. E. (2003). Discrete choice methods with simulation. Cambridge University Press.Tsafarakis, S., Marinakis, Y., & Matsatsinis, N. (2010). Particle swarm optimization for
optimal product line design. International Journal of Research in Marketing, 27, 4.Urban, G. L., & Hauser, J. R. (1993). Design and marketing of new products. Englewood
Cliffs, NJ: Prentice-Hall.Wang, X., Camm, J., & Curry, D. J. (2009). A branch-and-price approach to the share-of-
choice product line design problem. Management Science, 55(10), 1718−1728.Wassenaar, H. J., & Chen, W. (2003). An approach to decision-based design with discrete
choice analysis for demand modeling. ASME J. Mech. Des., 125(3), 490−497.