internal capital markets and dividend policy...
TRANSCRIPT

1
Internal Capital Markets and Dividend Policy
Evidence from Indian Corporates
E. Goldman* and P.V. Viswanath†
November 2015
Abstract
The Pecking Order Hypothesis states that firms prefer internal financing to external financing. If
so, firms with larger sources of internal financing (internal capital markets, ICM) should be able to match
more of their investment needs with internally available funds; consequently they would pay lower dividends.
We test this hypothesis by looking at the dividend policies of listed Indian corporates: firms affiliated with
business groups, according to the ICM hypothesis, would pay lower dividends on average. While previous
papers have found that group-affiliated firms actually pay higher dividends, we find that, consistent with the
ICM hypothesis, group-affiliated are less likely to pay dividends compared to unaffiliated firms, after
controlling for industry affiliation and other firm-specific variables. We also extend the ICM hypothesis to
take into account the cost of internal funds transfer by distinguishing between Indian firms and India-listed
foreign firms; we hypothesize and confirm that these foreign firms, both group-affiliated and non-group-
affiliated, are less likely to pay dividends than Indian firms. We consider and reject the possibility that this
is due to their greater investment opportunities, as measured by the export intensity; we suggest that this may
instead be due to related-party transactions (RPTs) such as transfer pricing arrangements between the foreign
firms and their affiliates abroad. Our paper thus makes contributions in two different areas: one, the internal
capital markets hypothesis; and two, differences between foreign firms and domestic firms, particularly in
developing countries.
* Lubin School of Business, Pace University, 1 Pace Plaza, New York, NY 10038, Tel: (212) 618-6516, Fax: (212) 618-6410, email:
† Lubin School of Business, Pace University, 1 Pace Plaza, New York, NY 10038
Tel: (212) 618-6516, Fax: (212) 618-6410, email: [email protected], web: http://webpage.pace.edu/pviswanath
2
I. Introduction
Ever since Modigliani and Miller suggested that dividends might not matter, there has been intense
interest in why firms pay dividends. Their argument was that, transactions costs aside, as long as a firm is
able to obtain funds from the capital market on the same terms as its retained earnings, it could always pay
dividends by raising the funds in the capital market. As far as investors were concerned, they should be
indifferent, tax considerations aside, between receiving cash dividends and generating home-made
dividends by selling off shares. In practice, though, firms prefer internally generated funds to external
financing – an empirical regularity described by Myers (1984) as the Pecking Order Hypothesis. This
suggests that internally generated funds are cheaper: the question is why? Myers and Majluf (1985)
introduced the possibility that information asymmetry between the firm and capital markets might cause
external funds to be more expensive than internal funds. One implication of their theory is that firms with
larger internal capital markets would have an advantage because they would be able to obtain funds more
easily through internal generation of funds, rather than go to the external capital markets (ICM hypothesis).
According to this hypothesis, large firms should pay lower dividends since, having access to a larger pool
of new projects, they can use the funds more efficiently internally compared to small firms who would be
more inclined to pay out excess funds. Large firms, however, are generally more stable as well, and we
know from the Cashflow Uncertainty hypothesis that stable firms are able to pay higher dividends. Firm
size may also be related to the availability of investment opportunities per dollar of assets, which is also a
key determinant of dividend policy.1 Hence, if the size of firms’ internal capital markets is measured by
the size of the firms, we then need to control for investment opportunities and cashflow uncertainty, as well.
Disentangling the effects of internal capital markets from those of investment opportunities and cashflow
uncertainty is not easy. The existence of business groups, which consist of loosely related firms linked
together by a common, controlling set of shareholders, provides an opportunity to separate these effects.
In many Asian countries, it is not uncommon for firms to have a common and often controlling set
of equity investors. These are well known as keiretsu in Japan and chaebol in Korea; their prevalence in
China and India, too, has been well documented (He et al., 2013). Indeed, in both Korea and Japan, dividend
payouts are quite low as predicted by the ICM hypothesis, compared to firms in other countries of similar
economic development. However, it is not clear whether the size of the internal capital market is an
important consideration in the determination of group firms’ dividend policies in these countries. In Japan,
it is usually the case that a banking corporation, called a main bank, is an integral part of the keiretsu group;
as a result, dividend policies are not as important in terms of obtaining access to capital. In Korea, the state
itself promoted chaebols as a development strategy and used state-owned banks to direct funds to chaebol
1 Chahine, Filatotchev and Piesse (2007) find that growth opportunities are negatively related to firm size; according to this, large firms would
pay higher dividends. The weaker propensity of large firms with large internal capital markets to pay dividends could end up being offset by this
opposite tendency, thus obscuring a relationship consistent with the ICM hypothesis. Hence, it is important to control for investment/growth
opportunities.
3
companies. In China, the stock market has not been an efficient mechanism to raise funds, given that SOEs
(state-owned enterprises) form a large proportion of the listed companies; as a result, access to external
capital is limited for most non-state enterprises. India, however, is unusual in having both group companies
as well as a reasonably well-functioning equity capital market. As such, it provides us with a good
environment to test the internal capital markets hypothesis in the context of dividend policy.
Gopalan, Nanda and Seru (2014) provide some evidence that reallocation of capital across group
firms influences dividend policies of firms affiliated with those groups; using a cross-country sample, they
show that dividends by group-affiliated firms are systematically related to concomitant equity-financed
investments by other group affiliates; however the capital transfer in this case is not achieved through
internal operations. Gopalan et al. (2007) show that group-affiliated firms provide loans to other firms in
the same group that are experiencing financial distress; while this study does examine internal channels for
fund transfers, they do not look at the effect of internal markets on dividend policy. Manos et al. (2012) do
look at differences in dividend policies of group-affiliated firms versus stand-alone firms. However, they
actually find that group-affiliated firms pay higher dividends than stand-alone firms, probably because of
their failure to condition on other relevant firm-related variables.2 Ours is the first study that provides
convincing evidence of the effect of internal capital markets on dividend policy that is supportive of the
ICM theory. We find that, while group-affiliated firms pay unconditionally higher dividends than stand-
alone firms, group firms are actually less likely to pay dividends, once we take into consideration firm
characteristics such as industry, as well as other variables proxying for investment opportunities, internal
and external resource availability and cashflow uncertainty. Conditioning on the decision to pay dividends,
though, group-affiliation at the margin does not have an appreciable impact on the level of dividend
payments. Still, our results do provide support for the flow of financial resources between firms in the same
group, as evidenced in dividend policy.
While these results show significant internal movement of financial resources within business
groups, Gopalan et al. (2014) – as noted above – provide convincing evidence that groups also move funds
across related firms through external mechanisms: group firms in their sample paid dividends to enable
insiders to make equity investments in other group-affiliated firms. What these somewhat contradictory
results demonstrate, is that the costs and benefits of direct internal transfers between affiliated firms need
to be taken into account. If internal transfers are costlier, affiliated firms will use external transfers and
may not show lower dividend payments. However, to the extent that affiliated firms can obtain greater
advantages through internal funds transfers – for example, in the form of reduced tax payments – and can
execute them cheaply, such firms would pay less dividends than stand-alone firms. In this paper, we find
2 While Manos et al. (2012) do include some variables such as standard deviation of residuals from a market model and non-institutional
shareholder holding to measure information asymmetry, they do not use industry affiliation or capital intensity or any measures of expected firm
growth rate. This may explain the discrepancy between their results (they conclude from their regressions that group-affiliated firms pay lower
dividends at the margin) and ours.

4
evidence that such advantages may indeed be dispositive for a subset of firms, viz. foreign firms, that is,
firms where foreign promoters have management control.3
Previous studies have explicitly excluded such foreign firms from their sample, presumably on the
basis that they are different from domestic firms. However, while we do show that they are different, these
are also firms listed on Indian stock exchanges, and there is no reason to believe that they are not affected,
by and large, by the same factors that affect listed domestic firms; hence it is worthwhile and arguably
necessary to include them in the analysis. Since foreign firms are, almost by definition, associated with
other entities abroad – often in the same industry – they are likely to have ample opportunities to
strategically move funds from India to their affiliates abroad. We hypothesize, therefore, that such firms –
whether allied with a group or not – are less likely to pay dividends at the margin, controlling for firm-
specific variables. And, in fact, we do find that foreign firms have a lower propensity to pay dividends than
Indian firms. Firms have a multitude of ways to transfer funds to other related entities, some of them
affecting operating earnings (such as transfer pricing) and some of them non-operational (such as providing
concessional loans). If transfer pricing is the chosen mechanism, then we have an additional test of the
ICM hypothesis: foreign firms engaging in such activities to benefit their foreign affiliates should have
lower profitability relative to Indian group firms, as has been shown for keiretsu firms (Lincoln et al. 1996).
We cannot, however, conclusively show that this is indeed the case. On the other hand, to the extent that
resource transfers are done in the form of loans or other activities that are not related to operations, profits
may indeed not be affected. We do provide additional circumstantial evidence that the lower propensity of
foreign firms to pay dividends may indeed be due to aggressive and strategic transfer pricing practices by
these foreign firms designed to reduce taxes paid on Indian profits.
The interesting aspect of this result is that it is true not just in a comparison of foreign group-
affiliated firms versus foreign non-group firms, but rather in comparing all foreign firms (group or non-
group) to all Indian firms (group or non-group). The reason, we believe, is that the concept of groups as
currently defined may not be appropriate for all purposes. In particular, researchers studying internal capital
markets may need to use a broader definition of group. Khanna and Palepu (2000) define Indian business
groups as “collections of publicly traded firms in a wide variety of industries, with a significant amount of
common ownership and control, usually by a family.” Bertrand et al. (2002) implicitly define a business
group as a single shareholder (or a family) completely controlling several independently traded firms and
yet having significant cash flow rights in only a few of them.” Gopalan et al. (2014) define business groups
3 According to Prowess, foreign non-group companies are defined subjectively as follows: “Companies classified as 'Private (Foreign)' are the
companies that are owned by foreigners including foreign government and these companies do not belong to any foreign business group or any NRI
business house. Further, there is no strict rule that can be applied to associating a company with a business group. It is neither entirely defined by the
concept of promoters stake, nor is it a case of a certain percent of equity ownership with a particular individual or family, nor is it management control.
Each of these are important but, none is a fool-proof way of defining ownership control and management. CMIE uses the available data, its intelligence
and judgement in associating a company to a business group or any ownership heading in the ownership structure. The classification is thus sometimes
tentative.”

5
as “firms in different industries, often controlled by a family and their associates.” These definitions, while
not exactly the same, coincide pretty much with the common understanding of what a group is, as
exemplified by the Tata group or the Ambani group or the Gillette group of companies. However, a firm
like Bata India Ltd., which Prowess considers to be a foreign company is not classified as a group company
presumably because the Bata Company, which is the majority shareholder of Bata India, is in a single line
of business, describing itself as “a leading manufacturer and retailer of quality footwear” and thus violates
one of the conditions of the Gopalan et al. (2014) definition. Nevertheless, the worldwide Bata Company
and Bata India Ltd. are part of one internal capital market, since it is possible for the Bata Company to
extract funds from Bata India Ltd. through transfer pricing practices or other related party transactions
(RPTs) just as business group firms are able to transfer funds to other firms affiliated with the same business
group. Hence studies of internal capital markets should consider using a definition of the term “group” that
is broader than the traditional definition of a business group. However, in order not to confuse existing
terminology, in this paper we will continue to apply the term “group” only to firms defined by Prowess as
“group” firms.
In any case, if indeed foreign firms move money to out-of-country parent firms or other affiliates
– for example if they move them abroad through aggressive transfer-pricing practices – then they would,
indeed, tend to pay lower dividends. The point is that any kind of symbiotic relationship between two firms
may lead to internal funds transfers between those firms, whether or not they are part of a group, as currently
defined. And while many studies of the internal capital markets hypothesis have looked at these transfers
as a way of funding investment projects in affiliated firms, they may be undertaken for broader purposes,
as well. For example, Gopalan, Nanda and Seru (2007) also provide evidence that Indian group-affiliated
firms provide loans to other financially troubled firms from the same group.4 Fisman and Wang (2010)
also note such related party transactions (RPTs) in the context of Chinese firms. They suggest two kinds
of RPTs: one, a coinsurance relationship between one firm and another firm – the first firm may help the
second firm out by paying a higher premium for services or goods provided; two, the first firm may provide
loans or loan-guarantees to the second firm. Bertrand, Mehta and Mullainathan (2002) document transfers
of resources in Indian groups from firms near the bottom of the pyramid to firms at the top of the pyramid.5
Our results regarding the lower propensity for foreign firms to make dividend payouts is thus consistent
with the literature on RPTs.
There may, however, be an alternative explanation for the lower propensity of foreign firms to pay
dividends. Foreign firms may pay lower dividends because they use their international connections to
cultivate export markets and hence need the internally generated cash to fund investment opportunities.
The lower dividend payouts of these firms, according to this explanation, reflects higher growth
4 Gopalan, Nanda and Seru (2007) however do not report dividend policies of these firms. 5 See other examples of the broader phenomenon of RPTs in Srinivasan (2013).

6
opportunities. We test this hypothesis by using a firm’s export intensity as a measure of these additional
investment opportunities. However, contrary to the implications of the growth opportunities explanation,
we find that exporting firms tend to pay higher dividends than non-exporting firms, after controlling for
other influences. Exporting firms may indeed have greater growth opportunities, as indicated by larger
market/book ratios and higher R&D investments; however, this does not seem to be an explanation for the
lower dividend payout ratios of foreign group firms. In fact, export intensity and the foreign group effect
seem to operate independently on a firm’s dividend policy. One possible reason for the export intensity
effect is that exporting firms may have lower cashflow volatility, possibly because their diversity of sales
markets allows them to have greater diversification. Our paper, thus, has added a hitherto undiscovered
determinant of corporate dividends viz. a firm’s export intensity. This may be an important factor to
consider in future studies of dividend policies of firms operating in open economies.
Since our sample includes multinational firms, in contrast to other papers studying the ICM
hypothesis, we are also able to contribute to the ongoing literature discussing differences between foreign
firms and domestic firms, particularly in developing countries. Internalization theory going back to Coase
(1937) suggests a tension between the incentives for opportunistic behavior when two interdependent firms
interact versus the higher coordination costs of running large organizations; according to this theory,
multinational firms arise because of the higher transactions costs of trans-border activities (Ietto-Gillies,
2005). A second resource-based view (RBV) of the firm argues that foreign firms have intangible assets in
the form of special technical or other knowledge that cannot be efficiently sold to third parties (Peng, 2001);
alternatively, they may have advantages over domestic firms because of better access to international capital
markets (Desai et al., 2004). According to the second theory, multinational firms should have different
financial policies compared to domestic firms. In particular, multinational firms should have higher payout
ratios, according to the RBV hypothesis, since their greater access to foreign capital markets makes them
less dependent on retained earnings, while the internalization theory would predict no difference. Existing
literature has looked at the capital structure of multinational firms (Desai et al., 2004); we contribute to this
literature by showing that there are indeed differences between multinational firms and domestic firms in
the context of dividend policy, as well. To the extent that foreign firms’ access to international capital
markets can be measured by their foreign currency borrowings, our results do not provide support to the
RBV hypothesis.
In sum, we make several contributions. One, our paper extends the literature on dividend
determination by providing tests of the internal capital markets hypothesis in the context of Indian
corporates and shows, for the first time, that group-affiliated firms are less likely to pay dividends. Second,
we argue that the relative costs and benefits of internal resource transfer and transfer using external capital
markets need to be incorporated into tests of the ICM hypothesis. We hypothesize and confirm that foreign
firms behave differently from Indian firms in that they have a lower propensity to pay dividends; this reflects
the greater facility of foreign firms to engage in RPTs, possibly through creative transfer pricing. In so
7
doing, we also add to the literature on RPTs. Parenthetically, our arguments also have implications for the
proper definition of groups in the study of internal capital markets. Finally, our paper contributes to the
ongoing literature investigating differences between foreign firms and domestic firms, particularly in
developing countries; in particular, we are innovative in suggesting and finding a role for a hitherto
undiscovered determinant of dividend policies, viz. export intensity.
The organization of paper is as follows. In the next section, we discuss the internal capital markets
hypothesis and its implications for dividend policy, as well as other theories of dividend determination. We
also describe the data obtained from Prowess database and variables used as proxies for each hypothesis.
Section III presents our Tobit and Probit regressions to test the ICM hypothesis. Section IV introduces the
role of resource transfer costs in the implications of the ICM for dividend policy. This allows us to
hypothesize that foreign firms should pay lower dividends than domestic firms, because of their higher
benefits from and lower costs of effecting RPTs. We present tests supporting our hypothesis. Section V
suggests two alternate explanations of our results regarding foreign firms and presents grounds to reject
those suggestions. Section VI concludes.
II. Hypotheses and Data
In this study we measure dividend payout in two ways: the dividend-to-earnings ratio (cash
dividends paid divided by earnings defined as after-tax profits, DIV/E) and the dividend-to-sales ratio
(DIV/S).6 We now introduce additional variables suggested by competing theories of dividend payout ratio.
Table 1 summarizes definitions and expected signs of the explanatory variables in the payout regressions
based on the hypotheses discussed below.
Insert Table 1 around here
A: Groups and Internal Capital Markets
In many countries with underdeveloped capital markets, the lack of effective safeguards means
that investors look for non-market channels for investment. Historically, this accounts for the high
frequency of family firms in developing countries. These firms depend on family ties to ensure monitoring
and contract enforcement. However, as economies develop, optimal firm sizes increase and the need for
capital exceeds the ability of single firms to satisfy capital requirements. This leads to the development of
business groups (Khanna and Palepu, 1999). Khanna and Yafeh (2005) argue that ICMs in business groups
allow for efficient risk sharing.
6 We refer to these two ratios jointly as payout ratios, for convenience, even though it is the dividend-to-earnings ratio alone that is usually
referred to as a payout ratio. The DIV/S ratio has more firms included in the sample since it can include firms with zero and negative earnings.
8
As discussed in the Introduction, it has been conjectured that business groups in India function like
chaebols or keiretsus and provide access to capital to their group members.7 Khanna and Palepu (2000)
and others note that groups can transfer funds across firms to economize on the cost of raising external
capital.8 Gopalan et al. (2007) study, in particular, the tendency of firms to provide loans to other group-
affiliated firms that are in business difficulties. The ability of firms in a group to share financial resources
with each other means that internal capital can be used efficiently and there is a reduced need to return
capital to shareholders occasioned by lack of profitable internally generated investment opportunities.
Consequently, firms belonging to groups would be expected to have lower payout ratios. This is the Internal
Capital Markets Hypothesis.
Using data on group membership, we created four different categories, based on ownership-type:
private Indian group companies, private foreign group companies, private Indian non-group (stand-alone)
companies and private foreign non-group companies.9 Table 2 provides data on the composition of our
data: by year, by ownership category and by industry affiliation. Panel A shows that our data are fairly
evenly distributed over the sample period. As can be seen from Panel B, about two-fifths of our firms are
group companies, while the rest are non-group companies. The ratio of group to non-group to companies
is about 0.635 for Indian companies, while it is lower for foreign companies at 0.445. Of course, as argued
in the introduction, foreign companies, even those not belong to a group often have ties other companies
operating outside India; taking this into account, the ratio of companies affiliated with other companies to
truly stand-alone companies may not be substantially different for the subset of foreign companies. About
7.24% of our sample consists of foreign firms listed in India, which is potentially large enough to allow us
to make comparative inferences between foreign and domestic firms. In addition to our group dummy
variables, we use two measures of internal capital market size: i) group assets (Group_log(TA)), which is
computed as the sum of total assets across all members in a given group, and ii) group size (group_N),
defined as the number of distinct companies belonging to a given group. For non-group firms, the group
assets variable would simply be the total assets of that firm and the group size variable would be unity. To
the extent that these variables do indeed measure the size of the internal capital market, the ICM hypothesis
predicts that they will affect dividend policy – the greater the size of the group that a firm belongs to, the
lower should its dividend payout ratios be. However, these two variables, group assets in particular, might
very well represent the stability of the group and hence that of the firm and could, therefore, be positively
correlated with dividend payouts. Group size (group_N), however, is more likely to be a proxy for the size
of the internal capital market in a regression, especially if the group assets variable is also included.
7 See Khanna and Palepu (1999, 2000) and Hansoge and Marisetty (2011), for example.
8 Bertrand et al. (2002) point out that intragroup flows can be used to tunnel cash out of firms with low insider holding to firms with high
insider holding in order to steal resources. 9 Prowess also provides data on joint sector companies, firms owned by NRIs and government companies. We do not include these firms in
our sample, since their motivations are likely to be different from private sector for-profit companies. An argument could be made that firms owned by
NRIs and joint-sector firms are comparable to other private-sector firms; however, there were only about half a percent of our sample falling into this
category. Hence we dropped these firms from the final sample to improve the accuracy of our interpretations.

9
Insert Table 2 around here
Table 3 presents the first test of the Internal Capital Markets Hypothesis. We see from the Lawley-
Hotelling trace statistic in the last row, that firms in the four different categories do not all have the same
dividend policy. The null hypothesis of no difference can be strongly rejected. Above that, we present tests
of the hypothesis that group firms have the same dividend payout ratios as non-group firms: this hypothesis,
too, can be strongly rejected. Taken at face value, what this actually says is that group firms have higher
payouts than non-group firms. In fact, we see from Figure 1 that, not only do group firms pay higher
dividends than non-group firms, but that this is true – averaged over firms – year-by-year, for every year in
the sample. This is consistent with the findings of Manos et al. (2012), but constitutes a rejection of the
ICM hypothesis, since as explained, internal capital markets should allow for more efficient use of retained
earnings, leading to lower dividend payouts, not higher dividend payouts. This conclusion, however,
assumes that group and non-group firms are the same in other respects. In particular, we are really assuming
that distinctions between group and non-group firm categories – other than the size of their internal capital
markets – have nothing to do with payout ratios. In the following sub-sections, we provide a brief survey
of the literature to see what other variables have been hypothesized to affect dividend policy, so that we can
take them into account in our further tests of the ICM hypothesis.
Insert Tables 3 and 4 around here
Insert Figure 1 around here
B: Investment Opportunities and Dividends
Investment Opportunities and Growth
It has been hypothesized that firms with investment opportunities would have lower payout ratios
so as to conserve retained earnings, given that information asymmetry implies that external funds are more
expensive than internal funds; this follows from Myers’ (1984) Pecking Order Hypothesis. Empirically,
Woolridge and Ghosh (1985) found that the market penalized firms that cut dividends; however, when the
firms simultaneously announced investment opportunities, the negative market reaction was much lower,
and it was more than overturned in the next quarter. Soter, Brigham and Evanson (1996) reported similar
results with the Florida Power and Light’s 1994 dividend cut, which was designed to improve the
company’s long-term financial flexibility and prospects for growth, and which resulted in an overall positive
market response.10 Abbott (2001) looked at firms whose investment opportunity sets changed and tried to
correlate this with their financing policies – he found that firms with improved investment opportunities
10 One possible explanation for the immediate negative market reaction is that the market did not have enough information to confirm the
firms’ announcement of better investment opportunities.
10
decreased their dividend payouts. The evidence, then, supports the notion that firms with higher investment
and growth opportunities would have lower payout ratios.
We use several measures of growth. The ratio of intangibles to total assets (Intangibles) is usually
positively correlated with growth opportunities, as is the Market-to-Book ratio (MBR); high market-to-
book firms, having high investment and growth opportunities should pay low dividends. The ratio of fixed
assets to total assets (capital intensity, CapInt) is usually negatively empirically correlated with growth
opportunities, since firms with high investment in tangible, fixed assets are often older manufacturing firms
that are more stable. However, other research has found a positive, though not causal, relationship between
capital intensity and growth opportunities. For example, David et al. (2006) found that foreign ownership
in Japanese corporations leads to higher capital intensity and higher expenditure on R&D in the presence
of growth opportunities. Arguably, the issue here is the lack of investor protection and the fear of
opportunistic exploitation, which can be overcome by the availability of growth opportunities: although the
rule of law exists in Japan, there is enough evidence to indicate that Japanese managers are unresponsive to
foreign shareholders. If so, it would be appropriate to extrapolate from foreign owned firms to other firms
in our Indian context; hence, capital intensity could be empirically positively correlated with growth
opportunities. We also use R&D as a measure of investment opportunity, since its purpose is to generate
investment ideas. These variables are also associated with information asymmetry. Finally, we use export
intensity (exports/sales) as a measure of investment opportunities for foreign firms; this will be discussed
to a greater extent in section IV.
Industry Affiliation and Growth
It is well known that earnings growth rates vary systematically across industries. Hence it makes
sense that dividend payout ratios would vary across industries as well.11 Industry membership for the
companies was obtained from the PROWESS database, using the NIC classification variable presented in
Table 2 panel C. Table 2 shows that about 57% of our sample consists of manufacturing firms; the rest are
distributed across the different industry categories, with Business Service firms constituting the second
largest industry. Since the agriculture industry includes very few observations, it is commingled with the
miscellaneous category in our regressions and is left out from regressions to prevent multi-collinearity;
hence all industry effects are relative to the agriculture/miscellaneous category. Going further, Table 4
shows the mean dividend payouts across industry groups. The Lawley-Hotelling statistic shows that
payouts vary significantly across industries, with electricity firms having the highest average payout ratio
(Dividend/Earnings) and Business Service and Construction firms having the lowest (leaving aside the
miscellaneous category). It is clear, therefore, that we cannot take the results of Table 3 at face value as a
valid test of the Internal Capital Markets hypothesis; we need to adjust for industry affiliation in our tests
11 Industry affiliation often turns out to be a significant explanatory variable in studies of financial policies, for example in capital structure
models (Frank and Goyal, 2009).
11
to ensure that dividend policy variation between group and non-group firms is not, in fact, proxying for
inter-industry variation.
C: Access to Funding and Dividends
The higher the level of internal funds available, the higher the payout ratio the firm can tolerate
and still fund internally generated projects. Hence we would expect a positive relationship between payout
ratios and measures of cashflow.12 We used the ratio of cashflow to assets (CFA) as a flow measure of
internal funds availability.13 Financial leverage (Ltdebt) may also indicate the availability of free cashflow
to be paid out as dividends; the higher the financial leverage, the lower the free cashflow. On the other
hand, leverage brings along with it, the requirement to pay interest and could arguably reduce free cashflow.
Finally, we use the ratio of cash and bank balances to total assets (CASH) as a stock measure of internal
funds availability.
In addition, as mentioned above, access to external funds might be an important determinant of
dividend policy since, as long as there are positive NPV investment projects available for the firm, the
payment of dividends increases dollar-for-dollar the need to raise funds externally. Access to domestic
capital markets may be considered similar for all firms; however, not all firms have equal access to foreign
capital markets. We measure access to foreign capital markets by looking at foreign currency borrowings,
normalized by total borrowings.14 The greater the access to external funds, the higher dividend payouts can
be; on the other hand, the greater a firm’s borrowing, the lower the free cashflow (after interest payments)
available to be paid out as dividends. Hence the effect of this variable on dividend payouts could be either
positive or negative.
D: Cashflow Uncertainty and Dividends
Dividend payouts are also expected to be affected by cashflow uncertainty: firms with higher
cashflow uncertainty have a greater chance of not having sufficient resources to meet their dividend
commitment. Bradley, Capozza and Seguin (1998) show that this argument holds in the case of REIT
companies. More recently, Chay and Suh (2009) looked at a global sample of firms and established a
similar result for developed and developing countries including India, using realized stock return volatility.
We measure cashflow uncertainty directly as the volatility of Operating Cashflow before Working Capital
normalized by Total Assets, computed using observations for the most recent four years (3 lags and current
12 See Myers (1984) for a static version and Viswanath (1993) for a dynamic version of the Pecking Order Hypothesis that suggests the
importance of this category of variable. Byoun (2008) presents a recent test of this hypothesis.
13 The CFA variable that we use is similar to the operating profitability variable used by Chay and Suh (2009). 14 We also have data on GDR/ADR issues; however, it turns out that most firms did not take advantage of this method of raising foreign
equity capital. Hence we do not include this variable in our analysis.

12
year) (VOLCF).15 In addition, larger firms and older firms tend to be more stable; hence we also use firm
size (measured as log(TA), the log of total assets) and firm age (Age) as additional measures of cashflow
stability.16
Insert Tables 5, 6 and 7 about here
E: Data and Summary Statistics
Data was obtained from the Prowess database marketed by CMIE (Centre for the Monitoring of
the Indian Economy). While CMIE data is available from the 1990s, there were a lot of policy changes in
the earlier years and firms were still responding to the new economic environment in these early years;17
hence we use data from a more recent time period. We chose firms on the A and B lists of the Bombay
Stock Exchange with available data from the years 2000 to 2009.18 The CMIE database, unfortunately, has
problems with data inconsistency. We dropped firms with dividends greater than sales; firms with negative
dividends; firms with negative earnings and positive dividends; firms with negative book value of equity
and zero market value of equity; firms with exports greater than sales and negative exports; firms with
negative long term debt; and finally firms with cash greater than total assets. In order to exclude outliers,
we also winsorized the dividend-to-earnings, long term debt/market-value-of-assets, intangibles/assets,
foreign exchange borrowing/assets, firm age, R&D and capital intensity at the top 1%; and log(assets) and
cash flow/assets at the top and bottom 1%.19 As a result our sample consists of 15574 observations (firm-
years).20
Table 5 provides summary statistics for our explanatory variables. Table 6 reports the correlations
between dividend payout and key variables over the period 2000-2009. The second column reports the
correlations of DIV/E, the dividend-to-earnings ratio, with key variables. The third column reports the
correlations of DIV/S, the dividend-to-sales ratio, with key variables. All correlations are significant at the
15 This is similar to the ROAVOL measure used by Chay and Suh (2009), though VOLCF is probably better because it is a cashflow
construct, rather than an accounting construct. Chay and Suh (2009) use two other variables that we do not have, viz. the retained earnings-to-total
equity ratio (RE/TE) and insider ownership; however, neither of these variables is significant in their India regression. We do use data on group
affiliation that arguably captures the effect of insider ownership in India. The RE/TE variable is a financial life-cycle theory; industry affiliation and
firm age, which we do use, may be considered measures of financial life-cycle.
16 We considered including the firm’s asset beta as an explanatory variable, on the assumption that beta and return volatility would be
positively correlated. However, this variable was not significant, and so we do not report the associated regression coefficients. Part of the problem
was that we did not have enough data to compute the asset beta directly using asset returns. Instead, we took the measure of equity beta provided by
Prowess and adjusted for the weight of equity in the capital structure of the firm by multiplying the equity beta by the ratio of the market value of
equity to total assets, implicitly assuming a debt beta of zero. To complicate the issue, Prowess only provides the most recent estimate of a firm’s
equity beta.
17 There is some evidence even in the earlier years that exporting firms are already different from other firms (see Ganesh-Kumar, Sen and
Vaidya, 2003).
18 One reason for not using data beyond this date is that the worldwide financial crisis that erupted in 2008 has probably affected dividend
patterns in the post-crisis era.
19 We follow Chay and Suh (2009) in this.
20 When we constructed the volatility of cash flows variable from 3 lags and current year cash flows, the sample is further reduced to 7 years
of data (2003-2009) with 9662 observations. The sample size for our Tobit and probit models is smaller due to missing values.

13
5% level, except for that between DIV/S and VOLCF. All variables with the exception of R&D, Intangibles
and MBR, have the expected correlation with dividend payout variables.21
Panel A of Table 7 provides
average values of our explanatory variables for the group and non-group sub-samples. The first two rows
emphasize the fact that dividend payouts are higher for group firms, in sharp contra-distinction to the ICM
hypothesis, as already discussed above in section II A. The other rows show the differences between the
two sub-samples. Group firms are larger, older, more leveraged, have higher capital intensity and R&D
expenditure and market-to-book ratios. And while they have higher cashflows, they have lower cash on
hand. This shows that group firms are different from non-group firms. Hence the seemingly higher payout
ratios for group firms has to be re-examined after controlling for these explanatory variables.22
Panel B of Table 7 shows the differences between Indian and foreign firms. Foreign firms are
larger, older, have higher payout ratios, higher R&D, higher market-to-book ratios, higher cash-in-hand as
well as cashflows; but lower capital intensity and lower cash flow volatility. They have higher exports and
higher foreign currency borrowings as might be expected but lower long-term debt. They have more in
group assets on, but fewer group members.
III. Estimation Results
We now go on to investigate the relationship between dividend policy, our measures of group
affiliation and our other control variables. We note, at the outset, that the payout ratio cannot take values
less than zero and should properly be treated as a censored variable; hence we use a Tobit specification.
The model uses pooled data with industry, group and year dummy variables included in the Tobit
regressions. We follow Petersen (2009) and report t-statistics for the pooled results using standard errors
corrected for clustering at the firm level. We first regress, using the entire sample of observations, the
payout ratios DIV/E and DIV/S against the set of three ICM hypothesis variables – a single indicator dummy
variable for all group firms (Indian or foreign), group assets and group size – and other variables controlling
for the Investment Opportunities, Access to Funds and Cashflow Uncertainty hypotheses as discussed in
section II; the results are reported in columns 2 and 4 of Table 8. The results in columns 3 and 5 are for all
Foreign versus all Indian firms either belonging to a group or not. Before we look at the variables
representing the ICM hypothesis, we note that most of the independent variables included in the regression
to control for other theories of dividend payouts behave as expected. Age, Firm Size and Volatility of
Cashflows, controlling for the Cashflow Uncertainty hypothesis all have the expected signs. As far as the
Investment Opportunities Hypothesis is concerned, Intangibles are negatively related to the payout ratios
as expected and Capital Intensity has a negative coefficient, consistent with David et al. (2000), while the
MBR variable is insignificant. However, R&D has an unexpected positive coefficient; it is not clear why
21 Export Intensity (Exp) also has an unexpected positive relationship with payout ratios; this will be discussed later in section IV. 22 As we will see, in our regressions, all variables except for R&D behave as predicted in Table 2.

14
this is so, but it may be related to the greater tendency of established firms to engage in R&D activities
which may require a long time to produce returns (Shefer and Frenkel, 2005). Controlling for the Access
to Funds hypothesis, we have CASH and Cashflow-to-Assets both having the expected positive sign, while
Ltdebt has a significant negative coefficient indicating that it depletes free cashflow.
Coming to the variables tapped to represent the ICM hypothesis, Group Assets are positively
related to the payout ratio, indicating that it is more similar to Firm Size and is a measure of cashflow
stability rather than internal capital market size. Group_N is significantly negative, which is consistent with
the idea that it is a measure of internal capital market size. The coefficients for the group dummy variable
are not significantly different from zero in either of these regressions. While these results are interesting,
given the fact that our univariate tests show group firms actually paying higher dividends, they still do not
definitively support the ICM hypothesis. We then repeat the regressions, but this time using not one single
group dummy variable, but three different dummy variables – for Indian group firms (indian_group),
foreign group firms (foreign_group), and foreign non-group firms (foreign_nongroup) (dropping the Indian
non-group firm dummy variable to prevent multicollinearity). These regressions, too, are inconclusive, in
that the coefficients of the three dummy variables are not significant at the 10% level of significance; details
of these results are not reported, for the sake of brevity.
Insert Table 8 about here
Regressions using the entire sample, of course, force the coefficients for the independent control
variables to be the same for both foreign firms and Indian firms. There is, however, a substantial literature
noting that domestic firms are different from foreign firms, as mentioned in the Introduction. This suggests
that the inability to reject the null hypothesis of no difference between group and non-group firms may be
due to this additional restriction, which is not implied by the ICM theory. Hence we rerun our regressions
separately for Indian and foreign firms. Once again, both for the foreign and the Indian subsample, it is not
possible to reject the null hypothesis that payout policies for group and non-group firms are the same; these
results, too, are not reported.
Insert Table 9 about here
The Tobit regressions test the hypothesis that group firms pay lower dividends than non-group
firms, which is the primary hypothesis of the ICM theory. An additional implication of the ICM theory,
though, is that group firms are less likely to pay dividends at all, compared to non-group firms. To test this
hypothesis, we perform a probit analysis to model the probability of firms choosing to pay dividends; the
results are presented in Table 9. For better comparison with our Tobit results, we create a dummy variable
for our probit analysis that is based on our Tobit dependent variable: our probit dependent variable takes
the value 1 when Div/Sales is positive and zero otherwise. We find that, for our full sample (column 2),
group firms do not have a significantly greater propensity to pay dividends than non-group firms. However,
15
once we allow the different sub-groups to have different coefficients (column 10), we find that Indian group
firms do indeed have a significantly lower propensity to pay dividends compared to Indian non-group firms,
as suggested by the ICM theory.23
We also find that foreign non-group firms also have a significantly lower
propensity to pay dividends, compared to Indian non-group firms. Furthermore, when we run the regression
separately for foreign firms, we find that foreign group firms actually pay statistically significantly higher
dividends than foreign non-group firms (column 6). This is quite unexpected and not predicted by the ICM
hypothesis. This suggests that foreign group firms behave differently from foreign non-group firms. This
is confirmed in the results of the regression reported in column 4, where the dividend payout of foreign
firms is contrasted with that of Indian firms; foreign firms have a significantly lower propensity to pay
dividend payouts than Indian firms.24
At this point, we come to two conclusions: a) the ICM theory is substantiated to the extent that
Indian group firms are less likely to pay dividends than non-group firms, and b) that foreign firms are
significantly different from Indian firms. While there is some evidence to suggest that the ICM theory is
rejected for foreign firms, we need to look more carefully at the characteristics of foreign firms in order to
construct better tests of the ICM hypothesis for foreign firms. Once we expand the set of independent
variables that have special relevance for foreign firms, we may well find that foreign group firms no longer
have a significantly greater propensity to pay dividends. We consider two different hypotheses to explain
the weaker tendency of foreign group firms to pay dividends. The first hypothesis is that foreign groups
are better able to locate investment opportunities because of their international connections; it follows then
from the Investment Opportunities Hypothesis that they would pay lower dividends. The second hypothesis
is that local affiliates of foreign groups find it optimal to transfer funds to their foreign partners through
related party transactions (RPT); consequently they have lower local payouts in the form of dividends. The
next section considers the investment opportunities explanation, while the following section considers the
RPT explanation.
IV. Foreign Firms, Investment Opportunities and Exports
The Specific Advantage Theory of multinational firms (Dunning, 1973) argues that multinational
firms have specific advantages that are transferable within the firm, but cannot be transferred in the
marketplace. Such advantages may be derived through R&D and may connote technical or operational
superiority (Markusen, 1995). Another possibility, however, is that they have better access to information
that can profitably utilize resources available in the host country. This may be because they have better
23 The coefficients for group size, group assets and CapInt, which were significant in the Tobit regressions are no longer significant in these
probit regressions.
24 The Tobit regressions (Table 8, columns 3, 4) do not allow us to reject the hypothesis that Indian and foreign firms are similar in their
dividend payouts.
16
information and better ability to analyze investment situations (Caves, 1996). There is a fair amount of
support for this view in the empirical literature (Bellak, 2004). If so, foreign firms should be able to better
utilize internally generated funds; they would, consequently, pay lower dividends. We use export intensity,
measured as the ratio of exports to total sales, to measure a firm’s ability to exploit foreign investment
opportunities. According to this hypothesis, then, a regression of dividend payout on export intensity should
show a significant negative coefficient. If our previous finding that foreign firms have a lower propensity
to pay dividends is because of our having incorrectly measured their investment opportunities, inclusion of
the export intensity variable may now render the foreign dummy in our regressions insignificant. We also
include an additional variable, FOREX, the ratio of unsecured foreign currency borrowings to total
borrowings, which may be relevant for various reasons. This variable could function as a measure of firms’
greater availability of funds to pay dividends; on the other hand, since borrowings of any kind mean that
interest payments have to be made, it may indicate firms’ lesser ability to pay dividends. Finally, they may
also indicate greater growth prospects for firms, on the supposition that foreign investors are more confident
of a firm’s prospects if they are willing to lend it money; this would imply that such firms – and foreign
firms may well be over-represented in this category – would pay lower dividends.
A Tobit regression of dividend payout ratios on group dummy variables and other independent
variables, including export intensity and foreign borrowings, does not change our conclusions from the
previous section; the group dummy variables are insignificant and remain insignificant (results not
reported). However, when we look at the results of the probit analyses, we find some new results. First of
all, we find that even with a single group dummy representing all group firms in the entire sample, we can
now reject the hypothesis that group and non-group firms have equal propensities to pay dividends (Table
9, column 3); in fact, we accept the alternative hypothesis that group firms have a lower propensity to pay
dividends, providing confirmatory evidence in favor of the ICM theory. Second, when we include different
dummy variables (representing Indian group firms, foreign group firms and foreign non-group firms) as
independent variables, we find that Indian group firms continue to have a lower propensity to pay dividends
compared to Indian non-group firms (Table 9, columns 9 and 11). We also find that foreign group firms
continue to have a greater propensity to pay dividends compared to foreign non-group firms, as before,
although the magnitude of the Foreign_group dummy variable is slightly smaller (Table 9, column 7);
furthermore, foreign firms continue to have a lower propensity to pay dividends, as before, although the
regression coefficient is smaller (Table 9, column 5).
Before we proceed further, it is interesting to note that our two new variables, export intensity and
forex borrowings are both significant. Firms with higher forex borrowings have higher propensity to pay
dividends consistent with the idea that higher borrowings increase the ability of the firm to pay dividends;
this contrasts with the coefficient of domestic long-term debt (Ltdebt), which is negative, suggesting that
17
firms with higher debt may have lower disposable cashflow to pay dividends.25 If these two coefficients
are to be taken at face value, foreign borrowings and domestic borrowings may play different roles in terms
of a firm’s dividend policy. Our second variable, export intensity, also has a surprising coefficient. Firms
with higher export intensities tend to have higher propensities to pay dividends: this is contrary to our initial
conjecture that export intensity might measure a firm’s growth opportunities. One explanation for this
counter-intuitive result may be that export intensity is a measure of cashflow stability. To the extent that
the Indian economy is not fully in sync with the global economy, foreign sales may represent a
diversification of a firm’s revenues; this may explain the positive coefficient for export intensity in our
regressions.
Insert Table 10 about here
Coming back to our exploration of the ICM hypothesis, we perform year-by-year probit
regressions to examine the robustness of our pooled probit regression results in Table 9 to see whether the
overall results mask variation over years; these results are reported in Table 10. Each reported coefficient
is the average of the seven regression coefficients over the seven-year sample period and the numbers in
parentheses are t-statistics for the average regression coefficient. These t-statistics are calculated following
the Fama-MacBeth approach from the time series of fitted probit coefficients. The year-by-year regression
results shown in Table 10 are supportive of the pooled regressions. Following Petersen (2009), who reports
smaller biases when clustered standard errors are used in finance panel datasets compared to other
approaches, we rely on Table 9 results and use Table 10 results for sensitivity.
To summarize our results: in spite of including two new independent variables, export intensity
and forex borrowings, we continue to find that foreign group firms are more likely to pay dividends than
foreign non-group firms inconsistent with the ICM theory, although the evidence for Indian firms continues
to be consistent with the ICM theory. It is, of course, possible that there are other as-yet unknown aspects,
unrelated to internal capital markets, in which foreign and Indian firms differ, recognition of which would
allow us to accept the ICM theory for foreign firms. At this point, though, we explore another reason why
foreign firms might be expected to behave differently from Indian firms by taking a closer look at the ICM
theory; in the following section, we look at the relative costs and benefits from the use of internal capital
markets for foreign firms versus Indian firms.
25 We also consider the possibility that Ltdebt might be endogenous, since it is also a financial choice variable for the firm. We performed a
Wald test of exogeneity using just one instrument (Capital Intensity) due to limitations of number of variables available in the database. The results in
terms of the magnitude and the significance of variables (Ltdebt) in the equations were the same. We have, therefore, retained the results of Tobit and
Probit without performing an additional two-stage estimation.

18
V. Internal Capital Market Transfer Costs, Related Party Transactions & Foreign Firms
We provided support in the previous sections for the Internal Capital Markets hypothesis, at least
as applied to Indian firms. Specifically, we saw that, as implied by the ICM hypothesis, group-affiliated
firms have a lower propensity to pay dividends compared to non-group firms. The reason as we noted
earlier, was that groups have larger internal capital markets, since they consist of several firms with a
significant amount of common ownership and control. Given the element of common ownership, affiliate
firms with excess financial resources can supply them to other affiliate firms with financial resource deficits.
Since internally generated funds are less expensive than externally sourced funds, transmission of funds
through the shared internal capital market makes more sense for the resource-surplus firm than paying out
the excess funds in dividends. However, this argument depends crucially upon the costs and benefits of
internal transmission being lower than the costs and benefits of external transmission.
As Bertrand et al. (2002) point out, internal transfers may not be always be in the best interests of
non-insider shareholders. As a result of the danger of such potential wealth expropriation, these non-insider
shareholders may force insiders to bear dissipative auditing costs (Gopalan et al., 2014); Gopalan, Nanda
and Seru (2007) document the presence of such additional costs in the form of routine covenants in loan
contracts in India that require the auditing of the pricing of inter-corporate investments. In addition, since
there are tax implications to many of these internal transfers, they may be subject to additional regulations
such as transfer-pricing rules. Hence, while there are extra savings from such related party transactions,
they may also invite additional regulatory and legal scrutiny. Following the economic liberalization of the
securities markets in India since the early 1990s, the government has also improved oversight of corporate
financing behavior through the establishment of regulatory agencies like the Securities and Exchange Board
of India (SEBI) and new transfer pricing regulations introduced in 2001; hence costs of internal resources
transfers within groups cannot be ignored. This is consistent with the results of Gopalan et al. (2014) who
found that business groups often use the external dividend channel to fund investments in affiliate firms.
On the other hand, transferring funds through the explicit payment of dividends to common insider investors
involves the payment of taxes. Thus, while there are tax disadvantages to external transfers, there are
offsetting regulatory disadvantages to internal transfers. We argue below that, on the one hand, regulatory
costs of internal transfers for foreign firms are likely to be lower than that for Indian firms; on the other, the
tax advantages of internal transfers are also higher. Hence internal resource transfers are more likely to
occur in foreign firms than in Indian firms; consequently, dividend payouts are likely to be lower for foreign
firms than for Indian firm. In order to appreciate the advantages of internal transfers for foreign firms, it is
first necessary to discuss the concept of related party transactions or RPTs at greater length.
RPTs are transactions between parties which are associated by reason of common control, common
ownership or other common interest; in particular, transactions that occur between firms belonging to the
same business group would be considered RPTs. RPTs include sales of goods and services by one party to

19
the other, granting loans, writing off loans and dues, selling assets and other similar transactions. RPTs can
lead to effective asset utilization as well as reduce transactions costs when financial resources as well as
technology and business know-how are shared between related parties, particularly in the context of
institutional voids (Khanna and Palepu, 2000). While such resource transfers to related entities can hurt
minority shareholders if executed at a price significantly below the market price, it can also reduce corporate
taxes for the transferring entity.26
In other words, there are strong motivations for corporations to engage
in RPTs. There are good reasons to believe that the foreign firms in our sample can engage in such RPTs
at lower net cost than domestic companies, group-affiliated or stand-alone. We provide two such reasons.
First, foreign firms, whether defined by Prowess as group firms or not, are all affiliates of
multinational firms that have close ties to their foreign counterparts. For example, the Bata family is a
majority shareholder in Bata India Ltd. Another such firm, DISA India, according to its website, is “a
leading Equipment Manufacturer in India, offering advanced Foundry & Surface Preparation process
technology.” It is “the Indian arm of the Denmark based DISA Holding A/s.” The Disa Group, according
to the same website, is “the leading name in moulding and casting technology.”27 While DISA India belongs
to the Disa group, it is not listed in the Prowess database as a group firm, and neither is Bata India; however,
it is clear that both of them are likely to have strong motivations to engage in RPTs. These two examples
also indicate that our foreign firms tend to have foreign affiliates in the same industry, which would make
RPTs much more convenient, on the one hand, and more difficult for regulatory authorities to oversee, on
the other. In fact, when we looked at the 113 distinct foreign firms in our sample for the year 2009, 33 of
them being group firms and 80 being non-group firms, about half of the group firms had foreign affiliates
in the same industry, while 80% of the non-group firms had foreign affiliates in the same industry, broadly
defined. Firms in the same industry are likely to engage in operational transactions, such as buying raw
materials, selling finished goods, obtaining royalties for intellectual property rights or selling management
advice. 28
These goods and services, even raw materials if they are specialized, are likely not to have liquid
markets and determining an arm’s length prices is likely to be difficult. As a result, using RPTs to transfer
resources from one affiliated firm to another is likely to be easier for such firms. Domestic firms, on the
other hand, if they are non-group, are unlikely to have close operational relationships with other firms. And
even group firms are likely to be in disparate industries given the nature of Indian business groups (Khanna
and Palepu, 2000; Gopalan et al. 2014).
26 Presumably these transfers would be made to related entities that have lower marginal corporate tax rates.
27 Both Bata and Disa are also classified in the Prowess database as non-group firms. While Disa India today is 74% owned by Disa Holdings,
a part of the Norican group, seems to have originally been a joint venture between various entities including the government of
Karnataka.(http://www.moneycontrol.com/company-facts/disaindia/history/DI22, viewed October 1, 2015). Bata, may also not be classified as a group
by Prowess because all its affiliates operate in the same industry. Although Prowess’s definition of a group is self-confessedly subjective, the database
may well be using a common understanding of group which involves ownership of businesses in disparate industries (see, e.g. Khanna and Palepu, 2000).
28 For example, Kodak India, CLSA India and Ford India all either pay royalties to their parents Kodak USA, Credit Lyonnais Securities Asia
and Ford USA or purchase advertising or other services from them.
20
A second reason why foreign firms are more likely to engage in RPTs has to do with tax savings.
Foreign companies in India are taxed at a rate about 10% higher than local companies,29
which makes it
more desirable for them to reduce their reported Indian profits. According to the Indian Ministry of
Corporate Affairs,30
the US, Singapore, the UK, Japan and Germany are the source countries for the largest
number of foreign companies operating in India. In terms of comparable statutory tax rates, the corporate
tax rate for India in 2013 was 43.26% for large foreign companies operating in India (Ernst and Young,
2013), which is larger than the 35% rate domestic corporate tax rate in the US, 17% in Singapore, 25.5%
in Japan and 15% in Germany.31
For parents of these India-listed foreign companies requiring funds, it is
certainly better to obtain the funds through internal transfers without having to pay high corporate income
taxes and dividend taxes in India. These are all strong a priori reasons to expect foreign firms in India to
actively use internal money transfers. Empirically, too, we have evidence that OECD multinationals, for
one, tend to use transfer pricing as a strategy to reduce taxes – underpricing sales to subsidiaries in low tax
countries and vice-versa (Bartelsman and Beetsma, 2003).
There is also indirect evidence that foreign firms may be using aggressive transfer pricing practices
to move income from their Indian affiliates abroad. This is suggested by a recent article in an Indian
business daily, The Hindu Business Online,32 which reports that “Dividends declared by a foreign company
outside India on shares that derived substantial value from assets in India” are not taxable in India according
to the Central Board of Direct Taxes (CBDT, the Indian equivalent of the Internal Revenue Service). That
article also reports a corporate tax lawyer as saying that this “clears the air on taxability (under indirect
transfer) of dividends declared by foreign companies outside India.” This ruling seems to have been
intended to assuage the sentiments behind the drop in investment following the controversial retrospective
amendment to the Income Tax Act by the Finance Act of 2012.33
The history behind the government
notification goes back to the economic liberalization of the early 1990s. Following the increased FDI and
the increase in international trade, the number and size of transactions between companies belong to the
same foreign group also increased, leading to the use of transfer pricing activities that affected Indian
corporate tax revenues negatively. It was to counter this that the Indian government introduced new
Transfer Pricing Regulations through the Finance Act, 2001.34 In spite of the new regulations, the Indian
government seems to have felt that corporations were continuing to avoid taxes through the use of creative
29 Doing Business in India, Ernst and Young, November 2013, (https:www.ey.com%2FPublication%2FvwLUAssets%2FIndia_-
_Doing_Business%2F%24FILE%2FDoing%2520Business%2520in%2520India.pdf, viewed October 1, 2015.) 30 http://www.mca.gov.in/DataPortal/Ministry/DataPortal/ForeignCompanies_Source_Countrywise_1.xls 31 Deloitte and Touche, Corporate Tax Rates, 2015. Of course, effective tax rates are likely to be quite different, given the loopholes in tax
codes. 32 The Hindu Business Online, March 27, 2015. 33 This amendment sought to retroactively tax the 2007 Vodafone acquisition of Hutchinson Essar Telecom. Even though the transaction took
place in the Cayman Islands, the Indian tax authorities alleged that, since the transaction involved purchase of the assets of an Indian company, it was
liable to Indian taxation. 34 http://www.india-briefing.com/news/transfer-pricing-law-india-7815.html/

21
transfer pricing. This led to “a steep expansion of Transfer Pricing Officers (TPOs), a coordinated all-India
transfer pricing approach, and coordination between customs and transfer pricing authorities, resulting in
significant adjustments being made to companies in IT, pharmaceuticals, financial services, automobiles,
chemicals and related sectors.” 35 The behavior of the Indian Government from the 1990s to the present
day does seem to suggest a concern with the potential of transfer pricing practices to affect corporate taxes.
Furthermore, the Indian tax authorities have been successfully basing their challenges of multinational
transfer pricing practices by comparing them to pricing in purely domestic companies (Ernst and Young,
2013). Hence it would seem that there are grounds to believe the existence of aggressive transfer pricing
practices in foreign companies for the years in our sample. In summary, there are both a priori and empirical
reasons to expect foreign firms to have lower propensities to make dividend payouts than Indian firms.
As far as our finding that foreign group firms have a higher propensity to pay dividends than
foreign non-group firms, this may be purely an artifact of how CMIE, the creators of the Prowess database,
defines a group. The identity of Indian groups is fairly well known, since they are widely recognized as
being groups and usually are not of recent provenance. However, foreign firms may have been classified
as group firms or non-group firms based on unknown criteria that may make group firms different from
non-group firms in unknown ways. In fact, as mentioned above, non-group foreign firms seemed to have
a parent or a major shareholder abroad in the same industry in about 80% of the firms in our sample, in
contrast to a much lower percentage for foreign group firms. If our conjecture that having affiliates in the
same industry facilitates internal resource transfers, this could very well account for the lower propensity
of non-group foreign firms to pay dividends. Furthermore, according to its own disclosure, “CMIE uses
the available data, its intelligence and judgement in associating a company to a business group or any
ownership heading in the ownership structure. The classification is thus sometimes tentative.” More
research is required on the characteristics of foreign group firms.
While the dividend evidence above provided strong evidence in favor of the ICM hypothesis, we
now suggest an additional test of this hypothesis, based on our argument that India-listed affiliates of foreign
firms would find it optimal to expatriate funds through operational transactions to their foreign affiliate. If
this is true, foreign firms engaging in transfer pricing activities to benefit their foreign affiliates should have
lower profitability relative to Indian-group firms. In fact, keiretsu firms in Japan have been shown to have
lower profitability compared to non-keiretsu firms (Lincoln et al. 1996). Unfortunately, we are not able to
show that foreign group firms have significantly lower profitability. Similarly, to the extent that Indian
group firms use transfer pricing activities, their reported profits should also be smaller than comparable
Indian non-group firms. Once again, we cannot demonstrate that there is a statistically significant
difference. Of course, for Indian group firms, it may not make sense to make resource transfers to affiliated
35 KPMG (2013). The Vodafone case, thus, was only one transaction that stood out because of its size and because it went all the way to the
Supreme Court and caused an explicit Government reaction.

22
firms using transfer pricing mechanisms. To the extent that resource transfers are done in the form of loans
or other activities that are not related to operations, profits may indeed not be affected.36 We do, however,
provide suggestive evidence that the dividend policy of foreign firms listed in India is very likely affected
by internal funds transfers accomplished through the mechanism of aggressive and strategic transfer pricing
practices with the goal of reducing taxes paid on Indian profits.
VI. Conclusion
In this paper, we investigate the Internal Capital Markets hypothesis. The essence of the ICM
theory is that the cost to firms of internal financing is lower compared to that of external financing. As a
result, firms with larger sources of internal financing (internal capital markets, ICM) are able to match more
of their investment needs internally; consequently they pay lower dividends. We test this hypothesis by
looking at the dividend policies of listed Indian corporates: firms affiliated with business groups, according
to the ICM hypothesis, would pay lower dividends. While previous papers have found that group-affiliated
firms actually pay higher dividends, we find that there is no difference between group-affiliated and
unaffiliated firms, once we control for industry affiliation and other firm-specific variables. However,
consistent with the ICM, we find that group-affiliated firms have a lower propensity to pay dividends. We
also look at the behavior of foreign firms, which are actually India-listed firms where foreign promoters
have significant control. We find that foreign group-affiliated firms are less likely to pay dividends than
Indian group-affiliated firms. We suggest that this may be due to related-party transactions (RPTs) such as
transfer pricing arrangements between the foreign firms and their affiliates abroad. As part of our analysis,
we raise important questions as to what constitutes a group firm. Our paper thus makes contributions in
two different areas: one, the internal capital markets hypothesis, and two, differences between financial
policies of foreign firms and domestic firms in developing countries.
36 Bertrand, Mehta and Mullainathan (2002) find no evidence of tunneling in operating profits.
23
References
Abbott, Lawrence J. 2001. “Financing, dividend and compensation policies subsequent to a shift in the investment opportunity set,”
Managerial Finance, v. 27, no. 3, pp. 31-48.
Alessandrina, George and Horag Choi (2007). "Do Sunk Costs of Exporting Matter for Net Export Dynamics?" The Quarterly Journal
of Economics, MIT Press, vol. 122(1), pages 289-336.
Aulakh, Preet S; Masaaki Kotabe; and Hildy Teegen. (2000). “Export strategies and performance of firms from emerging economies:
Evidence from Brazil, Chile, and Mexico,” Academy of Management Journal, vol. 43, no. 3, pp. 342-361.
Bao, Jack and Jun Pan. (2013). “Bond Illiquidity and Excess Volatility,” Working Paper, Ohio State University.
Bernard, A. B. and J. B. Jensen. (2004): “Why Some Firms Export,” Review of Economics and Statistics vol. 86, no. 2, pp. 561-569.
Bernard, Andrew B., J. Bradford Jensen, Stephen J. Redding and Peter K. Schott. (2007): “Firms in International Trade,” Journal of
International Perspectives, vol. 21, no. 3, pp. 105-130.
Bradley, Michael; Dennis Capozza and Paul Seguin. 1998. “Dividend Policy and Cash Flow Uncertainty,” Real Estate Economics,
v. 26, no. 4, pp. 555-580.
Byoun, Soku. (2008). “How and When Do Firms Adjust Their Capital Structures toward Targets?” The Journal of Finance, vol. 43,
no. 6, pp. 3069-3096.
Cavusgil, S. T. (1982): Some Observations on the Relevance of Critical Variables for Internationalization Stages. In M.R. Czinkota
and G. Tesar, eds., Export Management: An International Context, pp. 276-85. New York: Praeger.
Chahine, Salim; Igor Filatotchev and Jenifer Piesse. (2007): “The Effects of R&D Investment and Firm Size on Growth
Opportunities of Newly Listed Firms: European Evidence,” Working Paper. http://ssrn.com/abstract=959155.
Chay, J.B. and Jungwon Suh (2009). “Payout Policy and Cash-Flow Uncertainty,” Journal of Financial Economics, vol. 93, pp. 88-
107.
Chibber, Pradeep and Sumit Majumdar. (1998). “Does it Pay to Venture Abroad? Exporting Behavior and the Performance of Firms
in Indian Industry,” Managerial and Decision Economics, vol. 19, no. 2, pp. 121-126.
Czinkota, M. R. (1982): Export Development Strategies: U.S. Promotion Policy. New York, Praeger.
David, Parthiban; Toru Yoshikawa; Murali Chari and Abdul Rasheed. (2006). “Strategic Investments in Japanese Corporations: Do
Foreign Portfolio Owners Foster Underinvestment or Appropriate Investment?” Strategic Management Journal, 27: 591–
600.
Demirbas, Dilek; Ila Patnaik; and Ajay Shah. (2009). “Graduating to globalisation: A study of Southern Multinationals,” Working
Paper, National Institute of Public Finance and Policy.
Desai, Mihir; C. Fritz Foley; and James R. Hines, Jr. (2007). “Dividend Policy Inside the Multinational Firm,” Financial Management,
Spring, pp. 5-26.
Desai, Mihir; C. Fritz Foley; and James R. Hines, Jr. (2004). “A Multinational Perspective on Capital Structure Choice and Internal
Capital Markets,” The Journal of Finance, vol. 59, no. 6, pp. 2451-2487.
Fadhlaoui, Kais; Makram Bellalah; Armand Dherry and Mohamed Zouaouil. (2008). “An Empirical Examination of International
Diversification Benefits in Central European Emerging Equity Markets,” International Journal of Business, vol. 13, no. 4, pp.
331-348.
Frank, Murray Z. and Vidhan K. Goyal. (2009). “Capital Structure Decisions: Which Factors Are Reliably Important?” Financial
Management, v. 38, no. 1, pp. 1-37.
French, Kenneth and Richard Roll. (1986) “Stock Return Variances: The Arrival of Information and the Reaction of Traders,” Journal
of Financial Economics, v. 17, pp. 5-26.
Ganesh-Kumar, A.; Kunal Sen and Rajendra R. Vaidya. (2003). International Competitiveness, Investment and Finance: A Case Study
of India, Routledge, New York.
Ghosh, Chinmoy and J. Randall Woolridge. (1998). “An Analysis of Shareholder Reaction to Dividend Cuts and Omissions,” Journal
of Financial Research, Volume 11, Issue 4, pages 281–294, Winter.
Goldman, Elena and P.V. Viswanath. 2001. “Export Intensity and Financial Leverage of Indian Firms,” International Journal of Trade
and Global Markets, vol. 4, no. 2, pp. 152-171.
Hansoge, Narahari and Vijaya Marisetty (2011). “Economic Transition and the Value of Business Group Affiliation: Evidence from
the Indian Market,” Working Paper, Indian Institute of Management, Bangalore, India.
He, Jia; Xinyang Mao; Oliver Rui and Xiaolei Zha (2013). “Business Groups in China,” Journal of Corporate Finance, vol. 22, pp.
166-192. Jakob S. H.and Johannes R. (2008). Dividend Determinants in Denmark, Management Working Paper 2008-3. University of Aarhus,
Denmark.

24
.Jensen, J.B., Redding, S. and Schott, P., (2007) “Firms in International Trade“, Journal of Economic Perspectives, vol. 21, no. 3, pp.
109-130.
Khanna, T. and Palepu, K. (1999). Policy shocks, market intermediaries, and corporate strategy: The evolution of business groups in
Chile and India. Journal of Economics and Management Strategy, 8(2):271–310.
Khanna, T. and Palepu, K. (2000). Is group affiliation profitable in emerging markets? An analysis of diversified Indian business
groups. Journal of finance, 55(2):867–891.
Kumar, Manoj; L.M. Bhole and Shahrokh Saudagaran, (2008) “How International Listings by the Indian Firms affect their Access to
the External Capital Markets and Investment-Cash Flows Sensitivity?” Working Paper, accessed at
http://ssrn.com/abstract=951388
Levine, Ross; and Sara Zervos. 1998. "Stock Markets, Banks, and Economic Growth," The American Economic Review, Vol. 88, No.
3. (Jun., 1998), pp. 537-558.
Lincoln, J., Gerlach, M. & Ahmadijan, C. (1996). “Keiretsu Networks and Corporate Performance in Japan,” American Sociological
Review, 61 (April), pp. 67–88.
Mohanty, Pitabas. 1999. “Dividend and Bonus Policies of Indian Companies: An Analysis,” Vol. 24, No. 4, October-December, pp.
35-42. http://www.vikalpa.com/pdf/articles/1999/1999_oct_dec_035_042.pdf
Moon, J. and Lee, H. (1990) “On the Internal Correlates of Export Stage Development: An Empirical Investigation in the Korean
Electronics Industry,” International Marketing Review, vol. 7, no. 5, 16-26.
Mullainathan, Senthil, Bertrand M., and P. Mehta. (2002) “Ferreting Out Tunneling: An Application to Indian Business Groups,”
The Quarterly Journal of Economics, 117(1):121-148.
Myers, Stewart. (1984). “The Capital Structure Puzzle,” The Journal of Finance, v. 39, no. 3, pp. 575-592.
Navaretti, Giorgio; Marzio Galeotti and Alessandra Tucci. (2002). “Do not get Trapped into Crossing: Indian Firms and Foreign
Markets,” Development Studies Working Paper, Centro Studi Luca D’Agliano.
Petersen, Mitchell. (2009). “Estimating standard errors in finance panel data sets: Comparing approaches,” Review of Financial
Studies, v. 22, pp. 435-480.
Rajan, Raghuram G.; and Luigi Zingales. 1998. "Financial Dependence and Growth," The American Economic Review, v. 88, no. 3,
pp. 559-586.
Rao, T. R. and Naidu, G. M. (1992). “Are the Stages of Internationalization Empirically Supportable?” Journal of Global Marketing,
vol. 6, nos. 1-2, pp. 147-170.
Shefer, Daniel and Amnon Frenkel. (2005). “R&D, firm size and innovation: an empirical analysis,” Technovation, vol. 25,no. 1, pp.
25-32.
Sinani, Evis and Bersant Hobdari. (2008). “Export market participation with sunk costs and firm heterogeneity,” Applied Economics.
Soter, D.; E. Brigham; and P. Evanson. 1966. “The Dividend Cut ‘Heard Round the World’: The Case of FPL,” Journal of Applied
Corporate Finance,” Spring, pp. 4-15.
Srinivasan, Padmini. (2013). “An Analysis of Related-Party Transactions in India,” Working Paper no. 402, Indian Institute of
Management, Bangalore.
Viswanath, P.V. "Strategic Considerations, The Pecking Order Hypothesis and Market Reactions to Equity Financing." Journal of
Financial and Quantitative Analysis, 28, no. 2, June 1993.
Woolridge, J.R. and C. Ghosh. 1985. “Dividend Cuts: Do They Always Signal Bad News?,” in J.M. Stern and D.H. Chew (eds.) The
Revolution in Corporate Finance, 1997, 3rd edition, Oxford: Blackwell.
Wortzel, L. H. and Wortzel, H. V. (1981). “Export Marketing Strategies for NIC and LDC-based Firms,” Columbia Journal of World
Business, Spring, pp. 51-60.

25
Table 1: Description of key variables and their expected signs in Payout-Ratio Regressions
Variable Definition Expected
sign Dominant Theory
Payout variables Dividend-to-earnings ratio
(DIV/E) Cash dividends / earnings
Dividend-to-sales ratio (DIV/S) Cash dividends / sales
Key explanatory variables
Group_all Dummy variable for Indian and Foreign Group
Firms - Internal Capital Markets
Indian Dummy variable for Indian Group and Non-Group Firms Internal Capital Markets
Foreign Dummy variable for Foreign Group and Non-Group Firms Internal Capital Markets
Indian_group Dummy variable for Indian Group Firms Internal Capital Markets
Foreign_group Dummy variable for Foreign Group Firms Internal Capital Markets
Indian_nongroup Dummy variable for Indian Non-Group Firms Internal Capital Markets
Foreign_nongroup Dummy variable for Foreign Non-Group Firms Internal Capital Markets
Firm Assets (log(TA)) Log(Total Assets) for each firm + Cashflow Uncertainty
Group Size (Group_N) Number of firms in the ownership group + Internal Capital Markets
Group Assets (Group_log(TA)) Log of the Sum of Total Assets in the ownership
group +/-
Internal Capital Markets/ Cashflow
Uncertainty
Capital Intensity (CapInt) Fixed Assets/Total Assets +/- Investment Opportunities
R&D Capital Account/Sales - Investment Opportunities
Intangibles-to-Assets (Intangibles) Ratio of Intangibles to Total Assets - Investment Opportunities
Market-to-Book (MBR) Market value of equity / book value of equity - Investment Opportunities
Cashflow-to-Assets (CFA) Ratio of Cashflow to Assets + Access to Funds
Age Age of the firm + Cashflow Uncertainty
Long term debt (Ltdebt) Ratio of Long term debt to Market Value of
Assets +/- Access to Funds
Cash Holdings (CASH) Ratio of cash and bank balance to total assets + Access to Funds
Volatility of cash flows (VOLCF) Volatility of the ratio of Operating cashflows to
Total Assets - Cashflow Uncertainty
Borrowing in foreign currency
(FOREX)
Ratio of unsecured foreign currency borrowings
to total borrowings +/- Access to Funds
Export Intensity (Exp) Exports/Sales - Investment Opportunities
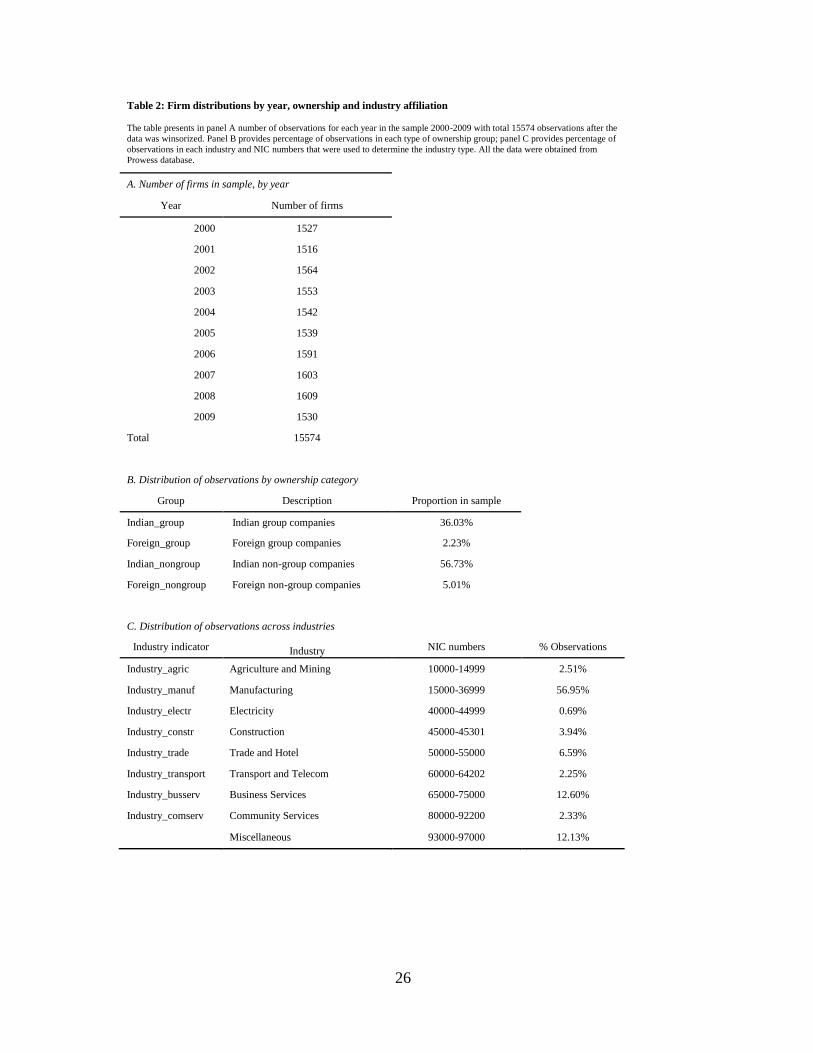
26
Table 2: Firm distributions by year, ownership and industry affiliation
The table presents in panel A number of observations for each year in the sample 2000-2009 with total 15574 observations after the
data was winsorized. Panel B provides percentage of observations in each type of ownership group; panel C provides percentage of
observations in each industry and NIC numbers that were used to determine the industry type. All the data were obtained from
Prowess database.
A. Number of firms in sample, by year
Year Number of firms
2000 1527
2001 1516
2002 1564
2003 1553
2004 1542
2005 1539
2006 1591
2007 1603
2008 1609
2009 1530
Total 15574
B. Distribution of observations by ownership category
Group Description Proportion in sample
Indian_group Indian group companies 36.03%
Foreign_group Foreign group companies 2.23%
Indian_nongroup Indian non-group companies 56.73%
Foreign_nongroup Foreign non-group companies 5.01%
C. Distribution of observations across industries
Industry indicator Industry NIC numbers % Observations
Industry_agric Agriculture and Mining 10000-14999 2.51%
Industry_manuf Manufacturing 15000-36999 56.95%
Industry_electr Electricity 40000-44999 0.69%
Industry_constr Construction 45000-45301 3.94%
Industry_trade Trade and Hotel 50000-55000 6.59%
Industry_transport Transport and Telecom 60000-64202 2.25%
Industry_busserv Business Services 65000-75000 12.60%
Industry_comserv Community Services 80000-92200 2.33%
Miscellaneous 93000-97000 12.13%

27
Table 3: Payout Ratios by Ownership Category Status
The table presents the means, standard deviations and number of observations in each ownership category for the payout ratios. The results for the dividend to earnings
ratio (DIV/E) are in columns 2-4; the results for the dividend to sales ratio (DIV/S) are in columns 5-7. N is number of observations of the payout ratio in each
ownership category. T-test for equality of means between all group and non-group firms as well as the Lawley-Hotelling trace test of equality means of four groups
(Indian group, Foreign group, Indian non-group, Foreign non-group) are given in the last rows columns 2-3 for DIV/E and columns 5-6 for DIV/S respectively. The
*** indicates the significance of the test at the 1% level.
DIV/E DIV/S
Ownership Category mean (St. Dev.) N mean (St. Dev.) N
Indian group firms (1) 0.181 0.220 5,459 0.021 0.062 5,612
Foreign group firms (2) 0.341 0.260 329 0.046 0.070 347
Indian non-group firms (3) 0.089 0.180 8,739 0.011 0.045 8,835
Foreign non-group firms (4) 0.226 0.264 764 0.027 0.043 780
Indian and Foreign group firms (1+2) 0.190 0.226 5,788 0.022 0.063 5,959
Indian and Foreign non-group firms (3+4) 0.100 0.191 9,503 0.012 0.045 9,615
Statistics (p-value) Statistics (p-value)
Test of equality of group (1+2) versus non-group (3+4) means:
t-statistics 25.471*** (0.000) 11.041*** (0.000)
Joint test for equality of (1),(2),(3),(4) group means:
Lawley-Hotelling trace statistics 0.082*** (0.000) 0.018*** (0.000)
Table 4: Payout Ratios by
Industry
The table presents the means, standard deviations and number of observations in each industry for the payout ratios. The
results for the dividend to earnings ratio (DIV/E) are in columns 2-4; the results for the dividend to sales ratio (DIV/S) are
in columns 5-7. N is number of observations of the payout ratio in each ownership category. The Lawley-Hotelling trace
test of equality means of four groups are given in the last row columns 2-3 for DIV/E and columns 5-6 for DIV/S
respectively. The *** indicates the significance of the test at the 1% level.
DIV/E DIV/S
Industry mean (St. Dev.)
N mean (St. Dev.)
N
Agriculture and Mining 0.101 0.178 386 0.012 0.027 391
Manufacturing 0.158 0.220 8,674 0.013 0.033 8,869
Electricity 0.196 0.203 106 0.050 0.112 108
Construction 0.115 0.170 610 0.012 0.032 614
Trade and Hotel 0.129 0.224 1,011 0.020 0.078 1,026
Transport and Telecom 0.139 0.214 346 0.025 0.062 351
Business Services 0.097 0.184 1,939 0.033 0.098 1,963
Community Services 0.113 0.209 358 0.018 0.051 363
Miscellaneous 0.074 0.173 1,861 0.008 0.038 1,889
Test for equality of 9 group means Statistic
s
(p-
value)
Statistic
s
(p-
value)
Lawley-Hotelling trace statistics 0.024**
* (0.000)
0.023**
* (0.000)

28
Table 5: Summary Statistics for Selected Firm Specific Variables
The table presents summary statistics (mean, standard deviation, median and number of observations N) of key variables. Payout Ratio DIV/E is
dividends paid/profit after taxes; DIV/S is dividends paid/sales. Firm size is the natural logarithm of Total Assets (Log(TA)); Goup_N is number of
firms in the ownership group; Group_log(TA) is the log of the sum of Total Assets in the ownership group; CapInt is the ratio of Net Fixed Assets
to Total Assets. Intangibles is the ratio of Net Intangible Assets to Total Assets; MarketCap is defined as the market price of the stock at the end of
March (which is the end of the financial year for most firms in India) times the number of shares outstanding; BookValue is defined as Assets
minus Total Borrowings ; MBR is the ratio of MarketCap to BookValue; CFA is Operating Cashflow before Working Capital Changes as a ratio of
Total Assets; R&D is the ratio of R&D expenses on Capital Account to Sales; Age is current year minus the year of incorporation; Ltdebt is (Total
Borrowings - Short-term Borrowings)/(MktValAssets); CASH is the ratio of cash and bank balance to Total Assets; VOLCF is the volatility of
Operating CashFlow/Total Assets, computed using observations for the most recent four years; FOREX is the ratio of unsecured foreign currency
borrowings to total borrowings; Exp is the ratio of exports to sales.
Mean Median St.Dev N
DIV/E 0.134 0.000 0.210 15,291
DIV/S 0.016 0.000 0.053 15,574
Log(TA) 4.416 4.298 1.925 15,512
Group_N 1.765 1.000 2.355 15,574
Group_log(TA) 4.852 4.588 2.317 15,527
CapInt 0.359 0.345 0.224 15,485
R&D 0.0003 0.000 0.0016 15,405
Intangibles 0.010 0.000 0.036 15,398
MBR 1.073 0.447 2.746 13,860
CFA 0.088 0.084 0.092 15,315
Age 24.15 18.00 19.55 15,554
Ltdebt 0.190 0.133 0.189 13,812
CASH 0.054 0.023 0.087 15,350
VOLCF 0.058 0.029 0.395 9,662
FOREX 0.012 0.000 0.064 14,005
Exp 0.156 0.012 0.266 15,494

29
Table 6: Correlations between dividend payout and key variables
The table reports the correlations between dividend payout and key variables over the period 2000-2009.
The second column reports the correlations of DV/E, the dividend-to-earnings ratio, with key variables.
The third column reports the correlations of DV/S, the dividend-to-sales ratio, with key variables. The star
indicated the correlation coefficient is statistically significant at the 5% level.
DIV/E DIV/S
Log(TA) 0.3315* 0.1348*
Group_N 0.1899* 0.0804*
Group_log(TA) 0.3271* 0.1457*
CapInt -0.0202* -0.0995*
R&D 0.1305* 0.0306*
Intangibles 0.0231* 0.0204*
MBR 0.0839* 0.0986*
CFA 0.3382* 0.1541*
Age 0.2331* 0.0691*
Ltdebt -0.1348* -0.1182*
CASH 0.1075* 0.1309*
VOLCF -0.0380* -0.0129
FOREX 0.0655* 0.0359*
Exp 0.0789* 0.0655*
Table 7: Summary Statistics by group categories The table presents summary statistics for the key variables for subsamples: group versus non-group firms in panel A and indian versus foreign
firms in panel B . The last column reports the t-statistics of the difference in mean between group and non-group firms for panel A and the
difference in mean beween foreign and indian firms in panel B. Positive value of t-statistics indicates higher mean for group firms in panel A
and for foreign firms in panel B. The *** indicates the significance of the t-test at the 1% level.
A. Summary Statistics – group vs non-group firms
Variable Group Non-group
Mean St. Dev. N Mean St. Dev. N t-stat
DIV/E 0.190 0.226 5,788 0.100 0.191 9,503 25.47***
DIV/S 0.022 0.063 5,959 0.012 0.045 9,615 11.04***
Log(TA) 5.657 1.760 5,941 3.645 1.591 9,571 71.76***
Group_N 2.999 3.467 5,959 1.000 0.000 9,615 44.51***
Group_log(TA) 6.791 1.956 5,956 3.645 1.591 9,571 100.00***
CapInt 0.383 0.218 5,930 0.345 0.227 9,555 10.57***
R&D 0.0005 0.0020 5,876 0.0002 0.0013 9,529 11.58***
Intangibles 0.010 0.032 5,923 0.010 0.038 9,475 -0.52
MBR 1.189 2.594 5,452 0.998 2.837 8,408 4.08***
CFA 0.100 0.091 5,881 0.081 0.092 9,434 12.43***
Age 31.855 23.266 5,954 19.379 14.960 9,600 36.91***
Ltdebt 0.216 0.191 5,438 0.173 0.186 8,374 13.03***
CASH 0.050 0.079 5,943 0.056 0.091 9,407 -4.26***
VOLCF 0.060 0.582 3,819 0.057 0.192 5,843 0.28
FOREX 0.021 0.083 5,540 0.006 0.047 8,465 12.31***
Exp 0.159 0.246 5,928 0.154 0.278 9,566 1.12

30
B. Summary Statistics – foreign vs Indian firms
The table presents summary statistics for the key variables for two subsamples: foreign and Indian firms. The last column reports the t-statistics
of the difference in mean between group and non-group firms. Positive value of t-statistics indicates higher mean for group firms. The ***
indicates the significance of the t-test at the 1% level.
Variable Foreign Indian
Mean St. Dev. N Mean St. Dev. N t-stat
DIV/E 0.260 0.268 1,093 0.124 0.201 14,198 16.45***
DIV/S 0.033 0.054 1,127 0.015 0.052 14,447 10.83***
Log(TA) 5.690 1.671 1,127 4.316 1.908 14,385 26.29***
Group_N 1.186 0.429 1,127 1.810 2.436 14,447 -26.04***
Group_log(TA) 5.907 1.803 1,127 4.769 2.332 14,400 19.91***
CapInt 0.322 0.215 1,124 0.362 0.225 14,361 -6.02***
R&D 0.001 0.002 1,119 0.000 0.002 14,286 4.24***
Intangibles 0.017 0.039 1,120 0.010 0.036 14,278 5.90***
MBR 1.886 1.900 1,039 1.007 2.793 12,821 13.75***
CFA 0.140 0.103 1,101 0.084 0.090 14,214 17.69***
Age 32.989 22.136 1,127 23.464 19.161 14,427 14.04***
Ltdebt 0.101 0.161 1,028 0.197 0.189 12,784 -18.01***
CASH 0.101 0.120 1,127 0.050 0.083 14,223 14.03***
VOLCF 0.047 0.057 736 0.059 0.411 8,926 -2.55***
FOREX 0.021 0.088 911 0.011 0.062 13,094 3.20***
Exp 0.207 0.287 1,118 0.152 0.264 14,376 6.27***

31
Table 8 : TOBIT for DIV/E and DIV/S
The table presents Tobit regression results for the dividend to earnings ratio DIV/E and dividend to sales ratio DIV/S over the period 2003-2009 for the whole sample. Columns 2 and 4 give results for group versus non-group firms while columns 3 and 5 show results for foreign versus domestic Indian firms. The numbers in parentheses are t-statistics. We follow Petersen (2009) and report t-statistics for the pooled results using standard errors corrected for clustering at the firm level. LK is the log likelihood ratio. N*T is the total number of observations. Year dummy variables are used in the regression but the results are omitted to save space. The *, ** and *** indicate significance at 10%, 5% and 1% levels respectively. Variables that are statistically significant are in bold.
DIV/E DIV/S
Group/Non-Group Foreign/Indian Group/Non-Group Foreign/Indian
coeff coeff coeff coeff
(t-stat) (t-stat) (t-stat) (t-stat)
Group_all (-) -0.004 0.001
(-0.23) (0.2)
Foreign (-) 0.00005 -0.007
(0.00) (-1.11)
Log(TA) (+) 0.048*** 0.048*** 0.007*** 0.007***
(5.14) (5.26) (2.95) (3.10)
Group_N (+) 0.001 0.001 -0.002** -0.002**
(0.15) (0.18) (-2.22) (-2.42)
Group_log(TA) (+) 0.017* 0.016* 0.007** 0.007***
(1.71) (1.76) (2.34) (2.92)
CapInt (+) 0.005 0.005 -0.033*** -0.033***
(0.13) (0.12) (-2.78) (-2.84)
R&D (-) 6.023** 5.982** 1.049** 1.026**
(2.37) (2.36) (2.56) (2.46)
Intangibles (-) -0.317 -0.316 -0.181*** -0.178***
(-1.63) (-1.62) (-3.89) (-3.83)
MBR (-) 0.001 0.001 0.001 0.001
(0.36) (0.37) (1.26) (1.29)
CFA (+) 1.470*** 1.471*** 0.336*** 0.338***
(17.54) (17.46) (10.84) (10.95)
Age (+) 0.002*** 0.002*** 0.0004*** 0.0004***
(4.97) (4.93) (4.02) (3.97)
Ltdebt (-) -0.358*** -0.358*** -0.052*** (-0.054***
(-7.39) (-7.32) (-3.66) (-3.73)
CASH (+) 0.236*** 0.238*** 0.061*** 0.064***
(3.19) (3.16) (3.2) (3.26)
VOLCF (- ) -0.896*** -0.896*** -0.153*** -0.154***
(-2.80) (-2.80) (-2.94) (-2.95)
Industry_manuf 0.106*** 0.106*** 0.017*** 0.017***
(4.41) (4.39) (2.82) (2.84)
Industry_electr 0.075* 0.076* 0.051*** 0.052***
(1.66) (1.64) (2.8) (2.86)
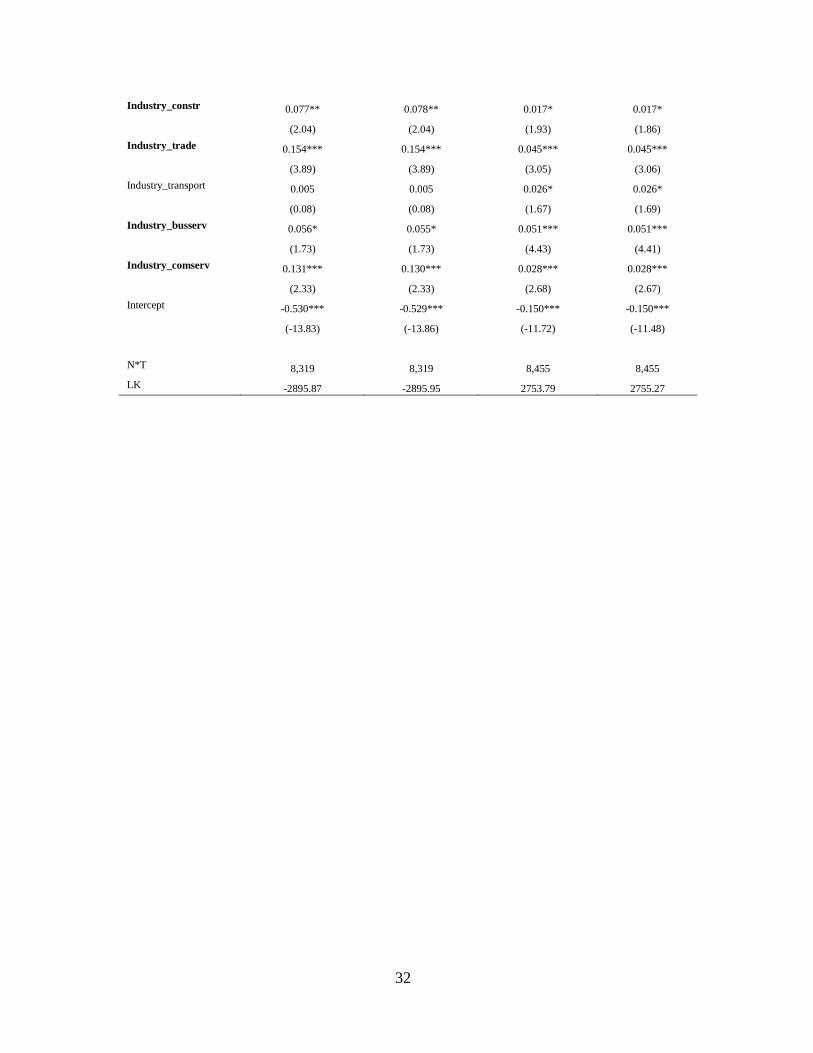
32
Industry_constr 0.077** 0.078** 0.017* 0.017*
(2.04) (2.04) (1.93) (1.86)
Industry_trade 0.154*** 0.154*** 0.045*** 0.045***
(3.89) (3.89) (3.05) (3.06)
Industry_transport 0.005 0.005 0.026* 0.026*
(0.08) (0.08) (1.67) (1.69)
Industry_busserv 0.056* 0.055* 0.051*** 0.051***
(1.73) (1.73) (4.43) (4.41)
Industry_comserv 0.131*** 0.130*** 0.028*** 0.028***
(2.33) (2.33) (2.68) (2.67)
Intercept -0.530*** -0.529*** -0.150*** -0.150***
(-13.83) (-13.86) (-11.72) (-11.48)
N*T 8,319 8,319 8,455 8,455
LK -2895.87 -2895.95 2753.79 2755.27
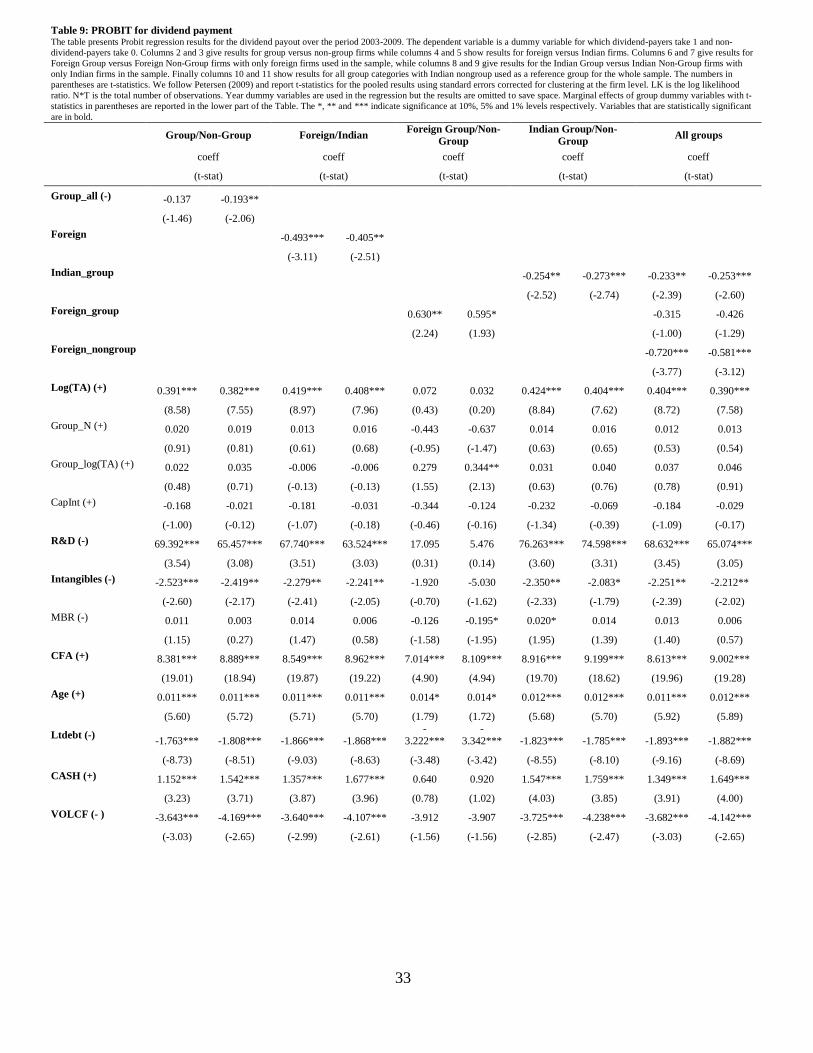
33
Table 9: PROBIT for dividend payment The table presents Probit regression results for the dividend payout over the period 2003-2009. The dependent variable is a dummy variable for which dividend-payers take 1 and non-
dividend-payers take 0. Columns 2 and 3 give results for group versus non-group firms while columns 4 and 5 show results for foreign versus Indian firms. Columns 6 and 7 give results for
Foreign Group versus Foreign Non-Group firms with only foreign firms used in the sample, while columns 8 and 9 give results for the Indian Group versus Indian Non-Group firms with
only Indian firms in the sample. Finally columns 10 and 11 show results for all group categories with Indian nongroup used as a reference group for the whole sample. The numbers in
parentheses are t-statistics. We follow Petersen (2009) and report t-statistics for the pooled results using standard errors corrected for clustering at the firm level. LK is the log likelihood
ratio. N*T is the total number of observations. Year dummy variables are used in the regression but the results are omitted to save space. Marginal effects of group dummy variables with t-
statistics in parentheses are reported in the lower part of the Table. The *, ** and *** indicate significance at 10%, 5% and 1% levels respectively. Variables that are statistically significant
are in bold.
Group/Non-Group Foreign/Indian Foreign Group/Non-
Group
Indian Group/Non-
Group All groups
coeff coeff coeff coeff coeff
(t-stat) (t-stat) (t-stat) (t-stat) (t-stat)
Group_all (-) -0.137 -0.193**
(-1.46) (-2.06)
Foreign -0.493*** -0.405**
(-3.11) (-2.51)
Indian_group -0.254** -0.273*** -0.233** -0.253***
(-2.52) (-2.74) (-2.39) (-2.60)
Foreign_group 0.630** 0.595* -0.315 -0.426
(2.24) (1.93) (-1.00) (-1.29)
Foreign_nongroup -0.720*** -0.581***
(-3.77) (-3.12)
Log(TA) (+) 0.391*** 0.382*** 0.419*** 0.408*** 0.072 0.032 0.424*** 0.404*** 0.404*** 0.390***
(8.58) (7.55) (8.97) (7.96) (0.43) (0.20) (8.84) (7.62) (8.72) (7.58)
Group_N (+) 0.020 0.019 0.013 0.016 -0.443 -0.637 0.014 0.016 0.012 0.013
(0.91) (0.81) (0.61) (0.68) (-0.95) (-1.47) (0.63) (0.65) (0.53) (0.54)
Group_log(TA) (+) 0.022 0.035 -0.006 -0.006 0.279 0.344** 0.031 0.040 0.037 0.046
(0.48) (0.71) (-0.13) (-0.13) (1.55) (2.13) (0.63) (0.76) (0.78) (0.91)
CapInt (+) -0.168 -0.021 -0.181 -0.031 -0.344 -0.124 -0.232 -0.069 -0.184 -0.029
(-1.00) (-0.12) (-1.07) (-0.18) (-0.46) (-0.16) (-1.34) (-0.39) (-1.09) (-0.17)
R&D (-) 69.392*** 65.457*** 67.740*** 63.524*** 17.095 5.476 76.263*** 74.598*** 68.632*** 65.074***
(3.54) (3.08) (3.51) (3.03) (0.31) (0.14) (3.60) (3.31) (3.45) (3.05)
Intangibles (-) -2.523*** -2.419** -2.279** -2.241** -1.920 -5.030 -2.350** -2.083* -2.251** -2.212**
(-2.60) (-2.17) (-2.41) (-2.05) (-0.70) (-1.62) (-2.33) (-1.79) (-2.39) (-2.02)
MBR (-) 0.011 0.003 0.014 0.006 -0.126 -0.195* 0.020* 0.014 0.013 0.006
(1.15) (0.27) (1.47) (0.58) (-1.58) (-1.95) (1.95) (1.39) (1.40) (0.57)
CFA (+) 8.381*** 8.889*** 8.549*** 8.962*** 7.014*** 8.109*** 8.916*** 9.199*** 8.613*** 9.002***
(19.01) (18.94) (19.87) (19.22) (4.90) (4.94) (19.70) (18.62) (19.96) (19.28)
Age (+) 0.011*** 0.011*** 0.011*** 0.011*** 0.014* 0.014* 0.012*** 0.012*** 0.011*** 0.012***
(5.60) (5.72) (5.71) (5.70) (1.79) (1.72) (5.68) (5.70) (5.92) (5.89)
Ltdebt (-) -1.763*** -1.808*** -1.866*** -1.868***
-
3.222***
-
3.342*** -1.823*** -1.785*** -1.893*** -1.882***
(-8.73) (-8.51) (-9.03) (-8.63) (-3.48) (-3.42) (-8.55) (-8.10) (-9.16) (-8.69)
CASH (+) 1.152*** 1.542*** 1.357*** 1.677*** 0.640 0.920 1.547*** 1.759*** 1.349*** 1.649***
(3.23) (3.71) (3.87) (3.96) (0.78) (1.02) (4.03) (3.85) (3.91) (4.00)
VOLCF (- ) -3.643*** -4.169*** -3.640*** -4.107*** -3.912 -3.907 -3.725*** -4.238*** -3.682*** -4.142***
(-3.03) (-2.65) (-2.99) (-2.61) (-1.56) (-1.56) (-2.85) (-2.47) (-3.03) (-2.65)

34
FOREX (+) 1.037** 1.055** 1.562 1.317*** 1.020**
(2.18) (2.29) (0.93) (3.09) (2.21)
Exp (-) 0.411*** 0.445*** -0.495 0.433*** 0.423***
(3.40) (3.65) (-0.79) (3.42) (3.46)
Industry_manuf 0.376*** 0.368*** 0.391*** 0.377*** -0.476 -0.506 0.415*** 0.409*** 0.387*** 0.374***
(3.96) (3.71) (4.00) (3.73) (-0.80) (-0.83) (4.20) (4.00) (3.96) (3.69)
Industry_electr 0.510 0.501 0.567 0.573 0.383 0.336 0.594 0.574
(1.31) (1.35) (1.45) (1.49) (0.87) (0.83) (1.52) (1.47)
Industry_constr 0.490** 0.583*** 0.483** 0.595*** 0.445** 0.561*** 0.443** 0.553***
(2.61) (2.85) (2.54) (2.88) (2.29) (2.67) (2.33) (2.67)
Industry_trade 0.527*** 0.549*** 0.544*** 0.554*** -1.261 -0.609 0.656*** 0.605*** 0.547*** 0.552***
(3.10) (3.52) (3.28) (3.56) (-1.45) (-0.70) (4.08) (3.82) (3.29) (3.52)
Industry_transport -0.334 -0.280 -0.317 -0.268 -1.035 -0.520 -0.274 -0.273 -0.304 -0.270
(-1.11) (-0.89) (-1.06) (-0.85) (-1.00) (-0.56) (-0.85) (-0.80) (-1.01) (-0.85)
Industry_busserv 0.337** 0.288** 0.345** 0.295** -0.168 0.696 0.321** 0.248 0.342** 0.297**
(2.53) (1.96) (2.53) (1.98) (-0.27) (0.95) (2.25) (1.59) (2.51) (1.97)
Industry_comserv 0.333* 0.302 0.323* 0.305 -0.446 -0.257 0.358* 0.327* 0.335* 0.310*
(1.86) (1.59) (1.84) (1.61) (-0.76) (-0.43) (1.91) (1.64) (1.88) (1.65)
Intercept -3.014*** -3.207*** -3.022*** -3.179*** -1.320* -1.402* -3.198*** -3.340*** -3.066*** -3.238***
(-19.01) (-18.54) (-19.28) (-18.31) (-1.74) (-1.91) (-19.11) (-18.23) (-19.22) (-18.60)
N*T 8,455 7,528 8,455 7,528 641 478 7,795 7,034 8,455 7,528
LK -3256.37 -2877.78 -3239.31 -2873.23 -214.32 -152.92 -2964.00 -2669.39
-
3224.7098 -2861.8429
Pseudo R2 0.44 0.45 0.45 0.45 0.44 0.48 0.45 0.45 0.45 0.45
Marginal effect at median
Group_all -0.08**
(-2.07)
Foreign -0.15***
(-2.68)
Indian_group -0.11*** -0.10***
(-2.76) (-2.61)
Foreign_group 0.12* -0.16
(1.73) (-1.36)
Foreign_nongroup -0.22***
(-3.41)

35
Table 10 : Year by year PROBIT regressions
The table presents Probit regression results for the dividend payout over the period 2003-2009.Columns 2 and 3 give results
for group versus non-group firms while columns 4 and 5 show results for foreign versus Indian firms. Industry dummy
variables are used in the regression but the results are omitted to save space. Each reported coefficient is the average of the
seven regression coefficients over the seven-year sample period. The numbers in parentheses are t-statistics for the average
regression coefficient. The t-statistics are calculated following the Fama-MacBeth approach from the time series of fitted
Probit coefficients. ‘# expected sign’ denotes the number of times the regression coefficient takes the expected sign as noted
in Table 1. ‘#sig’ denotes the number of times the regression coefficient is statistically significant (two-tailed significance at
the 10% level) with the predicted sign. LK is the average log likelihood ratio. N is the average annual number of
observations. Variables that are statistically significant for at least 3 years out of total T=7 years are in bold.
Group/Non-Group Foreign/Indian
coeff # expected sign coeff # expected sign
(t-stat) [# sign at 10%] (t-stat) [# sign at 10%]
Group_all (-) -0.195 6
(-3.26) [3]
Foreign (-) -0.443 7
(-11.75) [4]
Log(TA) (+) 0.394 7 0.421 7
(16.16) [7] (17.15) [7]
Group_N (+) 0.021 5 0.016 5
(2.04) [0] (1.74) [0]
Group_TA (+) 0.037 4 -0.005 4
(1.43) [1] (-0.19) [0]
CapInt (+) -0.031 4 -0.042 4
(-0.34) [0] (-0.51) [0]
R&D (-) 85.207 0 82.803 0
(3.86) [4] (3.74) [4]
Intangibles (-) -2.311 6 -2.124 7
(-4.67) [3] (-4.65) [1]
MBR (-) -0.022 3 -0.003 3
(-1.04) [0] (-0.25) [0]
CFA (+) 9.424 7 9.467 7
(12.45) [7] (12.56) [7]
Age (+) 0.012 7 0.011 7
(12.62) [7] (13.84) [7]
Ltdebt (-) -2.014 7 -2.059 7
(-9.94) [7] (-9.99) [7]
CASH (+) 1.784 7 1.934 7
(5.49) [5] (5.71) [5]
VOLCF (- ) -4.740 7 -4.649 7
(-5.64) [5] (-5.51) [5]
FOREX (+) 1.687 7 1.649 6
(3.15) [3] (3.07) [3]
Exp (-) 0.404 0 0.439 0
(6.53) [4] (6.32) [5]

36
Industry_manuf 0.374 0.383
(6.68) [6] (6.60) [6]
Industry_electr 0.071 0.161
(0.32) [2] (0.79) [2]
Industry_constr 0.595 0.606
(10.95) [5] (9.89) [5]
Industry_trade 0.582 0.585
(6.87) [6] (6.93) [6]
Industry_transport -0.237 -0.225
(-1.80) [1] (-1.71) [1]
Industry_busserv 0.249 0.248
(2.68) [2] (2.63) [2]
Industry_comserv 0.325 0.315
(2.21) [3] (2.09) [3]
Intercept -3.187 -3.160
(-25.56) [7] (-27.09) [7]
N 1072.86 1072.86
LK -400.02 -399.61
Pseudo R2 0.46 0.46

37
Figure 1: Average payout ratios DIV/E and DIV/S for group and non-group firms over time.