internal structure and composition of a rock glacier in ... · internal structure and composition...
TRANSCRIPT
Internal structure and composition of a rock glacier in the Andes(upper Choapa valley, Chile) using borehole information and
ground-penetrating radar
Sebastien MONNIER, Christophe KINNARDCentro de Estudios Avanzados en Zonas Aridas (CEAZA), La Serena, Chile
E-mail: [email protected]
ABSTRACT. This study uses boreholes, ground temperature monitoring and ground-penetrating radar(GPR) in order to understand the internal structure and composition of a rock glacier in the upperChoapa valley, northern Chile. The rock glacier is a small valley-side feature, 200m long and rangingbetween 3710 and 3780ma.s.l. Two boreholes were drilled down to depths of 20 and 25m, respectively,using the diamond drillhole technique. An ice–rock mixture was encountered in the boreholes, withheterogeneous ice content averaging 15–30%. Data from common-midpoint (CMP) and constant-offset(CO) GPR surveys acquired, respectively, near the boreholes and across the whole rock glacier wereprocessed to highlight the internal stratigraphy and variations in the radar-wave velocity. The GPRprofiles depict a rock glacier constituted of stacked and generally concordant layers, with a thicknessranging from 10m in its upper part to �30m towards its terminus. The CMP analysis highlights radar-wave velocities of 0.13–0.16mns–1 in the first 20m of the structure. Larger vertical and lateral velocityvariations are highlighted from CO data, reflecting the heterogeneous composition of the rock glacierand the likely presence of unfrozen water in the structure. Given the average air temperature registeredat the site (+0.58C), the near-melting-point temperature registered in the boreholes over more than ayear and the presence of locally high water content inferred from GPR data, it is thought that thepermafrost in the rock glacier is currently degrading.
1. INTRODUCTIONRock glaciers are ice–rock mixtures moving downslope andexhibiting striking viscous flow morphology. They aregenerally regarded as the main geomorphological expressionof mountain permafrost (Barsch, 1996; Berthling, 2011), thelatter being defined as ground with temperature remaining ator below 08C during at least two consecutive years,irrespective of ice content or texture (Washburn, 1979; VanEverdingen, 2005; Haeberli and others, 2006). Rock glaciersare very common in mid-latitude orogens. This is particularlytrue in the semi-arid Andes of Chile and Argentina, wherethey can reach very high concentrations and very largedimensions (Schrott, 1996; Trombotto and others, 1999;Brenning, 2005; Angillieri, 2009; Azocar and Brenning,2010). The abundance of rock glaciers in the semi-arid Andespotentially makes them the most important ice reservoir,before glaciers; at the scale of some catchments where thedensity of glaciers is low or null, this is indisputable(Brenning, 2005; Azocar and Brenning, 2010). However,considerable uncertainties remain as to how much ice isstored in rock glaciers at the basin scale, mainly due to a lackof observations of their internal structure and ice content.Studies of rock glaciers in the semi-arid Andes, especiallyfield-based ones, are few compared with other areas of theworld such as the intensively studied European Alps. To ourknowledge, only two published studies have addressed theproblem of the internal structure of rock glaciers in the semi-arid Andes (Croce and Milana, 2002; Milana and Guell,2008). At the same time a considerable amount of mostlyunpublished consulting work (e.g. Marangunic, 2010) hasbrought insights on this topic within the framework of themining industry. In the mountains of northern Chile, thedevelopment of mining activities has indeed been favored by
the presence of large amounts of precious metals, withporphyry copper at the forefront (Sillitoe, 2010), and byeconomic and political factors at global and national levelsin recent decades – especially the importance and growth ofcopper usage in many segments of industry worldwide(ICSG, 2010) and the driving of the Chilean mining sector bythe so-called ‘Chilean economic model’, with a friendlyenvironment for foreign investment (Bastida and others,2005; Bastida, 2006). Because mining activities may reshapethe Earth’s surface (e.g. Palmer and others, 2010) and henceaffect cryosphere elements, which in semi-arid to arid highmountains may constitute important freshwater reservoirs,the political and scientific interest in the Chilean cryospherehas grown over the past decade (Brenning, 2010). Never-theless, debates exist around the hydrological importance ofrock glaciers (Arenson and Jakob, 2010; Brenning, 2010).This context highlights the need for further research and fieldmeasurements on rock glaciers in the semi-arid Andes.
In this paper, we describe and interpret new field datacollected on a rock glacier in the upper Choapa valley, NorteChico region of Chile (between 29802’ S and 32816’ S), withthe aim of revealing its stratigraphy and estimating itscomposition. Our approach focuses on the use of ground-penetrating radar (GPR) complemented with boreholedrilling and ground temperature monitoring. Over the pastdecade, many studies have employed GPR in order todescribe the stratigraphy of rock glaciers (e.g. Lehmann andGreen, 2000; Degenhardt and others, 2003; Hausmann andothers, 2007; Monnier and others, 2008; Degenhardt, 2009;Leopold and others, 2011). On the other hand, few studieshave used the velocity of radar-wave propagation in rockglaciers. The latter varies significantly both in the lateral andvertical directions, which is likely to reveal valuable
Annals of Glaciology 54(64) 2013 doi:10.3189/2013AoG64A107 61
information on the internal composition of rock glaciers(Musil and others, 2006; Monnier and others, 2011).Notably, previous studies have highlighted from geophysicaldata the presence of liquid water in permafrost (Musil andothers, 2006; Maurer and Hauck, 2007; Hauck and others,2011). Hence our study places emphasis on the character-ization and interpretation of the radar-wave velocity in a rockglacier and discusses the influence of unfrozen water withinor beneath the rock glacier on the GPR-derived velocity.
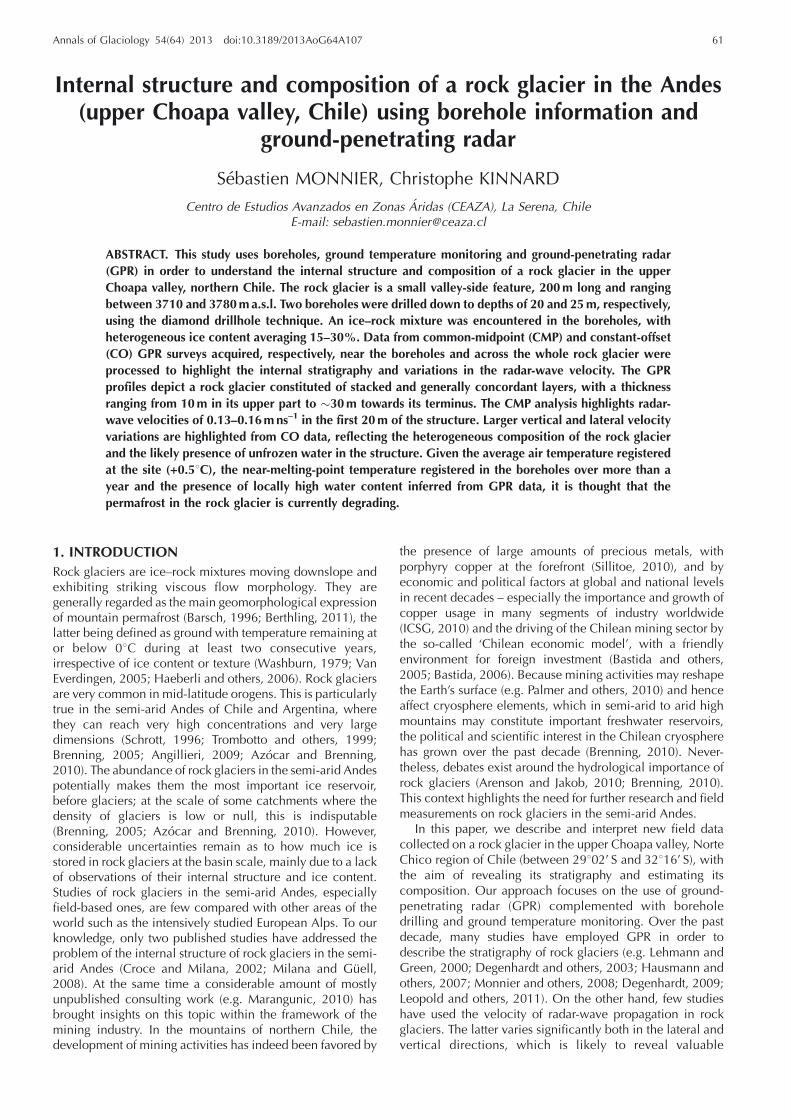
2. STUDY AREAThe rock glacier investigated is located in a small hangingvalley called Quebrada Noroeste (NW) within the LosPelambres mine area in the upper part of the Choapa valley(31.88 S, 70.58W) (Fig. 1). The Los Pelambres mine is anopen-pit copper mine with elevations ranging from �1100to 4500ma.s.l. The area represents a transition between theMediterranean climate to the south and the semi-arid steppeclimate to the north. The climate of the upper Choapa valleyis a highland climate. Using meteorological data from theChilean Water Service (Direccion General de Agua, DGA), alinear temperature gradient of –0.738C (100m)–1 was calcu-lated and resulted in a 08C isotherm located at �3650ma.s.l. In Quebrada NW, a meteorological station installed in2009 at 3700ma.s.l. by the Los Pelambres Companyrecorded in 2010 an average air temperature of +0.58C.The nearest precipitation gauge maintained by the DGA(Huintil, 805ma.s.l.) registered 207mm in 2010, 38% lessthan the 1961–90 average of 334mm. Various consulting
studies previously focused on the rock glaciers in QuebradaNW in order to address concerns about the use of this site bythe mining company. These studies gave rise to variousgeomorphological interpretations, from the rejection ofpermafrost and rock glacier occurrence (DISSAM Securite,2002) to the identification of glacier ice-cored rock glaciers(Geoestudios, 1998); Geoblast (2009) recognized the fea-tures in Quebrada NW as rock glaciers and, usinggeoelectrical measurements, made the hypothesis of perma-frost occurrence. Apart from these consulting studies,Azocar and Brenning (2008) and Brenning and Azocar(2010) inventoried rock glaciers in Quebrada NW fromaerial photograph and satellite imagery interpretation. Theyemphasized the role that these rock glaciers may play asreservoirs and suppliers of fresh water and the damage thatthese landforms may suffer, or have already suffered, fromnearby mining activities.
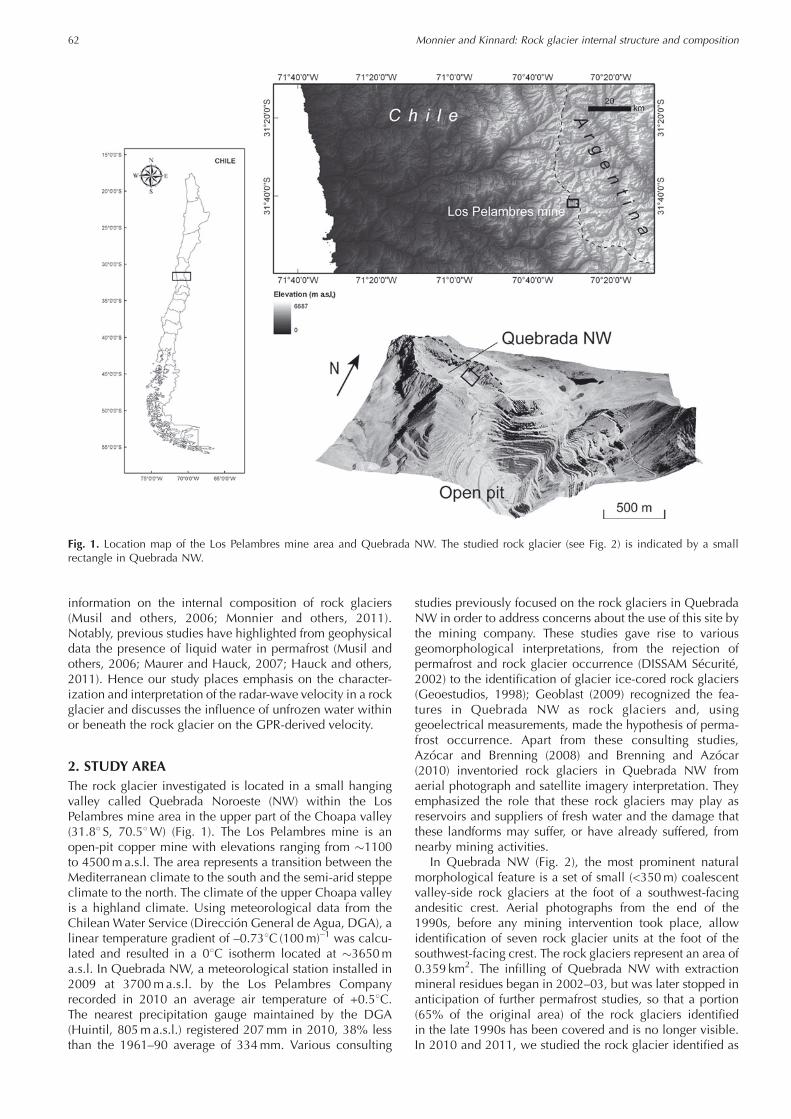
In Quebrada NW (Fig. 2), the most prominent naturalmorphological feature is a set of small (<350m) coalescentvalley-side rock glaciers at the foot of a southwest-facingandesitic crest. Aerial photographs from the end of the1990s, before any mining intervention took place, allowidentification of seven rock glacier units at the foot of thesouthwest-facing crest. The rock glaciers represent an area of0.359 km2. The infilling of Quebrada NW with extractionmineral residues began in 2002–03, but was later stopped inanticipation of further permafrost studies, so that a portion(65% of the original area) of the rock glaciers identifiedin the late 1990s has been covered and is no longer visible.In 2010 and 2011, we studied the rock glacier identified as
Fig. 1. Location map of the Los Pelambres mine area and Quebrada NW. The studied rock glacier (see Fig. 2) is indicated by a smallrectangle in Quebrada NW.
Monnier and Kinnard: Rock glacier internal structure and composition62
#5 and the upper lateral part of the one identified as #4(Figs 2 and 3). These represent the most intact landforms thatremain visible at the site, i.e. they were the least disturbedby mining operations. The elevation range of the surveyedarea is 3710–3780ma.s.l. Rock glacier #5 is a small, 270mwide and 200m long valley-side landform. The original(undisturbed) surface of the rock glacier is quite smoothwithout noticeable ridges and furrows. However, a clear andsteep front is noticeable on the satellite images recordedbefore burial of the distal part by extraction residues and isstill perceptible in the artificial morphology. Using a high-resolution (2m) digital elevation model (DEM) of the areaderived from aerial photographs taken in 2009, the originalheight of the front was estimated to be �10m. On thecurrently intact parts of the surface, the material is coarse,consisting of gravels, cobbles and small (<30 cm) boulders(Fig. 2). Monitoring of surface movement at five locations onrock glaciers #4 and #5 was carried out by topographersfrom the Los Pelambres Company between March 2010 and
March 2012 and showed horizontal displacements between13 and 50 cma–1 (CEAZO, 2012).
3. METHODS
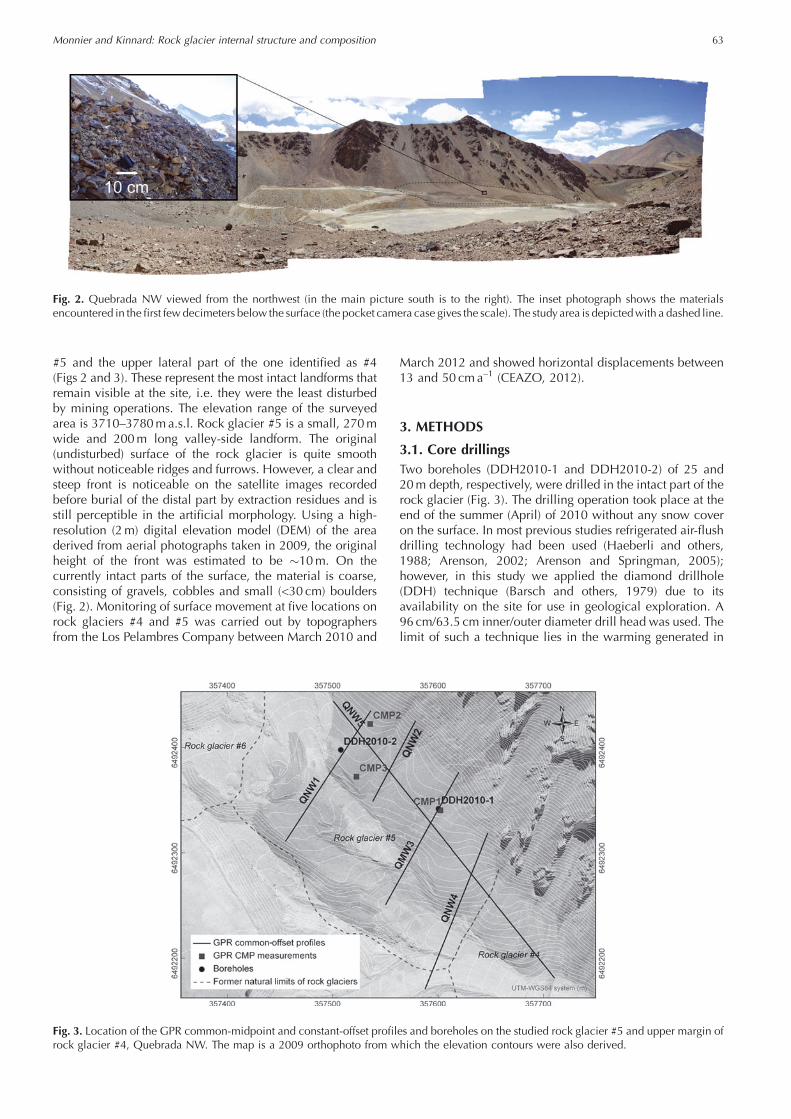
3.1. Core drillingsTwo boreholes (DDH2010-1 and DDH2010-2) of 25 and20m depth, respectively, were drilled in the intact part of therock glacier (Fig. 3). The drilling operation took place at theend of the summer (April) of 2010 without any snow coveron the surface. In most previous studies refrigerated air-flushdrilling technology had been used (Haeberli and others,1988; Arenson, 2002; Arenson and Springman, 2005);however, in this study we applied the diamond drillhole(DDH) technique (Barsch and others, 1979) due to itsavailability on the site for use in geological exploration. A96 cm/63.5 cm inner/outer diameter drill head was used. Thelimit of such a technique lies in the warming generated in
Fig. 2. Quebrada NW viewed from the northwest (in the main picture south is to the right). The inset photograph shows the materialsencountered in the first fewdecimeters below the surface (the pocket camera case gives the scale). The studyarea is depictedwith a dashed line.
Fig. 3. Location of the GPR common-midpoint and constant-offset profiles and boreholes on the studied rock glacier #5 and upper margin ofrock glacier #4, Quebrada NW. The map is a 2009 orthophoto from which the elevation contours were also derived.
Monnier and Kinnard: Rock glacier internal structure and composition 63
the borehole by the rotation of the diamond head; althoughcooling is maintained by the injection of cold water, lossesof core samples are bound to occur. This use of water alsoprevents the determination of volumetric ice content by thegravimetric method using known densities (Arenson andSpringman, 2005). Considering that rock glaciers have beendrilled only on very rare occasions (see Haeberli and others,2006), this opportunistic technique was still consideredvaluable to visually examine the inner part of the rockglacier and to provide general ground-truthing for the GPRresults. During drilling of the hole, the recovery rate (theratio between the retrieved sample length and the totallength drilled) was recorded. The samples were describedaccording to visible grain size and ice filling. Since the DDHtechnique disturbs and wets the structure we did not weighthe samples. The temperature of the samples was measuredon site immediately after their recovery from the boreholeusing a manual digital thermometer. The ice content wasestimated visually at depth intervals of 10–40 cm dependingon the complexity of the stratigraphy. The varying recoveryrate of the sample cores was then used to estimate thepotential minimum and maximum ice content. As the typeof material lost during the coring is unknown, we consideredthat the lost core fraction may have been composed of puredebris or pure ice; however, it is probable that ice-poor wetmaterials are more likely to be destroyed and lost due totheir lower cohesive strength.
3.2. Ground temperature monitoringThe DDH2010-1 borehole was equipped with a 25m long12-thermistor (Lakewood Inc.) string with an accuracy of�0.28C. Thermistors were spread between the surface (0m)and at successive depth intervals of 2m between –1 and–17m and of 4m between –17 and –25m. The borehole wasbackfilled with sand and sealed with bentonite at the surfaceto prevent water percolation. A data logger was connectedto the string and programmed to record borehole tempera-tures every 2 hours. In the DDH2010-2 borehole an 18mlong five-thermistor string with an accuracy of �0.28C,without a data logger, was placed for punctual measure-ments.
3.3. Ground-penetrating radarIn April 2010, we used a pulseEKKO Pro DVL (Sensors &Software Inc.) GPR system mounted with unshielded50MHz antennas in order to obtain data describing thesubsurface of rock glacier #5 in Quebrada NW. Weperformed (Fig. 3): (1) three common-midpoint (CMP)surveys near the boreholes using a step size of 0.4m; and(2) five constant-offset (CO) profiles (four longitudinalprofiles of �150m and one 350m long transverse profile)throughout the intact and intervened parts of the rock glacierusing an antenna separation of 2m and a step size of 0.5m.Whereas the CMP1 survey was performed at the exactlocation of DDH2010-1 before drilling of the borehole, theCMP2 and CMP3 surveys were performed 50m northwestand 35m southeast of DDH2010-2, respectively, becausethe borehole had already been drilled and the surfacedisrupted by the drilling platform. For the whole survey, eachcollected trace was the results of 16 stacks in order toincrease the signal-to-noise ratio. Topographic data wereintegrated into the GPR survey using a handheld GPS forplanar positioning and elevation values from the pre-existing2009 high-resolution DEM. An automatic high-pass filter
(dewow filter) was applied to the GPR data to remove thevery low-frequency component. Following common pro-cedures (Eisen and others, 2002; Annan, 2003) semblanceanalysis of the CMP data was performed in order to obtain avertical profile of the normal moveout (NMO) velocity.Then, according to the main changes seen in the boreholestratigraphy, interval velocities were calculated using the Dixformula (Dix, 1955). The four longitudinal CO profiles weremigrated with a Stolt (1978) migration using a constantvelocity (0.13mns–1) derived from consideration of both theCMP results and the fitting of some diffraction hyperbolas inthe unmigrated CO data. The data from the transverse profile(QNW5) allowed the following advanced processing stepsto derive the distribution of the radar-wave velocity. Thelarge number of diffraction hyperbolae in the data was usedfor calculating root-mean-square (rms) velocities using thehyperbola-fitting method. The latter technique has beendescribed by Brandt and others (2007), Bradford and others(2009) and Jol (2009). Jol (2009) reported errors of �10%associated with the technique. To reduce the errors, velocitymeasurements were carefully repeated several times on eachhyperbola, so that the maximum error on rms velocities isestimated to be <5%. Subsequently, the distribution of rmsvelocities was used for migration of the profile using a two-dimensional (2-D) Kirchhoff migration (Yilmaz and Doherty,2001). When hyperbolae were found to be approximatelyaligned vertically along the profile, which was frequently thecase, the Dix formula (Dix, 1955) was used to convert therms velocities into a vertical profile of interval velocities.Maximum errors on calculated interval velocities werecomputed considering the maximum �5% error on rmsvelocities. The interval velocities were used for the time-to-depth conversion of the profile. Finally, static elevationcorrections were applied to all GPR profiles using thetopographic data, and profiles were further visually en-hanced using automatic gain control (AGC) gain with a timewindow of 60 ns.
4. RESULTS4.1. Borehole stratigraphyFigure 4 shows the observed stratigraphy at the boreholesDDH2010-1 and DDH2010-2. In the DDH2010-1 borehole,the first 7m are devoid of ground ice and exhibited positivetemperatures at the moment of their retrieval. The materialsare predominantly sand with gravels (0–5m deep) and thenangular gravels with a few sand matrices (5–7m deep).Below 7m, the materials are frozen. The occurrence ofground ice is heterogeneous. Between 7 and 10m depth,there is an alternation of layers with excess pore ice, layerswith unsaturated pore ice and even two very thin (10 cm)layers of pure ice. Below 10m, sediments with unsaturatedpore ice predominate, with the occasional occurrence of thinlayers with excess pore ice. The sediment size in theDDH2010-2 borehole is nearly constant throughout itslength, consisting of angular gravels with a few sandmatrices. The top unfrozen layer is thinner than in the firstborehole (5m). Below 5m the materials are frozen, againwith heterogeneous occurrence of ground ice. Between 5and �12m, unsaturated pore ice predominates, though two�50 cm thick layers with excess pore ice and one 20 cm thicklayer of pure ice are encountered. Below�12m and down tothe bottom of the borehole, the frequency of layers withexcess pore ice increases, alternating with layers of
Monnier and Kinnard: Rock glacier internal structure and composition64
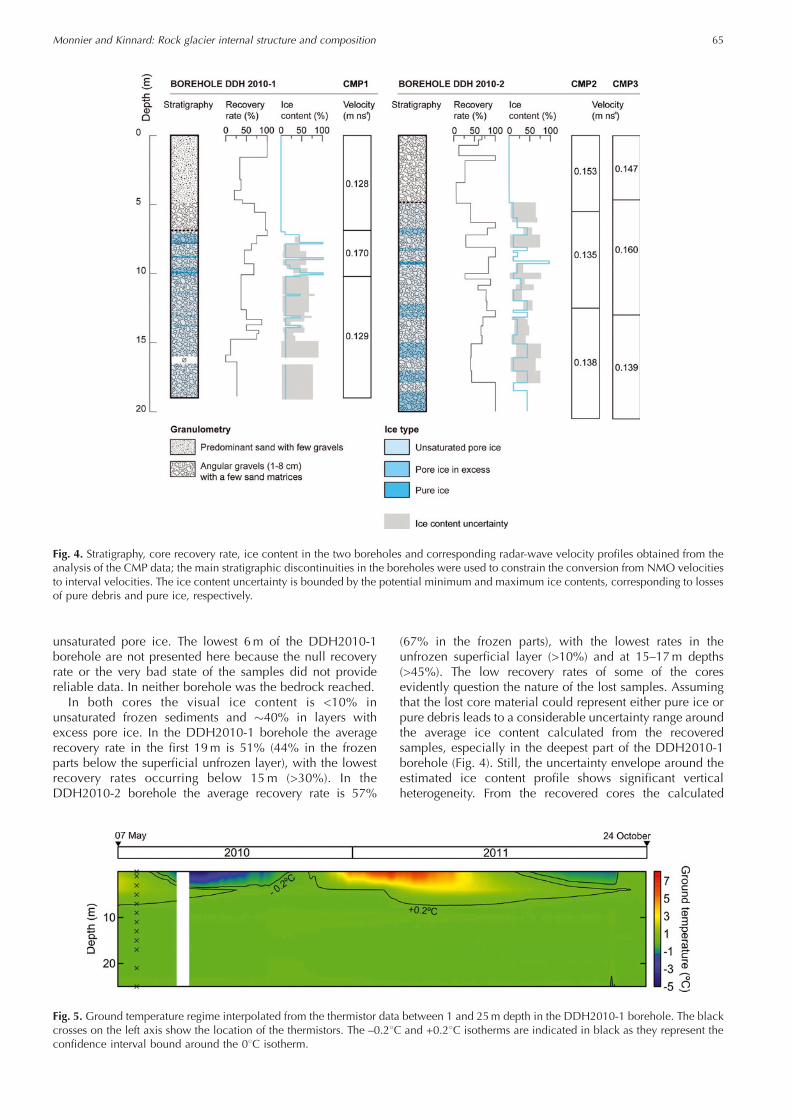
unsaturated pore ice. The lowest 6m of the DDH2010-1borehole are not presented here because the null recoveryrate or the very bad state of the samples did not providereliable data. In neither borehole was the bedrock reached.
In both cores the visual ice content is <10% inunsaturated frozen sediments and �40% in layers withexcess pore ice. In the DDH2010-1 borehole the averagerecovery rate in the first 19m is 51% (44% in the frozenparts below the superficial unfrozen layer), with the lowestrecovery rates occurring below 15m (>30%). In theDDH2010-2 borehole the average recovery rate is 57%
(67% in the frozen parts), with the lowest rates in theunfrozen superficial layer (>10%) and at 15–17m depths(>45%). The low recovery rates of some of the coresevidently question the nature of the lost samples. Assumingthat the lost core material could represent either pure ice orpure debris leads to a considerable uncertainty range aroundthe average ice content calculated from the recoveredsamples, especially in the deepest part of the DDH2010-1borehole (Fig. 4). Still, the uncertainty envelope around theestimated ice content profile shows significant verticalheterogeneity. From the recovered cores the calculated
Fig. 4. Stratigraphy, core recovery rate, ice content in the two boreholes and corresponding radar-wave velocity profiles obtained from theanalysis of the CMP data; the main stratigraphic discontinuities in the boreholes were used to constrain the conversion from NMO velocitiesto interval velocities. The ice content uncertainty is bounded by the potential minimum and maximum ice contents, corresponding to lossesof pure debris and pure ice, respectively.
Fig. 5. Ground temperature regime interpolated from the thermistor data between 1 and 25m depth in the DDH2010-1 borehole. The blackcrosses on the left axis show the location of the thermistors. The –0.28C and +0.28C isotherms are indicated in black as they represent theconfidence interval bound around the 08C isotherm.
Monnier and Kinnard: Rock glacier internal structure and composition 65
average ice content in the frozen portions of the DDH2010-1 borehole is 16% (uncertainty interval 9–63%). The averageice content in the 20m of the DDH2010-2 borehole is 27%(uncertainty interval 19–52%). The estimated ice contentwas linearly regressed onto the core recovery rate toexamine a possible causative link between the twovariables. Coefficients of determination (r2) of 0.08 and0.05 are found for DDH2010-1 and DDH2010-2, respect-ively, showing that the rate of core loss does not significantlyexplain the vertical variations in estimated ice content.
4.2. Ground temperaturesThe monitoring of the ground temperature in boreholeDDH2010-1 confirms the existence of a 5–7m thickseasonally unfrozen superficial layer (active layer) (Fig. 5).Below this, the ground is constantly frozen and, despite thelack of a few months of measurements needed to fulfill theaccepted definition, the rock glacier can be considered as apermafrost feature. However, the thermal state of thepermafrost appears singular since all temperature probesbetween 7 and 25m depth remain at 08C year-round (takinginto account the �0.28C accuracy of the probes). Thisphenomenon is well known at the seasonal timescale as the‘zero curtain effect’ (Outcalt and others, 1990; Hanson andHoelzle, 2004). The zero curtain effect is explained either bythe release of latent heat during the change of phase fromwater to ice or by the absorption of latent heat during thechange of phase from ice to water. Moreover, the temperaturemeasurements performed episodically (three times in theyear) in the DDH2010-2 borehole (not shown) confirmed thevalues measured in the DDH2010-1 borehole.
4.3. Ground-penetrating radar
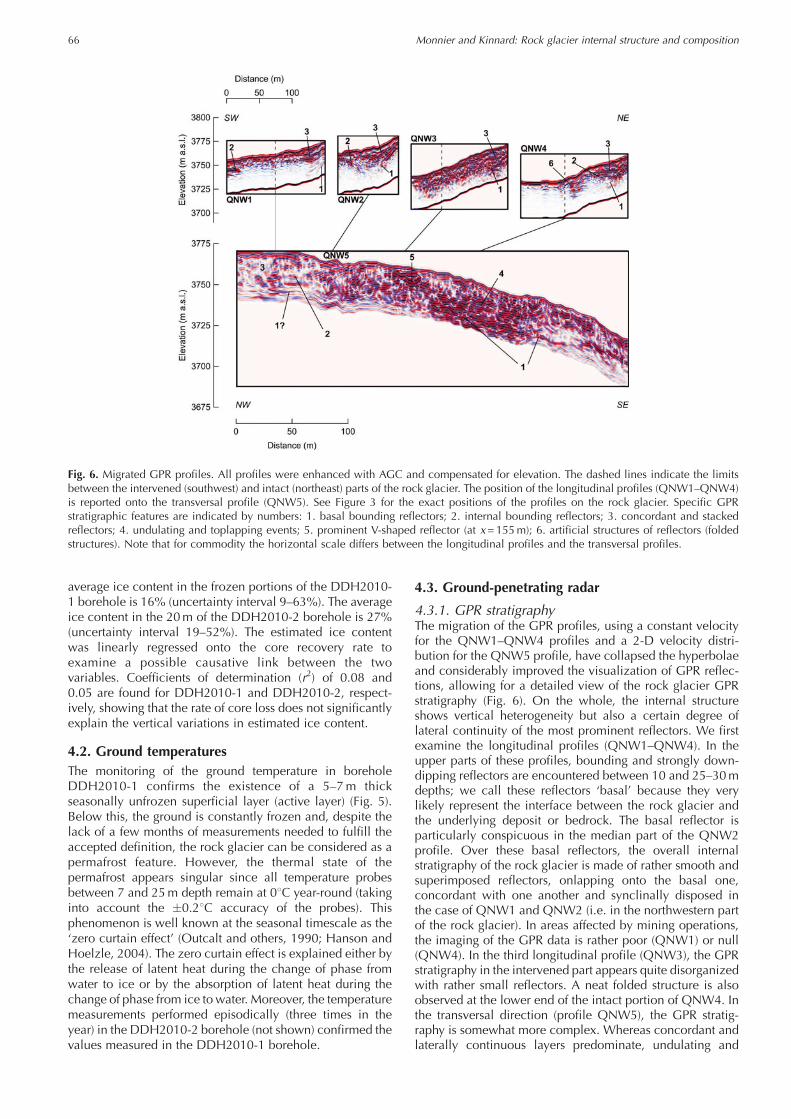
4.3.1. GPR stratigraphyThe migration of the GPR profiles, using a constant velocityfor the QNW1–QNW4 profiles and a 2-D velocity distri-bution for the QNW5 profile, have collapsed the hyperbolaeand considerably improved the visualization of GPR reflec-tions, allowing for a detailed view of the rock glacier GPRstratigraphy (Fig. 6). On the whole, the internal structureshows vertical heterogeneity but also a certain degree oflateral continuity of the most prominent reflectors. We firstexamine the longitudinal profiles (QNW1–QNW4). In theupper parts of these profiles, bounding and strongly down-dipping reflectors are encountered between 10 and 25–30mdepths; we call these reflectors ‘basal’ because they verylikely represent the interface between the rock glacier andthe underlying deposit or bedrock. The basal reflector isparticularly conspicuous in the median part of the QNW2profile. Over these basal reflectors, the overall internalstratigraphy of the rock glacier is made of rather smooth andsuperimposed reflectors, onlapping onto the basal one,concordant with one another and synclinally disposed inthe case of QNW1 and QNW2 (i.e. in the northwestern partof the rock glacier). In areas affected by mining operations,the imaging of the GPR data is rather poor (QNW1) or null(QNW4). In the third longitudinal profile (QNW3), the GPRstratigraphy in the intervened part appears quite disorganizedwith rather small reflectors. A neat folded structure is alsoobserved at the lower end of the intact portion of QNW4. Inthe transversal direction (profile QNW5), the GPR stratig-raphy is somewhat more complex. Whereas concordant andlaterally continuous layers predominate, undulating and
Fig. 6. Migrated GPR profiles. All profiles were enhanced with AGC and compensated for elevation. The dashed lines indicate the limitsbetween the intervened (southwest) and intact (northeast) parts of the rock glacier. The position of the longitudinal profiles (QNW1–QNW4)is reported onto the transversal profile (QNW5). See Figure 3 for the exact positions of the profiles on the rock glacier. Specific GPRstratigraphic features are indicated by numbers: 1. basal bounding reflectors; 2. internal bounding reflectors; 3. concordant and stackedreflectors; 4. undulating and toplapping events; 5. prominent V-shaped reflector (at x=155m); 6. artificial structures of reflectors (foldedstructures). Note that for commodity the horizontal scale differs between the longitudinal profiles and the transversal profiles.
Monnier and Kinnard: Rock glacier internal structure and composition66
overlapping reflectors are also identified. A basal boundingreflector can be traced quite neatly over the lower (southeast)part of the profile at �25m depth, but fades toward thenorthwest end.
4.3.2. Radar-wave velocityThe vertical profiles of the radar-wave velocity obtainedfrom the CMP data near the boreholes exhibit noticeablevariations (Fig. 4). In the top few meters corresponding to theunfrozen active layer, the velocity is typically �0.15mns–1
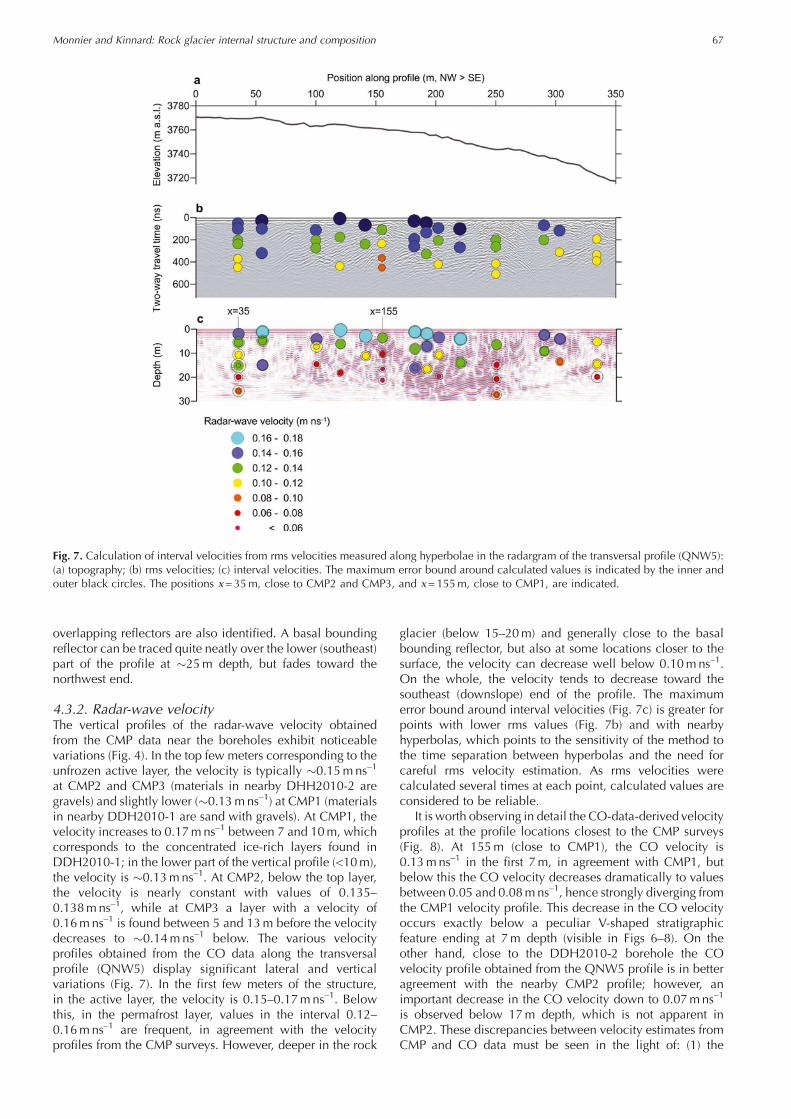
at CMP2 and CMP3 (materials in nearby DHH2010-2 aregravels) and slightly lower (�0.13mns–1) at CMP1 (materialsin nearby DDH2010-1 are sand with gravels). At CMP1, thevelocity increases to 0.17mns–1 between 7 and 10m, whichcorresponds to the concentrated ice-rich layers found inDDH2010-1; in the lower part of the vertical profile (<10m),the velocity is �0.13mns–1. At CMP2, below the top layer,the velocity is nearly constant with values of 0.135–0.138mns–1, while at CMP3 a layer with a velocity of0.16mns–1 is found between 5 and 13m before the velocitydecreases to �0.14mns–1 below. The various velocityprofiles obtained from the CO data along the transversalprofile (QNW5) display significant lateral and verticalvariations (Fig. 7). In the first few meters of the structure,in the active layer, the velocity is 0.15–0.17mns–1. Belowthis, in the permafrost layer, values in the interval 0.12–0.16mns–1 are frequent, in agreement with the velocityprofiles from the CMP surveys. However, deeper in the rock
glacier (below 15–20m) and generally close to the basalbounding reflector, but also at some locations closer to thesurface, the velocity can decrease well below 0.10mns–1.On the whole, the velocity tends to decrease toward thesoutheast (downslope) end of the profile. The maximumerror bound around interval velocities (Fig. 7c) is greater forpoints with lower rms values (Fig. 7b) and with nearbyhyperbolas, which points to the sensitivity of the method tothe time separation between hyperbolas and the need forcareful rms velocity estimation. As rms velocities werecalculated several times at each point, calculated values areconsidered to be reliable.
It is worth observing in detail the CO-data-derived velocityprofiles at the profile locations closest to the CMP surveys(Fig. 8). At 155m (close to CMP1), the CO velocity is0.13mns–1 in the first 7m, in agreement with CMP1, butbelow this the CO velocity decreases dramatically to valuesbetween 0.05 and 0.08mns–1, hence strongly diverging fromthe CMP1 velocity profile. This decrease in the CO velocityoccurs exactly below a peculiar V-shaped stratigraphicfeature ending at 7m depth (visible in Figs 6–8). On theother hand, close to the DDH2010-2 borehole the COvelocity profile obtained from the QNW5 profile is in betteragreement with the nearby CMP2 profile; however, animportant decrease in the CO velocity down to 0.07mns–1
is observed below 17m depth, which is not apparent inCMP2. These discrepancies between velocity estimates fromCMP and CO data must be seen in the light of: (1) the
Fig. 7. Calculation of interval velocities from rms velocities measured along hyperbolae in the radargram of the transversal profile (QNW5):(a) topography; (b) rms velocities; (c) interval velocities. The maximum error bound around calculated values is indicated by the inner andouter black circles. The positions x=35m, close to CMP2 and CMP3, and x=155m, close to CMP1, are indicated.
Monnier and Kinnard: Rock glacier internal structure and composition 67
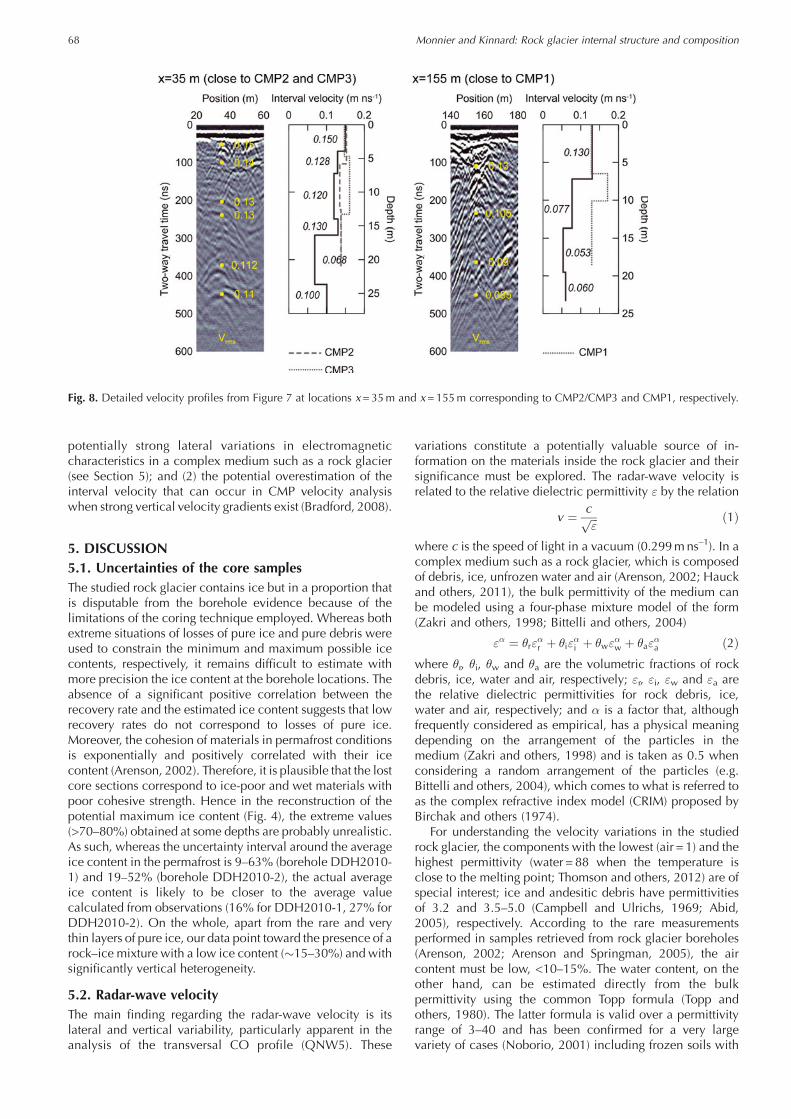
potentially strong lateral variations in electromagneticcharacteristics in a complex medium such as a rock glacier(see Section 5); and (2) the potential overestimation of theinterval velocity that can occur in CMP velocity analysiswhen strong vertical velocity gradients exist (Bradford, 2008).
5. DISCUSSION5.1. Uncertainties of the core samplesThe studied rock glacier contains ice but in a proportion thatis disputable from the borehole evidence because of thelimitations of the coring technique employed. Whereas bothextreme situations of losses of pure ice and pure debris wereused to constrain the minimum and maximum possible icecontents, respectively, it remains difficult to estimate withmore precision the ice content at the borehole locations. Theabsence of a significant positive correlation between therecovery rate and the estimated ice content suggests that lowrecovery rates do not correspond to losses of pure ice.Moreover, the cohesion of materials in permafrost conditionsis exponentially and positively correlated with their icecontent (Arenson, 2002). Therefore, it is plausible that the lostcore sections correspond to ice-poor and wet materials withpoor cohesive strength. Hence in the reconstruction of thepotential maximum ice content (Fig. 4), the extreme values(>70–80%) obtained at some depths are probably unrealistic.As such, whereas the uncertainty interval around the averageice content in the permafrost is 9–63% (borehole DDH2010-1) and 19–52% (borehole DDH2010-2), the actual averageice content is likely to be closer to the average valuecalculated from observations (16% for DDH2010-1, 27% forDDH2010-2). On the whole, apart from the rare and verythin layers of pure ice, our data point toward the presence of arock–ice mixture with a low ice content (�15–30%) and withsignificantly vertical heterogeneity.
5.2. Radar-wave velocityThe main finding regarding the radar-wave velocity is itslateral and vertical variability, particularly apparent in theanalysis of the transversal CO profile (QNW5). These
variations constitute a potentially valuable source of in-formation on the materials inside the rock glacier and theirsignificance must be explored. The radar-wave velocity isrelated to the relative dielectric permittivity " by the relation
v ¼ cffiffiffi
"p ð1Þ
where c is the speed of light in a vacuum (0.299mns–1). In acomplex medium such as a rock glacier, which is composedof debris, ice, unfrozen water and air (Arenson, 2002; Hauckand others, 2011), the bulk permittivity of the medium canbe modeled using a four-phase mixture model of the form(Zakri and others, 1998; Bittelli and others, 2004)
"� ¼ �r"�r þ �i"
�i þ �w"
�w þ �a"
�a ð2Þ
where �r, �i, �w and �a are the volumetric fractions of rockdebris, ice, water and air, respectively; "r, "i, "w and "a arethe relative dielectric permittivities for rock debris, ice,water and air, respectively; and � is a factor that, althoughfrequently considered as empirical, has a physical meaningdepending on the arrangement of the particles in themedium (Zakri and others, 1998) and is taken as 0.5 whenconsidering a random arrangement of the particles (e.g.Bittelli and others, 2004), which comes to what is referred toas the complex refractive index model (CRIM) proposed byBirchak and others (1974).
For understanding the velocity variations in the studiedrock glacier, the components with the lowest (air = 1) and thehighest permittivity (water = 88 when the temperature isclose to the melting point; Thomson and others, 2012) are ofspecial interest; ice and andesitic debris have permittivitiesof 3.2 and 3.5–5.0 (Campbell and Ulrichs, 1969; Abid,2005), respectively. According to the rare measurementsperformed in samples retrieved from rock glacier boreholes(Arenson, 2002; Arenson and Springman, 2005), the aircontent must be low, <10–15%. The water content, on theother hand, can be estimated directly from the bulkpermittivity using the common Topp formula (Topp andothers, 1980). The latter formula is valid over a permittivityrange of 3–40 and has been confirmed for a very largevariety of cases (Noborio, 2001) including frozen soils with
Fig. 8. Detailed velocity profiles from Figure 7 at locations x=35m and x=155m corresponding to CMP2/CMP3 and CMP1, respectively.
Monnier and Kinnard: Rock glacier internal structure and composition68

ice (with an uncertainty of �0.025 cm3 cm–3; Smith andPatterson, 1984) and gravelly soils (Drungil and others,1989). Its applicability in our case is reinforced by theabsence of clay (confirmed by the observations in theboreholes) and the consolidated state of the rock glacier as apermafrost feature. The application of the Topp formula tothe interval velocities of transversal profile QNW5 yieldswater content values typically ranging between 0% and20%, but reaching as high as 46% (Fig. 9). High watercontents (>20%) generally occur below depths of 15–20m.At 35m, high water content is visible at the bottom of atypical syncline structure, where it is plausible that waterconvergence occurs. In two other cases (at 155 and 250malong the profile, respectively), high water contents con-centrate along a vertical segment. As the porosity of the drysediments (mostly gravels) of the rock glacier must bebetween 25% and 40% (Delleur, 1999), many of the watercontent values calculated here imply a saturation of thematerials. Some of the highest values may be partlyexplained by the propagation of the initial uncertainty onrms velocity determination to the interval velocity and watercontent calculations (Fig. 9). However, despite the possibleerrors, the data still suggest the occurrence of punctuallyhigh water contents, and values higher than 40%, in excessof porosity, must be explained by macro-porosity featuressuch as cracks or channels. These are quite plausible at thebase of the rock glacier and, in cases when the velocitydrops downward repeatedly such as seen at 155m along theprofile (Figs 6–9), imply the presence of water-filled cracks/conduits in the permafrost akin to those seen in glaciers andburied ice deposits (e.g. Moorman, 2005). The presence ofconcentrated water in such zones is supported by theprominent V-shaped reflector previously described at 155mand which may be interpreted as a funnel-type featurereaching down to 10m depth, perhaps linked to a crackbelow in which the water penetrates. Moreover, in theunmigrated data (Fig. 8), the column of hyperbolas andintercrossed reflectors at this position is reminiscent of thefeatures created by crevasses in glaciers (Moore and others,1999). High water contents are not necessarily incompatiblewith the presence of ice. Indeed it is possible to use Eqn (2)to simulate the radar-wave velocity from, for instance, afictive mixture composed of stable volumetric contents ofdebris (47.5%) and air (5%) and in which the ice (with an
initial maximum content of 47.5%, corresponding to asituation of pore ice in excess) is progressively replaced bywater. This leads us to consider that in such a medium radar-wave velocities decreasing as low as 0.06–0.07mns–1 canoccur while ice is present in the ground in small quantity(�10%).
Previous geophysical studies have already reported thepossibility of encountering considerable amounts of water inrock glaciers (Croce and Milana, 2002; Musil and others,2006; Hauck and others, 2011). Arenson and others (2002)reported that during drillings into the Murtel-Corvatsch rockglacier, Switzerland, water was found at the permafrost tablebut also at greater depths inside the permafrost body. Thehydrology of rock glaciers is known to be complex (Burgerand others, 1999). Conceptual models of rock glacierhydrology have usually considered the permafrost core inrock glaciers as an impermeable body with water flowingrapidly over it through the superficial active layer (supra-permafrost flow) and more slowly below it (sub-permafrostflow) (Giardino and others, 1992; Burger and others, 1999;Williams and others, 2006). Using dye-tracing experiments,Tenthorey (1992, 1994) also deduced the existence of waterflowing through an inactive rock glacier (‘intra-flow’), withno supra-permafrost flow, a phenomenon that was attributedto the ice-poor nature of the material and the occurrence ofthermokarst subsidence within the rock glacier. The con-ceptual model of Tenthorey (1992, 1994) included watertransfer from the active layer down the rock glacier throughunfrozen channels. Our interpretation of GPR-derivedlocally high water content in our studied rock glacier is inagreement with these observations and models. Theoccurrence of unfrozen water within the rock glacier is alsocompatible with the constant zero-curtain effect observed inthe ground temperatures and which may indeed expresspermafrost degradation in the rock glacier. The idea of amelting structure with water at near-melting-point tempera-ture and percolating at depth is further supported by thepoor state of the core samples encountered below 19–20mdepth in borehole DDH2010-1.
Finally, the generally high velocities (0.15–0.17mns–1)observed in the first few meters of the structure (active layerof the rock glacier) must be explained by the larger volumesof air within the layer. For example, if we consider the activelayer to be devoid of unfrozen water and ice, a velocity of
Fig. 9. Water fractions along the transversal profile (QNW5) estimated from the application of the Topp formula to calculated intervalvelocities (see Fig. 7). The maximum error bound around water content values, which arises from maximum errors on calculated intervalvelocities, is indicated by the inner and outer black circles.
Monnier and Kinnard: Rock glacier internal structure and composition 69
0.16mns–1 yields an air content of 22% using Eqn (2). Thespecial case of the lower velocity (0.13mns–1) in the activelayer of the CMP1 profile has to be explained by the finermaterials (likely to retain water) observed in the coresamples from the drilling.
5.3. GPR stratigraphy and rock glacier developmentThe prominent bounding reflectors encountered at depth inboth the longitudinal and transversal profiles of the rockglacier are interpreted as the basal contact between the rockglacier and the underlying sediments or bedrock. They givean approximation of the rock glacier thickness. The lattervaries between 10m in its upper part, close to the talusslopes, and 30m or even more in its lower part. The poorimaging of the GPR data in the areas affected by miningoperations prevents a more precise estimation. The reducedGPR imaging in the areas affected by mining (construction ofplatforms and later infilling by mining waste rocks) is stillpoorly understood. It may result from an increase in thematerial conductivity due to compaction of the materials(Johnson and others, 2001) and thus increased attenuation ofthe radar signal, and from the disruption of the stratigraphydue to operation of machinery and the overburden pressureof the waste rocks, as suggested by the stratigraphy(disorganization, folded structure) in the lower part ofQNW4. In areas where the original structure is clearlyvisible, the rather smooth stratigraphy together with thesteady surface topography supports the idea of a rock glacierthat has undergone somewhat more extensive than com-pressive deformations during flow. The stacked, mostlyconcordant and quite laterally – along longitudinal profilesand also to some extent along the transversal profile –continuous GPR layers of the rock glacier could be regardedas contradicting the lateral variations of the radar-wavevelocity. In fact, the lateral variations of the radar-wavevelocity appear more as punctual discontinuities than acontinuously irregular phenomenon; furthermore, they wereonly highlighted along a transversal axis (QNW5) and notalong longitudinal profiles. Thus, the GPR stratigraphy tendsto suggest a sequential development of the landform. Theapparently heterogeneous vertical distribution of ice furthersupports this scenario. In the hypothesis that little ice was lostduring the retrieval of core samples from the boreholes, thestructure of the studied rock glacier appears as a successionof layers alternatively poor and rich in pore ice. Pore icewithin rock glaciers can originate from refreezing of rain- ormeltwater percolating from the surface, groundwater see-page from upslope, or snow burial (Haeberli and Muhll,1996; Haeberli and others, 2006). Below steep slopes theorigin of snow can be avalanches, as highlighted in arcticregions (Humlum and others, 2007). Hence the ice-poorlayers may represent dry periods with limited or no formationof pore ice, while the ice-rich layers may represent wetperiods with enhanced formation of pore ice. Avalanchemaps for the mine area indicate important avalanche activityon the southwest-facing slopes of Quebrada NW, whichsuggests that snow avalanching and consequent snow burialis likely to be an important process for the formation ofinterstitial ice in the rock glaciers in Quebrada NW.
6. CONCLUSIONWe have presented a unique combination of sediment cores,ground temperature records and GPR data collected on a
small valley-side rock glacier in Quebrada NW in the semi-arid Andes of Chile. Particular attention was paid to theanalysis and processing of the GPR data in order to derivethe distribution of the radar-wave velocity and reconstructthe GPR stratigraphy. The combined analysis of these dataprovides information on the inner structure and materials ofthe rock glacier. Our study has led to the followingconclusions: (1) the rock glacier is a permafrost landformwith a thermal state close to the melting point. Given theaverage air temperature registered at the site (+0.58C), theobserved zero curtain is thought to reflect current permafrostdegradation; (2) the rock glacier is up to 30m thick towardits terminus, though uncertainty remains in the lowerintervened parts where the GPR signal was stronglyattenuated; (3) the rock glacier is a layered landform withvertical alternations between ice-poor and ice-rich layers,where the extracted ice content varies between 15% and30%; (4) in line with the near-melting thermal regime, theoccurrence of low radar-wave velocities in various locationswithin the rock glacier suggests that water stagnates orcirculates through the pores of the structure and throughpossible conduits in the permafrost, adding to the evidencethat the permafrost in the rock glacier is currently degrading.Future works on this site will aim to improve the geophysicalmapping of the internal structure by combining differentgeophysical methods and more advanced modeling of thegeophysical properties.
ACKNOWLEDGEMENTSThis study was funded by Minera Los Pelambres (MLP)through research contract CS-581. The MLP Company wasinformed of the content of the manuscript but did notinterfere in its production. We thank the partners at MLP forproviding technical and logistic support during the fieldsurveys. Roberto Garrido, Jorge Marın and Rodrigo Saezprovided assistance during field campaigns and with theprocessing of remote-sensing and GIS data. We thankChristian Camerlynck and Faycal Rejiba for advice on theprocessing of GPR data. We also thank Helmut Hausmannand an anonymous reviewer for valuable and constructivecomments on the manuscript.
REFERENCESAbid MM (2005) Spacecraft sensors. Wiley, ChichesterAngillieri MYE (2009) A preliminary inventory of rock glaciers at
308S latitude, Cordillera Frontal of San Juan, Argentina. Quat.Int., 195(1–2), 151–157 (doi: 10.1016/j.quaint.2008.06.001)
Annan AP (2003) Ground penetrating radar: principles, proceduresand applications. Sensors and Software Inc., Mississauga, Ont.
Arenson LU (2002) Unstable Alpine permafrost: a potentiallyimportant natural hazard – variations of geotechnical behaviourwith time and temperature. (PhD thesis, ETH Zurich)
Arenson LU and Jakob M (2010) The significance of rock glaciers inthe dry Andes – a discussion of Azocar and Brenning (2010) andBrenning and Azocar (2010). Permafrost Periglac. Process.,21(3), 282–285 (doi: 10.1002/ppp.693)
Arenson LU and Springman SM (2005) Triaxial constant stress andconstant strain rate tests on ice-rich permafrost samples. Can.Geotech. J., 42(2), 412–430 (doi: 10.1139/t04-111)
Arenson L, Hoelzle M and Springman S (2002) Borehole deform-ation measurements and internal structure of some rock glaciersin Switzerland. Permafrost Periglac. Process., 13(2), 117–135(doi: 10.1002/ppp.414)
Monnier and Kinnard: Rock glacier internal structure and composition70
Azocar G and Brenning A (2008) Intervenciones de glaciaresrocosos en minera Los Pelambres, region de Coquimbo, Chile.Tech. Rep. University of Waterloo, Waterloo, Ont.
Azocar GF and Brenning A (2010) Hydrological and geomorpho-logical significance of rock glaciers in the dry Andes, Chile(27–338S). Permafrost Periglac. Process., 21(1), 42–53 (doi:10.1002/ppp.669)
Barsch D (1996) Rockglaciers: indicators for the present and formergeoecology in high mountain environments. (Springer Series inPhysical Environment 16) Springer, Berlin
Barsch D, Fierz H and Haeberli W (1979) Shallow core drilling andborehole measurements in the permafrost of an active rockglacier near the Grubengletscher, Wallis, Swiss Alps. Arct. Alp.Res., 11(2), 215–228
Bastida E (2006) Sustainable investment in the minerals sector: re-examining the paradigm. EconPapers, 6(4), 401–406 (doi:10.1007/s10784-006-9019-x)
Bastida E, Irarrazabal R and Labo R (2005) Mining investment andpolicy developments: Argentina, Chile and Peru. CEPMLPInternet J., 16, Article 10. http://www.dundee.ac.uk/cepmlp/journal/html/Vol16/Vol16_10.pdf
Berthling I (2011) Beyond confusion: rock glaciers as cryo-conditioned landforms. Geomorphology, 131(3–4), 98–106(doi: 10.1016/j.geomorph.2011.05.002)
Birchak RR, Gardner GC, Hipp JE and Victor JM (1974) Highdielectric constant microwave probes for sensing soil moisture.IEEE Proc., 62(1), 93–98 (doi: 10.1109/PROC.1974.9388)
Bittelli M, Flury M and Roth K (2004) Use of dielectric spectroscopyto estimate ice content in frozen porous media. Water Resour.Res., 40(W4), W04212 (doi: 10.1029/2003WR002343)
Bradford JH (2008) Measuring water content heterogeneity usingmultifold GPR with reflection tomography. Vadose Zone J., 7,184–193 (doi: 10.2136/vzj2006.0160)
Bradford JH, Nichols J, Mikesell TD and Harper JT (2009)Continuous profiles of electromagnetic wave velocity andwater content in glaciers: an example from Bench Glacier,Alaska, USA. Ann. Glaciol., 50(51), 1–9 (doi: 10.3189/172756409789097540)
Brandt O, Langley K, Kohler J and Hamran S-E (2007) Detection ofburied ice and sediment layers in permafrost using multi-frequency ground-penetrating radar: a case examination onSvalbard. Remote Sens. Environ., 111(2–3), 212–227 (doi:10.1016/j.rse.2007.03.025)
Brenning A (2005) Climatic and geomorphological controls of rockglaciers in the Andes of central Chile: combining statisticalmodelling and field mapping. (PhD thesis, Humboldt-Universi-tat zu Berlin)
Brenning A (2010) The significance of rock glaciers in the dry Andes– reply to L. Arenson and M. Jakob. Permafrost Periglac.Process., 21(3), 286–288 (doi: 10.1002/ppp.702)
Brenning A and Azocar GF (2010) Minerıa y glaciares rocosos:impactos ambientales, antecedentes polıticos y legales, yperspectivas futuras. Rev. Geogr. Norte Grande, 47, 143–158
Burger KC, Degenhardt JJJ and Giardino JR (1999) Engineeringgeomorphology of rock glaciers. Geomorphology, 31(1–4),93–132 (doi: 10.1016/S0169-555X(99)00074-4)
Campbell MJ and Ulrichs J (1969) Electrical properties of rocks andtheir significance for lunar radar observations. J. Geophys. Res.,74(25), 5867–5881 (doi: 10.1029/JB074i025p05867)
Centro de Estudios Avanzadas en Zonas Aridas (CEAZA) (2012)Monitoreo de los glaciares rocosos en la Quebrada NW, area dela Mina Los Pelambres (MLP). Unpublished report
Croce FA and Milana JP (2002) Internal structure and behaviour of arock glacier in the arid Andes of Argentina. Permafrost Periglac.Process., 13(4), 289–299 (doi: 10.1002/ppp.431)
Degenhardt JJJ (2009) Development of tongue-shaped andmultilobate rock glaciers in alpine environments – inter-pretations from ground-penetrating radar surveys. Geo-morphology, 109(3–4), 94–107 (doi: 10.1016/j.geomorph.2009.02.020)
Degenhardt JJJ, Giardino JR and Junck MB (2003) GPR surveyof a lobate rock glacier in Yankee Boy Basin, Colorado,USA. In Bristow CS and Jol HM eds. Ground-penetratingradar in sediments. (Special Publication 211) GeologicalSociety, London
Delleur JW (1999) The handbook of groundwater engineering. CRCPress/Springer, Boca Raton, FL/Heidelberg
DISSAM Securite (2002) Estudio glaciar de roca, emplazamientobotadero. (Tech. Rep. 411) Unpublished report
Dix C (1955) Seismic velocities from surface measurements.Geophysics, 20(1), 68–86 (doi: 10.1190/1.1438126)
Drungil CEC, Abt K and Gish TJ (1989) Soil moisture determinationin gravelly soils with time domain reflectometry. Trans. Am. Soc.Agric. Eng., 32(1), 177–180
Eisen O, Nixdorf U, Wilhelms F and Miller H (2002) Electro-magnetic wave speed in polar ice: validation of the common-midpoint technique with high-resolution dielectric-profiling and�-density measurements. Ann. Glaciol., 34, 150–156 (doi:10.3189/172756402781817509)
Geoblast SA (2009) Estudio geoelectrico en zona de avalanchas,sector mina Los Pelambres. Unpublished report
Geoestudios Ltda (1998) Estudio de glaciares de roca en el area dela mina Los Pelambres. Unpublished report
Giardino JR, Vitek JD and DeMorett JL (1992) A model of watermovement in rock glaciers and associated water characteristics.In Dixon JC and Abrahams AD eds. Periglacial geomorphology.Wiley, Chichester, 159–184
Haeberli W and Muhll DV (1996) On the characteristics andpossible origins of ice in rock glacier permafrost. Z. Geomorph.,104, 43–57
Haeberli W, Huder J, Keusen HR, Pika J and Rothlisberger H (1988)Core drilling through rock glacier–permafrost. In Senneset K ed.Proceedings of the 5th International Conference on Permafrost,2–5 August 1988, Trondheim, Norway, Vol. 2. Tapir Publishers,Trondheim, 937–942
Haeberli W and 10 others (2006) Permafrost creep and rock glacierdynamics. Permafrost Periglac. Process., 17(3), 189–214 (doi:10.1002/ppp.561)
Hanson S and Hoelzle M (2004) The thermal regime of the activelayer at the Murtel rock glacier based on data from 2002.Permafrost Periglac. Process., 15(3), 273–282 (doi: 10.1002/ppp.499)
Hauck C, Bottcher M and Maurer H (2011) A new model forestimating subsurface ice content based on combined electricaland seismic data sets. Cryosphere, 5(2), 453–468 (doi: 10.5194/tc-5-453-2011)
Hausmann H, Krainer K, Bruckl E and Mostler W (2007)Internal structure and ice content of Reichenkar rock glacier(Stubai Alps, Austria) assessed by geophysical investigations.Permafrost Periglac. Process., 18(4), 351–367 (doi: 10.1002/ppp.601)
Humlum O, Christiansen HH and Juliussen H (2007) Avalanche-derived rock glaciers in Svalbard. Permafrost Periglac. Process.,18(1), 75–88 (doi: 10.1002/ppp.580)
International Copper Study Group (ICSG) (2010) The world copperfactbook 2010. International Copper Study Group, Lisbonhttp://www.icsg.org
Johnson CK, Doran JW, Duke HR, Wienhold BJ, Eskridge KM andShanahan JF (2001) Field-scale electrical conductivity mappingfor delineating soil condition. Soil Sci. Soc. Am. J., 65(6), 1829–1837 (doi: 10.2136/sssaj2001.1829)
Jol HM (2009) Ground-penetrating radar theory and applications.Elsevier Science, Amsterdam
Lehmann F and Green AG (2000) Topographic migration ofgeoradar data: implications for acquisition and processing.Geophysics, 65(3), 836–848 (doi: 10.1190/1.1444781)
Leopold M, Williams MW, Caine N, Volkel J and Dethier D (2011)Internal structure of the Green Lake 5 rock glacier, ColoradoFront Range, USA. Permafrost Periglac. Process., 22(2), 107–119(doi: 10.1002/ppp.706)
Monnier and Kinnard: Rock glacier internal structure and composition 71
Marangunic C (2010) Physical characteristics of rock glaciers in themountains of central Chile. International Glaciological Con-ference on Ice and Climate Change: A View from the South,1–3 February 2010, Valdivia, Chile. http://www.geostudias.cl/esp/archivos.php?tipo=3
Maurer H and Hauck C (2007) Geophysical imaging of alpine rockglaciers. J. Glaciol., 53(180), 110–120 (doi: 10.3189/172756507781833893)
Milana JP and Guell A (2008) Diferencias mecanicas e hıdricas delpermafrost en glaciares de rocas glacigenicos y criogenicos,obtenidas de datos sısmicos en El Tapado, Chile. Rev. Asoc.Geol. Argentina, 63(3), 310–325
Monnier S, Camerlynck C and Rejiba F (2008) Ground-penetratingradar survey and stratigraphic interpretation of the Plan du Lacrock glaciers, Vanoise Massif, northern French Alps. PermafrostPeriglac. Process., 19(1), 19–30 (doi: 10.1002/ppp.610)
Monnier S, Camerlynck C, Fejiba F, Kinnard C, Feuillet T andDhemaied A (2011) Structure and genesis of the Thabor rockglacier (northern French Alps) determined from morphologicaland ground-penetrating radar surveys. Geomorphology,134(3–4), 269–279 (doi: 10.1016/j.geomorph.2011.07.004)
Moore JC and 8 others (1999) High-resolution hydrothermalstructure of Hansbreen, Spitsbergen, mapped by ground-penetrating radar. J. Glaciol., 45(151), 524–532
Moorman BJ (2005) Glacier–permafrost hydrological inter-connectivity: Stagnation Glacier, Bylot Island, Canada. In HarrisC and Murton JB eds. Cryospheric systems: glaciers andpermafrost. (Special Publication 242) Geological Society,London, 63–74
Musil M, Maurer HR, Holliger K and Green AG (2006) Internalstructure of an alpine rock glacier based on crosshole georadartraveltimes and amplitudes. Geophys. Prospect., 54(3), 273–285(doi: 10.1111/j.1365-2478.2006.00534.x)
Noborio K (2001) Measurement of soil water content and electricalconductivity by time domain reflectometry: a review. Comput.Electron. Agr., 31(3), 213–237 (doi: 10.1016/S0168-1699(00)00184-8)
Outcalt SI, Nelson FE and Hinkel KM (1990) The zero-curtaineffect: heat and mass transfer across an isothermal region infreezing soil. Water Resour. Res., 26(7), 1509–1516 (doi:10.1029/WR026i007p01509)
PalmerMA and 11 others (2010)Mountaintopmining consequences.Science, 327(5962), 148–149 (doi: 10.1126/science.1180543)
Schrott L (1996) Some geomorphological–hydrological aspects ofrock glaciers in the Andes (San Juan, Argentina). Z. Geomorph.,104, 161–173
Sillitoe RH (2010) Porphyry copper systems. Econ. Geol., 105(1),3–41 (doi: 10.2113/gsecongeo.105.1.3)
Smith MWand Patterson DE (1984) Determining the unfrozen watercontent in soils by time-domain reflectometry. Atmos.–Ocean,22(2), 261–263 (doi: 10.1080/07055900.1984.9649198)
Stolt RH (1978) Migration by Fourier transform. Geophysics, 43(1),23–48 (doi: 10.1190/1.1440826)
Tenthorey G (1992) Perennial neves and the hydrology of rockglaciers. Permafrost Periglac. Process., 3(3), 247–252 (doi:10.1002/ppp.3430030313)
Tenthorey G (1994) Hydrologie liee aux glaciers rocheux, Hout-Valde Rechy (Nax, VS). Bull. Murith., 112, 97–116
Thomson LI, Osinski GR and Pollard WH (2012) The dielectricpermittivity of terrestrial ground ice formations: considerationsfor planetary exploration using ground-penetrating radar.J. Geophys. Res., 117(E9), E09003 (doi: 10.1029/2012JE004053)
Topp GC, Davis JL and Annan AP (1980) Electromagneticdetermination of soil water content: measurements in coaxialtransmission lines. Water Resour. Res., 16(3), 574–582 (doi:10.1029/WR016i003p00574)
Trombotto D, Buk E and Hernandez J (1999) Rock glaciers in theSouthern Central Andes (appr. 338 S.L.) Mendoza, Argentina: areview. Bamberger Geogr. Schrift. 19. Selbstverlag des FachesGeographie an der Universitat Bamberg, Bamberg, 145–173
Van Everdingen RO ed. (2005) Multi-language glossary of perma-frost and related ground-ice terms. National Snow and Ice DataCenter/World Data Center for Glaciology, Boulder, CO
Washburn AL (1979) Geocryology: a survey of periglacial processesand environments. Edward Arnold, London
Williams MW, Knauf M, Caine N, Liu F and Verplanck PL (2006)Geochemistry and source waters of rock glacier outflow,Colorado Front Range. Permafrost Periglac. Process., 17(1),13–33 (doi: 10.1002/ppp.535 )
Yilmaz O and Doherty SM (2001) Seismic data analysis: processing,inversion and interpretation of seismic data. (Investigations inGeophysics 10) Society of Exploration Geophysicists, Tulsa, OK
Zakri T, Laurent J-P and Vauclin M (1998) Theoretical evidence for‘Lichtenecker’s mixture formulae’ based on the effectivemedium theory. J. Phys. D, 31(3), 1589 (doi: 10.1088/0022-3727/31/13/013)
Monnier and Kinnard: Rock glacier internal structure and composition72