international aid to palestinians feeds the israeli economy
DESCRIPTION
According to the report’s author, the study has ‘tremendous moral implications’ which suggest that donors to Palestine may become unwitting ‘accomplices to Israel’s crimes.’About 72% of aid sent to Palestine is diverted or subverted in Israel's economy.TRANSCRIPT
1
How Much International Aid to Palestinians Ends Up in the
Israeli Economy?
Shir Hever
Aid Watch
September 2015
1. Introduction
The Israeli occupation of the West Bank and Gaza Strip is a prominent issue within the
international community. Heavily reported by the global media, it also features on the
agenda of governments around the world who seek a stake in shaping the future of
Palestine. International aid to Palestinians is one of the highest per capita aid
disbursements in the world.1 Yet the simple fact remains that despite over two decades of
sustained aid, the occupation has not come to an end and Palestinians are not yet sovereign
in their own country. The question that arises is not only whether aid is effective, but
whether it also causes harm.
#
We estimate that at least 72% of international aid ends up in the Israeli economy.
#
The main harm discussed here is how international aid efforts ultimately reinforce the
Israeli economy and subsidize the Israeli government in financing the occupation. There
are several means (described below) by which money intended for aid projects to benefit
Palestinians ends up being paid to Israeli companies and to the Israeli government.
1 The OPT is the world’s tenth biggest recipient of per capita aid accumulated over the years 1994-2011.
The top nine (starting from the highest) are: Palau, Tuvalu, Marshall Islands, Federal States of Micronesia, New Caledonia, Israel, French Polynesia, Tonga and Cape Verde. It is of special interest that Israel is the sixth biggest recipient of per capita aid, positioned above the OPT. The data are from the World Bank, 2015 and Sharp, 2014.
2
Although this fact is well known and acknowledged by aid workers themselves (Hoseini,
2006; Karmi, 2005), the challenge remains to quantify the actual sums involved: How much
of every dollar or euro spent by donors ends up in the Israeli economy rather than assisting
Palestinians?
An article by Nikki Tillekens in 2010 conducted the first estimate of this figure. By
tracing the connection between the trade deficit between the OPT and Israel on the one
hand, and international aid to the OPT on the other, Tillekens found a 71% correlation
between aid to the OPT and the trade imbalance between the OPT and Israel. In other
words, aid money is used to purchase goods and services from Israeli companies. The
sustained trade surplus Israel enjoys with the OPT, and the fact that the trade surplus is
financed with foreign currency, has contributed substantially to Israel’s economic stability,
and therefore allowed the Israeli government to invest ever-increasing resources in the
occupation of the OPT (Swirski, 2008). The aim of this paper is to update and expand the
argument of Tillekens, and to assess the proportion of aid to the OPT which ends up in the
Israeli economy.
#
Aid has not brought the two-state solution closer.
#
2. How and Why is Aid Diverted and Subverted?
Although aid is presented as a mechanism to facilitate the two-state solution, 22 years of
sustained aid have failed to achieve this goal (Taghdisi-Rad, 2010; Wilderman & Tartir,
2013). Furthermore, many aid workers have confessed in interviews that they feel that
their efforts, rather than empowering Palestinians to achieve freedom, help to sustain the
occupation by relieving the Israeli government from its responsibilities towards the
occupation population under international humanitarian law (IHL) (Hoseini, 2006; Karmi,
2005).
The continued occupation and the subsequent international aid efforts have allowed
donors and aid agencies ample time to observe the ways in which Israeli policies divert aid,
and to understand that their activities have become a factor that enables the occupation.
3
Conceptually, a distinction should be made between aid which is “diverted,” meaning that
the money never reaches the Palestinian population because of Israeli measures such as
taxes, port fees, transportation fees, etc., and aid which is “subverted,” meaning money
received by the Palestinian population, but in a way that supports the Israeli economy and
helps to fund the occupation, as in the purchase of Israeli products. Unfortunately, we lack
the data to distinguish between the two. The question of whether aid has become a tool in
perpetuating the occupation remains relevant even if we cannot distinguish between
diverted and subverted aid (Murad, 2014).
The economic agreement between the PLO negotiating team and Israel in April 1994,
the “Paris Accords,” created conditions conducive to sourcing materials from Israeli
companies by aid organizations (UNCTAD, 2014). Restrictions imposed on Palestinian
movement by the Israeli authorities further contribute to aid agencies sourcing
transportation services from Israeli companies. USAID went so far as to use Palestinian aid
money to finance scanners and other equipment for the Israeli military checkpoints
through which aid shipments must cross (Taghdisi-Rad, 2010:104). The currency and
customs union imposed by Israel forces aid, in money and in kind, to flow in Israeli
currency and donors must convert their funds into Israeli currency for the disbursement of
aid (UNCTAD, 2014). All these factors contribute to transforming aid and the occupation
into an important export sector for the Israeli economy, a source of foreign currency, and a
source of income for many Israeli companies (BOI, 2014:54-55). Port and storage fees are
paid to Israeli companies or to government institutions. On top of that, the Israeli
authorities levy special taxes on aid agencies, termed “security fees,” and levied from every
truck carrying goods into the OPT. The largest aid distributor, UNRWA, reported that in
2001 it paid US$2.5 million in taxes to Israel, nearly 1% of its total budget (Deen, 2002).
#
Israeli policies cause aid to be diverted and subverted.
#
Although the State of Palestine was recognized as a non-member state of the UN in
November 2012, the Israeli military occupation persists in both the West Bank and the
Gaza Strip. Israel remains the only sovereign government in the area of Israel/Palestine,

4
and the Israeli authorities wield control over border passes, seaports, airports, customs
and currency. This control enables the Israeli authorities to determine the conditions for
aid and to divert it to goods and services provided by Israeli companies, while restricting
and hindering any kind of aid of which they do not approve (AIDA, 2011). Israeli
economists have identified an unwritten, but consistently-applied, Israeli policy that
prevents Palestinian economic development in sectors which could compete with the
Israeli economy. This policy has kept the Palestinian economy heavily dependent on that of
Israel. As a result, many of the goods and services required for aid projects are simply
unavailable in the Palestinian market and must be sourced from Israeli companies (Arnon
et. al., 1997:5-6). A clear example of this policy can be seen in the pharmaceutical sector, in
which Israeli companies enjoy a monopoly of the Palestinian market and Palestinian
companies are restricted in their freedom to compete (WhoProfits, 2012).
Palestinian economic dependency on Israel makes it impossible to differentiate
between legitimate and non-legitimate purchases of Israeli goods by aid agencies managing
projects in the OPT. In ordinary aid scenarios (such as relief following natural disasters),
aid agencies spend a portion of their budget to source goods and services from neighboring
countries. In the case of Israel/Palestine, Israel is not merely a “neighboring country” but is
the occupying power with the ultimate responsibility under international humanitarian
law to meet the needs of the population under its control (Waelbroeck & Aldershoff, 2014).
Therefore, any form of aid by third party countries that relieves Israel of its obligations, or
even that pays the Israeli government or Israeli companies for goods and services which
the Israeli government is obligated to provide, are considered here as a form of aid
subversion.
#
The trade imbalance between the OPT and Israel indicates deep economic dependency.
#
3. Methodology
The main methodological challenge in addressing the subversion of aid lies in how to
measure it. The lack of separation in currency and customs between the Israeli and the

5
Palestinian economies means that no statistical data exist to track money from aid projects
to its ultimate destination. Money flowing into the Israeli economy from aid agencies
contributes to Israel’s overall balance of payments because the foreign currency is
converted into Israeli currency in the process of conducting transactions. The Israeli
authorities have not developed mechanisms to distinguish between exports to private
customers and companies, or exports to aid agencies. The Palestinian government does not
have the means to create this distinction.
The Israeli Central Bureau of Statistics (ICBS) and the Palestinian Central Bureau of
Statistics (PCBS) both measure the trade balance2 between Israel and the OPT. The
prolonged trade imbalance between Israel and the OPT is a testament to the economic
dependency of Palestinians on the Israeli economy, but it also poses an economic puzzle. If
Palestinians are able to purchase Israeli goods and services whose monetary value is
consistently higher than the value of goods and services provided by Palestinian workers
and companies to Israeli customers, how is the trade imbalance funded? A trade imbalance
is a common economic phenomenon between countries. In the long run, trade deficits are
financed through debt, investments and trade surplus with third-party countries. This is
not the case in Israel/Palestine because the Palestinian trade deficit in the years 2000-2014
was consistent at 27%-41% of the Palestinian GDP every year.3 This accumulates to a total
of 512% of the Palestinian GDP in this period alone. If the trade deficit was financed by
debt and investments, Israelis would privately own nearly everything in the OPT (which is
not the case). Since trade with Israel is larger than the OPT’s trade with all other countries
combined, the deficit can also not be financed by trade. The argument presented here is
that international aid can explain the origin of the funding of the trade deficit and of the
balance of payments. Aid enables a consistent trade imbalance, which has a substantial
impact on both the Palestinian and the Israeli economies.
2 The balance of trade is the difference between a country’s imports and exports. A trade deficit occurs
when imports are higher than exports. A balance of payments is the difference between foreign money entering and leaving the country. It includes the balance of trade, but also includes financial transfers, investments, gifts, loans and repayments, etc. A balance of payments deficit means that the country sends out more money than it receives.
3 Data based on UNCTAD, 2015, http://unctadstat.unctad.org/wds/TableViewer/tableView.aspx, accessed August 2015.

6
The article by Nikki Tillekens, titled 71% of Aid to the Palestinians Ends Up in the Israeli
Economy, was the first attempt to correlate the trade imbalance between the OPT and
Israel with the aid figures for the OPT to assess the proportion of aid used to finance the
trade deficit, and thereby contributing directly to the Israeli economy. The article surveyed
a short period of time: the nine years from 2000 to 2008, and relied on data from the PCBS.
#
The OPT trade deficit cannot be explained by debt or investments.
#
For this article, we have access to a slightly larger dataset and can cover the 14 years
from 2000 to 2013. We also have access to data on the trade deficit from the United Nations
Conference on Trade and Development (UNCTAD), which differs from PCBS data. The PCBS
collects trade data separately for trade in goods (PCBS, various years) and for trade in
services (PCBS, 2014). This is important because the OPT services sector actually has a
trade surplus: Palestinians sell more services (usually in the form of labor) to Israeli
companies and individuals than vice versa. Together, they comprise the trade balance
between Israel and the OPT.
UNCTAD, however, measures the balance of payments between the two economies. The
balance of payments is very similar to the trade balance: It measures not only trade in
goods and services, but also investments, fees and other money transfers. Restrictions
imposed by the Israeli authorities sometimes take the form of fees collected from
Palestinian companies and individuals. The balance of payments therefore offers a better
and more comprehensive measurement of the relations between the economies. The
service trade, in which the Palestinian economy enjoys a surplus, is also included in the
balance of payments. The UNCTAD data have already been published for 2013 and will be
used here instead of the PCBS data in order to cover a longer period of time (UNCTAD,
2015).
#
Palestinians have a deficit in commodity trade, but a surplus in service trade.
#

7
Tillekens applied the Pearson statistical correlation to measure the ratio between the
trade deficit and aid. The advantage of the Pearson coefficient is that it can be applied to
small samples. Also, it measures whether a correlation exists and gives an estimate of the
strength of the correlation. The Pearson coefficient can have values of between -1 and 1. A
value of 0 indicates that the two strings of data are completely uncorrelated. A value of 1 or
-1 indicates that the two strings of data are perfectly correlated by a linear coefficient. The
correlation can be positive or negative. The stronger the correlation (closer to 1 or -1), the
more prediction power can be achieved from one string of data over the other and vice
versa.
In a linear model it is possible to derive the R-squared of the model by squaring the
value of the Pearson coefficient. The R-squared gives an estimate of how well one series of
data can explain the other, and how important the unknown elements are to complete the
picture. In Tilleken’s model, the R-squared is 0.504. This means that the model is only
50.41% complete. Other factors which determine the trade deficit are missing: The missing
factors could include Palestinians using their own purchasing power to obtain Israeli goods
and services, buying them on credit and Israelis making investments in the OPT.
4. The Data
Israel is the main trading partner of the OPT as a result of Israeli control over all borders by
land, air and sea to and from the OPT. Between 2002 and 2007, between 84% and 85.8% of
all imports to the OPT came from Israel, and between 77.4% and 91.8% of all OPT exports
were directed to Israel (UNCTAD, 2012:14). In 2012, Israeli exports to the OPT generated
an added value of NIS 6 billion to 9 billion, which comprise 0.8%-1.2% of the Israeli GDP.
These exports accounted for 5% of total Israeli exports, and 8% of total Israeli commodity
exports. The US is the only trading partner which is a bigger importer of Israeli goods,
indicating that Palestinian imports are of crucial importance to the Israeli economy (BOI,
2014:54-55). As of 2008, annual expenditure on the occupation by the Israeli government
was estimated at US$6.84 billion, or NIS 26 billion (Hever, 2010:70). The trade surplus
enjoyed by Israel with the Palestinians has therefore funded approximately 23-34% of the
costs of the occupation.
8
#
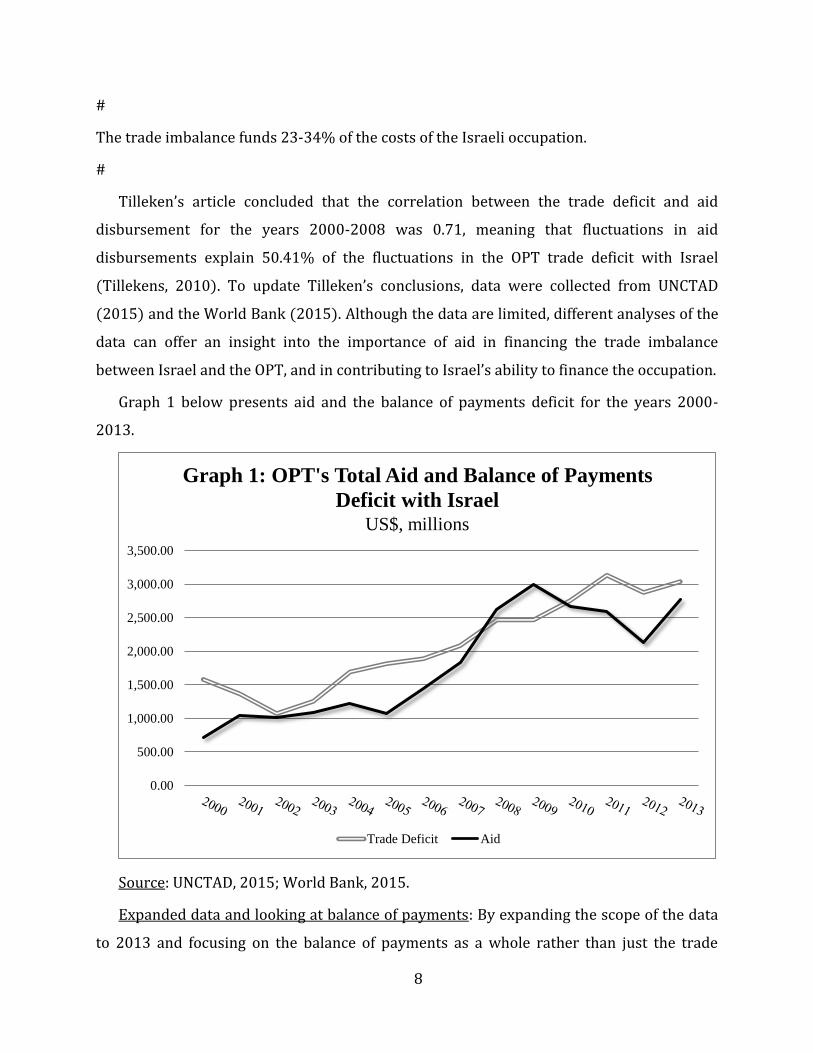
The trade imbalance funds 23-34% of the costs of the Israeli occupation.
#
Tilleken’s article concluded that the correlation between the trade deficit and aid
disbursement for the years 2000-2008 was 0.71, meaning that fluctuations in aid
disbursements explain 50.41% of the fluctuations in the OPT trade deficit with Israel
(Tillekens, 2010). To update Tilleken’s conclusions, data were collected from UNCTAD
(2015) and the World Bank (2015). Although the data are limited, different analyses of the
data can offer an insight into the importance of aid in financing the trade imbalance
between Israel and the OPT, and in contributing to Israel’s ability to finance the occupation.
Graph 1 below presents aid and the balance of payments deficit for the years 2000-
2013.
Source: UNCTAD, 2015; World Bank, 2015.
Expanded data and looking at balance of payments: By expanding the scope of the data
to 2013 and focusing on the balance of payments as a whole rather than just the trade
0.00
500.00
1,000.00
1,500.00
2,000.00
2,500.00
3,000.00
3,500.00
Graph 1: OPT's Total Aid and Balance of Payments
Deficit with Israel US$, millions
Trade Deficit Aid

9
deficit, we find that the Pearson correlation between aid and trade is 88.378, a significant
increase over Tilleken’s findings for 2000 to 2008. This signifies that the close correlation
between the two forms of data is even more clearly observable for a larger set of data. If we
know only the amount of aid in a given year, we can predict the deficit in the balance of
payments with 88.378% accuracy. The R-squared of the model is now 0.781, meaning that
the model can explain 78.107% of the balance of payments deficit using aid alone. This
result confirms Tilleken’s hypothesis that international aid to Palestinians is strongly
correlated to the imbalance in trade between Israel and the OPT.
Looking at trade deficit instead: In a special 2014 report, UNCTAD also presented data
on the trade deficit (separate from the balance of payments) for the years 1995, 1999,
2002, 2005, and 2009 to 2012. The sample only applies to eight separate years, but covers
a time period of 17 years (UNCTAD, 2014), for which we also have data on aid from the
World Bank (2015). When compared with aid data for those years, we find a Pearson
correlation of 0.799, and an R-squared of 0.638. This strengthens the conclusion of a strong
and sustained correlation between aid and the balance of payments deficit, as well as
between aid and the trade deficit.
#
Last year’s aid is the best predictor of the current year’s balance of payments deficit.
#
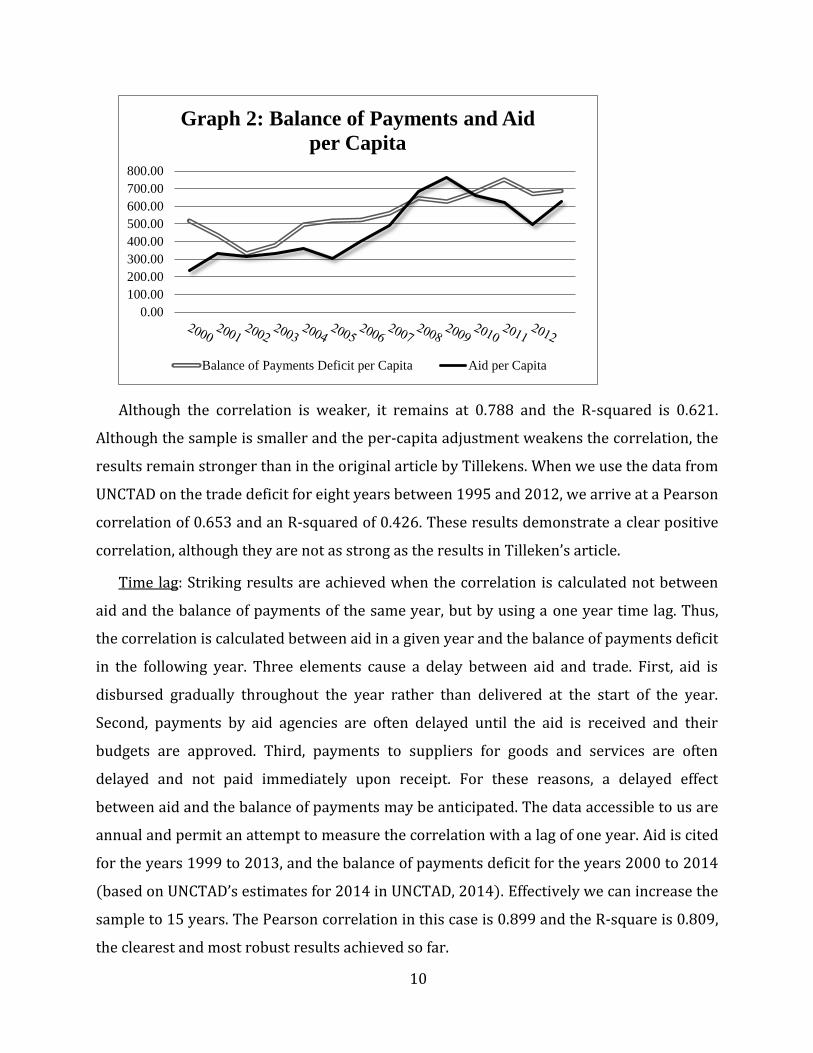
Per capita perspective: It could be argued that the two series of data are correlated not
simply because of the way aid contributes to purchasing goods and services, and paying
fees and taxes to the Israeli economy, but are also correlated to additional indicators which
are not part of the model. Specifically, both aid and the balance of payments tend to grow
over time as a result of economic and population growth. To partially address this, the
calculation can be repeated, but rather than comparing aid with the balance of payment
deficit (or the trade deficit), we can calculate the correlation between aid per capita and the
balance of payments deficit per capita. The population numbers are taken from the PCBS
(2015). In effect, we are neutralizing the population size of the OPT in order to capture the
relationship between aid and trade more effectively. The results of this comparison are
somewhat weaker than the previous results, as can be seen in Graph 2:
10
Although the correlation is weaker, it remains at 0.788 and the R-squared is 0.621.
Although the sample is smaller and the per-capita adjustment weakens the correlation, the
results remain stronger than in the original article by Tillekens. When we use the data from
UNCTAD on the trade deficit for eight years between 1995 and 2012, we arrive at a Pearson
correlation of 0.653 and an R-squared of 0.426. These results demonstrate a clear positive
correlation, although they are not as strong as the results in Tilleken’s article.
Time lag: Striking results are achieved when the correlation is calculated not between
aid and the balance of payments of the same year, but by using a one year time lag. Thus,
the correlation is calculated between aid in a given year and the balance of payments deficit
in the following year. Three elements cause a delay between aid and trade. First, aid is
disbursed gradually throughout the year rather than delivered at the start of the year.
Second, payments by aid agencies are often delayed until the aid is received and their
budgets are approved. Third, payments to suppliers for goods and services are often
delayed and not paid immediately upon receipt. For these reasons, a delayed effect
between aid and the balance of payments may be anticipated. The data accessible to us are
annual and permit an attempt to measure the correlation with a lag of one year. Aid is cited
for the years 1999 to 2013, and the balance of payments deficit for the years 2000 to 2014
(based on UNCTAD’s estimates for 2014 in UNCTAD, 2014). Effectively we can increase the
sample to 15 years. The Pearson correlation in this case is 0.899 and the R-square is 0.809,
the clearest and most robust results achieved so far.
0.00
100.00
200.00
300.00
400.00
500.00
600.00
700.00
800.00
Graph 2: Balance of Payments and Aid
per Capita
Balance of Payments Deficit per Capita Aid per Capita
11
5. Conclusion
The role of international aid to the OPT in relieving Israel of its responsibilities under IHL is
widely acknowledged and referred to frequently in the context of the complicity of aid
agencies with the Israeli occupation. However, the issue has both legal and economic
implications. International aid disbursements to the OPT serve a crucial purpose of keeping
the Palestinian population from plunging into a humanitarian catastrophe that could cost
the lives of thousands. The population of the OPT has become heavily dependent on aid to
survive. Yet the side effect of this aid is not lost on the Israeli authorities as it turns the
occupation of the OPT into an effective export sector for the Israeli economy. Israeli
companies offer goods and services to the aid agencies, Israeli employees work for them,
and Israeli ministries levy tolls and fees from them. Aid agencies pay these costs in foreign
currency, which contributes to Israel’s foreign currency reserves and increases the demand
for Israeli currency. Indeed, Lieutenant Colonel Sharon Biton wrote in the Israeli military
journal Ma’arakhot on the invaluable service provided by international aid agencies, which
he described as an “asset” to Israeli interests (Biton, 2013).
#
Donors bear a responsibility stemming from the consequences of their aid efforts.
#
The strong correlation between aid and the balance of payments deficit discussed in this
article indicates that, regardless of how one chooses to measure the relationship between
aid and the trade deficit, the inescapable conclusion is that the majority of aid money finds
its way sooner or later into the Israeli economy. As exports to the OPT account for
approximately 5% of total Israeli exports (BOI, 2014:54-55), and the majority of these
exports are financed by international aid, one can conclude that international aid to
Palestinians contributes billions of dollars to the Israeli GDP and makes it possible for
Israel to afford the continued military occupation. The findings here indicate that at least
78% of aid money is used to import from Israel, thereby covering at least 18% of the costs
of the occupation for Israel.

12
The question arises of whether the Israeli government would end the occupation if aid
ceased? Would the Israeli authorities rebuild the Civil Administration to assume their
responsibilities under IHL in place of international donors? Or would they remain
indifferent to a mass humanitarian disaster that could cost the lives of thousands of
Palestinians? The tremendous moral implications of these questions indicate that aid is not
something to be toyed with when so many lives are at stake. Nevertheless, the dependence
of the Israeli authorities on international aid to the Palestinians as a mechanism to finance
the ongoing military occupation gives donors important leverage to put pressure on Israel.
This leverage carries with it political responsibilities. Donors cannot close their eyes to the
fact that their donations are enabling the occupation and have funded grievous violations
of international law. They are not themselves the occupiers of the Palestinians in the OPT,
but decades of acquiescing to Israeli demands and conditions on the disbursement of aid
have turned them into accomplices to Israel’s crimes.
6. Bibliography
Association of International Development Agencies (AIDA), 2011. “Restricting
Aid: the Challenges of Delivering Assistance in the Occupied Palestinian
Territory,” June 8th, 2011.
Arnon, Arie; Luski, Israel; Spivak, Avia; and Weinblatt, Jimmy, 1997. The
Palestinian Economy, Between Imposed Integration and Voluntary Separation,
New York and Koln: Brill, Leiden.
Bank of Israel (BOI), 2014. “Economic Developments in Recent Months 137:
October 2013 until March 2014,” Bank of Israel, Research Department,
Jerusalem, June 2014,
http://www.boi.org.il/he/NewsAndPublications/RegularPublications/DocLib3/
RecentEconomicDevelopments/develop137h.pdf, accessed August 2015.
Biton, Sharon, 2013. “International Aid Agencies in Gaza – Asset or Burden?
Discussion Following ‘Cast Lead,’” Ma’arakhot, Vol. 447, pp. 29-36.
Deen, Thalif, 2002. “Israel Taxes Humanitarian Aid to Palestinians – UN,” Inter
Press Service, September 26th, 2002,

13
http://www.ipsnews.net/2002/09/politics-israel-taxes-humanitarian-aid-to-
palestinians-un/, accessed August 2015.
Hever, Shir, 2010. The Political Economy of Israel’s Occupation: Repression
Beyond Exploitation, London: Pluto Press.
Hoseini, Nasrin, 2006. Co-Opting Resistance, Master’s Thesis at the Stockholms
Universitet, March 2006.
Karmi, Ghada, 2005. “With No Palestinian State in Sight, Aid Becomes an Adjunct
to Occupation,” The Guardian, December 30th, 2005,
http://www.theguardian.com/world/2005/dec/31/comment.israelandthepales
tinians, accessed August 2005.
Murad, Nora Lester, 2014. “Donor Complicity in Israel’s Violations of Palestinian
Rights,” Al-Shabaka, October 24th, 2014, https://al-shabaka.org/briefs/donor-
complicity-in-israels-violations-of-palestinian-rights/, accessed August 2015.
Palestinian Central Bureau of Statistics, various years. “Table 3: Total Value of
Imports, Exports in Goods, Net Balance and Trade Transactions in Palestine* by
Country of Origin and Destination, [various years],” PCBS Website,
http://www.pcbs.gov.ps/PCBS_2012/Publications.aspx?CatId=31&scatId=307,
accessed August 2015.
Palestinian Central Bureau of Statistics, 2014. “Table 11: Total Value of Imports,
Exports, Net Balance and Trade Transaction in Services with Israel in Palestine
2000-2013,” PCBS Website,
http://www.pcbs.gov.ps/PCBS_2012/Publications.aspx?CatId=31&scatId=307,
accessed August 2015.
Palestinian Central Bureau of Statistics (PCBS), 2015. "Mid-Year Estimated
Population in the Palestinian Territory by Governorate, 1997-2016 (Revised
Estimates),"
http://www.pcbs.gov.ps/Portals/_Rainbow/Documents/gover_e.htm, accessed
August 2015.
Sharp, Jeremy M., 2014. “U.S Foreign Aid to Israel,” Congressional Research
Service, CRS Report for Congress 7-5700, April 11th, 2014.

14
Swirski, Shlomo, 2008. The Cost of Occupation: The Burden of the Israeli-
Palestinian Conflict, 2008 Report, Adva Center, Tel-Aviv, June 2008.
Taghdisi-Rad, Sahar, 2010. The Political Economy of Aid in Palestine: Relief from
Conflict or Development Delayed? New York: Routledge.
Tillekens, Nikki, 2010. “71% of the Aid to the Palestinians Ends Up in the Israeli
Economy,” Monthly Review Zine, September 30th, 2010,
http://mrzine.monthlyreview.org/2010/tillekens300910.html, accessed July
2015.
United Nations Conference on Trade and Development (UNCTAD), 2012. “The
Palestinian Economy: Macroeconomic and Trade Policymaking Under
Occupation,” UNCTAD/GDS/APP/2011/1, New York and Geneva.
United Nations Conference on Trade and Development (UNCTAD), 2014.
“Palestinian Fiscal Revenue Leakage to Israel Under the Paris Protocol on
Economic Relations,” UNCTAD/GDS/APP/2013/1, New York and Geneva.
United Nations Conference on Trade and Development (UNCTAD), 2015.
“Balance of Payments,” UNCTAD STAT Data Center,
http://unctadstat.unctad.org/wds/, accessed August 2015.
Waelbroeck, Michel; Aldershoff, Willem, 2014. “Israel’s Obligations as an
Occupying Power Under International Law, its Violations and Implications for EU
Policy,” ECCP, Brussels, January 27th, 2014, http://www.eccpalestine.org/wp-
content/uploads/2014/01/Isra%C3%ABls-obligations-as-an-occupying-power-
under-international-law-its-violations-and-implications-for-EU-policy-1.pdf,
accessed August 2015.
WhoProfits, 2012. “Captive Economy: The Pharmaceutical Industry and the
Israeli Occupation,” March 2012,
http://www.whoprofits.org/sites/default/files/captive_economy_0.pdf,
accessed September 2015.
Wilderman, Jeremy; Tartir, Alaa, 2013. “Can Oslo’s Failed Aid Model be Laid to
Rest?” Al-Shabaka, September 18th, 2013, https://al-shabaka.org/briefs/can-
oslos-failed-aid-model-be-laid-rest/, accessed August 2015.

15
World Bank, 2015. “Data: Net ODA Received Per Capita (current US$),”
http://data.worldbank.org/indicator, accessed August 2015.