international bank for reconstruction and...
TRANSCRIPT
Report No. EC-176a
This report may not be published nor may it be quoted as representing the view ofthe Bank and its affiliated organizations. They do not accept responsibility for itsaccuracy or completeness.
INTERNATIONAL BANK FOR RECONSTRUCTION AND DEVELOPMENT
INTERNATIONAL DEVELOPMENT ASSOCIATION
MEDIUM-TERM TRENDS IN THE
INTERNATIONAL SUGAR MARKET
August 1970
EFconiornics DepartmnentFIEC P Prepared by: Gertrud Lovasy
Pub
lic D
iscl
osur
e A
utho
rized
Pub
lic D
iscl
osur
e A
utho
rized
Pub
lic D
iscl
osur
e A
utho
rized
Pub
lic D
iscl
osur
e A
utho
rized

P R E F A C E
In this report prospective trends in consumption, production
and trade of sugar in major importing (mainly developed) and exporting
(mainly developing) countries have been analyzed. Taking into account
the complex institutional framework dividing the market into a number
of separate trading areas, an attempt has been made to forecast medium
term growth and structural changes on the international sugar market.
The study is part of the continuing research program of the
Trade Policies and Export Projections Division, Economics Department.
It has been prepared by Hiss Gertrud Lovasy, Consultant to the Depart-
ment, who wishes to thank Hr. A. J. iPlacone, Division Chief, for very
valuable comments and suggestions. Hrs. Helen B3othwell has assisted
in the preparation of statistical material.
Andrew M. K amarckDirector
Econonics Department
TAkGE OF CONTEITS
Page lNo.
SUMMNARY
I. INTRODUCTION 1
A. Basic Assumptions 1
B. The M4ethod Applied 3
II. PROJECTIOI1S 4
A. Net Importing (Excluding Centrally Pla.nned)Countries 4
Developed Countries 4
Developing Countries 7
"Most likely" developments compared t;o pastgrowth 7
Import demand by market sectors 10
Demand for inventory adjustment 12
B. Centrally Planned iNet Importers - SuppliesAvailable from Cuba 12
C. Net Exporting Countries 16
Consumption estimates 16
Demand for exports and production requiredby 1975 16
Prospects for major exporters 21
III. PROSPECTTVE; DEVELCPMENTS ONi THE WORLD MARKET 31
International trade 34
Prices 36
ANlEXES
Summary of Main Arrangements Regulating Tradle on theinternational Sugar Market
Statistical Appendix
SUMMARY
1. The purpose of this paper is to providle a tentative estimateof prospective, medium-term developments on the international sugarmarket - growth of consumption and production, globally and in majorexporting and importing areas; volume and structure of internationaltrade and probable price developments. The estimates apply to the mid-seventies; although for the sake of brevity reference is made to theyear 1975, it should be understood that the projections indicate trendvalues around that time but not actual values in that particular year,which may be affected by various unpredictable short-run factors.
2. Forecasts have been based on the assumption, spelled out insome detail below, that the existing institutional framework controllingtrade and, indirectly, prodcction will be maintained in its broad lines.It therefore is expected that output will be adjusted to consumptionrequirements and that production and consumption will be in reasonablebalance. Using 1966-68 average data as a base, the projections indicatethat aggregate world consumption up to the mid-seventies will rise at anannual average rate of slightly more than 3 percent. The advance willbe much more pronounced in developing areas, where a relatively low percaput consumption provides much scope for further expansion; moreover,population growth is faster than in other areas. World production willincrease by some 2.8 percent and the apparent surplus of recent years willdisappear. Production growth will also be heavily concentrated indeveloping areas, including Cuba; the growth rate of some 4 percent willbe more than twice as high as in other parts of the world. The trendtoward greater self-sufficiency, particularly in developing importingcountries, will continue; moreover, most of the additional output innet exporting countries will be used for domestic consumption. Hence,as in the past, world trade will grow more slowly than either consumptionor output. The complex structure of trade which developed after thecessation of U.S. imports from Cuba will persist: Cuba will continue toexport large quantities to the centrally planned countries and part ofthese shipments will be re-exported to the free market. Cuban exports tocentrally planned countries as well as to the free market will gain, bothin absolute and relative terms. Those of developed countries willdecline. Imports by the U.S. and the U.K. at special prices will growmore slowly than those to the free market and the rise in exports bydeveloping countries (other than Cuba) will be heavily concentrated onthe latter. Prices on the free market, which were extremely low in1966-68 but have improved since, should gain further, provided that theInternational Sugar Agreement keeps exportable supplies in balance withimport demand.

I. INiTRODUCTIOil
A. Basic Assumtions
1. The projections for the mid-seventies have been based on theassumption that the institutional framework controlling sugar trade anddividing the market into several sectors would be maintained in itsbroad lines. The U.S. Sugar Act, regulating domestic production as wellas imports, would be renewed without changing its essential features.Current regulations, under which additional mainland consumption is metby domestic output and imports in the ratio of 65:35, would be maintained.However, in view of the large and rising shortfalls of Puerto Rican sup-plies, the present provisions, under which shortfalls are re-allocatedexclusively to foreign suppliers, are expected to be modified when theAct comes up for renewal in 1971.1/
2. The privileges granted under the Commcnwealth Agreement, pro-viding for U.K. imports from Commonwealth sources of certain quantitiesat agreed prices, would be maintained, even if the U.K. were to join theCommon Market. Bilateral agreements between Cuba and centrally plannedcountries, notably commitments by the USSR to purchase agreed quantitiesat special prices, would be extended. The present International Agree-ment (in force since January 1969) which aims at stabilizing prices onthe residual free market through export controls, would be renewed andwould retain the provisions which limit re-expoxts to the free market bycentrally planned countries importing sugar fromL Cuba. Under such con-ditions the sharp price fluctuations experienced during the sixtieswould not recur; free market prices would generally be maintainedwithin the range aimed at under the Agreement (3.25 to 5.25 U.S. centsper pound).2/ It furthermore has been assumed that the sugar policywithin the Common Market, which could lead to a considerable increaseof exportable supplies, will be modified and, whether or not the groupaccedes to the International Agreement, net exports to the free marketwould not (or not appreciably) exceed the quota reserved for the group.
3. These assumptions narrow down the scope of the exercise; yetthey do not appear unrealistic for the medium term. The U.S. SugarAct, which comes up for renewal in 1971, dates back to 1934; sincethen it has been periodically extended and, in spite of repeated revis-ions and amendments, has preserved its essential features. There areno indications that - apart from modifying the rules on shortfallallocation - any changes of substance will be made in 1971. However,
1/ Domestic mill capacity on the mainland is presently not fullyutilized and there have already been repeated requests by domesticproducers to change the provisions of shortfall allocation in theirfavor.
2/ For a summary of the main arrangements regulating internationaltrade in sugar see Annex I.

-2-
a major shift in the pattern of U.S. imports could be caused if diploma-tic relaticos with Cuba were resumed: in that case the quota reservedfor Cuba,2Y temporarily assigned to other foreign suppliers, would berestored to that country. Such a development camnot be precluded in amore distant future, but the chance that it will occur within the periodunder consideration appears remote.
4. The Commonwealth Agreement, first concluded in 1951, has beenextended with some changes almost automatically every year. Presentlythe duration is indefinite. In the event that the U.K. should join theCommon Mlarket current commitments would not continue beyond the end of1974. However, the U.K. has repeatedly indicated its intention to main-tain the privileges granted to Commonwealth sources of supply, althoughthey would have to be extended in a different form*2/
5. The bilateral agreement between Cuba and the USSR, providingfor sugar trade up to 5 million tons, will expire at the end of 1970.Cuba has regularly exported to the USSR, although the volume has beenwell below 5 million tons. Current conditions - a relatively shortcrop in the USSR and prospects for ample supplies in Cuba - suggestthat shipments in 1970 will increase. Moreover, the USSR seems to beeager to expand future imports of Cuban sugar, There can be littledoubt that the agreement will be extended, though volume and pricemight be changed.
6. The International Sugar Agreement, originally concluded in1953 and renewed in 1958, was suspended in 1961, as Cuba's claim for agreatly increased quota could not be accommodated. Repeated negotiationsfinally led to the conclusion of the present Agreement, which came intoforce in January 1969. The much more stable market conditions duringthe lifetime of the earlier Agreement, the protracted period of extremelydepressed prices in the late sixties and their recovery after the newAgreement started operations will in all probability strengthen thedesire for continued market control beyond the exgpiration date (December1973) of the Agreement.
7. IModification of the current sugar policy within the CommonMarket is expected mainly because of the heavy f:inancial burden arisingfrom export subsidies, in addition to those on domestic consumption,which are strongly resisted by some members. Attempts to modify currentprices and quotas have already been made, but so far no agreement hasbeen reached. There can be no doubt, however, that efforts to lightenthe financial burden will be resumed.
1/ I.e., 50 percent of the market not assigned to domestic producersand the Philippines (see Annex I, page 1).
2/ See Annex I, page 4.

B. The Method Applied
8. Forecasts of consumption in both net importing and exportingcountries have been based on projections of population growth and onestimated developments of per caput consumption, taking account of theircurrent level in individual countries, of growth trends in the sixties,of special circumstances (such as the recent ban on cyclamates) and, insome cases, of countries' own projections. Except for centrally plannedimporting countries, one single figure rather thlan a range has been es-tablished. This implies that no allowance has been made for the possibleeffect of changes in the rate of incorie growth or of prices paid by con-sumers. However, in the medium term no such changes are likely. More-over, in most developed and in those developing countries where consump-tion is high, the income elasticity of demand is negligible. Finally,in contrast to the sharp fluctuations in world market quotations, retailprices in most countries have been kept fairly stable. They frequentlyreflect high domestic production costs and sometimes are inflated by highrevenue taxes. Although tax reductions might well stimulate consumption,the chances of such reductions seem remote.
9. Estimates of production in net importLng countries (in the formof ranges) have been based, where possible, on countries' plans with res-pect to their sugar industries, on IBRD Economic Reports and their find-ings, on information with respect to resources available and capacity ofraising yields, and on past performances. Prospective import demand wasderived as the balance between estimated consumption and production.
10. A different approach was followed with respect to productionin net exporting countries. Since it has been assumed that internationalmarket control, in the form of restricting exports to anticipated importdemand, would continue, it is to be expected that exporting countrieswill plan future production accordingly, aiming at levels sufficient tocover (but not exceed) domestic requirements plus their respective shareson export markets. Barring serious misjudgment of domestic and exportdemand, this would restore and maintain overall market balance. A similarprocedure has been applied here in estimating production - global and forindividual exporting countries. Aggregate production has been derivedas the sum of their domestic requirements plus export demand (equal toestimated total import demand as forecast above). A tentative allocationby areas and countries was then based on their prospective shares underspecial marketing arrangements and free market quotas under the Inter-national Sugar Agreement.
11. The particular position of Cuba in relation to importingcentrally planned countries calls for still another approach in estimatingtheir production. Although Cuba is a member of the International Agree-ment with a limited share on the free market, exports to centrally plannedcountries are not subject to restrictions. Commitments under the Inter-national Agreement only limit the quantities which may be re-exported tothe free market, but not those retained by centrally planned importers.
- 4 -
Production of Cuba will be determined by the coLmtry's own target and itsability to meet it; the forecast for Cuban procuction has therefore beenstated in the form of a range. It has been assumed that any foreseeablesurplus beyond domestic consumption and export rights on the free marketwould be absorbed by the USSR and other centrally planned importing coun-tries, and that their consumption and/or production would be adjustedaccordingly.
II. PROJECTIONS
A. Net Importing (Excluding Centrally Pl;anned) Countries
Developed Countries
12. Net imports as well as consumption of sugar are heavily concen-trated in this grcup of countries. Four of them - the United States, theUnited Kingdom, Japan and Canada - account for some 60 percent of totalnet sugar imports and for about the same proportion in importing countries'total consumption.l/
13. In the United States, where consumption in recent years has beenclose to 10 million metric tons, a moderate further increase of about 1½5million tons is expected (Annex Table M-1). This figure is based on anestimated rise of current mainland per caput consumption of 49 kilogramsto 50 kilograms by 1975 reflecting, in part, substitution for cyclamates,the use of which has been prohibited (except for dietary purposes). Somegain should also arise through the somewhat larger proportion of youngpersons in the U.S. population projected for 1975. However, the principalfactor in the anticipated rise in total consumption is growth in popula-tion. The shares of mainland consumption to be mnet by domestic (includingoffshore) production and by imports are determined by the U.S. Sugar Act;under current provisions (in force until the end of 1971) any increase inconsumption is allocated in the proportion of 65:35 between these twosources of supply.YI Import allocations in recenit years have greatly ex-ceeded basic quotas; these additional allocations resulted frcm persistentand rising shortfalls in Puerto Rican supplies which were distributed toforeign countries, mainly in the Western Hemisphere. It cannot be expected,however, that these windfall gains will be maintained at the high level ofrecent years. A rehabilitation program designed by the Puerto Ricanauthorities is aimed at a reversal of the downward trend in production;
1/ The shares of these countries' net imports in 1966-68 were as follows:U.S. 30 percent; U.K. 14 percent; Japan 12 percent; Canada 6 percent.
2/ For details see Annex I.

- 5 -
although prospects are not very favorable!/ some increase in productionand available supplies from the island could be achieved. Moreover, asmentioned above, it is almost certain that the current procedure of allo-cating total shortfalls to foreign countries will be changed.
14. The projections of U.S. imports in 1975 have been based on thecurrent provisions of the Sugar Act, taking account of this change. Ithas been assumed that in the future shortfalls will be allocated betweendomestic and foreign so rces in the same proportion as increases in con-sumption, i.e., 65:35.27 The computations made on that basis arrive attotal imports of 4,480 to 4,630 thousand metric tons.3/ These figuresinclude, in addition to quota imports at preferential prices, an estimateof 150 thousand tons of "non-quota" imports for feed, production ofalcohol and use in sugar-containing products for export, regularly admittedat prevailing world prices. Since imports in the late sixties were infla-ted for the reasons stated above, their rate of increase in the future,even if the higher figure were reached, would be considerably slower thanthe anticipated rise in consumption; the annual average growth rate inimports would be 1.2 percent as against 1.9 percent in consumption.
15. In the United Kingdom per caput consumption, after a temporarydecline in the early sixties, has remained close to 52 kilograms inrecent years and no change has been assumed in the future. Except forminor year to year fluctuations, production, which covers about one-thirdof domestic demand, has also been fairly stable. Population growth shouldraise consumption from about 2.9 million tons in recent years to over 3million tons in the mid-seventies, of which some 2 million tons would bemet by imports.
16. Per caput consumption in Canada has varied between 46 and 50kilograms per year, with no perceptible trend. 'rhe 1975 forecast hasbeen based on 50 kilograms, the same as for the UJnited States. Produc-tion is expected to remain small, well over 80 percent of demand beingcovered by imports. On that basis net imports byr 1975 should reach about1 million tons, compared to O.35 million in recenit years.
17. Japan is the only one of the four countries (and, indeed, oneof the fewi developed importers) where there is considerable scope for afurther rise in per caput consumption. The 1975 estimate assumes continued
1/ Increasing emphasis has been placed on industrialization and on tourism;labor has been and is expected to remain in short supply, partly becauseof alternative opportunities and also on account of emigration to themainland; production costs have been steeply rising.
/ This is obviously an arbitrary assumption but; the exact nature of theexpected re-allocation cannot, of course, be predicted.
3/ The range reflects different assumptions with respect to the magnitudeof Puerto Rican shortfalls.
-6-
growth at roughly the same rate as in the sixties. In view of the an-ticipated vubstitution of sugar for the recently banned cyclamates, whichwere widely used in Japan, this assumption appears not unrealistic. Percaput consumption by 1975 would reach 32 kilograms, but even at thatlevel it would still remain below consumption in other developed and in amimber of developing countries.i/ The sharp rise in the country's prodac-tion throughout the mid-sixties has slowed down and, according to a recentstatementino further expansion of acreage is planned, though some gainin output may be expected from improving yields. The production rangeprojected for 1975 allows for such gain; but higher yield per se couldhardly raise production beyond the lower limit and a further rise would inall likelihood necessitate some addition to acreage. Should consumptionreach the expected level of 3.4 million tons, import demand could rise byas much as 1 million tons over the 1966-68 level.3
18. The four major importers of sugar wiLl continue to be theprincipal markets for net imports and little change in their combinedshare in total net imports is expected. However, Japan will replace theUnited Kingdom as the second largest net importer.L
19. In most other net importing developed countries per caput con-sumption is high and total consumption will expand only slightly. Greece,Spain and Yugoslavia are the main exceptions. Should their plans for asubstantial expansion of output materialize, the share of consumption metby domestic output in these three countries wouLd greatly increase andimports may actually decline. Some other countries in the group - notablyNew Zealand, Norway and Switzerland - cover all or most of their require-ments by imports and any increase in their consumption would add to imyportdemand.
1/ The estimate does assume further increase in per caput income, butmakes no allowance for the possible effect of a reduction in the veryhigh domestic retail price if such a reduction were to occur.
2/ Statement by the Japanese Delegation at the International Sugar Con-ference in October 1968. There is no guararntee, however, that plansmight not be changed.
3/ It should be noted that such increase would considerably exceed therise to which Japan would be committed under the obligation assumedunder Article 51 of the Interniational Agreement. Japan has undertakento import not less than 35 percent of any rise in consumption beyond2.1 million tons; thus, if consumption should reach the anticipatedlevel of 3.4 million tons, Japan's commitment would call for additionalimports of some 450,000 tons - far less than the actual rise expected.
hi This remark applies to volume only; since the greater part of U.K.imports are at special prices considerably higher than the "world" pricepaid by Japan, the value of U.K. net sugar imports will continue toexceed that of Japan.

-7-
Developing Countries
20. These countries are continuing their efforts toward achievinggreater self-sufficiency, though perhaps not so rapidly as in the sixties.In the Western,Hemisppre only a few coantries, notably Chile and Uruguay,remain net importers. They have been steadily expanding production andadditional import demand will be moderate.
21. In Africa the number of countries developing their own sugarindustry keeps rising; others, including Morocco (until recently thelargest importer among the developing countries) are expanding existingcapacity. Some of the net importing countries, e.g., Zambia and Senegal,are aiming at turning into net exporters. ShouLd their plans materialize,African import demand might decline to less than its current level.
22. Developments among Asian importing coumtries show a similartrend: except for some of the Im ddle Eastern o-Ll countries very few willremain entirely dependent on imports of their sugar requirements. Iran,however, is in the process of raising beet acreage and adding processingequipment, attempting to become self-sufficient in the early seventies.M4alaysia plans to develop production and reduce dependence on imports.In Pakistan per caput consumption, sustained by a substantial increase indomestic output, has been rapidly rising through the sixties replacing, inpart, consumption of "Gurt (non-centrifugal sugazr). Further developmentin that direction is planned, but probably will proceed at a much moremoderate rate. For some of the major importers of Asia, including Ceylon,Iraq, South Korea and South Vietnam, domestic production, if any, is ex-pected to remain small in relation to requiremenits and imports shouldcontinue to rise. Production in Indonesia, a net exporter through thefifties and part of the sixties, has been stagnant for some time and, inrecent years, the country had to supplement output by imports. The Govern-ment is planning to revive production, but current conditions suggest thatthis will be a slow process. Although only a minor increase in per caputconsumption is anticipated, rapid population growth will raise domesticrequirements and it appears likely that the courntry will remain a netimporter for some years to come.!/ Even though output in a number ofAsian importing countries is growing, it is expected that import demandfor the group as a whole will show at least some increase.
"Most likeLy" developments compared to past growth
23. It cannot be expected that production and import demand of allor even a large majority of countries will necessarily be clustered aroundeither the lower or the upper limit of the ranges shown in Annex Table M-1;
J It should be noted that Indonesia has joined the International SugarAgreement as an exporter, with a net export entitlement (not a basicquota) of 81,000 tons per year. In view of its position in recentyears and of expected developments, however, the country has in thispaper been included among net importers.

-8-
the addition of all the "low" and all the "high" figures is bound to giveunrealistic results. The odds are that for the aggregate of all importingcountries the midpoint of the ranges shown in Annex Table M-1, i.e., 15.9million and 15.75 million tons for production and imports, respectively,would give a better approximation. An attempt has been made, however, togo somewhat further and to estimate the "most likely" prospects for majorindividual importers; for others the midpoints of -the ranges have beentaken.
24. The results, summarized in Table 1, suiggest that for thedeveloped countries the "most likely" aggregate import estimate comesclose to the higher figure and, conversely, the corresponding productionestimate close to the lower figure of the range indicated in Annex TableM-1. This reflects largely the rather optimistic views with respect toimports by the U.S., the U.K., Japan and Canada.,/ The expectation thatU.S. imports will be close to the upper limit of the range is based onthe belief that Puerto Rican shortfalls would not decline much belowtheir level of recent years.a/ In the U.K. as wrell as in Canada produc-tion has not changed much in recent years; it seems probable that bothcountries will meet all or the better part of the rather modest increasein this consumption through rising imports.2/ As mentioned earlier,Japan does not, at this stage, intend to expand acreage; the "mostlikely" estimate of production and imports of that country assumes nochange in this policy. Hence production would increase only moderately -through improved yields - and most of the expected large rise in consump-tion would be met by imports.
25. For the developing countries as a group aggregate imports andproduction would come close to the midpoint of the ranges. Imports inltoAfrican countries would be fractionally above and those into Asia slight-ly below the respective midpoints. For some of the major importers
1/ Included in "other developed countries".
2/ As pointed out earlier (see footnote 3 on page 5) the range in U.S.imports indicated in Annex Table M-1 reflects different assumptionsregarding shortfalls of Puerto Rico. The assumed distribution ofshortfalls among domestic and foreign sources of supply (65 to 35percent) has been the same for the lower and upper limit.
3t This implies a minor increase in Canada's production, and no changein the U.K.'s, as compared to the late sixties. In the case of theU.K. no account has been taken of the possibility that should thecountry join the EEC, the higher prices paid to domestic producersafter the transition period could stimulate output and reduce importdemand. It is not expected, however, that such a development wouldoccur during the period under consideration.
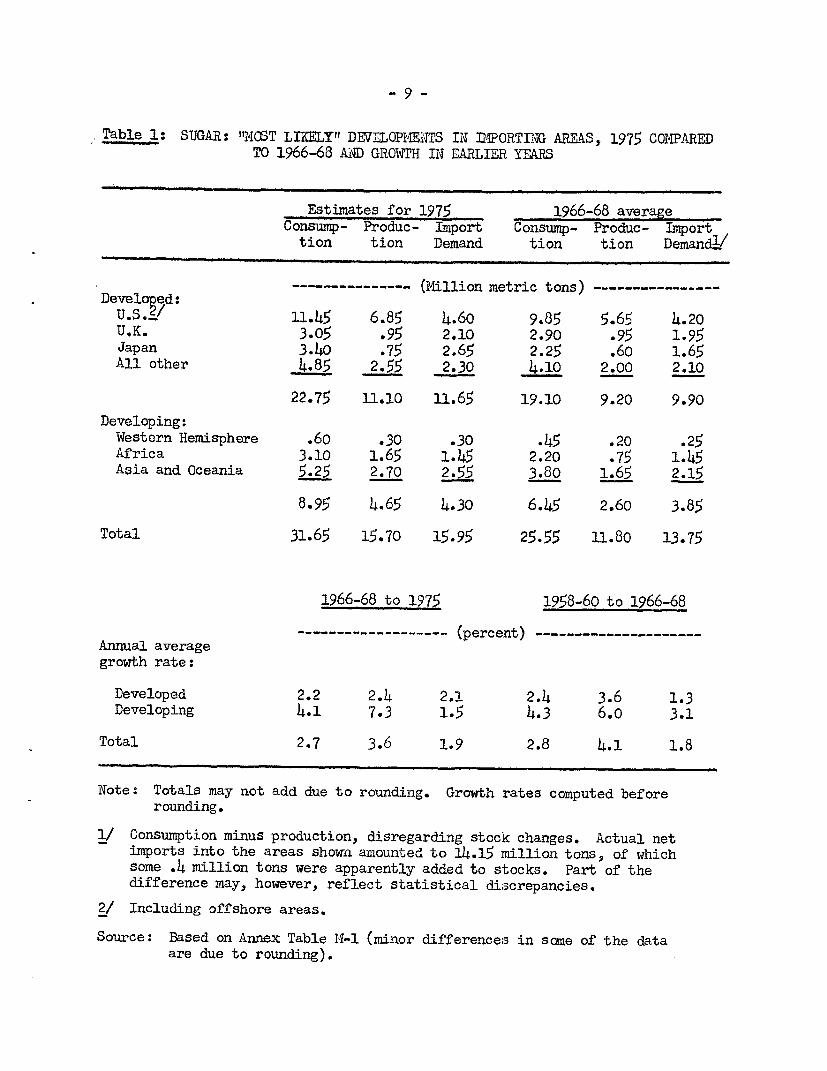
Table 1: SUGAR: T"MOST LIEELY" DEVELOPMENTS IN IMPORTING AREAS, 1975 COMPAREDTO 1966-68 AiD GROWTH IN EARLIER YEARS
Estimates for 1975 1966-68 averageConsump- Produc- Import Consump- Produc- Import
tion tion Demand tion tion Demandv
-------------- (Million metric tons) ----------------DevelopdU.S.2/ 11.45 6.85 4.60 9.85 5.65 4.20U.K. 3.05 .95 2.10 2.90 .95 1.95Japan 3.40 .75 2.65 2.25 .60 1.65All other 4.85 2.55 2.30 4.10 2.00 2.10
22.75 11.10 11.65 19.10 9.20 9.90
Developing:Western Hemisphere .60 .30 .30 .45 .20 .25Africa 3.10 1.65 1.45 2.20 .75 1.45Asia and Oceania 5.25 2.70 2.55 3.80 1.65 2.15
8.95 4.65 4.30 6.45 2.60 3.85
Total 31.65 15.70 15.95 25.55 11.80 13.75
1966-68 to 1975 1958-60 to 1966-68
- (percent) --Annual averagegrowth rate:
Developed 2.2 2.4 2.1 2.4 3.6 1.3Developing 4.i 7.3 1.5 4.3 6.o 3.1
Total 2.7 3.6 1.9 2.8 4.1 1.8
Note: Totals may not add due to rounding. Growth rates computed beforerounding.
1/ Consumption minus production, disregarding stock changes. Actual netimports into the areas shown amounted to 14.15 mnillion tons, of whichsome .4 million tons were apparently added to stocks. Part of thedifference may, however, reflect statistical discrepancies.
2/ Including offshore areas.
Source: Based on Annex Table 14-1 (minor differences in same of the dataare due to rounding).

- 10 -
in both continents where production is quite small not much if any changeis expected and the ranges shown (see Annex Table 1$-1) are very narrow;for others, which are planning expansion of output the "most likely" esti-mates have been based on considerations with respect to the probable degreeof self-sufficiency attained by the mid-seventies.
26. Annual growth rates, shown in the lower part of Table 1, indi-cate that in developing countries consumption and production will risemuch faster and imports much more slowly than in the developed group.Compared to movements in the preceding eight years there will be a minorslowdown in the rate of consumption growth in both groups of countries.In the developing group expansion of output is expected to accelerate,reflecting continued striving toward greater self-sufficiency. Theopposite movement is expected in developed countries, since the mainreasons for the considerable expansion in the preceding period - uncer-tainty concerning supplies frcm Cuba, temporary shortages and high prices, -have subsided. Import demand in this group should grow at a faster rate,largely offsetting the expected slowdown in impo:rts of developing coun-tries.
Import demand by market sectors
27. A considerable proportion of net imporbs - roughly 43 percentin the last few years - have been moving under special arrangements atprices far above the world price level. The greater part of these im-ports is absorbed by the U.S. and most of the rest by the U.K. (seeTable 2). For the reason stated above the "most likely" estimate of U.S.quota imports comes close to the upper limit of the computed range. Yetin view of the expected modification in the distribution of shortfalls,the increase compared to imports in the late sixties would be quitemoderate: not more than 350,000 tons, or less than 9 percent over a periodof eight years. The rise in U.K. imports under the terms of the Common-wealth Agreement's negotiated price quota would be even smaller; it isexpected that most of the additional net imports by that country would bemet on the free market. No change appears likely in the small volume oftrade under special arrangements among African developing countries.S/Total trade under special arrangements over the period 1966-68 to 1975would increase by only 400,000 tons, or about 7 percent.
28. A much greater expansion is expected for imports on the freemarket, largely on account of rising demand by developed importers, not-ably Japan. Although the growth in developing countries would be muchmore moderate, total free market imports would rise by some 23 percentas compared to 7 percent for those under special arrangements. Hencethe proportion of the latter in total imports woutld decline and a corres-pondingly larger share would move at world prices.
l/ Agreement among former French territories covering 114,000 tons andamong countries of the East African Community covering 10,000 tons.

- 11..-
Table 2: SUGAR: ESTIMATED "MOST LIKELY" DIPORT DEMAND UNDER SPECIALARRANGEMENTS AND ON THE FREE 'IARKET 1975,9C00?ARED TO 1966-68 AVERAGEI/
(Million metric tons)
Under SpecialArrangements Free Market Total197 ;61975 1966-68 1975 1966-68
Ddveloped
U.S. 4.45 4.1 .15 .10 4.60 4.20U,K. 1.8 1.75 .30 .20 2.10 1.95Other _ _ 4.95 3.75 4.95 3.75
Total 6.25 5.85 5.40 4.05 11.65 9.90
Developing .10 .10 4.20 3.75 4.30 3.85
Total allcountries 6.35 5.95 9.60 7.80 15.95 13.75
Change from1966-68 .40 1.8 2.20
Annual averagegrowth rate .9 2.6 1.9(percent)
1/ Consumption minus production; see Table 1.
Source: 1966-68 data: International Sugar Organization Sugar Yearbook1968 and Statistical Bulletin, various issues.USDA Sugar Reports, various issues.

- 12 -
Demand for inventory adjustment
29. Since import demand for 1975 has been derived as a balance be-tween anticipated consumption and production, no allowance has been madefor additional supplies required to maintain inventories at workinglevels, i.e., some three months' consumption. As indicated earlier (seeTable 1) consumption in importing countries over the years 1966-68 to1975 is expected to rise by some 6 million tons, or roughly 750,000 tonsper year. At that rate of consumption growth an annual increment to in-ventories of roughly 200,000 tons would be required. Such addition wouldraise global import demand in 1975 to i6.15 minlion tons.l/
B. Centrally Planned Net Importers - Supplies Available from Cuba
30. The group includes the USSR, the largest single producer andconsumer of sugar, with a per caput consumption which in recent years hasreached some 40 kilograms; it is met to a considerable extent, but notentirely, from domestic output. The group furthermore includes MainlandChina, where domestic production also covers most of the country's consump-tion which, however, on a per caput basis is very low (around 4 kilograms).In addition, East Germany, Bulgaria and some other centrally planned coun-tries of Europe and Asia are net importers of sugar.
31. After the suspension of U.S. imports from Cuba in 1960, largequantities of Cuban sugar were diverted to the USSR and other centrallyplanned countries. This trade has been conducted under a series of bi-lateral agreements; it has varied from well over 4 million tons in 1961to 1.7 million tons in 1963, reflecting the sharp fluctuations in Cubanoutput. Following the severe shortage of Cuban supplies in 1963, produc-tion in the USSR was greatly expanded and in subsequent years increasingquantities have been re-exported to the free market._/ In the late six-ties re-exports by net importing centrally planned countries reached 1.7
1/ This adjusted figure would have to be compared with actual imports in1966-68 of 14.15 million tons rather than with the balance betweenproduction and consumption of 13.75 million used in Tables 1 and 2.However, the difference of 0.4 million tons does not only representadjustment of inventories; closer scrutiny of the data suggest thatpart of the difference is accounted for by statistical discrepancies.
2/ The USSR has objected to the term "re-exports", maintaining that thesugar exported was domestically produced while Cuban imports wereconsumed in the country. However, any export by a net importingcountry of the commodity concerned is customarily termed as "re-export",irrespective of physical identity.

- 13 -
million tons, while less than 1.5 million tons were retained by thegroup.!/ However, under the terms of the International Sugar Agreement,restrictions have been placed on these re-exports.&/
32. In gauging future developments in the sugar economies of netimporting centrally planned countries the procedure followed for otherimporters cannot be applied. Their net imports cannot be derived as thebalance between estimated consumption and production. In view of theirclose trade relations with Cuba, net imports of the group - in particularthose of the USSR - would mainly depend on supplies available from Cuba.The consumption estimates for the USSR (and China) in Annex Table M-2have been given in the form of a range; it is expected that consumptionor production developments, particularly in the USSR, will be largelydetermined by the volume of sugar which Cuba will be able to provide.
33. In recent years production in Cuba has varied from 4.9 to 6.2million tons; currently supreme efforts are being made to approach therepeatedly announced target of 10 million tons.3/ Although this figurewill not be attained, data on output reached so far indicate that totalproduction in the season ending late July 1970 will be in the neighborhoodof 8.5 million tons. This does not., however, provide a reliable guidefor estimating future performance. Although it is conceivable that pro-duction of that size might be repeated, it cannot be ruled out thatrelaxation of the present heroic efforts, which could hardly continuewithout adverse effects on other parts og the economy, would result in arelapse of output to much lower levelsf It also is possible, but perhapsnot very likely, that recognizing the limited scope for expanding exportson favorable terms may induce a lowering of targets for the future. Tak-ing account of these uncertainties, production forecasts for the mid-seventies are given in the form of a wide range - 6.5 to 8.5 million tons.Allowing for domestic consumption of about 700,000 tons some 5.8 to 7.8million tons would be available for export. Exportable supplies of thatmagnitude would exceed actual exports in the late sixties by about 1million to 3.8 million tons (see Table 3). The International Sugar Agree-ment, under the basic export quota, would permit expansion of 1966-68exports by about 0.6 million tons; re-exports via centrally plannedimporters of Cuban sugar would remain close to their 1966-68 level. Allow-ing for these direct and indirect export entitlements, amounting in the
1/ In addition, Cuban sugar has also been exporbed to and re-exported bynet exporting countries, including Poland, Czechoslovakia and Hungary.
2/ For details see Annex I, pages 5 and 6.
3/ The highest level reached in the past was 7.2 million tons in 1952and, more recently, 6.8 million tons in 1961.
4/ The Cuban review Bohemia has conceded that other sectors of the economyhave suffered from neglect and wastage of manapower (quoted in TheEconomist, lay 30, 1970, page 39).

aggregate to 3.95 million tons, would leave residual exportable suppliesof some 1.85 to 3.85 million tons. It has been assumed that centrallyplanned countries, chiefly the USSR but also China and others, would pro-vide markets for such supplies. In the early sicties, prior to the declinein Cuban output, net imports of these countries actually reached some 3.3million tons - not much less than the higher figire of the range mentioned.Subsequently, however, net imports have been much lower (see Table 3).
34. Official USSR data suggest that in recent years domestic produc-tion has covered most of the country's steeply rising consumption. How-ever, largely due to adverse weather conditions accompanied by damagethrough disease and insects, the current (1969/70) crop has been sharplyreduced and will have to be supplemented by large net imports. gecoveryof output could be slowed down by further damage to sugar beet.e Theexpansion of Cuban supplies at this time should be of help and its coinci-dence with increased USSR demand for imports should also create a favorableclimate for the pending renewal of the agreement between the two coun-tries.2/
35. Concerning future developments, it has been reported that theUSSR would not wish to expand production beyond the level of recent years(prior to the crop damage just mentioned), and would prefer to cover arising proportion of consumption by imports. Under such circumstances,a substantial part of the expected Cuban supplies, even under the "high"assumption, could be absorbed by the USSR (see Table 3 and Annex Table14-2).
36. IIainland China, where per caput consumption has remained quitesmall (some 3-4 kilograms per year), has been a net importer of Cubansugar in widely varying quantities. In that coultry the scope for expand-ing per caput and total consumption appears almost unlimited and it is notunreasonable to assume that China might become ani expanding market forCuban sugar.2/ Net imports of other centrally planned countries, whichinclude East Germany, North Korea and North Vietnlam, have considerablyincreased through the sixties; some further modest increases may beanticipated. It should be stressed, however, that the allocation ofadditional net imports among centrally planned countries and areas shownin Table 3 is quite arbitrary; developments in the countries concernedcould lead to a different distribution.
1/ See USDA: Note on "Diseases affecting USSR sugar beets", ForeignAgriculture, May 11, 1970, page 15.
2/ The current agreement will expire at the end of 1970. See Annex I,page 4.
3/ A rough indication of production and consumption developments in theUSSR and Mainland China, implied in case of rising imports from Cuba,is given in Annex Table M-2. Available data do not permit similarestimates for other countries of the group.

- 15 -
Table 3: SUGAR: ESTDMATE OF CUBA'S EXPORTABLE SUPPLY AND OF PROSPECTIVEMARKETS 1975, CO1MPARED TO ACTUAL DATA 1961-68
(Million metric tons)
1975 Estimate Actual DataLow High Midpoint 1966-6a 1963-65 1961-62
Exportable supply 5.80 7.80 6.8o 4.90 4.35 5.80
Exports to freemarket2Y 2.15 2.15 2.15 1.55 1.6o 1.55
Exports to centrallyplanned countriesfor re-export tofree market_/ 1.80 1.80 1.80 1.90 1.30 .95
Residual supply 1.85 3.85 2.85
Exports for consump-tion in centrallyplanned countries3/USSR 1.00 2.50 1.75 .75 1.10 2.10M4ainland China .30 .70 .50 .20 .10 1.05Other .55 .65 .60 .50 .25 .15
1.85 3.85 2.85 1.45 1.45 3.30
2/ 1975: Basic export tonnages under International Sugar Agreement (as of1971).
2/ 1975: Export and re-export entitlements of centrally planned importersof Cuban sugar.
3/ 1975: Tentative distribution among markets.

- 16 -
C. Net Exporting Countries
37. Forecasts of consumption have been derived on the basis of anti-cipated population growth and estimated per caput consumption - the samemethod as applied for net importing countries. For the reasons statedearlier, production has been calculated as the sum of damestic requirementsplus demand for exports (equal to estimated import demand). The tentativeallocation by areas and countries has been based on their shares underspecial marketing arrangements and on free market; quotas under the Inter-national Sugar Agreement.
Consumption estimates
38. On the basis of estimates for individuatl countries, consumptionin developing net exporting countries as a group is ex ected to rise at anaverage annual rate of almost 5 percent (see Table 4).1/ Roughly half ofthe increase will result from higher per caput consumption, the other halffrom population growth. This ratio will vary greatly among main areas.In the 'Sestern Hemisphere, where per caput consumption is already high,population growth will be the main factor. In Asia the opposite is true:the very substantial increase in total consumption will largely reflecthigher consumption per head. Yet, in spite of the expected rise, per caputconsumption in Asia in 1975 would still remain far below the average levelin exporting countries of other continents.
39. In developed net exporting countries, which include the EECgroup,'/ per caput consumption is high and the mcderate rise expected intotal consumption would mainly result from population growth. The sameapplies to centrally planned net exporters, all of them t"developed" coun-tries of Eastern Europe.
40. Total consumption in all net exporting countries would reachnearly 32 million tons by 1975, implying an annual average rate of growthof 3.6 percent. This compares with a rate of 2.7 percent in net importing(not including the centrally planned) countries. The difference is largelyexplained by the much greater proportion of developing countries among netexporters, where both population and per caput consumption tend to grow,faster than in developed areas.
Demand for exports and production required by 1975
41. On the basis of estimated aggregate consumption and of projecteddemand for imports a rough estimate can be derived of the production volumewhich will be required in net exporting countries by 1975. For the sake of
1/ For details by individual countries see Annex Table X-1.
2/ The group itself covers, in addition to the Metropolitan areas, theFrench overseas departments of Guadeloupe, Martinique and Reunion.
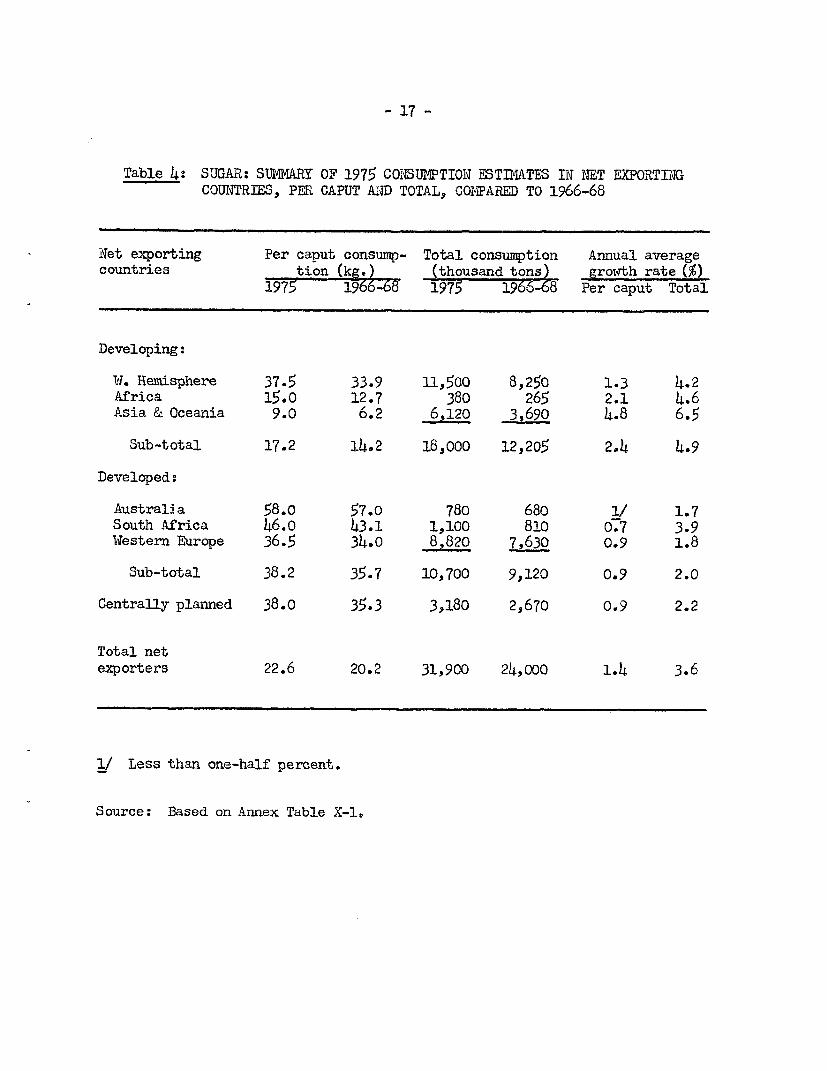
- 17 -
Table 4: SUGAR: SUMMARY OF 1975 CONS1JMTION ESTIWATES IN NET EXPORTINGCOUNTRIES, PER CAPUT A1iD TOTAL, COMPARED TO 1966-68
Net exporting Per caput consump- Total consumption Annual averagecountries tion (kg.) (thousand. tons) growth rate (%)
1975 1966-68 1975 1966-68 Per caput Total
Developing:
W. Hemisphere 37.5 33.9 11,500 8,250 1.3 4.2Africa 15.0 12.7 380 265 2.1 4.6Asia & Oceania 9.0 6.2 6,120 3,690 4.8 6.5
Sub-total 17.2 14.2 18,000 12,205 2.4 4.9
Developed:
Australia 58.o 57.0 780 680 1/ 1.7South Africa 46.0 43.1 1,100 810 0.7 3.9Western Europe 36.5 34.0 8,820 7,630 0.9 1.8
Sub-total 38.2 35.7 10,700 9,120 0.9 2.0
Centrally planned 38.0 35.3 3,180 2,670 0.9 2.2
Total netexporters 22.6 20.2 31,900 24,000 1.4 3.6
/ Less than one-half percent.
Source: Based on Annex Table X-1.

- 18 -
simplicity, calculations have been based on the "most likely" demand forimports - 16.15 million tons.!/ Adding an adjustment for loss in transitof 200,000 tons raises the figure to 16.35 million tons.Z/ In derivingrequired prodiction, allowance has furthermore to be made for the need toraise stocks in exporting countries, in line with increased domestic con-sumption; 200,000 tons have been added for this purpose.
42. Since it has been assumed that increasing production in Cubawould be absorbed by rising net imports in centrally planned countries,net import demand by this group and the corresponding Cuban productionhave been disregarded in the estimates to be presented. They include, how-ever, free market demand to be met by Cuba - directly or via re-exports bycentrally planned countries.
43. The estimate of production required in 1975 indicates that some48 million tons, as against 39 million tons in 1966-68, would have to beproduced to meet domestic consumption and demand for exports in 1975. Themain factor calling for an increase of 9 aillion tons would be expandingdomestic consumption; the rise in export demand plays only a minor role(see Table 5).3/
44. Since the export-shares of most individual countries are deter-mined by their quotas under special arrangements or, for the free market,under the International Sugar Agreemenit, a tentative indication of countryand area distribution of 1975 exports may be derived on the basis of these
1/ Import demand as shown in Tables 1 and 2 plus 200,000 tons for additionto inventories in importing countries.
2/ This adjustment corresponds to the procedure followed by the Inter-national Sugar Council in estimating import demand. It allows for"non-statistical disappearance" of sugar regularly observed in transitfrom exporting to importing countries. This adjustment has been con-fined to "free market" transactions only; published data on importsby and exports to the U.S. and the U.K. in recent years did not seemto justify a similar adjustment for trade under special arrangements.
2/ It may be noted that the increase between 1966-68 and 1975, both inabsolute and relative terms, would be smaller on the export than onthe import side. The annual average growth rate of export demand of1.1 percent compares with a rate of 1.9 percent if measured againstimports over the same period (see Tables 1 and 2). The customarystatistical discrepancy between exports and imports was greatlywidened in 1968 when exporting countries, anticipating restrictionsunder the International Sugar Agreement, shipped unusually largequantities in the last months of the year which were not recorded(and may not even have been received) by importing countries beforethe end of 1968.

- 19 -
Table 5: '3UGAR: ESTIMATE OF PRODUCTION14 IN NET EXPORTING COUNTRIESREQUIRD BY 1975
1966-68 Annual growth1975 average Change rate, percent
(------ Million metric tons - )
Consumption 31.90 24.oo 7.80 3.6
Addition to stocks .20 .20 -
Export demand2/ 16.35 14.95 1.40 1.1
ProductionrequiredL/ 48.45 39.15 9.20 2.7
1/ Equal to consumption plus stock increment plus estimated exportdemand; excluding exports retained by centrally planned importers.1966-68 average: For comparability with 1975 estimate, adjusted
to exclude the amount of Cuban production exported to andretained by centrally planned countries.
2/ 1975: Equal to net import demand (excluding centrally plannedcountries) adjusted for loss in transit.
1966-68 average: Net exports, excluding those retained in centrallyplanned countries.

- 20 -
quotas.-/ It should be borne in mind, however, that the shares used forthis purpose are necessarily current ones or, where available, those pre-determined for 1971. Even if, as has been assumed, market regulations willbe extended to and beyond 1975, at least some chlanges in the distributionare bound to be made. Under the terms of the International Agreementquotas might be revised for the years 1972 and 1973; further revisionsmight be decided when the Agreement comes up for renewal. In the case ofthe United States modification of shortfall distribution - the expectedpartial allocation to domestic areas - is likely to lead to changes in thecurrent proration of the remaining part among fcreign sources of supply.There is no way of gauging the nature and extent of such changes; in thefew instances where revisions can be anticipated, they have been taken intoaccount.
45. Estimates of 1975 export shares for major individual countriesand areas cover those under the International Agreement, the U.K. negotiatedprice quota, the U.S. import quotas, and also those under inter-Africanarrangements. They do not include exports of Cuba to and retained by cen-trally planned countries. A rough estimate of exports by Southern Rhodesia,which presently has no active quota under any of the existing arrangements,has been added.
46. Export shares under the International Agreement are expected tobe equal to 100 percent of basic export tonnages set for 1971 (7.88 milliontons)a/ plus entitlements for re-exports by centrally planned countriesimporting Cuban sugar (1.8 million tons),_:/ which give a total of 9.68million tons. Free market demand for 1975, including the adjustments forinventories and loss in transit mentioned above, comes to about 10 milliontons. This leaves an undistributed margin of 0.32 million tons, which wouldallow for exports by non-members in excess of the quotas allocated to them,by Southern Rhodesia and by new exporters.
1/ For current (or 1971) quotas under the International Agreement andunder special arrangements see Annex Table X-2.
2/ This figure includes basic export tonnages for members as well as forcountries which have participated in the negotiations but are not mem-bers of the Agreement. Total export tonnages of such countries amountto some 500,000 tons or 6.4 percent of the aggregate tonnages set for1971.
3/ No account was taken of the export entitlements for Indonesia (up to81,000 tons in any quota year) and for the Philippines (up to 60,000tons in any quota year when the level of the aggregate of quotas ineffect exceeds 100 percent of basic export tonnages). Indonesia isexpected to remain a net importer; aggregate quotas in the mid-seventiesare not expected to exceed 100 percent of basic tonnages.
- 21 -
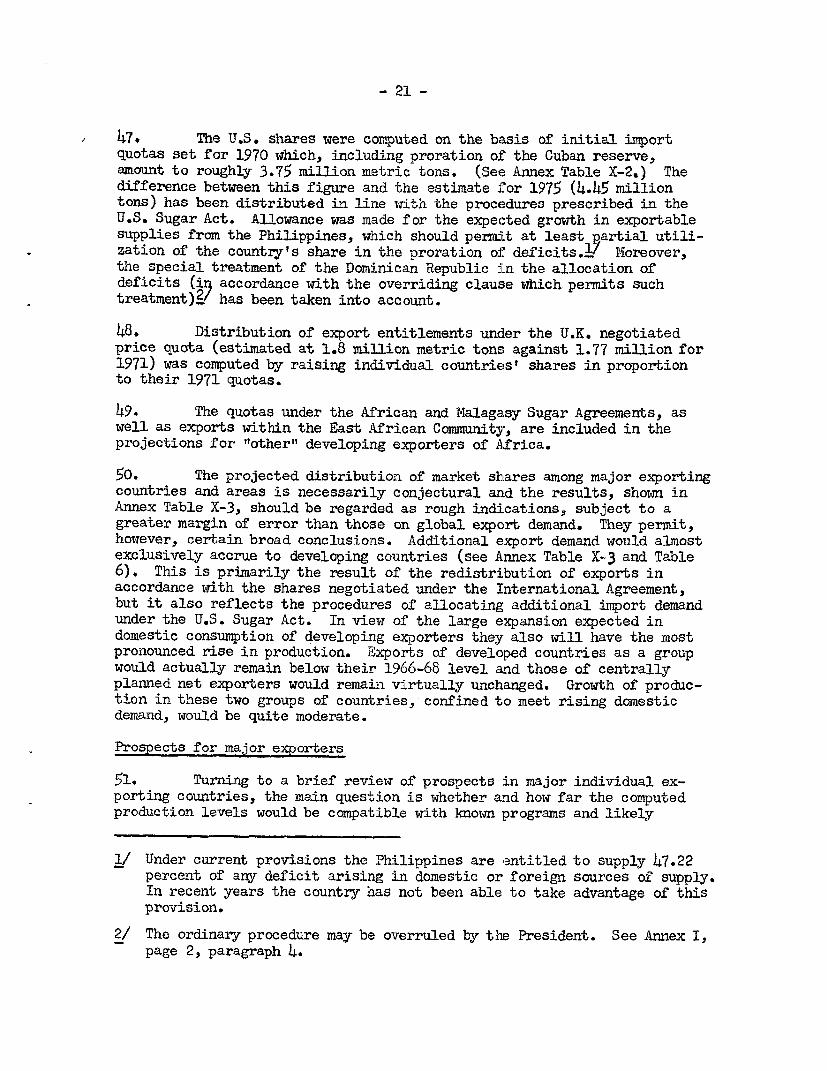
47. The U.S. shares were computed on the basis of initial importquotas set for 1970 which, including proration of the Cuban reserve,amount to roughly 3.75 million metric tons. (See Annex Table X-2.) Thedifference between this figure and the estimate Jor 1975 (4.45 milliontons) has been distributed in line witVh the procedures prescribed in theU.S. Sugar Act. Allowance was made for the expected growth in exportablesupplies from the Philippines, which should perniLt at least partial utili-zation of the country's share in the proration of deficits.2I/ M1oreover,the special treatment of the Dominican Republic in the allocation ofdeficits (izL accordance with the overriding clause which permits suchtreatment)i/ has been taken into account.
48. Distribution of export entitlements uncder the U.K. negotiatedprice quota (estimated at 1.8 million metric tons against 1.77 million for1971) was computed by raising individual countries' shares in proportionto their 1971 quotas.
49. The quotas under the African and Malagasy Sugar Agreements, aswell as exports within the East African Community, are included in theprojections for "other" developing exporters of Africa.
50. The projected distribution of market shLares among major exportingcountries and areas is necessarily conjectural and the results, shown inAnnex Table X-3, should be regarded as rough indications, subject to agreater margin of error than those on global export demand. They permit,however, certain broad conclusions. Additional export demand would almostexclusively accrue to developing countries (see Annex Table X-3 and Table6). This is primarily the result of the redistribution of exports inaccordance with the shares negotiated under the International Agreement,but it also reflects the procedures of allocating additional import demandunder the U.S. Sugar Act. In view of the large expansion expected indomestic consumption of developing exporters they also will have the mostpronounced rise in production. Exports of developed countries as a groupwould actually remain below their 1966-68 level and those of centrallyplanned net exporters would remain virtually unchanged. Growth of produc-tion in these two groups of countries, confined to meet rising domesticdemand, would be quite moderate.
Prospects for major exporters
51. Turning to a brief review of prospects in major individual ex-porting countries, the main question is whether anad how far the computedproduction levels would be compatible with known programs and likely
1/ Under current provisions the Philippines are entitled to supply 47.22percent of any deficit arising in domestic or foreign sources of supply.In recent years the country has not been able to take advantage of thisprovision.
2/ The ordinary procedure may be overruled by the President. See Annex I,page 2, paragraph 4.

- 22 -
Table 6: SUGIR: TENTATIVE ESTIMATES OF DISTRIBUTION OF CONIUMPTION, EXPORTSHARES AND PRODUCTION REQUIRED AMONG MAIN REAS I.N 1975 CO ARED TO 1966-68
Estimates 1975 1966-68 averageConsump- Export Prod.z' Consump- Net Produc-tion Shares Required tion Exports tionj /
----- (Million metric tons) - -------
Developing
Cuba' .70 2.15 4.65 .60 1.55 4.001.80 1.90
Other W. Hemisphere 10.80 5.oo 15.95 7.65 4.50 12.25Africa .40 1.10 1.50 .25 1.00 1.30Asia and Oceania 6.10 2.60 8.70 3.70 2.35 5.80
Total Developing(excluding Cuba) 17.30 8.65 26.15 11.60 7.80 19.35
Developed 10.70 2.80 13.50 9.15 3.00 12.25
Centrally Planned 3.20 .75 3.95 2.70 .75 3.55
Unallocated .20 .20
TotalExcluding Cuba 31.20 12.40 43.80 23.40 11.50 35.15Including Cubai/ 31.90 16.35 48.45 24.00 14.95 39.15
Annual average growthrates (percent)
DevelopingCuba 1.6 4.3 1.8Other 5.1 1.4 3.9
Developed 2.0 - 1.2
Centrally Planned 2.2 - 1.2
Total all exporters 3.6 1.1 2.7
Note: Totals may not add due to rounding. Growth rates computed beforerounding.

- 23 -
Footnotes to Table 6
Productic3. required in 1975 and actual 1966-68: totals and Cubanfigures exclude amounts exported to and retained by centrally plannedcountries. Production estimates for 1975 (total and for some areas)include some allowance for addition to stocks in exporting countries.
2/ Cuba: exports for 1975 equal to basic export tonnages under theInternational Sugar Agreement (2,15 million tons) plus export andre-export entitlements of centrally planned countries importing Cubansugar (1.8 million tons). Those for 1966-68 are exports to the freemarket plus re-exports by centrally planned countries importing Cubansugar.
Source: Based on Annex Table X-3.

. 2 4 -
developments in the countries concerned. Obviously the programs of coun-tries whose exports are subject to restrictions under the InternationalSugar Agreement and other arrangements would take account of these res-trictions as well as of prospective domestic needs. But their own projec-tions in both respects may considerably differ from those presented here.Moreover, some countries may aim at and count on securing larger exportshares when renewal or revision of existing arrangements will make possibleat least some redistribution of quotas.
52. As mentioned earlier, production in Cuba during the currentseason has exceeded 8 million tons permitting - i addition to free marketexports, direct and indirect, as provided for under the InternationalAgreement - large shipments for domestic consumption in the USSR and othercentraUly planned countries. Decisions on future production will probablybe determined in the main by prospective demand in these markets. Domes-tic needs in Cuba are comparatively small; most of the country's outputis produced for export.
53. This also holds true for the Dominican Republic, where domesticconsumption is absorbing less than one-fifth of 1production. For a numberof years production showed a fairly stable trend, around .8 to .9 milliontons., but starting in the mid-sixties the countr;y experienced severalvery poor crops, mainly caused by adverse weather conditions. The 1969crop was back to "normal" and some further increase is expected in 1970.It also has been reported that considerable capital has been invested toimprove operations and to modernize existing mills.2/ According topresent intentions, production in the near future will be raised to about1 million tons. This will not require the addition of new mills or acreageand no such additions are planned. Exports in riecent years have beenentirely absorbed by the U.S.; apart from its basic quota and its sharein the proration of the Cuban quota, the Dominican Republic has beenallocated a "preferentialt' proportion of the Puerto Rican deficit. Underthe expected modification of the deficit distribution the share in thelatter would be much smaller, but the country is seeking an increase inits basic quota. The country also has a quota under the InternationalAgreement. Even if it succeeded in securing a larger share on the U.S.market, both the U.S. and free market quotas as well as domestic require-ments could be comfortably met by maintaining production at about 1million tons.
54. The West Indies and Guyana also produce sugar mainly for export,most of which is directed to the U.K. and the U.S. under special arrange-ments. Practically all of the group's free market exports are sold toCanada, where Comnonwealth exporters have tariff preferences. Productionrequired to meet expected needs in 1975 of about 1.4 million tons2/ would
1/ USDA, Foreign Agricultural Service: Annual Report on Sugar, May 6,1970, by Agricultural Attache in the Dominican Republic.
2/ See Annex Table X-3.
- 25 -
have to be raised only moderately, about 1 percent per year. All coun-tries in the group are attempting to develop alternative sources offoreign exchange, including tourism. In some of them the sugar industryhas various problems, including labor shortage, for which solutions arebeing sought. Provided that present difficulties can be overcome, theminor rise in production needed to cover expected requirements could beachieved; it is unlikely, however, that output would be expanded beyondthat level.
55. Peru is the only other major exporter in the Western Hemispherewhose exports exceed domestic consumption. However, the share of the lat-ter in total production is rapidly rising - from 35 percent in the latefifties to 45 percent in recent years. This trend is expected to continuefurther. Production over the past decade has remained fairly stable -around 750,000 to 800,000 tons. In order to bring production to theexpected 1975 requirements of 1 million tons expansion at an annual averagerate of some 3.5 percent would be needed. There is some doubt, however,whether this will be feasible. Under the agrarian reform program beingcarried out in the country, most of its large sugar plantations have beenexpropriated. Even though it is planned to farn the land as cooperativeswnder central government guidance, such a changeover causes, as a rule,at least temporary reducuion in output. It is ,ifficult to visualizerecovery and the required rise in output being achieved by 1975.
56. In most other exporting countries of the Western Hemisphere thegreater proportion of production, varying from about 70 percent in Mexicoand Colombia to over 90 percent in Argentina, is domestically consumed.Prior to 1960, i.e., before gaining access to the U.S. market, a numberof these countries were only minor or sporadic exporters. This appliesi.a. to Brazil currently the second largest exporter of the Hemisphere,surpassed only by Cuba. Large expansion of Brazil's output, from 3.2million tons in the late fifties to well over 4.2 million tona in 1967-69,has permitted a steadier and increasing flow of exports. In recent yearsthey have reached over 1 million tons, of which more than half has beenshipped under the U.S. quota. Domestic consumption is expected to main-tain its fast rate of growth, while exports in the mid-seventies, restric-ted by quotas, would not exceed their current level. There appears to beample scope for further expansion of output through extending acreage,raising yields and perhaps also by diverting cane from alcohol to sugarproduction. Internal prices and production are controlled by the Sugarand Alcohol Institute and it is expected that ouitput will be geared tocover rising domestic needs as well as demand for exports.
57. Production in Mexico increased even more rapidly - from 1.4million tons in 1958-60 to 2.4 millioni tons in recent years - and, inspite of fast growing domestic demand, rising quantities have becomeavailable for export. By far the greater part of the country's exportshave been absorbed by the United States; only about one-fifth have beensold on the free market. Although sorme further increase in export demandis expected by 1975, most of the additional prodluction requirements will
- 26 -
arise from expanding domestic consumption.V/ T'o meet demand on bothfronts production would have to be raised at an average annual rate ofsome 3 percent, considerably less than during the sixties. It has beenreported that the iexican sugar industry was in urgent need of moderniza-tion and re-structuring; but current domestic prices were not conducivefor investment.2/ In recent years the government has authorized specialfinancing and seems to have assumed an active role in the program of re-structuring the industry.
58. Colombia has more than doubled production during the pastdecade and has become a net exporter of increasing quantities. The U.S.has been the largest single market for Colombian sugar, but nearly 4alf ofthe exports to this country have been "non-quota t' at world prices.3i Likevarious other exporters, Colombia is seeking an increase in its basicquota; however, even if these efforts should succeed the expected changesin the proration of deficits make it unlikely that quota exports will risebeyond the level of recent years, i.e., some 60,000 metric tons. Domesticconsumption is rapidly rising, partly because of growing urbanization andsubstitution of centrifugal sugar for "panela"l which is widely consumedin rural areas. During 1969 Colombia has not fully utilized its quotaunder the International Agreement and it has been reported that a similarcourse will be taken in the current year. There is ample scope for ex-panding output and, if the country wished to do so, there should be nodifficulty in meeting rising domestic consumption and making full use ofits export quotas.
59. The share of Africa in total exports of developing countriesis rather small and not expected to increase. Exports of I4auritius, thelargest exporter in the group, would hardly rise beyond their level inrecent years;!/ domestic consumption, although expected to grow, willremain very small both in absolute terms and in relation to exports.Practically no expansion of output would be required and, in view of thescarcity of suitable land, would hardly be sought. Swaziland, the secondlargest developing exporter of Africa, would have a modest increase inexports; the rise in domestic consumption would also be small._ Wlithample land resources available, the country could expand production farbeyond what will be needed to meet domestic and export demand in 1975.The quotas of Southern Rhodesia under the U.S. Sugar Act and the Common-wealth Agreement have been suspended; the country is not a member anddoes not hold a quota under the International Agreement. Its exports,
1/ See Annex Table X-3.
2/ J. H. Christman: "Sugar Industry Goes Bittersweet", Mexican-AmericanReview, liovember 1969.
3/ As mentioned earlier, such exports are admit;ted in limited quantities,for use as animal feed, production of industrial alcohol or re-exportin sugar-containing products.

- 27 -
which were higher before, declined to about 65,ooo tons in 1966-68reflecting, no doubt, the limitation of export markets. The forecastused for 1975 - 90,000 tons - is not more than a rough guess, based inpart on the country's earlier performance. Like other countries in thearea, Southern Rhodesia has ample scope for expanding production andwould have no difficulty in meeting anticipated domestic needs and exportdemand in 1975.
60. Exports of Asian countries have been stagnant through most ofthe sixties. The cessation of exports from Indonesia, after a brief andonly partial recovery in the fifties, has alread;y been mentioned. China(Taiwan), whose exports are mainly sold on the free market, has greatlyreduced its previously high dependence on sugar trade; production,apart from minor year to year fluctuations, has remained much the sameover the past decade. Domestic consumption absorbs about one-fifth oftotal output, most of which is exported. The International Sugar Agree-ment quota, together with the small quota on the U.S. market, willpermit only a minor expansion of exports; even though domestic consump-tion should rise faster, only a modest expansion of output (not beyondthe level reached ii the mid-sixties) would be required to meet domesticand export demand.2 , Unless free market prices should rise to much moreattractive levels the country would hardly be temnpted to aim at a greaterexpansion and a higher export quota.
61. In India, the largest producer of Asia, most of the sugar pro-duced is consumed in the country, only a small fraction being exported.Yet per caput consumption of (centrifugal) sugar remains very low and,according to recent reports, strong efforts are under way to expandoutput and consumption.-2' Measures have been taken by the government toencourage diversion of cane from. the production of Gur (non-centrifugalsugar) to the centrifugal sugar industry. Moreover, sugar beet is nowgrown on an experimental basis; should this prove successful, anadditional source could be opened, which in a few years could augmentsugar derived from cane. It nevertheless is doubtful whether the originalconsumption target of 5.3 million tons by 1975 can be reached. Consump-tion projected in this paper is lower - 4.6 million tons by 1975. Produc-tion required to reach this level and to meet the country's modest exportquotas would have to rise to nearly 5 million tonls as against 3.2 millionon the 1965-69 aver4age, implying an annual growth rate of about 5.6 per-cent.3/ This would be more than twice the average rate (2.6 percent) in
1/ See Annex Table X-3.
2/ See C. Czarnikow Ltd., Sugar Review Ho. 954, January 22, 1970.
3/ Production in 1967 and 1968 was severely reduced by drought; ittherefore appeared more realistic to use the broader five-year average1965-69, which includes two years with "normal" and one with very highproduction.

- 28 -
the preceding eight years (1957-61 to 1965-69); yet the great effortsbeing made toward raising output and the record 'Level of nearly 4.2million tons attained in 1969 suggest that expansion to an average of5 million tons in the mid-seventies is well within reach.
62. The Philippines are exporting the greater part of their produc-tion. For many years their sugar has been sold exclusively to the UnitedStates under the preferential conditions providedi for under the Agreementwith the U.S. and the U.S.. Sugar Act.l/ Yet pro(duction in the Philippineshas been virtually stagnant through the sixties while domestic demand hasbeen rapidly rising. As a result, the country has found it increasinglydifficult to fill its quota (1,020,000 metric tois) and, indeed, has notbeen able to take advantage of its entitlement to supply some 47 percentof any deficit in the quotas of other suppliers. Eager to maintain itsprivileges on the U.S. market, the country is aiiing at a gradual expan-sion of output, mainly +-hrough establishing a number of new mills. Produc-tion in 1970, forecast at some 1.8 million tons, should enable the countryto supply part of its share in the current deficit. The expected modifi-cation of the proration of deficits after 1971 would greatly reduce allo-cations to foreign suppliers; moreover, distribution among the lattermight be altered. There is no way of predicting how this would affectthe share of the Philippines. i'Ror is it possible to forecast whether andto what extent the country's basic quota might be raised. The projectionused for 19752 /as been arrived at by adding 100,C00 tons to the presentbasic quota.2_ Domestic consumption, which continues to rise throughpopulation growth and increasing per caput intake, is expected to reach920,000 tons. Production in 1975 required to cover domestic needs andthe projected share on the U.S. market would havet to reach 2.04 milliontons, somewhat less than the country's own target of 2.1 million for 1974.Taking into account that the figure of 2.04 million tons does not allowfor addition to stocks the difference is quite small; moreover, the shareon the U.S. market may have been somewhat underestimated. It should beadded, however, that the "free market" is not likely to provide an addi-tional outlet. The export entitlement of up to 60,000 tons under theInternational Agreement would apply only when aggregate quotas in effectexceeded 100 percent of basic export tonnages; it is not expected thatthis will be the case.
63. Production in Fiji has increased from some 200,000 tons in thelate fifties to some 350,000 tons in recent years, most being exported.Roughly half of the island's exports move to the U.K. and U.S. at special
1/ For details on the determination of the Philippine quota under theU.S. Act see Annex I, page 2.
2/ The figure of 100,000 tons would be roughly equal to 47 percent (i.e.,the current share of the Philippines) of the deficit proration toforeign suppliers expected in the mid-seventies; it would not allowfor an increase in the basic quota.

- 29 -
prices, the balance being mostly shipped to Canada and New Zealand.Quotas under special arrangements and the International Agreement providelittle scope for further expansion; production, however, could be raisedconsiderably through improving yield on present acreage and with existingmilling capacity; the industry has been described as efficient and wellorganized.
64. Nearly one-fifth of net exports in recent years have been sup-plied by developed countries, notably Australia and South Africa. Australiahas greatly expanded production and exportable supplies over the pastfifteen years. Up to 1953 production amounted to less than 1 million tonsand the greater part was consumed in the country., Subsequently productionrose much faster than domestic needs; this movement gained further momen-tum throagh the admission of Australian sugar to the U.S. market andthrough the temporary price boom in the mid-sixties. In recent yearsoutput has exseeded 2.5 million tons and hardly more than 25 percent hasbeen consumed in the country. Mechanization of cane cutting on a largescale has reduced cost of production, yet there remains a sizeable highcost sector and during the last few years of depressed world prices pro-duction has been heavily subsidized. The quota under the InternationalAgreement places a limit on market outlets and the present policy of thecountry is to eliminate high-cost production, thus bringing down totaloutput to anticipated export opportunities and domestic needs. However,there are also plans, perhaps of longer range, to raise efficiency in thehigh-cost sector; there can be no doubt that the country could, withoutdifficulty, expand production to and beyond the level of recent years ifthis were called for by market developments.
65. South Africa is renowned as a low-cost producer with ampleresources for further expansion. EXports have rapidly increased throughthe sixties; those under special arrangements are confined to compara-tively minor quantities under the U.S. quota, the bulk being sold on thefree market. But these latter exports will have to be scaled down to thequota accepted under the International Agreement. However, domesticconsumption is growing fast and a rising proportion of output will beabsorbed within the country. Hence, even though exports are likely toremain well below the 1966-68 level, the expected advance in domesticrequirements will call for a moderate expansion of output. In view ofthe ample resources in the country a much greater expansion would, nodoubt, be feasible.
66. The EEC_group, the main exporter which participated in the nego-tions but did not join the Agreement, had been offered a basic export ton-nage of 300,000 tons. In addition, the French Overseas Departments in theWest Indies have a quota on the U.S. market of about 60,000 tons. Althoughnet exports of the group (including those under the U.S. quota) amounted inrecent years to only 240,000 tons,V/ the heavy subsidies on production and
1/ Exports of the group have shown wide year to year fluctuations; in 1967the group actually was a net importer of some 90,000 tons against netexports of 170,000 tons and 64o,ooo tons in 1.966 and 1968 respectively.

- 30 -
trade under the Common Market sugar policy could produce exportable sur-pluses well in excess of those in previous years. However, the consider-able financial burden caused by present arrangements suggests that thelatter will be revised; although attempts in that direction have beenmade, they have not yet succeeded. It is to be expected that effortswill be renewed and it is not un='easonable to asswme that exports by thegroup in the mid-seventies would not, or not appreciably, exceed theInternational Sugar Agreement tonnage offered plas the U.S. quota assignedto the French est Indies. lNevertheless, the lack of a commitment to thateffect does leave an element of uncertainty concerning the group's futureexports. Even though average exports may remain close to the InternationalAgreement and U.S. quotas, it cannot be taken for granted that this wouldalso hold on a year by year basis, and the danger of at least some dis-turbances through larger exports in any particular year cannot be ruledout.
67. Denmark has made it known that production will gradually beadjusted to cover domestic requirements only. A'Lthough the country'squota is small - 41,000 tons - its relinquishment would permit some ex-pansion in other countries' exports.
68. Basic export tonnages for the net exporting centrallyplamedcountries!/ will leave their exports at much the same level as in 19 -68.However, in these countries net exports have absorbed not more than 15-30percent of total production, the greater part be:ing absorbed by high andrising domestic consumption. Dcmestic requirements are expected to risefurther and to call for expanded production; exports from Hungary, thesmallest exporter of the group with a quota of 51,000 tons, have beenfalling off in recent years and it has been repor-ted that the countrywill become a net importer. This would again permit some expansion inother countriest quotas, possibly within the centrally planned group.
1/ Czechoslovakia, Hungary, Poland and Rumania. The last mentionedcountry (with a quota of 46,Oo tons) has not joined the Agreement.

- 31 -
III. PROSPECTIVE DEVELTOP WT Oi THE 1LD MRET
69. By combining the forecasts for net exporting and importingareas!/ a more comprehensive view can be gained of prospective (as com-pared to past) developments on the world sugar market. World consumptionbetween 1966-68 and 1975 is expected to increase by some 17 million tons,slightly more than in the preceding eight-year period (see Table 7). Theexpected rise in production by 16 million tons would be much the same asin the preceding eight years. Total production of some 81.5 million tonsin the mid-seventies would cover consumption and permit gradual upwardadjustment of working stocks; the apparent produiction surplus in the twopreceding periods would disappear. The projectedi balance between consump-tion and production in 1975 is not accidental: it results from the methodused in projecting production in net exporting countries (domestic consump-tion plus export requirements plus allowance for stock adjustment). Aspointed out earlier, it is to be expected that exporting countries, inplanning their production, will be guided by similar considerations .2/
70. The future growth rates of both world consumption and produc-tion will be lower than they were in the eight-year period preceding1966-68. As indicated by the data in Table 8, the slowdown will be mostpronounced in the centrally planned countries where consumption and outputhad sharply advanced in the earlier period. Production developments inthese countries are closely linked with those of Cuba. Should Cuba'souitput be maintained at not less than some 7.5 million tons, thus per-mitting a larger and steadier flow of exports to this grcup, productionof the latter is expected to expand only moderately; additional consump-tion would be largely met by supplies from Cuba.
71. The decline in the growth of consumption in developed countriesreflects, in part, a lower rate of population growth anticipated for thesecond period, but also the high level of per caput consumption in manycountries of that group, which limits the scope for further increase.Ekpansion of output in the group will also slow down, largely as a resultof expected developments in Australia and South Africa, where the sharpadvance in the earlier period will be severely restricted through theexport limitations under the International Sugar Agreement.
1/ The data in this section refer to "most likely" estimates; for Cuba andthe centrally planned countries the midpoint of the ranges shown has beenused. The figures for developed and for developing countries in Table 7are slightly higher than the sum of "net importing" and "net exporting"countries in Section II. They include data for three countries - Austria,Burma and Tanzania - which have become self-sufficient in recent years.Production, roughly equal to consumption, of these three countries in1966-68 amounted to 320,000 tons, 70,000 tons and 75,000 tons respective-ly. Data for these countries have been included in order to round outworld totals.
2/ See discussion on pages 3 and 21 above.

- 32 -
Table 7: SUGAR: PROJECTED CONSUMPTION AMD PRODUCTION BY MAIN AREASIN 1975 COMPARED TO 1958-60 ANqD 1966-68 AVERAGES
(Million metric tons)
Consumption Production1958-60 1966-6d 1975 1958-60 1966-68 1975
Developed 23.1 28.55 33.8 16.3 21.8 24.9
Developing(excluding Cuba) 13.2 18.2 26.3 17.0 22.1 30.85
Cuba .3 .6 .7 5.85 5.5 7.5
Centrally planned 10.5 16.4 20.25 10.3 16.1 18.3
World 47.1 63.75 81.05 49.45 65.5 81.55
Sources: 1958-60 and 1966-68 data: International Sugar OrganizationSugar Yearbook, various issues. USSR Central StatisticalAdministration: Official Statistical Yearbook, various issues.

Table 8: SUGAR: ANNUAL AVERAGE GROWTH HATES AND CI111AGE IN TIIE SHAREBS OF MAIEN AREAS IN *)RL'D C07EMPTIONAND PRODUCTION, 1958-60 TO 1975
Annual average growth rates, percent Percent share in world totalConsumption Production Consumption Production
1958-60 1966-68 1958-60 1966-68to 1966-8 to 1975 to 1966-8 to 1975 1958-60 1966-68 1975 1958-60 1966-68 1975
Developed 2.7 2.1 3.7 1.7 49.0 44. 8 41.7 32.9 33.3 30.6
Developing
(excluding Cuba) 4.0 4.7 3.3 4.3 28.0 28.5 32.4 34.4 33.7 37.7
Cuba 9.1 1.5 - 4.0 .7 1.0 .9 11.9 8.4 9.2
Centrally Planned 5.7 2.6 5.8 1.5 22.3 25.7 25.0 20.8 24.6 22.5
World Total 3.8 3.1 3.6 2.8 100.0 100.0 100.0 100.0 100.0 100.0
Source: See Table 7.
- 34 -
72. In the developing countries (excluding Cuba) both conaumptionand production growth will accelerate, the latter mainly in order to meetadditional domestic requirements. Po-ulation growth in these countriesis anticipated to continue at the high rate of 2.5 percent per year;moreover, with the notable exception of the Wiestern Hemisphere, per caputconsumption in most of the developing countries is very low, leavingample scope for further increase.
73. As a result of the wide differences in the growth rates ofmajor areas, there will be a marked shift in the distribution of bothworld consumption and production. The downward trend in the proportionof sugar consumed by developed countries will continue. This group, withsome 20 percent of world population, accounted in the late fifties foralmost half of world sugar consumption. This high proportion has graduallydiminished and is expected to decline further to about 42 percent in themid seventies. The share of developing countries, which has hardlychanged in the sixties, is expected to advance considerably - from 28.5percent to 32.4 percent between 1966-68 and 1975. Little change isexpected for centrally planned countries.
74. On the production side the shares of Cuba and of other develop-ing countries will gain, while those of the other two groups, for reasonsdiscussed earlier, will decline.
International trade
75. As pointed out in Section C above (see Table 5), by far thegreater part of additional production in exporting countries will berequired to meet growing domestic consumption; the rise in export demandwill be rather small. Hence production consumed in exporting countrieswill absorb a larger proportion of their output, increasing from about60 percent in 1966-68 to some 66 percent in the mid-seventies. Thisdevelopment corresponds to the trend in importing countries, where theshare of consumption met by domestic production is expected to grow from46 to 49 percent. The secular trend of a declining share of trade inworld production and consumption will thus continLue.
76. No change is expected in the roundabout way of sugar tradewhich has developed following the cessation of U.S. imports from Cuba.The greater part of Cuban sugar will continue to be shipped to the USSRand other centrally planned countries and partly be re-exported to thefree market. The area distribution of U.S. and U.K. imports under theirspecial arrangements will remain much the same, though some shifts inU.S. quotas for individual countries may occur.
77. As indicated in Table 9, which provides a rough indication ofthe 1966-68 and the projected 1975 network of trade among major areas,some two-thirds of developing countries' exports have been absorbed bythe U.S. and the U.K. under special arrangements, at prices far abovethe prevailing world price level. Since import demand by these two^ountries is expected to grow more slowly than demand on the free market.
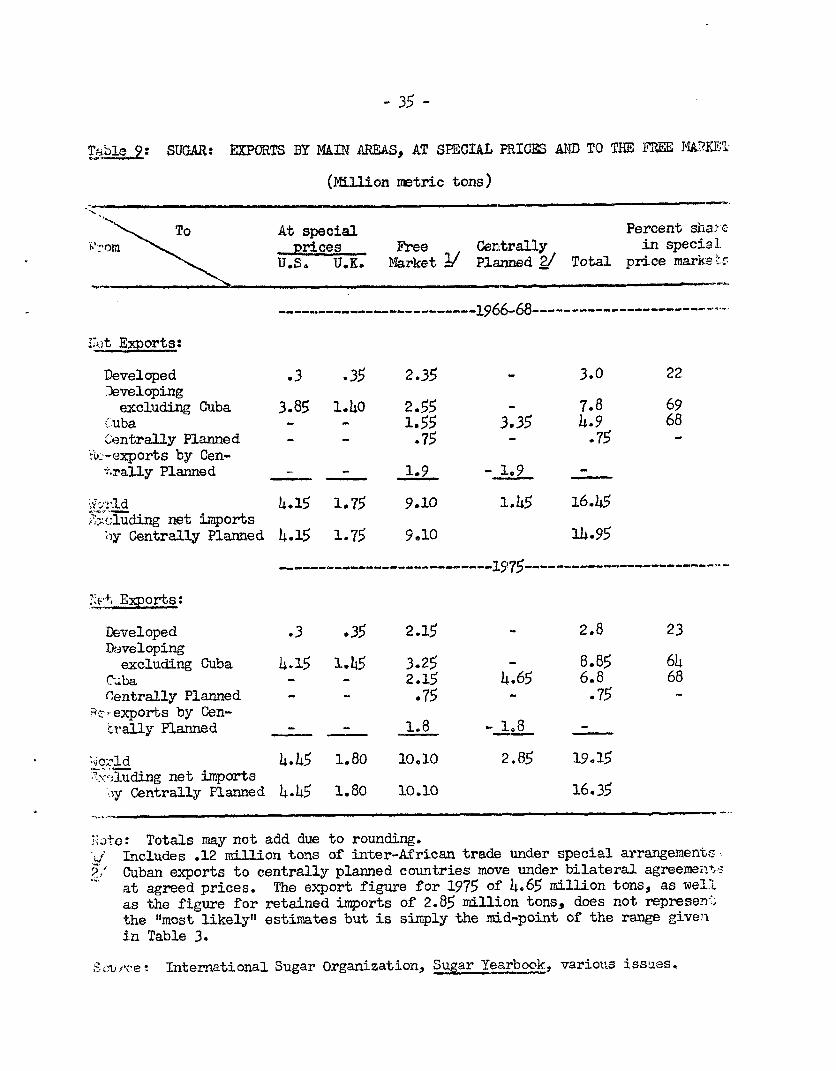
- 35 -
~~Ibm_: SUGAR: EXPORTS BY MAIN AREAS, AT SPECIAL PRICES AND TO THE FREE MAOKE;1
(million metric tons)
To At special Percent shaycprices Free CentralJly in special.
U.S. U.K. Market 1/ Planned 2/ Total price markaet'
- ------- -- - ----------1966-68----------------
.et Exports:
Developed .3 .35 2.35 - 3.0 22Developingexcluding Cuba 3.85 1.40 2.55 - 7.8 69
'uba - - 1.55 3.35 4.9 68Centrally Planned - - .75 - .75 -
.-exports by Cen-,.rally Planned - - 1.9 -1.9 -
4.15 1.75 9.10 ].45 16.45,Y.Kwluding net imports
'oy Centrally Planned 4.15 1.75 9.10 14.95
- ----------------- ----- 15975---- ---
?2e*, Exports:
Developed .3 .35 2.15 - 2.8 23Developingexcluding Cuba 4.15 1.45 3.25 - 8.85 64
(Iba - - 2.15 4.65 6.8 68(Centrally Planned - _ .75 - .75 -
R-exports by Cen-trally Planned - - 1.8 - 1.8
4.45 1.80 10.10 2.85 19.157x,;luding net imports
.y Centrally Planned 4.45 1.80 10.10 16.35
30e: Totals may not add due to rounding.Vf Includes .12 million tons of inter-African trade umder special arrangements".. Cuban exports to centrally planned countries move under bilateral agreemeiqt,--
at agreed prices. The export figure for 1975 of 4,65 million tons, as wellas the figure for retained imports of 2.85 million tons, does not represen-,the "most likely" estimates but is simply the mid-point of the range givenin Table 3.
Ie.ZVCe International Sugar Organization, Sugar Yearbook, various issues.

- 36 -
the proportion of developing countries' exports sold at "special prices"will decline. Shifts in the distribution of free market shares will belargely the result of the quota allocation under the terms of the Inter-national Sugar Agreement. Exports of developed countries will be re-duced, both in relative and absolute terms. There will be a minordecline in the share of centrally planned net exporters but no change inthe export volume. The greatest gain will accrue to Cuba, whose sharein direct exports will rise from 17 to almost 22 percent; re-exportsvia centrally planned importers of Cuban sugar will slightly decline.Developing countries other than Cuba will also gain; their share infree market exports is expected to advance from 28 to 32 percent.
Prices
78. Free market prices through the sixties have been subject toviolent gyrations (see Table 10). The sharp advance in 1963 was causedin the main by a temporary, stringent shortage, following two consecutivecrop failures in Cuba and uncertainty about future developments in thatcountry. Accelerated and unrestricted expansion of output in nearly allareas1/ led to large and persistent surpluses, which in turn were respon-sible for the steep and protracted downturn of prices. Recovery in 1969may be credited, in part, to the resumption of operations of the Inter-n&ional Agreement,.2/ but it also reflected improved market conditions.
79. U.S. prices, though not rigidly fixed, are maintained throughquota manipulations which aim at a "price objective" rising with the U.S.farm parity index. (See Annex I, page 2.) The (f.o.b.) price receivedby exporters differs from the domestic price by the amourt of duty(0.625 cents per pound), freight and insurance. The data in Table 10,which state prices in f.o.b. terms, indicate that they have been gener-ally well above the world price level.
80. The Commonwealth price paid for U.K. imports under the nego-tiated price quota is agreed between the U.K. and Commonwealth exportersat intervals for a number of years in advance.3 The price is stated insterling and the reduction in 1968 and 1969, in terms of cents per pound,reflects the devaluation of the pound late in 1967.
1/ Suspension of the International Sugar Agreement in 1961 also removedlimitations on expansion of output.
2/ The present Agreement aims at maintaining prices within a range of3.25 to 5.25 cents per pound f.o.b.; prices during 1969 were thusclose to the lower limit of the range.
3/ The basic price is currently L43.10.0 per long ton, bulk, f.o.b.Developing countries receive in addition Il.l0.0 plus a variablebonus - varying inversely with world market prices. The series giveain Table 10 refer to prices received by developing Commonwealth ex-porters (presently all except Australia).

- 37 -
Table 10: SUGAR: PRICES!/ ON THE INTERNATIONAL MARKET
(U.S. cents per pound)
Unit value'Worldt U.S. Common- (developing
wealth_ / countries)
1960 3.14 5.35 5.44
1961 2.70 5.34 5.52 4.75
1962 2.78 5.56 5.61 4.83
1963 8.29 7.28 5.64 6.50
1964 5.72 5.98 5.64 6.48
1965 2.03 5.80 5.82 4.66
1966 1.76 6.o4 5.94 4.64
1967 1.87 6.32 5.94 4.74
1968 1.85 6.54 5.10 4.67
1969 3.20 6.75 5.10
1970 January-HIay 3.35 6.88
1/ F.a.s. or f.o.b. Caribbean or Brazilian ports.
2/ Starting in 1965 the figuresinclude the special payments to develop-ing countries introduced in that year.
Sources: International Sugar Council Sugar Yearbook and Monthly Bulletin,various issues. USDA Sugar Report, various issues. FAO Stateof Food and Agriculture and Trade Yearbook, various issues.

- 38 -
81. Concerning future developments it appears safe to assume thatthe U.S. price will continue to move with the farm parity index and, inall likelihood, continue its slow upward movemeint. The U.K. price hasbeen set with the aim of providing e.xporters with a "remunerative"return; it has changed very little over the last decade and may be ex-pected to be maintained between 5 and 6 cents per pound.
82. The fate of the free market price will. largely depend on theability of the International Sugar Agreement to keep exports (and export-able production) in line with import demand. Thne production estimatespresented in this paper are based on the assumption that this wyill be thecase. As indicated earlier, import demand on the free market w4ill be ona level which would cal, for export quotas close to or at 100 percent ofbasic export tonnages.1z Under existing International Sugar Agreementprovisions quota adjustments are linked to prevailing market prices;quotas equal to 100 percent of basic tonnages would correspond to amarket price of around 4 cents per pound. It may be concluded on thisbasis that average prices in the mid-seventies will be close to thatlevel. /
83. The "forecast" of a free market price of some 4 cents perpound has obviously not been derived as the equilibrium level iwhich wouldequate demand and supply on the residual market. As pointed out earlier,import demand is highly inelastic and the estimated volume would remainmuch the same within a price range of, say, 3 to 4.5 cents per pound.This leaves the question whether at a price of some 4 cents per pound anadditional export volume of about 1 million tons (as compared to the1966-68 average) would be offered.
84. In approaching this question it should be recalled tiat theincrement in free market demand accounts for onLy a small fraction - some11 percent - of the additional demand from all sectors of the market,including domestic requirements in net exporting countries. The latteraccount for about 85 percent; the remaining 4 perce:t represents increas-ing dermand under special arrangements.3/ Hence the average return perunit of additional output by net exporting countries as a group will beheavily weighted by their domestic prices.
1/ Since January 1969, when the new Agreement started operations, quotashave been held at 90 percent of basic export tonnages. Shortfalls ofparticipating exporters during 1969 have not been redistributed; henceaggregate effective export quotas in that year were as low as 80 per-cent of basic tonnages.
2/ The provisions of the Agreement do not allow for changes in the generalprice level; the prices referred to as well als the average price expectecdto prevail in the mid-seventies are expressed in terms of actual prices,
3/ See Tables 4 and 9. The figures do not include additional demand forsugar to be retained in net importing centrally planned countries.

- 39 -
85. However, as indicated earlier, the distribution of additionaldemand by market sectors varies widely among indLividual countries. Anumber of them, notably the net exporters in the Caribbean, severalAfrican countries and Fiji, are producing mainly for export; domesticconsumption (of less than 15 percent of output) and its growth are quitesmall and average returns per unit of additional sales would come closeto the free market price.17 In China (Taiwan) and Australia the percent-age of output consumed in the country is somewhat higher - some 20 and27 percent respectively 2_ - and if in expanding output these ratios weremaintained, the weight of the domestic price would be greater than in theother counitries mentioned.
86. If it were assumed (a) that any increase in output of countriesmainly producing for export would require the establishment of additionalmills and expansion of acreage and (b) that total cost per unit (i.e.,variable plus interest and amortization over say 15 to 20 years) wouldhave to be covered by the free market price (or a price fairly close tothat level), one could safely maintain that a free market price of 4 centsper pound would hardly be sufficient.i/ However, neither of these assump-tions is realistic.
87. Even within the group of countries here mentioned, additionalexports of about 1 million tons could in fact be supplied, wholly orlargely by fuller utilization of existing mill capacity and probably alsowithout much, if any, expansion of acreage. This would require, however,a distribution of additional expo4 s different from the pattern of sharesunder the International Agreement.4/ So long as prices would have to
1/ This would not apply for Cuba, as part of additional exports would goto centrally planned countries at prices higher than 4 cents per pound.For others, additional exports to special price markets, if any, wouldbe negligible.
2/ The percentages refer to the 1966-68 average., See Annex Table X-1.
3/ Variable costs differ widely among individual countries and areas; thesame would apply to the cost of expanding acreage. A rough indicationof the cost per ton of establishing new mills can, however, be gaugedfrom data on investment in additional mills in a number of countries.Provided utilization at full capacity, the average cost per ton rangedfrom $280 to $315. Based on a price of $300, an interest rate of 7 per-cent and equal paymaents over 20 or 15 years, annual debt service wouldamount to roughly $28 or $33 per ton (i.e., about 1.3 to 1.5 cents perpound). This would leave less than 3 cents to cover variable costs plusthose for investment in additional acreage; scattered data on productir,>costs suggest that these costs could not be met at a price of 4 centsper pound.
4/ As discussed earlier, current mill capacity and acreage in most of thecountries under consideration would be sufficient to expand exports eve;beyond their prospective shares. Australia, under the terms of tll ;ment, actually had to cut back production ard exports on a s. 7tab e 3C:i i.

- 40 -
cover variable costs of operation and maintenance, which on the marginmay be quite low, countries would find it profitable to expand exports ata price of 4 cents per pound.
88. Wiith respect to those countries for which expansion of produc-tion will primarily be required to meet growing domestic needs, there canbe no doubt that the majority will have to add new mills and probablyexpand acreage. But here average returns on additioral production willcome close to the domestic price, which as a rule is higher than 4 centsper pound. As in the past, some countries woulcd cover losses on exportsby charging higher prices to domestic consumers; soine would subsidizeboth domestic consumption and free market prices and some may choose notto utilize their free market quotas. Any such deficits could easily beprorated to other countries, eager to expand their exports.
89. In the majority of exporting countrieE, where the sugar market -for domestic consumption as well as for exports - is strictly controlledby the governments, decisions to expand exports will not be based on themarginal but rather on the average price received. Most of the develop-ing countries export the greater part of their sugar trade under specialarrangements to the U.S. and the U.K., where prices in 1975 should bearound 7 to 8 cents per pound and 5 to 6 cents per pound respectively;hence the average should be close to 6 cents, a price which would beprofitable for most if not for all exporting countries.
90. The foregoing considerations strongly suggest that at a "freemarket" price of 4 cents per pound, demand on that market would be fullymet.

Summary of Ylain Arrangements Regulating Trade on theInternational Sugar, H-arkiet
1. The following summary of special arrangements between majortrading areas and of the International Sugar Agreement is not intended tobe exhaustive; it is largely confined to the features which are relevant,in connection with the medium-term projections presented in the main partof the paper.
The U.S. Sugar Act
2. Sugar imports into the United States as well as domestic (main-land and offshore) supplies are regulated by the U.S. Sugar Act. Initial1yadopted in 1934, the Act was renewed in 1948 an(d has since been repeatedlyamended and revised, last in 1965 when it was extended to the end of 1971.The essential features remained unchanged: prospective requirements, es-timated by the Secretary of Agriculture for each calendar year (subject tolater revision) serve as a basis for quota allocation. Specific quotasare assigned to mainland and offshore producers (Hawaii, Puerto Rico,Virgin Islands) as well as to the Philippines; the remaining balance isallocated to other sources of supply. Up to 1960 over 95 percent of thisbalance was supplied by Cuba. Following suspension of imports from thatsource, import quotas were reallocated, largely to other Western Hemis-phere countries, but also to Australia, South Africa, China (Taiwan) andscme other African and Asian exporters. Provisions relating to realloca-tion have been repeatedly revised. Unlder the latest (1965) amendment 50percent of the market not assigned to domestic producers and the Philip-pines remains reserved for Cuba; the other half has been permanentlyallocated to (29) other countries. The reserved part has been prorated tothe same countries - designated as temporary quotas - subject to cancella-tion if relations with Cuba should be resumed. If countries importing intothe U.S. fail to fill their quotas (except for reasons beyond their controlsthey are subject to penalties in the form of permanent quota reductions bythe amount of the shortfall. Moreover, under the 1965 amendment importingcountries have to give advance assurances that they will fill their quotas,
3. Any increase in requirements is distributed between domestic(including offshore) and foreign suppliers in the proportion of 65:35 per-cent.-! The current procedure is laid down in the 1965 amendment,_ which
1/ The 65 to 35 percent ratio has been in force since 1962. Previously t4lcshare of domestic producers in increments of requirements was 55 percee;t
2/ The 1965 amendment provides for upward adjus-tments in the quotas ofHawaii and Puerto Rico in case production in these areas exceeds theizbasic quotas; such adjustment would reduce the balance (of 35 percent)to be allocated to foreign suppliers. However, in view of the mountiiiFshortfalls in Puerto Rico allocations to foreign suppliers have actu -Ely been greater than envisaged in the amendment.

A-NEX IPage 2
assigned to dw estic producers a global basic quota of 6,390,000 shorttons with the rrovision that 65 percent of any increase in requirementsbeyond 10,400,000 tons would be allocated to domLestic areas. The specificquota of 1,050,000 tons assigned to the Philippines in 1962 will be raised,under the terms of the 1965 amendment, by 10.86 percent of any increase inrequirements between 9.7 and 10.4 million short tons. Quotas for otherforeign countries are established on the basis cf fixed percenltages, alsolaid down in the 1965 amendment to the Act.
4. Shortfalls (deficits in quotas), whether in domestic or foreignareas, are reallocated under current provisions entirely to foreignsources of supply.!/ Deficits in domestic areas and in the Western Hemis-phere have to be assigned to the Philippines (47.22 percent) and lWesternHemisphere countries; the latter would also supply any shortfall occurringin the Philippines. Deficits of other Eastern Hemisphere countries wouldbe allocated to the Philippines (47.22 percent) and the balance to otherEastern Hemisphere countries. The President may, however, override theserules and, if it is in the national interest, allocate any deficit orpart of it to countries holding quotas, as he finds appropriate.
5. The U.S. price of raw sugar (which has to be adjusted by sub-tracting the duty of .625 cents per pound2_/ as well as by freight andinsurance, and by adding bag allowance in order to arrive at the f.o.b.equivalent) is not rigidly fixed. The USDA determines for each month a"price objective" on the basis of the 1957-59 average price of 6.2 centsper pound, adjusted by the parity index; it then undertakes, throughquota manipulations, to maintain actual prices close to the "objective".This has, as a rule, been achieved; occasionally, however, most recentlyin 1963, when the high level of the "world" price made exports to otherareas highly attractive, the U.S. price had to be allowed to exceed the"objective" in order to obtain sufficient supplies.
The Commonwealth Sugar Agreement
6. Current provisions regulating sugar trade between the U.K. andCommonwealth sugar exporting countries date back to the Agreement of 1951,which in turn replaced previous wartime and early postwar purchase ar-rangements. The 1951 Agreement provided for mutual obligations for theU.K. and participating Commonwealth exporters to purchase and sell speci-fied quantities of sugar at a negotiated price (mIegotiated Price Quotas).
1/ This provision, under which the total Puerto Rican shortfalls havebeen allocated to foreign sources of supply, is expected to be changedat the next (1971) revision of the Act.
2/ Currently the rate for sugar imports from the Philippines is lower(.3 cents per pound) but is gradually being raised and by July 1974,the expiration date of the present U.S.-Philippines Trade Agreement,should reach the general (.625 cents) level.
AIMEX IPage 3
These quotas, originally set at 1,568,000 long tons, have been repeatedlyraised in line with increasing U.K. consumption (of which they coverroughly 60 percent) and revised to take account of changing membership.For the years 1969 to 1971 inclusive the aggregate Negotiated Price Quotaamounts to 17742,000 long tons (1,770,000 metric tons) per year; thisfigure includes the quota for Southern Rhodesia of some 25,000 tons,presently suspended.
7. The initially adopted base price (c.i.f. London) has been sub-ject to annual review and to adjustments in accordance with cost of pro-duction and other relevant price developments. In 1965 provisions relatingto price determination were revised; moreover, starting in 1966 priceshave been expressed on an f.o.b. basis and fixed for a period of three (inlieu of one) years. The price for the three years 1969 to 1971 remains atits previous level of 143.10.0 per long ton.17 Developing member countries(presently all except Australia) receive in addition special payments, re-placing benefits formerly derived under the "Colonial Certificate" system.These payments consist of a fixed and a variable element, the forneramounting to ,ll.10.0 per long ton; the other ccmponent varies inverselywith world market prices from 12.10.0 at a world price level of less thanT;31.0.0 to nil when the latter reaches 139.0.0./
8. A second set of quotas (Overall Agreement Quota, presently2,780,000 long tons) which encompasses the ;egotiated Price Quota, has thefunction of limiting total exports of participating Commonwealth exportersto preferential markets - the U.K., Canada and Nlew Zealand. It does notentitle exporters to any benefits other than those arising from tariffpreferences accorded to Commonwealth countries. Sales to Canada, NewZealand and to the U.K. beyond the legotiated Price Quota move at theworld price.
9. The Agreement, originally concluded for a period ending December31, 1959, has been extended, in accordance with its provisions, in eachsubsequent year by another year - in 1952 to the end of 1960, etc. It wasextended in 1966 to December 1974; further extension in 1967 was omittedin view of the pending application for admission to the Common Hiarket.
10. At the last mieeting between the-parties to the CommonwealthAgreement, in November-December 1968, the provisions concerning durationwere revised and, subject to certain qualifications, its duration will beindefinite. In the event of successful completion of negotiations for theaccession of the U.K. to the Comm,lon liarket, contractual obligations under
1/ Equivalent to 5..44 U.S. cents per pound prior to, and 4.66 cents perpound after devaluation of the pound. The price in terms of the poundsterling has remained unchanged.
2/ Lncluding special payments the equivalent in U.S. cents per poundamounts to 5.94 before and to g.09 after devaluation of the pound.

A11EX I
the Agreement cannot be continued after December 31, 1974. However, inthat case the U.K. would consult with the other parties to the Agreement"with a view to seeking means of fulfilling the objectives which thoseobligations would otherwise fulfil."j./ When the U.K. applied for member-ship in the Common Market in 1967 the need for provisions to that effectwere stressed. The subject was again brought up recently when discussionsof U.K. accession to the Common MIarket were resumed.
Agreements between Cuba and centrall planned countries
11. Trade betwJeen Cuba and the USSR moves under a five-year Agree-ment, covering the period 1965 to 1970. The USSR has agreed to purchaseincreasing quantities; during each of the years 1968 to 1970 the volumeto be taken was set at 5 million tons. So far, actual trade has remainedwell below the agreed figure. The price was fixed at the equivalent ofO U.S. cents per pound, f.a.s. Cuba; it has been reported that 20 per-cent of imports would be paid in convertible currency, the rest on astrictly bilateral basis. In addition to the contract with the USSR,Cuba has bilateral agreements with other centrally planned countries, atprices reportedly between 5 and 6 cents, f.a.s. Cuba.
The International Sugar Agreement
12. Operations of the first postwar sugar Agreement, concluded in1953 and renewed in 1958, were suspended at the end of 1961, when itproved impossible to accommodate the greatly increased free market quotarequested by Cuba subsequent to the cessation of U.S. imports from thatcountry. After previous abortive attempts to revrive the Agreement,negotiations held in 1968 were finally successfuL. Like its predecessors,the new Agreement, which came into force on January 1, 1969 for a periodof five years, aims primarily at maintaining prices within a certainrange. Although not specifically spelled out, the relevant provisions ofthe Agreement imply a range within the limits of 3.25 and 5.25 cents perpound.
13. The mechanism of export quotas, intencled to keep prices withinthe range indicated above, is similar to the one applied in previous Agree-ments. Basic export tonnages&/ for individual exporters, established in
1/ The Commonwealth Sugar Agreement, Text of 1968, page 7.
2/ The term "basic export tonnages" refers to shares in the free market,expressed in metric tons. The tonnages for individual exporters areshown in Annex Table X-2. No basic export tcnnages have been estab-lished for Indonesia or for the Philippines. Indonesia, which since1967 was a net importer, will be entitled to net exports of up to 81,000tons in any quota year, not subject to any adjustments. The Philippines,which had not exported to the free market for many years, will be en-titled to export up to 60,000 tons in any quota year, provided that theaggregate of quotas in effect exceeds 100 percent of basic export to.a-nages.

A iiAEX Ipa-ge ,)_
the course of the negotiations and -orming an integral part of the Agree-ment, serve as a guide for allocation (and subsequent adjustment) ofannual export quotas. Depending on price movements quotas could be belowor could exceed basic export tonnages. A comnplex set of regulations pro-vides for adjustment of quotas to varying price levels. If the prevailingprice exceeds 5.25 cents per pound quotas become inoperative; in case of adecline to less than 3.50 cents per pound quotas shall not be higher than90 percent of basic export tonnages; when the price reaches 3.25 centsper pound a further reduction (not exceeding, hlowever, 5 percent of basicexport tonnages) is foreseen. At a price exceeding 4 cents per pound ag-gregate quotas should not be less than 100 percent of basic export ton-nages; in case of a decline to less than 4 cerLts per pound quotas shouldbe reduced by 5 percent.S/ Some of the regulations, e.g., suspension ofquotas if the price exceeds 5.25 cents per pourld, are mandatory,, withrespect to others it is left to the discretion of the Counci]J to takea different decision.
14. Following the pattern of earlier Agreements, trade under specialarrangements - exports to the United States, to the United Kingdom withinthe negotiated price quota under the Commonwealth Agreement, exports ofCuba to centrally planned countries as well as trade under the Afro-M4alagasySugar Agreement - will not be charged to quotas under the InternationalAgreement.
15. Tne difficulties arising from large-scale re-eXports to the freemarket of Cuban sugar imported by the USSR and other centrally plannedcountries have been resolved through commitments undertaken by these coun-tries and by Cuba, to keep re-exports within agreed limits:
(a) The USSR will limit re-exports to the free market to 1.1million tons in 1969; the corresponding limit for thefollowing two years will be determined by the Council butshould not be less than 1.1 million or more than 1.25million tons.
(b) Exports of Cuba to Czechoslovakia, Hungary and Poland inexcess of 250,000 tons in each quota ,year will be chargedto Cuba's free market quota.
1/ This is not an exhaustive list of all regulations; the ones mentionedhere only refer to the (practical) limits and the approximate midpointof the range.
2/ The Council, consisting of all members of the Agreement, is the highestexecutive authority; it is entitled, however, to delegate a nlumber offunctions (but not including the determination of quotas) to the(narrower) Executive Committee.

AK\Th'EX IPage 6
(c) Exports by Eastern Germany and China (Mainland) in anyquota year, in excess of 300,000 tons, will be deductedfrom Cuba's free market quota provided, however, thatCuban exports to the countries in the preceding yearhave been higher than 910,000 tons (i.e., average ex-ports in the period 1960 to 1967).
16. The first and second of these undertakings place definite limitson re-exports of Cuban sugar by the USSR and the three net exporting coun-tries mentioned. The third provision is weakened by the clause referringto Cuban exports in the preceding year which might not have reached thespecified volume. Moreover, no limitations have been stipulated for othercentrally planned importers of Cuban sugar which may be actual or poten-tial re-exporters to the free market. These loopholes should be covered,however, by the general obligations of members participating in specialarrangements to conduct their sugar trade "i a manner which shall notprejudice the objectives of the Agreement. l/ Such members also under-take to adopt measures which will ensure that increased trade underspecial arrangements will not result in increased re-exports to the freemarket.
17. Provisions relating to stocks are similar to those underprevious Agreements. Exporting members' end-of-season stocks should notbe in excess of either 20 percent of production in the immediately pre-ceding year, or 20 percent of basic export tonnages (over and above stocksheld for domestic consumption requirements). Exporters were given achoice between the two alternatives. Minimum stocks, defined as thequantities of uncommitted sugar held (in addition to those required fordomestic consumption and to meet obligations under special arrangements),should not be less than 15 percent (or 10 percent) of basic export ton-nages for developed (or developing) coLmtries respectively.
18. Special obligations by exDorters concerning free market suppliesto importing members would be activated if prices exceeded 4.75 cents perpound for ',en consecutive days; in that case exporters would have torelease sugar from minimum stocks for prompt sale and shipment. Obliga-tions would become increasingly stringent as prices advance; should theyreach 6.50 cents per pound exporters would have to supply, if requested,specified quantities to their traditional markets at prices not exceedingan agreed limit.
19. Special obligations by importing members, designed to avoid lossof markets to non-participating exporters, have been strengthened. The(standard) provisions requiring importers to limit purchases from non-members to specified quantities have been supplemented by commitments torefrain altogether from such purchases if and as long as prices were ator below 3.25 cents per pound. Conversely, if prices were at or above5.25 cents per pound all restrictions would be suspended.
1/ International Sugar Agreement 1268, Article 34 "Special Arrangements"paragraph (4).
ANIIEX IPage 7
20. In contrast to previous Agreements, which were mainly concernedwith the problem of price stabilization, an attempt was made to deal withthe increasingly pressing problem of securing access to markets. However,the commitments by (de-velopedinporting members w]h7h finall 1emergedremained well within the limits of past performance; they imply no promisethat future imports would exceed their prospective level in the abserce ofany pledge.
21. HIembership among net exporting countries is fairly comprehensive.Those which have participated in the negotiationsl/ but are not membersaccount for hardly more than six percent of aggregate basic export ton-nages (see Columnu 1, Annex Table X-2; quotas of non-members are shown inparentheses). Participation on the side of net importers is rmuch lesswide; in mid-H'arch (at the time of the most recent meeting of theCouncil) the list consisted of : Canada, Finlantd, Ghana, Ireland, Japan,Kenya, M4alawi, New Zealand, Nigeria, Portugal, Sweden, the USSR and theU.K. The United States, a member of earlier Agreements, has not joined;however, since most of U.S. imports move under special arrangements, notcovered by the quotas under the International Agreement, non-participationof the U.S. does not seriously affect the operalion of the latter.
22. The Agreement has been concluded for a period of five years,from January 1, 1969 to December 31, 1973. Before the end of the thirdyear (i.e., during 1971) th-e Cuncil, after having reviewed past opera-tions, may propose amendments and, if deemed necessary, make arrangementsfor re-negotiation of the Agreement. TMien conducting its review theCouncil should, by special vote, determine the basic export tonnages forthe remaining three years. If no such decision is taken, the tonnageswould remain the same as for the preceding three years.
1/ Southern Rhodesia is the only net exporting country which has notparticipated in the negotiations.

LIST OF STATISTICAL TABLES
Annex Table 14-1: Sugar: Estimates of 1975 consumption, productionand import demand in net importing countries com-pared to 1966-68
Annex Table M4-2: Sugar: Estimates of 1975 consumption, productionand net imports in the USSR and China (Mainland)compared to 1966-68
Annex Table X-1: Sugar: Estimates of 1975 consumption in netexporting countries compared to 1966-68
Annex Table X-2: Sugar: International Sugar Agreement (ISA)basic export tonnages 1971, U.S. initial importquotas 1970 and Commonwealth negotiated pricequotas 1971
Annex Table X-3: Sugar: Tentative estimates of distribution ofconsumption, export shares and production requiredamong major net exporting countries and areas in1975 compared to 1966-68 data

Annex Table M-1: SUG0A: ESTnMATES OF 1975 CONSUMPTION, PRODUCTION AND IMPORT DEMAND IN iET IllPORTING COOIRNIES COOPARED TO 1966-68
Estimaten for 1975 _ i966-68Consnmptcon , Prouction Net imports Consumption Net Consumption
Population Per caput Total t Low high Nigh Low Popt.Jation Per caput Total Production Icporta minus prod.(Millinns) (kg.) -------------- (thousand tone) --------------- (Millions) (kg.) -- - (thousand tons) ------------
Developed countries
USA Mailand-/ 222.3 50 11,120 6,640 6,790 t,1l80 1l,330 i98.6 48.8 9,690 5,80 4,210 1,210Quota eoempt 150 150 150
Hawaiig/ .9 50 50 50 50 - - .7 53.3 39 39 - -Puerto Rico (inciluing
Virgin Ialands)_/ 322 12 130 130 130 - - 2.8 41.0 113 113
226.2 50 11,450 6,820 6,970 4,630 4,480 202.1 18.7 9,842 5,632 4,210 4,210
Canada 23.6 50 1,180 160 190 1,020 990 20.5 47.5 970 135 823 835Japan 106.6 32 3,400 750 900 2,650 2,500 100.9 21.6 2,256 580 1,645 1,676U.K. 58.6 52 3,050 950 1,050 2,100 2,000 55.3 52.0 2,883 950 1,934 1,933Switzerland 6.6 52 340 60 80 280 26o 6.1 49.9 303 63 254 240Finland 5.0 46 230 50 70 180 160 4.7 45.0 210 59 172 151Noruay 4.1 49 200 - - 200 200 3.8 47.6 180 - 181 180Sweden 8.1 47 380 250 300 130 8o 7.9 45.5 358 26o 128 98Spsir3/ 34.4 29 1,000 850 950 150 50 32.1 24.4 798 636 213 162New Zealand 3.2 53 170 - - 170 170 2.7 52.5 143 - 140 143Other 4h.5 1,340 1,090 1,170 250 170 42.2 27.1 1.310 896 362 247
Total Developed 520.9 44 22,710 10,980 11,680 11,760 1i,060 478.3 39.9 19,086 9,211 10,062 9,875
Developing countries
Weastern HenisphereChile 10.9 38.5 120 150 180 270 240 9.0 37.0 333 157 176 176Other 3.9 42.3 165 95 105 70 6o3 3 40.9 135 66 78 69
01.8 39.5 585 245 285 340 30( 32.3 38.0 468 223 254 245
AfricaAlgeria 15.5 23 360 10 10 350 350 12.5 19 239 5 271 234morocco 18.5 30 550 300 350 250 200 14.1 27 382 58 300 324Sudan 17.5 15 265 120 180 145 85 14.4 13.1 188 68 139 120UAR 40.0 17 68o 450 550 230 130 30.9 16.5 510 379 120 131Other 226.8 5.4 1,235 635 720 600 5 L5 L15.8 4.7 877 221 702 656
318.3 9.7 3,090 1,515 1,810 1,575 1,280 23i7.7 8.5 2,196 731 1,532 1,465
Asia and OceaniaCeylon 25.0 24.5 370 20 40 350 330 311.8 21.2 250 9 251 241Iraq 11.4 35 400 30 50 370 350 8.5 34.0 288 4 282 284Iran 31.5 21 750 650 750 100 - 2'6.2 23.2 608 423 175 185Indonesia 133.0 7 930 750 85o 18o 80 1l0.1 6 671 622 34 49W. Malaysia 10.0 30 300 50 1CO 250 200 8.6 27.8 238 - 256 238Pakistan 348.8 6 890 650 800 240 90 118.6 4.8 569 503 85 66Other 145 23 11.0 1.605 250 3CC 1,355 1,305 11L8.9 9.16 1,162 98 1167 1,064
495.0 10.6 5,245 2,400 2,890 2,845 2,355 412.7 9.4 3, 786 1,659 2,250 2,127
Total Developing 828.1 10.8 8,920 4,160 4,985 4,760 3,935 672.7 9.6 6,450 2,613 4,036 3,837
Total Developed & Developing 1349.0 23.5 31,660 15,310 16,665 16,520 14,995 13.5l.O 22.2 25,536 11,824 14,098 13,712
2/ Rounded.
2/ Production: Mainland pluw receipts fro H-awaii and Puerto Rico. Copsumption: Mainland only. Quo-a exempt: sugar for feed, alcohol and for re-export in sugar-containingproduoto. Rauaii and Puerto Rico- production for own o-onumptio. only.
3/ Including Balearic aed Canary Islands.
Sources: Population projeotions: FAO: Agricultural Comnodities - Projections for 1975 and 1985, Vol. II; CCP 67/3 August 1966. USDA: World PcpuLation and I-come byCountries 1950-5 an Projiections to 1980. Economic Research Service Ootoer 1968.
1966-68 data: International Sugar Council: Sgar YearDock 192 Statistical Bufletin various iSsues, supplenented by data from USDA: World AgriculturalProduotion and Trade, June and August 1969. F. 0. Licht: International SaRo JuLy 28, 2969.

Annex Table 1,1-2: SUGAR: FoTIATIIS OF 197• CC0-,UTPTION, PRODUCTION ALDITET DPORTS Iii THE USSR ANlD CMTI J.' (INPI lJLAND) COI2A=RD TO 1966-68
USSR _ Mainland China1975 1966-66 1975 196-68
Population, million 256 236 930 720
Consumption per caput, kg. 42 -44 40 4.6- 5.- 4.2
Total, million metric tons 10.8 - 11.3 9.4 4.3- 4.7 3.0
Production, million metrictons 9.0 -10.0 9.3 4.0 2.7
Net imports, million metrictons 1.0 - 2.5 0.75 0.3 -0.7 0.2
Sources: USSR Central Statistical Adiinistration, Official StatisticalYearbook- of the USSR, various issues; International SugarOrganizatioi, Sugar Yearbook, various issues; Population 1966-68:U.,N. Monthly Bulletin of Statistics, var-ious issues.

Annex Table K-1: SUGA,;: E3TDATh3 OF 1975 CONSUBWPTIO4 I I;ET EXPORTI5IC' COUJTBTRIES CCVInARUD TO 1966-68
1975 1966-6dConsumption Consumption Produc- Consumption
Population Per caput Total Population Per caput Total tion as percent of(Millions) (kg.) ('000 tons) (Millions) (kg.) ---('000 tons)--- production
Developing Countries
Wdestern Hemisphere
Cuba 9.3 75 700 8.1 76.0 618 5,473 11
Other W. Hemisphere
Dominican Republic 5.1 35 180 3.9 29.8 116 739 16Mexico 58.o 40 2,300 45.7 36.2 1,657 2,338 71
Central AmericanCommon Market 17.4 26 455 13.7 24.5 335 561 60
West Indies and Guyana 4.8 46 220 4.3 42.3 182 1,264 14
Argen.tina 26.3 40 1,050 23.1 38.1 881 900 98Brazil 110.0 42 4,600 85.7 35.4 3,058 4,165 73Colombia 24.o 26 630 19.2 21.7 417 599 70Peru 15.3 30 460 12.4 28.0 346 766 45Venezuela 12.5 35 435 9.4 33.9 317 363 87
Otheri/ 22.3 21 470 18.0 17.9 323 545 60
Western Hemisphere(excluding Cuba) 295.7 37 10,800 235.4 32.4 7,632 12,240 62

-2-
Annex Table X-1 (Continued)
1975 1966-6bConsumption Consumption Produc- Consumption
Population Per caput Total Population Per caput Total tion as percent of(Millions) (kg.) ('000 tons) (Millions) (kg.) ---('000 tons)--- production
Developing Countries
Africa
Mauritius .9 44 40 .8 40°5 32 634 5Congo (Brazzaville) 1.0 5 5 .9 4.3 4 83 5Malagasy Republic 8.0 8 65 6.4 6.2 40 106 38Swaziland .5 40 20 .4 33.2 13 159 8Uganda 9.2 14 140 7.9 13.0 103 138 75Southern Rhodesia 5.8 19 110 4.5 16.5 75 183 41
Sub-total 25.4 15 380 20.9 12.7 267 1,303 20
Asia and Oceania
China (Taiwa-) 15.7 1J 2 13.1 13.2 173 865 20Philippines 46.o 20 920 34.7 17.1 594 1,564 38India 610.0 7.5 4,600 512.4 5.3 2,700 2,788 97Thailand 41.o 8 330 32.7 6.1 200 230 87Fiji .7 45 30 .5 42.9 21 340 6
Sub-total 713.4 9 6,120 593.4 6.2 3,688 5,787 64
Total Developing1excluding Cuba) 1,034.6 17 17,300 849.7 13.6 11,587 19,330 60
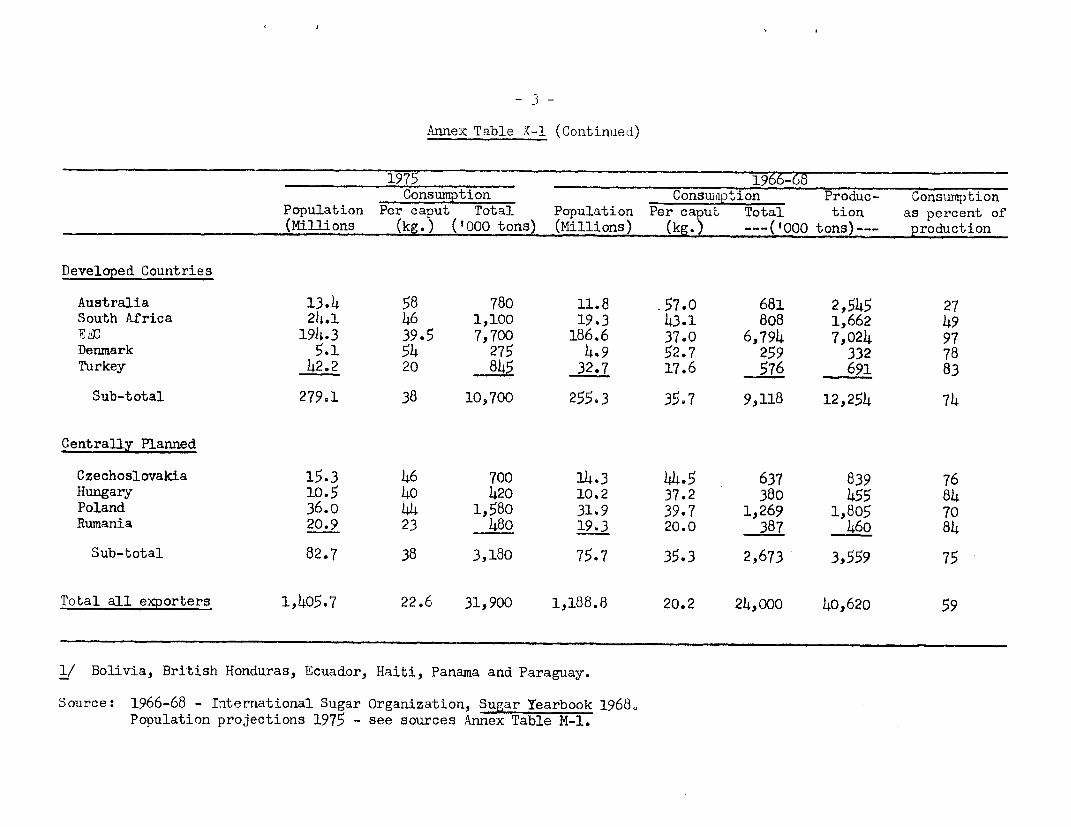
3-
Annex Table Y-1 (Continued)
1975 1966-68Consumption Consizaption Produc- Consumption
Population Per caput Total Population Per caput Total tion as percent of(Millions (kg.) ('000 tons) (Millions) (kg.) ---(tooo tons)--- production
Developed Countries
Australia 13.4 58 780 11.8 .57.0 681 2,545 27South Africa 24.1 46 1,100 19.3 43.1 808 1,662 49EEC 194.3 39.5 7,700 186.6 37.0 6,794 7,024 97Denmark 5.1 54 275 4.9 52.7 259 332 78Turkey 42.2 20 845 32.7 17.6 576 691 83
Sub-total 279.1 38 10,700 255,3 35.7 9,118 12,254 74
Centrally Planned
Czechoslovakia 15.3 46 700 14.3 44.5 637 839 76Hungary 10.5 40 420 10.2 37.2 380 455 84Poland 36.o 44 1,580 31.9 39.7 1,269 1,805 70Rumania 20.9 23 480 19.3 20.0 387 460 84
Sub-total 82.7 38 3,180 75.7 35.3 2,673 3,559 75
Total all exporters 1,405.7 22.6 31,900 1,188.8 20.2 24,ooo 40,620 59
1/ Bolivia, British Honduras, Ecuador, Haiti, Panama and Paraguay.
Source: 1966-68 - International Sugar Organization, Sugar Yearbook 1968.Population projections 1975 - see sources Annex Table M-1.

Annex Table X-2: SUGAR: INTE3N[iTIONAL SUGAR AGRER2ENT (ISA) BASIC EXPORTTOi,pUGAGS 1971, U.S. INITIAL IMPORT QUOTAS 1970 AND COMnMOWEALTH
NEGOTIATED PRICE QUOTAS 1971
ISA 1971 US initial 1970 quotas UK 1971Incl.proration
Basic export of Cuban and Negotiatedtonnagesl_/ Basic S. Rhodesian Price Quotas
quoas
('000 metric tons) (1000 short tons) ('COO long tons)
Developing Countries
W. HemisphereCuba 2,150 2/ - -
Other W. HemisphereArgentina 55 23 .58 _Bahamas - 10 10 -Bolivia 10 3 6 -Brazil 500 227 471 _British Honduras 22 7 12 21Central AmericanCommon MarketCosta Rica ) 27 55 -El Salvador ) (33) 17 34 -Nicaragua ) 27 55 -Guatemala 11 23 47 -Honduras 11 3 6 -
Colombia 164 24 50 -Dominican Republic 186 227 471 _Ecuador (10) 33 68 -Haiti (10) 13 26 -Mexico 96 232 481 -Panama (10) 17 35 -Paraguay (10) - - -Peru 100 181 375 -Venezuela (17) 11 24 -West Indies & Guyana 200 91 166 725
Sub-total 3,595 1,201 2,450 746
AfricaCongo (Brazzaville) 41 - _ _Malagasy Republic 41 5 9 -Mauritius 175 10 18 380S. Rhodesia - 2/ - 25j/Swaziland 55 T4 7 85Uganda 39 - - 7
Sub-total 351 19 34 497
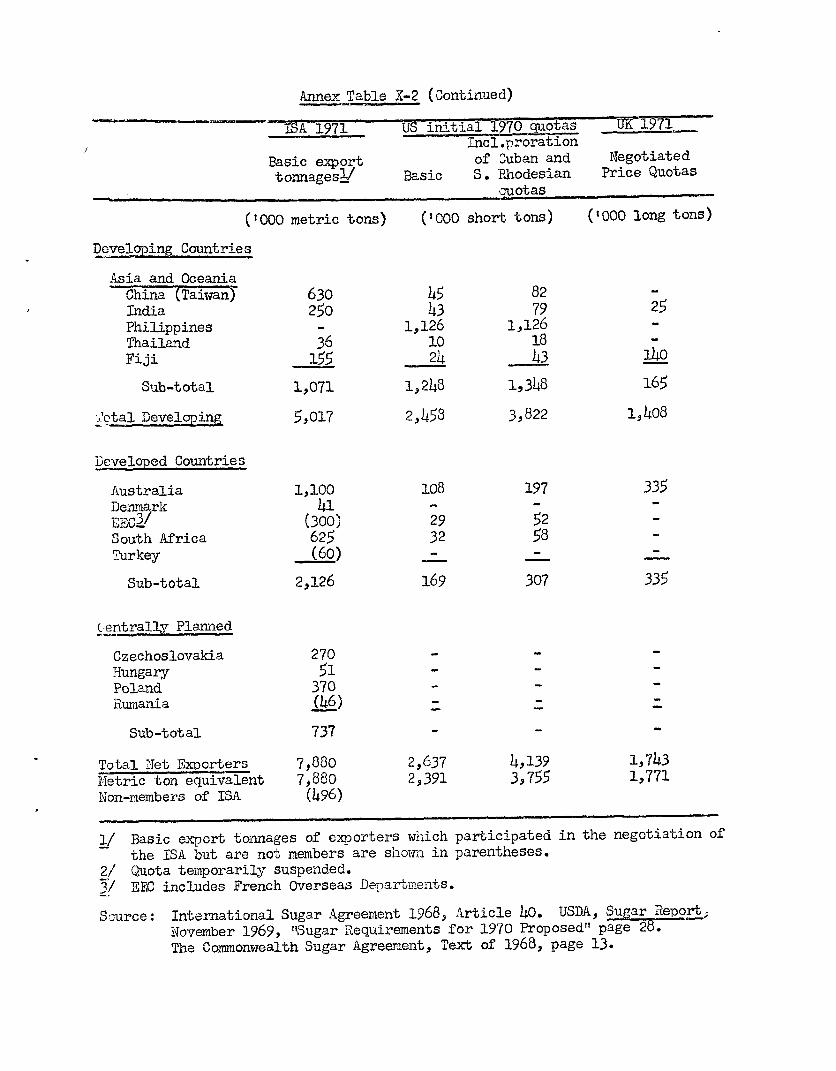
Annex Table X-2 (Continued)
ISA 1971 US initial 19 UK -- 1971Incl.proration
Basic export of Cuban and Negotiatedtonnages./ Basic S. '.Rhodesian Price Quotas
.uotas-
('000 metric tons) ('000 short tons) ('000 long tons)
Developing Countries
Asia and OceaniaChina (Taiwan) 630 45 82 -India 250 43 79 25Philippines - 1,126 1,126 _Thailand 36 10 18 -Fiji 155 24 43 140
Sub-total 1,071 1,248 1,348 165
,'otal Developing 5,017 2,453 3,822 l,408
De-veloped Countries
Australia 1,100 108 197 335Dewmark 41 - - --1 C3/ (300) 29 52South Africa 625 32 58Turkey (60) - - -
Sub-total 2,126 169 307 335
(entrally Planned
Czechoslovakia 270 - -Hungary 51 -
Poland 370 -Rumania (46) _-
Sub-total 737 - -
Total Net Expcrters 7,880 2,637 4,139 1,743Metric ton equivalent 7,880 2,391 3,755 1,771Non-members of ISA (496)
1/ Basic export toimages of exporters wniich participated in the negotiation ofthe ISA but are not members are show-n in parentheses.
2/ Quota temporarily suspended.3/ EEC includes French Overseas Dencartments.
S urce: International Sugar Agreement 1968, Article 40. USDA, Sugar Report;November 1969, "Sugar Requirements for 1970 Proposed" page 2 .The Commonwealth Sugar Agreement, Teext of 1968, page 13.
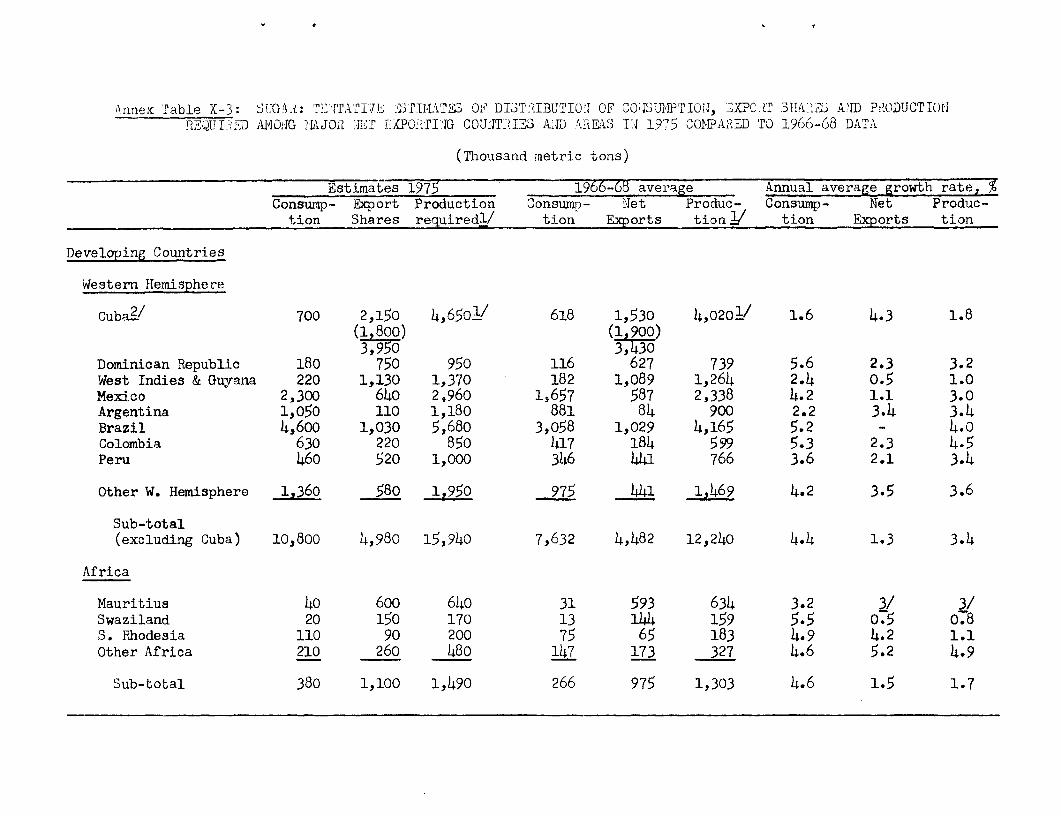
Annex Table X-3: SIK4XA: 2T':J'TATTJL :5132IITES OiY' DILiTitIBUTIOMl OF QO3UiAPTIOrN, EXPC.T 31S1!U'3 A'S P~'ODUCTTI)IUE.jIT3_D AUOiIG HAJOil Li"T EXPOITI4'G COUJT-'I3S AJD AtES I-,J 19'05 COMIt2A,E To 1966-68 DATA
(Thousand metric tons)
Estimates 1975 1966-68 average Annual average growth rate,,Consump- Export Production Consujrp- Net Produc- Consump- Net Produc-tion Shares requiredl/ tion Exports tion2/ tion Exports tion
Developing Countries
Western Hemisphere
Cuba_ 700 2,150 4,6501/ 618 1,530 4,0201/ 1.6 4.3 1.8(1 800) (1 900)
Dominican Republic 180 750 950 116 627 739 5.6 2.3 3.2West Indies & Guyana 220 1,130 1,370 182 1,089 1,264 2.4 0.5 1.0Mexico 2,300 640 2,960 1,657 587 2,338 4.2 1.1 3.0Argentina 1,050 110 1,180 881 84 900 2.2 3.4 3.4Brazil 4,600 1,030 5,680 3,058 1,029 4,165 5.2 - 4.0Colombia 630 220 850 417 184 599 5.3 2.3 4.5Peru 460 520 1,000 346 441 766 3.6 2.1 3.4
Other W. Hemisphere 1,360 580 1,950 975 441 1,469 4.2 3.5 3.6
Sub-total(excluding Cuba) 10,800 4,980 15,940 7,632 4,482 12,240 4.4 1.3 3.4
Africa
Mauritius 40 600 640 31 593 634 3.2 3/ 3/Swaziland 20 150 170 13 144 159 5.5 0.5 0:8S. Rhodesia 110 90 200 75 65 183 4.9 4.2 1.1Other Africa 210 260 480 147 173 327 4.6 5.2 4.9
Sub-total 380 1,100 1,490 266 975 1,303 4.6 1.5 1.7

-2-
Annex Table X-3 (Continued)
Estimates 1975 1966-68 average Annual average growth rate, %Consump- Export Production Consump- lUet Produ9ji Consump- Net Produc-tion Shares requiredl/ tion Exports tion- tion Exports tion
Developing Countries
Asia and Oceania
China (Taiwan) 240 710 950 173 691 865 3.8 3/ 1.2India ) 4,600 360 4,980 2,700 265 2,788 6.9 4.0 7.5(India)4/ ) (2,800) (235) (3,210) (6.4) (5-5) (5.6)Philippines 920 1,120 2,040 594 1,036 1,564 5.6 1.0 3.4Thailand 330 60 390 200 23 230 6.5 12.7 6.8Fiji 30 340 370 21 321 340 4.6 0.7 1.1
Sub-total 6,120 2,590 8,730 3,688 2,336 5,787 6.5 1.3 5.3
Total Developing(excluding Cuba) 17,300 8,670 26,160 11,586 7,793 19,330 5.1 1.4 3.9
DeveloDed Countries
Australia 780 1,650 2,430 681 1,848 2,545 1.7 - -South Africa 1,100 680 1,780 808 774 1,662 3.9 - 0.9EEC 7,700 360 8,o60 6,794 240 7,024 1.6 5.2 1.7Denmark 275 40 315 259 61 332 0.8 - _Turkey 845 60 905 576 48 691 4.9 2.8 3.4
Total Developed 10,700 2,790 13,490 9,118 2,971 12,254 2.0 - 1.2
Centrally Planned5/ 3,180 740 3,920 2,673 733 3,559 2.2 - 1.2
Unallocated 200 200
Total(Excluding Cuba) 31,200 12,400 43,800 23,380 11,500 35,140(Including Cuba) 31,900 16,350 48,450 24,000 14,930 39,160

Footnotes to Annex Table X-3
1/ Production required in 1975 and actual 1966-68: totals and Cubanfigures exclude amounts exported to and retained by centrally plannedcountries. Production estimates for 1975, total and for some areas,include some allowance for addition to stockis in exporting countries.
2/ Cuba: exports for 1975 equal to basic export tonnages under theInternational Agreement (2.15 million tons) plus export and re-exportentitlements of centrally planned countries importing Cuban sugar(1.8 million tons). Those for 1966-68 are exports to the free marketplus re-exports by centrally planned countries importing Cuban sugar.
3/ Rate less than 0.5 percent.
4/ India: production on the 1966-68 average was abnormally low as aresult of two consecutive droughts. The figures in brackets refer tothe 1965-69 average, which is more suitable as a basis of comparison.
5/ Czechoslovakia, Hungary, Polanid and .umania.
Source: 1966-60: International Sugar Organization, Sugar Yearbook, 1968.