international conference on urban traffic safety creating complete streets to accommodate all users...
TRANSCRIPT

International Conference on Urban Traffi c Safety
Introduction
Creating Complete Streets to Accommodate All Users
Peter Lagerwey, Toole Design [email protected] Dougherty, Seattle [email protected]

Macro Trends - Examples
• 40% (28%) Single Households• 60% Non-Traditional• 48% 25 to 35 – Urban Future• 31% of 16 year olds have
drivers license
Trends
International Conference on Urban Traffi c Safety

Trends
• 50% Major Maintenance• 3% to 10% New Capacity• 11% Fatalities; 1.6% of Federal
Funding in USA• 2% Annual Transit Growth• Economic Development
(example of Dallas, Tx)
International Conference on Urban Traffic Safety

4
Trends
• 55% of Americans would rather drive less & walk more
• Transit is growing faster than population or driving
• About one-third of Americans don’t drive: 21% of Americans over 65 Children under 16 Low income Americans
can’t afford to drive

• In 2009, they took 24% more bike trips than they took in 2001.
• In 2009, they walked to destinations 16% more frequently than they did in 2001.
• From 2001 to 2009, they increased their travel on public transit by 40%.
Some facts about 16-34 year olds:
National Household Transportation Survey, Federal Highway Administration
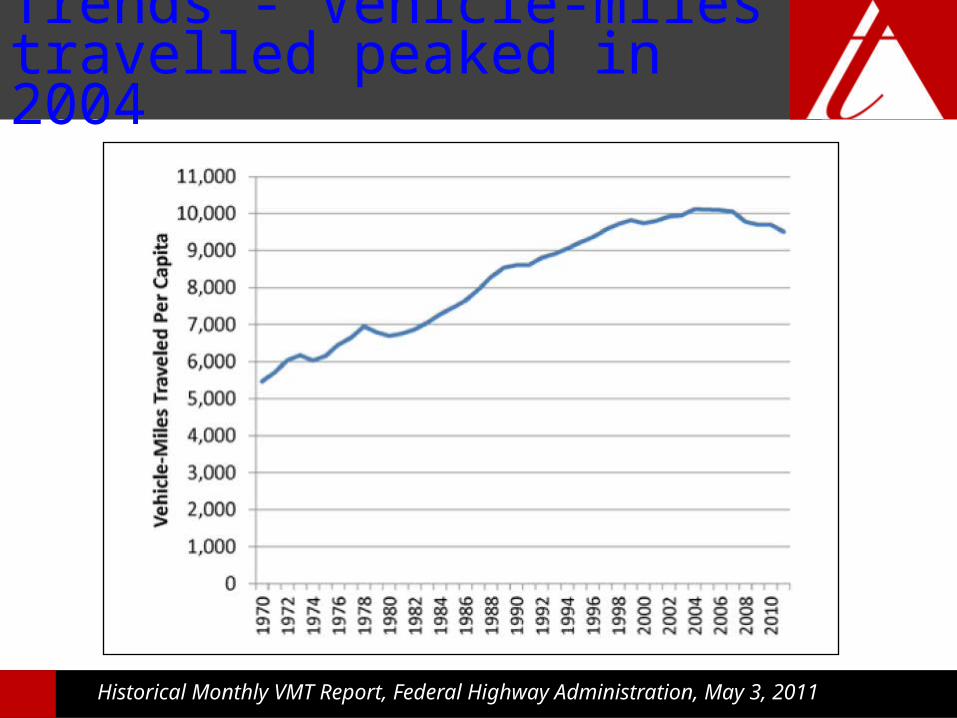
Trends - Vehicle-miles travelled peaked in 2004
Historical Monthly VMT Report, Federal Highway Administration, May 3, 2011

International Conference on Urban Traffi c Safety
United States

Knowledge
Safety: How to reduce crashes
Use: How to increase walking and bicycling
Aesthetics: How to create great people places
International Conference on Urban Traffi c Safety

International Conference on Urban Traffi c Safety
Countermeasures: CRF
CountermeasuresPedestrian Crash Reduction Factor(Percentage)
Cost
Mini-Traffic Circles 90 medium
Sidewalks 88* high
Rectangular Rapid Flash (all roadway users) 80 to 88 medium
Protected Left Turn Phase 70 to 80 medium
Illumination at Pedestrian Crossings 42 to 78 medium
Right In Right Out Driveways 72 low
Medians (un-signalized) 60 high
Crossing Island 56 medium
Marked Crosswalk Alignment 54 high
Medians (with marked xwalk) 46 high
Medians (with unmarked xwalk) 39 high
Parking Restrictions at Intersections 30 low
Road Diet 29 high
Pedestrian Countdown Signal and Timing 25 medium
High Visibility Crosswalk 20 to 29 low
Illumination Along Corridors 25 high
Pedestrian Crossing Warning Signs 15 low
Right Turn on Red Restrictions 10 low
Leading Pedestrian Interval (LPI) 5 medium
International Conference on Urban Traffi c Safety
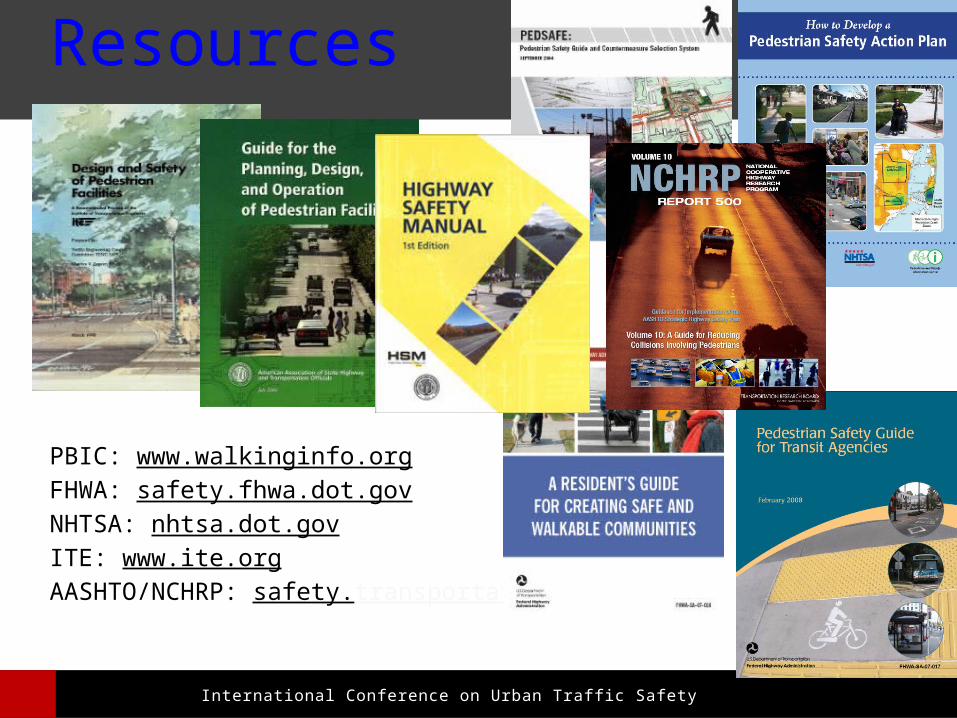
Resources
PBIC: www.walkinginfo.orgFHWA: safety.fhwa.dot.govNHTSA: nhtsa.dot.govITE: www.ite.orgAASHTO/NCHRP: safety.transportation.org

Americans want Complete Streets
11

12
What is a Complete Street?
A Complete Street is safe, comfortable & convenient for travel via automobile, foot,
bicycle, & transit
13
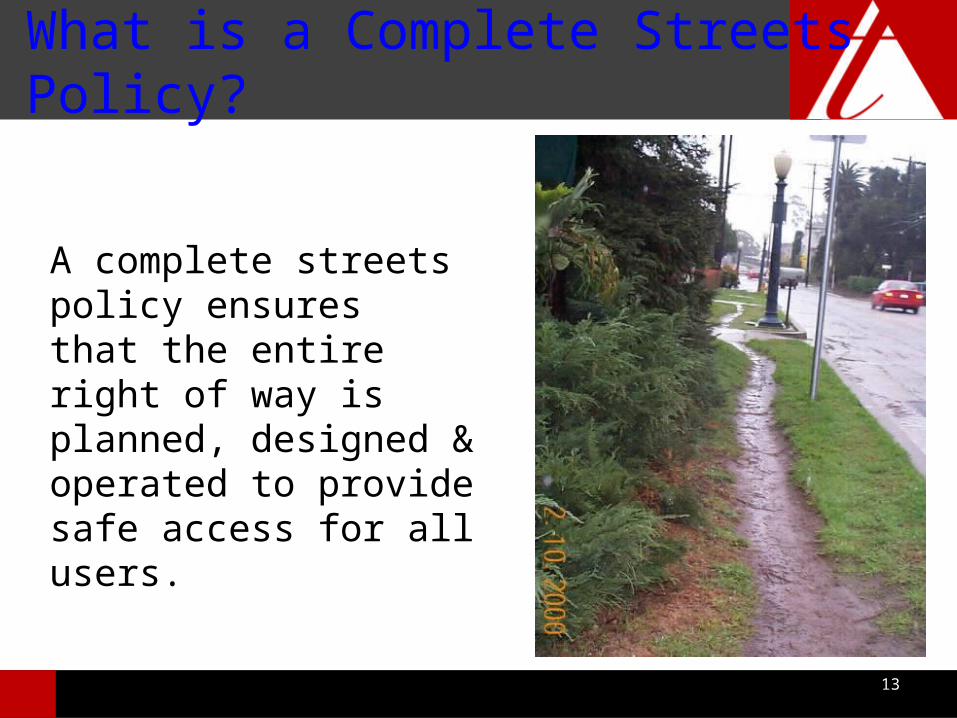
What is a Complete Streets Policy?
A complete streets policy ensures that the entire right of way is planned, designed & operated to provide safe access for all users.

14
What is a Complete Streets Policy?
A complete streets policy ensures that the entire right of way is planned, designed & operated to provide safe access for all users.

15
Complete Streets Policies provide for:• Pedestrians • Bicyclists • Transit • Motorists• Travelers of all
ages and abilities
US Access Board
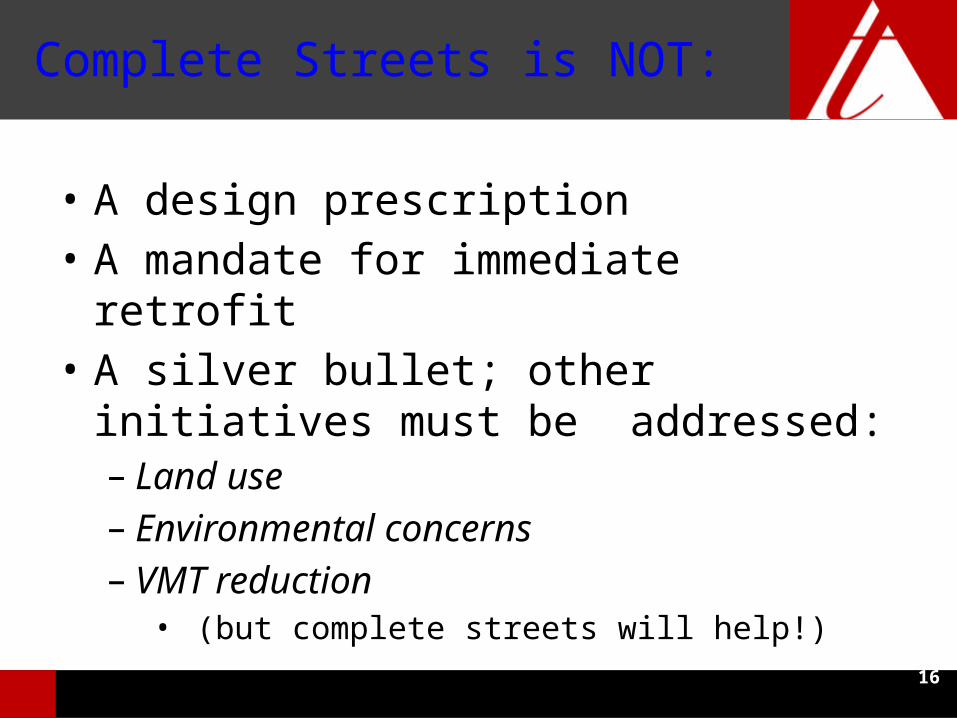
Complete Streets is NOT:
• A design prescription• A mandate for immediate retrofit• A silver bullet; other initiatives must
be addressed:– Land use– Environmental concerns– VMT reduction
• (but complete streets will help!)
16

17
What does a Complete Street look like?
There is no magic formula

18
The many types of Complete Streets
Safe Routes to School

19
The many types of Complete Streets
Shoulder bikeways on rural roads

20
The many types of Complete Streets

21
The many types of Complete Streets
Transit routes
22
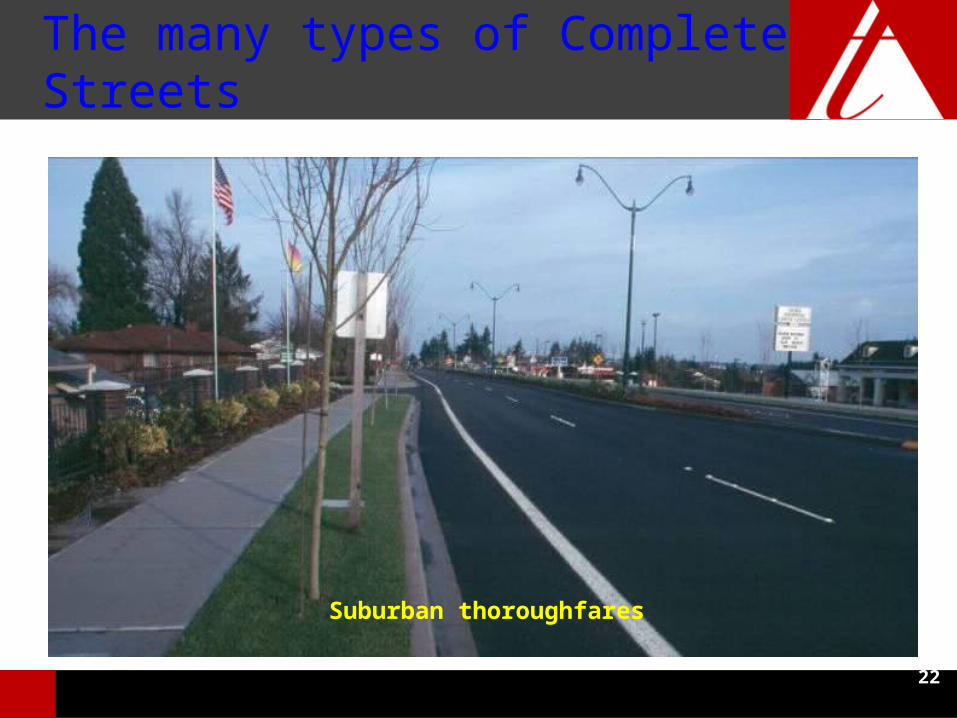
The many types of Complete Streets
Suburban thoroughfares

23
The many types of Complete Streets
Residential skinny streets

24
The many types of Complete Streets
Low traffic streets
25
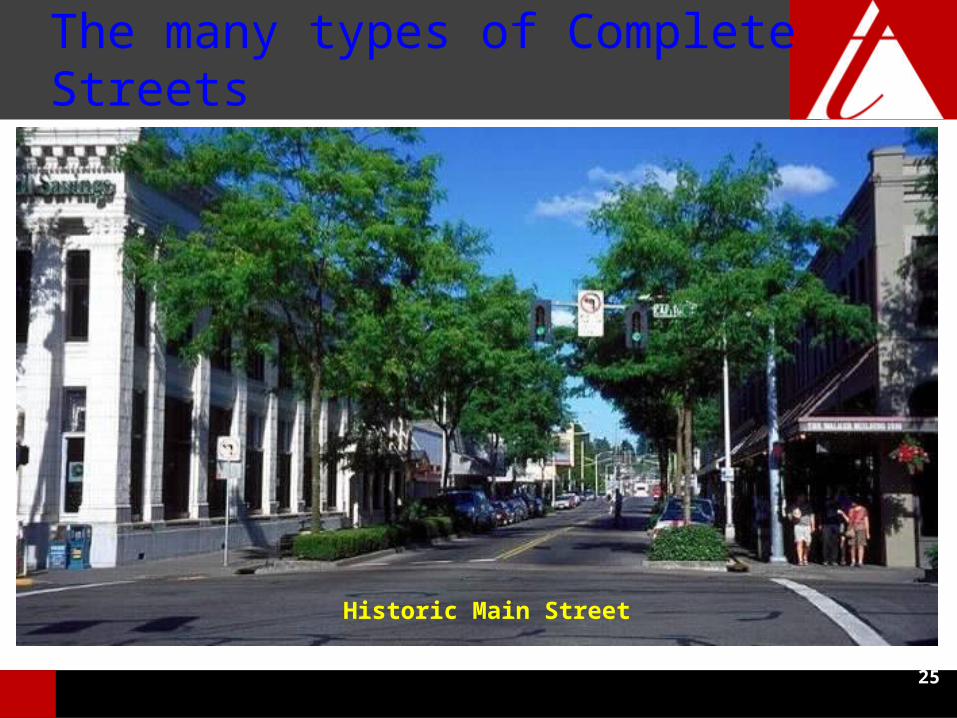
The many types of Complete Streets
Historic Main Street
26
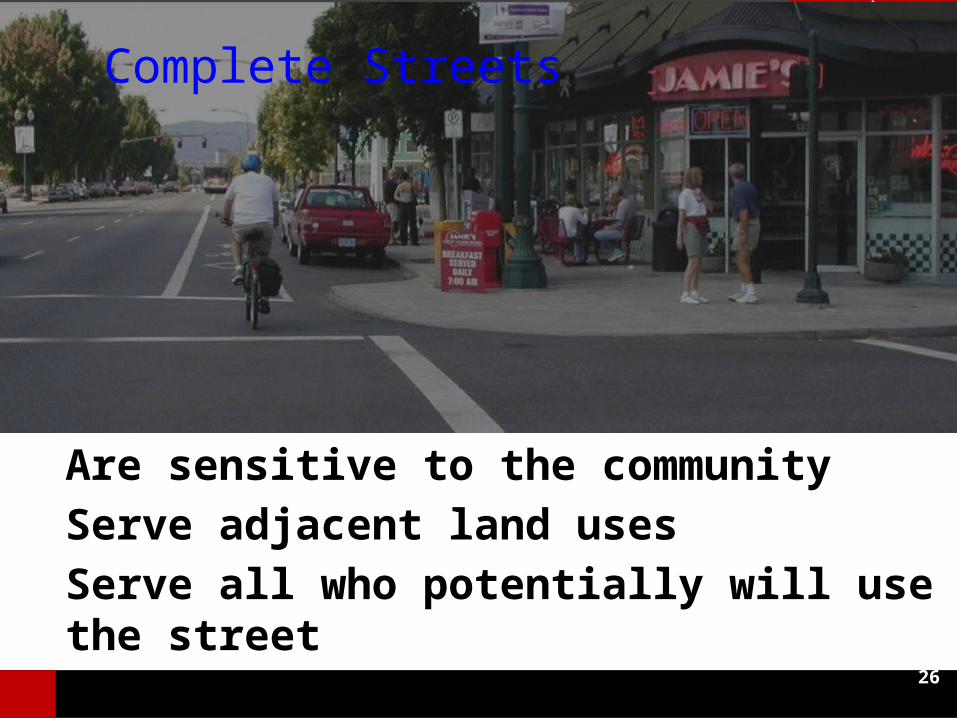
Complete Streets
Are sensitive to the communityServe adjacent land usesServe all who potentially will use the street


28
Why have a Complete Streets Policy?
• To change practice, integrating the needs of all road users into everyday transportation planning practices

29
Why have a Complete Streets Policy?
• To gradually create a complete network of roads that serve all users

30
Why have a Complete Streets Policy?
• To shift transportation investments so they create better streets now

31
Why have a Complete Streets Policy?
• To save money:In the long run, retrofit projects always cost more than getting it right the first time

Complete Streets Implementation workshop 32
Types of Complete Streets Policies
1. Legislation/ordinance
2. Internal department policies
3. Resolution
4. Ballot & funding measures
5. Comprehensive plans
6. Design manuals
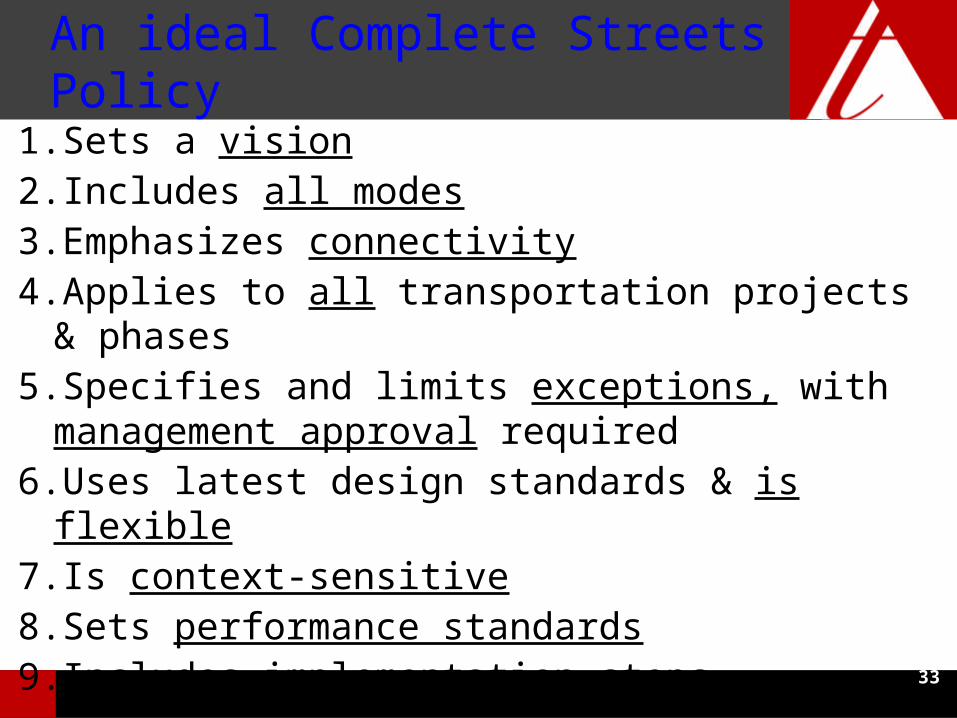
An ideal Complete Streets Policy
1.Sets a vision2.Includes all modes3.Emphasizes connectivity 4.Applies to all transportation projects & phases5.Specifies and limits exceptions, with
management approval required6.Uses latest design standards & is flexible 7.Is context-sensitive8.Sets performance standards9.Includes implementation steps
33
34
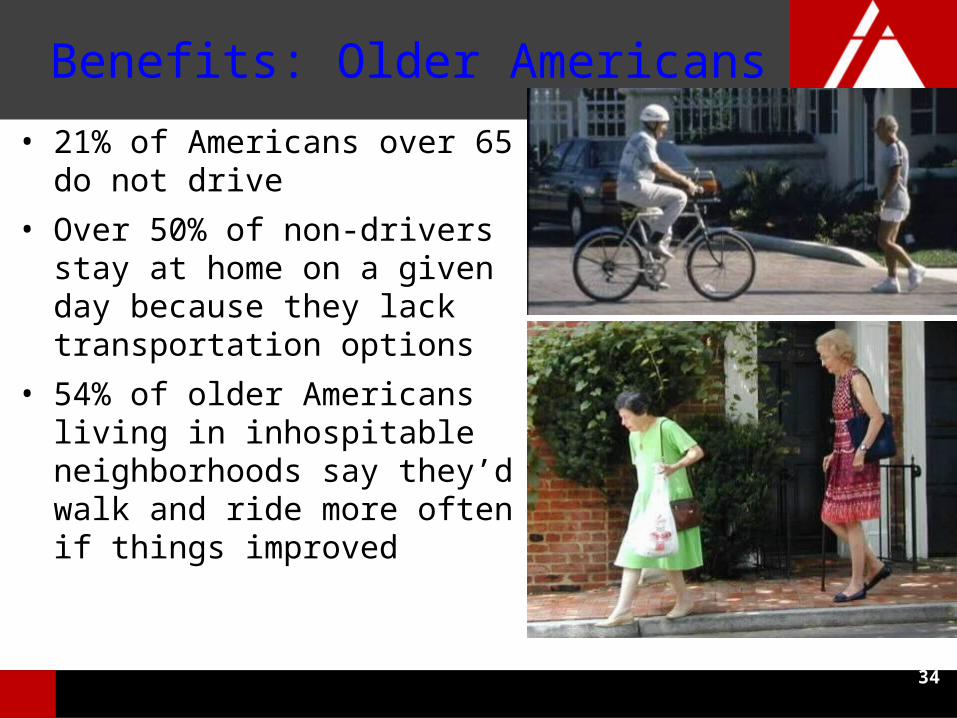
Benefits: Older Americans
• 21% of Americans over 65 do not drive
• Over 50% of non-drivers stay at home on a given day because they lack transportation options
• 54% of older Americans living in inhospitable neighborhoods say they’d walk and ride more often if things improved
35
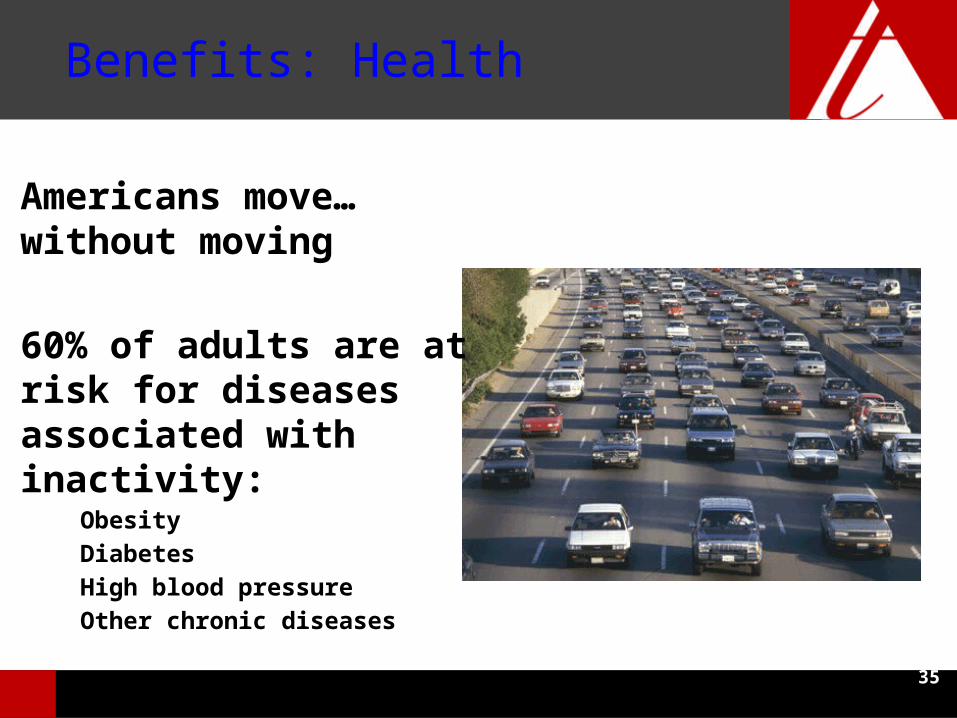
Americans move… without moving
60% of adults are at risk for diseases associated with inactivity:
ObesityDiabetesHigh blood pressureOther chronic diseases
Benefits: Health

36
Benefits: Physical ActivityResidents are more likely to walk in a neighborhood w/sidewalks
Cities with more bike lanes have higher levels of bicycling
1/3 of regular transit users meet minimum daily physical activity requirement during their commute

37
Benefits: Safety
• Sidewalks reduce pedestrian crash risk by 88%
• Intersections designed for pedestrians can reduce crash risk by 28%

38
Benefits: People with Disabilities
• Improved mobility for disabled people and reduced need for expensive paratransit service

39
Benefits: Better us of Transit Funds
A year of paratransit service for a daily commuter:$38,500
Making a transit stop accessible:$7,000-$58,000
Source: Maryland Transit Administration

40
Benefits: The Economy/Your Wallet
Multi-modal streets:Increase home valuesRevitalize retailPeople can leavetheir car at home