international conference territorial impact assessment of ... · new ‘kid on the block’...
TRANSCRIPT

// What Territorial Impact Assessment of Territorial Cohesion in Italian regions
(Territorial Cohesion, Place based evidence model, Policy evaluation, Inner and metropolitan peripheries, Territorial Planning, Green economy)
Maria Prezioso
International Conference
Territorial Impact Assessment of Territorial Cohesionin Italy and Europe
Rome, 11-12 April 2019University of Rome “Tor Vergata”

PRIN (Research projects of National interest in Human Science – duration: 3 years):“Territorial Impact Assessment of the territorial cohesion in Italian regions. Place evidence model for assessing policies devoted to green economy in inner and metropolitan peripheries” 4/16/2019PowerPoint template 16:92
0- Measure, by a new TIA
method and tool GIS of the distance from the 2020 targets achievable through the Policy of Territorial Cohesion
- Test policy activities 2020 in Italian regions for the territorialized use of the Policy and funds ofCohesion in offering Services of General Interest in inner peripheries
- relaunch a territorialised cohesion policy post-2020
- Insert TIA and TC into a common methodology of sustainable territorial planning (New Territorial Agenda post 2020)
- development of new TC indicators and recommendations towards the green economy development

Research questions (1-2 years):- what TC means for Italy in Europe- how to create a common policy and language able to supportdecision making in Italy
New methodology, tools and placeevidence need 4/16/2019PowerPoint template 16:93

Starting from the status quo ofCohesion Policy at 2017 …
PowerPoint template 16:94 4/16/2019
In a feasible and practical way
TC is a public policy issue
10 Units (more than 60 researchers involved) are holding a close dialogue between them and with:
Institutional GovernamentalObservators- Precidency of Italian Ministries
Council- Agency of Territorial Cohesion- MIT- MATTM- Committe of Regions
and 76 regional/local stakeholders

…EC possible options (toward EU budget 2021-2027): what scenario?

PRIN Methodological Approach Adoption of a complex process by a ‘logical tree’ named STeMA that involves some methods
(geographical, statistical, econometric, math) in order to: i) guarantee simple results, ii) makecoherent integration of instruments, techniques, data, weights/judgements and mapping The process is able to select and produce: indicators, quali-quantitative evaluation, place evidence, territorialised results and policy recommendations It incorporates a TIA method and GIS that follow rules coherent with the EU evaluation
expectations (EP, DG Regio, CoR, etc.) After 2 years of intensive work, the STeMA methodological approach has produced:
- A critical review of scientific and ‘grey’ literature (general and sectoral, concepts, programs, projects, etc.) of the Italian policy framework (national, regional and local) related to the European TC
- Shared definitions, surveys and synthesis of concepts- Selection of 73 indicators (metadata and data) covering Italian NUTS 2 and 3 and mapping- ex ante territorialised evaluation of 4 main determinants (Europe 2020 Strategy: smart, sustainable,
inclusive and spending of funds) by STeMA-T IA- 7 Systemic territorial regional typologies able to territorialise the TIA results of Europe2020 Strategy
The 3rd year will be dedicated to develop the ex post assessment of policies at regional level(2020 evaluation and post), detailed regional analysis and policy recommendations

Some key words are connected to TC
• Cohesion, Cohesion Policy and Territory• Competitiveness and productivity• Sustainability• Diversity (territorial and geographical)• Inclusion and social inclusion• Equity• Territorial Impact Assessment• Inner periphery (in Italy: metro peripheries and internal
areas)• Territorial Capital and Spatial Planning• Green Economy

g g p pTC is
the whole of a society’s inherent values, a place’s implicit identity, the collective and individual feeling of a distinct region (J. Brunhes, C. Vallaux, 1921)
system (G. Jaia,1938) that “contribute to manage, discipline, integrate individual and collective activities”
economic regime (U. Toschi, 1948) “force of the organization … that identify with political territorial units”
Determinant in all cultures, a real value only in western societies’ post-capitalism systems, which exploit it in order to spread, having accepted competition, free market access of all enterprises producing similar goods, and price competitiveness (M. Weber, 1945)
content and category of development (J. Schumpeter, 1954)
complex of principles and institutions on which, in a given historical time, the organization of a state processes of goods and services’ production and distribution is based (W. Sombart, 1967 and the neo-schumpeterians)
capability of spreading settled socio-territorial models, adherence to shared socio-economic principles, potential for positively affecting income, gross domestic product, wealth, interest rate through regional operating Programmes regarding to contents and categories (Prezioso, 2006)
an incremental value resulting from European Cohesion policy (Mairate, 2006);
Discourse that derives from the analysis of a situation, and is also liable to influence that situation (Dühr, Colomb and Nadin, 2010; Elissalde, Santamaria, 2013).
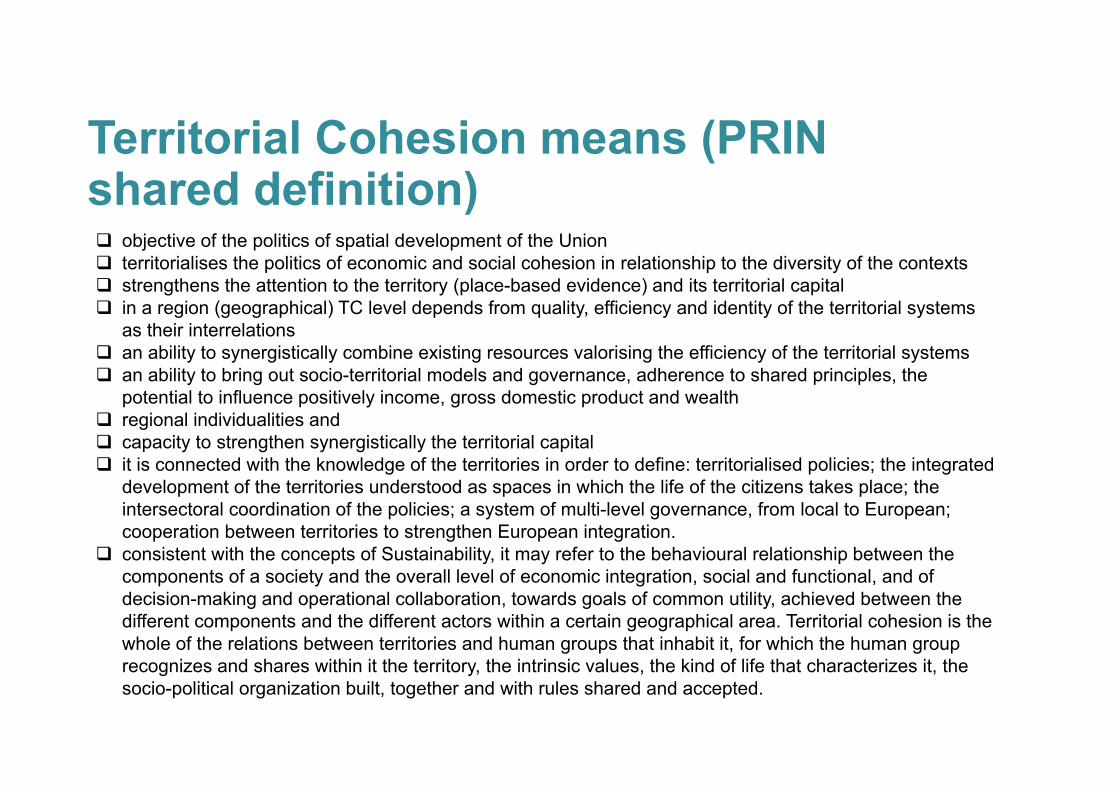
Territorial Cohesion means (PRIN shared definition) objective of the politics of spatial development of the Union territorialises the politics of economic and social cohesion in relationship to the diversity of the contexts strengthens the attention to the territory (place-based evidence) and its territorial capital in a region (geographical) TC level depends from quality, efficiency and identity of the territorial systems
as their interrelations an ability to synergistically combine existing resources valorising the efficiency of the territorial systems an ability to bring out socio-territorial models and governance, adherence to shared principles, the
potential to influence positively income, gross domestic product and wealth regional individualities and capacity to strengthen synergistically the territorial capital it is connected with the knowledge of the territories in order to define: territorialised policies; the integrated
development of the territories understood as spaces in which the life of the citizens takes place; the intersectoral coordination of the policies; a system of multi-level governance, from local to European; cooperation between territories to strengthen European integration.
consistent with the concepts of Sustainability, it may refer to the behavioural relationship between the components of a society and the overall level of economic integration, social and functional, and of decision-making and operational collaboration, towards goals of common utility, achieved between the different components and the different actors within a certain geographical area. Territorial cohesion is the whole of the relations between territories and human groups that inhabit it, for which the human group recognizes and shares within it the territory, the intrinsic values, the kind of life that characterizes it, the socio-political organization built, together and with rules shared and accepted.

… and that TC is linked to territorial efficiency and massAs economic scientists suggest: Barca Report 2009, 2011 and 2018, Science Po 2010, Fitoussi, Stiglitz, Senn Report 2013, BES Composite Index 2013, UrbBES Report 2015:
the closer relationships with GDP is discussed and the capacity building efficiency emerges as main issue
polycentrism (Davoudi, 2004) appears as the better form receipting and increasing TC supported from an horizontal cooperative organisation based on the mass (population, resources, funds)
each “socio-economic system” (urban, rural, urban-rural, peripheral, inner, internal) has the its owenreal expression and dimension of Territorial Cohesion
at different subsidiary level (scales)national
regional
sub-regional
local
TC is ever located and different
Cohesion
MassEfficiency

What TIA, in order to measure and apply a Territorial CohesionPolicy 2020 and post
STeMA_TIA methodology
4/16/2019PowerPoint template 16:911
2 TC
TC is ever localised

PRIN compared models in EU
PowerPoint template 16:912 4/16/2019
Producing and important narrativeTIA relates to many dimensions, including: financial, capacity building and better regulation, legislative revision/integration, policies, NOP-ROP, etc.The story is long to tell …. But Geography is on 6° place in the EU for research on TIA which also include SEA and EIA
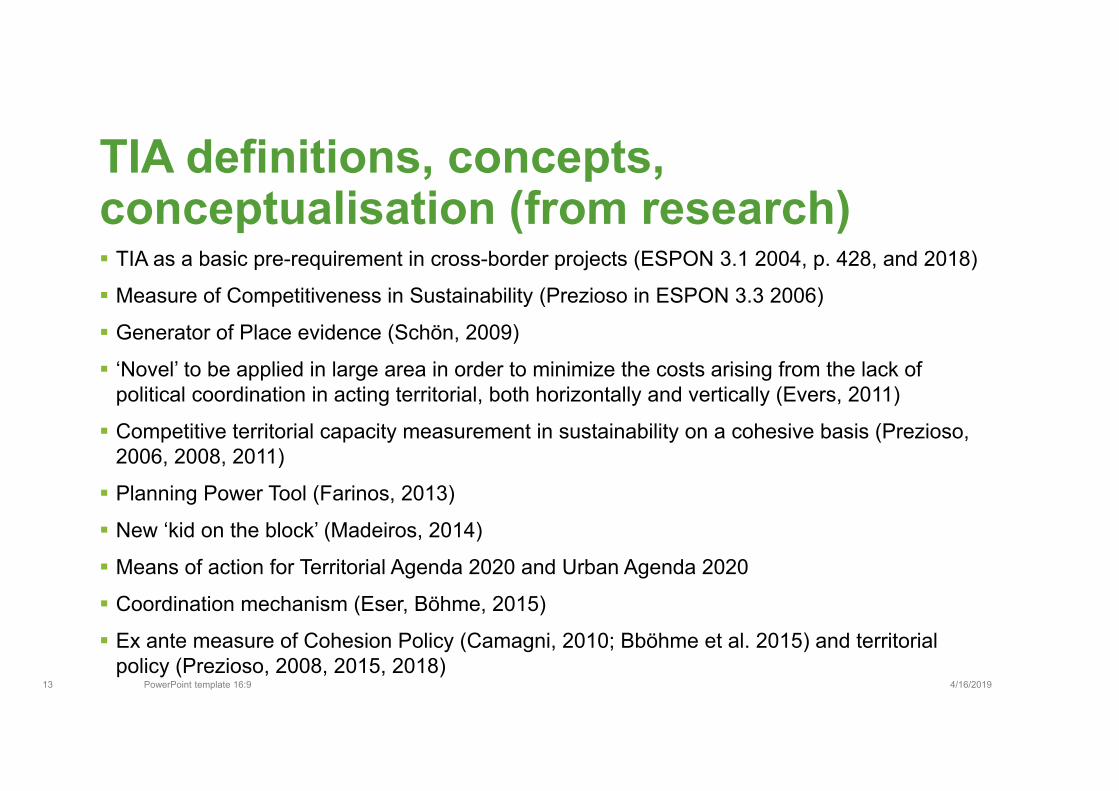
TIA definitions, concepts, conceptualisation (from research)
PowerPoint template 16:913 4/16/2019
TIA as a basic pre-requirement in cross-border projects (ESPON 3.1 2004, p. 428, and 2018)
Measure of Competitiveness in Sustainability (Prezioso in ESPON 3.3 2006)
Generator of Place evidence (Schön, 2009)
‘Novel’ to be applied in large area in order to minimize the costs arising from the lack of political coordination in acting territorial, both horizontally and vertically (Evers, 2011)
Competitive territorial capacity measurement in sustainability on a cohesive basis (Prezioso, 2006, 2008, 2011)
Planning Power Tool (Farinos, 2013)
New ‘kid on the block’ (Madeiros, 2014)
Means of action for Territorial Agenda 2020 and Urban Agenda 2020
Coordination mechanism (Eser, Böhme, 2015)
Ex ante measure of Cohesion Policy (Camagni, 2010; Bböhme et al. 2015) and territorial policy (Prezioso, 2008, 2015, 2018)

TIA in UE
PowerPoint template 16:914 4/16/2019
strong narrative background since 2001, TIA constitutes a means and a procedure to support and create awareness in the policy/decision maker
It creates correlation between ‘policy and financing targeting and policy awareness of expected effects
It allows to reduce/overcome the subjective perception of the impact of EU interventions (Petzold, European Committee of regions, 2016)
TIA is applied to policies, funds, CBC, strategies, administrative capacity, legislation, etc.
Questions raised by the EU:- How do European economic and social and investment challenges change using regional TIA?- Institutions and governance: can TIA improve and strengthen public administration and effective management in the use of funds?- Does TIA improve the use of resources for policies? making them more effective and efficient?

STEP 1: TIA Logical Framework of TC by STeMA(Prezioso, Coronato 2017)
Sustainability• Climate Change• Energy• Competitiveness• Biodiversity
Smart• Innovation• Education• Digital Society
Inclusive• Employment• Poverty and
exclusion
(Concepts)• Competitiveness• Territorial
Capital
(Concepts)• Green
economy• Sustainability
(Concepts)Social
Inclusion
In Metropolitan and inner peripheriesTerritorialisation
indicators indicators indicators
Categories
Indicators
Sectors and Types
Determinants

Smart Growth
Education and Human CapitalSupply of educationHuman capital internationalisation
Digital society
Bridging digital divided and digital
transitionTechnological\innovative dissemination
for the enterprises and institutionsSupport to transregional cooperative
projectsUse/development of environmental
friendly techologiesQuality certification and assessment
tools
Innovation and R&D
R&D infrastructuresSupport to BATDevelopment of recycling technologies
and products (circular economy)
Transport/network
Development of telecomunication
networksDevelopment of energy networks
List of Policy

Sustainable growth
Competitiveness and
Economic development
Support Local productive
identityPromotion of a global enterprise
cultureNew business/service
instrumentsInflation/Deflaction controlInternationalisation of good and
services
Natural Resources efficiency
Use of renovable resourcesActive Protection of Natural
resourcesReduction of Natural

Inclusive Growth
Age
Reinvolvement of aging people
Support leisureSocial integrationChild protectionPoverty reductionPolicies dissemination for
transparency and efficency of
burocracyCultural integration
Employment
Homogeneisation of enterprise
costsSupport enterprise creationSupport employer mobilitySupport equal opportunitiesSocial Programme FinancingS f

Brid
ging
dig
ital d
ivid
ed
Tech
nolo
gica
l\inno
vativ
e di
ssem
inat
ion
for t
he e
nter
pris
es a
nd in
stitu
tions
Supp
ort t
o tra
nsre
gion
al c
oope
rativ
e pr
ojec
ts
Use
/dev
elop
men
t of e
nviro
nmen
tal
frien
dly
tech
olog
ies
Qua
lity c
ertif
icat
ion
and
asse
ssm
ent
tool
s
R&D
infra
stru
ctur
es
Supp
ort t
o BA
T
Dev
elop
men
t of r
ecyc
ling
tech
nolo
gies
of
was
te
Supp
ly o
f edu
catio
n
Hum
an c
apita
l inte
rnat
iona
lisat
ion
Rei
nvol
vem
ent o
f agi
ng p
eopl
e
Supp
ort l
eisu
re
Soci
al in
tegr
atio
n
Chi
ld p
rote
ctio
n
Pove
rty re
duct
ion
Polic
ies
diss
emin
atio
n fo
r tra
nspa
renc
y an
d ef
ficen
cy o
f bur
ocra
cy
Cul
tura
l inte
grat
ion
Supp
ort L
ocal
pro
duct
ive
iden
tity
Prom
otio
n of
a g
loba
l ent
erpr
ise
cultu
re
New
bus
ines
s/se
rvic
e in
stru
men
ts
Infla
tion
cont
rol
Inte
rnat
iona
lisat
ion
of g
ood
and
serv
ices
Hom
ogen
eisa
tion
of e
nter
pris
e c
osts
Supp
ort e
nter
pris
e cr
eatio
n
Supp
ort e
mpl
oyer
mob
ility
Supp
ort e
qual
opp
ortu
nitie
s
Dev
elop
men
t of
tele
com
unic
atio
n ne
twor
ks
Dev
elop
men
t of e
nerg
y ne
twor
ks
Incr
ease
of p
hisi
cal a
cces
sibi
lity
Use
of r
enov
able
reso
urce
s
Activ
e Pr
otec
tion
of N
atur
al re
sour
ces
Red
uctio
n o
f Nat
ural
Res
ourc
es
cons
umpt
ion
Nat
ural
haz
ard
prev
entio
n
Ener
gy p
olic
ies
Flex
ible
Mec
hani
sms
(ETS
, CD
M)
Clim
ate
Activ
e Pr
otec
tion
Soci
al P
rogr
amm
e Fi
nanc
ing
Safe
ty
Supp
ort W
elfa
re
Effects Ci Bj' Bj 0 0 0 0 0 0 0 0 0 0 0 0 0 0 0 0 0 0 0 0 0 0 0 0 0 0 0 0 0 0 0 0 0 0 0 0 0 0 0
1 1 2 2 2 3 2 1 2 2 2 2 1 1 1 1 2 3 2 1 3 3 Aumento del livello di produttività 0.00 0 49 2 2 2 3 2 3 1 1 2 3 2 2 2 2 3 2 2 2 2 2 1 2 3 1
2 1 3 3 2 2 2 2 1 3 3 2 1 1 3 1 3 3 1 1 2 3 1 3 3 2 3 2 1 2 2 2 2 2 3 3 1 2 1 Aumento della domanda di beni e servizi green 0.00 0 42 1 2 1 1 1 1 1 1 2 2 1 3 3 2 2 1 2 1 1 1 2 2 1 2 1 2 2
3 3 3 1 1 1 2 2 2 1 3 3 2 1 3 1 3 2 2 2 2 2 2 2 2 2 1 2 2 2 2 2 2 2 3 Aumento del livello di occupazione nei settori green 0.00 0 46 2 2 1 2 1 2 2 3 2 3 1 3 2 2 3 3 2 1 2 2 2 2 1
4 2 1 1 1 2 1 3 2 3 3 3 3 1 1 3 3 3 2 2 1 1 2 3 1 2 3 3 3 3 3 3 3 1 1 3 3 3 1 1 Aumento della salute pubblica 0.00 0 26 1 1 3 1 2 1 1 2 2 1 1 2 1 1 3 1 2
5 1 3 3 2 3 2 3 3 3 3 1 3 2 Aumento delle attività legate al tempo libero 0.00 0 11 3 1 1 1 1 1 1 2
6 2 1 1 2 1 3 3 3 3 3 3 2 1 3 2 3 1 3 2 2 3 2 1 1 2 2 3 3 3 3 3 3 3 3 3 Riduzione dei rif iuti 0.00 0 22 2 2 2 3 3 1 2 1 1 1 2 2
7 2 3 2 2 3 3 3 3 3 2 2 3 3 2 1 3 3 3 3 1 2 2 2 3 2 2 3 2 2 1 1 2 1 1 2 1 1 1 3 3 3 Processo produtitvo a basso impatto sull'ambiente 0.00 0 34 2 2 1 3 3 2 2 2 2 2 2 3 3 2 2 1
8 1 3 1 2 2 3 1 3 3 3 2 1 3 3 1 2 2 3 3 2 2 2 3 3 3 3 3 3 3 3 3 Aumento del livello di riciclo dei rif iuti 0.00 0 25 1 1 3 2 2 3 3 2 2 1 2 2 1
9 1 2 1 2 1 1 2 2 3 3 1 2 1 3 1 1 1 1 1 1 1 Prevenzione dai rischi naturali 0.00 0 40 2 3 3 2 2 2 2 3 3 3 3 1 2 2 2 3 2
10 1 3 1 1 1 2 1 3 3 1 3 3 3 3 3 3 3 3 2 1 3 2 2 3 2 3 3 2 2 2 2 2 2 3 3 2 1 Riduzione delle polveri sottili 0.00 0 29 1 2 2 2 3 1 1 1 1 1 2 2 3 3 2 2
11 1 1 1 2 1 2 2 2 3 2 3 1 3 2 1 1 2 1 3 3 Uso efficiente delle acque 0.00 0 36 2 1 3 3 2 3 1 1 1 2 3 3 2 1 3 2 3
12 2 3 1 2 2 2 1 3 3 1 3 3 3 3 3 3 1 3 2 2 3 1 2 3 3 2 2 2 2 2 2 3 3 3 2 Diminuzione del livello di CO2 0.00 0 36 1 2 3 3 2 3 2 1 1 1 3 2 1 2 1 3 3 1 1
13 2 2 3 1 2 3 Miglior livello di perequazione 0.00 0 21 1 2 3 2 2 1 3 2 3 2
14 2 2 2 2 2 2 3 3 1 3 3 3 3 3 1 3 2 3 3 1 1 1 1 1 Aumento offerta ecoservizi 0.00 0 25 2 3 3 2 2 3 1 1 1 2 2 1 1 1
15 3 3 1 1 1 2 2 2 3 2 2 Dimunuzione del livello di povertà 0.00 0 26 1 2 2 2 3 3 3 2 2 3 3
16 2 2 1 2 1 1 3 1 2 2 1 1 1 1 1 1 3 1 Aumento dell'occupazione femminile nei settori green 0.00 0 32 1 1 1 2 2 2 3 1 2 2 2 2 3 3 2 3
17 2 2 3 1 2 1 3 2 2 2 1 1 1 2 2 3 2 2 1 1 2 1 2 2 1 1 1 3 3 2 3 3 2 3 2 2 3 2 3 1 1 2 2 2 3 Aumento del livello di benessere 0.00 0 45 2 2 2 2 2 2 3 3 2 2 2 2 3 1 3 1 1 2 3 2 3
18 3 1 2 2 2 3 2 3 3 2 1 3 3 2 1 2 2 2 2 1 3 2 2 Efficienza energetica 0.00 0 36 2 2 3 2 2 3 2 3 2 2 2 3 3 3 2
19 2 2 2 1 1 3 1 3 3 2 1 1 1 3 2 2 1 Internazionalizzazione 0.00 0 32 3 1 3 1 2 1 1 3 3 2 2 1 2 3 3 1
20 2 1 2 2 1 3 1 2 2 2 3 3 2 2 2 3 3 3 3 2 Aumento dell'attrattività territoriale nei settori green 0.00 0 19 2 1 1 2 1 3 1 2 1 3 2
21 3 3 1 2 1 1 2 3 2 3 1 1 3 3 2 2 2 Aumento della connettività culturale green 0.00 0 31 3 2 1 3 3 1 1 3 2 1 2 3 2 2 2
22 3 3 1 1 2 2 2 3 1 2 2 2 2 2 2 1 1 1 1 1 Aumento dell'offerta di lavoro green 0.00 0 19 2 1 1 3 2 3 3 2 2
23 2 2 3 3 3 2 1 1 2 2 2 2 1 2 3 1 1 2 2 1 3 Innovazione di prodotto/processo 0.00 0 28 3 3 1 3 3 3 2 3 1 3 3
24 1 1 1 1 1 1 3 3 3 1 Riduzione del rischio di esclusione sociale 0.00 0 24 1 1 2 2 3 1 3 3 3 2 2 1
25 2 2 1 1 3 3 3 1 3 2 2 1 2 1 3 3 3 2 2 2 2 1 1 1 1 1 1 1 1 Aumento delle infrastrutture materiali ed immateriali green (connettività)
0.00 0 36 3 3 1 3 1 2 2 2 3 2 3 3 2 3 3
26 3 3 2 1 1 3 1 1 1 3 2 1 1 3 1 3 3 Aumento degli aiuti pubblici al settore green 0.00 0 50 3 3 2 2 1 2 2 3 2 3 2 1 1 2 1 3 1 1 2 3 3 3 3 1
27 2 2 1 2 3 1 3 3 1 1 2 2 1 1 2 3 3 3 Uso delle rinnovabili 0.00 0 39 2 1 3 3 3 3 2 2 3 3 2 3 2 2 1 3 1
28 2 2 2 2 3 2 2 3 3 3 3 1 3 1 1 3 Cambio della Tecnologia sostenibile 0.00 0 28 3 3 1 3 2 3 3 3 2 1 1 2 1
29 3 3 3 2 2 3 3 2 1 1 3 2 1 2 3 Aumento della capacità innovativa 0.00 0 34 3 3 2 3 2 3 3 2 3 2 1 2 2 2 1
30 3 3 3 1 1 1 1 2 2 1 2 2 2 3 1 2 1 1 1 1 2 1 2 3 Aumento della formazione nei settori green 0.00 0 26 2 2 3 2 1 1 1 3 2 3 2 1 1 2
31 2 3 3 2 2 2 3 3 Aumento attrattività (IDE, turismo, ecc) 0.00 0 21 2 1 1 2 1 1 2 2 1 2 1 3 2
32 2 3 2 1 2 1 1 3 2 2 3 1 2 3 3 Aumento della cooperazione transnazionale 0.00 0 33 1 3 2 3 1 2 2 1 3 2 2 1 2 3 3 2
32 37 0 46 40 30 35 44 38 7 8 40 43 14 12 8 16 28 33 22 41 19 11 69 15 23 32 22 22 14 21 31 24 3 33 4 24 25 14 25 14 24 2 14 14 35 34 8 17 14 17 14 22 21 22 22 33 20 8 8 31 30 10 16 25 7 8 22
Stu
dent
i uni
vers
itari
iscr
itti n
ei in
set
tori
gree
n
Pop
olaz
ione
laur
eata
in s
etto
ri gr
een
Indi
ce d
i dip
ende
nza
inno
vativ
a
Uni
vers
ità e
cen
tri d
i Ric
erca
acc
redi
tati
al C
arbo
on F
oot P
rint
Cap
acità
inno
vativ
a
Cer
tific
azio
ne a
mbi
enta
le E
mas
Bre
vetti
ver
di re
gist
rati
allo
Eur
opea
n P
aten
t Offi
ce (E
PO
) (nu
mer
o pe
r milio
ne d
i abi
tant
i)
Num
ero
di li
cenz
e ec
olab
el
Qua
lità
ambi
enta
li di
org
aniz
zazi
one
e di
impr
ese
(n. d
i org
aniz
zazi
oni c
ertif
icat
e IS
O 1
4001
og
ni 1
00.0
00 im
pres
e)P
oten
za e
ffici
ente
lord
a de
lle fo
nti r
inno
vabi
li
Con
sum
i per
set
tore
ver
de
Ene
rgia
pro
dotta
da
font
i rin
nova
bili
Pro
duzi
one
netta
di e
nerg
ia e
lettr
ica
attra
vers
o im
pian
ti ge
oter
moe
lettr
ici,
eolic
i e fo
tovo
ltaic
i
Cap
acità
di e
spor
tare
in s
etto
ri a
dom
anda
din
amic
a
Live
llo d
i esp
orta
zion
i (€)
Live
llo d
i im
porta
nzio
ni (€
)
Acc
essi
bilit
à G
reen
Cos
te n
on b
alne
abili
per
inqu
inam
ento
Den
sità
di p
ista
cic
labi
le
Ser
vio
Car
Sha
ring
Nat
ura
2000
Zone
pro
tette
Age
nda
21
Pro
getto
Sm
art C
ity
VAS
regi
onal
e +
Acco
rdi B
lue
(mar
e e
cost
a)
VIA
regi
onal
e
Vul
nera
bilit
à (s
ism
ica,
idre
olog
ica,
indu
stria
le)
Cap
acità
di a
ttraz
ione
dei
con
sum
i tur
istic
i ver
di
Eco
Par
chi
Gru
ppi d
i ric
erca
inte
nazi
onal
e ne
i set
tori
gree
n
Uni
tà d
i lav
oro
in A
gric
oltu
ra, s
ilvic
oltu
ra e
pes
ca
Uni
tà d
i lav
oro
nei s
ervi
zi g
reen
alle
impr
ese
Pop
olaz
ione
atti
va n
ei s
etto
ri gr
een
Det
razi
one
fisca
le d
el 5
5%
Con
sum
i pro
cap
ite d
i pro
dotti
gre
en
Indi
ce d
ei p
rezz
i al c
onsu
mo
Com
mer
cio
di b
eni g
reen
Com
mer
cio
di s
ervi
zi g
reen
Ince
ntiv
i Fis
cali
Co2
pro
cap
ite n
on e
mes
sa (r
ispa
rmio
pro
cap
ite)
Inve
stim
enti
dire
tti e
ster
i in
gree
n
Ban
da la
rga
per l
e im
pres
e
Azi
ende
zoo
tecn
iche
Opp
ortu
nità
cul
tura
li (v
erdi
)
Turis
mo
verd
e ne
i mes
i non
est
ivi
Pos
ti le
tto a
lber
ghie
ri (v
erdi
)
Stru
tture
rice
ttive
gre
en
Indi
ce d
ei p
rezz
i pro
dotto
Gre
en
Con
sum
i gre
en
GD
P pr
o ca
pite
Inci
denz
a de
lle fa
mig
lie c
on u
n re
ddito
net
to a
l di s
otto
del
la s
oglia
di p
over
tà a
ssol
uta,
per
pr
ovin
cia.
O
ccup
azio
ne fe
mm
inile
nei
set
tori
gree
n
Rifi
uti u
rban
i rac
colti
Rifi
uti u
rban
i sm
altit
i in
disc
aric
a pe
r abi
tant
e
Rifi
uti s
peci
ali r
acco
lti
Rifi
uti s
peci
ali s
mal
titi
Rifi
uti u
rban
i (fra
zion
e um
ida
+ ve
rde)
trat
tati
in im
pian
ti di
com
post
aggi
o
Rac
colta
diff
eren
ziat
a de
i rifi
uti u
rban
i
Acq
ua p
rele
vata
Acq
ua im
mes
sa
Em
issi
one
di C
O2
Sup
eram
ento
sog
lia d
i alla
rme
Tass
o di
feco
ndità
Set
tore
Soc
iale
Live
llo d
i sen
sibi
lità
alla
sos
teni
bilit
à
Live
llo d
i fid
ucia
nel
le is
tituz
ioni
in m
ater
ia g
reen
Fond
i IN
TER
REG
spe
si
Spe
se in
R&S
set
tore
gre
en
Variables
ID data 1 2 3 4 5 6 7 8 9 10 11 12 13 14 15 16 17 18 19 20 21 22 23 24 25 26 27 28 29 30 31 32 33 34 35 36 37 38 39 40 41 42 43 44 45 46 47 48 49 50 51 52 53 54 55 56 57 58 59 60 61 62 63 64 65 66 67 68
GREEN ECONOMY
Green Economy for Europe 2020 Strategy
Economic development Employment Natural Resources Public HealtClimateTransport/netw orkAgeR&D Human CapitalInnovation
INDICATORS
POLICY EFFECTS

4/16/201920
3Go to logic schema
effects on TC
Territorialization
COMPARE E - E'' PRE-XONDITIONALITY
D Policy impacts B Policy weightsC
Policy
Regional Policy Choice
D' modified policy impacts ꝺ
Regional TC ex ante
E' ex post no territorialised
E'' ex post territorialised
Territorialisation by STFT
Source: Prezioso, 2018
To calculate this ꝺwe created SRFTs
7 SRFTs as base of STeMA TIA 3.0

PowerPoint template 16:921 4/16/2019
1. MEGA and Metropolitan Systems in 4 different morphological typologies, with high urban influence andtransnational/national functions able to make cooperation between cities (or city parts) at regional, national,transnational level
2. High Urban influence Systems in 4 different morphological typologies, with transnational/national specialisedfunctions able to make urban-rural cooperation between interconnected areas at regional, national, transnationallevel
3. High Urban influence Systems in 4 different morphological typologies, without specialised functions and lowtransnational/national functions, able to make rural cooperation between authorities in interconnected areas atregional, national, transnational level
4. High Urban influence Systems in 4 different morphological typologies, without specialised functions andtransnational/national functions, not able to make rural cooperation between at regional, national, transnationallevel
5. Low Urban influence Systems in 4 different morphological typologies, with transnational/national specialisedfunctions able to make rural cooperation between interconnected areas at regional, national, transnational level
6. Low Urban influence Systems in 4 different morphological typologies, with regional/local functions, not able tomake rural cooperation between interconnected areas at regional, local level
7. Low Urban influence Systems in 4 different morphological typologies, without specialised functions andtransnational/national functions, not able to make rural cooperation between at regional, national, transnationallevel.
Combining 7 typologies STeMA (Prezioso, 2003, 2006, 2011) revisited taking into account 4 types of territories with geographical diversity (ESPON, 2016), 4 types of inner periphery and 5 FRTs (ESPON, 2017)


IT1079 Toscana 4
IT1080 Massa-Carrara 3
IT1081 Lucca 3
IT1082 Pistoia 3
IT1083 Firenze 2
IT1084 Prato 3
IT1085 Livorno 2
IT1086 Pisa 2
IT1087 Arezzo 6
IT1088 Siena 6
IT1089 Grosseto 6
IT1090 Umbria 6
IT1091 Perugia 5
IT1092 Terni 6
IT1093 Marche 4
IT1094 Pesaro e Urbino 3
IT1095 Ancona 3
IT1096 Macerata 3
IT1097 Ascoli Piceno 3
IT1098 Fermo 6
IT1099 Lazio 1
IT1100 Viterbo 6
IT1101 Rieti 6
IT1102 Roma 1
IT1103 Latina 3
IT1104 Frosinone 3
IT1000 Abruzzo 4
IT1001 L'Aquila 6
IT1002 Teramo 3
IT1003 Pescara 3
IT1004 Chieti 3
IT1005 Molise 6
IT1006 Isernia 6
IT1007 Campobasso 6
IT1008 Campania 3
IT1009 Caserta 3
IT1010 Benevento 3
IT1011 Napoli 1
IT1012 Avellino 3
IT1013 Salerno 2
IT1014 Puglia 4
IT1015 Taranto 3
IT1016 Brindisi 3
IT1017 Lecce 3
IT1018 Foggia 6
IT1019 Bari 2
IT1020 Barletta-Andria-T 6
IT1021 Basilicata 6
IT1022 Potenza 6
IT1023 Matera 6
IT1024 Calabria 4
IT1025 Cosenza 3
IT1026 Crotone 6
IT1027 Catanzaro 3
IT1028 Vibo Valentia 3
IT1029 Reggio di Calab 3
IT1031 Sicilia 3
IT1032 Trapani 3
IT1033 Palermo 2
IT1034 Messina 3
IT1035 Agrigento 3
IT1036 Caltanissetta 3
IT1037 Enna 6
IT1038 Catania 2
IT1039 Ragusa 3
IT1040 Siracusa 3
IT1041 Sardegna 5
IT1042 Sassari 6
IT1043 Nuoro 6
IT1044 Cagliari 2
IT1045 Oristano 6
IT1046 Olbia-Tempio 6
IT1047 Ogliastra 6
IT1048 Medio Campida 6
IT1049 Carbonia-Iglesia 6
N2_03 Italy Territory
IT970 Piemonte 2
IT971 Torino 1
IT972 Vercelli 6
IT973 Biella 3
IT974 Verbano-Cusio- 6
IT975 Novara 3
IT976 Cuneo 6
IT977 Asti 3
IT978 Alessandria 3
IT979 Valle d'Aosta/Va 6
IT980 Valle d'Aosta/Va 6
IT981 Liguria 4
IT982 Imperia 3
IT983 Savona 3
IT984 Genova 1
IT985 La Spezia 2
IT986 Lombardia 1
IT987 Varese 3
IT988 Como 2
IT989 Lecco 3
IT990 Sondrio 6
IT991 Bergamo 3
IT992 Brescia 2
IT993 Pavia 3
IT994 Lodi 3
IT995 Cremona 3
IT996 Mantova 3
IT997 Milano 1
IT998 Monza e della B 3
IT1051 Provincia Auton 6
IT1052 Bolzano-Bozen 6
IT1053 Provincia Auton 5
IT1054 Trento 5
IT1055 Veneto 3
IT1056 Verona 2
IT1057 Vicenza 3
IT1058 Belluno 6
IT1059 Treviso 3
IT1060 Venezia 2
IT1061 Padova 2
IT1062 Rovigo 3
IT1063 Friuli-Venezia G 4
IT1064 Pordenone 3
IT1065 Udine 5
IT1066 Gorizia 3
IT1067 Trieste 2
IT1068 Emilia-Romagna 3
IT1069 Piacenza 3
IT1070 Parma 3
IT1071 Reggio nell'Emi 3
IT1072 Modena 3
IT1073 Bologna 1
IT1074 Ferrara 3
IT1075 Ravenna 3
IT1076 Forlì-Cesena 2
IT1077 Rimini 6

73 basic indicators wereselected to represent the 4 determinants of TC(data, metadata, quantitative values)
4/16/2019PowerPoint template 16:927
3A survey to policy makers, stakeholders, practitioners, civilservantes permitted to better understand the initial knowledge of TC in Italy (ANNEX)

PowerPoint template 16:928 4/16/2019
Smart Growth Innovation Vulnerability (IV)
Innovation Status Quo (ISQ) Digital Society (DS) Formazione (F)
Virtual shareholder (VSh)
Virtual Stakeholders (VSt)
Structure for the creation of knowledge
Capitale Umano (CU)
Formazione del Capitale Umano
(FCU)
R&D infrastructures (RDI)
Livello di sviluppo delle telecomunicazioni (LST)
Pene
trazio
ne de
lla
band
a ultra
larga
(BUL
)
Pene
trazio
ne de
lla
band
a ultra
larg
a (BU
L)
PA U
tilizz
ano i
ntern
et (P
AI)
Stru
tture
Edu
cazio
ne
alla c
reaz
ione d
i co
nosc
enza
(PL)
Indice
di di
pend
enza
inn
ovati
va (I
DI)
Popo
lazion
e con
for
mazio
ne te
rziar
ia (P
ET)
Popu
lation
in lif
e lon
g lea
rning
(PLL
)
R&D
Infra
struc
tures
(R
DI)
Livell
o di p
enetr
azion
e de
lla ba
nda l
arga
nella
PA
(BLP
A)
BUL II PAI
PL
IDI
PET
PLL
RDI
BLPA

PowerPoint template 16:929 4/16/2019

Inclusive Growth
Variabili strutturali di inclusione (VSI) Capacità formativa inclusiva (CFI)
Capacità di inclusione sociale (CSI) Capacità istituzioni (CI) RES+IS=RESIS
Attitude to social welfare
(ATS)
Variabili economiche
Qualità della vita (QV) Capacità del sistema formativo
Rischio di esclusione sociale (RES)
Inclusione straniera (IS)
Fiducia nella governance
SALBD Tempo libero
Inclusione del sistema
formativo ISF
Esclusione del
sistema formativo
ESF
Rischio di
povertà
Rischio di esclusione giovanile (REG)
LPP+AmReg
PIL+DisRed Cons+IPzC Benessere demografico StlnStud OcStr+TxImSt LPP
Prod
otto I
ntern
o Lor
do pr
o cap
ite S
tanda
rd
Poter
e di a
cquis
to (P
ILpp S
PA)
Dise
guale
distr
ibuzio
ne de
l redd
ito re
giona
le (D
isRed
)
Cons
umo p
ro ca
pite (
Cons
)
Indice
dei p
rezz
i al c
onsu
mo /IP
zC)
Tass
o di fe
cond
ità to
tale (
TFT)
Sper
anza
di vi
ta >6
5 (Sp
Vit)
Tass
o di o
sped
alizz
azion
e (SA
L)
Oppo
rtunit
à cult
urali
(OpC
u)
Tass
o di tu
ristic
ità (T
xTUR
)
Popo
lazion
e con
laur
ea tr
ienna
le /
Popo
lazion
e tota
le (P
TE)
Stud
enti i
n ing
ress
o (St
uln)
Stud
enti i
n usc
ita (S
tuUsc
)
Abba
ndon
o sco
lastic
o (Ab
bSc)
NEET
Livell
o di o
ccup
azion
e
Risc
hio di
pove
rtà as
solut
a (Ri
skPo
cAs)
Tass
o di o
ccup
azion
e giov
anile
Risc
hio di
esclu
sione
mino
ri (Ri
skMi
n)
Resid
enti s
tranie
ri (RS
)
Occu
pati s
tranie
ri (Oc
Str)
Tass
o di im
pren
ditor
i stra
nieri (
TxIm
St)
Occu
pazio
ne fe
mmini
le (P
arOp
)
Asili
nido
Parte
cipaz
ioni a
lle am
minis
trazio
ni re
giona
li (A
mReg
)
Parte
cipaz
ione p
ubbli
ca al
la po
litica
na
ziona
le (P
pEn)
Parte
cipaz
ione a
lle el
ezion
i eur
opee
(PeE
e)
Tass
o di c
oope
razio
ne tr
ansfr
ontal
iera e
tra
nsna
ziona
le (C
OOP)
PILp
p SP
A
DisR
ed
Cons
IPzC
TFT
SpVi
t
SAL
OpCu
TxTU
R
PTE
Stuln
StuU
sc
AbbS
c
NEET
Occ
Risk
PovA
s Oc
cG
Risk
Min
RS
OcSt
r
TxIm
St
ParO
p
AN
AmRe
g
PpEn
PeEe
CfUe

Risorse e Fondi
Vulnerabilità (Vuln) Uso dei Fondi (UF)
Livello di intervento in innovazione e conoscenza (InCon) Livello di intervento in sostenibilità (Sost)
Innovazione competitiva (IC) Capitale umano (CU) Competitivitrà
sostenibile (CS) Qualità della vita (QV) Uso dei fondi di coesione
Livello di cooperazione
R&S Aiuto alla imprese
Formazione professionale Occupazione Sostenibilità
allo sviluppo Diritto alla
mobilità Sport e
tempo libero Diritti sociali Fondi di coesione Cooperazione
Spes
a in r
icerca
e Sv
ilupp
o
Spes
a per
svilu
ppo
econ
omico
e co
mpeti
tività
Spes
a per
occu
pazio
ne
RF_S
pesa
per f
orma
zione
pr
ofess
ionale
Spes
a in s
vilup
po
soste
nibile
Spes
a in t
rasp
orti e
diritt
o all
a mob
ilità
Spes
a in p
olitic
he gi
ovan
ili,
spor
t e te
mpo l
ibero
Spes
a per
diritt
i soc
iali,
politi
che s
ocial
i e fa
migli
a
Fond
i di c
oesio
ne ut
ilizza
ti in
prog
etti
Tass
o di c
oope
razio
ne
trans
fronta
liera
e tra
nsna
ziona
le (C
OOP)
RF_S
pR&
S
RF_S
pSv
Ec
RF_S
pOc
RF_S
pFo
P
RF_S
pSS
RF_T
ra
RF_S
pG
RF_S
pSoc
RF_F
CP
RF_C
OOP

4Ex ante place evidence: at 2018 and comparation with 2011
Smart: Milan and some Lombardia provinces decline in significance, as well as Veneto ones, Po Valley, and Bologna and Florence. South shows resilience!
Sustainability: Veneto provinces (Noth-East), Turin, Florence, Rome and Catania loose positions, as well assismic/risk areas
Funds: Here the change issignificant! Milan and Po Valley, Bologna and its Region and sismic areas decline in significance; South Metropolitancities/areas rise! Sicily loosepositions

4/16/2019PowerPoint template 16:933


General Framework until the end of the PRIN II year: the TIA of reached TC cannot be deemed sufficient in order to support the EU pre-conditionality required to enter in post 2020
4/16/2019PowerPoint template 16:935
5Italy is appelling to N+3In January 2019:- 51 OP co-financed by ERDF and ESF 2014-2020
have submitted (31/12/18) the certification ofexpenditure incurred and the correspondingapplication for reimbursement to the EuropeanCommission
- 3/51 NOP are not meeting TC and expendituretargets:•Research and Innovation•Inclusion•Governance•Some regional ROP
Payments October 2018

PRIN Policy remarksTC helps to satisfy policy needsIntroducing new conceptualterms, it is able to create new balanced and «family» solutionsby europeanisation of planning practice
4/16/201936
6
PRIN is Bridging the gapThis means to find the way to participate:- in implementing the next Territorial Agenda - in applying Urban Agenda The measure of the TC progress is important to make policy/decision institutions responsible in strategic integrated choices of investment for the future and for discussing the proposed architecture of the new Cohesion Policy in the Southern macro-region.This could really be a political and economic progress for Italy

Remove obstacles and barriers
PowerPoint template 16:937 4/16/2019
low capability in an efficient spending of Regional Operational Programs (ROPs)
difficulty in the policy elaboration process to catch real needs
difficulty in the selection of appropriate beneficiaries of local investments
limited involvement of territorial stakeholders and citizens
use of unsuitable (no place-based) expenditure monitoring system
lack of well suited territorial assessment tools and other EU instruments
transform Italian localisms into European typologies of geographical diversity towards Green Economy is the PRIN final ambitious (III year) developing a Geography of Cohesion useful to policy/decision makers, stakeholders, practioners, civil servantes, citizens

Special thanks to Maria, Angela and MicheleMaria Prezioso PRIN Principal Investigator (and Unit 1), University of Rome ”Tor Vergata”
www.princoesione.uniroma2.it
Prin 2015 – Rome, 11-12 April 2019