international construction cost survey 2010–11 · material and labour costs and market conditions...
TRANSCRIPT

International Construction
Cost Survey 2010–11
A year of stability
making the difference

1making the difference
Introduction 2
Country Overviews
Australia 8
Canada 10
China 12
Dubai and Abu Dhabi 14
Germany 16
India 18
Ireland 20
Malaysia 22
The Netherlands 24
Russia 26
Singapore 28
South Africa 30
South Korea 32
UK 34
US 36
Vietnam 38
Contributors 40
Comparative values are based on exchange rates at 20 November 2010
© Turner & Townsend plc 2011
Contents
2
International Construction Cost Survey 2010–11
Welcome to the Turner & Townsend International Construction Cost Survey.
Here you can find and compare construction, material and labour costs and market conditions across many of the countries in which we operate.
The cost data presented here has been prepared by our own professionals working in the construction sector around the world, based on their experience with the many exciting projects we undertake.
If you have any feedback on this survey or would like any further information, please contact: [email protected] For further information on our services, please visit www.turnerandtownsend.com, or contact your nearest office.
What has happened since the last survey?
The advanced economies, including Europe and the US, have gradually improved since the Global Financial Crisis (GFC) in early 2009. However, with persistently high unemployment, weak growth and weak housing markets, the process is slow and steady. Financial constraints are gradually easing but a residual nervousness by financial institutions towards property and private construction is hampering private development. Furthermore, a weakness in demand for private construction in the housing and commercial sectors is keeping construction generally weak.
In contrast, the emerging economies of Asia are still growing strongly. China is now the world’s second largest economy, and dangers of overheating, inflation and strong wage growth are forcing the Chinese Government to engineer a moderate slowdown. Between these extremes Australia and South Africa and the other Asian economies (outside Japan) are reaping the benefits of strong Chinese demand for resources and services. Despite their weak construction markets, for those countries closely tied to China investment in engineering and resources is increasing. In Japan a period of reconstruction following the Sendai earthquake will soon be underway.
Similarly, the Middle East is renewing its growth path, and once again investing in oil and gas projects. Despite some political unrest Middle East construction levels have been growing.
These are the dynamics which have driven construction costs during 2010 and will continue during 2011. Construction costs remain stable in developed countries with insufficient volume in the construction markets to drive substantial price growth and tender conditions remaining highly competitive. Emerging economies are experiencing wage rises, but coming off a low base. Higher levels of inflation in emerging economies are also a problem but not enough so far to cause construction costs to increase significantly.
Introduction
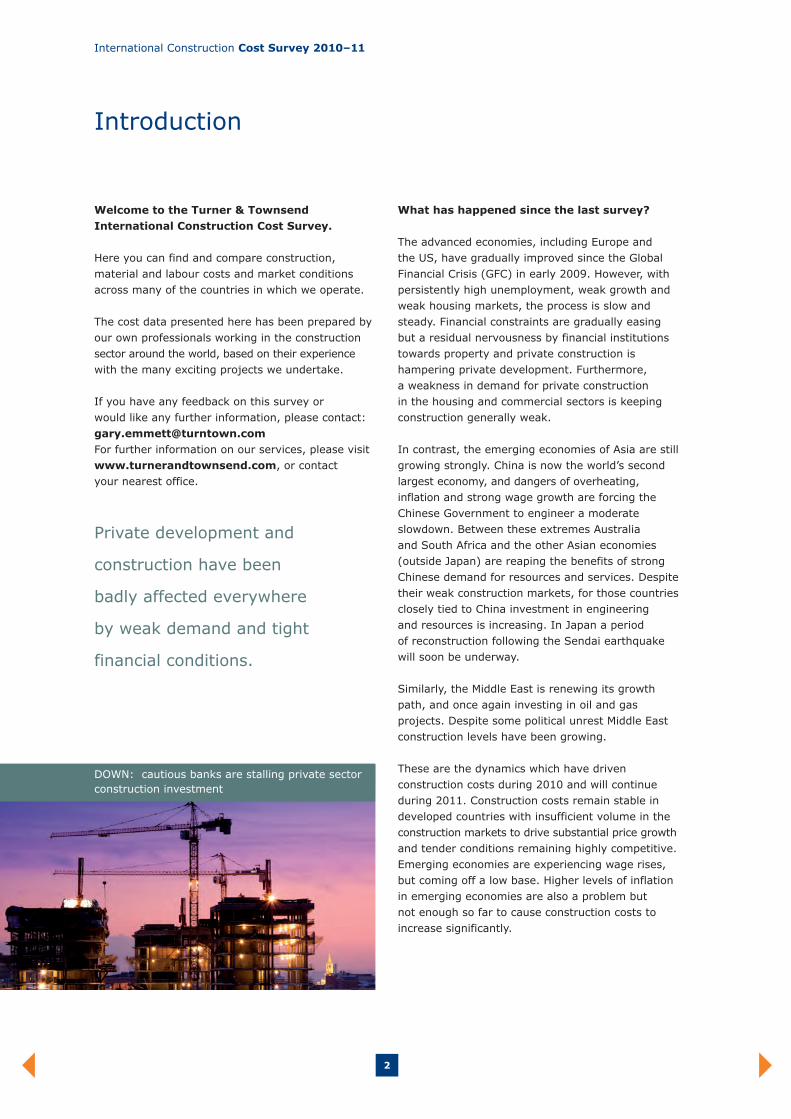
Private development and
construction have been
badly affected everywhere
by weak demand and tight
financial conditions.
DOWN: cautious banks are stalling private sector construction investment

3making the difference
Private sector stagnation
Private development and construction have been badly affected everywhere. For many private markets the booming prices and valuations of 2007–08 have been replaced by weak rents and prices, weak demand and oversupply. Banks retain their tight lending criteria so that only projects with guaranteed pre-sales or committed blue-chip tenants are approved in these financially constrained times.
Tighter margins
Construction costs have stayed static or even fallen during 2010 in most regions. The reason is simple. In contrast to the debt-fuelled global construction boom earlier in the decade, there are now fewer construction projects. Competition for work drives down margins and so prices fall.
Job losses
A decline in workload has resulted in some construction companies reducing their workforces, and the number of jobs in the industry has fallen as a consequence. The construction sector has always been a transient industry, with many workers moving in and out of employment with the booms and busts of the construction cycles. But during downturn contractors keep the better workers, so productivity rises, construction project durations fall and costs are reduced. There are actually some benefits to the industry and to investors in a downturn.
Housing sector decline
The household sector has been badly affected in one way or another. Some countries have suffered a rise in unemployment. Others have seen wealth destroying falls in house values. Some have experienced pay cuts and higher taxes. A few have experienced all of the above. In this environment it is natural that people slow their spending, reduce their credit and get their debt levels down. Until European and US consumers start spending more freely, their economies will hardly grow. The type of construction that depends on high consumption – such as shopping centres, resort hotels and condominiums – is therefore likely to stagnate until consumption rises again.
Construction costs stayed static
or even fell during 2010 in most
regions. The reason is simple.
Competition for work drives
down margins and so prices fall.
DOWN: fewer jobs; UP: higher productivity
UP: public sector investment in infrastructure
4
International Construction Cost Survey 2010–11
Public sector stimulus
Meanwhile, construction will continue to be led by the public sector in many countries. This means construction of hospitals, schools and roads, where public budgets can afford it. It is ironic that a downturn creates an opportunity for these projects to be built, but when every other sector is strong, the cost becomes prohibitive. In many cases, public funding has started to decrease, as governments become increasingly nervous about the size of public debt. Recently, stimulus packages have been winding down as many governments saddled with high public welfare costs have turned their attention to a search for cutbacks, including cancelling publicly funded construction projects. This scenario is evident in the US and many European economies.
The China effect
However, this trend has not occurred everywhere. The most notable exceptions have been those regions whose economies are tied to China. Although badly affected by the fall in export earnings to Europe and the US, China’s own stimulus package has maintained its internal development momentum. High speed rail, smart electricity networks, road construction, nuclear power stations and many other huge infrastructure projects make China the world’s most dynamic region at present. Countries that are supplying China are making the quickest recovery. Projects cancelled during the downturn are being resurrected. Commodity prices have recovered swiftly and resources and engineering projects are picking up strongly. The big beneficiaries of this are Brazil, Russia, India, the Middle East, West Africa and Australia for energy and resources. Much of the engineering construction for these resources projects is being carried out by Korea, Japan, Singapore and India. Large US and European engineering companies also benefit from the global scale of the expertise and resources that projects of this size demand.
Commodities
Because the prices of oil and commodities have recovered since 2009, some building material costs are under upward pressure again. Very high steel prices during 2008 added substantially to construction costs, but in early 2009 the cost of steel fell sharply. During 2010 steel prices increased again, rising strongly at year end, but not to 2008 levels. Copper prices are pushing towards record levels and this will add to the costs of electrical and plumbing trades in 2011. Higher water and electricity costs have threatened to force an increase in concrete prices, but this has so far been counterbalanced by fierce competition in the market, keeping concrete prices relatively stable. The price of oil has recently increased and this will increase some plant operating costs and delivery charges.
Expected trends
With lower construction volumes in many of the advanced economies, their construction markets will remain highly competitive for another few years. The US and European economies will gradually rejuvenate and recover. Financial markets have short memories, and eventually there will be a recovery in financial institutions’ appetite for property construction. Most countries are experiencing only moderate increases in construction costs at present (see chart opposite). The exceptions are India, Russia and Vietnam. High cost escalation usually occurs in those economies where work volumes are growing strongly, and a shortage of competitive bids allows contractors to increase their margins. In some of the low wage economies strong increases in wages are now occurring. Looking further ahead, the Chinese economy will eventually slow down, which could affect growth in the economies of those countries with strong economic ties to China.
Most countries are expecting
only moderate increases in
construction costs at present.

5making the difference
Cost Index – High Rise Apartments
Cost Index 2008=100
2008 2009 2010
Australia 100 96 94
Canada 100 95 94
China 100 78 80
Dubai and Abu Dhabi 100 94 89
Germany 100 101 101
India 100 111 121
Ireland 100 92 85
Malaysia 100 98 111
The Netherlands 100 104 108
Russia 100 105 98
Singapore 100 74 79
South Africa 100 107 107
South Korea 100 99 99
UK 100 98 98
US 100 99 97
Vietnam 100 117 125
Cost Index – CBD Offices
Cost Index 2008=100
2008 2009 2010
Australia 100 96 96
Canada 100 96 95
China 100 82 84
Dubai and Abu Dhabi 100 96 92
Germany 100 101 101
India 100 125 125
Ireland 100 78 72
Malaysia 100 97 101
The Netherlands 100 104 108
Russia 100 105 99
Singapore 100 83 83
South Africa 100 106 106
South Korea 100 99 99
UK 100 91 91
US 100 97 94
Vietnam 100 117 125
The above two charts show construction costs indexed to 2008=100 for each region in the survey. The indices are based on nominal costs in $/m2 in the currency of the country. The indices shows the increase or fall from mid-year to mid-year. The data indicates that in most regions construction costs have fallen since 2008 although the changes from mid 2009 to mid 2010 were smaller. Construction cost changes are likely to vary between different building types depending on the type of construction.
0.0% 2.0% 4.0% 6.0% 8.0% 10.0%
Estimated Cost Escalation mid 2010–mid 2011
AustraliaCanada
ChinaDubai and Abu Dhabi
Germany
The Netherlands
IndiaIreland
Malaysia
RussiaSingapore
South AfricaSouth Korea
UKUS
Vietnam

6
International Construction Cost Survey 2010–11
Key Economic Indicators
Country/Region City
Inflation %
Unemployment %
GDP Actual 2010 (IMF) %
GDP Forecast 2011 (IMF) %
GDP Forecast 2012 (IMF) %
Australia 2.8 5.0 3.0 3.5 3.2
Canada 2.2 7.8 2.9 2.3 2.7
China 4.9 4.2 10.3 9.6 9.5
Dubai and Abu Dhabi
2.0 4.9 2.4 3.2 4.1
Germany 2.0 7.4 3.6 2.2 2.0
India 9.3 9.4 9.7 8.4 8.0
Ireland 2.2 14.6 -0.3 2.3 3.5
Malaysia 2.4 3.2 6.7 5.3 5.5
The Netherlands 1.9 5.1 1.8 1.7 1.9
Russia 9.5 7.4 3.7 4.5 4.4
Singapore 2.8 2.2 15.0 4.5 4.0
South Africa 4.5 26.4 2.8 3.4 3.8
South Korea 3.0 4.0 6.1 4.5 4.0
UK 4.3 7.9 1.7 2.0 2.3
US 2.1 8.9 2.8 3.0 2.7
Vietnam 11.8 3.5 6.5 6.8 7.5
Cold Lukewarm Warm Hot Overheating
Ireland Australia Canada South Africa
Malaysia Dubai and China Vietnam
UK Abu Dhabi Germany
India The Netherlands
Russia
Singapore
South Korea
US
Cooler Staying The Same Warmer
Ireland Australia China
Canada Germany
Dubai and Abu Dhabi India
Singapore Malaysia
South Africa The Netherlands
South Korea Russia
UK Vietnam
US
The information from which this survey is compiled has been provided by Turner & Townsend professionals based in 16 countries or regions.
Our respondents have also provided their views on current and anticipated market conditions in their countries or regions.
How would you describe current market tendering conditions?
Is the construction market getting warmer, cooler or staying the same?

7making the difference
Typical Preliminaries as a percentage of total costs
0.0% 2.0% 4.0% 6.0% 8.0% 10.0% 12.0% 14.0% 16.0% 18.0% 20.0%
Australia
Canada
China
Dubai and Abu Dhabi
Germany
The Netherlands
India
Ireland
Malaysia
Russia
Singapore
South Africa
South Korea
UK
US
Vietnam
Contractor’s margin has been squeezed in those countries where work volumes have fallen and contractors have to compete more vigorously. With fewer jobs contractors will often submit very competitive prices just to keep work flowing. Often sub-contractor prices may be equally competitive allowing head contractors to claw back some lost margin during the job.
Preliminaries include job set-up costs, such as scaffolding, approvals, insurances, power and water, cleaning and handover, and work supervision. Typically, higher cost countries have higher preliminaries. In many countries costs of power and water are increasing. Also regulatory compliance adds further preliminary costs.
Typical Contractor’s Margin on medium commercial job (5000m2 GFA)
0.0% 2.0% 4.0% 6.0% 8.0% 10.0% 12.0% 14.0% 16.0%
Australia
Canada
China
Dubai and Abu Dhabi
Germany
The Netherlands
India
Ireland
Malaysia
Russia
Singapore
South Africa
South Korea
UK
US
Vietnam

8
International Construction Cost Survey 2010–11
AustraliaIn contrast to other developed economies, Australia has experienced a relatively mild downturn. Construction costs are generally stable because the private construction sector is weak. The Government introduced a large stimulus package in 2009 which included school buildings, public housing and infrastructure. This has successfully prevented large increases in construction unemployment. Healthy commodity export earnings and a solid pipeline of resources projects will underpin strong GDP growth in 2011 despite the prolonged weakness in commercial and residential construction. Earnings for the iron ore and coal sector are very strong, and some very large gas export projects are moving towards construction in Queensland and Western Australia.
Country Overviews
Australia – International Building Costs per m2 of internal area
2008 2009 mid 2010 mid 2010 AUD AUD AUD USD
Residential
Individual detached house medium standard 1,518 1,445 1,445 1,417Individual detached house prestige 2,250 2,150 2,100 2,059Townhouses medium standard 1,715 1,640 1,650 1,618Apartments private medium density 2,050 1,950 1,900 1,863Apartments high rise 2,500 2,400 2,350 2,304Aged care/affordable units 2,400 2,300 2,260 2,216
Commercial
Offices – business park 1,895 1,820 1,820 1,784CBD Offices – up to 20 floors medium 3,000 2,880 2,880 2,824CBD Offices – prestige 3,360 3,200 3,200 3,137
Warehouses
Warehouse/factory units – basic 830 750 760 745Large warehouse distribution centre 640 590 600 588High-tech factory/laboratory 1,540 1,500 1,500 1,471
Retail
Large shopping centre including mall 2,200 2,150 2,150 2,108Neighbourhood including supermarket 1,810 1,750 1,750 1,716Prestige car showroom 4,400 4,200 4,200 4,118
Hotels
Three star travellers 2,840 2,800 3,247 3,183Five star luxury 3,850 3,750 3,750 3,676Resort style 4,185 4,000 4,000 3,922
Hospitals
Day centre 2,900 2,900 2,900 2,843Regional hospital 3,300 3,270 3,270 3,206General hospital 5,500 5,300 5,134 5,033
Schools
Primary and secondary 1,985 1,900 1,900 1,863University 3,130 3,050 3,050 2,990
Carparks
Multi-storey above ground 850 832 800 784Multi-storey below ground 1,250 1,235 1,173 1,150
Airports
Airport terminal 8,000 7,000 6,500 6,373

9making the difference
Australia – Costs of Labour (including overheads)
2010 2010 AUD USD
Group 1 Tradesman – eg, plumber, electrician 65 64Group 2 Tradesman – eg, carpenter, bricklayer 55 54Group 3 Tradesman – eg, carpet layer, tiler, plasterer 53 52General labourer 37 36Site foreman 53 52
Australia – Costs of Materials
Concrete 30 mpa (m3) (1,500m3 job) 186 182Reinforcement bar 16mm (tonne) (120 tonne job) 2,422 2,375Concrete block (400 x 200) per 1,000 (>10,000 block job) 3,360 3,294Standard brick per 1,000 541 530Structural steel beams (tonne) (>100 tonne job) 2,955 2,897Glass pane 6mm (m2) 47 46Softwood timber for framing 100mm x 50mm (m) 29 2813mm Plasterboard (m2) 39 38Emulsion paint (litre) 15 15Copper pipe 15mm (m) (>1,000m job) 12 12Copper cable (m) (3C + E, 2.5mm PVC) (>100,000m job) 5 5
Australia – Key Trades (excluding preliminaries and builders’ margins)
Excavate basement (m3) (1,800m3 job) 29 28Excavate footings (m) 71 70Concrete in slab (m3) (1,500m3 job) 256 251Reinforcement in beams (tonne) 2,442 2,394Formwork to soffit of slab (m2) 120 118Blockwork in wall (m2) (10,000 block job) 131 128Structural steel beams (tonne) 6,298 6,175Pre-cast concrete wall (m2) 299 293Curtain wall glazing incl support system (m2) (1,000m2 job) 1,051 1,030Plasterboard 13mm thick to stud wall (m2) (3,000m2 job) 30 29Single solid core door incl frame and hardware (no) (50 door job) 765 750Painting to walls primer + 2 coats (m2) 15 15Ceramic tiling (m2) (1,000m2 job) 109 107Vinyl flooring to wet areas (m2) (500m2 job) 71 70Carpet medium tufted (m2) (4,500m2 job) 80 78Lighting installation (m2) (>5,000m2 job) 81 79Copper pipe 15mm to wall (m) (>1,000m job) 60 59Fire sprinklers (per m2) (5,000m2 job) 46 45Air conditioning incl main plant (m2) (>5,000m2 job) 300 294
Australia – Major Projects
AUD
Curtis Island LNG Project 7.7 billionBarangaroo Development Project 6 billionWest Pilbara Iron Ore Project 5.7 billionGorgon LNG Project 40 billionWiggins Island Coal Terminal 4 billion
10
International Construction Cost Survey 2010–11
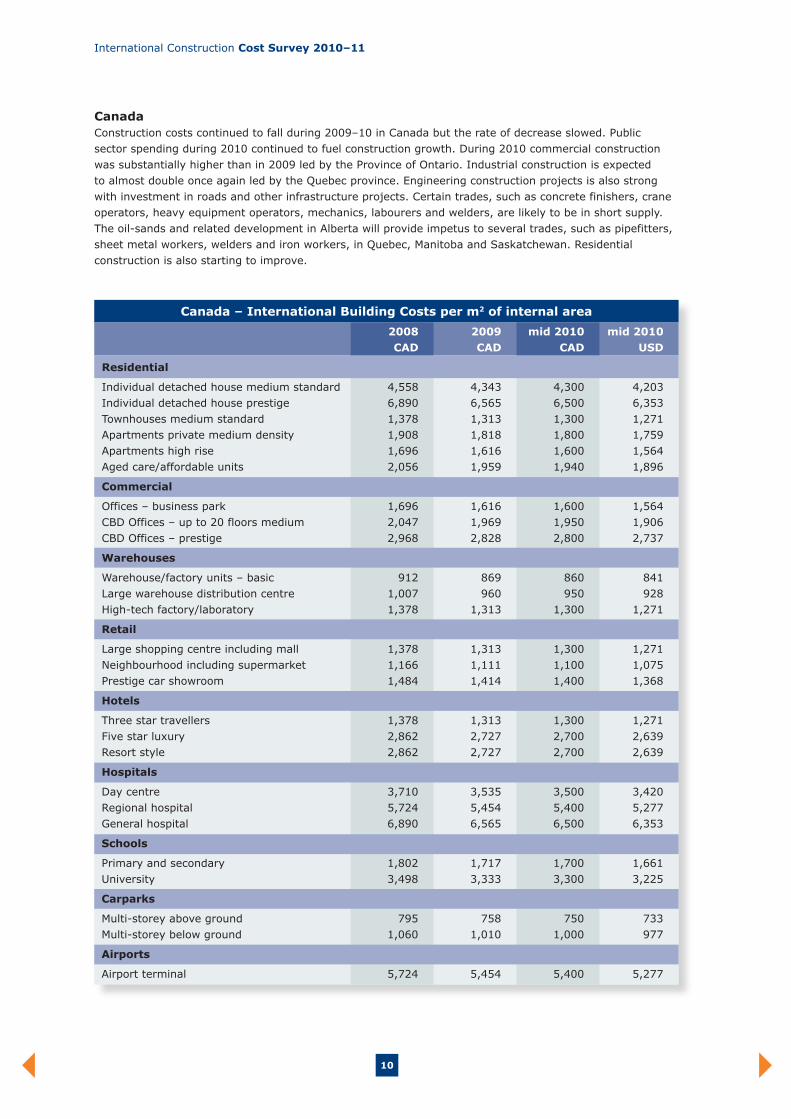
CanadaConstruction costs continued to fall during 2009–10 in Canada but the rate of decrease slowed. Public sector spending during 2010 continued to fuel construction growth. During 2010 commercial construction was substantially higher than in 2009 led by the Province of Ontario. Industrial construction is expected to almost double once again led by the Quebec province. Engineering construction projects is also strong with investment in roads and other infrastructure projects. Certain trades, such as concrete finishers, crane operators, heavy equipment operators, mechanics, labourers and welders, are likely to be in short supply. The oil-sands and related development in Alberta will provide impetus to several trades, such as pipefitters, sheet metal workers, welders and iron workers, in Quebec, Manitoba and Saskatchewan. Residential construction is also starting to improve.
Canada – International Building Costs per m2 of internal area
2008 2009 mid 2010 mid 2010 CAD CAD CAD USD
Residential
Individual detached house medium standard 4,558 4,343 4,300 4,203Individual detached house prestige 6,890 6,565 6,500 6,353Townhouses medium standard 1,378 1,313 1,300 1,271Apartments private medium density 1,908 1,818 1,800 1,759Apartments high rise 1,696 1,616 1,600 1,564Aged care/affordable units 2,056 1,959 1,940 1,896
Commercial
Offices – business park 1,696 1,616 1,600 1,564CBD Offices – up to 20 floors medium 2,047 1,969 1,950 1,906CBD Offices – prestige 2,968 2,828 2,800 2,737
Warehouses
Warehouse/factory units – basic 912 869 860 841Large warehouse distribution centre 1,007 960 950 928High-tech factory/laboratory 1,378 1,313 1,300 1,271
Retail
Large shopping centre including mall 1,378 1,313 1,300 1,271Neighbourhood including supermarket 1,166 1,111 1,100 1,075Prestige car showroom 1,484 1,414 1,400 1,368
Hotels
Three star travellers 1,378 1,313 1,300 1,271Five star luxury 2,862 2,727 2,700 2,639Resort style 2,862 2,727 2,700 2,639
Hospitals
Day centre 3,710 3,535 3,500 3,420Regional hospital 5,724 5,454 5,400 5,277General hospital 6,890 6,565 6,500 6,353
Schools
Primary and secondary 1,802 1,717 1,700 1,661University 3,498 3,333 3,300 3,225
Carparks
Multi-storey above ground 795 758 750 733Multi-storey below ground 1,060 1,010 1,000 977
Airports
Airport terminal 5,724 5,454 5,400 5,277

11making the difference
Canada – Major Projects
CAD
Union Station Rehabilitation 500 millionOttawa Light Rail Transit Project 2 billionMetrolinx Project 9 billionHalton Region Hospital 950 millionHumber River Hospital 1 billion
Canada – Costs of Labour (including overheads)
2010 2010 CAD USD
Group 1 Tradesman – eg, plumber, electrician 60 59Group 2 Tradesman – eg, carpenter, bricklayer 55 54Group 3 Tradesman – eg, carpet layer, tiler, plasterer 50 49General labourer 45 44Site foreman 75 73
Canada – Costs of Materials
Concrete 30 mpa (m3) (1,500m3 job) 150 147Reinforcement bar 16mm (tonne) (120 tonne job) 1,200 1,173Concrete block (400 x 200) per 1,000 (>10,000 block job) 700 684Standard brick per 1,000 900 880Structural steel beams (tonne) (>100 tonne job) 2,000 1,955Glass pane 6mm (m2) 165 161Softwood timber for framing 100mm x 50mm (m) 25 2413mm Plasterboard (m2) 10 10Emulsion paint (litre) 10 10Copper pipe 15mm (m) (>1,000m job) 6 6Copper cable (m) (3C + E, 2.5mm PVC) (>100,000m job) 4 4
Canada – Key Trades (excluding preliminaries and builders’ margins)
Excavate basement (m3) (1,800m3 job) 15 15Excavate footings (m) 20 20Concrete in slab (m3) (1,500m3 job) 190 186Reinforcement in beams (tonne) 1,800 1,760Formwork to soffit of slab (m2) 140 137Blockwork in wall (m2) (10,000 block job) 120 117Structural steel beams (tonne) 3,000 2,933Pre-cast concrete wall (m2) 300 293Curtain wall glazing incl support system (m2) (1,000m2 job) 900 880Plasterboard 13mm thick to stud wall (m2) (3,000m2 job) 25 24Single solid core door incl frame and hardware (no) (50 door job) 1,500 1,466Painting to walls primer + 2 coats (m2) 8 8Ceramic tiling (m2) (1,000m2 job) 85 83Vinyl flooring to wet areas (m2) (500m2 job) 60 59Carpet medium tufted (m2) (4,500m2 job) 55 54Lighting installation (m2) (>5,000m2 job) 50 49Copper pipe 15mm to wall (m) (>1,000m job) 65 64Fire sprinklers (per m2) (5,000m2 job) 35 34Air conditioning incl main plant (m2) (>5,000m2 job) 310 303

12
International Construction Cost Survey 2010–11
ChinaDespite the price decreases for basic building materials, inflation for the next 12 months is expected to rise four to six percent following the announcement of a minimum labour wage standard in June 2010. The minimum wage standard rose approximately ten percent in major cities. Construction expenditures in China are expected to rise 9.1 percent per annum in real terms through to 2014. Increases will be bolstered by a growing domestic economy, ongoing industrialisation, rebounding foreign investment funding, continuing efforts to expand and upgrade physical infrastructure, rising income levels, and further population and household growth.
China – International Building Costs per m2 of internal area
2008 2009 mid 2010 mid 2010 CNY CNY CNY USD
Residential
Individual detached house medium standard 5,800 4,400 4,480 661Individual detached house prestige 6,500 5,100 5,170 763Townhouses medium standard 4,800 4,000 4,050 598Apartments private medium density 4,500 3,200 3,290 486Apartments high rise 5,000 3,900 3,980 588Aged care/affordable units 3,700 2,600 2,670 395
Commercial
Offices – business park 5,500 4,400 4,500 664CBD Offices – up to 20 floors medium 8,400 6,900 7,090 1,047CBD Offices – prestige 10,500 8,900 9,140 1,349
Warehouses
Warehouse/factory units – basic 3,000 2,300 2,360 348Large warehouse distribution centre 3,300 2,700 2,780 410High-tech factory/laboratory 6,100 5,300 5,450 805
Retail
Large shopping centre including mall 7,500 5,900 6,080 898Neighbourhood including supermarket 5,100 4,000 4,120 608Prestige car showroom 3,900 3,400 3,500 517
Hotels
Three star travellers 6,800 5,500 5,660 836Five star luxury 11,300 10,000 10,300 1,521Resort style 9,100 8,300 8,550 1,262
Hospitals
Day centre 4,500 4,200 4,320 638Regional hospital 5,500 5,100 5,250 775General hospital 6,100 5,700 5,870 867
Schools
Primary and secondary 3,800 3,500 3,610 533University 5,700 5,200 5,350 790
Carparks
Multi-storey above ground 2,200 2,000 2,080 307Multi-storey below ground 5,300 4,500 4,640 685
Airports
Airport terminal 11,500 10,300 10,600 1,565

13making the difference
China – Major Projects
USD
Guang Niu South to North Water Transfer 62 billionShanghai Tower 1.2 billionPing’an International Finance Centre 1.2 billionPuhuangyu Expressway 740 millionFushi Expressway 532 million
China – Costs of Labour (including overheads)
2010 2010 CNY USD
Group 1 Tradesman – eg, plumber, electrician 19 3Group 2 Tradesman – eg, carpenter, bricklayer 18 3Group 3 Tradesman – eg, carpet layer, tiler, plasterer 17 3General labourer 11 2Site foreman 31 5
China – Costs of Materials
Concrete 30 mpa (m3) (1,500m3 job) 370 55Reinforcement bar 16mm (tonne) (120 tonne job) 3,400 502Concrete block (400 x 200) per 1,000 (>10,000 block job) 18 3Standard brick per 1,000 365 54Structural steel beams (tonne) (>100 tonne job) 7,400 1,093Glass pane 6mm (m2) 460 68Softwood timber for framing 100mm x 50mm (m) 53 813mm Plasterboard (m2) 32 5Emulsion paint (litre) 60 9Copper pipe 15mm (m) (>1,000m job) 64 9Copper cable (m) (3C + E, 2.5mm PVC) (>100,000m job) 15 2
China – Key Trades (excluding preliminaries and builders’ margins)
Excavate basement (m3) (1,800m3 job) 10 1Excavate footings (m) 34 5Concrete in slab (m3) (1,500m3 job) 420 62Reinforcement in beams (tonne) 5,200 768Formwork to soffit of slab (m2) 90 13Blockwork in wall (m2) (10,000 block job) 150 22Structural steel beams (tonne) 9,000 1,329Pre-cast concrete wall (m2) 155 23Curtain wall glazing incl support system (m2) (1,000m2 job) 1,600 236Plasterboard 13mm thick to stud wall (m2) (3,000m2 job) 130 19Single solid core door incl frame and hardware (no) (50 door job) 2,200 325Painting to walls primer + 2 coats (m2) 42 6Ceramic tiling (m2) (1,000m2 job) 180 27Vinyl flooring to wet areas (m2) (500m2 job) 385 57Carpet medium tufted (m2) (4,500m2 job) 390 58Lighting installation (m2) (>5,000m2 job) 660 97Copper pipe 15mm to wall (m) (>1,000m job) 82 12Fire sprinklers (per m2) (5,000m2 job) 210 31Air conditioning incl main plant (m2) (>5,000m2 job) 490 72

14
International Construction Cost Survey 2010–11
Dubai and Abu Dhabi With Dubai particularly impacted by the global downturn, much of the focus for construction within the UAE has turned to Abu Dhabi. Construction costs are now well down from the levels experienced in 2008 when the construction sector was booming. However, a stronger oil price and high projected levels of export demand for gas are providing an incentive for new energy infrastructure projects. Whilst Dubai experienced weaker construction conditions in 2010 after a period of over construction, the sector is slowly starting to recover. However, prospects in Abu Dhabi are much more positive. A number of new projects focusing on government, leisure, residential and tourism are underway or in the planning stage.
Dubai and Abu Dhabi – International Building Costs per m2 of internal area
2008 2009 mid 2010 mid 2010 AED AED AED USD
Residential
Individual detached house medium standard 7,500 7,000 6,500 1,770Individual detached house prestige 9,500 9,250 9,000 2,450Townhouses medium standard 7,500 6,525 5,550 1,511Apartments private medium density 7,000 6,500 6,000 1,634Apartments high rise 9,000 8,500 8,000 2,178Aged care/affordable units 5,720 5,340 4,960 1,350
Commercial
Offices – business park 5,300 4,800 4,550 1,239CBD Offices – up to 20 floors medium 6,000 5,750 5,500 1,498CBD Offices – prestige 8,000 7,500 7,000 1,906
Warehouses
Warehouse/factory units – basic 6,000 5,250 4,500 1,225Large warehouse distribution centre 5,500 4,750 4,000 1,089High-tech factory/laboratory 7,625 6,875 6,125 1,667
Retail
Large shopping centre including mall 8,000 7,500 7,000 1,906Neighbourhood including supermarket 8,500 8,000 7,500 2,042Prestige car showroom 10,200 9,600 9,000 2,450
Hotels
Three star travellers 10,000 9,750 9,500 2,586Five star luxury 13,000 12,750 12,500 3,403Resort style 15,000 15,000 15,000 4,084
Hospitals
Day centre 7,000 6,500 6,000 1,634Regional hospital 8,500 8,000 7,500 2,042General hospital 9,000 8,500 8,000 2,178
Schools
Primary and secondary 7,000 6,500 6,000 1,634University 7,800 7,300 6,800 1,851
Carparks
Multi-storey above ground 3,500 3,500 3,500 953Multi-storey below ground 4,500 4,500 4,500 1,225
Airports
Airport terminal 8,000 7,500 7,000 1,906
15making the difference
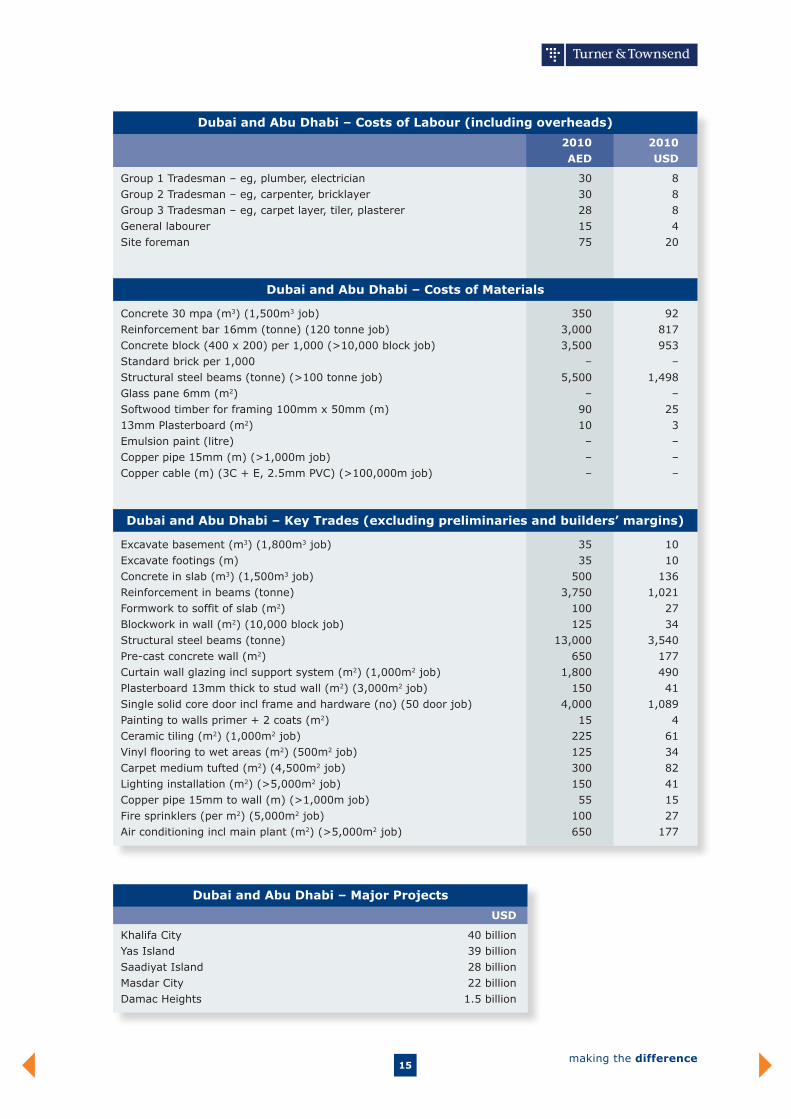
Dubai and Abu Dhabi – Major Projects
USD
Khalifa City 40 billionYas Island 39 billionSaadiyat Island 28 billionMasdar City 22 billionDamac Heights 1.5 billion
Dubai and Abu Dhabi – Costs of Labour (including overheads)
2010 2010 AED USD
Group 1 Tradesman – eg, plumber, electrician 30 8Group 2 Tradesman – eg, carpenter, bricklayer 30 8Group 3 Tradesman – eg, carpet layer, tiler, plasterer 28 8General labourer 15 4Site foreman 75 20
Dubai and Abu Dhabi – Costs of Materials
Concrete 30 mpa (m3) (1,500m3 job) 350 92Reinforcement bar 16mm (tonne) (120 tonne job) 3,000 817Concrete block (400 x 200) per 1,000 (>10,000 block job) 3,500 953Standard brick per 1,000 – –Structural steel beams (tonne) (>100 tonne job) 5,500 1,498Glass pane 6mm (m2) – –Softwood timber for framing 100mm x 50mm (m) 90 2513mm Plasterboard (m2) 10 3Emulsion paint (litre) – –Copper pipe 15mm (m) (>1,000m job) – –Copper cable (m) (3C + E, 2.5mm PVC) (>100,000m job) – –
Dubai and Abu Dhabi – Key Trades (excluding preliminaries and builders’ margins)
Excavate basement (m3) (1,800m3 job) 35 10Excavate footings (m) 35 10Concrete in slab (m3) (1,500m3 job) 500 136Reinforcement in beams (tonne) 3,750 1,021Formwork to soffit of slab (m2) 100 27Blockwork in wall (m2) (10,000 block job) 125 34Structural steel beams (tonne) 13,000 3,540Pre-cast concrete wall (m2) 650 177Curtain wall glazing incl support system (m2) (1,000m2 job) 1,800 490Plasterboard 13mm thick to stud wall (m2) (3,000m2 job) 150 41Single solid core door incl frame and hardware (no) (50 door job) 4,000 1,089Painting to walls primer + 2 coats (m2) 15 4Ceramic tiling (m2) (1,000m2 job) 225 61Vinyl flooring to wet areas (m2) (500m2 job) 125 34Carpet medium tufted (m2) (4,500m2 job) 300 82Lighting installation (m2) (>5,000m2 job) 150 41Copper pipe 15mm to wall (m) (>1,000m job) 55 15Fire sprinklers (per m2) (5,000m2 job) 100 27Air conditioning incl main plant (m2) (>5,000m2 job) 650 177

16
International Construction Cost Survey 2010–11
Germany After a turbulent 2009, with declining prices and inadequate demand, 2010 saw a gradual turnaround as Germany became the standout economy of Europe. Forecasts for 2011 indicate that Germany will continue to lead the economic recovery of Europe despite the Euro crisis. Currently, the German Government is maintaining a tight fiscal policy in order to keep down expenses as much as possible. However, some new public sector building projects are underway or moving to construction. Recent GDP growth figures for Germany are promising.
Germany – International Building Costs per m2 of internal area
2008 2009 mid 2010 mid 2010 EUR EUR EUR USD
Residential
Individual detached house medium standard 820 830 833 1,141Individual detached house prestige 1,160 1,170 1,174 1,609Townhouses medium standard 1,740 1,760 1,766 2,420Apartments private medium density 670 680 682 935Apartments high rise 640 645 647 887Aged care/affordable units 660 670 672 921
Commercial
Offices – business park 1,130 1,140 1,144 1,567CBD Offices – up to 20 floors medium 1,130 1,140 1,144 1,567CBD Offices – prestige 1,620 1,640 1,646 2,254
Warehouses
Warehouse/factory units – basic 340 345 345 473Large warehouse distribution centre 320 325 325 445High-tech factory/laboratory 1,560 1,575 1,575 2,158
Retail
Large shopping centre including mall 895 900 903 1,237Neighbourhood including supermarket 895 900 903 1,237Prestige car showroom 870 880 883 1,210
Hotels
Three star travellers 1,210 1,220 1,224 1,677Five star luxury 2,652 2,662 2,666 3,652Resort style 1,718 1,728 1,732 2,373
Hospitals
Day centre 1,350 1,365 1,370 1,876Regional hospital 2,160 2,180 2,188 2,997General hospital 2,350 2,375 2,383 3,265
Schools
Primary and secondary 1,170 1,180 1,184 1,622University 1,370 1,385 1,390 1,904
Carparks
Multi-storey above ground 130 135 135 186Multi-storey below ground 370 375 376 515
Airports
Airport terminal 1,080 1,090 1,094 1,498

17making the difference
Germany – Major Projects
USD
Elbphilharmonie 413 millionStuttgart 21 5.2 billionGasunie Pipeline Project 1.2 billionAirport Berlin BBI 3.1 billionStuttgart to Munich A8 Motorway Extension 16.6 million
Germany – Costs of Labour (including overheads)
2010 2010 EUR USD
Group 1 Tradesman – eg, plumber, electrician 39 53Group 2 Tradesman – eg, carpenter, bricklayer 36 49Group 3 Tradesman – eg, carpet layer, tiler, plasterer 35 48General labourer 24 33Site foreman 40 55
Germany – Costs of Materials
Concrete 30 mpa (m3) (1,500m3 job) 118 162Reinforcement bar 16mm (tonne) (120 tonne job) 1,200 1,645Concrete block (400 x 200) per 1,000 (>10,000 block job) 4,400 6,027Standard brick per 1,000 550 753Structural steel beams (tonne) (>100 tonne job) 2,500 3,430Glass pane 6mm (m2) 53 73Softwood timber for framing 100mm x 50mm (m) 3 413mm Plasterboard (m2) 4 5Emulsion paint (litre) 5 6Copper pipe 15mm (m) (>1,000m job) 9 12Copper cable (m) (3C + E, 2.5mm PVC) (>100,000m job) 4 5
Germany – Key Trades (excluding preliminaries and builders’ margins)
Excavate basement (m3) (1,800m3 job) 13 18Excavate footings (m) 25 34Concrete in slab (m3) (1,500m3 job) 133 182Reinforcement in beams (tonne) 1,800 2,466Formwork to soffit of slab (m2) 35 48Blockwork in wall (m2) (10,000 block job) 63 86Structural steel beams (tonne) 3,020 4,137Pre-cast concrete wall (m2) 90 123Curtain wall glazing incl support system (m2) (1,000m2 job) 435 596Plasterboard 13mm thick to stud wall (m2) (3,000m2 job) 50 68Single solid core door incl frame and hardware (no) (50 door job) 820 1,123Painting to walls primer + 2 coats (m2) 5 7Ceramic tiling (m2) (1,000m2 job) 50 68Vinyl flooring to wet areas (m2) (500m2 job) 33 45Carpet medium tufted (m2) (4,500m2 job) 25 34Lighting installation (m2) (>5,000m2 job) 53 73Copper pipe 15mm to wall (m) (>1,000m job) 28 38Fire sprinklers (per m2) (5,000m2 job) 75 103Air conditioning incl main plant (m2) (>5,000m2 job) 30 41

18
International Construction Cost Survey 2010–11
India GDP growth levels of 9.4 percent indicate that the economy continues to grow strongly, with IT and the services sectors performing well. This year’s monsoon has been intensive, making construction conditions difficult in some regions. The Commonwealth Games in Delhi created numerous construction projects, now complete. The private construction sector is starved of finance at the moment. This is particularly affecting the commercial and residential sectors where falling sales and rent pressures have made it hard for private developers. The Indian Government has been working hard to increase the supply of housing but a severe supply–demand imbalance still remains.
India – International Building Costs per m2 of internal area
2008 2009 mid 2010 mid 2010 INR INR INR USD
Residential
Individual detached house medium standard 14,850 16,500 28,000 611Individual detached house prestige 19,350 21,500 35,000 764Townhouses medium standard 18,000 20,000 22,000 480Apartments private medium density 17,100 19,000 18,000 393Apartments high rise 20,700 23,000 25,000 545Aged care/affordable units 12,600 14,000 16,000 349
Commercial
Offices – business park 21,600 27,000 25,000 546CBD Offices – up to 20 floors medium 18,400 23,000 23,000 502CBD Offices – prestige 20,000 25,000 30,000 655
Warehouses
Warehouse/factory units – basic 27,000 30,000 35,000 764Large warehouse distribution centre 31,500 35,000 37,000 808High-tech factory/laboratory 33,300 37,000 38,000 830
Retail
Large shopping centre including mall 24,300 27,000 35,000 764Neighbourhood including supermarket 20,700 23,000 26,000 568Prestige car showroom 13,500 15,000 16,000 349
Hotels
Three star travellers 32,130 35,700 35,000 764Five star luxury 75,735 84,150 70,000 1,528Resort style 29,835 33,150 38,000 830
Hospitals
Day centre 16,200 18,000 20,000 437Regional hospital 27,000 30,000 35,000 764General hospital 24,300 27,000 25,000 546
Schools
Primary and secondary 9,000 10,000 15,000 327University 22,500 25,000 35,000 764
Carparks
Multi-storey above ground 40,500 45,000 40,000 873Multi-storey below ground 16,200 18,000 25,000 546
Airports
Airport terminal 40,500 45,000 55,000 1,201

19making the difference
India – Major Projects
USD
Nashri Tunnel In Jammu 500 millionVizag Port Expansion 45 millionMetro Rail project (Ongoing) 4.25 billion
India – Costs of Labour (including overheads)
2010 2010 INR USD
Group 1 Tradesman – eg, plumber, electrician 45 1Group 2 Tradesman – eg, carpenter, bricklayer 45 1Group 3 Tradesman – eg, carpet layer, tiler, plasterer 40 1General labourer 35 1Site foreman 80 2
India – Costs of Materials
Concrete 30 mpa (m3) (1,500m3 job) 3,500 76Reinforcement bar 16mm (tonne) (120 tonne job) 35,000 764Concrete block (400 x 200) per 1,000 (>10,000 block job) 20,000 437Standard brick per 1,000 7,000 153Structural steel beams (tonne) (>100 tonne job) 65,000 1,419Glass pane 6mm (m2) 500 11Softwood timber for framing 100mm x 50mm (m) 150 313mm Plasterboard (m2) 250 5Emulsion paint (litre) 300 7Copper pipe 15mm (m) (>1,000m job) 1,400 31Copper cable (m) (3C + E, 2.5mm PVC) (>100,000m job) 2,200 48
India – Key Trades (excluding preliminaries and builders’ margins)
Excavate basement (m3) (1,800m3 job) 900 20Excavate footings (m) 400 9Concrete in slab (m3) (1,500m3 job) 5,500 120Reinforcement in beams (tonne) 55,000 1,201Formwork to soffit of slab (m2) 500 11Blockwork in wall (m2) (10,000 block job) 1,000 22Structural steel beams (tonne) 65,000 1,419Pre-cast concrete wall (m2) 6,000 131Curtain wall glazing incl support system (m2) (1,000m2 job) 7,000 153Plasterboard 13mm thick to stud wall (m2) (3,000m2 job) 3,500 76Single solid core door incl frame and hardware (no) (50 door job) 30,000 655Painting to walls primer + 2 coats (m2) 200 4Ceramic tiling (m2) (1,000m2 job) 2,800 61Vinyl flooring to wet areas (m2) (500m2 job) 1,800 39Carpet medium tufted (m2) (4,500m2 job) 1,500 33Lighting installation (m2) (>5,000m2 job) 2,800 61Copper pipe 15mm to wall (m) (>1,000m job) 1,500 33Fire sprinklers (per m2) (5,000m2 job) 1,200 26Air conditioning incl main plant (m2) (>5,000m2 job) 5,000 109

20
International Construction Cost Survey 2010–11
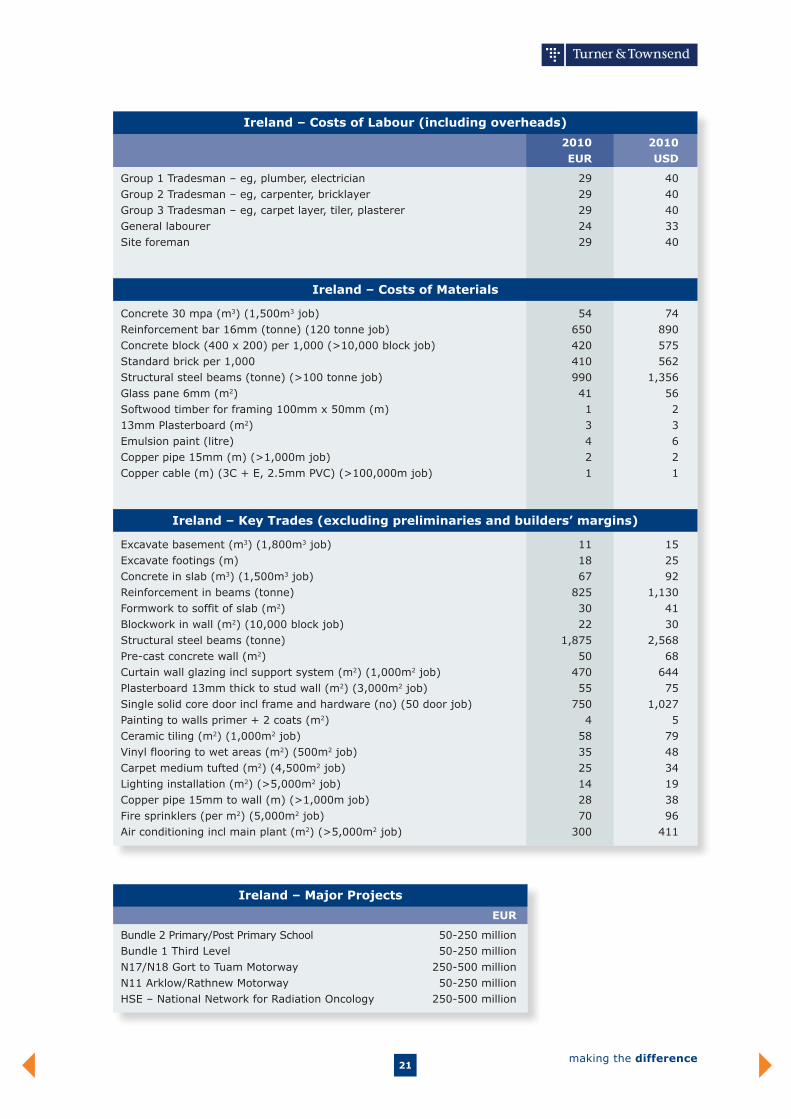
Ireland An acute shortage of new projects is likely in the coming year. Currently, the private sector market is almost stagnant with markets oversupplied. Furthermore, the public sector capital programme has been cut back substantially to ease pressure on the budget. Competition will remain fierce and tender prices will fall further during 2011 as below cost tendering is becoming even more prevalent. This is unsustainable in the long run and may result in some company failures. Overall, there have been no increases in construction labour rates. Material prices are reducing generally, but manufacturers’ costs have risen as a result of smaller production volumes. Furthermore, high energy materials, such as structural steelwork, reinforcement, and copper cabling and piping, have also risen during the year. Further material cost increases will place even greater stress on tendering conditions and margins during the next 12 months.
Ireland – International Building Costs per m2 of internal area
2008 2009 mid 2010 mid 2010 EUR EUR EUR USD
Residential
Individual detached house medium standard 1,500 1,100 1,000 1,370Individual detached house prestige 2,200 1,800 1,700 2,329Townhouses medium standard 1,400 1,080 1,000 1,370Apartments private medium density 1,750 1,500 1,375 1,884Apartments high rise 1,800 1,650 1,525 2,089Aged care/affordable units 2,500 2,000 1,850 2,534
Commercial
Offices – business park 1,750 1,300 1,200 1,644CBD Offices – up to 20 floors medium 2,500 1,950 1,800 2,466CBD Offices – prestige 3,750 2,950 2,725 3,733
Warehouses
Warehouse/factory units – basic 650 550 500 685Large warehouse distribution centre 1,100 975 900 1,233High-tech factory/laboratory 4,000 3,300 3,000 4,110
Retail
Large shopping centre including mall 2,950 2,500 2,300 3,151Neighbourhood including supermarket 2,950 2,200 2,025 2,774Prestige car showroom 3,250 2,900 2,675 3,664
Hotels
Three star travellers 2,000 1,700 1,575 2,158Five star luxury 3,300 3,000 2,775 3,801Resort style 2,450 2,200 2,025 2,774
Hospitals
Day centre 3,000 2,400 2,200 3,014Regional hospital 4,500 3,500 3,225 4,418General hospital 4,500 3,500 3,225 4,418
Schools
Primary and secondary 1,230 1,230 1,125 1,541University 2,500 2,200 2,035 2,788
Carparks
Multi-storey above ground 570 570 525 719Multi-storey below ground 960 960 875 1,199
Airports
Airport terminal 4,300 3,900 3,600 4,932
21making the difference
Ireland – Major Projects
EUR
Bundle 2 Primary/Post Primary School 50-250 millionBundle 1 Third Level 50-250 millionN17/N18 Gort to Tuam Motorway 250-500 millionN11 Arklow/Rathnew Motorway 50-250 millionHSE – National Network for Radiation Oncology 250-500 million
Ireland – Costs of Labour (including overheads)
2010 2010 EUR USD
Group 1 Tradesman – eg, plumber, electrician 29 40Group 2 Tradesman – eg, carpenter, bricklayer 29 40Group 3 Tradesman – eg, carpet layer, tiler, plasterer 29 40General labourer 24 33Site foreman 29 40
Ireland – Costs of Materials
Concrete 30 mpa (m3) (1,500m3 job) 54 74Reinforcement bar 16mm (tonne) (120 tonne job) 650 890Concrete block (400 x 200) per 1,000 (>10,000 block job) 420 575Standard brick per 1,000 410 562Structural steel beams (tonne) (>100 tonne job) 990 1,356Glass pane 6mm (m2) 41 56Softwood timber for framing 100mm x 50mm (m) 1 213mm Plasterboard (m2) 3 3Emulsion paint (litre) 4 6Copper pipe 15mm (m) (>1,000m job) 2 2Copper cable (m) (3C + E, 2.5mm PVC) (>100,000m job) 1 1
Ireland – Key Trades (excluding preliminaries and builders’ margins)
Excavate basement (m3) (1,800m3 job) 11 15Excavate footings (m) 18 25Concrete in slab (m3) (1,500m3 job) 67 92Reinforcement in beams (tonne) 825 1,130Formwork to soffit of slab (m2) 30 41Blockwork in wall (m2) (10,000 block job) 22 30Structural steel beams (tonne) 1,875 2,568Pre-cast concrete wall (m2) 50 68Curtain wall glazing incl support system (m2) (1,000m2 job) 470 644Plasterboard 13mm thick to stud wall (m2) (3,000m2 job) 55 75Single solid core door incl frame and hardware (no) (50 door job) 750 1,027Painting to walls primer + 2 coats (m2) 4 5Ceramic tiling (m2) (1,000m2 job) 58 79Vinyl flooring to wet areas (m2) (500m2 job) 35 48Carpet medium tufted (m2) (4,500m2 job) 25 34Lighting installation (m2) (>5,000m2 job) 14 19Copper pipe 15mm to wall (m) (>1,000m job) 28 38Fire sprinklers (per m2) (5,000m2 job) 70 96Air conditioning incl main plant (m2) (>5,000m2 job) 300 411

22
International Construction Cost Survey 2010–11
Malaysia Malaysia’s economy contracted during the downturn as demand for its principal exports – electronics and energy – declined. Malaysia is quite dependent on exports and the downturn flowed through to its construction sector. Private construction has been impacted by the weaker global economic outlook with the commercial and industrial sectors particularly affected. However, since 2009 recovery has been fairly solid with close to five percent GDP growth, and recovery is definitely evident. Furthermore, a moderate increase in construction costs occurred between 2009 and 2010. During 2011, Malaysian construction is expected to pick up in line with the other Asian economies with brisk trade to China being a key part of this.
Malaysia – International Building Costs per m2 of internal area
2008 2009 mid 2010 mid 2010 MYR MYR MYR USD
Residential
Individual detached house medium standard 1,436 1,400 1,500 475Individual detached house prestige 1,897 1,850 1,980 627Townhouses medium standard 974 950 1,000 317Apartments private medium density 1,169 1,140 1,200 380Apartments high rise 1,538 1,500 1,700 538Aged care/affordable units 1,250 1,220 1,310 415
Commercial
Offices – business park 1,957 1,900 2,000 633CBD Offices – up to 20 floors medium 2,575 2,500 2,600 823CBD Offices – prestige 3,605 3,500 3,700 1,172
Warehouses
Warehouse/factory units – basic 1,228 1,200 1,250 396Large warehouse distribution centre 1,536 1,500 1,600 507High-tech factory/laboratory 2,560 2,500 2,600 823
Retail
Large shopping centre including mall 3,021 3,000 3,200 1,013Neighbourhood including supermarket 2,517 2,500 2,700 855Prestige car showroom 3,323 3,300 3,500 1,108
Hotels
Three star travellers 3,525 3,500 3,600 1,140Five star luxury 6,042 6,000 6,200 1,963Resort style 6,300 6,250 6,450 2,043
Hospitals
Day centre 1,611 1,600 1,700 538Regional hospital 2,115 2,100 2,200 697General hospital 2,366 2,350 2,500 792
Schools
Primary and secondary 805 800 850 269University 3,021 3,000 3,200 1,013
Carparks
Multi-storey above ground 1,008 1,000 1,150 364Multi-storey below ground 1,511 1,500 1,600 507
Airports
Airport terminal 4,600 4,500 4,700 1,488

23making the difference
Malaysia – Major Projects
USD
EWO2A at new LCCT – Sepang 94 millionPaya Peda Dam in Besut – Terengganu 107 millionMurum Dam – Sarawak 79 millionBoulevard Plaza Development – Putrajaya 78 millionBakun Similajau Transmission System 67 million
Malaysia – Costs of Labour (including overheads)
2010 2010 MYR USD
Group 1 Tradesman – eg, plumber, electrician 19 6Group 2 Tradesman – eg, carpenter, bricklayer 15 5Group 3 Tradesman – eg, carpet layer, tiler, plasterer 19 6General labourer 10 3Site foreman 50 16
Malaysia – Costs of Materials
Concrete 30 mpa (m3) (1,500m3 job) 230 73Reinforcement bar 16mm (tonne) (120 tonne job) 2,900 918Concrete block (400 x 200) per 1,000 (>10,000 block job) 3,600 1,140Standard brick per 1,000 360 114Structural steel beams (tonne) (>100 tonne job) 4,000 1,267Glass pane 6mm (m2) 188 60Softwood timber for framing 100mm x 50mm (m) 25 813mm Plasterboard (m2) 25 8Emulsion paint (litre) 38 12Copper pipe 15mm (m) (>1,000m job) 24 8Copper cable (m) (3C + E, 2.5mm PVC) (>100,000m job) 15 5
Malaysia – Key Trades (excluding preliminaries and builders’ margins)
Excavate basement (m3) (1,800m3 job) 27 9Excavate footings (m) 32 10Concrete in slab (m3) (1,500m3 job) 332 105Reinforcement in beams (tonne) 3,507 1,111Formwork to soffit of slab (m2) 50 16Blockwork in wall (m2) (10,000 block job) 67 21Structural steel beams (tonne) 6,500 2,058Pre-cast concrete wall (m2) – –Curtain wall glazing incl support system (m2) (1,000m2 job) 400 127Plasterboard 13mm thick to stud wall (m2) (3,000m2 job) 90 29Single solid core door incl frame and hardware (no) (50 door job) 800 253Painting to walls primer + 2 coats (m2) 8 3Ceramic tiling (m2) (1,000m2 job) 110 35Vinyl flooring to wet areas (m2) (500m2 job) 98 31Carpet medium tufted (m2) (4,500m2 job) 90 29Lighting installation (m2) (>5,000m2 job) 150 48Copper pipe 15mm to wall (m) (>1,000m job) 78 25Fire sprinklers (per m2) (5,000m2 job) 100 32Air conditioning incl main plant (m2) (>5,000m2 job) 300 95

24
International Construction Cost Survey 2010–11
The Netherlands Construction costs are only slightly above levels experienced in 2008. The Netherlands’ economy is one of the stable European economies but nevertheless is still feeling the effects of European economic weakness. Housing prices are high and have remained so during the downturn. The Dutch are concerned about rising sea levels and climate change and therefore there are numerous policies that impact construction in relation to this. For example, the Maasvlakte 2 project is a major reclamation and seawater defence project of 2,000 hectares. It also includes port, road and rail development. Generally, confidence is improving and the level of investment in construction is increasing again.
The Netherlands – International Building Costs per m2 of internal area
2008 2009 mid 2010 mid 2010 EUR EUR EUR USD
Residential
Individual detached house medium standard 1,900 1,976 2,050 2,808Individual detached house prestige 2,200 2,288 2,380 3,260Townhouses medium standard 2,000 2,080 2,150 2,945Apartments private medium density 1,200 1,248 1,296 1,775Apartments high rise 1,700 1,768 1,836 2,515Aged care/affordable units 1,100 1,144 1,180 1,616
Commercial
Offices – business park 1,400 1,455 1,511 2,070CBD Offices – up to 20 floors medium 1,900 1,976 2,051 2,810CBD Offices – prestige 2,300 2,391 2,483 3,401
Warehouses
Warehouse/factory units – basic 805 837 869 1,190Large warehouse distribution centre 780 811 842 1,153High-tech factory/laboratory 1,040 1,081 1,123 1,538
Retail
Large shopping centre including mall 1,600 1,663 1,727 2,366Neighbourhood including supermarket 1,300 1,351 1,403 1,922Prestige car showroom 1,800 1,871 1,943 2,662
Hotels
Three star travellers 1,600 1,663 1,727 2,366Five star luxury 2,500 2,599 2,698 3,696Resort style 2,100 2,183 2,267 3,105
Hospitals
Day centre 1,750 1,820 1,875 2,568Regional hospital 1,850 1,924 1,998 2,737General hospital 2,550 2,652 2,730 3,740
Schools
Primary and secondary 1,440 1,497 1,555 2,130University 1,690 1,757 1,825 2,500
Carparks
Multi-storey above ground 500 520 540 740Multi-storey below ground 1,200 1,248 1,296 1,775
Airports
Airport terminal 1,800 1,871 1,943 2,662

25making the difference
The Netherlands – Major Projects
USD
Maasvlakte 2 Project 2.9 billionHanzelijn Lelystand-Zwolle 1.3 billion
The Netherlands – Costs of Labour (including overheads)
2010 2010 EUR USD
Group 1 Tradesman – eg, plumber, electrician 41 56Group 2 Tradesman – eg, carpenter, bricklayer 33 45Group 3 Tradesman – eg, carpet layer, tiler, plasterer 29 40General labourer 19 26Site foreman 38 52
The Netherlands – Costs of Materials
Concrete 30 mpa (m3) (1,500m3 job) 92 126Reinforcement bar 16mm (tonne) (120 tonne job) 943 1,292Concrete block (400 x 200) per 1,000 (>10,000 block job) 2,562 3,510Standard brick per 1,000 396 542Structural steel beams (tonne) (>100 tonne job) 1,301 1,781Glass pane 6mm (m2) 32 44Softwood timber for framing 100mm x 50mm (m) 2 313mm Plasterboard (m2) 5 7Emulsion paint (litre) 11 15Copper pipe 15mm (m) (>1,000m job) 5 7Copper cable (m) (3C + E, 2.5mm PVC) (>100,000m job) 2 3
The Netherlands – Key Trades (excluding preliminaries and builders’ margins)
Excavate basement (m3) (1,800m3 job) 67 92Excavate footings (m) 51 70Concrete in slab (m3) (1,500m3 job) 287 393Reinforcement in beams (tonne) 1,127 1,544Formwork to soffit of slab (m2) 34 47Blockwork in wall (m2) (10,000 block job) 46 63Structural steel beams (tonne) 2,460 3,370Pre-cast concrete wall (m2) – –Curtain wall glazing incl support system (m2) (1,000m2 job) 615 842Plasterboard 13mm thick to stud wall (m2) (3,000m2 job) 77 105Single solid core door incl frame and hardware (no) (50 door job) 1,179 1,615Painting to walls primer + 2 coats (m2) 16 22Ceramic tiling (m2) (1,000m2 job) 108 148Vinyl flooring to wet areas (m2) (500m2 job) 26 36Carpet medium tufted (m2) (4,500m2 job) 46 63Lighting installation (m2) (>5,000m2 job) 67 92Copper pipe 15mm to wall (m) (>1,000m job) 5 7Fire sprinklers (per m2) (5,000m2 job) 36 49Air conditioning incl main plant (m2) (>5,000m2 job) 84 115

26
International Construction Cost Survey 2010–11
Russia Having suffered a large reduction in GDP during the global crisis, Russia is now emerging quite strongly with GDP growth expected to reach 4.5 percent in 2011. The financial sector was severely affected by the downturn, with private construction investment currently very weak. However, strong commodity prices are helping to encourage investment in resources projects, and high exports of coal, oil and gas will help promote investment in construction again. In Russia we are now seeing clients reassessing the contractors market, undertaking wider pre-qualifications and in some cases attracting a tender list with ten or more bidders. Due to the tightness of the market, some of the high cost, high quality international contractors are finding it difficult to secure contracts and in some cases deciding to withdraw from competing in the local market.
Russia – International Building Costs per m2 of internal area
2008 2009 mid 2010 mid 2010 RUB RUB RUB USD
Residential
Individual detached house medium standard 28,500 30,000 31,000 1,000Individual detached house prestige 57,000 60,000 62,000 2,000Townhouses medium standard 23,750 25,000 27,900 900Apartments private medium density 47,500 50,000 43,400 1,400Apartments high rise 57,000 60,000 55,800 1,800Aged care/affordable units 47,500 50,000 43,400 1,400
Commercial
Offices – business park 37,620 39,600 43,400 1,400CBD Offices – up to 20 floors medium 50,160 52,800 49,600 1,600CBD Offices – prestige 62,700 60,600 55,800 1,800
Warehouses
Warehouse/factory units – basic 20,425 21,500 23,250 750Large warehouse distribution centre 24,510 25,800 26,350 850High-tech factory/laboratory 81,700 86,000 93,000 3,000
Retail
Large shopping centre including mall 40,641 42,780 46,500 1,500Neighbourhood including supermarket 29,803 31,372 34,100 1,100Prestige car showroom 28,500 30,000 37,200 1,200
Hotels
Three star travellers 56,430 59,400 62,000 2,000Five star luxury 70,538 74,250 77,500 2,500Resort style 84,646 89,100 93,000 3,000
Hospitals
Day centre 37,500 40,000 42,500 1,371Regional hospital 50,000 53,000 51,000 1,645General hospital 65,000 68,000 70,000 2,258
Schools
Primary and secondary 45,000 48,000 49,000 1,581University 50,000 54,000 57,000 1,839
Carparks
Multi-storey above ground 21,300 22,355 23,250 750Multi-storey below ground 17,000 18,000 26,350 850
Airports
Airport terminal 90,000 96,000 100,000 3,226

27making the difference
Russia – Major Projects
USD
Moscow – St Petersburg High Speed Rail Line (HSR1) 35 billionUral Industrial – Ural Polar Project 28.7 billionNyagan Power Plant 2.1 billionAnkudinovka Innovative Technology Park 830 millionRF Network of Multifunctional Trade & Logistics Corridors 836 million
Russia – Costs of Labour (including overheads)
2010 2010 RUB USD
Group 1 Tradesman – eg, plumber, electrician 310 10Group 2 Tradesman – eg, carpenter, bricklayer 310 10Group 3 Tradesman – eg, carpet layer, tiler, plasterer 310 10General labourer 248 8Site foreman 496 16
Russia – Costs of Materials
Concrete 30 mpa (m3) (1,500m3 job) 3,000 97Reinforcement bar 16mm (tonne) (120 tonne job) 24,500 790Concrete block (400 x 200) per 1,000 (>10,000 block job) 1,000 32Standard brick per 1,000 9,000 290Structural steel beams (tonne) (>100 tonne job) 35,000 1,129Glass pane 6mm (m2) 900 29Softwood timber for framing 100mm x 50mm (m) 170 513mm Plasterboard (m2) 125 4Emulsion paint (litre) 40 1Copper pipe 15mm (m) (>1,000m job) 300 10Copper cable (m) (3C + E, 2.5mm PVC) (>100,000m job) 31 1
Russia – Key Trades (excluding preliminaries and builders’ margins)
Excavate basement (m3) (1,800m3 job) 465 15Excavate footings (m) 400 13Concrete in slab (m3) (1,500m3 job) 4,000 129Reinforcement in beams (tonne) 30,000 968Formwork to soffit of slab (m2) 900 29Blockwork in wall (m2) (10,000 block job) 1,200 39Structural steel beams (tonne) 75,000 2,419Pre-cast concrete wall (m2) 5,000 161Curtain wall glazing incl support system (m2) (1,000m2 job) 23,250 750Plasterboard 13mm thick to stud wall (m2) (3,000m2 job) 2,100 68Single solid core door incl frame and hardware (no) (50 door job) 24,000 774Painting to walls primer + 2 coats (m2) 250 8Ceramic tiling (m2) (1,000m2 job) 1,650 53Vinyl flooring to wet areas (m2) (500m2 job) 1,500 48Carpet medium tufted (m2) (4,500m2 job) 1,850 60Lighting installation (m2) (>5,000m2 job) 3,100 100Copper pipe 15mm to wall (m) (>1,000m job) 800 26Fire sprinklers (per m2) (5,000m2 job) 900 29Air conditioning incl main plant (m2) (>5,000m2 job) 6,000 194

28
International Construction Cost Survey 2010–11
Singapore As a major financial hub, Singapore was particularly affected by the global downturn with the demand for offices falling as vacancy increased and rents fell. However, the recovery has been very solid and Singapore saw growth of 15 percent during 2010, even higher than China’s growth rate. The tourism sector is growing strongly and recently new casinos and hotels have added to the attraction. Furthermore, the financial sector is experiencing a strong recovery in foreign exchange and commercial lending transactions. Strong export growth will add to the demand for construction and it is likely that hotel and commercial construction will increase sharply during 2011.
Singapore – International Building Costs per m2 of internal area
2008 2009 mid 2010 mid 2010 SGD SGD SGD USD
Residential
Individual detached house medium standard 4,000 3,500 3,850 2,984Individual detached house prestige 4,900 4,400 4,400 3,411Townhouses medium standard 3,400 2,800 2,800 2,171Apartments private medium density 3,000 2,000 2,000 1,550Apartments high rise 3,400 2,500 2,700 2,093Aged care/affordable units 1,500 1,350 1,450 1,124
Commercial
Offices – business park 2,300 2,000 2,000 1,550CBD Offices – up to 20 floors medium 3,000 2,500 2,500 1,938CBD Offices – prestige 3,200 2,800 2,800 2,171
Warehouses
Warehouse/factory units – basic 1,400 1,200 1,200 930Large warehouse distribution centre 1,600 1,500 1,700 1,318High-tech factory/laboratory 3,000 2,800 2,800 2,171
Retail
Large shopping centre including mall 3,000 2,500 3,000 2,326Neighbourhood including supermarket 2,400 2,000 2,000 1,550Prestige car showroom 3,500 3,300 3,300 2,558
Hotels
Three star travellers 3,300 2,700 3,100 2,403Five star luxury 4,800 4,000 4,150 3,217Resort style 3,200 2,600 3,000 2,326
Hospitals
Day centre 2,000 1,800 1,750 1,357Regional hospital 3,500 3,000 3,000 2,326General hospital 3,500 3,000 3,000 2,326
Schools
Primary and secondary 1,500 1,500 1,500 1,163University 2,500 2,500 2,500 1,938
Carparks
Multi-storey above ground 1,200 900 1,200 930Multi-storey below ground 2,000 1,600 1,600 1,240
Airports
Airport terminal 4,500 4,000 4,000 3,101

29making the difference
Singapore – Major Projects
USD
Ocean Financial Centre 1.4 billionOne Raffles Place (Tower 2) 404 millionSouth Beach 2.5 billionDowntown MRT Line 1.4 billionInternational Cruise Terminal 500 million
Singapore – Costs of Labour (including overheads)
2010 2010 SGD USD
Group 1 Tradesman – eg, plumber, electrician 25 19Group 2 Tradesman – eg, carpenter, bricklayer 20 16Group 3 Tradesman – eg, carpet layer, tiler, plasterer 20 16General labourer 12 9Site foreman 30 23
Singapore – Costs of Materials
Concrete 30 mpa (m3) (1,500m3 job) 126 98Reinforcement bar 16mm (tonne) (120 tonne job) 1,580 1,225Concrete block (400 x 200) per 1,000 (>10,000 block job) 800 620Standard brick per 1,000 250 194Structural steel beams (tonne) (>100 tonne job) 5,200 4,031Glass pane 6mm (m2) 55 43Softwood timber for framing 100mm x 50mm (m) 13 1013mm Plasterboard (m2) 21 16Emulsion paint (litre) 20 16Copper pipe 15mm (m) (>1,000m job) 12 9Copper cable (m) (3C + E, 2.5mm PVC) (>100,000m job) 2 1
Singapore – Key Trades (excluding preliminaries and builders’ margins)
Excavate basement (m3) (1,800m3 job) 21 16Excavate footings (m) 50 39Concrete in slab (m3) (1,500m3 job) 200 155Reinforcement in beams (tonne) 1,580 1,225Formwork to soffit of slab (m2) 30 23Blockwork in wall (m2) (10,000 block job) 35 27Structural steel beams (tonne) 5,200 4,031Pre-cast concrete wall (m2) 110 85Curtain wall glazing incl support system (m2) (1,000m2 job) 500 388Plasterboard 13mm thick to stud wall (m2) (3,000m2 job) 21 16Single solid core door incl frame and hardware (no) (50 door job) 800 620Painting to walls primer + 2 coats (m2) 8 6Ceramic tiling (m2) (1,000m2 job) 70 54Vinyl flooring to wet areas (m2) (500m2 job) 150 116Carpet medium tufted (m2) (4,500m2 job) 70 54Lighting installation (m2) (>5,000m2 job) 200 155Copper pipe 15mm to wall (m) (>1,000m job) 27 21Fire sprinklers (per m2) (5,000m2 job) 80 62Air conditioning incl main plant (m2) (>5,000m2 job) 260 202

30
International Construction Cost Survey 2010–11
South Africa The World Cup provided a much needed boost to the tourism and leisure market with strong flow-on effects to construction. With the World Cup over, the projected levels of development have fallen. South Africa has now returned to very competitive tendering as large projects such as Gautrain and the stadiums for 2010 football are complete. Government plans to spend money on improving infrastructure will add some impetus to construction levels. Currently, the office and retail markets are saturated. Strong commodity prices will underwrite resource projects with coal and platinum prominence, and this will encourage a gradual increase in construction activity.
South Africa – International Building Costs per m2 of internal area
2008 2009 mid 2010 mid 2010 ZAR ZAR ZAR USD
Residential
Individual detached house medium standard 4,500 5,000 5,000 725Individual detached house prestige 8,000 9,000 9 000 1,304Townhouses medium standard 5,000 6,000 6,000 870Apartments private medium density 4,800 6,000 6,300 913Apartments high rise 7,000 7,500 7,500 1,087Aged care/affordable units 5,000 5,355 5,355 776
Commercial
Offices – business park 4,500 5,000 5,300 768CBD Offices – up to 20 floors medium 8,000 8,500 8,500 1,232CBD Offices – prestige 7,500 10,000 10,000 1,449
Warehouses
Warehouse/factory units – basic 3,700 3,700 3,700 536Large warehouse distribution centre 3,900 3,900 3,900 565High-tech factory/laboratory 4,500 6,000 6,300 913
Retail
Large shopping centre including mall 5,500 7,800 7,800 1,130Neighbourhood including supermarket 6,000 6,800 6,800 986Prestige car showroom 6,200 7,000 7,000 1,014
Hotels
Three star travellers 5,500 8,000 8,400 1,217Five star luxury 7,000 10,000 10,500 1,522Resort style 6,900 9,700 10,185 1,476
Hospitals
Day centre 4,500 5,500 5,500 797Regional hospital 6,000 7,000 7,000 1,014General hospital 7,500 8,500 8,500 1,232
Schools
Primary and secondary 4,500 5,000 5,000 725University 5,000 6,000 6,000 870
Carparks
Multi-storey above ground 3,200 3,500 4,000 580Multi-storey below ground 3,500 4,000 4,800 696
Airports
Airport terminal 20,000 20,900 20,900 3,029

31making the difference
South Africa – Major Projects
ZAR
UJ Soweto 600 millionUJ Auckland Park 100 millionOhio Office Park 130 millionAbsa Volkskas 40 millionRefurbishments & Fitouts for Absa 50 million
South Africa – Costs of Labour (including overheads)
2010 2010 ZAR USD
Group 1 Tradesman – eg, plumber, electrician 50 7Group 2 Tradesman – eg, carpenter, bricklayer 45 7Group 3 Tradesman – eg, carpet layer, tiler, plasterer 35 5General labourer 15 2Site foreman 200 29
South Africa – Costs of Materials
Concrete 30 mpa (m3) (1,500m3 job) 940 136Reinforcement bar 16mm (tonne) (120 tonne job) 7,727 1,120Concrete block (400 x 200) per 1,000 (>10,000 block job) 1,450 210Standard brick per 1,000 1,500 217Structural steel beams (tonne) (>100 tonne job) 15,000 2,174Glass pane 6mm (m2) 400 58Softwood timber for framing 100mm x 50mm (m) 70 1013mm Plasterboard (m2) 46 7Emulsion paint (litre) 40 6Copper pipe 15mm (m) (>1,000m job) 30 4Copper cable (m) (3C + E, 2.5mm PVC) (>100,000m job) – –
South Africa – Key Trades (excluding preliminaries and builders’ margins)
Excavate basement (m3) (1,800m3 job) 50 7Excavate footings (m) 60 9Concrete in slab (m3) (1,500m3 job) 1,085 157Reinforcement in beams (tonne) 7,727 1,120Formwork to soffit of slab (m2) 135 20Blockwork in wall (m2) (10,000 block job) 210 30Structural steel beams (tonne) 24,000 3,478Pre-cast concrete wall (m2) 450 65Curtain wall glazing incl support system (m2) (1,000m2 job) 1,600 232Plasterboard 13mm thick to stud wall (m2) (3,000m2 job) 200 29Single solid core door incl frame and hardware (no) (50 door job) 1,683 244Painting to walls primer + 2 coats (m2) 27 4Ceramic tiling (m2) (1,000m2 job) 200 29Vinyl flooring to wet areas (m2) (500m2 job) 154 22Carpet medium tufted (m2) (4,500m2 job) 220 32Lighting installation (m2) (>5,000m2 job) – –Copper pipe 15mm to wall (m) (>1,000m job) 55 8Fire sprinklers (per m2) (5,000m2 job) 165 24Air conditioning incl main plant (m2) (>5,000m2 job) 1,300 188

32
International Construction Cost Survey 2010–11
South Korea The South Korean economy has recovered strongly, buoyed by Chinese growth and Korea’s ability to service large-scale engineering projects. However, not all sectors are growing strongly. Currently, the residential sector is in a depression. Around ten of the 100 top contractors have been made bankrupt as a result of falling sales and activity. There are fewer projects and intense competition is reducing margins and profitability. Some large-scale development projects are under suspension. Market conditions are forecast to recover strongly from the end of 2010. Currently, the commercial sector is quite weak with offices in Seoul over supplied. Nevertheless, there are some very large projects forecast for South Korea over the next two years.
South Korea – International Building Costs per m2 of internal area
2008 2009 mid 2010 mid 2010 KRW KRW KRW USD
Residential
Individual detached house medium standard 1,167,307 1,155,750 1,150,000 1,018Individual detached house prestige 1,725,585 1,708,500 1,700,000 1,504Townhouses medium standard 1,380,468 1,366,800 1,360,000 1,204Apartments private medium density 1,116,555 1,105,500 1,100,000 973Apartments high rise 1,421,070 1,407,000 1,400,000 1,239Aged care/affordable units 1,220,000 1,200,000 1,180,000 1,044
Commercial
Offices – business park 1,116,555 1,105,500 1,100,000 973CBD Offices – up to 20 floors medium 1,370,317 1,356,750 1,350,000 1,195CBD Offices – prestige 1,725,585 1,708,500 1,700,000 1,504
Warehouses
Warehouse/factory units – basic 954,450 945,000 900,000 796Large warehouse distribution centre 761,287 753,750 750,000 664High-tech factory/laboratory 2,639,130 2,613,000 2,600,000 2,301
Retail
Large shopping centre including mall 1,725,585 1,708,500 1,700,000 1,504Neighbourhood including supermarket 954,450 945,000 900,000 796Prestige car showroom 1,898,144 1,879,350 1,870,000 1,655
Hotels
Three star travellers 1,522,575 1,507,500 1,500,000 1,327Five star luxury 3,045,150 3,015,000 3,000,000 2,655Resort style 1,827,090 1,809,000 1,800,000 1,593
Hospitals
Day centre 1,116,555 1,105,500 1,100,000 973Regional hospital 1,624,080 1,608,000 1,600,000 1,416General hospital 1,725,585 1,708,500 1,700,000 1,504
Schools
Primary and secondary 1,015,050 1,005,000 1,000,000 885University 1,370,317 1,356,750 1,350,000 1,195
Carparks
Multi-storey above ground 558,277 552,750 550,000 487Multi-storey below ground 812,040 804,000 800,000 708
Airports
Airport terminal 2,500,000 2,600,000 2,550,000 2,257

33making the difference
South Korea – Major Projects
KRW
Songdo International Business Complex 24 trillionSongdo Landmark City Development 17 trillionSaemanguem Development 23 trillionYongsan Development 24 trillionDMC Landmark Building 3.3 trillion
South Korea – Costs of Labour (including overheads)
2010 2010 KRW USD
Group 1 Tradesman – eg, plumber, electrician 95,858 85Group 2 Tradesman – eg, carpenter, bricklayer 96,113 85Group 3 Tradesman – eg, carpet layer, tiler, plasterer 96,677 86General labourer 68,965 61Site foreman 92,218 82
South Korea – Costs of Materials
Concrete 30 mpa (m3) (1,500m3 job) 64,380 57Reinforcement bar 16mm (tonne) (120 tonne job) 771,000 682Concrete block (400 x 200) per 1,000 (>10,000 block job) 750,000 664Standard brick per 1,000 50,000 44Structural steel beams (tonne) (>100 tonne job) 910,000 805Glass pane 6mm (m2) 9,410 8Softwood timber for framing 100mm x 50mm (m) 917 113mm Plasterboard (m2) 3,059 3Emulsion paint (litre) 2,100 2Copper pipe 15mm (m) (>1,000m job) 5,188 5Copper cable (m) (3C + E, 2.5mm PVC) (>100,000m job) 285 0.24
South Korea – Key Trades (excluding preliminaries and builders’ margins)
Excavate basement (m3) (1,800m3 job) 6,256 6Excavate footings (m) 6,256 6Concrete in slab (m3) (1,500m3 job) 1,612,000 1,427Reinforcement in beams (tonne) 2,084,105 1,844Formwork to soffit of slab (m2) 22,440 20Blockwork in wall (m2) (10,000 block job) 35,566 31Structural steel beams (tonne) 2,350,000 2,080Pre-cast concrete wall (m2) 250,000 221Curtain wall glazing incl support system (m2) (1,000m2 job) 300,000 265Plasterboard 13mm thick to stud wall (m2) (3,000m2 job) 45,000 40Single solid core door incl frame and hardware (no) (50 door job) 250,000 221Painting to walls primer + 2 coats (m2) 4,448 4Ceramic tiling (m2) (1,000m2 job) 45,000 40Vinyl flooring to wet areas (m2) (500m2 job) 35,000 31Carpet medium tufted (m2) (4,500m2 job) 50,000 44Lighting installation (m2) (>5,000m2 job) 42,000 37Copper pipe 15mm to wall (m) (>1,000m job) 11,000 10Fire sprinklers (per m2) (5,000m2 job) 22,500 20Air conditioning incl main plant (m2) (>5,000m2 job) 202,000 179

34
International Construction Cost Survey 2010–11
UK The Comprehensive Spending Review in the UK saw the Government’s total capital spending cut by almost 40 percent and grants to local authorities falling by nearly 30 percent. Various current capital projects have been scrapped and more may follow as the true impact of these reductions is assessed. Whilst the private sector is showing some signs of activity, this may be insufficient to counterbalance the change in the market. Private sector clients are still suffering from the credit recession and have difficulty in obtaining credit/funding to progress with projects. Contractors’ margins are still very low at present and not expected to improve within the next six months. However, on-costs from increasing oil prices and material price increases may be passed on at some point within the next year. The Government has also reduced operational expenditure and announced an increase of VAT to 20 percent from January 2011.
UK – International Building Costs per m2 of internal area
2008 2009 mid 2010 mid 2010 GBP GBP GBP USD
Residential
Individual detached house medium standard 1,050 1,050 1,020 1,645Individual detached house prestige 1,465 1,465 1,465 2,363Townhouses medium standard 1,008 1,200 1,200 1,935Apartments private medium density 1,850 1,800 1,800 2,903Apartments high rise 2,350 2,300 2,300 3,710Aged care/affordable units 1,800 1,820 1,820 2,935
Commercial
Offices – business park 1,550 1,500 1,500 2,419CBD Offices – up to 20 floors medium 2,972 2,700 2,700 4,355CBD Offices – prestige 3,800 3,800 3,800 6,129
Warehouses
Warehouse/factory units – basic 820 800 800 1,290Large warehouse distribution centre 867 900 900 1,452High-tech factory/laboratory 1,365 1,500 1,500 2,419
Retail
Large shopping centre including mall 2,200 2,200 2,200 3,548Neighbourhood including supermarket 1,835 1,835 1,835 2,960Prestige car showroom 2,000 2,000 2,000 3,226
Hotels
Three star travellers 1,300 1,200 1,200 1,935Five star luxury 2,500 2,500 2,500 4,032Resort style 2,500 2,500 2,500 4,032
Hospitals
Day centre 1,295 1,530 1,530 2,468Regional hospital 2,639 2,514 2,514 4,055General hospital 1,740 1,733 1,733 2,795
Schools
Primary and secondary 1,553 1,590 1,350 2,177University 2,240 2,200 2,180 3,516
Carparks
Multi-storey above ground 437 450 450 726Multi-storey below ground 870 850 850 1,371
Airports
Airport terminal 3,150 3,050 3,050 4,919

35making the difference
UK – Major Projects
GBP
Crossrail Project 15.9 billionProject SLAM (Single living accommodation Modernisation) UK wide 1 billionOlympic Aquatic Centre 303 millionOlympic Athletes’ Village 1 billionLondon Tideway Tunnels 2 billion
UK – Costs of Labour (including overheads)
2010 2010 GBP USD
Group 1 Tradesman – eg, plumber, electrician 30 48Group 2 Tradesman – eg, carpenter, bricklayer 30 48Group 3 Tradesman – eg, carpet layer, tiler, plasterer 30 48General labourer 18 29Site foreman 45 73
UK – Costs of Materials
Concrete 30 mpa (m3) (1,500m3 job) 85 137Reinforcement bar 16mm (tonne) (120 tonne job) 700 1,129Concrete block (400 x 200) per 1,000 (>10,000 block job) 1,050 1,694Standard brick per 1,000 450 726Structural steel beams (tonne) (>100 tonne job) 1,600 2,581Glass pane 6mm (m2) 30 48Softwood timber for framing 100mm x 50mm (m) 2 313mm Plasterboard (m2) 5 8Emulsion paint (litre) 2 3Copper pipe 15mm (m) (>1,000m job) 1 2Copper cable (m) (3C + E, 2.5mm PVC) (>100,000m job) 0.15 0.23
UK – Key Trades (excluding preliminaries and builders’ margins)
Excavate basement (m3) (1,800m3 job) 45 73Excavate footings (m) 12 19Concrete in slab (m3) (1,500m3 job) 110 177Reinforcement in beams (tonne) 950 1,532Formwork to soffit of slab (m2) 42 68Blockwork in wall (m2) (10,000 block job) 35 56Structural steel beams (tonne) 1,900 3,065Pre-cast concrete wall (m2) 50 81Curtain wall glazing incl support system (m2) (1,000m2 job) 550 887Plasterboard 13mm thick to stud wall (m2) (3,000m2 job) 18 29Single solid core door incl frame and hardware (no) (50 door job) 750 1,210Painting to walls primer + 2 coats (m2) 5 8Ceramic tiling (m2) (1,000m2 job) 40 65Vinyl flooring to wet areas (m2) (500m2 job) 25 40Carpet medium tufted (m2) (4,500m2 job) 25 40Lighting installation (m2) (>5,000m2 job) 65 105Copper pipe 15mm to wall (m) (>1,000m job) 10 16Fire sprinklers (per m2) (5,000m2 job) 30 48Air conditioning incl main plant (m2) (>5,000m2 job) 160 258

36
International Construction Cost Survey 2010–11
USDue to considerable oversupply, the commercial office and retail sectors are expected to remain weak through 2011–12. Residential construction markets are gradually stabilizing, but also remain weak. The healthcare and education sectors are likely to remain stable, with the hospitality sector showing slow signs of improvement. Strong and stable sectors include energy, infrastructure and communication. Construction prices continued to fall during 2010 as contractors maintained tight margins in a very competitive market. Despite a forecast for future growth and construction spending, and recent oil price increases, construction prices are likely to remain flat in the short term. The outlook for the general US economy for 2011-12 is for reasonable stability and limited growth. Reflecting this outlook, construction spending is forecast to increase in 2011 and 2012. However, limited potential for growth, suppressed value of real estate, and high levels of existing stock are remaining obstacles for most developers.
US – International Building Costs per m2 of internal area
2008 2009 mid 2010 Forecast 2011 USD USD USD USD
Residential
Individual detached house medium standard 1,570 1,475 1,435 1,435Individual detached house prestige 1,925 1,750 1,710 1,710Townhouses medium standard 1,475 1,330 1,300 1,300Apartments private medium density 1,420 1,590 1,520 1,520Apartments high rise 2,075 2,045 2,020 2,020Aged care/affordable units 1,300 1,400 1,420 1,420
Commercial
Offices – business park 1,450 1,385 1,340 1,340CBD Offices – up to 20 floors medium 2,215 2,150 2,085 2,085CBD Offices – prestige 2,610 2,505 2,440 2,440
Warehouses
Warehouse/factory units – basic 750 850 840 840Large warehouse distribution centre 915 990 1,100 1,100High-tech factory/laboratory 1,520 1,615 1,700 1,700
Retail
Large shopping centre including mall 1,580 1,600 1,500 1,500Neighbourhood including supermarket 860 900 840 840Prestige car showroom 1,425 1,390 1,325 1,325
Hotels
Three star travellers 1,485 1,580 1,525 1,525Five star luxury 2,680 2,720 2,550 2,550Resort style 2,420 2,630 2,250 2,250
Hospitals
Day centre 1,645 1,700 1,725 1,725Regional hospital 3,100 3,210 3,290 3,290General hospital 3,000 3,110 3,260 3,260
Schools
Primary and secondary 1,450 1,510 1,495 1,495University 2,160 2,240 2,150 2,150
Carparks
Multi-storey above ground 700 730 690 690Multi-storey below ground 1,325 1,395 1,295 1,295
Airports
Airport terminal 3,650 3,525 3,425 3,425

37making the difference
US – Major Projects
USD
One World Trade Centre 3.1 billionShephards Flat Wind Farm 2 billionSmart Grid Investment Grant Program 3.375 billionCalifornia HSR 45 billionRevel Ent Resort North & South Tower 1.5–2 billion
US – Costs of Labour (including overheads)
2010 USD
Group 1 Tradesman – eg, plumber, electrician 73Group 2 Tradesman – eg, carpenter, bricklayer 64Group 3 Tradesman – eg, carpet layer, tiler, plasterer 54General labourer 51Site foreman –
US – Costs of Materials
Concrete 30 mpa (m3) (1,500m3 job) 138Reinforcement bar 16mm (tonne) (120 tonne job) 595Concrete block (400 x 200) per 1,000 (>10,000 block job) 950Standard brick per 1,000 400Structural steel beams (tonne) (>100 tonne job) 103Glass pane 6mm (m2) 58Softwood timber for framing 100mm x 50mm (m) 913mm Plasterboard (m2) 10Emulsion paint (litre) 1Copper pipe 15mm (m) (>1,000m job) 11Copper cable (m) (3C + E, 2.5mm PVC) (>100,000m job) 1
US – Key Trades (excluding preliminaries and builders’ margins)
Excavate basement (m3) (1,800m3 job) 8Excavate footings (m) 7Concrete in slab (m3) (1,500m3 job) 91Reinforcement in beams (tonne) 1,905Formwork to soffit of slab (m2) 56Blockwork in wall (m2) (10,000 block job) 70Structural steel beams (tonne) 2,105Pre-cast concrete wall (m2) 123Curtain wall glazing incl support system (m2) (1,000m2 job) 719Plasterboard 13mm thick to stud wall (m2) (3,000m2 job) 32Single solid core door incl frame and hardware (no) (50 door job) 2,048Painting to walls primer + 2 coats (m2) 12Ceramic tiling (m2) (1,000m2 job) 84Vinyl flooring to wet areas (m2) (500m2 job) 59Carpet medium tufted (m2) (4,500m2 job) 39Lighting installation (m2) (>5,000m2 job) 80Copper pipe 15mm to wall (m) (>1,000m job) 29Fire sprinklers (per m2) (5,000m2 job) 28Air conditioning incl main plant (m2) (>5,000m2 job) 162
US – Cost Variations
National Average % 100
Charlotte, NC 83Houston, TX 92Seattle, WA 111Chicago, IL 115Los Angeles, CA 115San Francisco, CA 125New York Metro 132Manhattan, NY 150Source: ENR
NB: Construction costs vary widely across the US:

38
International Construction Cost Survey 2010–11
VietnamThe Vietnam construction market will be impacted by the so-called ‘mega’ projects which the Government has targeted for tendering and commencement over the coming 25 years. Vietnam’s Infrastructure ‘lags’ a long way behind its regional counterparts so these are essential to growth. Projects such as the new airports (Long Thanh International Airport) and the six metro lines planned for Ho Chi Minh City will be hampered by the capacity of the construction industry. There is a shortage of skilled human resource from site level up to management level and increased costs of labour, materials and plant are likely. In Vietnam there are four tiers of contractors, including international blue-chip specialist contractors, standard international contractors, private Vietnamese and large government contractors attached to the Ministry of Construction. All four tiers will be experiencing increased demand and will be in a position to strategically determine which projects suit them. The net effect will be a period where construction costs could see significant ‘spikes’ especially if the time of tendering coincides with a mega infrastructure project.
Vietnam – International Building Costs per m2 of internal area
2008 2009 mid 2010 mid 2010 VND VND VND USD
Residential
Individual detached house medium standard 7,638,000 10,502,250 11,457,000 589Individual detached house prestige 9,165,600 11,457,000 12,411,750 638Townhouses medium standard 7,638,000 8,592,750 9,547,500 491Apartments private medium density 9,547,500 11,457,000 12,411,750 638Apartments high rise 11,457,000 13,366,500 14,321,250 736Aged care/affordable units 7,638,000 8,592,750 9,547,500 491
Commercial
Offices – business park 9,547,500 10,502,250 11,457,000 589CBD Offices – up to 20 floors medium 11,457,000 13,366,500 14,321,250 736CBD Offices – prestige 14,321,250 15,276,000 16,230,750 834
Warehouses
Warehouse/factory units – basic 5,728,500 6,683,250 7,638,000 393Large warehouse distribution centre 5,728,500 6,683,250 7,638,000 393High-tech factory/laboratory 11,457,000 12,411,750 13,366,500 687
Retail
Large shopping centre including mall 10,502,250 11,457,000 12,411,750 638Neighbourhood including supermarket 7,638,000 8,592,750 9,547,500 491Prestige car showroom 8,592,750 9,547,500 10,502,250 540
Hotels
Three star travellers 19,091,000 21,000,100 22,908,240 1,178Five star luxury 26,726,280 28,635,300 30,544,064 1,570Resort style 13,366,500 15,272,032 17,181,036 883
Hospitals
Day centre 9,547,500 9,547,500 11,457,000 589Regional hospital 21,000,100 22,908,240 23,862,550 1,227General hospital 21,000,100 22,908,240 23,862,550 1,227
Schools
Primary and secondary 7,254,203 8,592,750 9,547,500 491University 9,547,500 10,502,250 11,457,000 589
Carparks
Multi-storey above ground 9,163,204 10,502,250 11,457,000 589Multi-storey below ground 10,502,250 11,454,004 12,411,750 638
Airports
Airport terminal 34,362,002 38,180,003 41,998,003 2,159

39making the difference
Vietnam – Major Projects
USD
Thu Thiem Tunnel 150 millionMetroline No.1 1 billionMetroline No.2 1.3 billionLong Thanh – Dau Giay –Expressway 950 millionLong Thanh International 9 billion
Vietnam – Costs of Labour (including overheads)
2010 2010 VND USD
Group 1 Tradesman – eg, plumber, electrician 180,000 9Group 2 Tradesman – eg, carpenter, bricklayer 155,000 8Group 3 Tradesman – eg, carpet layer, tiler, plasterer 125,000 6General labourer 100,000 5Site foreman 90,000 5
Vietnam – Costs of Materials
Concrete 30 mpa (m3) (1,500m3 job) 1,100,000 57Reinforcement bar 16mm (tonne) (120 tonne job) 16,575,000 852Concrete block (400 x 200) per 1,000 (>10,000 block job) 5,301,000 273Standard brick per 1,000 14,003,000 720Structural steel beams (tonne) (>100 tonne job) 17,500,000 900Glass pane 6mm (m2) 247,000 13Softwood timber for framing 100mm x 50mm (m) 152,000 813mm Plasterboard (m2) 95,000 5Emulsion paint (litre) 114,000 6Copper pipe 15mm (m) (>1,000m job) 350,000 18Copper cable (m) (3C + E, 2.5mm PVC) (>100,000m job) 500,000 26
Vietnam – Key Trades (excluding preliminaries and builders’ margins)
Excavate basement (m3) (1,800m3 job) 75,000 4Excavate footings (m) 76,000 4Concrete in slab (m3) (1,500m3 job) 1,600,000 82Reinforcement in beams (tonne) 19,580,000 1,007Formwork to soffit of slab (m2) 380,000 20Blockwork in wall (m2) (10,000 block job) 350,000 18Structural steel beams (tonne) 22,000,000 1,131Pre-cast concrete wall (m2) 10,450,000 537Curtain wall glazing incl support system (m2) (1,000m2 job) 8,550,000 440Plasterboard 13mm thick to stud wall (m2) (3,000m2 job) 150,000 8Single solid core door incl frame and hardware (no) (50 door job) 4,750,000 244Painting to walls primer + 2 coats (m2) 190,000 10Ceramic tiling (m2) (1,000m2 job) 650,000 33Vinyl flooring to wet areas (m2) (500m2 job) 300,000 15Carpet medium tufted (m2) (4,500m2 job) 650,000 33Lighting installation (m2) (>5,000m2 job) – –Copper pipe 15mm to wall (m) (>1,000m job) 650,000 33Fire sprinklers (per m2) (5,000m2 job) – –Air conditioning incl main plant (m2) (>5,000m2 job) – –

40
International Construction Cost Survey 2010–11
AustraliaDave Todde: [email protected]: +61 (0)7 3020 4700
CanadaGerard McCabee: [email protected]: +1 (416) 925 1424
ChinaDuncan Stonee: [email protected]: +86 10 6474 5566
Dubai and Abu DhabiAlan Talabanie: [email protected]: +971 (0) 24437890
GermanyBernd Engelhardte: [email protected]: +41 (0) 61 270 96 74
IndiaRobert Hewitte: [email protected]: +91 22 4071 9800
Ireland Mark Kellye: [email protected]: +35 (0) 312 831 116
MalaysiaDavid Hancoxe: [email protected]: +60 3 2171 1100
The Netherlands Gordon Martine: [email protected] t: +31 (0) 20 6580 060
Russia Beate Reibolde: [email protected]: +7 495 223 86 50
SingaporeSoh May Yenge: [email protected]: +65 6846 3790
South AfricaIan Donaldsone: [email protected] t: +27 (0) 21 421 7001
South KoreaYoonseong Cho e: [email protected]: +82 (0)70 7118 2800
UKBruce McArae: [email protected] t: +44 (0) 20 7544 4000
USCraig Blinstone: [email protected] t: +1 415 489 1600
VietnamDavid Lockwoode: [email protected]: +84 (8) 62 99 82 83
This survey has been compiled by Gary Emmett, Economist Turner & Townsend Level 3, 179 Turbot Street Brisbane, Queensland 4000 t: +61 (0) 7 3020 4759 e: [email protected] w: turnerandtownsend.com
Contributors
