international economics: theory, application, and policy, ch. 16; charles van marrewijk, 2006 1...
Post on 19-Dec-2015
220 views
TRANSCRIPT
International Economics: Theory, Application, and Policy, Ch. 16; Charles van Marrewijk, 2006 1
Figure 16.1 Paul Romer (1955– )
International Economics: Theory, Application, and Policy, Ch. 16; Charles van Marrewijk, 2006 2
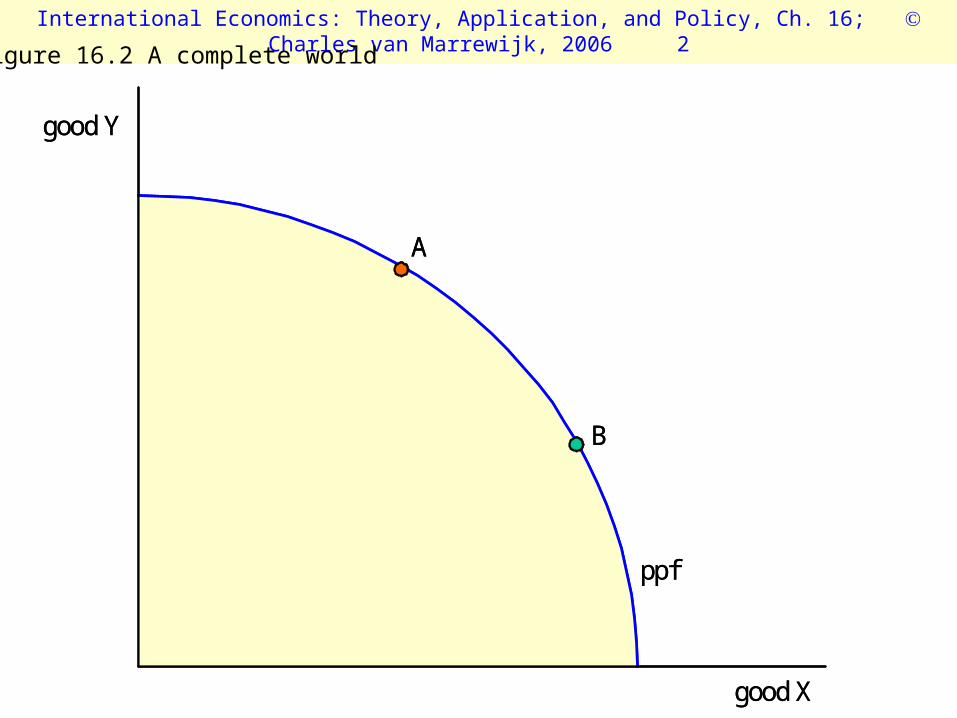
Figure 16.2 A complete world
good X
good Y
A
B
ppf
good X
good Y
A
B
ppf
International Economics: Theory, Application, and Policy, Ch. 16; Charles van Marrewijk, 2006 3
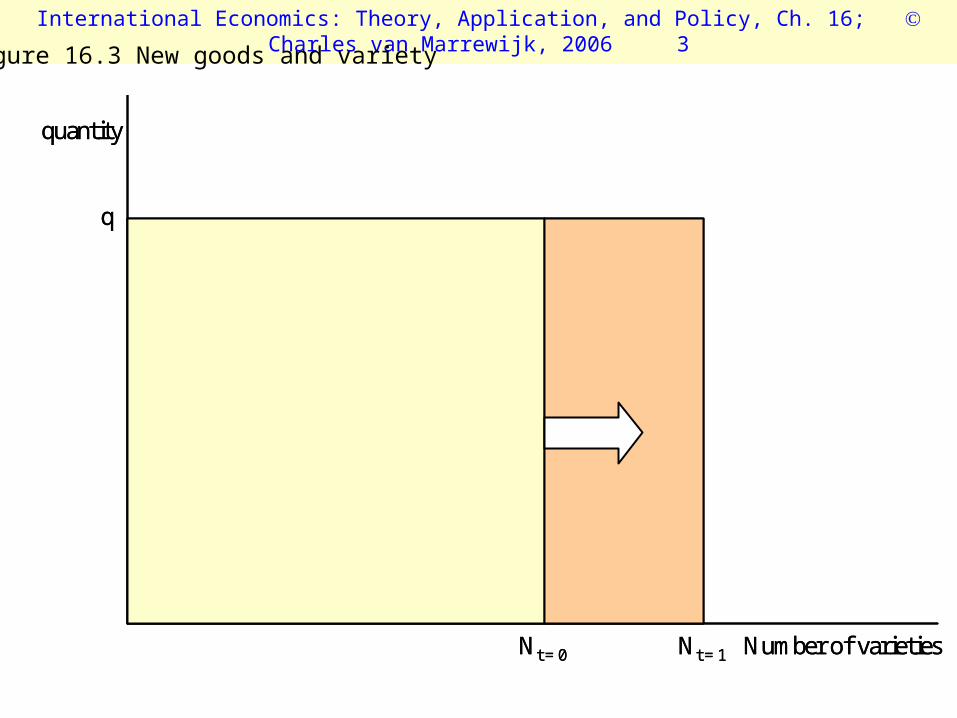
Figure 16.3 New goods and variety
Number of varieties
quantity
q
Nt = 0 Nt = 1 Number of varieties
quantity
q
Nt = 0 Nt = 1
International Economics: Theory, Application, and Policy, Ch. 16; Charles van Marrewijk, 2006 4
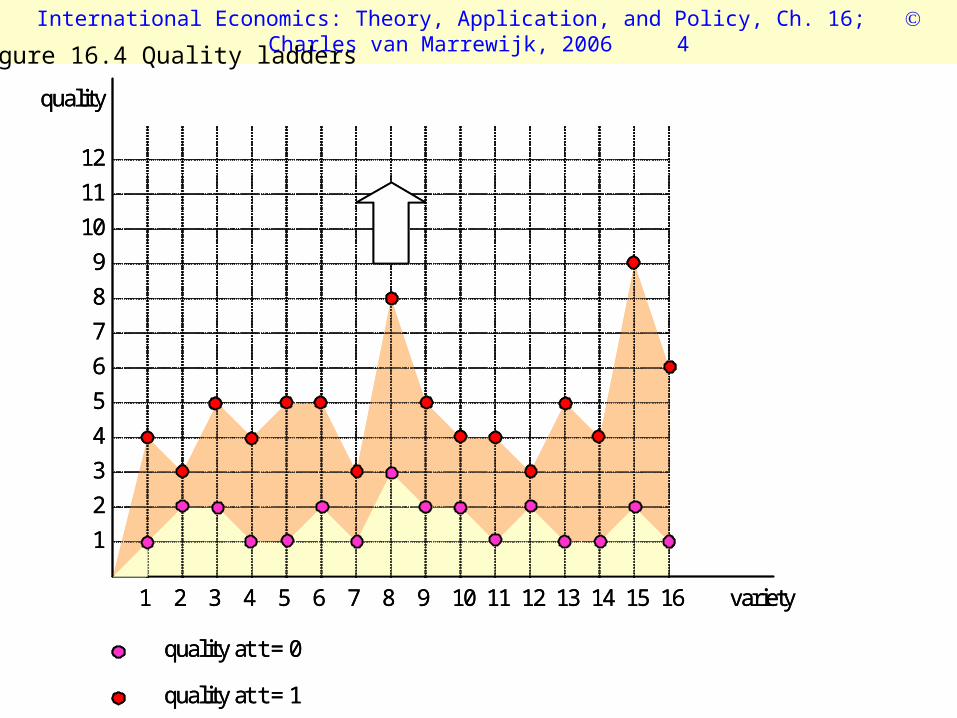
Figure 16.4 Quality ladders
variety
quality
1 2 3 4 5 9876 1413121110 1615
1
4
3
2
7
6
5
10
9
8
11
12
quality at t = 1
quality at t = 0
variety
quality
1 2 3 4 5 9876 1413121110 1615
1
4
3
2
7
6
5
10
9
8
11
12
quality at t = 1
quality at t = 0
International Economics: Theory, Application, and Policy, Ch. 16; Charles van Marrewijk, 2006 5
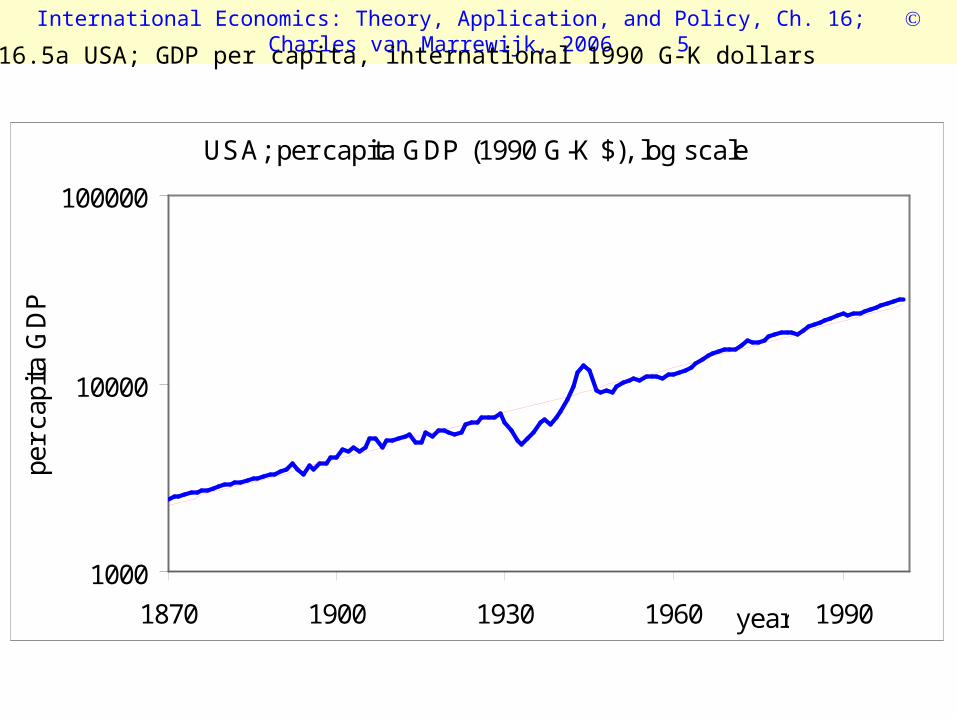
Figure 16.5a USA; GDP per capita, international 1990 G-K dollars
USA; per capita GDP (1990 G-K $), log scale
1000
10000
100000
1870 1900 1930 1960 1990year
per
capi
ta G
DP
International Economics: Theory, Application, and Policy, Ch. 16; Charles van Marrewijk, 2006 6
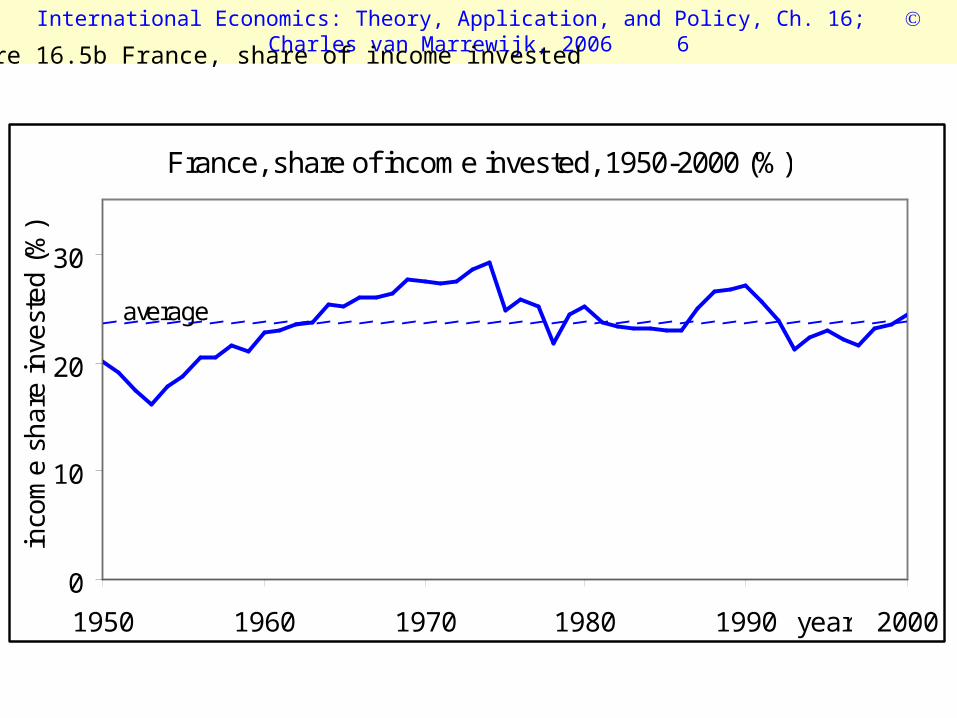
Figure 16.5b France, share of income invested
France, share of income invested, 1950-2000 (%)
0
10
20
30
1950 1960 1970 1980 1990 2000year
inco
me
sh
are
inve
ste
d (
%)
average
International Economics: Theory, Application, and Policy, Ch. 16; Charles van Marrewijk, 2006 7
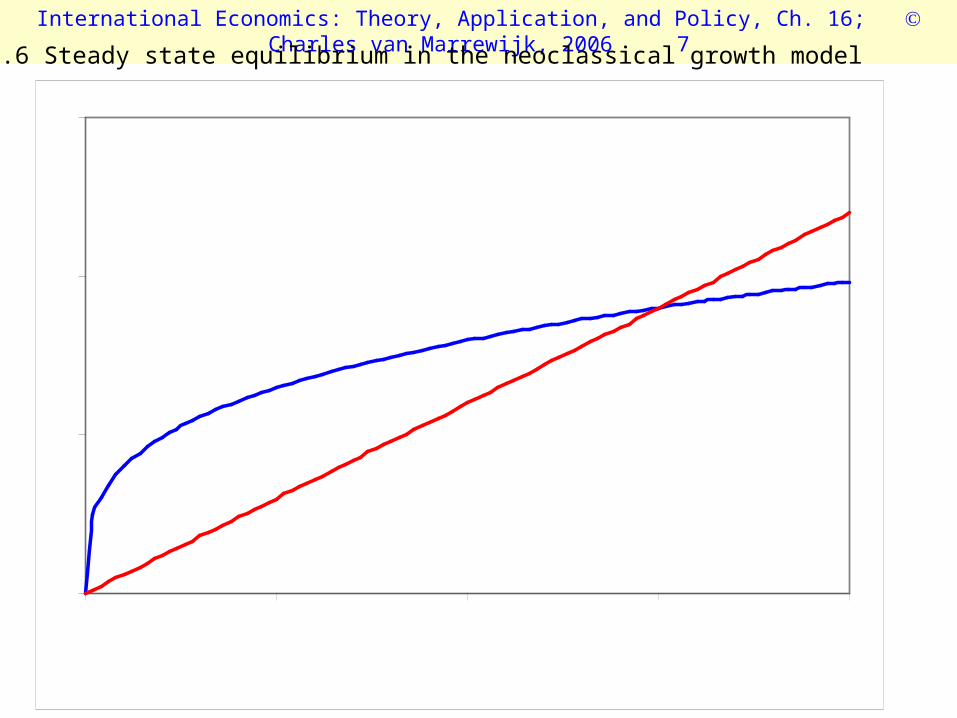
Figure 16.6 Steady state equilibrium in the neoclassical growth model
0
1
2
3
0 5 10 15 20
capital-labor ratio k
tkn)(
E
G
F
tks
International Economics: Theory, Application, and Policy, Ch. 16; Charles van Marrewijk, 2006 8
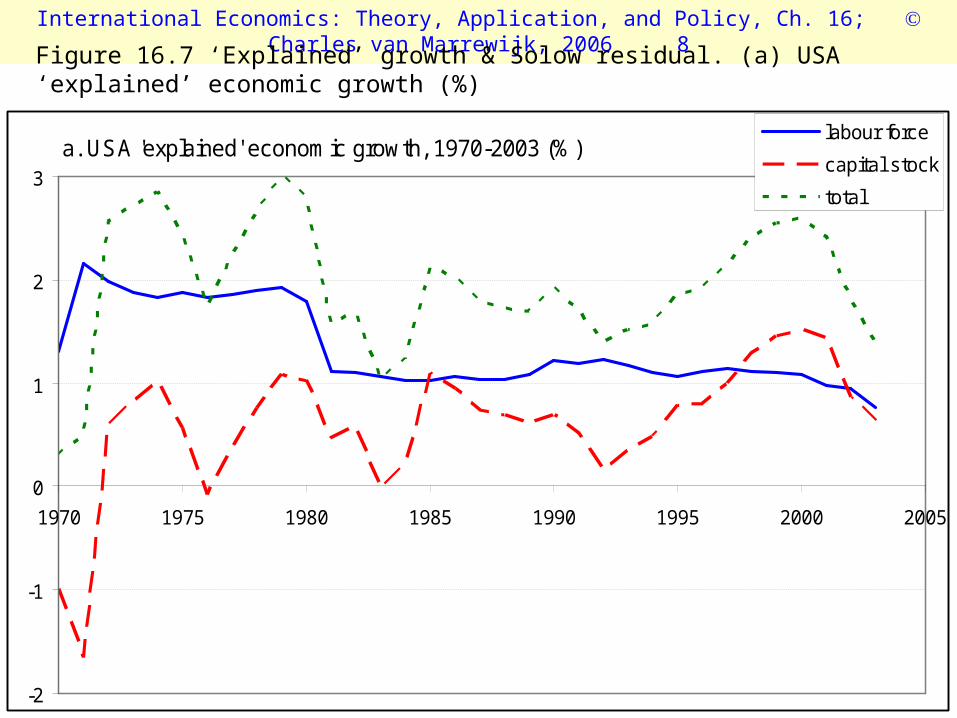
Figure 16.7 ‘Explained’ growth & Solow residual. (a) USA ‘explained’ economic growth (%)
a. USA 'explained' economic growth, 1970-2003 (%)
-2
-1
0
1
2
3
1970 1975 1980 1985 1990 1995 2000 2005
labour force
capital stock
total
International Economics: Theory, Application, and Policy, Ch. 16; Charles van Marrewijk, 2006 9
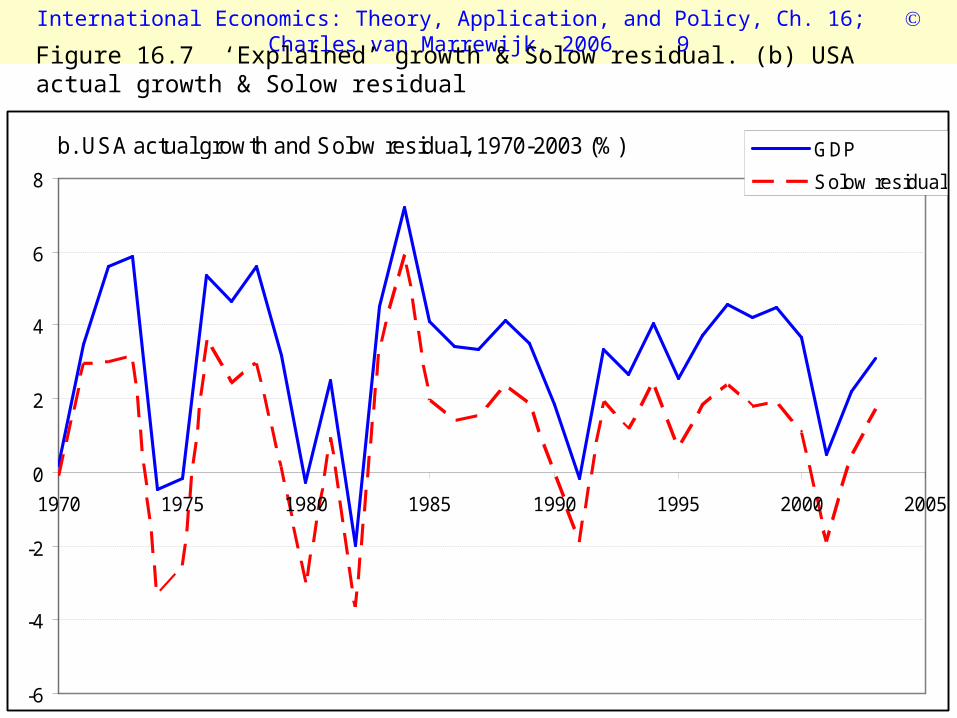
Figure 16.7 ‘Explained’ growth & Solow residual. (b) USA actual growth & Solow residual
b. USA actual growth and Solow residual, 1970-2003 (%)
-6
-4
-2
0
2
4
6
8
1970 1975 1980 1985 1990 1995 2000 2005
GDP
Solow residual

International Economics: Theory, Application, and Policy, Ch. 16; Charles van Marrewijk, 2006 10
Figure 16.8 Log income per capita I, 1990 G-K $
6
7
8
9
10
1870 1890 1910 1930 1950 1970 1990
Australia
Austria
Belgium
Canada
a
6
7
8
9
10
1870 1890 1910 1930 1950 1970 1990
Denmark
France
Finland
Germany
b

International Economics: Theory, Application, and Policy, Ch. 16; Charles van Marrewijk, 2006 11
Figure 16.8 Log income per capita I, 1990 G-K $
6
7
8
9
10
1870 1890 1910 1930 1950 1970 1990
ItalyNorw ay
Netherlands
Japan
c
6
7
8
9
10
1870 1890 1910 1930 1950 1970 1990
USA
UK
Sw itzerlan
Sw eden
d

International Economics: Theory, Application, and Policy, Ch. 16; Charles van Marrewijk, 2006 12
Figure 16.9 Log income per capita II, 1990 G-K $
5
6
7
8
9
10
1870 1890 1910 1930 1950 1970 1990
Argentina
BrazilChile
Bangladesh
a
5
6
7
8
9
10
1870 1890 1910 1930 1950 1970 1990
Colombia
Indonesia India
China
b
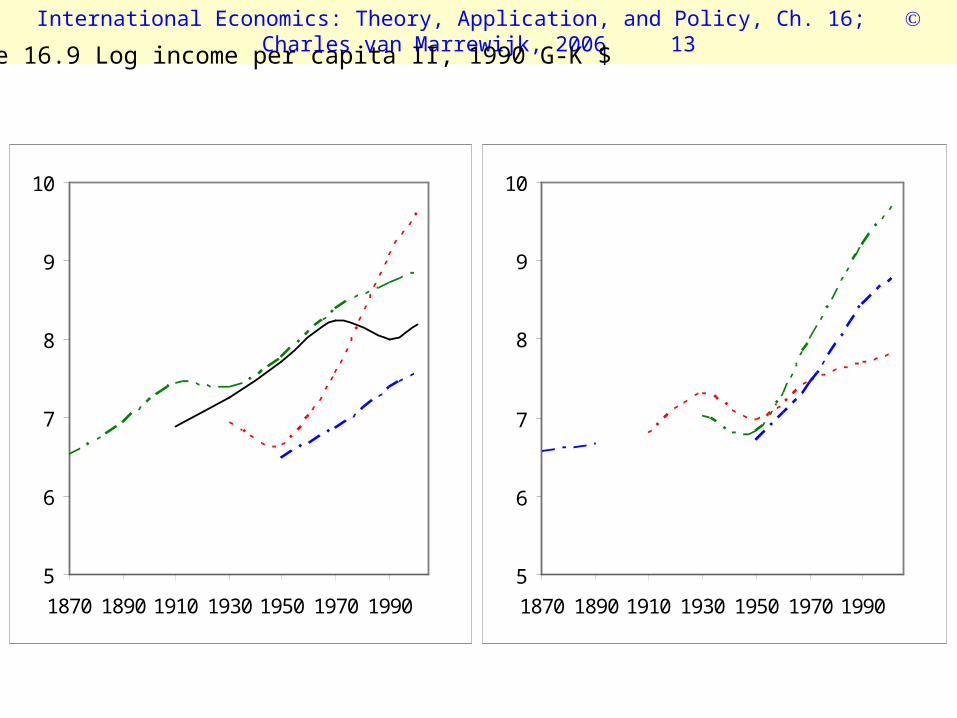
International Economics: Theory, Application, and Policy, Ch. 16; Charles van Marrewijk, 2006 13
Figure 16.9 Log income per capita II, 1990 G-K $
5
6
7
8
9
10
1870 1890 1910 1930 1950 1970 1990
Korea
Peru
Mexico
Pakistan
c
5
6
7
8
9
10
1870 1890 1910 1930 1950 1970 1990
Taiw an
Philippines
Thailand
d
International Economics: Theory, Application, and Policy, Ch. 16; Charles van Marrewijk, 2006 14
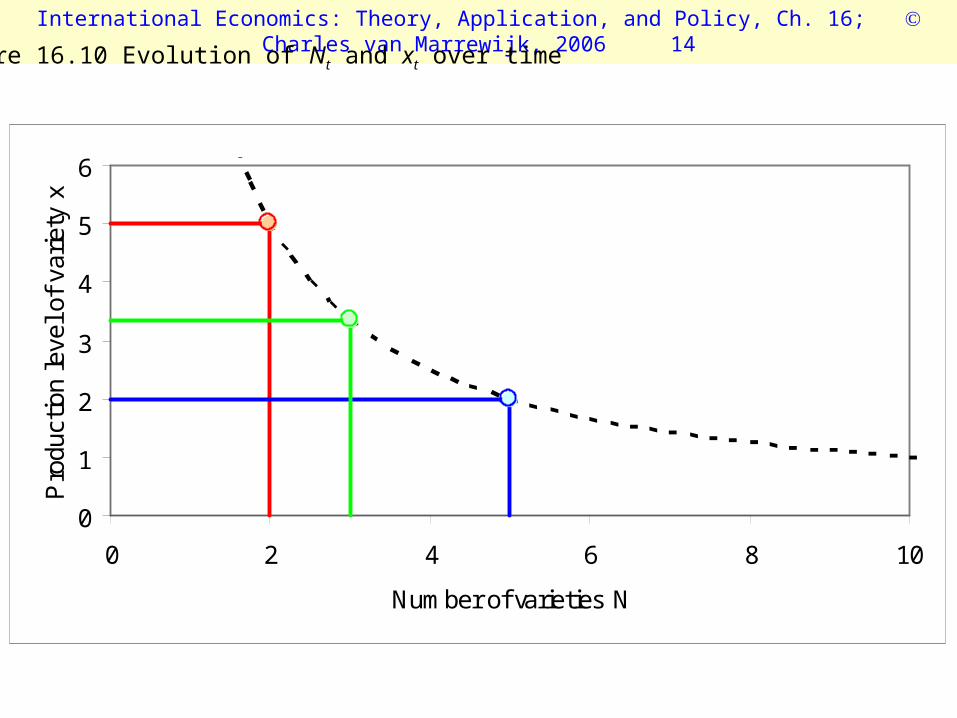
Figure 16.10 Evolution of Nt and xt over time
0
1
2
3
4
5
6
0 2 4 6 8 10
Number of varieties N
Pro
duct
ion
leve
l of
varie
ty x
t0
t1
t2

International Economics: Theory, Application, and Policy, Ch. 16; Charles van Marrewijk, 2006 15
Figure 16.11 Evolution of agglomeration, the Herfindahl index
Herfindahl index
0
0.1
0.2
0.3
0.4
0.5
0 200 400 600 800
reallocation
International Economics: Theory, Application, and Policy, Ch. 16; Charles van Marrewijk, 2006 16
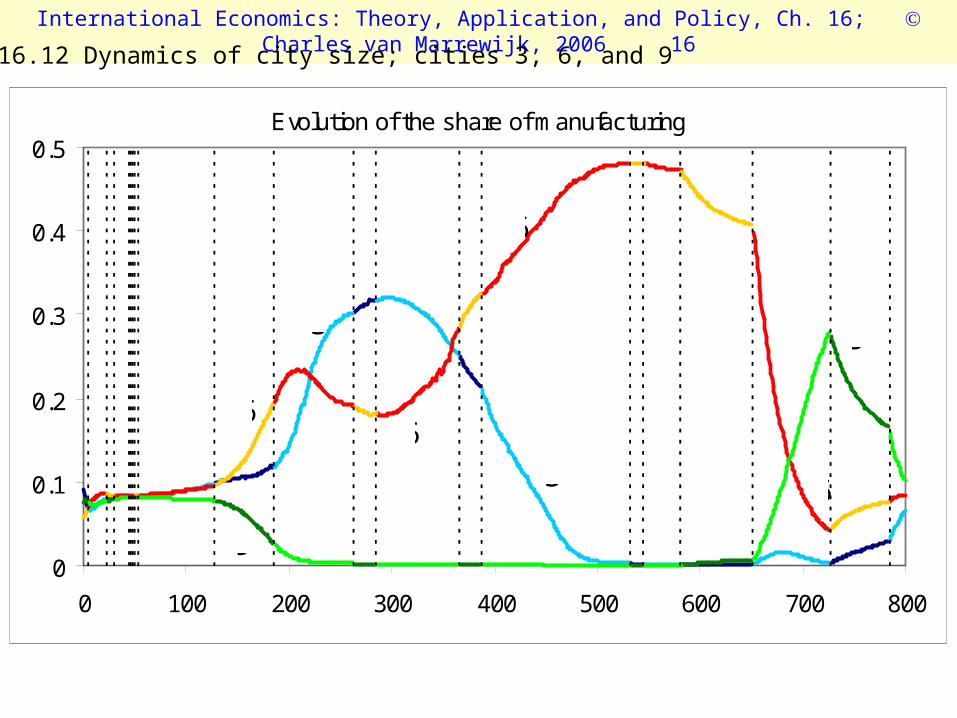
Figure 16.12 Dynamics of city size; cities 3, 6, and 9
Evolution of the share of manufacturing
0
0.1
0.2
0.3
0.4
0.5
0 100 200 300 400 500 600 700 800
3
6
9
3
66
6
9
International Economics: Theory, Application, and Policy, Ch. 16; Charles van Marrewijk, 2006 17
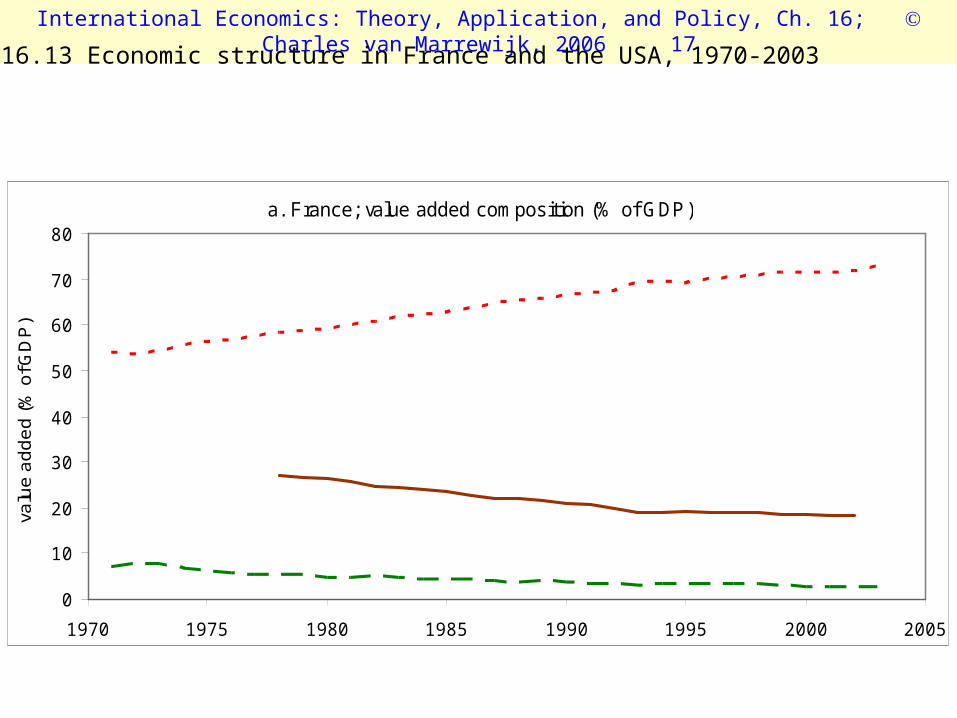
Figure 16.13 Economic structure in France and the USA, 1970-2003
a. France; value added composition (% of GDP)
0
10
20
30
40
50
60
70
80
1970 1975 1980 1985 1990 1995 2000 2005
valu
e a
dd
ed
(%
of G
DP
)
s ervices
m anufacturing
agriculture
International Economics: Theory, Application, and Policy, Ch. 16; Charles van Marrewijk, 2006 18
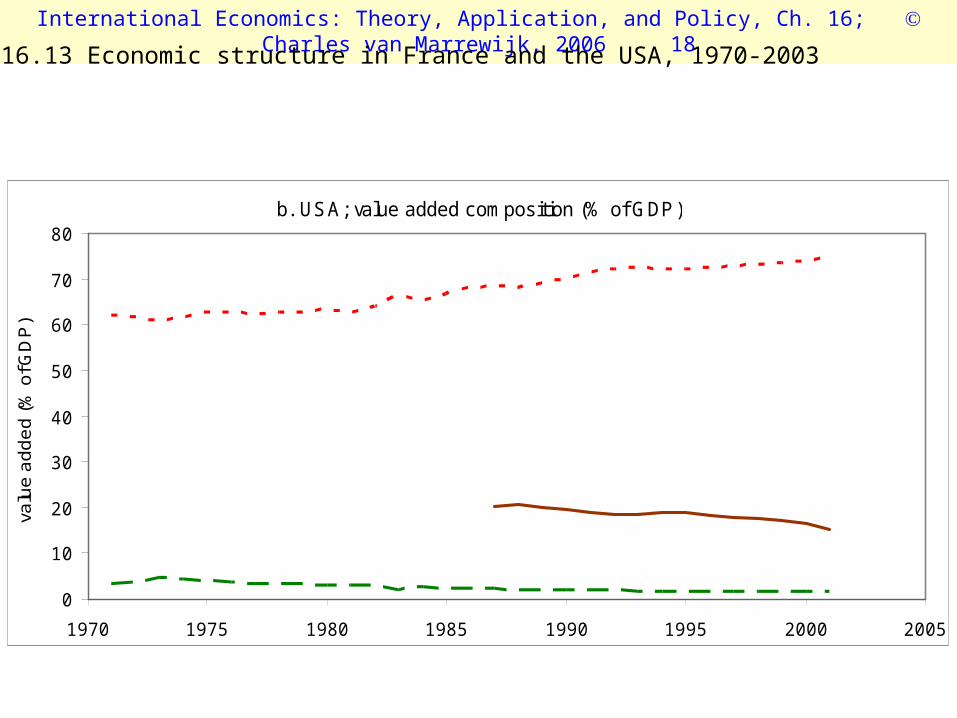
Figure 16.13 Economic structure in France and the USA, 1970-2003
b. USA; value added composition (% of GDP)
0
10
20
30
40
50
60
70
80
1970 1975 1980 1985 1990 1995 2000 2005
valu
e a
dd
ed
(%
of G
DP
)
s ervices
m anufacturing
agriculture

International Economics: Theory, Application, and Policy, Ch. 16; Charles van Marrewijk, 2006 19
Figure 16.14 Economic structure in Brazil, China, and India, 1960-2003
a. Brazil; value added composition (% of GDP)
0
10
20
30
40
50
60
70
80
1960 1965 1970 1975 1980 1985 1990 1995 2000 2005
valu
e a
dd
ed
(%
of G
DP
)
s ervices
m anufacturing
agriculture
International Economics: Theory, Application, and Policy, Ch. 16; Charles van Marrewijk, 2006 20
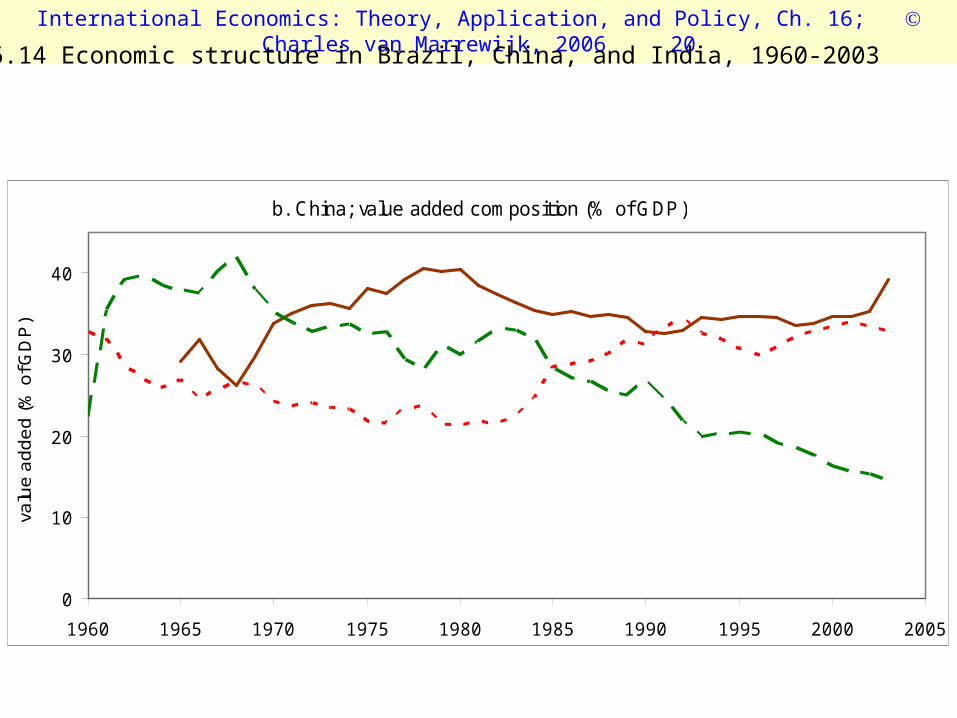
Figure 16.14 Economic structure in Brazil, China, and India, 1960-2003
b. China; value added composition (% of GDP)
0
10
20
30
40
1960 1965 1970 1975 1980 1985 1990 1995 2000 2005
valu
e a
dd
ed
(%
of G
DP
)
s ervices
m anufacturing
agriculture

International Economics: Theory, Application, and Policy, Ch. 16; Charles van Marrewijk, 2006 21
Figure 16.14 Economic structure in Brazil, China, and India, 1960-2003
c. India; value added composition (% of GDP)
0
10
20
30
40
50
60
1960 1965 1970 1975 1980 1985 1990 1995 2000 2005
valu
e a
dd
ed
(%
of G
DP
)
s ervices
m anufacturing
agriculture