international food and agribusiness management - agecon search
TRANSCRIPT

International Food and Agribusiness Management Review
Volume 10, Issue 2, 2007
The Joint Impact of Supply Chain Integration and Quality Management on the Performance of Pork Processing
Firms in China
Jiqin Han a , S. W. F. (Onno) Omta b, and Jacques H. Trienekens c
a PhD candidate, Management Studies, Wageningen University, Hollandseweg 1, Wageningen, 6706 KN, Netherlands.
b Professor, Management Studies, Wageningen University, Hollandseweg 1, Wageningen, 6706 KN, Netherlands.
c Associate Professor, Management Studies Group, Wageningen University, Hollandseweg 1, Wageningen, 6706 KN, Netherlands.
Abstract It is widely acknowledged that competition is no longer between individual firms, but between supply chains. A number of studies have indicated that supply chain integration and quality management have become essential to obtain competitive advantage. The present study tests the relationships among supply chain integration, quality management practices and firm performance in 229 Chinese pork slaughterhouses and processors using structural equation modeling. The most important results are that quality management is positively linked with firm performance. As managers put it “Quality is the life of the enterprise”. Pork processing managers that wish to improve their performance are therefore advised to invest in quality management. Equally interesting is the indirect link of supply chain integration through quality management with firm performance. To improve quality of their products and reduce uncertainty in hog supply chains, companies are advised to develop more integrated relationships with their suppliers. However, in contrast to earlier studies, the direct link of supply chain integration and firm performance was not significant. This result may indicate that the Chinese pork processing industry is still in an early stage of SC integration. Keywords: Supply chain management, quality management practices, pork supply chains, firm performance, China
Corresponding author: Tel: + 86-25-8439-5727 [email protected] Email:
[email protected] Other contact information: S.W.F. Omta: ; J. Trienekens: [email protected]
© 2007 International Food and Agribusiness Management Association (IAMA). All rights reserved. 67

Han, et al. / International Food and Agribusiness Management Review Volume 10, Issue 2, 2007
Introduction Supply chain management (SCM) and total quality management (TQM) are two important tools that manufacturing companies use to achieve competitive advantage (Sila et al., 2006). These two concepts are discussed extensively in both theoretical and empirical contexts. Since competition is no longer between individual firms, but between supply chains, the understanding and practicing of SCM has become an essential prerequisite for staying competitive in the global race and for enhancing profitability (Power et al., 2001). The enhancement of organizational performance should be attained through closely integrating the internal functions within a company and effectively linking them with the external operations of suppliers, customers and other channel members (Kim, 2006). Much like the recent emergence of SCM initiatives, the topic of quality management and improvement and the contribution of quality management practices to firm performance has dominated most manufacturing and service organizations. However, the number of studies interlinking SCM and quality management are still limited (Robinson and Malhotra, 2005). In the struggle for marketplace advantage, academic researchers and practitioners need to move from the traditional firm and product based mindset to an inter-organizational supply chain orientation involving customers, suppliers and other partners (Robinson and Malhotra, 2005). Traditional quality programs focus on quality management schemes, like total quality management, HACCP, and ISO 9001 (international quality management system standards). Nowadays, more and more companies apply a supply chain management philosophy to benefit from supply chain partnerships and quality improvement gains critical to customer satisfaction. In addition to addressing the relationship between quality management practices (QMP) and firm performance and SCM and firm performance, this study will also examine the interaction between SCM and quality management. The study domain of this paper is the pork processing industry in China. Since the government removed state procurement quotas and price control in 1985, fundamental changes have taken place in the pork sector. It has become the largest pork production and consumption country in the world since the early 1990s. The total output of pork production reached 48.8 million tons in 2005, accounting for approximately 46.1% of the total pork production in the world. The Chinese people consume about half of the total amount of pork products in the world (China Statistics Yearbook, 2006). Although pork consumption has the tendency of decreasing in the last two decades, it is still the most popular meat in China, accounting for about 65% of the major meat products in 2005 (China Statistics Yearbook, 2006). Based on current pork consumption at various income levels, it is estimated that pork consumption will grow more than 7% in Chinese cities and 1.5% in the countryside over the next ten years. This generates an additional 12 million pounds of pork in 2011 (Pan and Kinsey, 2002). With the increasing income
© 2007 International Food and Agribusiness Management Association (IAMA). All rights reserved. 68

Han, et al. / International Food and Agribusiness Management Review Volume 10, Issue 2, 2007
and changing life styles generated by rapid economic and social development, the pork industry will be driven to emphasize safety, quality and convenience. However, the current pork industry is characterized by the dominant position of the 80% of small household hog producers and a large number of small slaughterhouses. Traditional spot market transactions are still the most popular market channel that farmers use in selling their hogs (Zhou and Dai, 2005). The organization of the pork processing industry induces problems in tracking and tracing pork from “field to table”, and eventually results in potential quality and safety problems. In recent years, some leading meat processing companies like Shineway and Yurun Co. Ltd. have established closer vertical coordination mechanism with their suppliers and retailers and invested heavily in developing cold chains to provide consumers with brand products. Will this kind of inter-organizational supply chain orientation and quality management improve firm performance? Will the level of supply chain integration facilitate the implementation of quality management in these companies? These are the main questions that this paper will address in order to identify critical success factors for competitiveness of pork processing firms in China. To the best of our knowledge, there has been no empirical study on this issue in the pork processing sector by using survey methodology in China. This paper attempts to fill in this gap by examining the relationship among supply chain integration, quality management practices and firm performance in the upstream pork supply chain in China. In Section 2 we present the literature review on SCM, QMP and firm performance and describe a theoretical model that relates SCM and QMP to firm performance. Thereafter, the three constructs and the hypotheses are discussed. In Section 3 we present the instrument development and a description of the study sample. In Section 4 the methods to assess construct validity and reliability are first discussed. Once an acceptable measurement model is obtained, the hypothesized structural model will be tested using structural equation modeling techniques. In Section 5 our findings in the pork processing industry will be evaluated in the light of earlier studies, and the conclusions will be drawn. Finally, in Section 6, suggestions for further research and the implications for pork supply chain management are presented.
Theory and Research Hypotheses This part will present the theory of SCM and quality management. The presentation will include the literature review on the relationships among supply chain integration (SCI), quality management practices and firm performance. Hypotheses will be developed and the section will end with a conceptual framework of the research.
© 2007 International Food and Agribusiness Management Association (IAMA). All rights reserved. 69

Han, et al. / International Food and Agribusiness Management Review Volume 10, Issue 2, 2007
Supply Chain Management and Firm Performance Supply chain management (SCM) seeks to enhance competitiveness by closely integrating the internal functions within a company and effectively linking them with the external operations of suppliers, customers and other channel members. It has been credited as being helpful to cut costs (Mainardi et al. 1999), increase productivity (Gryna 2001) and reduce risk (Chase et al. 2000). Among the addressed benefits, improving profitability and strengthening organizational competitiveness are repeatedly mentioned (Fisher 1997, Christopher, 2000; Wisner and Choon, 2000; Kim, 2006). Industrial sectors, such as vehicle manufacturing and retail distribution, have made significant progress towards more efficient and closely integrated supply chains (Briscoe, 2005). The benefit of SCI can be attained through effectively linking various supply chain activities. This linkage should be subject to the effective construction and utilization of various supply chain practices. SCM practices have been defined as a set of activities undertaken in an organization to promote effective management of its supply chain (Li et al., 2006). Li et al. (2006) listed several studies on the dimensions of SCM practices. For example, Tan et al. (2002) identified six aspects of SCM practices through factor analysis: supply chain integration, information sharing, supply chain characteristics, customer service management, geographical proximity and JIT capability. Chen and Paulraj (2004) use supplier base reduction, long-term relationship, communication, cross-functional teams and supplier involvement to measure buyer-supplier relationships. When summarizing all these studies, we can notice that the literature portrays SCM practices from a variety of different perspectives with a common goal of ultimately improving organizational performance (Li et al., 2006). The performance of each supply chain practice should be evaluated depending on how the practice has a significant effect on the efficient integration of the supply chain (Kim, 2006). Bowersox (1989) asserts that the process of SCI should progress from the integration of internal logistics processes to external integration with suppliers and customers. This internal integration can be accomplished by automation and standardization of internal logistics functions, the introduction of new technology, and continuous performance control under a formalized and centralized organizational structure. External integration can be achieved by information sharing and strategic linkage with suppliers and customers, and the standardization of logistics processes between firms. Based on these discussions, our study will focus on the following five main SC integration activities of pork processors: internal integration, external integration, supplier-buyer relationship coordination, integrated information technology and integrated logistics management, and their relationships with firm performance. SCI should engender superior performance (e.g. Tan et al., 1998; Frohlich and Westbrook, 2001). Vickery et al. (2003) also mentioned a growing body of literature that has suggested a positive relationship between the degree of integration across the supply chain and firm performance (e.g. Stevens, 1989, Lee et al., 1997; Frohlich
© 2007 International Food and Agribusiness Management Association (IAMA). All rights reserved. 70
Han, et al. / International Food and Agribusiness Management Review Volume 10, Issue 2, 2007
& Westbrook, 2001). Wood (1997) also indicated that integration of the supply chain could improve both profit potential and competitive position. Therefore it is hypothesized: H1: There is a positive relationship between SCI and performance of pork processing firms in China. Quality Management Practices and Firm Performance To cope with the competitive environment, many companies have applied quality assurance systems. The importance of quality and its associated benefits such as improvements in customer satisfaction have been well acknowledged (e.g., Hendricks and Singal, 1997). Madu et al. (1995) studied QM practices in Taiwan's manufacturing firms. They found a significant causal relationship between quality dimensions (i.e., customer satisfaction, employment satisfaction, and employee service quality) and organizational performances. In their research on total quality management practices in the largest US firms, Mohrman et al. (1995) found that 83% of the surveyed companies had a “positive or very positive” experience with QM, and 79% planned to “increase or greatly increase” their QM initiatives in the next 3 years. Most of the TQM practices are related to one form of performance improvement or the other, e.g. productivity, quality of products, customer service, profitability and competitiveness. Kuei and Madu (2001) note that the focus of the quality-based paradigm has shifted from the traditional company-centered setting to complete supply chain systems. A number of articles offer insights on the critical success factors for achieving quality ‘in-house’ management and in a broader supply chain context. For example, Saraph et al. (1989) reported that eight critical factors could be used for QM assessment, namely the role of the quality department, training, product/service design, supplier quality management, process management, quality data and reporting, and employee involvement. However, a survey by A. T. Kearney of 100 British firms and a survey of the executives in US manufacturing and service firms revealed that only 20-30% believed that TQM made them more competitive (Economist, 1992, Mathews and Katel, 1992). Dooyoung et al. (1998) also reported estimates of QM failure rates as high as 60-67%. These mixed findings put forward the necessity to study the QM practices-performance link in companies of various size, not only big companies. The objective of quality management efforts should be focused on achieving customer satisfaction. Performance outcomes are driven by quality management practices (QMP), which in turn lead to customer satisfaction (Choi & Eboch, 1998). To identify the impact of quality management practices on firm performance, it is hypothesized: H2: There is a positive relationship between QMP and performance of pork processing firms.
© 2007 International Food and Agribusiness Management Association (IAMA). All rights reserved. 71

Han, et al. / International Food and Agribusiness Management Review Volume 10, Issue 2, 2007
According to literature review, the quality management practices will consist of the following four sub-measurements: management leadership, supplier quality management, quality design and process management. Supply Chain Integration and Quality Management Practices Organizations world-wide recognize the requirement to improve product quality to succeed in the competitive international market place. They also realize that the involvement of suppliers is critical to improve quality and to meet customer specifications (Wong et al., 1999). Therefore it is imperative to study the dynamics of quality management in a supply chain context (e.g. Ellram, 1991; Bamford, 1994). The integration of the upstream supply chain in the meat industry is particularly important since the outbreaks of animal diseases such as Foot and Mouth disease and BSE. Previous research (Fearne, 1998, 2000; Palmer, 1996) has highlighted the importance of greater vertical coordination within meat supply chains in order to reduce risk and uncertainty, improve quality and foster value creation (Taylor, 2006). However, the industry is dogged by adversarial relationships and a commodity culture that makes it hard for companies, particularly upstream, to reach a position of sustainable profitability (Simon et al., 2003). In other meat sectors studied, a stress on the relationship between close chain coordination and product quality has also been noticed. For example, Klein et al. (1996) asserted that one of the two primary steps that were regarded essential to ensure better Canadian pork quality was excellent communication and teamwork among all sector participants through the formation of strategic alliances or vertical integration. In the study of Hobbs (1998), a coordinated approach to production, processing and marketing was regarded as the driving force for the Danish pork industry to remain one of the most successful industries in the world. This approach was built on a thorough understanding of the requirements of different markets, a dedication to quality which includes the ability to provide a consistent and reliable supply of high quality products tailored to the needs of different markets. Co-operation between players at different stages of the supply chain enables information to be disseminated effectively and efficiently throughout the supply chain. In a study of 38 UK firms, Armistead and Mapes (1993) indicate that the level of SCI improves quality and operating performance. Thus, we formulate the following hypothesis: H3: The level of SCI is positively related to quality management practices in pork processing firms in China.
© 2007 International Food and Agribusiness Management Association (IAMA). All rights reserved. 72

Han, et al. / International Food and Agribusiness Management Review Volume 10, Issue 2, 2007
Firm Performance Indicators In literature much attention has been devoted to three main aspects of performance: financial, organizational and strategic performance. Organizational theory offers three approaches to measure organizational effectiveness or performance (Murphy, Trailer and Hill, 1996), namely the goal-based, systems and multiple constituency approach. After comparing different measures of performance, they suggest that multiple dimensions of performance should be considered where possible, including both financial and non-financial measures. Accounting-based indicators, with efficiency, sales growth rate and profitability (e.g. return on sales or on investments) are the financial indicators most commonly used (Murphy, Trailer and Hill, 1996). In addition, operational (non-financial) performance measures, such as product quality, customer satisfaction and market shares are often examined. Our research uses both financial and non-financial indicators to measure performance. The indicators we use to measure performance of pork processing firms are: growth rate, market share, profitability and customer satisfaction. Research Methodology The research framework of this study is shown in Figure 1. Supply chain integration and quality management initiatives and their relationships form the core of this research. The focus of the research is on the buying firms and their most important suppliers. The approach of surveying the buying firms’ top purchasing and supply management executives to study buyer-supplier relationships has been widely practiced in the field of operations management (Carr and Pearson, 1999, Shin et al., 2000). Therefore the survey methodology was employed to set up the quantitative part of empirical research and to collect data to test the hypotheses developed in this research. To test the measurement model and the structural model of this research, structural equation modeling (SEM) was used. SEM is one of the most applied and consolidated means of testing relations and causality in the field of buyer-supplier relationships (Malhorta et al., 1999). The advantage of SEM over standard regression analysis (i.e. OLS) is its explicit consideration of the measurement error in the indicators and simultaneously estimation of a system of structural equations. Moreover, SEM is a powerful method for testing causal models, because it enables the simultaneous evaluation of the individual paths constituting the model, total effects and the complete model's goodness-of-fit (Hair et al. 1998). In the next part, we will describe the process of scale development and determining the validity and reliability of the research constructs. Afterwards, the results of measurement model and structural model will be described.
© 2007 International Food and Agribusiness Management Association (IAMA). All rights reserved. 73

Han, et al. / International Food and Agribusiness Management Review Volume 10, Issue 2, 2007
Supply Chain
Integration
Firm Performance
H1
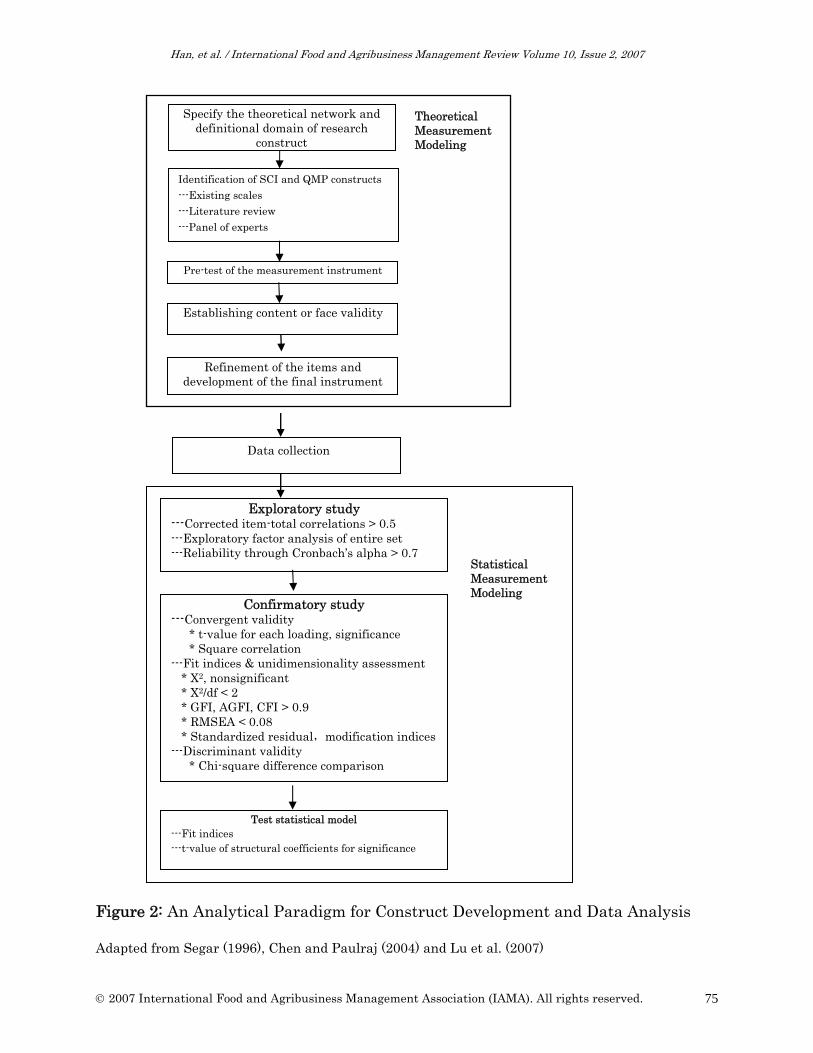
Figure 1: Research Framework. Construct Measures Figure 2 illustrates the analytical steps for scale development which incorporates aspects of both theoretical and statistical modeling to achieve construct validity and reliability as well as hypotheses testing. This paradigm is an amalgamation of similar frameworks of Segars (1996), Chen and Paulraj (2004), and Lu et al. (2007). A valid and reliable construct is very critical for research. Multiple scale items for each of the factors in the constructs are developed. As noted by Churchill (1979), many variables of interest are inherently complex in nature; therefore, they cannot be accurately measured with a single scale. Single measures typically contain considerable uniqueness and subsequently low correlation with the attribute being measured. Additionally, single items tend to frame concepts narrowly resulting in considerable measurement error. Multiple measures can overcome these difficulties. The specificity of individual items can be averaged out and more robust conceptualizations of complex variables can be developed thereby reducing measurement error (Segars, 1997). The scale development for the construct SCI was adapted from Chen and Paulraj (2004) and Segars (1997). It has five sub-constructs: internal integration, external integration, supplier-buyer relationship coordination, integrated information technology and integrated logistics management. Items on QMP were mainly derived from Saraph et al. (1989). We initially identified four sub-measurements to measure QMP: management leadership, supplier quality management, quality design and process management. Items on firm performance were mainly from Claro et al. (2004). Based on their studies and through interviews with practitioners, the items for the sub-measurements of the constructs were developed. Where appropriate, additional items were created to cover the domain of the constructs. Altogether 37 items were generated to measure the upstream pork SCI and QMP and 5 items for firm performance. A seven-point Likert scale was used where 1=not agree at all, 4=neutral and 7=totally agree. The scale was evaluated by practitioners and academicians in a formal pre-test study in order to establish construct validity. These were general managers from meat processing industries and professors from economics and management, food science and technology at Nanjing Agricultural University in China. In addition, the scales were pilot tested in 10 pork processing companies through structured interviews. Based
H3
H2 Quality Management Practices
© 2007 International Food and Agribusiness Management Association (IAMA). All rights reserved. 74
Han, et al. / International Food and Agribusiness Management Review Volume 10, Issue 2, 2007
Specify the theoretical network and definitional domain of research
construct
Identification of SCI and QMP constructs ---Existing scales ---Literature review ---Panel of experts
Pre-test of the measurement instrument
Establishing content or face validity
Refinement of the items and development of the final instrument
Theoretical Measurement Modeling
Data collection
Exploratory study Corrected item-total correlations > 0.5
---Exploratory factor analysis of entire set ---Reliability through Cronbach’s alpha > 0.7
---
Figure 2: An Analytical Paradigm for Construct Development and Data Analysis Adapted from Segar (1996), Chen and Paulraj (2004) and Lu et al. (2007)
Confirmatory study ---Convergent validity
* t-value for each loading, significance * Square correlation
---Fit indices & unidimensionality assessment * X2, nonsignificant * X2/df < 2 * GFI, AGFI, CFI > 0.9 * RMSEA < 0.08 * Standardized residual,modification indices ---Discriminant validity
* Chi-square difference comparison
Test statistical model ---Fit indices ---t-value of structural coefficients for significance
Statistical Measurement Modeling
© 2007 International Food and Agribusiness Management Association (IAMA). All rights reserved. 75
Han, et al. / International Food and Agribusiness Management Review Volume 10, Issue 2, 2007
revised instrument which contained 35 items for constructs SCI and QMP and 4 on suggestions by the managers, items were added, changed, or deleted to form a items for firm performance. The measurement items and indicators for this study are shown in Appendix A. Data Collection During the pre-test period, it turned out that it was difficult to get questionnaires back from the meat processing companies through post. The companies in China are still not used to answer mail questionnaires. Therefore the survey was carried out by students from Nanjing Agricultural University majoring in marketing, management and animal sciences, during the winter and summer vacations in 2005. As China is a big country, our research only focused on the eastern two provinces and one direct jurisdiction district of the central government of China, namely Jiangsu province, Shandong province and Shanghai. Four training sessions were organized for the students who were willing to do the survey. Each lasted for two hours. The students were divided into small groups to improve the effectiveness of the training. A written guideline on how to do the survey was distributed to the students. After explaining the research background and the questions to be asked, students were asked to work in pairs to practice the roles as respondent and interviewer. A stratified sampling technique was deemed appropriate to collect the data after consultation of experts and professionals in the pretest. They provided valuable information on the distribution of the pork slaughtering and processing firms in the sampling areas. Cities include pork slaughtering and processing companies of various sizes, in the villages, small scale slaughterhouses prevail. Eighty eight cities were selected. A list of pork slaughtering and processing firms was provided by the meat associations of the Jiangsu and Shandong provinces. As the members of the meat association are usually large and medium size companies, students were asked to also pay attention to the small firms in the sector. The list of pork slaughtering houses, including small companies, could be obtained from the Designated Pork Slaughtering Administration Office in their cities. Students were taught to use the method of systematic sampling techniques for selection of slaughterhouses. Two rounds of telephone contacts were conducted during the surveys. The first two rounds produced 202 questionnaires. Among these, twenty were not completed by the companies and therefore were useless. In the second round, another 56 questionnaires were returned. Among these, nine were useless. Therefore, the sample base for the empirical research was 229 questionnaires.
© 2007 International Food and Agribusiness Management Association (IAMA). All rights reserved. 76

Han, et al. / International Food and Agribusiness Management Review Volume 10, Issue 2, 2007
Table 1: Profile of the Respondent Companies (n=229) Characteristics of the respondents Number Percentage Job Title (n=229) General or Deputy General Managers 93 40.6 Quality Control Managers 49 21.4 Sales Managers 39 17.0 Head of the Office and Others 48 21.0 Organizational Status (n=229) State-owned 32 14.0 Collective 31 13.5 Private 70 30.6 Joint Venture 16 7.0 Private and Share Holding 80 34.9 Main Business (n=227) Slaughterhouses 94 41.0 Further Processing 60 26.2 Slaughtering/Processing 73 31.9 Employees (n=229) Below 50 48 21.0 51-100 48 21.0 101-499 93 40.6 More than 500 40 17.5 Level of Turnover (1,000 Euros) (n=229) Below 500 47 20.5 501-3,000 82 35.8 3,001-30,000 82 35.8 Greater than 30,000 18 7.9 Characteristics of Respondents A comparison of the early and the late respondents was carried out to test for the non-response bias (Armstrong and Overton, 1977). T-tests were performed on the responses of the early and late respondents. At the 5% confidence level, there were no significant differences between the responses of these groups. This suggests that non-response was not a major problem in our sample. The profiles of the respondents and their company characteristics are displayed in Table 1. The results show that 40.6% of the participants in the survey were general and deputy general managers, indicating a good quality of the respondents, who should have a clear understanding of what practices their firms use with regard to their relationships with their most important suppliers. As for the status of the organizations, private industry is developing very fast. Our survey also proved this, with 65.5% of the firms being privately owned or private share holding companies.
© 2007 International Food and Agribusiness Management Association (IAMA). All rights reserved. 77

Han, et al. / International Food and Agribusiness Management Review Volume 10, Issue 2, 2007
The survey on the business scope of the firms showed that 41% of the firms were slaughterhouses and 31.9% were integrated slaughtering and processing companies. Processors only accounted for 26.2% of the sample. The respondents were also asked to provide information about the number of employees and the level of turnover which indicate the scales of these companies. The results in Table 1 indicate that 40.6% of the companies had 100 to 500 employees. In China, companies are called “scaled companies” if their annual turnover is more than 500,000 euros. The number of companies with a turnover ranging from 500,000 euros to 30 million euros was 71.6%. In our sample, 7.9% of the companies had a yearly turnover of more than 30 million euros. Data Analysis Based on studies of Koufteros (1999), the following section will discuss statistical analysis used to determine the validity and reliability of each construct. The methods employed for the development of exploratory evaluation of the measurement scales for the two latent variables of SCI and QMP in this study is shown in Table 2. They included corrected item-total correlations, exploratory factor analysis and reliability estimation using Cronbach’s alpha. The description of these methods will be given in combination with the data analysis of this research.
Exploratory Factor Analysis
As our constructs SC integration and QMP were based on previous research to enhance validity, we first conducted a principal component analysis with oblique rotation for these constructs to see whether the items fell under the defined constructs. The result for SCI construct turned out to be four factors for SC integration with integrated information technology and integrated logistics management into one factor. By looking at the questions, we found an interrelationship between these two sub-measurements. The result for QMP was also different. There were five factors. It was more appropriate to rename the first dimension as “incompany quality management” (coded as QMP1, QMP6 and QMP8) and the new factor into “employee involvement into quality management” (coded as QMP3, QMP4, QMP5 and PM2). The other three factors still had the same name, but with different items. Table 2 showed the result of the factor analysis. We then checked the item-total correlation which refers to a correlation of an item or indicator with the composite score of all the items forming the same set. We used the corrected item-total correlation that does not include the score of the particular item in question when calculating the composite score (Koufteros, 1999). The results of the analysis for the scales of SCI and QMP was also shown in Table 2. Each scale was purified by eliminating items if their corrected item-total correlation was less than 0.50 (Koufteros, 1999; Lu et al., 2007). In the next step, we did an exploratory factor analysis to assess the dimensionality
© 2007 International Food and Agribusiness Management Association (IAMA). All rights reserved. 78

Han, et al. / International Food and Agribusiness Management Review Volume 10, Issue 2, 2007
of the remaining items using principal component analysis with oblique rotation. A factor loading can be used as an indicator in interpreting the role each item plays in defining each factor. Factor loadings are in essence the correlation of each item to their underlying construct (Lu et al. 2007). We use 0.40 as a cut-off for exploratory factor analysis. Items that are not pure (e.g. items with cross loadings) are eliminated. It is desired that the coefficient alpha is above 0.70 for established scales and 0.60 for new scales (Churchill, 1979). We didn’t find any cross-loading Table 2: Corrected-item Total Correlations, Factor Loadings and Cronbach’s Alpha for SCM Construct (n=229)
Item code Corrected--item total correlation
Factor loadings Factor Cronbach’s alpha
Integ1 .640 -.788 Integ2 .665 -.871 Integ3 .610 -.606
Internal integration .787
Exint1 .536 .819 Exint2 .632 .869 Exint3 .700 .760 Exint4 .519 .525
External integration .773
Coord1 .550 .907 Coord2 .500 .652 Coord3 .503 .750 Coord4 .263
Buyer- Supplier
Relationship Coordination
.658
Infoup - .920 Logis1 .700 .815 Logis2 .570 .928 Logis3 .703 .686
Integrated IT & logistics management .855
QMP1 .629 .713 QMP6 .780 .904 QMP8 .752 .800
Incompany quality management .849
QMP3 .634 .813 QMP4 .394 QMP5 .577 .747 PM2 .542 .885
Employee involvement .750
SQM1 .658 .894 SQM2 .569 .769 SQM3 .150 SQM4 .629 .689
Supplier quality management .778
QMP2 .454 QMP7 .522 .887
Design1 .591 .753 Design2 .502 .790
Product/service design .714
QM1 .644 .861
PM3 .644 .808 Process management .783
© 2007 International Food and Agribusiness Management Association (IAMA). All rights reserved. 79

Han, et al. / International Food and Agribusiness Management Review Volume 10, Issue 2, 2007
factors. However, the factor loading of Exintup4 was below 0.60, and was subsequently eliminated. The percentage of variance explained of the four factors for SCM accounted for 69.35% of the variance, while the percentage of variance explained of the five factors for QMP accounted for 65.66% of the variance. This may indicate that our two constructs have a good unidimensionality. Cronbach’s alpha has several disadvantages, including the fact that it is inflated when a scale has a large number of items, and it assumes that all of the measured items have equal reliability (Gerbing and Anderson, 1988). Despite of these shortcomings, it is still one of the most widely used measures for evaluating reliability (Hair et al., 1998; Koufteros, 1999). Table 2 shows the Cronbach’s alpha value for each factor. Except for the factor “buyer-supplier relationship coordination” which has a reliability value of 0.658, the reliability value for all the other factors was above 0.70, which is considered satisfactory (Hair et al., 1998). According to Gerbing and Anderson (1988) and Segars and Grover (1993), exploratory factor analysis does not provide an explicit test of unidimensionality as each factor from an exploratory analysis is defined as a weighted sum of all observed variables in the analysis. In addition, O’Leary-Kelly and Vokurba (1998) point out that exploratory factor models do not provide any explicit test statistic for assessing convergent and disciminant validity. Therefore, we will discuss in the next part the assessment of unidimensionality and other properties related to construct validity and reliability through confirmatory factor analysis (CFA).
Results for the Measurement Model Confirmatory Factor Analysis CFA involves the specification and estimation of one or more hypothesized models of factor structure, each of which proposes a set of latent variables (factors) to account for covariances among a set of observed variables (Koufteros, 1999). The path diagram for the SCM construct with four latent variables is presented in Figure 3. A similar path diagram can be drawn for the QMP construct. To save space, this is not illustrated here. According to the convention of AMOS analysis (Arbuckle, 1997), observed variables are represented by squares and latent variables by circles and labeled with the Greek lettersξ. The Greek letterδis seen as error in manifest or observed variables. A straight arrow pointing from a latent variable to an observed variable indicates the causal effect of the latent variable on the observed variable (Lu et al., 2007). It is worth to mention that on the estimation of the measurement model of constructs with more than one item (actually preferable in structural equation modeling), one of the loadings in each construct can be set to a fixed value of 1.0 in order to make the constructs comparable (Joreskog and Sorbom, 1996).
© 2007 International Food and Agribusiness Management Association (IAMA). All rights reserved. 80

Han, et al. / International Food and Agribusiness Management Review Volume 10, Issue 2, 2007
Figure 3: Path Diagram of the Measurement Model of SCI
ξ3 Buyer-supplier
relationship coordination
1
Coord1
δ6
δ δ7
ξ1 Internal integration
ξ2 External integration
Integ3
Extint1
Extint2
Extint3
Integ1
Integ2 δ2
δ3
δ4 δ5
δ1
δ4
Coord2
ξ4 Integrated IT &
logistics integration
Coord3
Infoup
Logis1
Logisup2
Logisup3
δ8 δ9
δ11
δ12
δ13
δ10
1
1
1
Convergent Validity and Item Reliability Convergent validity measures the similarity or convergence between the individual items measuring the same construct. It can be assessed by using EFA and CFA. In the exploratory factor analysis both constructs have achieved convergent validity. In CFA, convergent validity can be assessed by examining the loadings and their statistical significance through t-values (Dunn et al., 1994). In the AMOS text output file, the t-value is the critical ratio (C.R.), which represents the parameter estimates divided by its standard error. A t-value greater than 1.96 or smaller than -1.96 implies statistical significance (Byrne, 2001). On the first-order level of measurement models, the proportion of variance (R2) in the observed variables that is accounted for by the latent variables influencing them can be used to estimate the reliability of a particular observed variable (term). R2
© 2007 International Food and Agribusiness Management Association (IAMA). All rights reserved. 81

Han, et al. / International Food and Agribusiness Management Review Volume 10, Issue 2, 2007
values above 0.50 provide evidence of acceptable reliability (Bollen, 1989). If any items exhibit R2 less than this value, these can be dropped from the respective scale and parameter values can be re-estimated. Table 3 shows the result of parameter estimates, error terms, t-values and R2 for the two main constructs in this study. An examination of the results reveals that 3 items (i.e., coord1, coord2, coord3 and QMP5) did not meet the 0.50 criterion of the R2. Due to the fact that most of them reflected the coordination between the supplier and the buyers which was an important dimension in our study, they were kept for the forthcoming assessment of fit indices. Our analysis exhibited marginally acceptable R2 and the critical ratios were all higher than 1.96, indicating a good convergent validity. Assessment of the Fit and Unidimensionality An evaluation of model fit, together with two diagnostics indicators modification indices, and standardized residuals will be used to assess unidimensionality. The overall fit of a hypothesized model can be tested by using the maximum likelihood Х2 statistic provided in the AMOS output. ThisХ2 is a function of both internal and external consistency. The p-value associated with thisХ2 is the probability of obtaining a Х2 value larger than the value actually obtained under the hypothesis that the model specified is a true reflection of reality (Koufteros, 1999). As the significance levels of Х2 are sensitive to sample size and departures from multivariate normality, this statistic must be interpreted with caution in most applications (Joreskog and Sorbom, 1989; Byrne, 2001). Therefore, we also use other measures of model fit in assessing model adequacy (Joreskog and Sorbom, 1989). Such indices include the ratio of Х2 to degrees of freedom, the goodness-of-fit index (GFI) and adjusted goodness-of-fit index (AGFI), Bentler and Bonnet normed fit index (NFI), the Tucker-Lewis indices (TLI), comparative fit index (CFI) and the root mean square error of approximation (RMSEA). Researchers have recommended usingХ2/df ratios of less than 5 to indicate a reasonable fit (Marsch and Hocevar, 1985). Most current research suggests the use of Х2/df ratios less than 2 as indication of a good fit (Koufteros, 1999). The recommended value for RMSEA should be less than 0.05 as an indication of a good fit while values between 0.08-0.1 indicate a reasonable fit (Hair et al., 1995). The result of our analysis in table 3 with regard to constructs SCI and QMP showed that all of our indices have met the criteria. Further analysis was made to the full measurement model of the two constructs together. Overall, the measurement model has a satisfactory fit with Х2=46.897 (with d.f.=26), Х2 /df=1.804, GFI=0.956, AGFI=0.925, NFI=0.951, TLI=0.969, CFI=0.977. The RMSEA is 0.059, which is also very good. Diagnostic indicators such as modification indices (MI) and standardized residuals can be used to assess the model fit. The MI are measures of the predicted decrease in the Chi-square value that results if a single parameter (fixed or constrained) is free (relaxed) and the model re-estimated, with all other parameters maintaining their present values (Joreskog and Sorbom, 1996). Typically small modification
© 2007 International Food and Agribusiness Management Association (IAMA). All rights reserved. 82

Han, et al. / International Food and Agribusiness Management Review Volume 10, Issue 2, 2007
Table 3: Parameter Estimates, Error Terms, T-values, and R2 for the Model Latent
Variable Item Unstandardized
Factor Loading Standardized
Factor Loading
Error Term
t-values R2 (item reliability)
SCI Construct
ξ1 Integ1 1.000 0.757 0.757 Integ2 1.082 0.777 0.102 10.611 0.604 Integ3 1.278 0.732 0.126 10.116 0.536
ξ2 Extint1 1.105 0.581 0.141 7.859 0.508 Extint2 1.144 0.724 0.125 9.170 0.524 Extint3 1.000 0.748
0.416 ξ3 Coord1 0.928 0.645 0.136 6.818 Coord2 0.811 0.692 0.116 6.988 0.479 Coord3 1.000 0.640 0.409
ξ4 Info 0.725 0.809 0.053 13.614 0.655 Logis1 0.897 0.809 0.066 13.613 0.655 Logis2 1.000 0.845 0.715 Logis3 0.713 0.656 0.068 10.425 0.503
QMP Construct
ξ1 QMP1 1.000 0.704 0.776 QMP6 1.428 0.893 0.112 12.731 0.775 QMP8 1.107 0.869 0.089 12.436 0.797
ξ2 SQM1 1.456 0.857 0.136 11.154 0.679 SQM2 0.911 0.642 0.104 8.795 0.571 SQM4 1.000 0.686 0.534
ξ3 QMP3 1.170 0.816 0.136 8.600 0.575 QMP5 1.000 0.715 0.357 PM2 1.047 0.613 0.134 7.794 0.666
ξ4 QMP7 1.256 0.607 0.183 6.878 0.502 Design1 1.674 0.824 0.224 7.486 0.512 Design2 1.000 0.598 0.512
ξ5 PM1 1.134 0.881 0.088 12.846 0.506 PM3 1.000 0.791 0.515 Fit indices for SCI construct: Х2=105.148 (p=0.000), df=59, Х2/df=1.782, GFI=0.936, AGFI=0.901, NFI=0.913, TLI=0.946, CFI=0.959, RMSEA=0.059 Fit indices for QMP construct: Х2=132.887 (p=0.000), df=66, Х2/df=2.013, GFI=0.926, AGFI=0.882, NFI=0.924, TLI=0.944, CFI=0.960, RMSEA=0.067 indices (i.e., approximately 4.0, p<0.05) provide an insignificant improvement in model fit relative to the loss of one degree of freedom from estimating the additional parameter (Anderson, 1987). However, the judgment how small the MI should be is quite different in the book of Byrne (2001). Most of the values were well up above the recommended 4.0 by Anderson (1987). A careful check of other fit indices should be made before deleting the large MI. The standardized residuals (normalized) represent the differences between the observed correlation/covariance and the estimated correlation/covariance matrix. Residuals with values larger than 2.58 in
© 2007 International Food and Agribusiness Management Association (IAMA). All rights reserved. 83

Han, et al. / International Food and Agribusiness Management Review Volume 10, Issue 2, 2007
absolute terms are considered statistically significant at the 0.05 level (Hair et al., 1998). Significant residuals indicate the presence of a substantial error for a pair of indicators. Our analysis with regard to MI and standardized residuals shows the following results: the MI for items of constructs SCM and QMP ranged from 4.037 to 12.979 and 4.254 to 11.666 respectively. According to Byrne (2001), our model indicated a good fit and need not be re-estimated. The results also show that none of the standardized residual values exceeded 2.58 in absolute terms. Therefore, the check on the two diagnostic indicators MI and standardized residuals provides additional evidence of model fit and of no apparent misspecifications.
Discriminant Validity Discriminant validity measures the extent to which items referring to the same construct distinguish from each other. In this study, discriminant validity is established by using CFA. Models were constructed for all possible pairs of latent variables (constructs) and run on each selected pair, (1) allowing for correlation between the two constructs, and (2) fixing the correlation between the two constructs at 1.0. A significant difference in chi-square values for the fixed and free solution indicates the distinctiveness of the two constructs (Bagozzi et al., 1991). A chi-square difference is above 3.84 at a significance level of 0.05 and above 6.63 at a significance level of 0.01, meaning that discriminant validity between two measurement variables exists (Anderson and Gerbing, 1988; Steenkamp and van Trijp, 1991). For the 9 constructs, a total of 64 different discriminant validity checks were conducted at the significance level of p=0.05. It was found out that all of the differences between the fixed and free solutions in chi-square were significant. This result provides a strong evidence of discriminant validity among the theoretical constructs. Result of Structural Modeling In accordance with the structural equation modeling analysis step, we can come to hypothesis testing once the measurement model was established. The structural equation model was tested by applying AMOS version 4.01. The theoretical framework illustrated in Figure 1 has three hypothesized relationships among the variables SCM practices, quality management practices and firm performance. The result of the structural equation modeling analysis based on the four performance indicators did not provide us with a satisfactory fit. Though these fit indices, e.g. GFI=0.863, AGFI=0.800, NFI=0.855, TLI=0.860 and CFI=0.889 were reasonable compared with results of some research, such as Li et al. (2007), the Х2/df value was 3.642. The RMSEA indicated a less than optimal recommended value of 0.05. When the market share indicator was deleted from the model, the re-estimated model showed an improvement of fit indices with GFI=0.903, AGFI=0.852, NFI=0.902, TLI=0.917 and CFI=0.936. The RMSEA and Х2/df were 0.085 and 2.646. The path diagram and the results of the structural equation model analysis are presented in
© 2007 International Food and Agribusiness Management Association (IAMA). All rights reserved. 84

Han, et al. / International Food and Agribusiness Management Review Volume 10, Issue 2, 2007
Figure 4. It should be noted that even though all the t-values of the measurements are significant at 0.05 level, their loadings to the corresponding second-order construct are different. Apart from the internal integration, the other three factors of supply chain integration have low factor loadings, indicating that they may not be strong indicators of supply chain management practices compared to internal integration. This can be true in accordance with the result of our in-depth multiple case studies. In quality management practices, indicators “employee involvement” and “quality design” have lower factor loadings as compared with the other three indicators in this construct.
0.89
0.87
0.45
Firm
performance (FP)
Supply chain integration
(SCI)
0.92 0.85 0.43
0.54
0.84
Incompany quality management
Supplier QM
Employee involvement
Quality design
Process management
B-S relationship coordination
Market share
Profitability
Perceived quality
satisfaction
Internal integration
Integrated IT and logistics
management
External integration
Quality management
Practices (QMP)
0.77
0.65
0.66
0.23
0.57
0.66 0.54
Figure 4: Path Diagram Table 4: Results of Hypothesis Testing
Variables Estimates S.E. C.R. P Hypothesis SCI→FP 0.403 0.309 1.303 0.193 Not supported QMP→FP 0.635 0.145 4.369 0.000** Supported SCI→QMP 1.904 0.236 8.056 0.000** Supported *P<0.05 **P<0.001
© 2007 International Food and Agribusiness Management Association (IAMA). All rights reserved. 85

Han, et al. / International Food and Agribusiness Management Review Volume 10, Issue 2, 2007
We also tested the hypotheses based on the model as shown in Figure 1. Table 4 summarizes the specified relationships among the variables supply chain integration, quality management practices and firm performance. Hypothesis 1 was not supported by the data, as indicated by a insignificant critical ratio (C.R.= 1.303), indicating that the positive relationship between supply chain integration and firm performance was not significant. However, supply chain integration had an indirect impact on firm performance through quality management practices. The indirect influence was 0.69. Our analysis showed strong evidence that the second and the third hypotheses were supported. Significant positive relationships have been found between quality management practices and firm performance (C.R.= 4.369, p<0.001) and between supply chain integration and quality management practices (C.R.= 8.056, p<0.001). Discussion and Conclusions Supply chain management represents one of the most significant paradigm shifts of modern business management by recognizing that individual businesses no longer compete as solely autonomous entities, but rather as whole supply chains (Lambert and Cooper, 2000). Although there are a number of interlocking ideas and propositions which constitute the theory and prescription of supply chain management, the central underpinning ideas relate to alignment and integration (Storey et al., 2006). Our research attempted to study the interrelationships among SC integration, quality management and performance on the basis of data collected from the pork processing sector in China. We will discuss our findings below. The most important results of the present study are that quality management practices are directly linked with firm performance, while supply chain integration was indirectly linked to firm performance through quality management. The confirmed positive effect of quality management practices on firm performance is very encouraging for practitioners. It reaffirms the role of quality management in improving firm performance and provides impetus to managers on various levels in the pork processing industry to continue adopting quality management practices in their organizations. As many companies put it “Quality is the life of the enterprise”. Firms that wish to improve their performance should therefore invest in quality management. Equally interesting is the indirect link of supply chain integration through quality management with firm performance. To improve quality of the products and reduce uncertainty in hog supply chains, companies should therefore develop more integrated chains with their suppliers. In the survey, we found (especially large) pork processors paying more attention to building strategic relationships with their most important suppliers in order to provide high quality pork products to the consumers. However, the direct effect of SC integration on firm performance was not significant in our study. This is in contrast to some earlier studies. For example, Kim (2006)
© 2007 International Food and Agribusiness Management Association (IAMA). All rights reserved. 86

Han, et al. / International Food and Agribusiness Management Review Volume 10, Issue 2, 2007
studied the interrelationships among level of SC integration, implementation of SC practices and the organizational performance of 668 manufacturing corporations in Korea and Japan. He found that both the level of SC integration and SCM practices had a positive relation with firm performance. The results of Li et al. (2006) in 196 American manufacturing industries also supported the hypothesis that firms with high levels of SCM practices had high levels of organizational performances. Nevertheless, literature review also highlighted some opposite results. Handfield and Nichols (1998) indicated that there were in practice few examples of truly integrated supply chains while SCM has become popular. Few companies have succeeded simultaneously on strategic supplier-buyer partnerships, outsourcing non-core competencies and customer relations practices. Agricultural chains are still suffering from fragmentation, especially in developing countries (Boger, 2001). China is in a transitional period. Although its economy is in rapid development, its agri-food industry is still dominated by small companies with limited implementation of information technology and logistics integration (Chen, 2003). Chen suggested information centers to be established to facilitate SC integration. By taking a look at the result of our analysis, we found that factors “external integration”, “buyer-supplier relationship coordination” and “integrated information technology and logistics management” contributed poorly to firm performance compared with the contribution of internal integration. This result may indicate that the Chinese pork processing industry is still in an early stage of SC integration. Suggestions for Further Research and Management Implications The present study focuses on the relationships between upstream parties of the pork supply chain. Since the unit of analysis in this study is the dyadic relationship between the pork processors (the buyers) and their suppliers, managers of purchasing, supply management and operations functions were considered to be the best candidates to answer the questions. Although difficulties arise when empirical research is based on data collected from both the buyer and the supplier side, validation can be ensured through cross checking. Further efforts can be made in gathering data from multiple respondents per company in order to increase the validity of the data. Furthermore, empirical research should be conducted to gain more insight into the relationship between processors and retailers. With regard to the relationship between SC integration and firm performance, it is suggested that further analysis should be done to compare the extent of SC integration between companies that have different strategies. For example, are companies that apply product differentiation strategy more integrated in SCM than those that apply cost leadership strategy? Are larger companies more integrated in SCM than smaller ones? However, the present study has provided several important implications to both academics and pork supply chain managers in China.
© 2007 International Food and Agribusiness Management Association (IAMA). All rights reserved. 87

Han, et al. / International Food and Agribusiness Management Review Volume 10, Issue 2, 2007
This paper proposed to study the interrelationship among supply chain management, quality management practices and firm performance. The main theoretical contributions are as follows: • The supportive effect of supply chain integration on firm performance through
quality management practices contributes to supply chain management theory. This result also highlighted the assertion that supply chain management initiatives alone cannot improve profitability (Tan et al., 1999), which further confirms the necessity to combine supply chain management theory and quality management in doing research. Just as Robinson and Malhotra (2005) mentioned, the interlinking of supply chain management with the quality management perspective is often limited and tangential in nature even though much attention has been focused on supply chain management concepts in recent years. Academics need a more focused approach in evaluating quality management issues within the internal and external supply chain contexts. The significant impact of supply chain integration on quality management practices and the indirect relationship between supply chain integration and firm performance enriched the concept of supply chain quality management.
• The empirical evidence of the significant positive impact of quality management
on the firm performance contributes to quality management theory. Our study indicated that quality management forms a second-order construct composed of the first-order constructs of imcompany quality management, supplier quality management, employee involvement in quality management, quality design and process management—the five major components of quality management practices. Noteworthy, the data analysis showed a profound impact of long term quality strategy, policy goals and quality assurance systems on firm performance on one hand, the contribution of supplier quality management on the other hand. Aligned with quality management practices, the same important perspectives are employee empowerment and quality design. Our empirical study showed that the employee involvement in quality management and quality design contributed less than other three dimensions. Further investigation is therefore needed.
The empirical evidence has several implications for practitioners in pork supply chain managers in transitional economy like China: • The results show that there is a direct relationship between quality
management and firm performance. The attention for quality management turns out to be critical to generate sales growth, improve customer satisfaction and provide profits for the company. In quality management practices, we found that in-company quality management, supplier quality management, employee involvement, quality design and quality process management all contributed to
© 2007 International Food and Agribusiness Management Association (IAMA). All rights reserved. 88
Han, et al. / International Food and Agribusiness Management Review Volume 10, Issue 2, 2007
overall firm performance. Quality management needs a clear vision from the management team and participation by all employees of the company.
• The indirect relationship of supply chain integration through quality
management with firm performance indicates that pork processing companies not only need to be internally integrated, but also need to be externally integrated with their suppliers. The external integration enables a company to acquire technology and logistical capabilities to enhance customer service (Stevens, 1990).
• Therefore, pork processing firms in China should forge quality management
practices and combine these with strategic supply chain partnerships so as to develop closer relationships with their suppliers.
References Adacum, A. and B. G. Dale, 1995, Supplier partnering: case study experience,
International Journal of Purchasing & Materials Management, Winter. Anderson, J. C., 1987, An approach for confirmatory measurement and structural
equation modeling of organizational properties, Management Science 33 (4), 525-541.
Arbuckle, J.L., 1997, Amos Users’ Guide Version 3.6. Small Waters Corporation,
Chicago, IL. Armistead, C. G. & J. Mapes, 1993, The impact of supply chain integration on
operating performance, Logistics Information Management, Vol. 6 No. 4, 9-14.
Armstrong, J.S. and T.S. Overton, Estimating non-response bias in mail surveys,
Journal of Marketing Research 14(3), 396-402. Bagozzi, R. P., Youjae and L. W. Phillips, 1991, Assessing construct validity in
organizational research, Administrative Science Quarterly 36, 421-458. Bamford, J., 1994, Driving America to tiers, Financial World, 163, pp. 24-27. Boger, S. (2001), Agricultural Markets in Transition, an empirical study on
contracts and transaction costs in the Polish hog sector, PhD thesis, Shaker Verlag, Aachen.
© 2007 International Food and Agribusiness Management Association (IAMA). All rights reserved. 89

Han, et al. / International Food and Agribusiness Management Review Volume 10, Issue 2, 2007
Bowersox, D. J., 1989, Logistics in the integrated enterprises, paper presented at the Annual Conference of the Council of Logistics Management, St. Louis, MO.
Briscoe, G., 2005, Construction supply chain integration: an elusive goal, Supply
Chain Management: An International Journal, 10/4, 319-326. Byrne, B. M., 2001, Structural equation modeling with AMOS: basic concepts,
applications and programming, Lawrence Erlbaum Associates, New Jersey. Carr, A. S. and J. N. Pearson, 1999, Strategically managed buyer-seller
relationships and performance outcomes, Journal of Operations Management 17 (5), 497-519.
Chase, R. B., N. J. Aquilano & R. E. Jacobs, 2000, Operations management for
competitive advantage, Irwin Publishing Co., Chicago, IL, pp. 30-45. Chen, C (2003), Establishment of supply chain model of the processed meat
products in China, Journal of Nanjing Agricultural University, No. 1. Chen, I. J. & A. Paulraj, 2004, Towards a theory of supply chain management: the
constructs and measurements, Journal of Operations Management 22, 119-150.
Choi, T. Y. & K. Eboch, 1998, The TQM paradox: relations among TQM practices,
plant performance and customer satisfaction, Journal of Operations Management 17, pp59-75.
Christoper, M., 2000, Managing the global supply chain in an uncertain world,
www.rockfordconsulint.com, February 23. Churchill, G. A., 1979, A paradigm for developing better measures of marketing
constructs, Journal of Marketing Research 16 (1), 64-73. Claro, D. P., 2004, Managing business networks and buyer-supplier relationships,
PhD thesis, Wageningen University and Research Center, the Netherlands. Dooyoung, S., J. G. Kalinowski, and G. El-Enein, 1998, Critical implementation
issues in total quality management, SAM Advanced Management Journal 63 (1), 10-14.
Dunn, S. C., R. F. Seaker and M. A. Waller, 1994, Latent variables in business
logistics research: scale development and validation, Journal of Business Logistics 15 (2), 145-172.
© 2007 International Food and Agribusiness Management Association (IAMA). All rights reserved. 90

Han, et al. / International Food and Agribusiness Management Review Volume 10, Issue 2, 2007
Economist, 1992, April 18, p.67. Ellram, L. M., 1991, Supply chain management: the industrial organization
perspective, International Journal of Physical Distribution and Logistics Management 21 (1), pp. 13-22.
Fearne, A., 1998, The evolution of partnerships in the meat supply chains: insights
from the British beef industry, Supply Chain Management, Vol. 3 No. 4, 214-31.
Fearne, A., 2000, Building effective partnerships in the meat supply chain: lesson
from the UK, Canadian Journal of Agricultural Economics, Vol. 46 No. 4 491-518.
Fisher, M., 1997, What is the right supply chain for your product, Harvard Business
Review, March/April, pp. 105-116. Florhlich, M. T. & R. Westbrook, 2001, Arcs of integration: an international study of
supply chain strategies, Journal of Operations Management 19, 185-2000. Gerbing, D. W. and J. C. Anderson, 1988, An updated paradigm for scale
development incorporating unidimensionality and its assessment, Journal of Marketing Research 25, 186-192.
Gryna, F., 2001, Supply chain management, quality planning and analysis,
(Chapter 15), The McGraw-Hill Companies, Inc., New York, NY, pp. 403-432.
Hair, J., R. Anderson, R. Tatham and W. Black, 1995, Multivariate Data Analysis
with Readings, 4th ed. Prentice Hall, Englewood Cliffs, NJ. Hair, J., R. Anderson, R. Tatham and W. Black, 1998, Multivariate Data Analysis
with Readings, fifth edition, Prentice Hall International, Upper Saddle River, NJ.
Handfield, R. B. and E. L. Jr. Nichols, 1998, An introduction to Supply Chain
Management, Prentice Hall, Upper Saddle River, NJ. Hendricks, K. B. and V. R. Singhal, 1997, Does implementing an effective TQM
program actually improve operating performance? Empirical evidence from firms that have won quality awards, Management Science 43 (9), 1258-1274.
© 2007 International Food and Agribusiness Management Association (IAMA). All rights reserved. 91

Han, et al. / International Food and Agribusiness Management Review Volume 10, Issue 2, 2007
Hobbs, J. E., W. A. Kerr and K. K. Klein, 1998, Creating international competitiveness through supply chain management: Danish pork, Supply Chain Management Volume 3 No. 2, 68-78.
Joreskog, K. G. and D. Sorbom, 1989, LISREL 7 User’s Reference Guide, Scientific
Software, Chicago, IL. Joreskog, K. G. and D. Sorbom, 1996, LISREL 8: User’s Reference Guide, Scientific
Software, Chicago, IL. Kim, S. W., 2006, Effects of supply chain management practices, integration and
competition capability on performance, Supply Chain Management: An International Journal, 11/3, 241-248.
Klein, K. K., M. D. Faminow, A. M. Walburger, B. Larue, R. Romain and K. Foster,
1996, An evaluation of supply chain performance in the Canadian pork sector, Supply Chain Management, Vo. 1 No. 3, 12-24.
Koufteros, X. A., 1999, Testing a model of pull production: a paradigm for
manufacturing research using structural equation modeling, Journal of Operation Management 17, 467-488.
Kuei, C., C. Madu and C. Lin, 2001, The relationship between supply chain quality
management practices and organizational performance, International Journal of Quality and Reliability Management, Vol. 18 No. 8, 864-872.
Lambert, D. M. and M. C. Cooper, 2000, Issues in supply chain management,
Industrial Marketing Management 29, 65-83. Lee, H. L., Padmanabhan, V. & S. Whang, 1997, Information distortion in a supply
chain: the bullwhip effect, Management Science 43(4) 546-558. Li, S., B. Ragu-Nathan, T. S. Ragu-Nathan and S. S. Rao, 2006, The impact of
supply chain management practices on competitive advantage and organizational performance, Omega, The International Journal of Management Science, 34, 107-124.
Lu, C. S., K. H. Lai and T.C.E. Cheng, 2007, Application of structural equation
modeling to evaluate the intention of shippers to use Internet services in liner shipping, European Journal of Operational Research 180, 845-867.
Madu, C. N., C. Kuei, and C. Lin, 1995, A comparative analysis of quality practice
in manufacturing firms in the U. S. and Taiwan, Decision Sciences 26 (5), 621-635.
© 2007 International Food and Agribusiness Management Association (IAMA). All rights reserved. 92

Han, et al. / International Food and Agribusiness Management Review Volume 10, Issue 2, 2007
Mainardi, C.A., M. Salva & M. Sanderson, 1999, Label of origin: Made on earth,
strategy management competition, 2nd Quarter, pp.20-28. Malhotra, N. K., M. Peterson and R. P., 1999, Marketing research: a state-of-the-art
review and directions for the twenty-first century, Journal of the Academy of Marketing Science, Vol. 27 No. 2, pp. 160-183.
Marsch, H. W. and D. Hocevar, 1985, An application of confirmatory factor analysis
of the study of self-concept: first and higher order factor models and their invariance across groups, Psychological Bulletin 97 (3), 562-582.
Mathews, J. and P. Katel (1992), The cost of quality, Newsweek 120 (10), 48-49. Mohrman, S. A., R. V. Tenkasi, E. E. Lawler III and G. G. Ledford Jr., 1995, Total
quality management: practice and outcomes in the largest US firms, Employee Relations 17 (3), 26-41.
Murphy, G. B., J. W. Trailer & R. C. Hill (1996), Measuring performance in
entrepreneurship research, Journal of Business Research, Vol. 36, pp. 15-23. O’Leary-Kelly, S. and R. J. Vokurka, 1998, The empirical assessment of construct
validity, Journal of Operations Management 16, 387-405. Palmer, M., 1996, Building effective alliances in the meat supply chain: lessons
from the UK, Supply Chain Management, Vol. 1 No. 3, 9-11. Pan, C. and J. Kinsey, 2002, The supply chain of pork: U.S. and China, Working
paper 02-01, University of Minnesota, USA, March. Power. D. J., A. Sohal and S. U. Rahman, 2001, Critical success factors in agile
supply chain management: an empirical study, International Journal of Physical Distribution and Logistics Management, 31 (4): 247-265.
Robinson, C. J. & M. K. Malhotra, 2005, Defining the concept of supply chain
quality management and its relevance to academic and industrial practices, International Journal of Production Economics, 96, 315-337.
Saraph, J. V., P. G. Benson and R. G. Schroeder, 1989, An instrument for
measuring the critical factors of quality management, Decision Sciences 20(4), 810-829.
Segars, A. 1996, Assessing the unidimensionality of measurement: a paradigm and
illustration within the context of information systems research, OMEGA - The International Journal of Management Science. Vol. 25, No. 1, 107-121.
© 2007 International Food and Agribusiness Management Association (IAMA). All rights reserved. 93
Han, et al. / International Food and Agribusiness Management Review Volume 10, Issue 2, 2007
Segars, A. H. and V. Grover, 1993, Re-examining perceived ease of use and
usefulness: a confirmatory factor analysis, MIS Quarterly 17 (4), 517-525. Shin, H., Collier, D. A. and D. D. Wilson, 2000, Supply management orientation and
supplier/buyer performance, Journal of Operations Management 18 (3), 317-333.
Sila, I., M. Ebrahimpour and C. Birkholz, 2006, Quality in supply chains: an
empirical analysis, Supply Chain Management, An International Journal, 11/6, 491-502.
Simons, D., M. Francis, M. Boulakis and A. Fearne, 2003, Identifying the
determinants of value in the UK red meat industry: a value chain analysis approach, Journal of Chain and Network Science, Vol. 3 No. 2.
Steenkamp, J.E.M. and H.C.M. van Troijp,1991, The use of LISREL in validating
marketing constructs, International Journal of Research in Marketing, Vol. 8 No. 4, 283-299.
Stevens, G. C. (1989), Integrating the supply chain, International Journal of
Physical distribution and Materials Management, Vol. 19 No. 1, pp. 37-52. Stevens, G., 1990, Successful supply chain management, Management Decision, Vol.
28 No. 8, 25-30. Storey, J., C. Emberson, J. Godsell and A. Harrison, 2006, Supply chain
management: theory, practice and future challenges, International Journal of Operations & Production Management, Vol. 26 No. 7.
Tan, K. C., R. B. Handfield and D. R. Krause, 1998, Enhancing firm’s performance
through quality and supply base management: an empirical study, International Journal of Production Research, Vol. 36 No. 10, 2813-2837.
Tan, K. C., V. R. Kannan, R. B. Handfield and S. Ghosh, 1999, Supply chain
management: an empirical study of its impact on performance, International Journal of Operations & Production Management, Vol. 19 No. 10, 1034-1052.
Tan, K. C., Lyman, S. B. and J. D. Wisner, 2002, Supply chain management: a
strategic perspective, International Journal of Operations and Production Management 22 (6), 614-631.
© 2007 International Food and Agribusiness Management Association (IAMA). All rights reserved. 94

Han, et al. / International Food and Agribusiness Management Review Volume 10, Issue 2, 2007
Vereecke, A. and S. Muylle, 2006, Performance improvement through supply chain collaboration in Europe, International Journal of Operations & Production Management, Vol. 26 No. 11, 1176-1198.
Taylor, D. H., 2006, Strategic considerations in the development of lean agri-food
supply chains: a case study of the UK pork sector, Supply Chain Management: An International Journal, 11/3, 271-280.
Vickery, S. K., J. Jayaram, C. Droge & R. Calantone, 2003, The effects of an
integrative supply chain strategy on customer service and financial performance: an analysis of direct versus indirect relationships, Journal of Operational Management 21, 523-539.
Wong, A., D. tjosvold, W. Y. L. Wong and C. K. Liu, 1999, Relationships for quality
improvement in the Hong Kong-China supply chain, International Journal of Quality and Reliability Management, Vol. 16 No. 1, 24-41.
Wisner, J. D. & T. K. Choon, 2000, Supply chain management and its impact on
purchasing, The Journal of Supply Chain Management, (36:4), Fall, pp.33-42.
Wood, A., 1997, Extending the supply chain: strengthening links with IT, Chemical
Week, Vol. 159 No. 25, p. 26. Zhou S. D. and Y. C. Dai, 2005, Selection of vertical coordination forms by the hog
producers under the supply chain management context, China Rural Economy, No. 6, 30-36.
Appendix A: Items and Indicators for Constructs in this Study Construct Supply Chain Integration Internal Integration
• Integ1: We have a team involving different departments to jointly decide about company objectives.
• Integ2: We have a good team to jointly discuss and solve operational problems.
• Integ3: We have a good information management system covering different departments.
© 2007 International Food and Agribusiness Management Association (IAMA). All rights reserved. 95

Han, et al. / International Food and Agribusiness Management Review Volume 10, Issue 2, 2007
External Integration
• Exint1: Our company works with our most important suppliers to make production plans.
• Exint2: Our company participates in the sourcing decisions of our most important suppliers.
• Exint3: Our most important suppliers provide us with the inventory data of hogs (meat) they have.
• Exint4: We share risks with our most important suppliers. Supplier-Buyer Relationship Coordination
• Coord1: Our most important suppliers are trustworthy. • Coord2: Our most important suppliers and our company deal with problems
that arise in the course of cooperation. • Coord3: We have cooperated with our most important suppliers for a long
time. • Coord4: We frequently measure the performance of our most important
suppliers. Integrated Information Technology
• Infoup: For most of the times, we share information with our most important suppliers by using e-mail/fax.
Integrated Logistics Management
• Logis1: We can organize production in an efficient way according to market information
• Logis2: Our logistics activities are well integrated with those of our most important suppliers
• Logis3: We work together with our most important suppliers to reduce logistics costs instead of the internal cost of the company.
Construct Quality Management Practices Management Leadership
• QMP1: The quality strategy of our company is based on long-term planning. • QMP2: Our managers actively participate in quality improvement processes. • QMP3: Our mid-managers are trained frequently in quality management
practices. • QMP4: Our employees are rewarded for quality improvement suggestions.
© 2007 International Food and Agribusiness Management Association (IAMA). All rights reserved. 96

Han, et al. / International Food and Agribusiness Management Review Volume 10, Issue 2, 2007
• QMP5: We train our employees how to implement quality practices frequently.
• QMP6: Our company has very good quality assurance systems (HACCP, ISO 9000 series or ISO14000).
• QMP7: We can trace and track products from field to table. • QMP8: We make an effort in making quality goals and policies understood in
the departments of our company. Supplier Quality Management
• SQM1: Our most important suppliers are selected based more on quality than
on price. • SQM2: We pay our most important suppliers a premium for good quality
pigs. • SQM3: We provide our most important suppliers with feed and technology in
order to get good quality hogs. • SQM4: We check the quality of the pigs (meat) delivered by our most
important suppliers frequently. Product/Service Design
• Design1: We focus more on quality than on price in developing new
products/services. • Design2: The employees of our company know the procedures and operation
standards. Process Management
• PM1: Our company has a well-developed cold chain (from production to distribution and selling)
• PM2: Our mid-level managers inspect the work floor on a regular basis to check all operational processes.
• PM3: We pay great attention to in-process inspection, review or checking in pork production.
Construct Firm Performance Sales Growth
• FP1: Total sales volume has grown faster than that of our main competitors in the last three years.
© 2007 International Food and Agribusiness Management Association (IAMA). All rights reserved. 97

Han, et al. / International Food and Agribusiness Management Review Volume 10, Issue 2, 2007
Market Share
• FP2: Market share has increased faster than that of our main competitors in the last three years.
Profitability
• FP3: We achieved better profitability than that of our main competitors in the last three years.
Customer Satisfaction
• FP4: We achieved better customer satisfaction on product quality than our most important competitors in the last three years.
© 2007 International Food and Agribusiness Management Association (IAMA). All rights reserved. 98