international iron and steel institute09ed87af-366e-44c6-9f55-63c... · international iron and...
TRANSCRIPT
IIIIIIIIIIIIIIIIIII'31I
CONF1DNTTAL
FOR THE USE CF MEM3tRS 01M
INTERNATIONAL IRON AND STEEL INSTITUTE
A HANDBOOK OF
WORLD STEEL STATISTICS
-rCOMMITTEE ON STATISTICS
BRUSSELS 1978
© Copyright by
INTERNATIONAL IRON AND STEEL INSTITUTE
Association internationale à but scientifique
1978
ALL RIGHTS RESERVED
For permission to reproduce any part of this material,or for additional copies
write to
Secretary General
INTERNATIONAL IRON AND STEEL INSTITUTE
Avenue Hamoir 12/14B-1180 Brussels, Belgium
Printed in Belgium
CON P 0E NT! AL
FOR THE USE OF MEES ONLY
INTERNATIONAL IRON AND STEEL INSTITUTE
A HANDBOOK
OF WORLD STEEL STATISTICS
BRUSSELS 1978
CONFIDENTIAL FOR MEMBERS ONLY
FOREWORD
This Handbook brings together a cross section of basic steel Industry statistics which arepublished or exchanged by the International Iron and Steel Institute; it Is hoped that theircompilation into one volume will be useful to uSI members. The information presented Isas up-to-date as possible, the contents having been finalised In September 1978; data forlater periods, and revisions, will appear In due course in regular uSI statistical public-ations which are listed, together with other sources, on Page 61. Thanks are due tomembers of the Committee on Statistics, and to the Institutes network of StatisticalRespondents, whose generous cooperation makes possible the production of uSI statisticalreports.
Enquiries or requests for additional information should be addressed to Anthony Trickett,Secretary, Committee on Statistics, International Iron and Steel Institute, AvenueHamoir 12 - 14, B-1180 Brussels, Belgium.
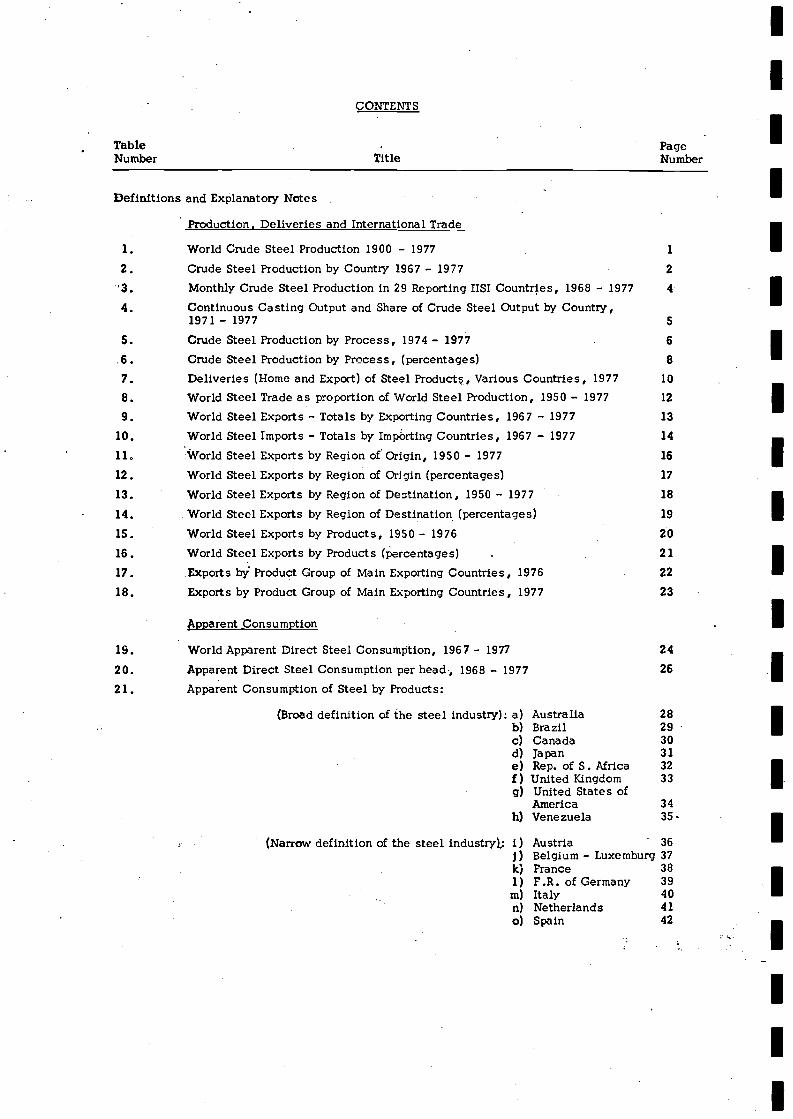
Definitions and Explanatory Notes
Production. Deliveries and International Trade
World Crude Steel Production 1900 - 1977 1
Crude Steel Production by Country 1967 - 1977 2
'3. Monthly Crude Steel Production in 29 ReportIng uSI CountrIes, 1968 - 1977 4
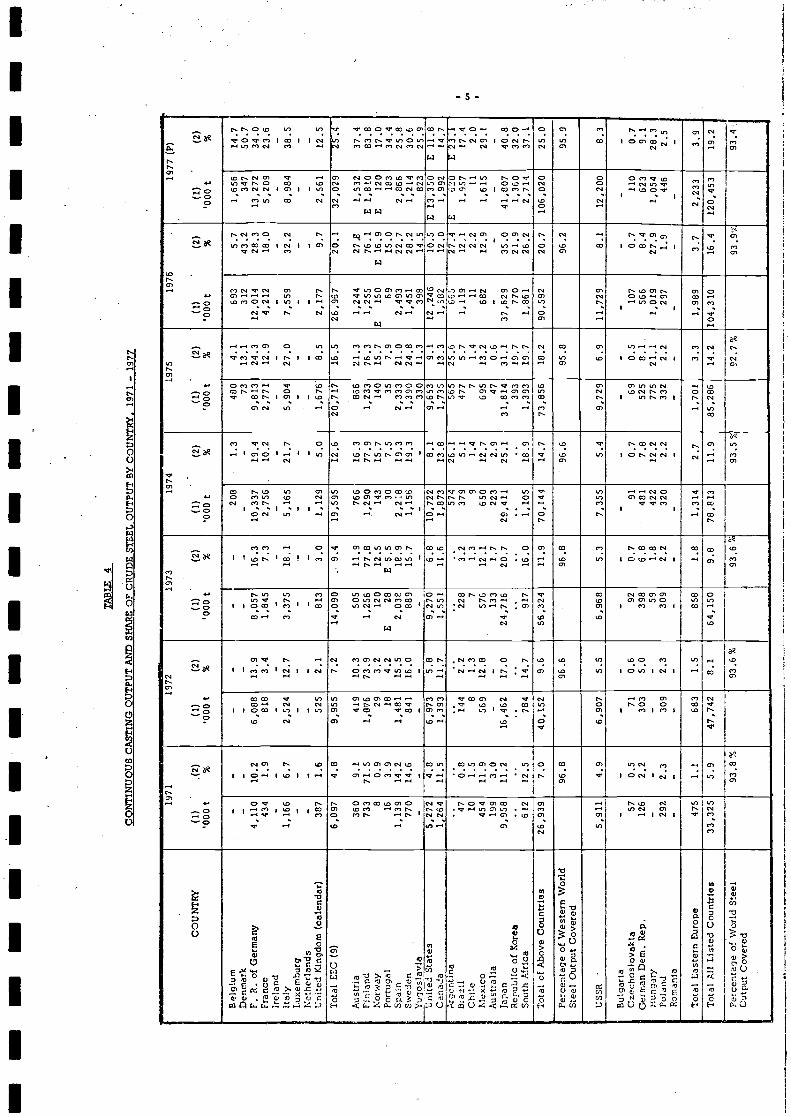
Continuous Casting Output and Share of Crude Steel Output by Country,1971 - 1977 5
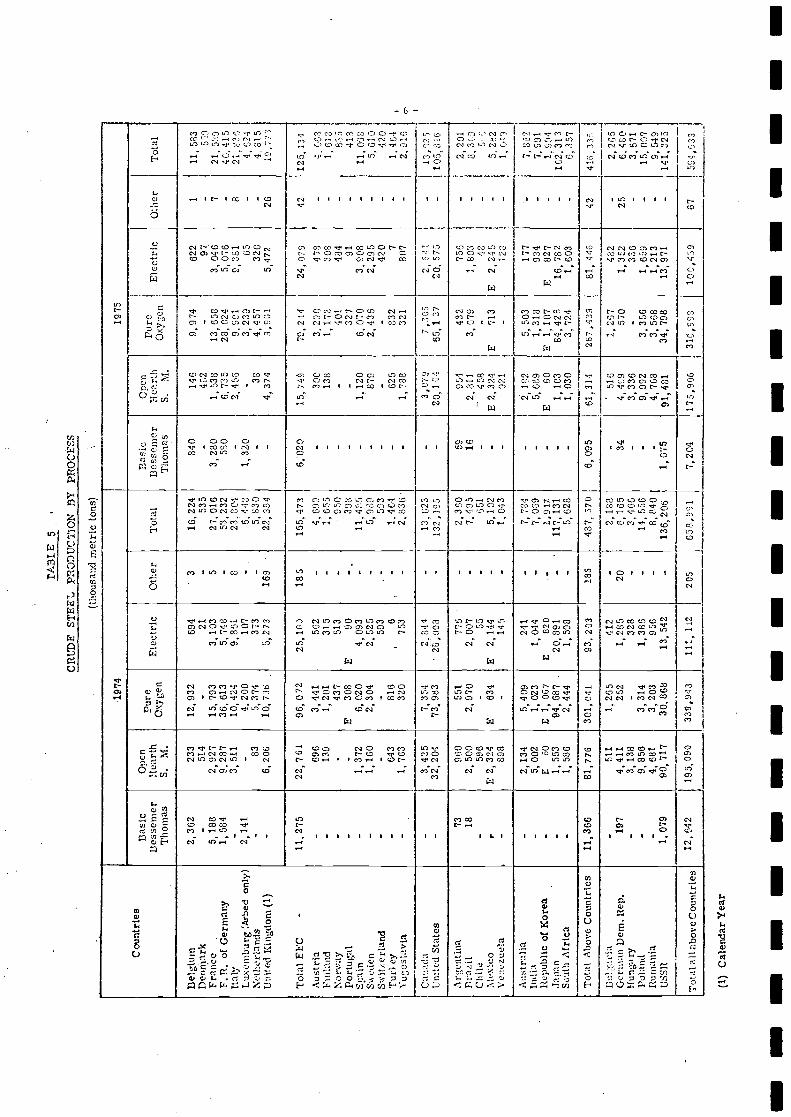
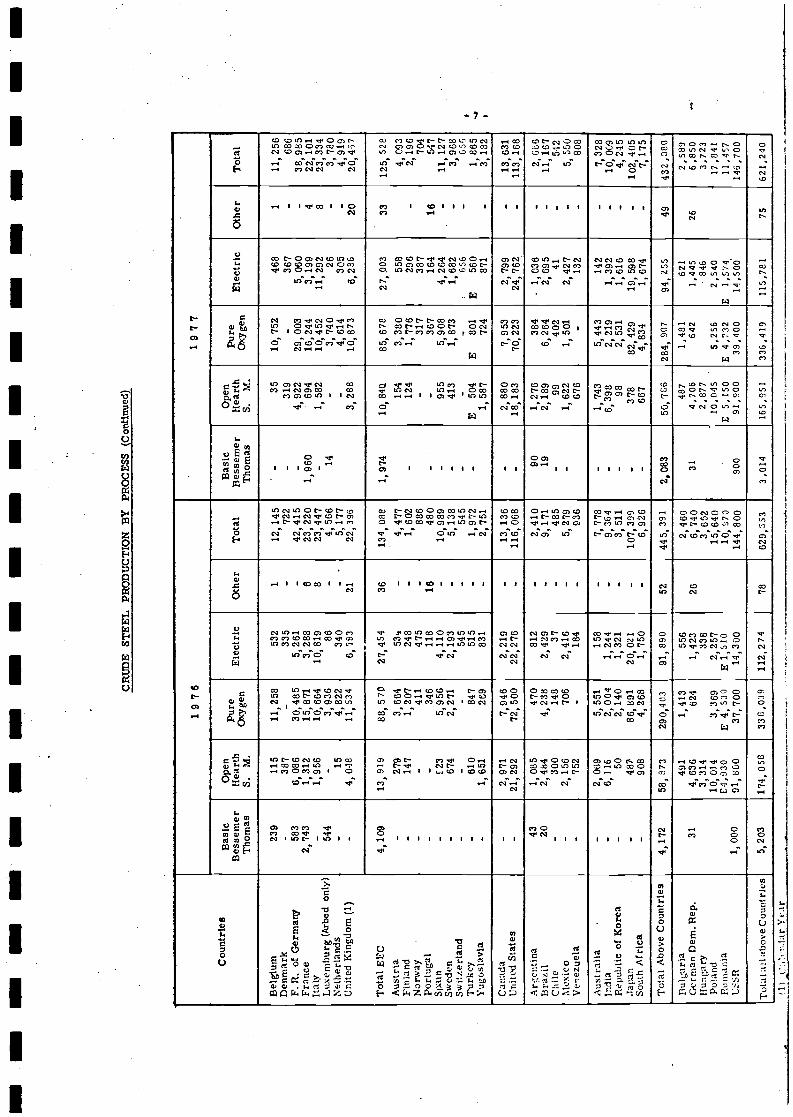
Crude Steel Production by Process, 1974 - 1977 . 6
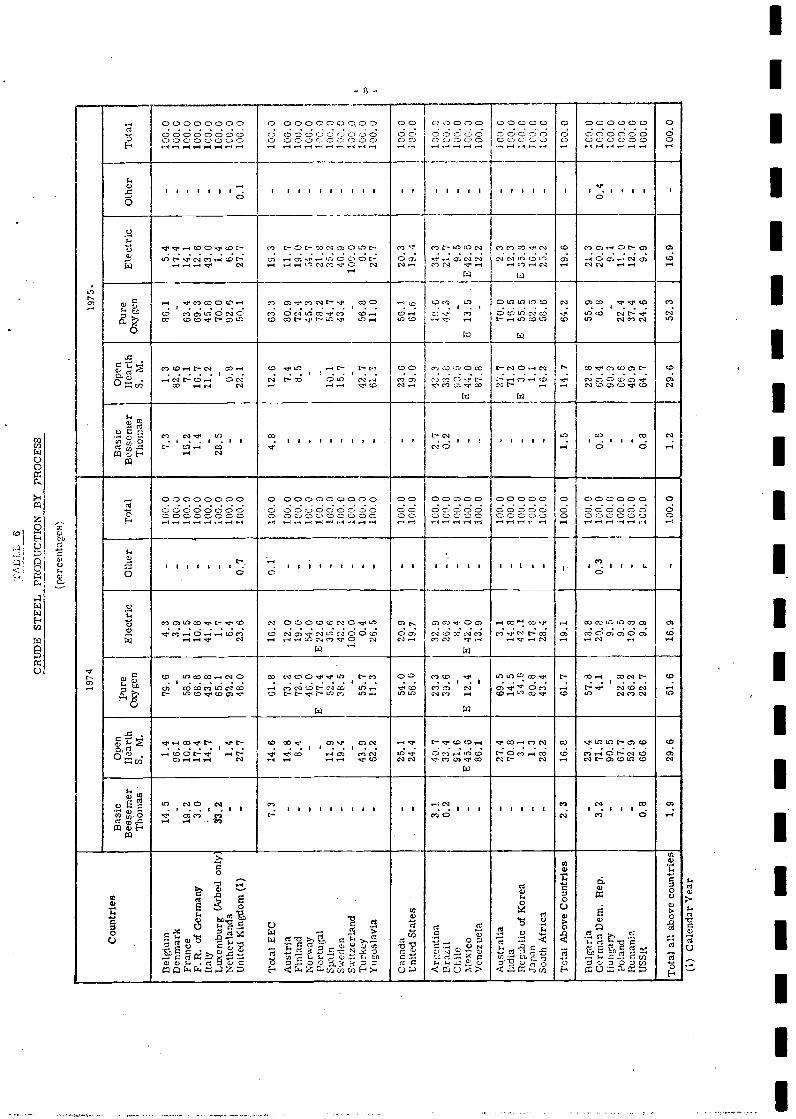
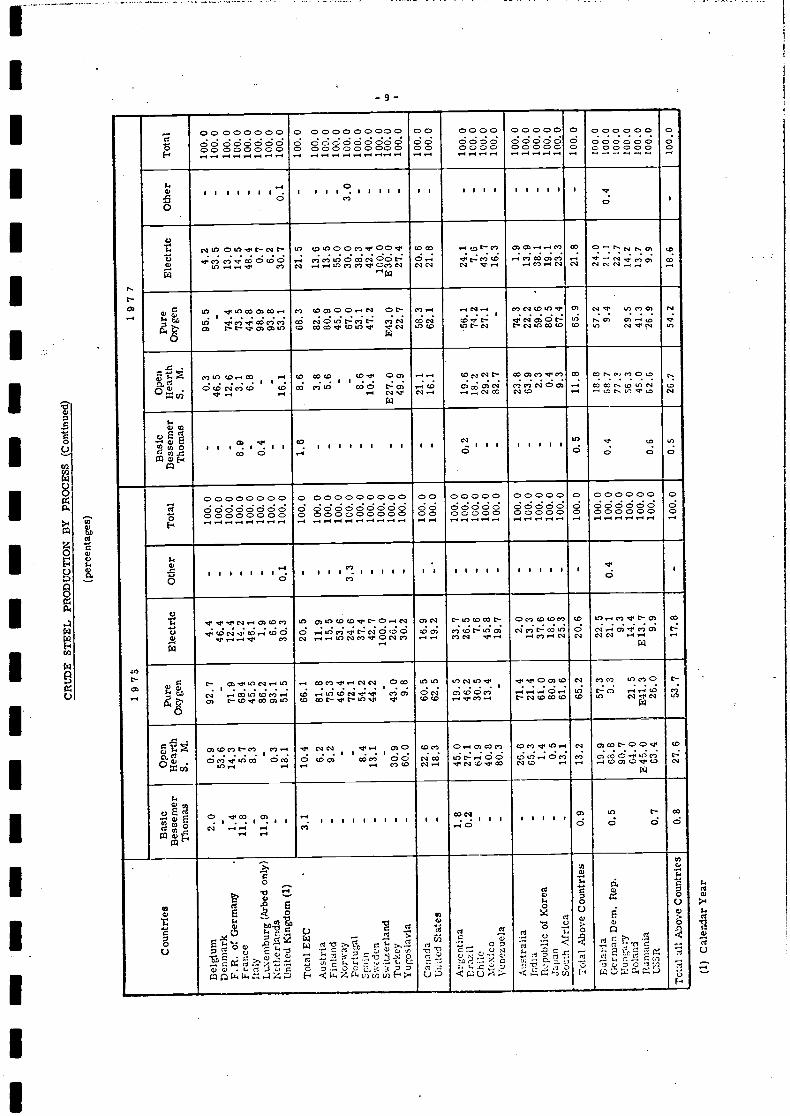
.6. Crude Steel Production by Process, (percentages) 8
Deliveries (Home and Export) of Steel Products, Various Countries, 1977 10
World Steel Trade as proportion of World Steel Production, 1950 - 1977 12
World Steel Exports Totals by Exporting Countries, 1967 - 1977 13
World Steel Imports - Totals by Imparting Countries, 1967 - 1977 14
World Steel Exports by Region of Origin, 1950- 1977 16
World Steel Exports by Region of Origin (percentages) 17
World Steel Exports by Region of Deztinatlon, 1950 - 1977 18
World Steel Exports by Region of Destination (percentages) 19
World Steel Exports by Products, 1950 - 1976 20
World Steel Exports by Products (percentages) 21
Exports b Product Group of Main Exporting Countries, 1976 22
Exports by Product Group of Main Exporting Countries, 1977 23
Apparent Consumption
World Apparent Direct Steel ConsumptIon, 1967 - 1977 24
Apparent Direct Steel Consumption per head, 1968 - 1977 26
Apparent Consumption of Steel by Products:
(Broad definition of the steel industry): a) Australia 28Brazil 29Canada 30Japan 31Rep. of S. Africa 32United Kingdom 33United States ofAmerica 34Venezuela 35
(Narrow definition of the steel industry I) AustrIa 36J) Belgium - Luxemburg 37k) France 381) F.R. of Germany 39m) Italy 40a) Netherlands dlo) Spain 42
III
u
ICONTENTS
Table Page uNumber Title Number
IIIIIIIIIIIIIII
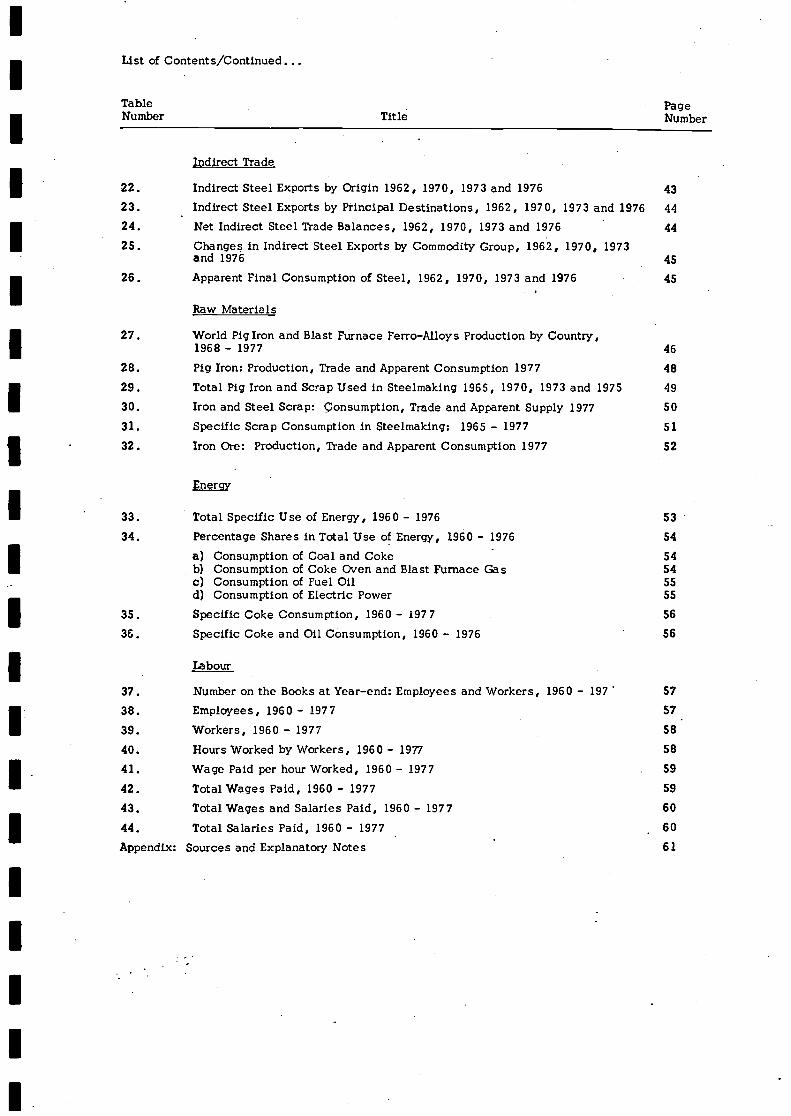
List of Contents/Continued...
Indirect Trade
22. IndIrect Steel Exports by OrIgin 1962, 1970, 1973 and 1976 43
23. IndIrect Steel Exports by Principal Destinations, 1962, 1970, 1973 and 1976 44
24. Net Indirect Steel Trade Balances, 1962, 1970, 1973 and 1976 44
25. Changes In Indirect Steel Exports by Commodity Group, 1962, 1970, 1973and 1976 45
26. Apparent Final Consumption of Steel, 1962, 1970, 1973 and 1976 45
Raw Materials
27. World Pig Iron and Blast Furnace Ferro-Alloys Production by Country,1968 - 1977 46
28. Pig Iron: Production, Trade and Apparent Consumption 1977 48
29. Total Pig Iron and Scrap Used In Steelrnaklng 1965, 1970, 1973 and 1975 49
30. Iron and Steel Scrap: Çonsumption, Trade and Apparent Supply 1977 50
31. Specific Scrap Consumption in Steelmaking: 1965 - 1977 51
32. Iron Ore: Production, Trade and Apparent Consumption 1977 52
Energy
33. Total Specific Use of Energy, 1960- 1976 53
34. Percentage Shares In Total Use of Energy, 1960 - 1976 54
Consumption of Coal and Coke 54Consumption of Coke Oven and Blast Furnace Gas 54Consumption of Fuel 011 55Consumption of Electric Power 55
35. Specific Coke Consumption, 1960 - 1977 56
36. Specific Coke and Oil Cônsumption, 1960 - 1976 56
Labour
37. Number on the Books at Year-end: Employees and Workers, 1960 - 197 57
38. Employees, 1960 - 1977 57
39. Workers, 1960 - 1977 58
40. Hours Worked by Workers, 1960- 1977 58
41. Wage Paid per hour Worked, 1960- 1977 59
42. Total Wages Paid, 1960- 1977 59
43. Total Wages and Salaries Paid, 1960 - 1977 60
44. Total Salaries Paid, 1960 - 1977 60
Appendix: Sources and Explanatory Notes 61
Table PageNumber Title Number
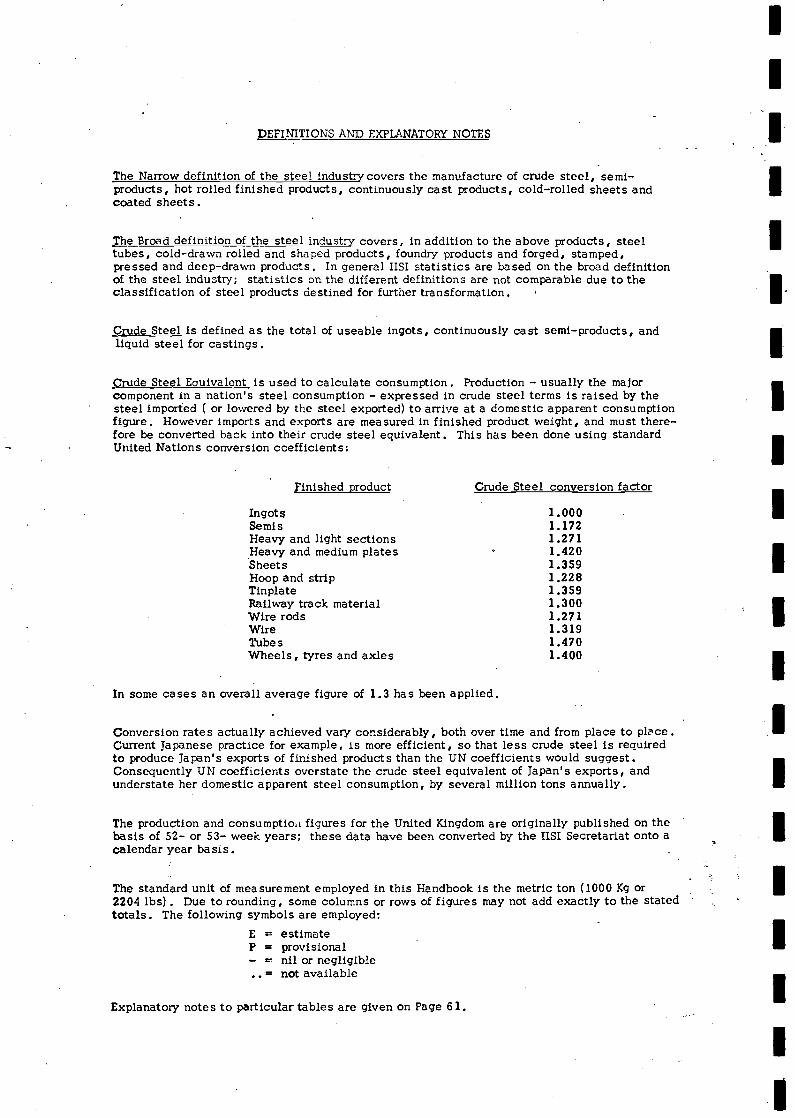
DEFINITIONS AND EXPLANATORY NOTES
The Narrow definition of the steel Industry covers the manufacture of crude steel, semi-products, hot rolled finished products, continuously cast products, cold-rolled sheets andcoated sheets.
The Broad definition of the steel industry covers, in addition to the above products, steeltubes, cold-drawn rolled and shaped products, foundry products and forged, stamped,pressed and deep-drawn products. In general uSI statistics are based on the broad definitionof the steel industry; statistics on the different definitions are not comparable due to theclassification of steel products destined for further transformation.
Crude Steel is defined as the total of useable ingots, continuously cast semi-products, andliquid steel for castings.
Crude Steel Equivalent Is used to calculate consumption. Production - usually the majorcomponent in a nation's steel consumption - expressed In crude steel terms Is raised by thesteel Imported ( or lowered by the steel exported) to arrive at a domestic apparent consumptionfigure. However Imports and exports are measured in finished product weight, and must there-
In some cases an overall average figure of 1.3 has been applied.
Conversion rates actually achieved vary considerably, both over time and from place to pl'ce.Current Japanese practice for example, is more efficient, so that less crude steel is requiredto produce Japan's exports of finished products than the UN coefficients would suggest.Consequently UN coefficients overstate the crude steel equivalent of Japan's exports, andunderstate her domestic apparent steel consumption, by several million tons anrually.
The production and consumptIoi figures for the United Kingdom are originally published on thebasis of 52- or 53- week years; these data have been converted by the tiSI Secretariat onto acalendar year basis.
The standard unit of measurement employed In this Handbook Is the metric ton (1000 Kg or2204 lbs). Due to rounding, some columns or rows of figures may not add exactly to the statedtotals. The following symbols are employed:
E = estimateP = provisional- = nil or negligible
= not available
Explanatory notes to particular tables are given on Page 61.
fore be converted back into their crude steel equivalent. This has been done using standardUnited Nations conversion coefficients:
Finished product Crude Steel conversion factor
Ingots 1.000Semis 1.172Heavy and light sections 1.271Heavy and medium plates 1.420Sheets 1.359Hoop and strip 1.228Tinplate 1.359Railway track material 1.300Wire rods 1.271Wire 1.319Tubes 1.470Wheels, tyres and axles 1.400
i
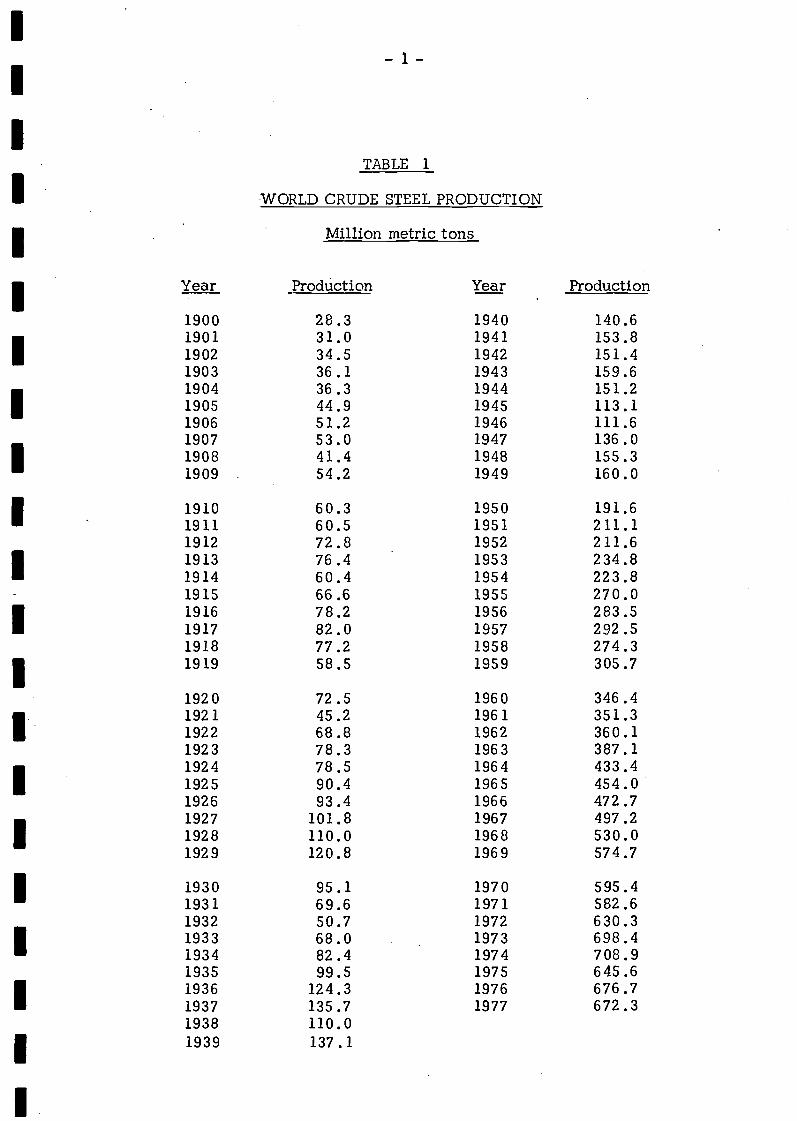
TABLE 1
WORLD CRUDE STEEL PRODUCTION
Million metric tons
Year Production Year Production
1900 28.3 1940 140.61901 31.0 1941 153.81902 34.5 1942 151.41903 36.1 1943 159.61904 36.3 1944 151.21905 44.9 1945 113.11906 51.2 1946 111.61907 53.0 1947 136.01908 41.4 1948 155.31909 54.2 1949 160.0
1910 60.3 1950 191.61911 60.5 1951 211.11912 72.8 1952 211.61913 76.4 1953 234.81914 60.4 1954 223.81915 66.6 1955 270.01916 78.2 1956 283.51917 82.0 1957 292.51918 77.2 1958 274.31919 58.5 1959 305.7
1920 72.5 1960 346.41921 45.2 1961 351.31922 68.8 1962 360.11923 78.3 1963 387.11924 78.5 1964 433.41925 90.4 1965 454.01926 93.4 1966 472.71927 101.8 1967 497.21928 110.0 1968 530.01929 120.8 1969 574.7
1930 95.1 1970 595.41931 69.6 1971 582.61932 50.7 1972 630.31933 68.0 1973 698.41934 82.4 1974 708.91935 99.5 1975 645.61936 124.3 1976 676.71937 135.7 1977 672.31938 110.01939 137.1
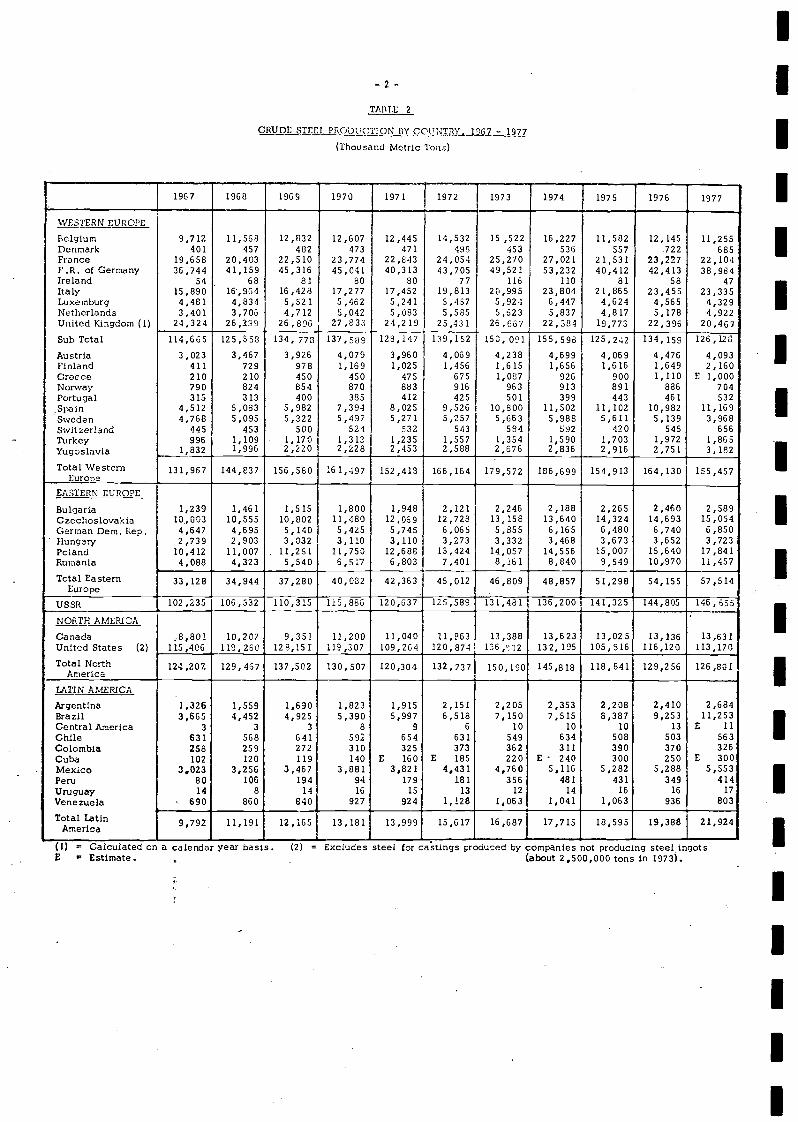
-2-TAIlLE 2
CRJDES-rEEI, PRCtUCTrON flY CCIJNTR 1967 - 1977
(Thousand Metric To)
(1) Calculated on a calendar year basis. (2) = Excludes steel for castings produced by companies not producing steel irigotsL Estimate. about 2,500,000 tons in 1973).
IIIII
1967 1968 1969 1970 1971 1972 1973 1974 1975 1976 1977
WESTERN EUROPE
Belgium 9,712 11,568 12,832 12,607 12,44S 14,532 15 522 16,227 11,582 12,145 11,255Denmark 401 457 482 473 471 498 453 536 557 722 585Fronce 19,658 20.403 22,510 23,774 22,843 24,054 25,270 27,021 21,531 23,227 22,104F.R. of Germany 36,744 41,159 45,316 45,041 40,313 43,705 49,521 53,232 40,412 42,413 38,984Ireland 54 68 81 80 80 77 116 110 81 58 47Italy 15,890 16,964 16,4213 17,277 17,452 19,813 20,995 23,804 21,865 23,455 23,335Luxemburg 4,461 4,834 5,521 5,462 5,241 5,457 5,924 6,447 4,624 4,565 4,329Netherlands 3,401 3,706 4,712 5,042 5,083 5,585 5,523 5,837 4,817 5,178 4,922United Kingdom (1) 24,324 26,299 26,096 27,833 24,219 25,431 26,667 22,384 19,773 22,396 20,457Sub Total 114,665 125,558 134, 778 137,g 128,147 139,152 150, 091 155,595 125,242 134,15 126,128
Austria 3,023 3,467 3,926 4,079 3,960 4,069 4,238 4,699 4,069 4,476 4,093Finland 411 729 978 1,169 1,025 1,456 1,615 1,656 1,616 1,649 2,160Grocce 210 210 450 450 475 675 1,087 926 900 1,110 E 1,000Norway 790 824 854 870 883 916 963 913 891 886 704Portugal 315 313 400 385 412 425 501 399 443 461 532Spain 4,512 5,003 5,982 7,394 8,025 9,526 10,800 11,502 11,102 10,982 11,169Sweden 4,768 5,095 5,322 5,497 5,271 5,257 5,663 5,988 5,611 5,139 3,968Switzerland 445 453 500 524 532 543 584 592 420 545 656Turkey 996 1,109 1,170 1,312 1,235 1,557 1,354 1,590 1,703 1,972 1,855Yugoslavia 1,832 1,996 2,220 2,228 2,453 2,588 2,676 2,836 2,916 2,751 3,182
Total Western 131,967 144,837 156,580 161,497 152,413 166,164 179,572 186,699 154,913 164,130 155,457Eurooe
EASTERN EUROPE
BulgarIa 1,239 1,461 1,515 1,800 1,948 2,121 2,246 2,188 2,265 2,460 2,589Czechoslovakia 10,003 10,555 10,802 11,480 12,069 12,728 13,158 13,640 14,324 14,693 15,054GermanDem.Rep. 4,647 4,695 5,140 5,425 5,745 6,065 5,855 6,165 6,480 6,740 6,850Hungary 2,739 2,903 3,032 3,110 3,110 3,273 3,332 3,468 3,673 3,652 3,723Poland 10,412 11,007 11,251 11,750 12,688 13,424 14,057 14,556 15,007 15,640 17,841Romania 4,088 4,323 5,540 6,517 6,803 7,401 8,161 8,840 9,549 10,970 11,457
TotalEastern 33,128 34,944 37,280 40,082 42,363 45,012 46,609 48,857 51,298 54,155 57,514Europe
USSR 102,235 106,532 110,315 115,886 120,637 125,589 131,481 136,200 141,325 144,805 146,555
NORTH AMERICA -
Canada 8,801 10,207 9,351 11,200 11,040 21,963 13,388 13,623 13,025 13,136 13,631United States (2) 115,406 119,258 128,151 119 307 109,264 120,874 136 ,O2 132, 195 105, 916 116,120 113 170
Total North 124 207. 129, 467 137,502 130,507 120,304 132,737 150,190 145,818 118, 841 129,256 126,801America
lATIN AMERICA
1,326 1,559 1,690 1,823 1,915 2,151 2,205 2,353 2,208 2,410 2,684kgentinaBrazil 3,665 4,452 4,925 5,390 5,997 6,518 7,150 7,515 6,387 9,253 11,253Central America 3 3 3 8 9 6 10 10 10 13 E 11Chile 631 568 641 592 654 631 549 634 508 503 563Colombia 258 259 272 310 325 373 362 311 390 370 326Cuba 102 120 119 140 E 160 E 185 220 E - 240 300 250 E 300Mexico 3,023 3,256 3,467 3,881 3,821 4,431 4,760 5,116 5,282 5,288 5,553Peru 80 106 194 94 179 181 356 481 431 349 414Uruguay 14 8 14 16 15 13 12 14 16 16 17Venezuela 690 860 840 927 924 1,128 1,063 1,041 1,063 936 803
Total Latin 9792 11,191 12,165 13,181 13,999 15,617 16,687 17,715 18,595 19,388 21,924America
IIIIIIu
IiIIIIIIi
IIiII
II
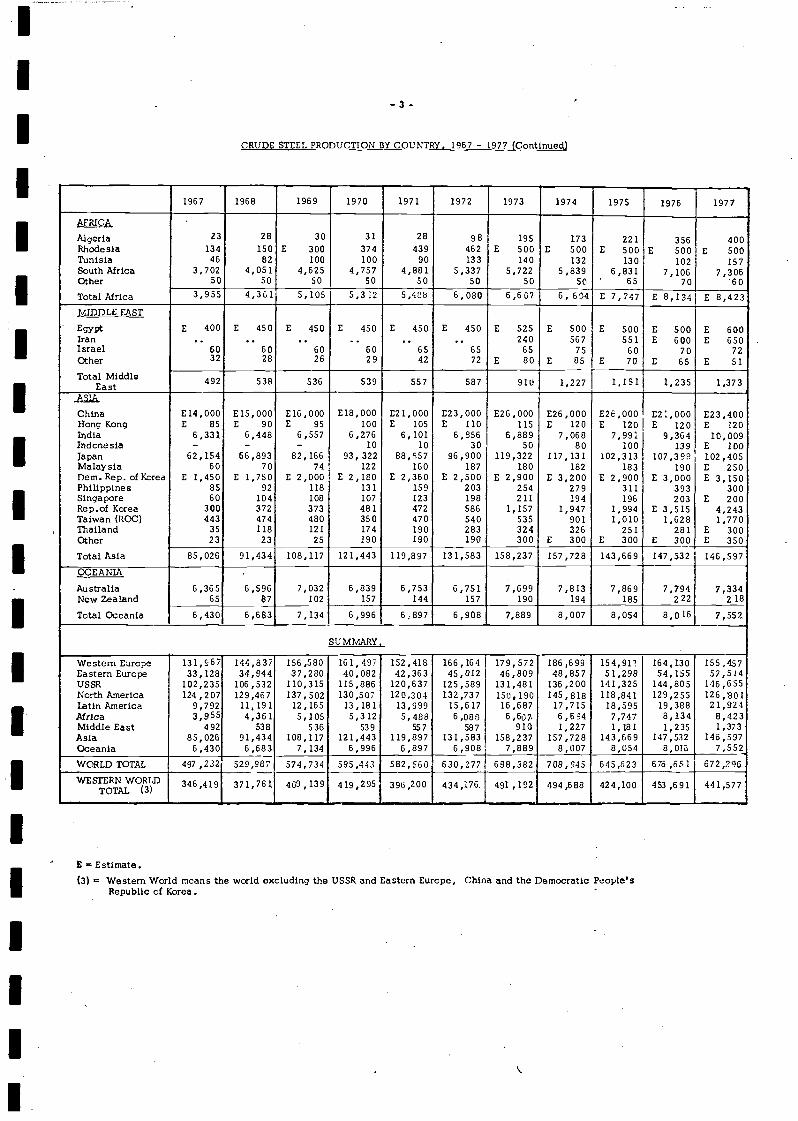
EEstimate.(3) Western World means the world excluding the USSR and Eastern Europe, China and the Democratic Peoples
Republic of Korea.
1967 1968 1969 1970 1971 1972 1973 1974 197S 1976 1977
AFRICA
Algeria 23 28 30 31 28 9P 195 173 221 356 400Rhodesia 134 150 E 300 374 439 462 E 500 E 500 E 500 E 500 E sooTunisia 46 82 100 100 90 133 140 132 130 102 157SouthAfrica 3,702 4,051 4,625 4,757 4,881 5.337 5,722 5,839 6,831 7,106 7 306Other 50 50 50 50 50 50 50 50 65 70 60TotalMrica 3,955 4,311 5,105 5,312 5,488 6,080 66O7 6, 6D4 E 7,747 E 8,134 E 8,423MIDDLE EASTEgypt
E 400 E 450 E 450 E 450 E 450 E 450 E 525 E 500 E 500 E 500 E 600Iran . . . . .. . . .. .. 240 567 551 E 600 E 650Israel 60 60 60 60 65 65 65 75 60 70 72Other 32 28 26 29 42 72 E 80 E 85 E 70 E 65 E 51
TotalMiddle 492 538J 536 539 557 587 91u 1,227 1,151 1,235 1,373
.5lAChina E14,000 E15,000 El6,000 E18,000 E21,000 £23,000 E26,000 E26,000 E21,000 E21,000 E23,400Hong Kong E 85 E 90 E 95 100 E 105 E 110 115 E 120 E 120 E 120 E 120India 6,331 6,448 6,557 6,276 6,101 6,856 6,889 7,068 7,991 9,364 10,009Indonesia - - - 10 10 30 50 80 100 339 E 100Japan 62,154 66,893 82,166 93,322 88,557 96,900 119,322 117,131 102,313 107,399 102,405Malaysia 60 70 74 122 160 187 180 182 183 190 E 250Dem.Rep.ofKorea E 1,450 E 1,750 E 2,000 E 2,180 E 2,360 E 2,500 E 2,900 E 3,200 E 2,900 E 3,000 E 3,150Philippines 85 92 118 131 159 203 254 279 311 393 300Singapore 60 104 108 107 123 198 211 194 196 203 E 200Rep.of Korea 300 372 373 481 472 586 1,157 1,947 1,994 E 3,515 4,243Taiwan (ROC) 443 474 480 350 470 540 535 901 1,010 1,628 1,770Thailand 35 118 121 174 190 283 324 326 251 281 E 300Other 23 23 25 190 190 190 300 E 3GO E 300 E 300 E 350
Total Asia 85,026 91,434 108,117 121,443 119,897 131,583 158,237 157,728 143,669 147,532 146,597
OCEANIA
Australia 6,365 6,596 7,032 6,839 6,753 6,751 7,699 7,813 7,869 7,794 7,334New Zealand 65 87 102 157 144 157 190 194 185 222 218
Total Oceania 6,430 6,683 7,134 6,996 6,897 6,908 7,889 8,007 8,054 8,016 7,55E
SUMMARY.
Western Europe 131,967 144,837 156,580 161,497 152,418 166,164 179,572 186,699 154,917 164,130 155,457EasternEurope 33,128 34,944 37,280 40,082 42,363 45,012 46,809 48,857 51,298 54,155 57,514USSR 102,235 106,532 110,315 115,886 120,637 125,589 131,481 136,200 141,325 144,805 115,655NorthAmerica 124,207 129,467 137,502 130,507 120,304 132,737 150,190 145,818 118,841 129,253 126,801LatinAmerica 9,792 1l191 12,165 13,181 13,999 15,617 16,687 17,715 18,595 19,388 21,92.1Africa 3,955 4,361 5,105 5,312 5,488 6,080 6,607. 6,694 7,747 8,134 8,423MlddleEast 492 538 536 539 557 587 910 1,227 1,181 1,235 1,373Asia 85,026 91,434 108,117 121,443 119,897 131,583 158,237 157,728 143,669 147,532 146,597Oceania 6,430 6,683 7,134 6,996 6,897 6,908k 7,889 8,007 8,054 8,0l 7,552WORLDTOTAL 497,232 529,987 574,734 595,443 582,560 63O,277 698,302 708,945 645,623 676,651 672,296
WESTERNWcR.D 346,419 371,761 409,139 419.205j 396,200 434,176. 491,192 494,588 424,100 453,691 441,577
-3-
i CRUDC STEEL PRODUCTION BY COUNTRYS 1967 - 1977 (Continued)
IIIIIIIIIIIII
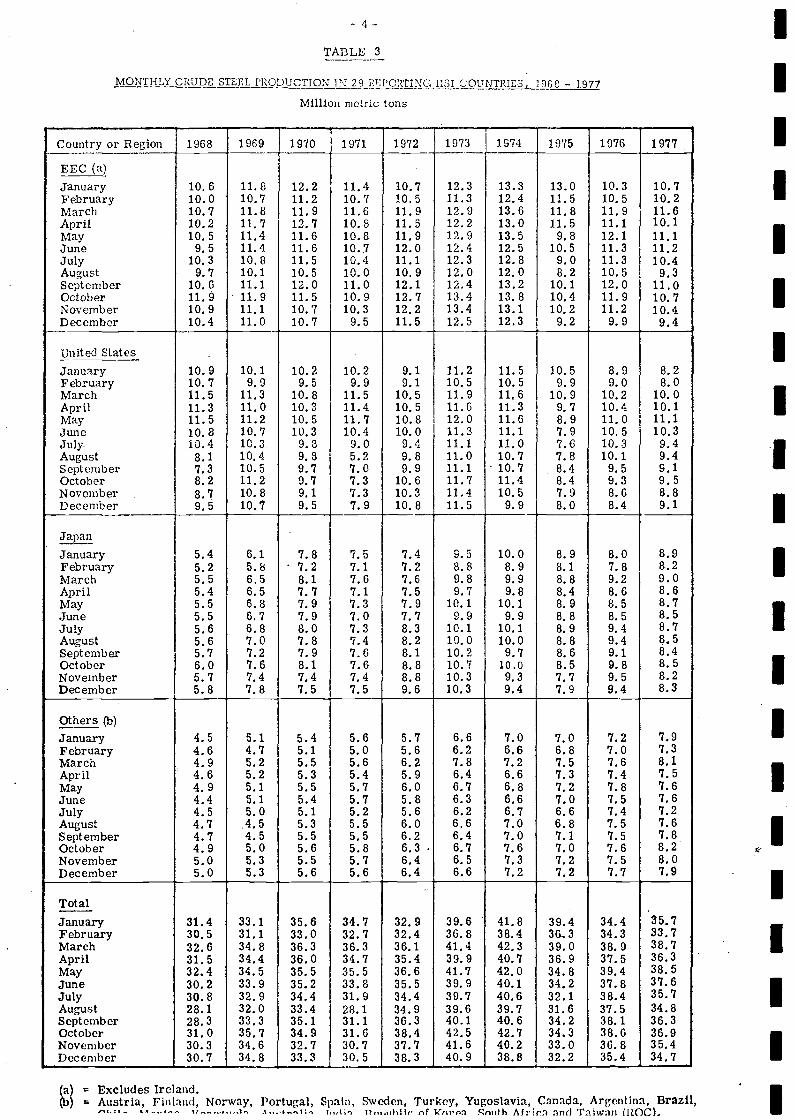
TABLE 3
MONTHLY CRUDE STEEL PRODUCTION I 29 EEI'ORTING uSI COUNTRIES9c - 1977
Million metric tons
Excludes Ireland.= Austria, Fitilami, Norway, Portugal, Spain, Sweden, Turkey, Yugoslavia, Canada, Argentina, Brazil,
A ...F ir,tt flrr,ht r.f I t' Çr,,ih Aft irì nnd Tuiw;In (ftOC.
I
I
Country or Region 1968 1969 1970 1971 1972 1973 1974 1975 197G 1977
EEC (a)10,610.0
11.810.7
12.211.2
11.410.7
10.710.5
12.311,3
13.312.4
13.011.5
10.310,5
10.710,2
JanuaryFebruaryMarch 10. '7 11. 8 11. 9 11. 6 11. 9 12. 9 13. 6 11. 8 11. 9 11.6April 10. 2 11. 7 12. 7 10. 8 11. 5 12. 2 13. 0 11. 5 11. 1 10.1May 10. 5 11.4 11. 6 10. 8 11. 9 12. 9 13. 5 9. 8 12. 1 11.1June 9.5 11.4 11.6 10,7 12.0 12.4 12.5 10.5 11.3 11.2July 10.3 10. 8 11. 5 10.4 11.1 12.3 12. 8 9.0 11.3 10.4August 9. '7 10. 1 10. 5 10. 0 10. 9 12. 0 12. 0 8. 2 10. 5 9.3September 10.6 11.1 12.0 11.0 12.1 12.4 13.2 10.1 12.0 11.0October 11. 9 11. 9 11. 5 10. 9 12. 7 13.4 13. 8 10.4 11. 9 io. 7November 10. 9 11. 1 10. '7 10. 3 12. 2 13. 4 13. 1 10. 2 11. 2 10.4December 10.4 11. 0 10. 7 9. 5 11. 5 12. 5 12. 3 9. 2 9. 9 94
Uniter] States :
January 10.9 10.1 10.2 10.2 9.1 11.2 11.5 10.5 8.9 8.2February 10. 7 9. 9 9. 5 9. 9 9. 1 10. 5 10. 5 9. 9 9. 0 8.0March 11.5 11.3 10. 8 11. 5 10. 5 11. 9 11, 6 10. 9 10.2 10.0April 11.3 11.0 10.3 11.4 10.5 11.6 11.3 9.7 10.4 10.1May 11. 5 11.2 10. 5 11. 7 10. 8 12. 0 11.6 8. 9 11. 0 11.1June 10. 8 10. 7 10. 3 10. 4 10. 0 11. 3 11. 1 7. 9 10. 5 10.3July 10.4 10.3 9.3 9.0 9.4 11.1 11.0 7.6 10.3 9.4August 8.1 10.4 9. 8 5.2 9.8 11.0 10.7 7.8 10.1 9.4September 7.3 10. 5 9. 7 7. 0 9. 9 11. 1 10. 7 8.4 9. 5 9.1October 8.2 11.2 9.7 7.3 10.6 11.7 11.4 8.4 9.3 9.5November 8. 7 10. 8 9. 1 7. 3 10. 3 11. 4 10. 5 7. 9 8. 6 8.8December 9.5 10.7 9.5 7.9 10.8 11.5 9.9 8.0 8.4 9.1
JapanJanuary 5.4 6.1 7.8 7.5 7.4 9.5 10.0 8.9 8.0 8.9February 5.2 5.8 ' 7.2 7.1 7.2 8.8 8.9 8.1 7.8 8.2March 5.5 6.5 8.1 7.6 7.6 9.8 9.9 8.8 9.2 9.0April 5.4 6.5 7.7 7.1 7.5 9.7 9.8 8.4 8.6 8.6May 5.5 6.8 7.9 7.3 7.9 10.1 10.1 8.9 8.5 8.7June 5.5 6.7 7.9 7.0 7.7 9.9 9.9 8.8 8.5 8.5July 5.6 6.8 8.0 7.3 8.3 10.1 10.1 8.9 9.4 8.7August 5.6 '7.0 7.8 7.4 8.2 10.0 10.0 8.8 9.4 8.5September 5.7 '7.2 7.9 7.6 8.1 10.2 9.7 8.6 9.1 8.4October 6.0 7.6 8.1 '7.6 8.8 10.7 10.0 8.5 9.8 8.5November 5.7 7.4 7,4 7.4 8.8 10.3 9.3 7.7 9.5 8.2December 5.8 7.8 7.5 7.5 9.6 10.3 9.4 7.9 9.4 8.3
Others (b)January 4.5 5.1 5.4 5.6 5.7 6.6 7.0 7.0 7.2 7.9February 4.6 4.7 5.1 5.0 5.6 6.2 6.6 6.8 7.0 7.3March 4.9 5.2 5.5 5.6 6.2 7.8 7.2 7,5 7.6 8.1April 4.6 5.2 5.3 5.4 5.9 6.4 6.6 7.3 7.4 7.5May 4.9 5.1 5.5 5.7 6.0 6.7 6.8 7.2 7.8 7.6June 4.4 5.1 5.4 5.7 5.8 6.3 6.6 7.0 7.5 7.6July 4.5 5.0 5.1 5.2 5.6 6.2 6.7 6.6 7.4 7.2August 4.7 .4.5 5.3 5.5 6.0 6.6 7.0 6.8 7.5 7.6September 4.7 4.5 5.5 5.5 6.2 6.4 7.0 7.1 7.5 7.8October 4.9 5.0 5.6 5.8 6.3 . 6.7 7.6 7.0 '7.6 8.2November 5.0 5.3 5.5 5.7 6.4 6.5 7.3 7.2 7.5 8.0December 5.0 5.3 5.6 5.6 6.4 6.6 7.2 7.2 7.7 7.9
TotalJanuary 31.4 33.1 35.6 34.7 32.9 39.6 41.8 39.4 34.4 35.7February 30.5 31.1 33.0 32.7 32.4 36.8 38.4 3U..3 34.3 33.7March 32.6 34.8 36.3 36.3 36.1 41.4 42.3 39.0 38.9 38.7April 31.5 34.4 36.0 34.7 35.4 39.9 40.7 36.9 37.5 36.3May 32.4 34.5 35.5 35.5 36.6 41.7 42.0 34.8 39.4 38.5June 30.2 33.9 35.2 33.8 35.5 39.9 40.1 34.2 37.8 37.6July 30.8 32.9 34.4 31.9 34.4 39.7 40.6 32.1 38.4 35.'?August 28.1 32.0 33.4 28.1 34.9 39.6 39.7 31.6 37.5 34.8September 28.3 33.3 35.1 31.1 36.3 40.1 40.6 34.2 38.1 36.3October 31.0 35.7 34.9 31.6 38.4 42.5 42.7 34.3 38.6 36.9November 30.3 34.6 32.7 30.7 37.7 41.6 40.2 33.0 36.8 35.4December 30.7 34.8 33.3 30.5 38.3 40.9 38.8 32.2 35.4 34.7
IIIIIII1
IIIIIIIIIII
- -
- -
- -
- -
- -
- -
- -
- -
- -
- -
-T
AB
LE
4
CO
NT
INU
OU
S C
AST
ING
OU
TPU
T A
ND
SH
PRE
OF
CR
UD
E S
TE
EL
OU
TPU
T B
Y C
OU
NT
RY
. 197
1 -
1977
1971
1972
1973
1974
1975
1976
1977
(P)
CO
UN
TR
Y(1
)(2
)(1
)(2
)(1
)(2
)(1
)(2
)(1
)(2
)(1
)(2
)(1
)(2
)00
0 t
%'0
00 t
%'0
00 t
%00
0 t
'000
t%
'000
t%
'000
t
Bel
gtum
--
--
--
208
1.3
480
4.1
693
5.7
1,65
614
.7D
enm
ark
--
--
--
--
7313
.131
243
.234
750
.7F.
R. o
f G
erm
any
4,11
010
.26,
088
13.9
8,05
716
.310
,337
19.4
9,81
324
.312
,014
28.3
13,2
7234
.0Fr
ance
434
1.9
818
3.4
1,84
57.
32,
756
10.2
2,77
112
.94,
212
18.0
5,20
923
.6Ir
elan
d-
--
--
--
--
--
--
-It
aly
1,16
66.
72,
524
12.7
3,37
518
.15,
165
21.7
5,90
427
.07,
559
32.2
8,98
438
.5L
uxem
burg
--
--
--
--
--
--
--
Net
herl
ands
--
--
--
--
--
--
-U
nite
d K
ingd
om (
cale
ndar
)38
71.
652
52.
181
33.
01,
129
5.0
1,67
68.
52,
177
9.7
2,56
112
.5T
otal
EE
C (
9)6,
097
4.8
9,95
57.
214
,090
.. 9.
419
,595
12.6
20,7
1716
.526
,967
20.1
32,0
2925
.4
Aus
tria
360
9.1
419
10.3
505
11.9
766
16.3
866
21.3
1,24
427
.81,
532
37.4
FInl
and
733
71.5
1,07
673
.91,
256
77.8
1,29
077
.91,
233
76.3
1,25
576
.1E
1,8
1083
.8N
orw
ay8
0.9
293.
212
012
.514
315
.714
015
.7E
150
E 1
6.9
E12
017
.0Po
rtug
al16
3.9
184.
2E
28E
5.5
307.
535
7.9
6915
.018
334
.4Sp
ain
1,13
914
.21,
481
15.5
2,03
818
.92,
2819
.32,
333
21.0
2,49
322
.72,
866
25.8
Swed
en77
014
.684
116
.088
915
.71,
156
19.3
1,39
024
.81,
451
28.2
1,21
430
.6Y
ugos
lavi
a-
--
--
--
-33
011
.339
814
.582
325
.9U
nite
d St
ates
5,27
24.
86,
973
5.8
9,27
06.
810
,722
8.1
9,65
39.
112
,246
10.5
E 1
3,35
0E
11.
8C
anaJ
a1,
264
11.5
1,39
311
.71,
551
11.6
1,87
313
.81,
735
13.3
1,50
212
.01,
992
14.7
\rgc
nt1n
a.
...
. .. .
...
574
26.1
565
25.6
665
27.4
EG
bE
23.
1B
razI
l47
0.8
144
2.2
228
3.2
379
5.1
477
5.7
1,11
912
.11,
957
17.4
Chi
le10
1.5
81.
37
1.3
91.
47
1.4
112.
2II
2.0
Mex
ico
454
11.9
569
12.8
576
12.1
550
12.7
695
13.2
682
12.9
1,61
529
.1.
Aus
tral
ia19
93.
0-
-13
31.
722
32.
947
0.6
--
--
Japa
n9,
958
11.2
16,4
6217
.024
,716
20.7
29,4
1125
.131
,814
31.1
37,6
2935
.041
,807
40.8
Rep
ublic
ofK
ores
....
....
....
....
393
19.7
770
21.9
1,36
032
.0So
uthA
fric
a61
212
.578
414
.791
716
.01,
105
18.9
1,39
319
.71,
861
26.2
2,71
437
.1T
otal
of
Abo
ve C
ount
ries
26,9
397.
040
,152
9.6
56,3
2411
.970
,144
14.7
73,8
5618
.290
,592
20.7
106,
020
25.0
Perc
enta
ge o
f W
este
rn W
orld
96.8
96.6
96.8
96.6
95.8
96.2
95.9
Stee
l Out
put C
over
ed
USS
R5,
911
4.9
6,90
75.
56,
968
5.3
7,35
55.
49,
729
6.9
11,7
298.
112
,200
8.3
Bul
gari
a-
--
--
--
--
--
--
-C
zech
oslo
vaki
a57
0.5
710.
692
0.7
910.
769
0.5
107
0.7
110
0.7
Ger
man
Dem
. Rep
.12
62.
230
35.
039
86.
848
17.
852
58.
156
68.
462
39.
1liu
ngar
y-
--
-59
1.8
422
12.2
775
21.1
1,01
927
.91,
054
28.3
Pola
nd29
22.
330
92.
330
92.
232
02.
233
22.
229
71.
944
62.
5R
oman
ia-
--
--
--
--
--
--
-
Tot
al E
aste
rn E
urop
e47
51.
168
31.
585
81.
81,
314
2.7
1,70
13.
31,
989
3.7
2,23
33.
9T
otal
All
Lis
ted
Cou
ntri
es33
,325
5.9
47,7
428.
164
,150
9.8
78,8
1311
.985
,286
14.2
104,
310
16.4
120,
453
19.2
Perc
enta
ge o
f W
orld
Ste
el93
.8%
93.6
%93
.6%
93.5
%92
.7%
93.9
/93
.4C
ut p
ut C
over
ed
(1)
Cal
enda
r Y
ear
A3L
E 5
CR
UD
E S
TE
EL
PR
OD
UC
TIO
N B
Y P
RO
CSS
(tho
usan
d m
etri
c to
ns)
- -
- -
- -
- -
- -
- -
- -
- -
- -
- -
-
Cou
ntri
es
1974
1975
Bas
icB
esse
mer
Tho
mas
Ope
nH
eart
hS.
M.
Pure
o' e
nE
lect
ric
Oth
erT
otal
Bas
icB
esse
mer
Tho
mas
Ope
nI-
jear
Ui
S.M
.-
Cl
Ele
ctri
cO
ther
Tot
al
Bel
gium
2, 3
6223
312
, 932
694
316
, 224
840
149,
974
622
111
, 583
Den
mar
k-
514
-21
-53
5-
462
-97
.-
Fran
ce5,
188
2, 9
2715
, 793
3, 1
035
27, 0
163,
280
1, 5
3813
, 68
3, 0
467
21,
523
F. R
. o!
Ger
man
y1,
584
9, 2
8736
, 613
5, 7
48-
53, 2
325S
06,
735
28. 0
245,
076
-40
,415
ItaI
'-
3, 5
1110
, 424
9, 8
618
23. 8
042,
456
9, 9
'1í,3
818
21,
3fL
uxem
burg
(A
rbed
onl
y)2,
141
-4.
200
107
-6,
448
1,32
0-
3,23
965
-4,
624
Net
h'rl
ands
-83
5,37
437
3-
5,83
0-
384,
457
320
-48
15U
nite
d K
ingd
om (
1)-
6,20
610
,736
5,27
316
922
, 384
-4,
374
9,90
15,
472
2619
,773
Tot
al E
EC
11,2
7522
, 761
96,0
7225
, 183
185
155,
473
6,02
015
,745
79, 2
1424
, 079
4212
5,13
4A
ustr
ia-
696
3,44
150
2-
4, 6
93-
300
3,20
047
3-
4,Fi
uiad
-13
91,
201
315
-1,
655
-13
81,
172
308
-1,
613
Nor
way
--
437
513
9.50
--
401
484
-89
5Po
rtug
alE
308
E90
- .
393
-32
791
-41
3Sp
ain
-1,
372
6,02
04,
093
-11
,495
-1.
120
6,07
03.
908
-11
,098
Sade
n-
1,16
02,
304
2,52
5-
5,93
9-
879
2,43
62,
295
-5,
010
Switi
.erl
and
--
-59
3-
593
--
-42
0-
420
Tur
key
-64
381
6,
6-
1,46
4-
625
832
7-
1.46
4Y
ugos
lavi
a-
1,76
332
075
3-
2,83
6-
1,78
832
180
7-
2.81
6
Can
ada
-3,
425
7,35
42,
844
-13
.623
-3,
072
7,30
52,
641
-13
,925
Uni
ted
Stat
es-
32, 2
0473
983
26,0
0313
2, tO
S-
20,1
0465
,1 3
720
. 575
-10
5,81
6
Arg
entin
a73
960
551
776
-2,
360
5995
443
275
6-
2, 2
01B
razi
l18
2, 5
002,
970
2,00
7-
1.49
516
2,31
13,
079
1,80
3-
8,31
1C
hile
-59
6-
55-
651
-45
8-
43-
sM
extc
or
E2,
324
E63
4E
2,14
4-
5,10
2-
E2,
324
E71
3E
2,24
5-
5232
Ven
ezue
la-
898
-14
5-
1,04
3-
321
-12
2.-
I, I
Al
Aus
tral
ia-
2,13
45,
409
241
-7,
734
-2,
192
5, 5
0317
7-
7,86
2in
dia
-5,
002
1,02
31,
044
-7,
039
-5,
689
1,31
393
4-
7,99
1R
epub
lic o
f K
orea
-
-E
30E
1,0
67E
820
1,94
7-
E60
E 1
,107
E82
7-
1,98
4Ja
pan
-1,
553
94, 6
87.
20, 8
91-
117,
131
-1,
103
84,4
2016
, 732
-10
2,31
3So
uth
Afr
ica
-1,
586
2,44
41,
508
-5,
628
-1,
030
3, 7
241,
603
-6,
357
Tot
al A
bove
Cou
ntri
es11
,366
81,7
7630
1, 0
4193
, 203
185
437,
570
6,09
561
, 31.
126
7 43
981
, 446
4241
5,33
5
I3ul
tria
-51
11,
265
412
-2,
183
-51
61,
267
482
-2,
265
Ger
man
Dem
. Rep
.19
74,
411
252
1,28
520
6,16
534
4,49
957
01,
352
256,
460
Hun
gary
-3,
138
-32
8-
3,46
6-
3,33
6-
336
-3,
671
Pola
nd-
9,85
63,
314
1,38
6-
14, 5
56-
9,99
23,
356
1,65
9-
15, 0
07R
uman
ia-
4,68
13,
203
956
-8,
840
-4,
768
3, 5
681,
213
9, 5
49us
sn1,
079
90, 7
1730
, 868
13, 5
42-
136,
206
1,07
591
, 481
34, 7
9813
, 971
-14
1,32
5
Tot
alal
labo
veC
ount
ries
12, 6
4219
5,09
033
9,94
3.11
1, 1
1220
565
8,99
17,
204
175,
901
318,
998
100,
459
6759
4,53
3
- -
- -
- -
- -
- -
- -
- -
- -
- -
- -.
CR
UD
E S
TE
EL
PR
OD
UC
TIO
N B
Y P
RO
CE
SS (
Con
tinue
d)
1C
:tflta
r Y
ear
Cou
ntri
es
1976
1977
Bas
icB
esse
mer
Tho
mas
Ope
nH
eart
hS.
M.
Pure
Oxy
gen
Ele
ctri
cO
ther
Tot
alB
asic
Bes
sem
erT
hom
as
Ope
nH
eart
hS.
M.
Pure
Oxy
gen
Ele
ctri
cO
ther
Tot
al
Bel
gIum
239
115
11,2
5853
21
12, 1
45-
3510
, 752
468
111
,256
Den
mar
k-
387
-33
5-
722
-31
9-
367
-68
6F.
R. o
f G
erm
any
583
6,08
630
,485
5,26
1-
42,4
15-
4,92
229
, 003
5,06
0-
38,9
85Fr
ance
2,74
31,
312
15, 8
713
288
623
, 220
1,96
069
416
, 244
3,19
94
22, 1
01It
aly
-1,
956
10,6
6410
:819
823
,447
-1,
582
10,4
5211
,292
823
,334
Lux
embu
rg (
Arb
ed o
nly)
544
-3,
936
86-
4 56
614
-3,
740
26-
3, 7
80N
ethe
rlan
ds-
154,
822
340
-'
5177
-4,
614
305
-4
919
Uni
ted
Kin
gdom
(1)
-4,
0-18
11,5
346,
9321
22, 3
963,
288
10, 8
736,
286
2020
:
Tot
al E
EC
4,10
913
, 919
88,5
7027
,454
3613
4, 0
881,
974
10, 8
4085
, 678
27,
O3
3312
5, 5
28A
ustr
ia-
279
3,66
453
t-
4,47
715
43,
380
558
4,09
3Fi
nlan
d-
147
1,20
724
8-
1,60
2-
124
1,77
629
6-
2,19
6N
orw
ay-
-41
147
5-
886
-31
738
770
4Po
rtug
al-
-34
611
816
480
--
367
164
1654
7Sp
ain
-(2
35,
956
4,11
0-
10,9
89-
955
5,90
84,
264
-11
,127
Swed
en-
674
2,27
12,
193
-5,
138
-41
31,
873
1,68
2-
3,96
8Sw
itzer
land
--
-54
5-
545
--
-65
6-
056
Tur
key
-61
084
751
5-
1,97
2-
E50
4E
801
E56
01,
865
Yug
osla
via
-1,
651
269
831
-2,
751
1,58
772
487
1-
3,18
2
Can
ada
-2,
971
7,94
62,
219
-13
, 136
-2,
880
7,95
32,
799
-13
, 631
Uni
ted
Stat
es-
21, 2
9272
, 500
22, 2
76-
116,
068
-18
,183
70, 2
2324
, 762
-11
3, 1
68
Arg
entin
a43
1,08
547
081
2-
2,41
090
1,27
638
4-
1,03
6-
2,68
6B
razi
l20
2,48
44,
238
2,42
9-
9,17
119
2,18
96,
264
2,69
5-
11, 1
67C
hile
-30
014
837
-48
5-
9940
241
-54
2M
uxic
o-
2,15
670
62,
416
-5,
279
-1,
622
1, 5
012,
427
-5,
550
Ven
ezue
la-
752
184
-93
667
6-
132
-80
8
Aus
tral
ia-
2,06
95,
551
158
-7,
778
-1,
743
5,44
314
2-
7,32
8In
dia
-6,
116
2,00
41
244
-9,
364
-6,
398
2,21
91,
392
-10
,000
Rep
ublic
of
Kor
ea-
502,
140
1 32
1-
3,51
1-
982,
531
1,61
6-
4,24
5.T
apan
-48
7'86
,891
20,0
21-
107,
399
-37
882
,429
19, 5
98-
102,
405
Sout
h A
fric
a-
908
4,26
81,
750
-6,
926
-66
74,
834
1,67
4-
7,17
5
Tot
al A
bove
Cou
ntri
es4,
172
58,8
7329
0,40
391
,890
5244
5,39
12,
083
50,7
6628
4,90
794
,255
4943
2,38
0B
ulga
ria
491
1,41
355
62,
460
487
1,48
162
12,
589
Ger
man
Dem
.Rep
.31
4,63
662
41,
423
266,
740
314,
706
642
1,44
526
6,85
0H
ungi
ry3,
314
338
3,65
22,
877
846
3,72
3Po
iand
10,0
143,
369
2,25
715
,640
10,0
455,
256
2,54
017
,841
Rum
ania
64,9
30E
4,5
30E
1,5
1010
, 870
6 5,
150
E 4
,732
61,
574
11,4
57U
8SI1
1,00
001
,800
37,7
0014
,300
144,
800
900
91,9
0039
,400
14,5
0014
6,70
0
Tut
alal
labO
veC
Oun
trlc
S5,
203
174,
058
338,
039
112,
274
7862
9,35
33,
014
165,
951
336,
419
115,
781
7562
1,24
0
(1)
Cal
enda
r 'le
ar
1'A
L;2
6
CR
UD
E S
TE
EL
PR
OD
UC
TIO
N B
Y P
RO
CE
SS
(per
cent
ages
- -
- -
- --
- -
- -
,- -
- -
- -
- -
- -
-
Cou
ntri
es
1974
1975
.
Bas
icO
pen
Bas
icO
pen
Bes
sem
erH
eart
hre
Ele
ctri
cO
ther
rota
iB
esse
mer
Hea
rth
r e
Ele
ctrI
cO
ther
Tot
alT
hom
asS.
M,.
.. ge
nT
hom
asS.
M.
o ge
n
Bel
gium
14.5
1.4
79.6
4.3
-10
0.0
7.3
1.3
86.1
5.4
-19
0.0
Den
mar
k-
96.1
-3.
9-
100.
0-
82.6
-17
.4-
100.
0Fr
ance
19.2
10.8
58.5
11.5
-10
0.0
15.2
7.1
63.4
14.1
-10
0.0
FAt o
f G
erm
any
3.0
17.4
68.8
10.8
-10
0.0
1.4
16.7
69.3
12.6
-10
0.0
Ital
y-
14.7
43.8
41.4
-10
0.0
-11
.245
.843
.0-
100.
0L
uxem
burg
(Ii
rbed
onl
y33
.2-
65.1
1.7
-10
0.0
28.5
-70
.01.
4-
100.
0N
ethe
rlan
ds-
1.4
92.2
6.4
-10
0.0
-0.
892
.66.
6-
160.
0U
nite
d K
ingd
om (
1)-
27.7
48.0
23.6
0.7
100.
0-
22.1
50.1
27.7
0.1
100.
0
Tot
al E
EC
7.3
14.6
61.8
16.2
0.1
100.
04.
812
.663
.319
.3-
100.
0A
ustr
ia-
14.8
73.2
12.0
-10
0.0
-7.
480
.911
.7-
100.
0Fi
nlan
d-
8.4
72.0
19.0
-10
0.0
-8.
572
.419
,0-
100.
0N
orw
ay-
-46
.054
.0-.
100.
0-
-45
.354
.7-
100.
0Po
rtug
al-
-E
77.4
E22
.6-
100.
0-
-78
.221
.8-
160.
0Sp
ain
-11
.952
.435
.6-
100.
0-
10.1
54.7
35.2
-10
0.0
Swed
en-
19.4
38.5
42.2
-10
0.0
-15
.743
.440
.9-
100.
0Sw
itzer
land
--
-10
0.0
-10
0.0
--
-10
0.0
-10
9.0
Tur
key
-43
.955
.70.
4-
100.
0-
42.7
56.8
0.5
-16
0.0
Yug
osla
via
-62
.211
.326
.5-
100.
0-
61.3
11.0
27.7
-10
0.0
Can
ada
-25
.154
.020
.9-
100.
0-
23.6
50.1
20.3
-10
0.0
Uni
ted-
Stat
es.
-24
.456
. 019
.7-
100.
019
.061
.619
.4-
100.
0
Are
ntjn
a3.
140
.723
.332
.9-
100.
02.
743
.319
.634
.310
0.0
Bra
zil
0.2
33.4
39.6
26.8
-.
100.
00.
233
.844
.321
.7-
160.
0C
hile
-91
.6-
0.4
-10
0.0
-90
.5-
9.5
-10
0.0
Mex
ico
-E
45.6
E 1
2.4
E 4
2.0
-10
0.0
" 44
.0E
13.
5-
E42
.010
0.0
Ven
ezue
la-
86.1
-13
.9-
100.
0.
87.8
-12
.2-
100.
0
Aus
tral
ia-
27.4
69.5
3.1
100.
027
.770
.02.
3-
100,
6In
dia
-70
.814
.514
.8-
100.
0-
71.2
16.5
12.3
-10
0.0
Rep
ublic
of
Kor
ea-
3.1
54.8
42.1
-10
0.0
-E
3.0
E55
.5E
35.
8-
100.
0Ja
pan
-1.
380
.817
.8-
300.
0-
1.1
62.5
16.4
-12
0.0
Sout
h A
fric
a-
28.2
43.4
28.4
-10
0.0
-16
.258
.625
.2-
160.
0
Tot
al A
bove
Cou
ntri
es2.
316
.861
.719
.1-
100.
01.
514
.764
.219
.6-
100.
0
Bul
gari
a-
23.4
57.8
13.8
-10
0.0
-22
.855
.921
.3-
100.
0G
erm
an D
em. R
ep.
3.2
71.5
4.1
20.8
0.3
100.
00.
569
.48.
820
.90.
410
0.0
-90
.5-
9.5
-10
0.0
-90
.9-
9.1
-10
0.0
Pola
nd-
67.7
22.8
9.5
-10
0.0
-66
.022
.411
.0-
100.
0R
uman
ia-
52.9
36.2
10.8
-10
0.0
-49
.937
.412
.7-
100.
0U
SSR
0.8
66.6
22.7
9.9
r10
0.0
0.8
64.7
24.6
9.9
-10
0.0
Tot
alal
labo
veco
untr
te$
1.9
29.6
51.6
16.9
-10
0.0
1.2
29.6
52.3
16.9
-10
0.0
_fr_
____
_._.
A_,
- -
- -
- -
- -
- -
- -
- -
- -
- -
- -
-C
RU
DE
ST
EE
L P
RO
DU
CT
ION
BY
PR
OC
ESS
(C
ontin
ued)
(per
cent
ages
)
(1)
Cal
enda
r Y
ear
197
1977
Cou
ntri
esB
asic
Bes
sem
erT
hom
as
Ope
nH
eart
hS.
M.
m r
e,.
Ele
ctri
cO
ther
Tot
alB
asic
Bes
sem
erT
hom
as
Ope
nH
eart
hS.
M.
pure
rv,,
e g
nE
lect
ric
Oth
erT
otal
Bel
gium
Den
mar
k2.
0 -0.
953
.692
.7 -4.
446
.4- -
100.
010
0.0
- -0.
346
.595
.5 -4.
253
.5- -
100.
010
0.0
100.
0F.
R. o
f G
erm
any
Fran
ce1.
411
.814
.35.
771
.968
.412
.414
.2-
100.
010
0.0
-8.
912
.6 3.1
74.4
73.5
13.0
14.5
- -10
0.0
ioo.
oIt
aly
-8.
345
.546
.1-
100.
0-
6.8
44.8
48.4
-10
0.0
Lt.x
embu
rg (
Arb
ed o
nly)
11.9
-86
.21.
9-
100.
00.
4-
98.9
0.7
-10
0.0
Net
herl
ands
-0.
393
.16.
6-
100.
0-
-93
.86.
2-
100.
0U
nite
d K
ingd
om (
1)-
18.1
51.5
30.3
0.1
100.
0-
16.1
53.1
30.7
0.1
Tot
al E
EC
3.1
10.4
66.1
20.5
-10
0.0
1.6
8.6
68.3
21.5
-10
0.0
Aus
tria
-6.
281
.811
.9-
100.
0-
3.8
82.6
13.6
-10
0.0
100.
0Fi
nlan
d-
9.2
75.3
15.5
-10
0.0
-5.
680
.913
.5-
100.
0N
orw
ay-
-46
.453
.6.
-10
0.0
--
45.0
55.0
- 3.0
100.
0Po
rtug
al-
-72
.124
.63.
310
0.0
--
67.0
30.0
100.
0Sp
ain
-8.
454
.237
.4-
100.
0-
8.6
53.1
38.3
-10
0.0
Svcd
en-
13.1
44.2
42.7
-10
0.0
-10
.447
.242
.4-
100.
0Sw
itzer
land
Tur
key
Yug
osla
via
.- - -
-30
.960
.0
-43
.09.
8
100.
026
.130
.2
- - -
100.
010
0.0
100.
0- -
E27
.049
.9E
43.0
22.7
100.
0E
30.0
27.4
- - -10
0.0
100.
0
Can
ada
Unt
ied
Stat
es- -
22.6
18.3
60.5
62.5
16.9
19.2
-10
0.0
100.
0-
21.1
16.1
58.3
62.1
20.6
21.8
- -10
0.0
100.
0
Arg
entin
a1.
845
.019
.533
.7-
100.
010
0.0
Fraz
il0.
227
.146
.226
.5-
100.
002
19.6
56.1
24.1
-10
0.0
Chi
le-
61.9
30.5
7.6
-10
0.0
-18
.274
.27.
6-
100.
0M
exic
o-
40.8
13.4
45.8
-10
0.0
-29
.227
.143
.7-
100.
0V
enez
uela
-80
.3-
19.7
-10
0.0
-82
.7-
16.3
-
Aus
tral
ia-
26.6
71.4
2.0
-10
0.0
-23
.874
.31.
9-
100.
010
0.0
Indi
a-
65.3
21.4
13.3
-10
0.0
-63
.922
.213
.9-
100.
0fl
opub
lic o
f K
orea
-1.
461
.037
.6-
100.
0-
2.3
59.6
38.1
-10
0.0
Japa
n-
0.5
80.9
18.6
-10
0.0
-0.
480
.519
.1-
100.
0So
ath
Afr
ica
-13
.161
.625
.310
0.0
-9.
367
.423
.3-
Tot
al A
bove
Cou
ntri
es0.
913
.265
.220
.6-
100.
00.
511
.865
.921
.8-
100.
0
Eul
aria
19.9
57.3
22.5
100.
018
.857
.224
.010
0.0
100.
0G
erm
an D
em. R
ep.
0.5
68.8
9.3
21.1
0.4
100.
00.
468
.79.
421
.10.
410
0.0
Hun
gary
90.7
9.3
100.
077
.722
.710
0.0
Pola
nd64
.021
.514
.410
0.0
56.3
29.5
14.2
100.
0R
uman
iaE
45.0
E41
.3E
13.7
100.
045
.041
.313
.710
0.0
USS
R0.
763
.426
.09.
910
0.0
0.6
62.6
26.9
9.9
Tot
al a
ll A
bove
Cou
ntri
es0.
827
.653
.717
.8-
100.
00.
526
.754
.218
.6-
100.
0
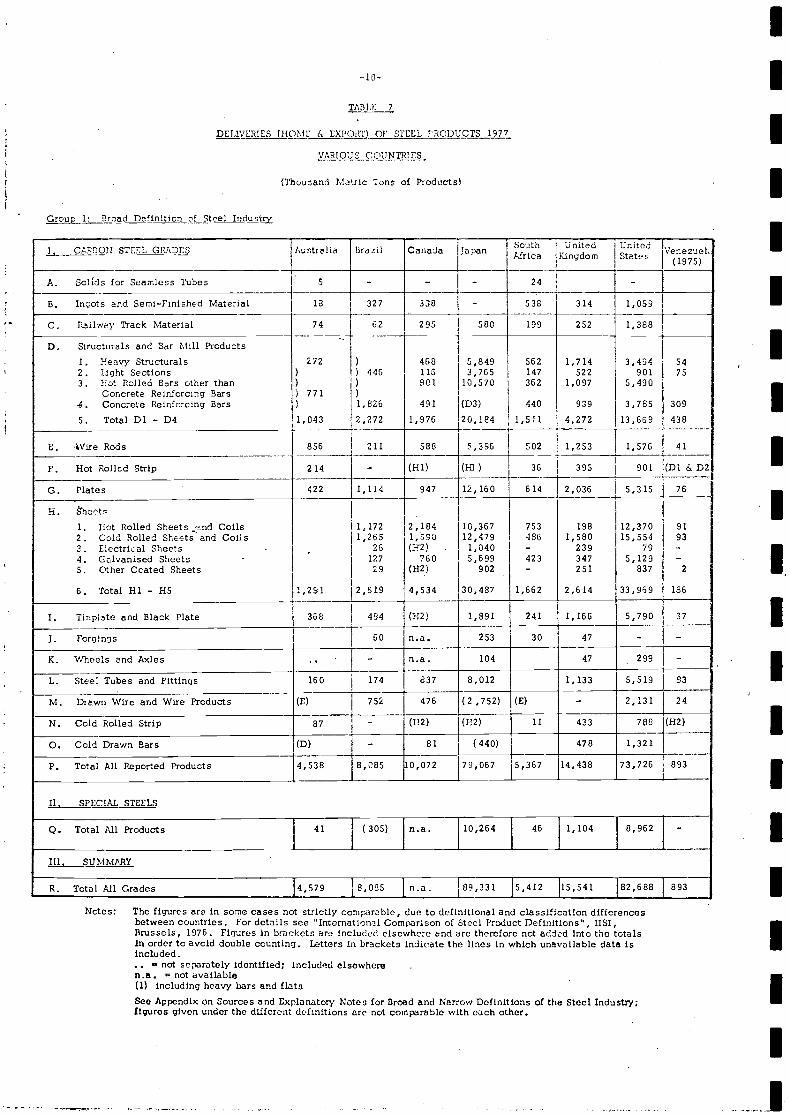
TJiBLE 7
DELIVERIES (HOME & EXPOÌLI) OF STEEL PRODUCTS 1977
VARIOUS COUNTRiES
(Thousand Metric Tons of Products)
Group 1: Broad Definition of Steel Indusi
Notes: The figures are In some cases not strictly comparoble, due to definitional and classification differencesbetween countries. For details see International Comparison of Stool Product Definitions", IISI,Brussels 1976. Figures In brackets are Includud elsewhere end are therefore not added into the totalsIn order to avoid double counting. Letters in brackets indicate the lines in which unavailable data isincluded.
= not separately identified; Included elsewheren.a. not available(1) includIng heavy bars and flatsSee Appendix on Sources arid Explanatory Notes for Broad and Narrow Definitions of the Steel Industry;figuras given under the different definitions are not comparable wìth each other.
I
-i
J CARBON STEEL GRADES Australia Brazil Canada Japan SouthAfrica
UnitedKingdom
UnitedStates Venezuel,,
(1975)
A. Solids for Seamless Tubes 5 - - - 24 -
B. Ingots nd Semi-Finished Material 13 327 338 - 538 314 1,059
C. Railwey Track Material 74 62 295 580 199 252 1,388
D. Structurals and Bar Mill Products1. Heavy Structurels 272 ) 460 5,849 562 1,714 3,494 542. Light Sections ) ) 446 119 3,765 147 522 901 753. Hot Rolled Bers other than ) ) 901 10,570 362 1,097 5,490
Concrete Reinforcing Bars ) 771-4. Concrete Reinforcing Bars ) 1,826 491 (D3) 440 939 3,785 309
5. Total Dl - D4 1,043 2,272 1,976 20,184 1,511 4,272 13,669 438
E. Wire Rods 856 211 588 5,396 502 1,253 1,576 41
F. Hot Roiled Strip 214 - (Hi) (Hi) 36 395 901 (Dl & D2
G. Plates 422 1,114 947 12,160 614 2,036 5,315 76
H. heete1. Hot Rolled Sheets end Coils 1,172 2,184 10,367 753 198 12,370 912. Cold Rolled Sheets and Coils 1,265 1,590 12,479 486 1,580 15,554 933. Electrical Sheets - 25 (H2) - 1,040 - 239 79 -4. Colvanised Sheets - 127 760 5,699 423 347 5,129 -5. Other Coated Sheets 29 (112) 902 - 251 837 2
6. Total Hl - 115 1,291 2,619 4,534 30,487 1,662 2,614 33,969 186
I. Tinplate and Black Plate 368 494 (112) 1,891 241 1,166 5,790 37
J. Forgings 60 n.a. 253 30 47 - -
K. Wheels end Axles .. - n.a. 104 47 299 -
L. Steel Tubes and Fittings 160 174 837 8,012 1,133 5,519 93
M. Drawn Wire and Wire Products (E) 752 476 (2 752) (E) - 2,131 24
N. Cold Rolled Strip 87 - (112) (112) 11 433 788 (112)
O. Cold Drawn Bers (D) - 81 (440) 478 1,321
P. Total All Reported Products 4,538 8,085 10,072 79,067 5,367 14,438 73,726 893
IL_ SPECIAL STEELS
Q. Total All Products 41 (305) n.a. 10,264 46 1,104 8,962 -
III SUMMARY -
R. Total All Grades 4,S79 8,085 n.e. 89,33l 5,412 15,541 82,688 893
-10- IIIIIIII
-II.
IIIIIIIIi
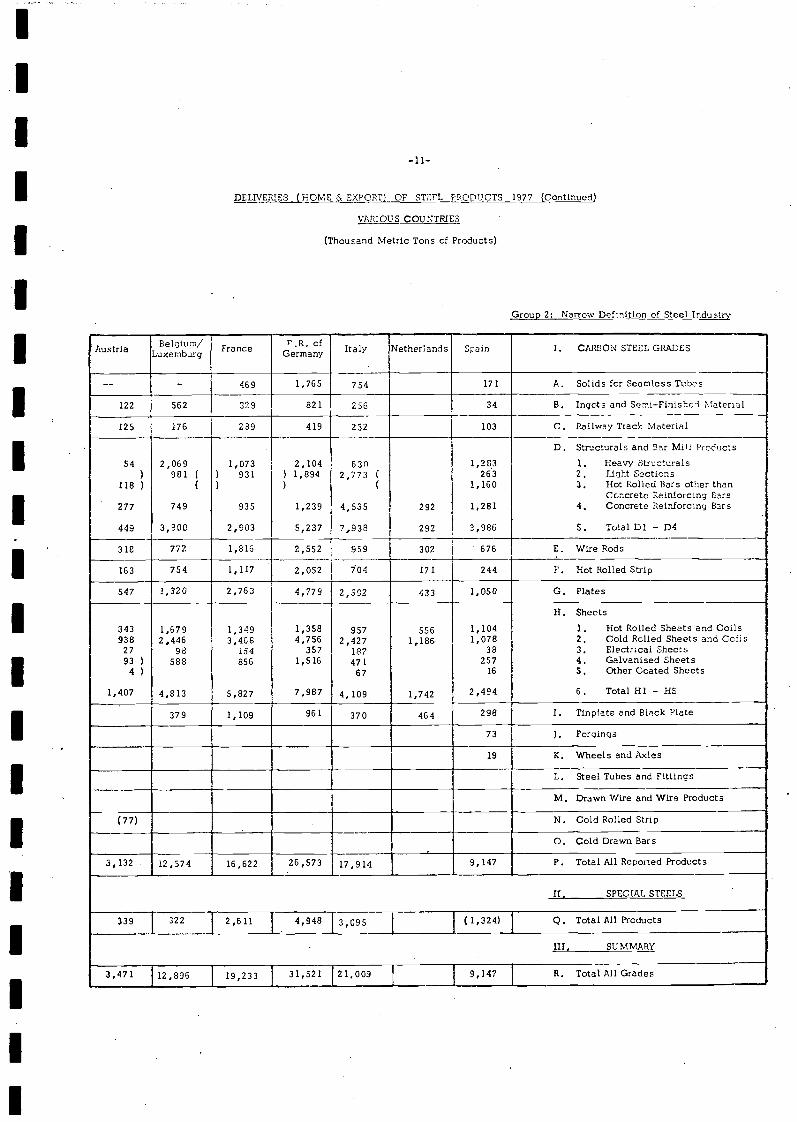
IIII DELIVERIES (HOME & EXPORT) OF STEEL PRODUCTS 1977 (Continued)
VARIOUS COU NTRIES
I (Thousand Metric Tons of Products)
IGroup 2: Narrow Definition of Steel Industiy
I
Austria Luxeb France J.of Italy Netherlands Spain I. CARBON STEEL GRADES
-- - 459 1,765 54 171 A. Solids for Seamless Tubes
122 562 329 821 256 34 3. Ingots and Semi-Finished Material
125 176 289 419 232 103 C. Railway Track Material
D. Structurais and Ear Mill Producls54 2,069 1,073 2,104 630 1,283 1. Heavy StructuraIs
981 ( ) 931 1,894 2,773 C 263 2. Light Sections118 ) ( ) ) ( 1,160 3. Hot Rolled Bars other than
Concrete Reinforcing Ears277 749 935 1,239 4,535 292 1,281 4. Concrete Reinforcing Bars
449 3,300 2,903 5,237 7,938 292 3,986 5. TotalDi - D4
318 772 1,816 2,552 959 302 676 E. Wire Rods
163 754 1,117 2,052 104 171 244 F. Hot Rolled Strip
547 1,320 2,763 4,779 2,592 433 1,050 G. Plates
H. Sheets
343 1,679 1,349 1,358 9s 1,104 1. Hot Roiled Sheets and Coils938 2,446 3,468 4,756 2,427 1186- 1,078 2. Cold Rolled Sheets and Coils
27 98 154 357 187 38 3. Electrical Sheets93 ) 588 856 1,516 471 257 4. Galvanlsed Sheets
4 ) 67 16 5. Other Coated Sheets
1,407 4,813 5,827 7,987 4,109 1,742 2,494 6. Total Hl - ES
379 1,109 961 370 464 298 I. Tinpiate and Black Plate
73 J. Forgirigs
19 K. Wheels and Axles
L. Steel Tubes and Fittings
M. Drawn Wire and Wire Products
(77) N. Cold Roiled Strip
O. Cold Drawn Bara
3,132 12,574 16,622 26,573 17,914 9,l47 P. Total All Reported Products
II, SPECtAL STEELS
T(1,324)
[Q. TotalAll Products339 322 2,611 4,948 3,095
III. SUMMAIW
3,471 12,896 19,233 31,521 121,009 9,147 R.
IIIIIIIIIIiIII
r;
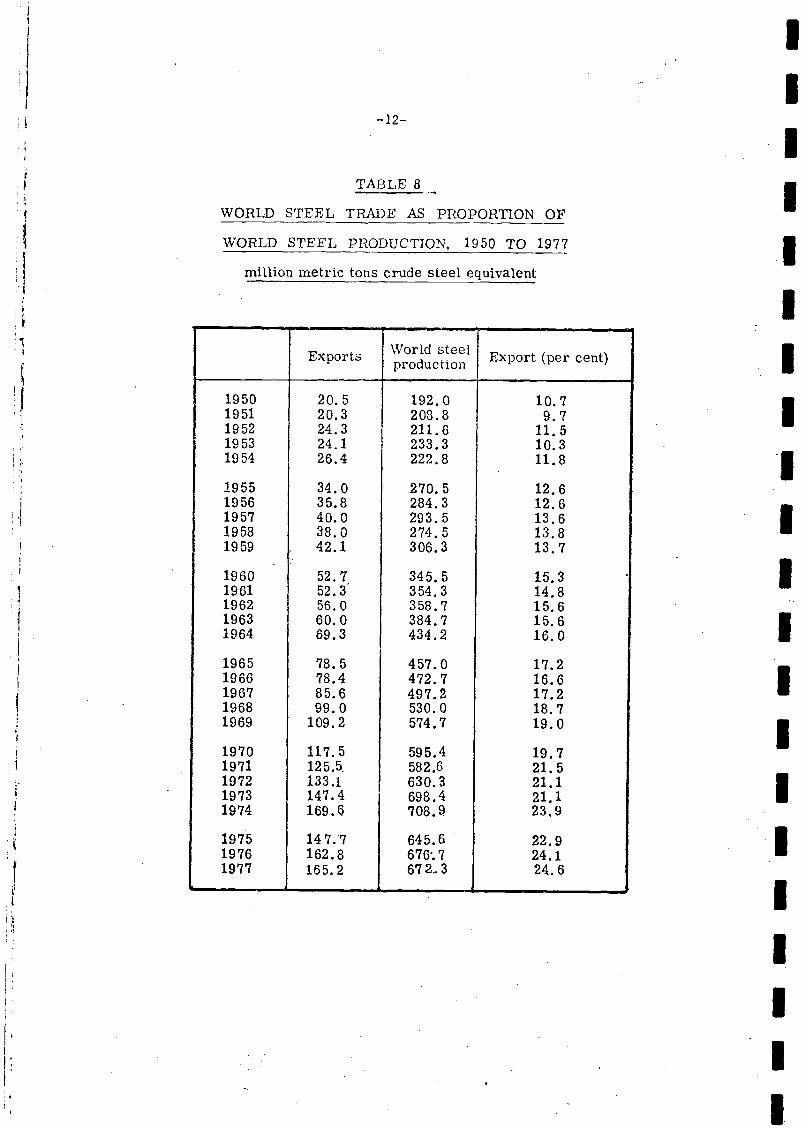
-12-
TABLE 8
WORLD STEEL TRADE AS PROPORTION OF
WORLD STEEL PRODUCTION, 1950 TO 1977
million metric tons crude steel equivalent
IIiI
III
Exports cc Export (per cent)
1950 20.5 192.0 10.71951 20.3 208.8 9.71952 24.3 211.6 11.51953 24.1 233.3 10.31954 26.4 222.8 11.8
1955 34.0 270.5 12.61956 35.8 284.3 12.61957 40.0 293.5 13.61958 38.0 274.5 13.81959 . 42.1 306.3 13.7
1960 52.7 345.5 15.31961 52.3 354.3 14.81962 56.0 358.7 15.61963 60.0 384.7 15.61964 69.3 434.2 16.0
1965 78. 5 457.0 17.21966 78.4 472.7 16.61967 85.6 497.2 17.21968 99.0 530.0 18.71969 109.2 574.7 19.0
1970 117.5 595.4 19.71971 125.5 582.6 21.51972 133.1 630.3 21.11973 147.4 698.4 21.11974 169.6 708.9 23.9
1975 147.7 645.6 22.91976 162.8 6767 24.11977 165.2 6723 24.6
IIIIi1
IIIIIIII
i
I
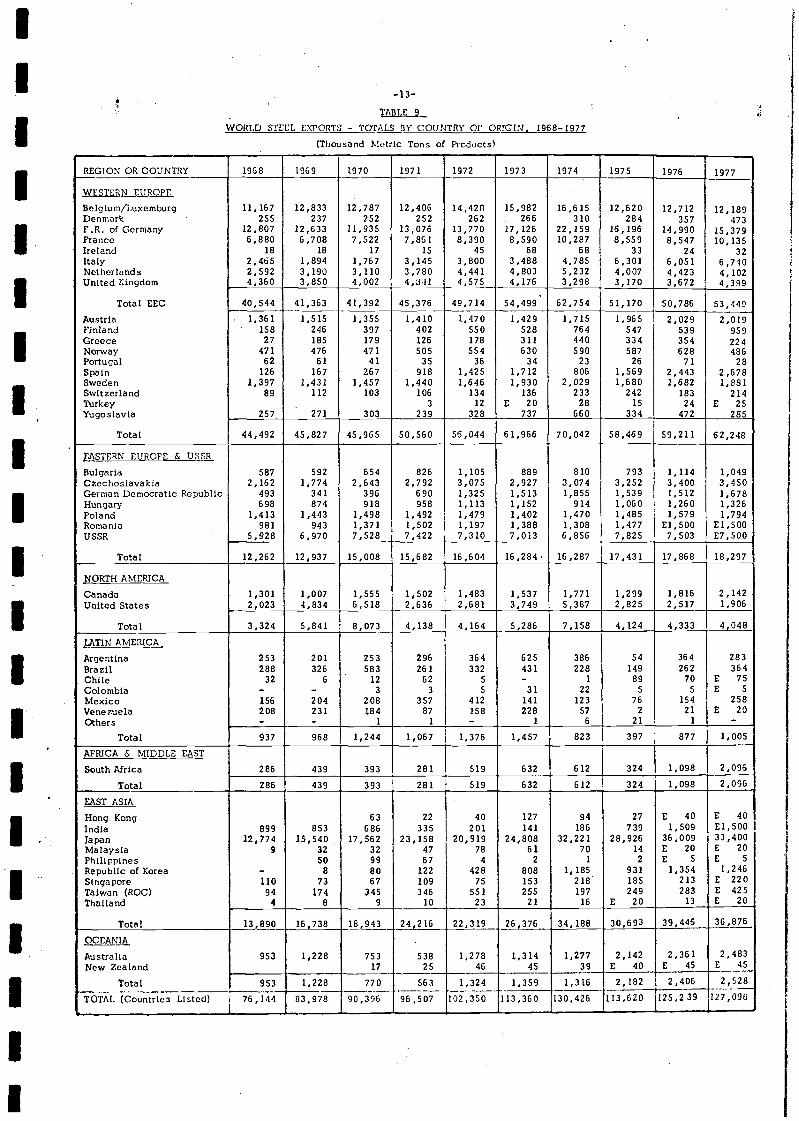
-13-
TABLC 9
WORLD STCFL EXPORTS - TOTALS Y COUNTRY OF ORTGIN. 1968-1977
(Thousand Metric Tons of Products)
REGION OR COUNTRY 1968 1969 97O 1971 1972 1973 1974 1975 1976 1977
WESTERN EUROPE
Bolgium/Luxemburg 11,167 12833 12,787 12,406 14,420 15,982 16,615 12,620 12,712 12,189Denmark . 255 237 252 252 262 266 310 284 357 473F.R. ofGermsny 12,807 12,633 11,935 13,076 13,770 17,126 22,159 16,196 14,990 15,379Franco 6,880 67O8 7,522 7,861 8,390 8,590 10,287 8,559 8,547 10,135Ireland 18 18 17 15 45 68 68 33 24 32Italy 2,465 1,894 1,767 3,145 3,800 3,488 4,785 6,301 6,051 6.740Netherlands 2,592 3,190 3,110 3,780 4,441 4,803 5,232 4,007 4,423 4,102UnitedKingdom 4,360 3,850 4,002 4,l41 4,575 4,176 3,298 3,170 3,672 4,399
Total EEC 40,544 41,363 41,392 45,376 49,714 54,499' 62,754 51,170 50,786 53,449Austria . 1,361 1,515 1,355 1,410 1,470 1,429 1,715 1,965 2,029 2,019Finland . 158 246 397 402 550 528 764 547 539 959Greece 27 185 179 126 178 311 440 334 354 224Norway 471 476 471 505 554 630 590 587 628 486Portugal 62 61 41 35 36 34 23 26 71 28Spain 126 167 267 918 1,425 1,712 806 1,569 2,443 2,678Sweden 1,397 1,431 2,457 1,440 2,646 1,930 2,029 1,680 2,682 1,881Switzerland 89 112 103 106 134 136 233 242 183 214Turkey 3 12 E 20 28 15 24 E 25Yugoslavia 257 271 303 239 328 737 660 334 472 285
Total 44,492 45,827 45,965 50,560 56,044 61,966 70,042 58,469 59,222 62,248
EASTERN EUROPE & USSR
Bulgaria 587 592 654 826 1,105 889 810 793 1,114 1,049Czechoslavakia 2,162 1,774 2,643 2,792 3,075 2,927 3,074 3,252 3,400 3,450German Democratic Republic 493 341 396 690 1,325 1,513 1,855 1,539 1,512 1,678Hungary 698 874 918 958 1,113 1,152 914 1,060 1,260 1,326Poland 1,413 1,443 1,498 1,492 1,479 1,402 1,470 1,485 1,579 1,794Romania 981 943 1,371 1,502 1,197 1,388 1,308 1,477 E1,500 El,500USSR 5,928 6,970 7,528 7,422 7,310 7,013 6,856 7,825 7,503 87,500
Total 12,262 12,937 15,008 15,682 16,604 16,284 16,287 17,431 17,868 18.297
NORTH AMERICA
Canada 1,301 1,007 1,555 1,502 1,483 1,537 1,771 1,299 1,816 2,142UnitedStates 2,023 4,834 6,518 2,636 2,681 3,749 5,387 2,825 2,517 1,906
Total 3,324 5,841 8,073 4,138 4,164 5,286 7,158 4,124 4,333 4,048
LATIN AMERICA
253 201 253 296 364 625 386 54 364 283rgentinaBrazil 288 326 583 261 332 431 228 149 262 364Chile 32 6 12 62 5 - i 89 70 E 75Colombia - - 3 3 5 3! 22 5 5 E 5
Mexico 156 204 208 357 412 141 123 76 154 258Venezuela 208 231 184 87 158 228 57 2 21 E 20Others - - 1 1 - 1 6 21 1 -
Total 937 968 1,244 1,067 1,376 1,457 823 397 877 1,005
APRICA & MIDDLE EAST
South Africa 286 439 393 281 519 632 612 324 1,098 2,096
Total 286 439 393 281 519 632 612 324 1,098 2,096
EAST ASIA
Hong Kong 63 22 40 127 94 27 E 40 E 40IndIa 899 853 686 335 201 141 186 739 1,509 81,500 I
Japan 12,774 15,540 17,562 23,158 20,919 24,808 32,221 28,926 36,009 33,400MalaysIa 9 32 32 47 78 61 70 14 E 20 E 20Philippines 50 99 67 4 2 1 2 E 5 E 5
Republic of Korea - 8 80 122 428 808 1,185 931 1,354 1,246Singapore 110 73 67 109 75 153 218 185 213 E 220Taiwan (ROC) 94 174 345 346 551 255 197 249 283 E 425Thailand 4 8 9 10 23 21 16 E 20 13 E 20
Total 13,890 16,738 18,943 24L216 22,319 26Z 34,188 30,693 39,446 36,876
OCEANIA
Australia 953 1,228 753 538 1,278 1,314 1,277 2,142 2,361 2,483New Zealand 17 25 46 45 39 E 40 E 45 E 45
Total 953 1,228 770 563 1,324 1,359 1,316 2,182 2,406 2,528
TOTAL (Countries Listed) 76,144 83,978 90,396 96,507 102,350 113,360 130,426 113,620 125,239 127,090I-
iIIIIIIIIIIIiII
I.iI
-14-
TAFLE fl
WORLD STEEL IMPORTS - TOTALS 1W 1MPORTNG COJNTRIESj8-1977
(Thousard Mtr1c Tons of Products)
II
iiii
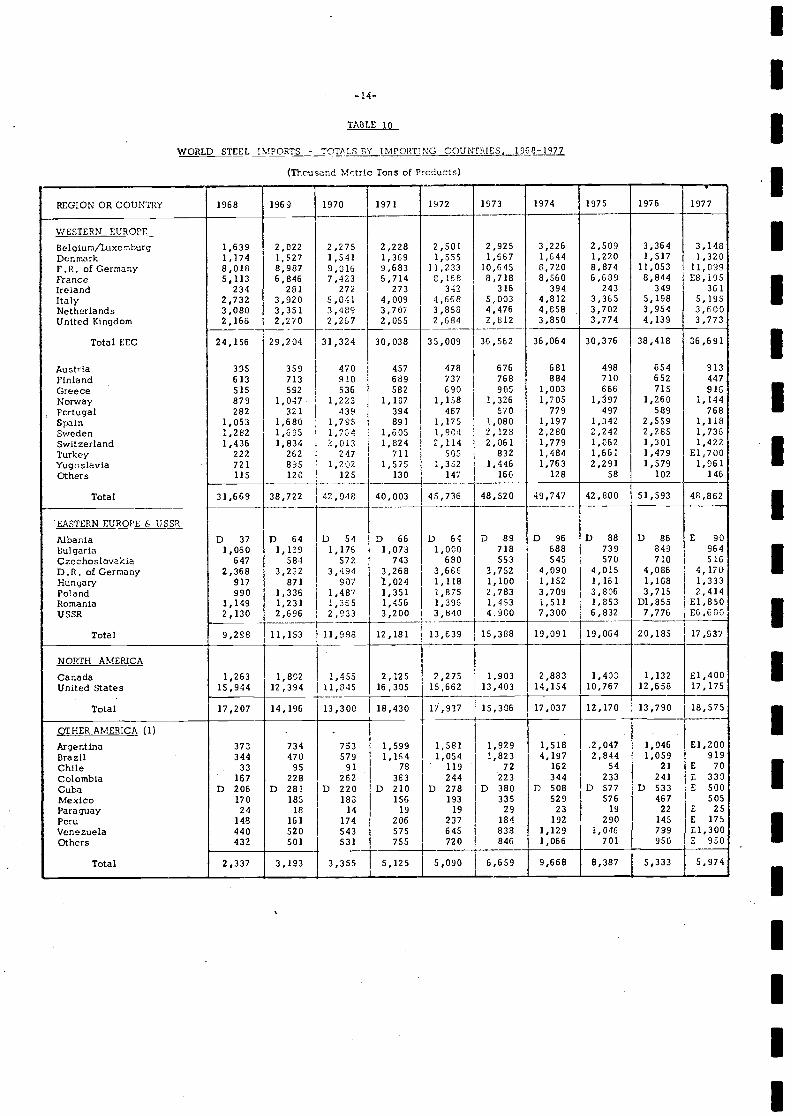
REGION OR COUNTRY 1968 1969 1970 1971 1972 1973 1974 1975 1976 1977
WESTERN EUROPE
Belgium/Luxernburg 1,639 2,022 2,275 2,228 2,501 2,925 3,226 2,509 3,364 3,148Denmark 1,174 1,527 1,541 1,369 1,555 1,657 1,644 1,220 1,517 1,320F.R. ofGerrnny 8,018 8,987 9,016 9,683 11,233 10,645 8,720 8,874 11,053 11,099France 5,113 6,846 7,423 5,714 8,168 8,718 8,560 6,689 8,844 E8,195Ireland 234 281 272 273 342 316 394 243 349 351Italy 2,732 3,920 5,041 4,009 4,658 5,003 4,812 3,365 5,198 5,195Netherlands 3,080 3,351 3,489 3,707 3,858 4,476 4,858 3,702 3,954 3,600United Kingdom 2,166 2,270 2,267 2,055 2,684 2,812 3,850 3,774 4,139 3,773
Total EEC 24,156 29,204 31,324 30,038 35,009 36,562 36,064 30,375 38,418 36,691
Austria 395 359 470 457 478 676 681 498 654 813Finland 613 713 910 689 737 768 884 710 652 447Greece 515 592 536 582 690 905 1,003 666 715 915Norway 879 1,047 1,223 1,107 1,158 1,326 1,705 1,97 1,260 1,144Portugal 282 32.1 439 394 467 570 779 497 589 768Spain 2,053 1,680 1,795 891 1175 1,080 1,197 1,342 2,559 1,118Sweden 1,282 1,695 1,7C.4 1,505 1,904 2,128 2,280 2,242 2,285 1,736Switzerland 1,436 1,834 2,013 1,824 2,114 2,061 1,779 1,062 1,301 1,422Turkey 222 262 247 711 505 832 1,484 1,661 1,479 £1,700Yugoslavia . 721 895 1,202 1,575 1,352 1,446 1,763 2,291 1,579 1,961Others 115 120 125 130 147 166 128 58 102 146
Total 31,669 38,722 42,048 40,003 45,736 46,520 49,747 42,800 51,593 48,862
EASTERN EUROPE & USSR
Albania D 37 D 64 D 54 D 66 D 64 D 89 D 96 D 88 D 86 E 90Bulgaria 1,060 1,139 1,176 1,073 1,000 718 688 739 849 964Czechoslovakia 647 584 572 743 680 553 545 570 710 516D.R. ofGermarry 2,368 3,232 3,494 3,268 3,666 3,752 4,090 4,015 4,086 4,170Hungary 917 871 907 1,024 1,118 1,100 1,152 1,161 1,108 1,333Poland 990 1,336 1,487 1,351 1,875 2,783 3,709 3,806 3,715 2,414Romania 1,149 1,231 1,355 1,456 1,396 1,493 1,511 1,853 D1,855 £1,850USSR 2,130 2,696 2,933 3,200 3,840
I4900 7,300 6,832 7,776 E6,600
Total 9,298 11,153 11,988 12,181 13,639 15,388 19,091 19,064 20,185 17,937
NORTH AMERICA
Canada 1,263 1,802 1,455 2,125 2,275 1,903 2,883 1,403 1,132 £1,400United States 15,944 12,394 11,845 16,305 15,662 13,403 14,154 10,767 12,658 17,175
Total 17,207 14,196 13,300 18,430 17,937 15,306 17,037 12,170 13,790 18,575
OTHER AMERICA (1)
Argentina 373 734 733 1,599 1,581 1,929 1,518 .2,047 1,046 E1,200Brazil 344 470 579 1,184 1,054 5,823 4,197 2,844 1,059 919Chile 33 95 91 78 119 72 162 54 21 E 70Colombia 167 228 262 363 244 223 344 233 241 E 333Cuba D 206 D 281 D 220 D 210 D 278 D 380 D 508 D 577 D 533 E 500Mexico 170 185 183 156 193 335 529 576 467 505Paraguay 24 18 14 19 19 23 23 19 22 E 25Peru 148 161 174 206 237 184 192 290 145 E 175Venezuela 440 520 543 575 645 838 1,129 1,046 799 E1,300Others 432 501 531 755 720 846 1,066 701 950 E 950
Total 2,337 3,193 3,355 5,125 5,090 6,659 9,668 8,387 5,333 5,974
IIIiIiiiiiIiIIi
iii -15-
III
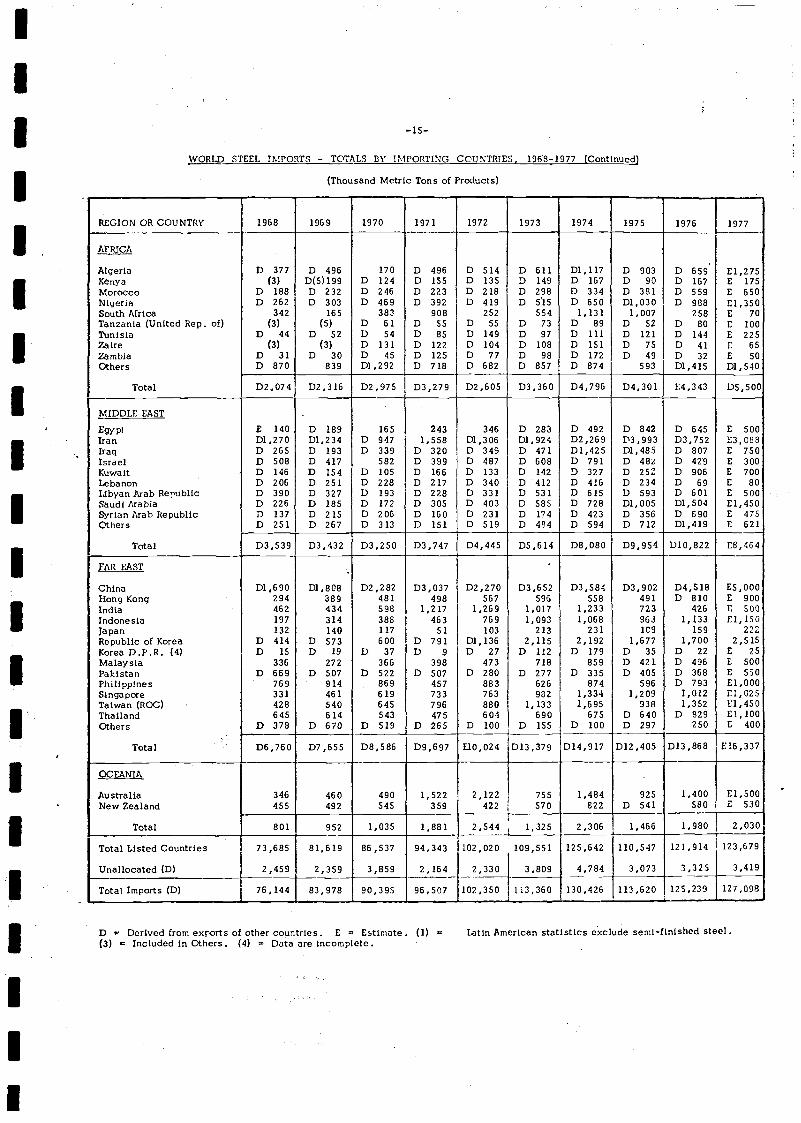
WORLD STEEL IMPORTS - TOTALS flY !MPORTIG COUNTR!ES, 1968-1977 (Conttnued)
(Thousand Metric Tons of Products)
D Derived from exports of other countries. E Estimate. (1) Latin American statistics exclude semi-finished steel.(3) Included in Others. (4) Data are incompleto.
REGION OR COUNTRY 1968 1969 1970 1971 1972 1973 1974 1975 1976 1977
AFRICA
Algeria D 377 D 496 170 D 496 D 514 D 611 Dl,117 D 903 D 659 El,275Kenya (3) D(S)199 D 124 D 155 D 135 D 149 D 167 D 90 D 167 E 175Morocco D 188 D 232 D 246 D 223 D 218 D 298 D 334 D 381 D 559 E 550Nigeria D 262 D 303 D 469 D 392 D 419 D 515 D 650 Dl.030 D 988 E1,350SouthMrica 342 165 383 908 252 554 ll31 1,007 258 E 70Tanzania (United Rep. of) (3) (5) D 61 D $5 D 55 D 73 D 89 D 52 D 80 E 100Tunisia D 44 D 52 D 54 D 85 D 149 D 97 D 111 D 121 D 144 E 225Zaire (3) (3) D 131 D 122 D 104 D 108 D 151 D 75 D 41 E 65Zambia D 31 D 30 D 45 D 125 D 77 D 98 D 172 D 49 D 32 E 50Others D 870 839 D1,292 D 718 D 682 D 857 D 874 593 Dl,415 D1,540
Total D2074 D2,316 D2,975 D3,279 D2,605 D3,360 D4796 D4,301 F.4,343 D5,500
MIDDLE EAST
Egypt 140 D 189 165 243 346 D 283 D 492 D 842 D 645 E 500Iran D1,270 Dl,234 D 947 1,558 Dl,306 Dl,924 D2,269 D3,993 D3,752 E3,089Iraq D 265 D 193 D 339 D 320 D 349 D 471 D1,425 D1,485 D 807 E 750Israel D 508 D 417 582 D 399 D 487 D 608 D 791 D 48Z D 429 E 300Kuwait D 146 D 154 D 105 D 166 D 133 D 142 D 327 D 252 D 906 E 700Lebanon D 206 D 251 D 228 D 217 D 340 D 412 D 416 D 234 D 69 E 80LlbyanArabRepublic D 390 D 327 D 193 D 228 D 331 D 531 D 615 D 593 D 601 E 500SaudlArabia D 226 D 185 D 172 D 305 D 403 D 585 D 728 Dl,005 Dl,504 El,450Syrian Arab Republic D 137 D 215 D 206 D 160 D 231 D 174 D 423 D 356 D 690 E 475Others D 251 D 267 D 313 D 151 D 519 D 484 D 594 D 712 D1,419 E 621
Total D3,539 D3,432 D3,250 D3,747 D4,445 D5,614 D8,080 D9,954 D10,822 E8,464
FAR EAST
China Dl,690 Dl,808 D2,282 D3,037 D2,270 D3,652 D3,584 D3,902 D4,518 E5,000Hong Kong 294 389 481 498 567 596 558 491 D 810 E 900India 462 434 598 1,217 1,269 1,017 1,233 723 426 E 500IndonesIa 197 314 388 463 769 1,093 1,068 963 1,133 E1,I50Japan 132 140 117 51 103 213 231 1C9 159 222Republicof Korea D 414 D 573 600 D 791 Dl,136 2,115 2,192 1,677 1,700 2,515Korea D.P.R. (4) D 15 D 19 D 37 D 9 D 27 D 112 D 179 D 35 D 22 E 25Malaysia 336 272 366 398 473 718 859 D 421 D 496 E 500Pakistan D 669 D 507 D 522 D 507 D 280 D 277 D 335 D 405 D 368 E 550Philippines 769 914 869 457 883 626 874 596 D 793 El,000Singapore 331 461 619 733 763 982 1,334 1,209 1,012 Ei3O25Taiwan (ROC) 428 540 645 796 880 1,133 1,695 938 1,352 E1,450Thailand 645 614 543 475 604 690 675 D 640 D 829 E1,l00Others D 378 D 670 D 519 D 255 D 100 D 155 D 100 D 297 250 E 400
Total D6,760 D7,655 D8,586 D9,697 E10,024 D13,379 D14,917 D12,405 Dl3,868 E16,337
OCEANIA
Australia 346 460 490 1,522 2,122 755 1,484 925 1,400 El,500New Zealand 455 492 545 359 422 570 822 D 541 580 E 530
Total 801 952 1,035 1,881 2,544 1,325 2,306 1,466 1,980 2,030
Total Listed Countries 73,685 81,619 86,537 94,343 102,020 109,551 125,542 110,547 121,914 123,679
Unallocated (D) 2,459 2,359 3,859 2,164 2,330 3,809 4,784 3,073 3,325 3,419
Total Imports (D) 76,144 83,978 90,395 96,507 102,350 113,360 130,426 113,620 125,239 127,098
iiIiIIIiiIiIiII
TA
BL
E 1
1
WO
RL
D S
TE
EL
EX
POR
TS
BY
RE
GIO
N O
F O
RIG
IN
(tho
usan
d m
etri
c to
ns o
f pr
oduc
ts)
Bro
ad d
efin
ition
of
the
stee
l ind
u5tr
;
- -
- -
- -
- -
- -
- -
- -
- -
- -
- -
-
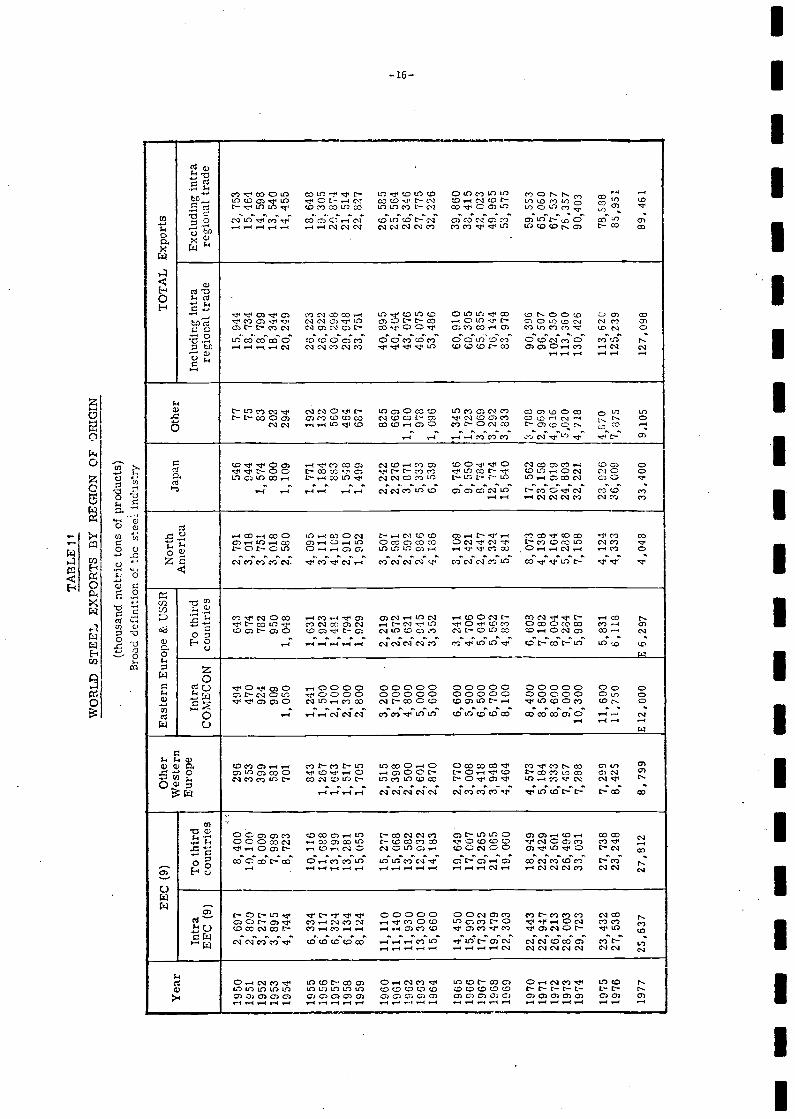
Yea
rE
EC
(9)
Oth
erW
este
rnE
urop
e
Eas
tern
Eur
ope
& U
SSR
Nor
thA
mer
ica
Japa
nO
ther
TO
TA
L E
xpor
ts
Intr
aE
EC
(9)
To
thir
dco
untr
ies
Intr
aC
OM
EC
ON
To
thir
dco
untr
ies
Incl
udin
g in
tra
regi
onal
trad
eE
xclu
ding
intr
are
gion
al tr
ade
1950
2,69
78,
400
296
494
643
2779
154
677
15,9
4412
,753
1951
2,80
010
,100
353
470
074
3,01
804
475
18,7
3415
,464
1952
3,27
78,
009
399
924
782
3, 7
51i,
574
8318
, 799
14, 5
9819
533,
895
7,98
958
190
905
03,
018
800
202
18,3
4413
,540
1954
4,74
4.8
,723
701
1,05
01,
048
,580
1,10
929
420
,249
14,4
55
1955
6,33
410
, 116
.84
31,
241
1,63
14,
095
1,77
119
2.26
, 223
18, 6
4819
566,
117
11,6
881,
267
1,50
01,
923
3,11
11,
184
132
26,9
2219
,305
1957
6,32
413
.199
1,64
32,
100
1,43
14,
108
883
560
30,2
9820
,874
1958
6, 1
3413
, 281
1, 5
172,
300
1,79
42,
910
1, 5
4846
429
, 948
21, 5
1419
598,
124
15, 0
551,
705
2,80
01,
029
1,95
21,
499
687
33, 7
5122
, 827
1960
11,1
1015
,277
2,51
53,
200
2,21
93,
507
2,24
282
540
,895
26,5
8510
6111
, 140
15, 0
682,
398
3,70
02,
572
2, 5
812,
276
669
40, 4
0425
, 564
1962
11,9
3013
, 582
2, 5
004,
800
2,62
12,
592
3,87
11,
180
43, 0
7626
, 346
1963
13, 3
0012
,932
2,60
15,
000
2,04
52,
086
5,33
397
846
, 075
27, 7
7519
6415
,660
14,1
832,
870
5,60
03,
352
4,18
66,
539
1,09
653
,486
32,2
26
1965
14,4
5019
,649
2,77
06,
600
3,24
13,
109
9,74
61,
345
60,9
1039
,860
1066
15,9
9017
, 607
3,00
85,
900
4,70
62,
421
9, 5
501,
723
60, 3
0538
, 415
1967
17, 3
3219
,265
3,41
86,
500
5,04
02,
447
8, 7
843,
069
65; 8
5542
, 023
1968
19,4
7921
,065
3,94
86,
700
5,56
23,
324
12,7
743,
202
76,1
4449
,965
1913
922
, 303
19, 0
604,
464
8,10
04,
837
5,84
115
, 540
3,83
383
, 978
53, 5
75
1970
22,4
4318
,949
4,57
38,
400
6,60
38,
073
17,5
623,
788
90,3
0659
,553
1971
22,9
4722
,429
5,18
48,
500
7,18
24,
138
23,1
582,
969
96,5
0765
,060
1972
26, 2
1323
, 501
6,33
38,
600
8,00
44,
164
20, 9
194,
616
102,
350
67, 5
3719
7328
,003
26,4
967,
467
9,00
07,
284
5,28
624
,803
5,02
011
3,36
076
,357
1974
29, 7
2333
, 031
7,28
810
,300
5,98
77,
158
32, 2
214,
718
130,
426
90,4
03
1975
23, 4
3227
, 738
7,29
911
,600
5,83
14,
124
28,0
264,
670
113,
620
78,5
8819
7627
,538
23,2
488,
425
11,7
506,
118
4,33
336
,009
7,87
512
5,23
985
,951
1977
25,6
3727
,812
8, 7
99E
12,
000
E 6
,297
4,04
333
,400
9,10
512
7,09
889
, 461
IIIIIII
II
-17-TAILi 12
WORLD STEEL EXPORTS BY REGION OF ORtGN
percentages
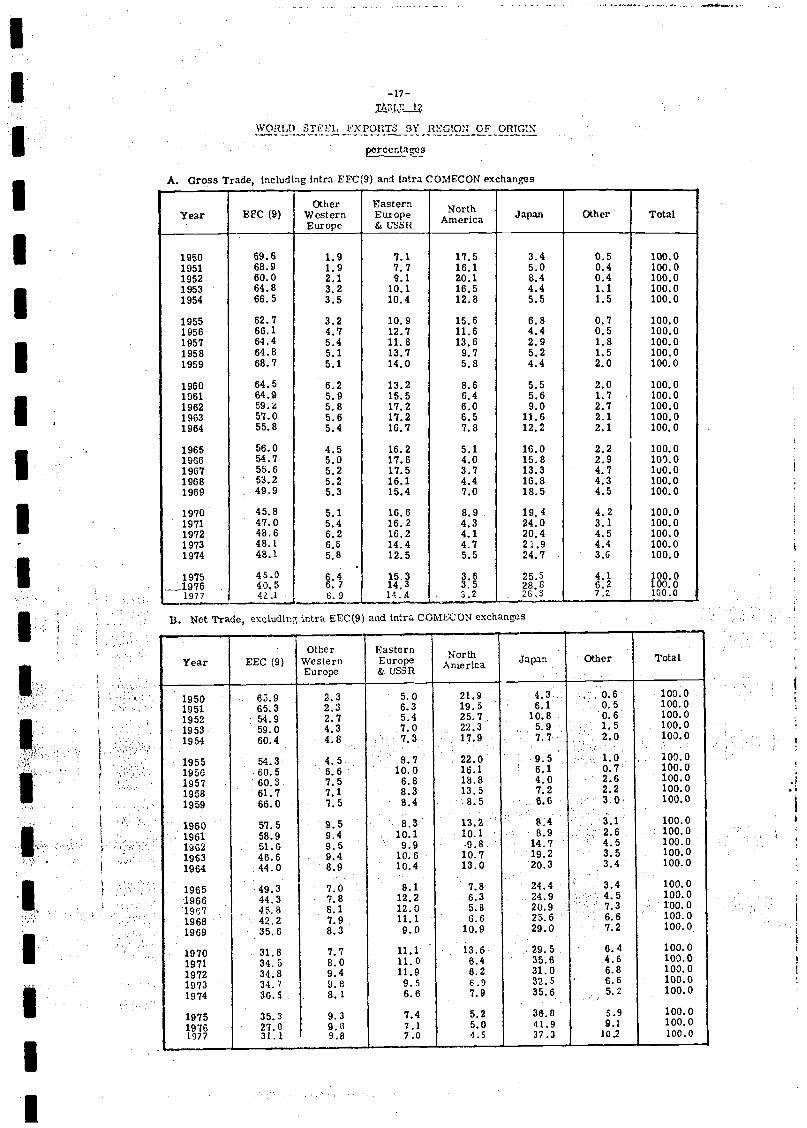
A. Gross Trade, including intra EFC(9) and Intra COMECON exchanges
B. Net Trade, excluding nira EEC(9 and tntra COMECON exchanges
Year EEC (9)Other
WesternEurope
EasternEurope& USSR
N hAmerica Japan Other Total
1950 69.6 1.9 7.1 17.5 3.4 0.5 100.01951 68.9 1.9 7.7 16.1 5.0 0.4 100.01952 60.0 2.1 9.1 20.1 8.4 0.4 100.01953 64.8 3.2 10.1 16.5 4.4 1.1 100.01954 66.5 3.5 10.4 12.8 5.5 1.5 100.0
1955 62.7 3.2 10.9 15.6 6.8 0.7 100.01956 66.1 4.7 12.7 11.6 4.4 0.5 100.01957 64.4 5.4 11.8 13.6 2.9 1.8 100.01958 64.8 5.1 13.7 9.7 5.2 1.5 100.01959 68.7 5.1 14.0 5.8 4.4 2.0 100.0
1960 64.5 6.2 13.2 8.6 5.5 2.0 100.01961 64.9 5.9 15.5 6.4 5.6 1.7 100.01962 59.Z 5.8 17.2 6.0 9.0 2.7 100.01963 57.0 5.6 1'7.2 6.5 11.6 2.1 100.01964 55.8 54 16.7 7.8 12.2 2.1 100.0
1965 56.0 4.5 16.2 5.1 16.0 2.2 100.01966 54. 5.0 17.6 4.0 15.8 2.9 103.01967 55.6 5.2 17.5 3.7 13.3 4.7 luO.01968 53.2 5.2 16.1 4.4 16.8 4.3 100.01969 49.9 5.3 15.4 7.0 18.5 4.5 100.0
1970 45.8 5.1 16.6 8.9 19.4 4.2 100.01971 47.0 5.4 16.2 4.3 24.0 3.1 100.01972 48.6 6.2 16.2 4.1 20.4 4.5 100.01973 48.1 6.5 14.4 4.7 21.9 4.4 100.01974 48.1 5.8 12.5 5.5 24.7 3.6 100.0
1975 45.0 6.4 15.3 3.6 25.5 4.1 100.01976 40.5 6.7 14.3 3.5 28.8 6.2 100.01977 42.1 6.9 14.4 3.2 26.3 7.2 100.0
Year EEC (9)Other
WesternEurope
EasternEurope& USSR
Aeca» ri Japan Other Total
1950 65.9 2.3 5.0 21.9 4.3 . ; . 0.6 100.01951 65.3 2.3 6.3 19.5 ' 6.1 0. 5 100.01952 54.9 2.7 5.4 25.7 10.8 0.6 100.01953 59.0 4.3 7.0 22.3 ,. 5.9 ; 1.5 100.01954 604 48 73 179 77 20 1000
1955 543 45 87 220 95 10 10001956 60.5 6.6 10.0 16.1 6.1 0.7 100.01957 '60.3 7.5 6.8 18.8 4.0 2.6 100.01958 61.7 7.1 8.3 13.5 7.2 2.2 100.01959 66.0 .5 8.4 8.5 6.6 3.0 100.0
1960 5'? 5 9 5 8 3 13 2 8 4 3 1 100 01961 59.9 9.4 10.1 10.1 '8.9 ':' 2.6 100.0
1962 51.6 9.5 9.9 9.8 14.7 4.5, 100.01963 46.6 9.4 10.6 10.7 19.2 3.5 100.01964 44.0 8.9 10.4 13.0 20.3 3.4 100.0
1965 49.3 7.0 8.1 7.8' 24.4 k 34 100.0
'1966 44.3 7.8 12.2 6.3 24.9 '.'' 4.5 100.01g7 'i 8 81 12 0 58 209 73 10001968 42.2 7.9. 11.1 6.6 25.6 '.6.6 100.01969 35.6 8.3 9.0 10.9 29.0 7.2 100.0
1970 31.8 7.7 11.1 13.6 .29.5 6.4 100.01971 34.5 8.0 11.0 6.4 35.6 4.6 100.01972 34.8 9.4 11.9 6.2 31.0 6.8 100.01973 34.7 9.8 9.5 6.9 32.5 6.6 100.01974 313.5 8.1 6.6 7.9 35.6 5.2 100.0
1975 35.3 9.3 7.4 5.2 36.8 5.9 100.019761977
27.031.1
9.09.8
7.17.0
5.04.5
41.937.3
9.110.2
100.0100.0
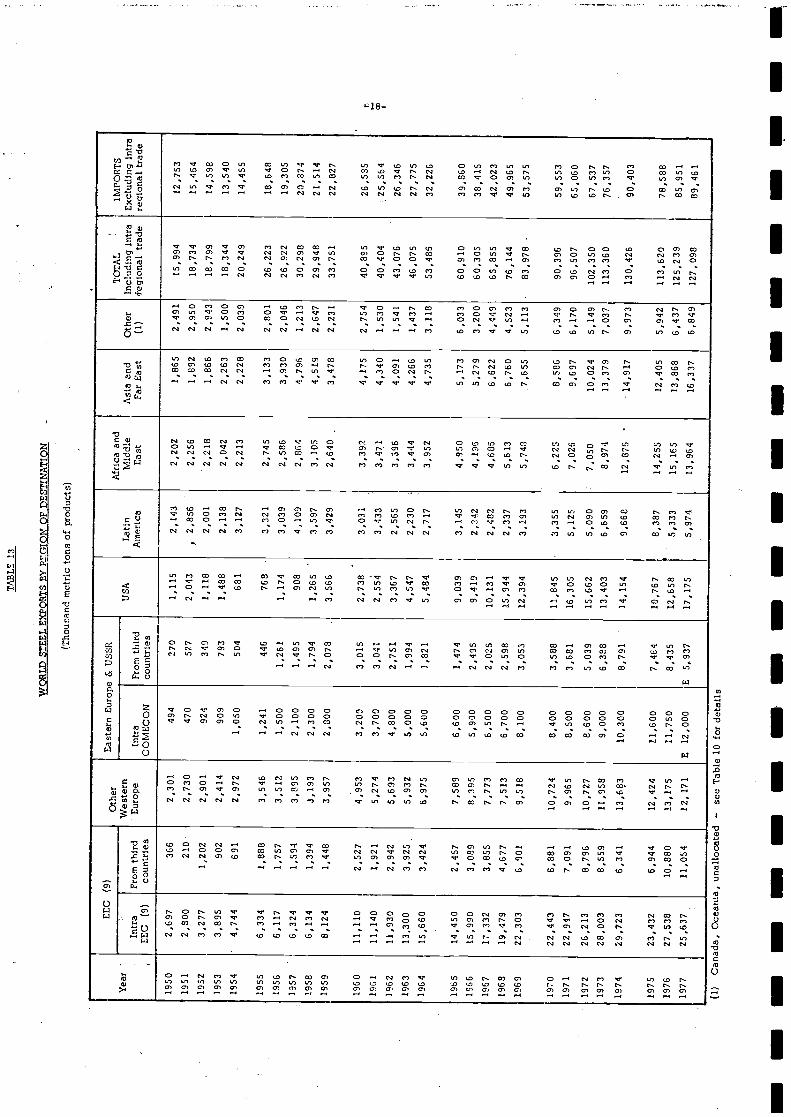
arta
oa, o
cean
a, u
nallo
cate
d -
see
Tab
le 1
0 fo
r de
tails
TA
BL
E 1
3
WO
RL
D S
TE
EL
EX
POR
TS
SY R
EG
ION
OF
DE
STIN
AT
ION
(Tho
ucan
d m
etri
c to
ne o
f pr
oduc
ts)
- -
- -
- -
- -
- -
- -
- -
- -
- -
- -
-
Yea
r
EE
Cot
her
Eas
tern
Eur
ope
& U
SSR
Lat
inA
mer
ica
Mi
and
MId
dle
Eas
tA
sia
and
Far
Eas
tO
ther
(1)
TO
LA
LIn
clud
ing
intr
a4e
glon
a! tr
ade
IMPO
RT
SE
xclu
ding
intr
are
gion
al tr
ade
Intr
aE
EC
(9)
From
thir
dco
untr
ies
Wes
tern
Eur
ope
Intr
aC
OM
EC
ON
From
thir
dco
untr
ies
USA
1950
2.69
736
62,
301
494
270
1,11
52,
143
2,20
21,
865
2,49
115
,994
12,7
5319
512,
S00
210
2,73
047
052
72,
043
,2,
856
2,25
61,
892
2,95
018
,734
15,4
6419
523.
277
1,20
22,
901
924
349
1,11
82,
001
2,21
81,
866
2,84
318
,799
14,5
9819
533,
895
902
2,41
490
979
31,
488
2,13
82,
042
2,26
31,
500
18,3
4413
,540
1954
4,74
469
12,
972
1,05
050
468
13,
127
2,21
32,
228
2,03
920
,249
14,4
55
1955
6,33
41,
886
3,54
61,
241
446
768
3,32
12,
745
3,13
32,
801
26,2
2318
,648
1956
6,11
71,
757
3,51
21,
500
1,26
11,
174
3,03
92,
586
3,93
02,
046
26,9
2219
,305
1957
6,32
41,
594
3,89
52,
100
1,49
590
84,
109
2,86
44,
796
1,21
330
,298
20,8
7419
586,
134
1,39
43,
193
2,30
01,
794
1,26
53,
597
3,10
54,
519
2,64
729
,948
21,5
1419
598,
124
1,44
83,
957
2,00
02,
078
3,56
63,
429
2,64
03,
478
2,23
133
,751
22,8
27
1960
11,1
102,
527
4,95
33,
200
3,01
52,
738
3,03
13,
392
4,17
52,
754
40,8
9526
,535
1961
11,1
401,
921
5,27
43,
700
3,04
12,
554
3,43
33,
471
4,34
01,
530
40,4
0425
,S64
1962
11,9
302,
942
5,69
34,
800
2,75
13,
367
2,56
53,
396
4,09
11,
541
43,0
7626
,346
1963
13,3
003,
925
5,93
25,
000
1,99
44,
547
2,23
03,
444
4,26
61,
437
46,0
7527
,775
1964
15,6
603,
424
6,97
55,
600
1,82
15,
484
2,71
73,
952
4,73
53,
118
53,4
8632
,226
1965
14,4
502,
457
7,58
96,
600
1,47
49,
039
3,14
54,
950
5,17
36,
033
60,9
1039
,860
1956
15,9
903,
089
8,39
55,
900
2,49
59,
419
2,34
24,
196
5,27
93,
200
60,3
0538
,415
1967
17,3
323,
855
7,77
36,
500
2,02
510
,131
2,48
24,
605
6,62
24,
149
65,8
5542
,023
1968
19,4
794,
677
7,51
36,
700
2,59
815
,944
2,33
75,
613
6,76
04,
523
76,1
4449
,965
1969
22,3
036,
901
9,51
88,
100
3,05
312
,394
3,19
35,
7413
7,65
55,
113
83,9
7853
,575
1970
22,4
436,
881
10,7
248,
400
3,58
811
,845
3,35
56,
225
8,58
66,
349
90,3
9559
,553
1971
22,9
477,
091
9,96
58,
500
3,68
116
,305
5,12
57,
026
9,69
76,
170
96,5
0765
,060
1972
25,2
138,
795
10,7
278,
600
5,03
915
,662
5,09
07,
050
10,0
245,
149
102,
350
67,5
3719
7328
,003
8,55
911
,958
9,00
06,
388
13,4
036,
659
8,97
113
,379
7,03
711
3,36
076
,357
1974
29,7
236,
341
13,6
8310
,300
8,79
114
,154
9,66
812
,876
14,9
179,
973
130.
426
90,4
03
1975
1976
23,4
326,
944
12,4
2411
,600
7,46
410
,767
8,38
714
,255
12,4
055,
942
113,
620
78,5
88
1977
27,5
3810
,880
13,1
7511
,750
8,43
512
,658
5,33
315
,165
13,8
686,
437
125,
239
85,9
5125
,637
11,0
5412
, 171
E 1
2,00
0E
5,9
3717
,175
5,97
413
,964
16,3
376,
849
127.
098
89,4
61
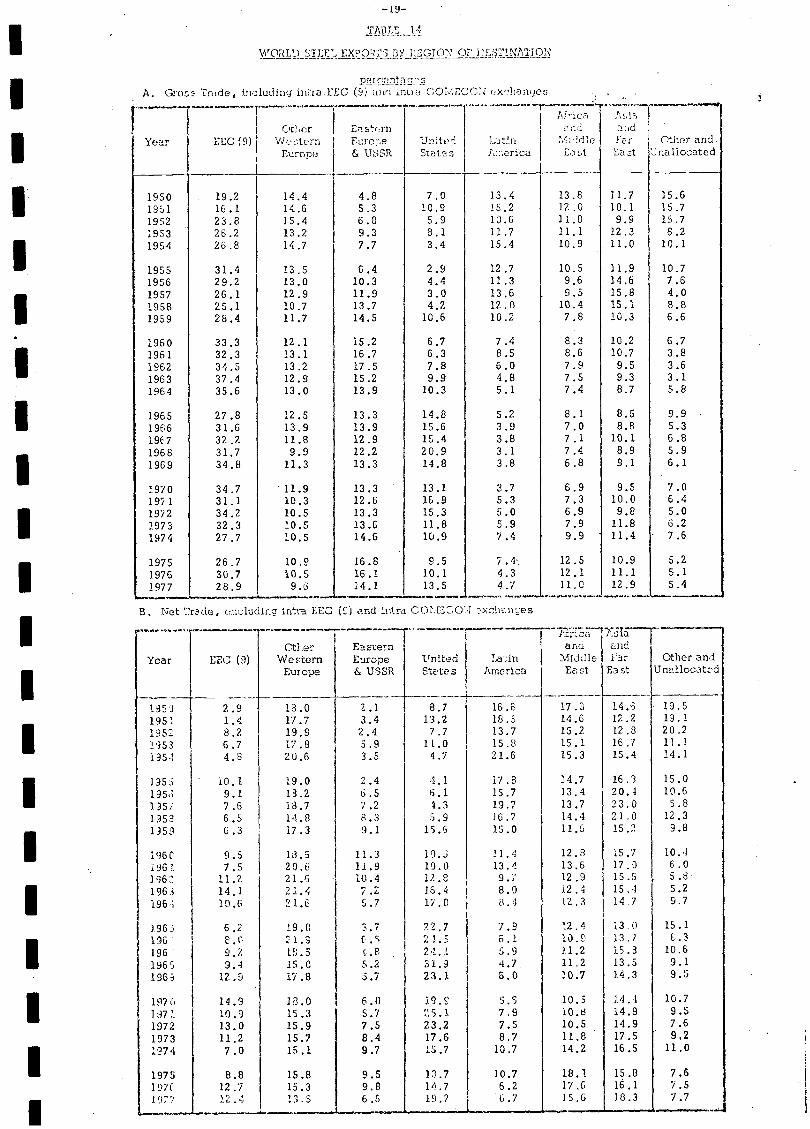
-19-»
TABT..E 14
WORLD STEE. EXPO2S 13Y 1:EGJú OF DLST1I'ThTION
any cantGrnr Trade, including írn L'FG (9) und labe COIdFCCN excdanges
Net racle, c::cludirg iri'ra }EO (F) aad ntra COìEOd c1ìruies
Year EEC (9)Od nr
We':ternLuroce
En snrnEurope& USSR
UnitedStates
1jtriiercJfica
idMidd1eEast
aFarEast
Other aridna11ocated
1950 19.2 14.4 4.8 7.0 13.4 13.8 11.7 15.61951 16.1 14.6 5.3 10.9 15.2 12.0 10.1 15.71952 23.8 15.4 6.8 5.9 10.6 11.8 9.9 13.71953 26.2 13.2 9.3 8.1 11.7 11.1 12,3 8.21954 26.8 14.7 7.7 3.4 15.4 10.9 11.0 10.1
1955 31.4 13.5 6.4 2.9 12.7 10.5 11.9 10.71956 29.2 13.0 10.3 4.4 11.3 9.6 14.6 7,61957 26.1 12.9 11.9 3.0 13.6 , 9.5 15.8 4.01958 25.1 10.7 13.7 4.2 12.0 10.4 15.1 8.81959 28.4 11,7 14.5 10.6 10.2 7.8 10.3 6.6
1960 33.3 12.1 15.2 6.7 7.4 8.3 10.2 6.71961 32.3 13.1 16.7 6.3 8.5 8.6 10.7 3.81962 34.5 13.2 17.5 7.8 6.0 7.9 9.5 3.61963 37,4 12.9 15.2 9.9 4.8 7.5 9.3 3.11964 35,6 13.0 13.9 10.3 5.1 7.4 8.7 5.8
1965 27.8 12.5 13.3 14.8 5.2 8.1 8.5 9.91966 31.6 13.9 13.9 15.6 3.9 7.0 8.8 5.31987 32.2. 11,8 12.9 15.4 3.8 7.1 10.1 6.81968 31.7 9.9 12.2 20.9 3.1 7.4 8.9 5.91969 34,8 11.3 13.3 14.8 3.8 6.8 9.1 6.1
1970 34,7 11.9 13.3 13.1 3.7 6.9 9.5 7.01921 31.1 10.3 12.6 16.9 5.3 7.3 10.0 6.419'12 34,2 10.5 13.3 15.3 5.0 6.9 9,8 5.01973 32.3 10.5 13.6 11.8 5.9 7.9 11.8 6.21974 27.7 10.5 14,6 10.9 7.4 9.9 11.4 7.6
1975 26.7 10.9 16.8 9.5 7.4i 12.5 10.9 5.21976 30.7 10.5 16.1 10.1 4.3 12.1 11.1 5.11977 28.9 9.6 24,1 13.5 4.7 11.0 12.9 5.4
.-.-----.----------- Pirtca tI.siaCtt.er Eastern ana and
Year EEC (9) Western Europe Unjted 1ain Middle lar Other andEurope & USSR States Arncria East Esst Unallocated
1353 2.9 18.0 2.1 8.7 16.6 17.3 14.6 19.51951 1.4 17.7 3.4 13.2 18.5 14.6 12.2 19.11952 8.2 19.9 2,4 7,7 13.7 15.2 12.8 20.21353 6.7 17.8 5.9 11.0 15.8 15.1 16.7 11,1135-1 4.8 20.6 3.5 4.7 21.6 15.3 15.4 14.1
1355 10.1 19.0 2.4 4.1 17.8 14.7 16.3 15.01955 9.1 13.2 6.5 6.1 15.7 13.4 20.4 10.61351 7.6 18.7 7.2 4.3 19.7 13.7 23.0 5.81353 6.5 14.8 8.3 5,9 16.7 14.4 21.0 12.31359 6.3 17.3 9.1 15.6 15.0 11.6 15.2 9.8
1960 9.5 113.3 11.3 10.5 11.4 12.3 15.7 10.41961. 7,5 20.o 11.9 10.') 13.4 13.6 17.0 6.01961 11.2 21.6 10.4 12.8 9./ 12.9 15.5 5.81963 14.1 21,4 7.2 16.4 8.0 12.4 15.4 5,22964 10,6 21.6 5.7 17.0 íL4 12,3 14.7 9.7
1965 6.2 19.0 3.7 22.7 7.9 12.4 13.1) 15.1196 8.0 21.8 6. 2 6.1 10.9 13./ .3196 9.2 1.9.5 t.8 24,.t 5.9 3.1,2 15.3 10.61965 9.4 15.0 5.2 31.9 4.7 11.2 13.5 9.1196 12.9 17.8 3,7 23.1 6.0 10.7 14.3 9.5
14.9 19.0 6.0 3.9.8 5.5 10.5 14.1 10.71971 10,3 15.3 5.7 55.1 7.9 10.8 14.9 9.51972 13.0 15,9 7,5 23.2 7.5 10.5 14.9 7.61973 11.2 15.7 8.4 17.6 8.7 11.8 17.5 9.21274 7.0 15.1 9.7 15.7 10.7 14.2 16.5 11.0
1975 8.8 15.8 9.5 13.7 10.7 18,1 15.8 7.61.971. 12.7 15,3 9,8 14.7 6.2 17,6 16.1 7.519'7 12.4 13.3 6.6 19,? .7 15,6 10.3 7,7
IIIIIIIiIIIIIIIIIIIII
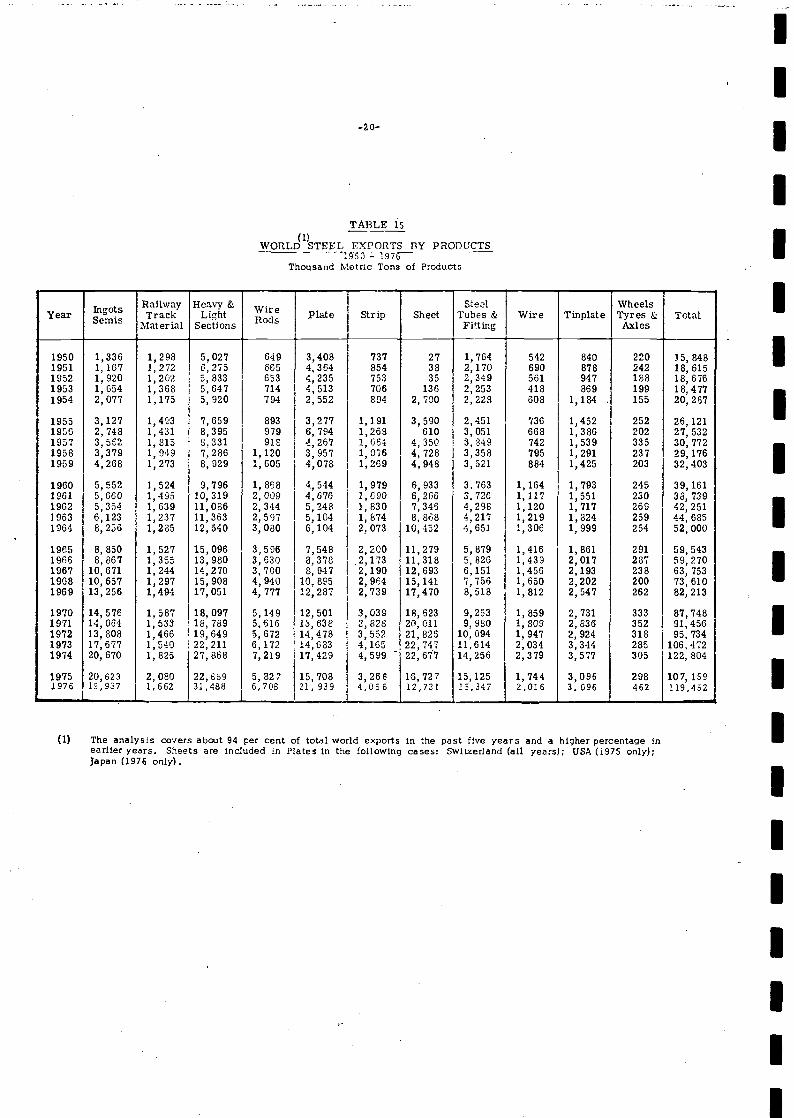
TABLE is(1)
WORLD STEEL EXPORTS BY PRODUCTS198T - 1976
Thousand Metric Tons of Products
II
i
Year es i
RailwayTrack
Material
Heavy &Light
Sections Rods Plate Strip SheetSteel
Tubes &Fitting
Wire TinpiateWheelsTyres &Axles
Total
1950 1,336 1,298 5,027 649 3,408 737 27 1,764 542 840 220 15,8481951 1,167 1,272 6,275 665 4,364 854 38 2,170 690 878 242 18,6151952 1,920 1,202 5,833 653 4,235 753 35 2,349 561 947 188 18, 6761953 1,654 1,368 5,647 714 4,513 706 136 2,253 418 869 199 18,4771954 2,077 1,175 5,920 794 2,552 84 2,700 2,228 608 1,184 155 20, 287
1955 3,127 1,493 7,659 893 3,277 1,191 3,590 2,451 736 1,452 252 26,1211956 2,748 1,431 8,395 979 6,794 1,268 610 3,051 668 1,386 202 27,5321957 3,562 1,813 8,331 918 4,267 1,064 4,350 3,849 742 1,539 335 30, 7721958 3,379 1,949 7,286 1,120 3,957 1,076 4,728 3,358 795 1,291 237 29,1761959 4,268 1,273 8,929 1,605 4,078 1,269 4,948 3,521 884 1,425 203 32,403
1960 5,552 1,524 9, '796 1,868 4,544 1,979 6,933 3.763 1,164 1,793 245 39, 1611961 5,660 1,495 10,319 2,009 4,676 1,690 6,266 3,720 1,127 1,551 230 38,7391962 5,354 1,639 11,086 2, 344 5,248 1,830 7,346 4,298 1,120 1,717 269 42, 2511963 6,123 1,237 11,363 2,597 5,104 1,874 8.868 4,217 1,219 1,824 259 44, 6851964 8,236 1,235 12, 540 3,080 6,104 2,073 10, 452 4,651 1,306 1,999 254 52, 000
1965 8,850 1,527 15,096 3,596 7,548 2,200 11,279 5,879 1,416 1,861 291 59,54319136 8,867 1,355 13, 980 3,630 8,378 2, 173 11,318 5, 826 1,439 2,017 287 59, 2701967 10, 671 1,244 14, 270 3,700 8,947 2,190 12, 693 6,151 1,456 2,193 238 63, 7531968 10,657 1,297 15, 908 4,940 10, 895 2,964 15, 141 7,756 1,630 2,202 200 73,6101969 13, 256 1,494 17, 051 4,777 12, 28? 2,739 17, 470 8,518 1,812 2,547 262 82, 213
1970 14, 576 1,587 18, 097 5,149 12, 501 3,039 18, 623 9,253 1., 859 2,731 333 87, 7481971 14, 064 1,533 18, 789 5,616 13, 638 2,828 20, 011 9,980 1,809 2,836 352 91, 4561972 13, 808 1,466 19, 649 5,672 14,478 3,552 21, 826 10, 004 1,947 2,924 318 95, 7341973 17,677 1,540 22,211 6,172 14,633 4,165 22,747 11,614 2,034 3,344 285 106.4721974 20, 670 1,825 27, 868 '7,219 17,429 4,599 22, 6t7 14, 256 2,379 3,577 305 122, 804
1975 20,623 2,080 22,669 5,827 15,708 3,266 16,727 15,125 1,744 3,096 298 107, 1591976 19,937. 1,662 31,488 6,708 21,939 4,066 12,731 15,347 2,016 3.096 462 119,452
-z o-. I
(1) The analysis covers about 94 per cent of total world exports in the past five years and a higher percentage In Iearlier years. Sheets are included in Plates in the following cases Switzerland (all years); USA (1975 only);Japan (1976 only).
IIIIiI
IiIIIiIIiI
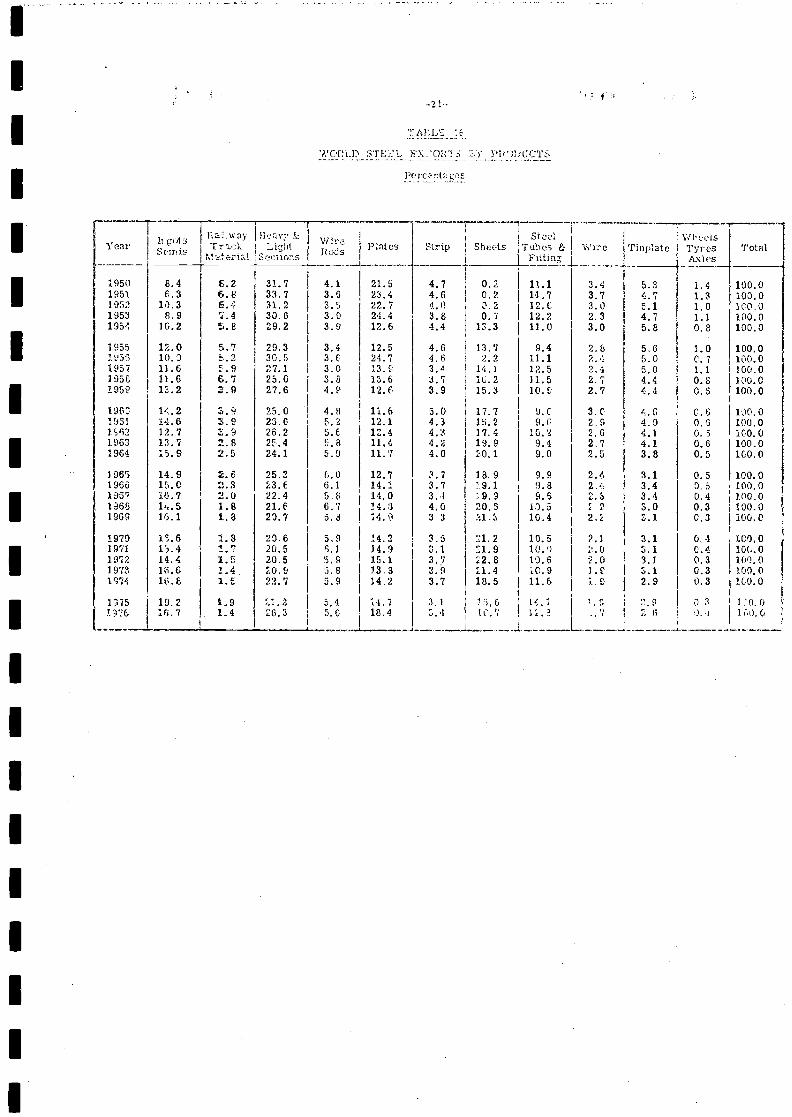
(Et LO. t{ '1J.S (11i1)i?.
I I I I I I I I I
I I I i
0,0E1
O'OOl 0'OOI O'üot 0")Ot 0'OOl
O'OOI O'OOI O'OOl OOOT C'COI
0'OOT 0'OOI OOO1 O'OOT 00Cl
0'OOl O'OOt 0001 0'OUI O'OOl
0,001 O'OOI 0031 0'OOI 0.001
t.)
C'O C'O C'O ¶'O YO
C'O C'O ¡''O YO l'O
l'O 9'O l'O 9.0 l'O
S'O YO t'I L'O 0.1
S'O t'i O't C'I ¡''1
O
6'l t'
l'E T'O ¡'E
¡'C O'O YE ¡''C ¡'E
C'E i' 1''
0'f O"
I' ¡''I' O'I OS l'I C'O L'
T'I ¿'
C'I
i '
C'
61 3'i O'l 0' l'
lE T
CT ,'E 'E
YE L'E YE 6E OC
L'E ¿'E ¡''E ¡''E C'E
YE C'E OC L'E ¡''e
Et l'1 9'IT 6'J'. 9'Cl 'Ol YOT
¡''01 l'CI l'O C'I; 6'6
0'G ¡''6
?'Y1 3'O YO
3'Ot YB YEt ¡'11 ¡''6
O'lI l'li I'll L'ti ¡'it
!,'Ol 't.
Y81 '1
8'lT 6'I
Z'I)
O1'' S'OE C'Y l'Y 6 '21
'VOI C'Ct ¡'LI l'Ol L'LI
L'Il Z'OI l'Y l'E YEt
C'TI ¿'O l'O l'O '0
LC
'E l'O YC
CC O'
IC L'E ¿'E
O' E'l' E'T' l' YE
YE fl
¡''C l'I' 9'' ¡''t C'E O't' 9'1' L'I'
21 L'F'.
11 ECL I'ï (t'l'l
Z'
C'Y tt.'
O'Y T'I'l L'EI
L'li ¡''11 ¡''CI T'EI 9'T1
YET YE! YET L'I'Z l'lt YET ¡''Y ¿'El ¡'CE I'll
9'9 '4 6'0 YO S'I T'I YE
L'I L'O 89 1,9 cYY
Y4 0'I T'I l'O
C'
i'I' S'E YE YE ¡''e
YE GE S'E YE T'I'
r £'9 ?'
h'll 0'0' YOl 9'O? 00E
¿C1 11 'EE 'ET C'lE
l'VE ¡''TE l'Ol 9'OZ O'lE
9'LE O'EE T'LE 'T'GE C'Ol
l'61 9'OC l'lE L'OC LTÇO
1'I 6'
Yt '1 4'!
¿' 8'
C'I C'I O'i
9'
YZ C'Z 6" 6'
YO
6' ¿'9 6.T C'I
L
8'! ¡''t 9 R'9 Z'9
LOT 161
3'91 9'1 i'1T 1CL 9'1 1'OL E''1 ¿'91 O'Ol S'Y S'lT ¿'01 ¿'El 9'T'I E''l EEt 9.11 9'It C'Ol YEt
E'OI 6'8
COI C'O Y9
96j
Ibl CLOI 6L61 L161 CLOT
6901 8961 L931 9961 9961
¡'961 0961 E91 ¡SOL 0961
6961 96( L961 ¶YT 4961
¡'961 0901 ;tor
0961
i1O,L S)Xf
S)1&[, GIutJ, O;iL "7 SZ)CjflJ, spq dig S1L'!d r suot1ag I'
,t'1;
1tJ;;' 't:'t,1, "ti Á
I I I I I I I I
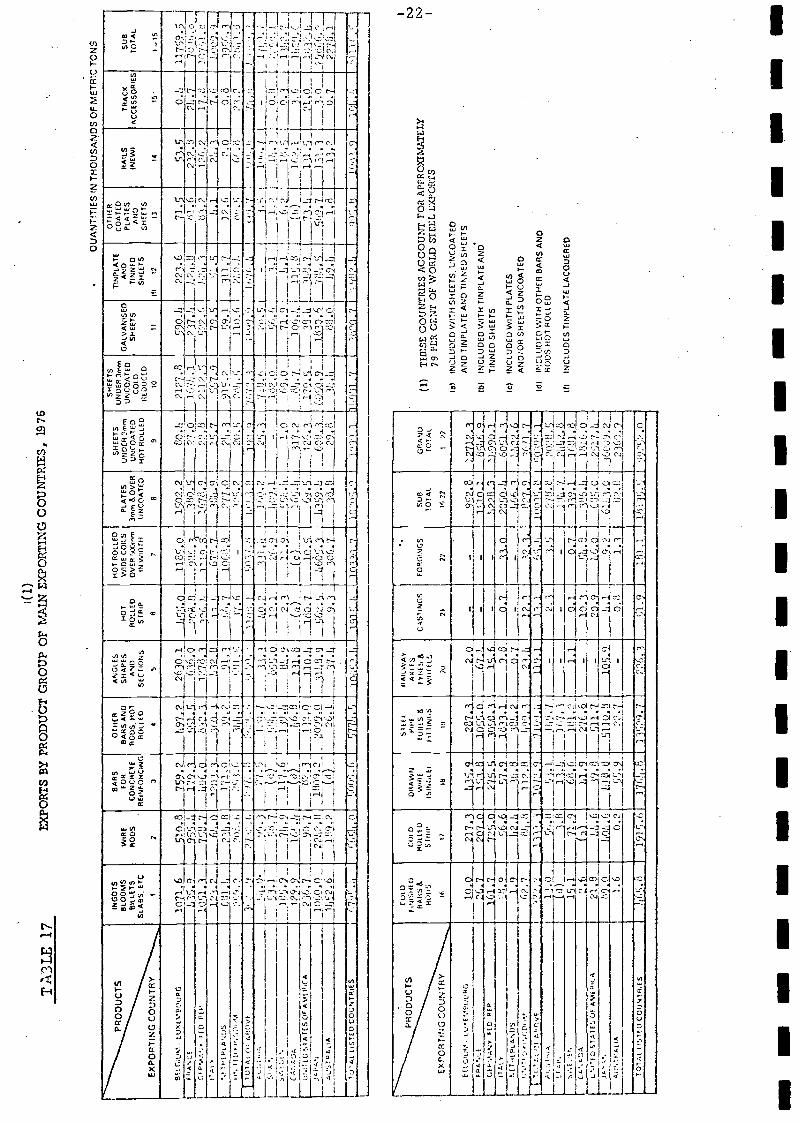
(1)
TH
ESE
CO
UN
TR
IES
AC
CO
UN
T F
OR
APP
RO
)aM
AT
EL
Y79
l'C
R C
EN
T O
F W
OR
LD
ST
EE
L C
XPO
RT
S
IaN
CL
UD
ED
WIT
H S
HE
ET
S. U
NC
OA
TE
DA
NO
TIN
PLA
TE
AN
D T
INN
ED
SH
EE
TS
tb)
tNC
LUD
ED
WIT
H T
tNP
LAT
E A
ND
TIN
NE
D S
HE
ET
S
(C)
INC
LUD
ED
WIT
H P
LAT
ES
AN
O/Q
fl S
HE
ET
S U
NC
OA
TE
D
(dl
ÌNC
LUV
ED
WIT
H O
TH
ER
BA
RS
AN
OR
OD
S H
OT
RO
LLE
D
(f)
)NC
LUO
ES
TIN
PLA
TE
LA
CQ
UE
RE
D
- -
- -
- -
- -
- -
- -
- -
- -
- -
- -
-
----
--PRODUCTS
EXPORTING COUNTRY
ING
OT
SB
LOO
MS
)UE
1SS
LAO
S. E
TC
i
WtR
IfO
DS
BA
RS
FO
RC
ON
CH
EE
AE
INF
OIC
ING
OT
HE
RO
AH
SA
NO
RO
DS
.HO
1R
OLL
ED
AG
1ES
SH
AP
ES
AN
))S
EC
IION
S
S
HO
TR
OLL
ED
ST
RIP
6
HO
TR
OLL
ED
WID
EC
OIL
SO
VE
RrO
O,'m
INW
IOT
H
7
PLA
TE
S3'
,,,&
OV
EM
UN
CO
AT
ED
8
SH
EE
TS
UN
OE
Rm
UN
CO
AIE
DH
OT
RO
LLE
D
9
UN
DE
R3r
,mU
NC
OA
TE
OC
OLD
RE
DU
CE
D
rn
GA
LVA
NIS
ED
SH
EE
TS
i i
flNP
IAT
EA
DT
INN
ED
SH
EE
TS
III
PLA
IES
AN
OS
HE
ET
S
t)
RA
ILS
INE
W)
14
TR
AC
KA
CC
ES
SO
RIE
S
IS
SU
TO
TA
L
_ ¶5
ELG
LN-L
UN
PO
JRO
1Op_
____
___
iA3.
91Ö
.89'
179
?!9
7,22
63O
.1
1?7J
!32[
i91
.3 )L JJ 514)
lu 1101
4_3
1145
9_3
7.14
L)-O
_":
aJ3_
2i_:
3r17
ft9
2.O
2127
.822
.671
51.
621
2.8
O.íI
?J.7
17. 0.8
ì17'
9J7O
1.)O
7d.
i
3
'AC
l_1
7')
3-Q
UJi
2i'L3.
%a- 3'(2
16/IL
.1?1
]7. '1
27»
)2!j,
lirI
D P
IIQ
:L2J
i II'1
27.8
'72.
6))
j3U
,2 jL )'.. 6
17.2
2LL
3'.o
1At.
____
_1:L
-2(1
. n
2flJ (,
G12
.71O
(8 _
_277
.O2)
j.3IJ
947I.Ç
i1>
.(1'
4)l
i'_
531
1 .7
TtP
1A'd
J5
)/..
I)I)
!.II7
( I
3'.ì 9
I!Lf
I1(
0.?
1_JI
Ohi
191)
u
?OL
1q ?
Ic)
31
3I
3
29E
R
1I)I
.
77'
)o.)
I7í -
11f
3.0
1N.
?3.2 -
')1.d
1(i»
.i-J
1O
At 0
1 A
I(V
1
Ji11
17
J('
I
)&37
359.
2
_7i9
11l6(d
)IO
.?
_]J)
Ij1L 2 í)
JJ4u
462 J.
3
3114
L17
2(o
311
1)1J
_O
j'i
1(
2275
.1
ll99
()(J
Q71
9Jl
Il,
_I14
.5i
J914
__jI6
14
3Ua3
Li9
)Q (
330.
0
_ii 8
_ I() 7I
Li
ij
LD1A
T(S
OrA
PC
AI3
'i1
1û2
__L.
__L
130
jO))
9
-__
1('
k460
31) 13
,
1J1J
.0c)
0.7
141
1111
(1 0
j 14 li2
,J
7P
4LIA
16jO
L1,
8
!O1A
L LI
ST
ED
CO
u1R
iES
(7I
I1t[
c)I1
.(,
7710
1D1I
2 14
Q30
114
0'1
'11.
11
IO'fl
?lf
lo?
-I'J
t'3
3'.5
j('O
»)
I
PR
OD
UC
TS
1.1)
1))
INIL
1IIL
OIIA
IIS&
01)1
15
CIlI
OH
ÜLL
E))
S 1
11W
DIE
AW
NW
IllE
SIN
GLO
ST
EE
LP
IlEID
OlS
&F
il I N
OS
IIAIL
WA
YA
XlE
S1X
1115
&W
ILE
1G
CA
S1
NO
SF
OR
GIN
GS
SU
BT
OT
AL
GR
AN
DT
OT
AL
EX
PO
RT
INGCOUNTRY
IS
I)
lB
929
21
22
¶1122
12?
EILOOM
LLlE
"11U
L4G
309
217,
323
--
207.
0 -
C-
7I
--
11 (
Li_J
if5_.
CE
-.I4
5Y F
ED
RI'
12O
_.2
71L
3014
O__
-i £
--
22B
3.. ì
J99f
tJ.
TA
l,I6
.679
--
IIJU
3.1.
_33S
LL
a_-
O7
O.L
13 O
20is
__6O
1íl
-__
U3_
GE
T ll
HL
AN
OS
'__
3.-
(2.
(8 .1
311
(331
)9
lR°
os7
01 1
09F
V'
-I'
4I
1Yl'
3109
111:
_12
i'j_
Q7
I9.1
l(3)1
.j3_
'-9L
.a_3
JI14
_ _1
31.o
LG'ID
5T
.XIE
LUE
AM
O'IL
.A21
,j_2
Q9
1L6.
0G
2c)1
i.L._
02.3
123
52.0
Ai),
1ALI
&1.
60.
81.
3
TO
T;L
LIS
TE
L) C
OU
NT
IIILS
--*
11.1
.11l
)-
019
2,2.
0
i(i)
TÂ
3LE
17
EX
POR
TS
BY
PR
OD
UC
T G
RO
UP
OP
MA
IN E
XPO
RT
ING
CoU
NT
RIE
S, 1
976
OU
AJT
T)E
S N
TH
OU
SA
ND
S O
F M
ET
RIC
TO
NS
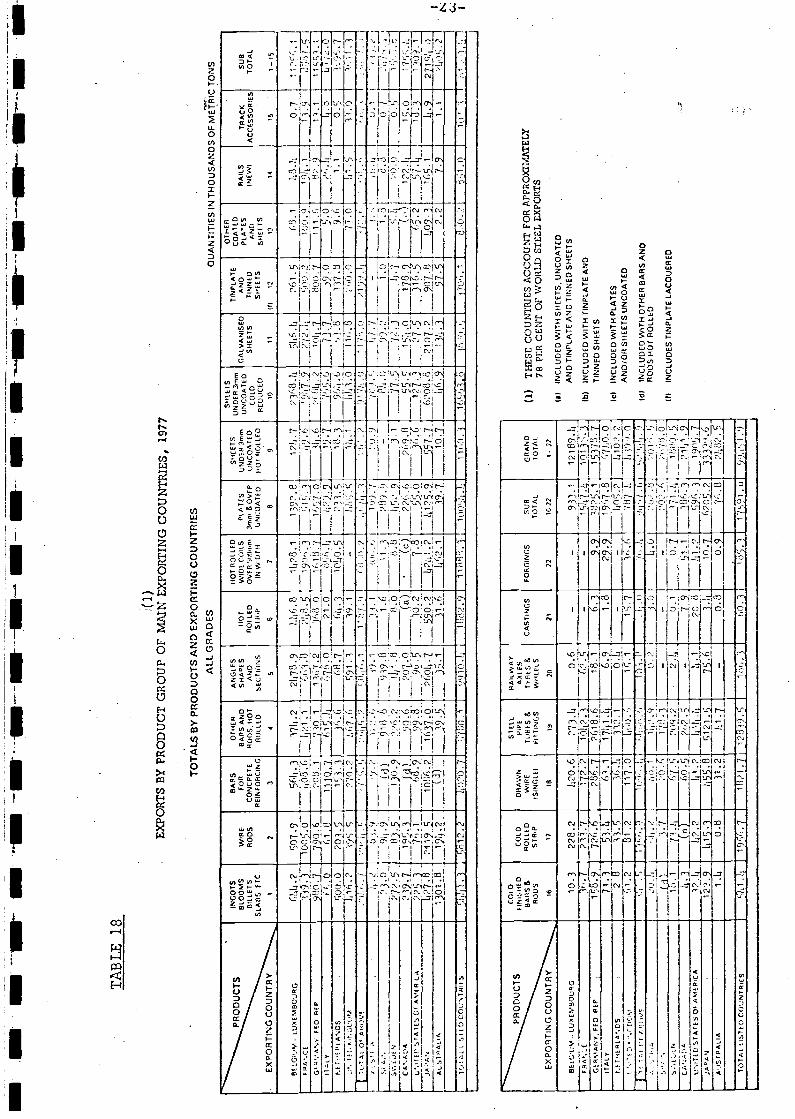
- .-
. -. -
-- -
. ..-
- --
. -__
.
TA
BL
E 1
8
(1)
EX
POR
TS
BY
PR
OD
UC
T G
RO
UP
OF
MA
IN E
XPO
RT
ING
CO
UN
TR
IES,
197
7
TO
TA
LS B
Y P
RO
DU
CT
S A
ND
EX
PO
RT
ING
CO
UN
TR
IES
ALL
GR
AD
ES
QU
AN
TIT
IES
IN T
HO
US
AN
DS
0F
ME
IC T
ON
S
(1)
TH
ESE
CO
UN
TR
IES
AC
CO
UN
T F
OR
APP
RO
)GM
AT
EL
Y78
PE
R C
EN
T O
P W
OR
LD
ST
EE
L E
XPO
RT
S
.1IN
CLU
OF
O W
ITH
SH
EE
TS
, UN
CO
AT
ED
AN
O T
INP
LAT
E A
ND
TIN
NE
D S
HE
ET
S
Ib)
INC
LUD
ED
WIT
H T
INP
IAT
E A
ND
TIN
NE
D S
HE
ET
S
Ic)
INC
LUD
ED
WIT
H P
LAT
ES
AN
D/O
R S
HE
ET
S U
NC
OA
TE
D
IdI
INC
LUD
ED
WIT
H O
TH
ER
OA
RS
AN
DR
OD
S H
OT
RO
LLE
D
I?)
INC
LUD
ES
TIN
PLA
TE
LA
CO
UE
RE
D
.
PR
OD
UC
TS
EX
PO
RT
ING
CO
UN
TR
Y
ING
OT
SD
tOO
MS
I3IL
LET
SS
LAR
S. E
IC.
i
WIR
ER
OD
S
OA
RS
FO
RC
ON
CR
ET
ER
EIN
FO
RC
ING
3
OT
HE
RE
AR
SA
ND
RO
I)S
, IIO
TR
OIL
ED
4
AN
GLE
SS
HA
PE
SA
NO
SE
CT
II)N
4S
5
1101
PO
I LE
DS
IRIP
E
HO
TR
OLI
ED
WIO
t CO
ILS
OV
FR
INW
IUF
H
/
PLA
TE
S3r
nr &
OV
PU
N(0
A1E
0
S
SH
EE
TS
UN
DE
R&
"'IJ
NC
OA
TfD
IIOT
RO
LLE
I)
9
SH
EE
TS
UN
DE
R3m
UN
CO
AT
EO
coto
RE
OIC
EO
O
GA
LVA
NIS
ED
SH
EE
TS
U
TIN
FLA
TE
AN
DT
INN
ED
SE
EY
S
IIII?
OT
HE
RC
OA
TID
PLA
TE
SA
Osu
îsE
3
RA
ILS
INE
WI
i4
TR
AC
KA
CC
ES
SO
RIE
S-
15
SU
ST
OT
AL
¶ _.
BG
,vw
(MB
Ouq
G(.
2O
7.9
56)1
.3
203.
100
L08(
7t.2
Iii
710
1
)0.6 7.6
2)17
8.9
Th3
81
l;7.2
ï70.
oI'ß
.7
J46.
81I
?.1
19(ì
3i(i
8ji0
L0.
1397
.512
!.773
8.I
li4.1
27?1
I(1i
1.7
6i .
r'Qr)
'80
0.'
(3.i
1(Y
) Q
I3.h
i)J
0.7
Pt.\
CE
I) 30.
90.6
JJ8
3(8
O6
ÇG
".A
NY
o R
Pl6
7.0
/I.6
2(J1
1.2
Iii .0
2.9
1 '4
. Ii
1Ç0'
4.L7
ì.ii1
000.
1)(i
1
201.
511
10,7
1Ç3.
321
.0Ñ
1.3
i2'
213.
5
)(j'
18.3
j0.0
9uL1
.63
. 3,8
j9.0
137.
3.0
9.0
Y).
.3.1
I'QP
1A\O
51.
10.
539
.711
6.2
193.
Ç27
0.2
091.
339
.1-
1.1
¿W
3.0
110.
20.0
77.0
,Ç34
.0'4
' 11.
3.
A O
' A l
____
____
____
____
___
."'
.'
.
19Ç
.7"
1
"ii9
Ç
--p9
)41
8 9
103(
2(3
)
o.6
- i
(a)
__1I
cL10
7 2
33
CA
.AO
A21
2.7
25 3
201.
0- 24
0I7
(c)
220.
6
Jj19
5 9
39.7
269.
0y
,_5
57 7
10.7
J1L
178.
9(
2
i22j
1.O
''T17
.lifo
iIO
bT
AT
10 A
', (P
ILA
9 8
1637
o'IO
23
5jt
)7 8
90 2
,,,,j2
12
j52.
190
J 13
3i
977
1CI
ALS
I1lA
tl1
01.8
19j.2
i .6
2.2
.1.
17L
106.
2
T0!
AIL
ISI(
DC
OIJ
NT
PIE
SIII
))Q
.i
7.11
10/.
.1Q
))51
,411
19.
.,CI.2
01,O
101'
4
C01
0S
1EE
LR
AIL
WA
YP
RO
DU
CT
SIN
I.,l1
FD
CO
LDD
RA
WN
PIP
EA
9IE
SS
AlIS
&P
0111
0W
IRE
IHR
ES
&rY
R1S
&C
AS
TIN
GS
FO
RG
ING
SS
UB
GR
AN
OB
OU
SS
TR
IPS
ING
LEI
FIT
TIN
GS
WH
EE
LST
OT
Al.
TO
TA
l.
EX
PO
RT
ING
CO
UN
TR
Y16
ITlB
1921
)21
721G
22
1.22
8ELG
11%
lLU
XtV
RO
UP
G10
.322
8.2
1120
.673
.tlo.
6-
-93
3.1
1211
39.t4
FR
A'.E
'7"
213.
717
2.2
i0]L
?.3
2,Ç
--
1Ç1
G4P
Ç'A
NI F
EO
PE
P15
.972
(.6
287
2618
.618
.16.
39
'182
5.1
j,517
8.7
ITA
LY71
.32
3).Ç
63.1
3.L
17t1
1 .L
6.,
1.8
9.9
19(1
7.8
¿i0
0.2
07iO
.0,
t.LT
'IEP
LAID
S31
2.1
Oj
-t1
107.
211
.281
.211
7.0
10.1
15.7
787.
14¿
10l0
rrY
41.0
T'o
,',.O
1u1.
J1r,
TT
0'4
O.9
.1).
))¡I
IJI
i)I'/.
I»Y
ld.)
I'I21
)11
'II .2
¡10.
11)
1' .4
0.2
3.0
LI .0
'9
1)11
)
5.,..
XdL
.3.7
0.17
8.1
--
-"1
(119
.1fu
10f
.2o
9.2
2.,j
0.1
0.1
'471
.li11
1I)O
.
CA
.'OJA
I.3Ç
)60
522
.6-
9O
i.i38
0.3
_?1L
I1..9
1.51
(10
ST
6TE
SO
FA
MLI
TIC
A3
li7.2
iiI5?
..fj?
j41L
' 120
¿I_
¿l .2
590
j1
9O. 7
127.
9¿
115.
3¿
8 61
21.5
75.6
Iiio
.62
q5,.2
3325
jLA
US
TR
AlIA
iL4
0.3
31.2
¿41
.7-
0.8
0.9
'«.8
IlI.3
iÇ
TO
TA
L LI
ST
EO
CO
UN
YR
ITS
Ili.lL
1900
1.7
1071
.712
8'4I
).Ç
1011
,300
.310
.317
1,01
.44
9/4-
1.1
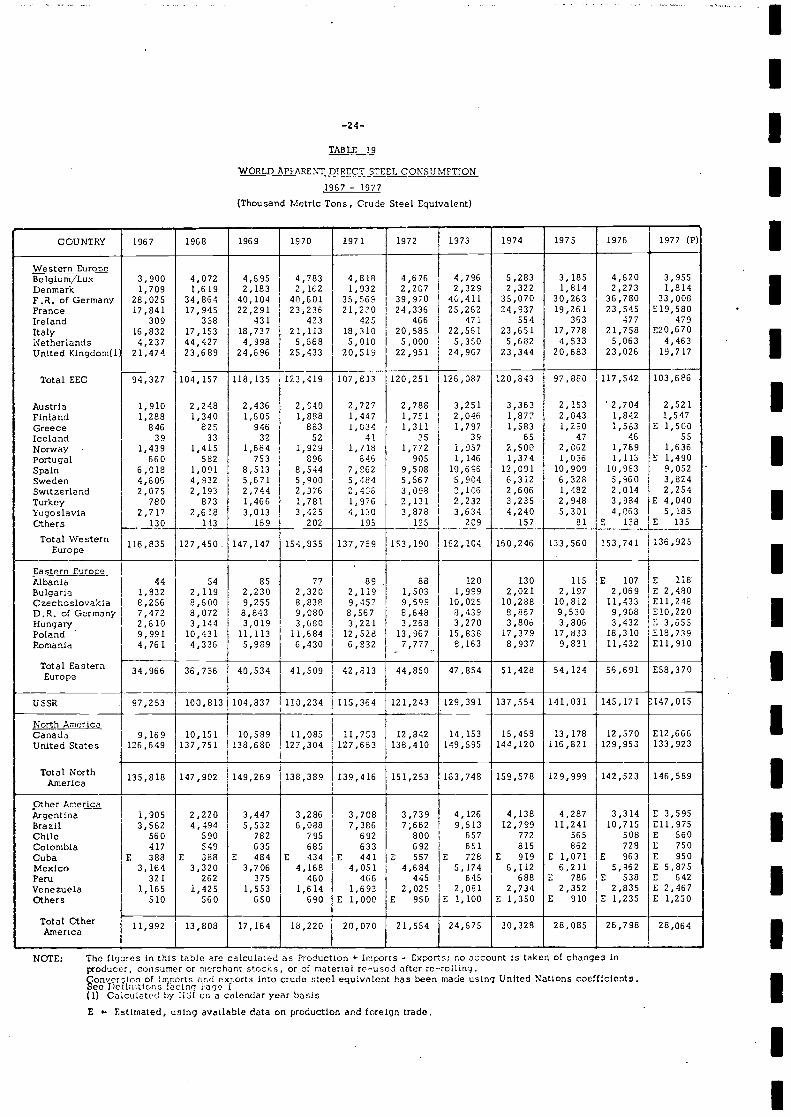
TABLE 19
WORLD APPARENT DIRECT STEEL CONSUMPTION
1967 - 1977
(Thousand Metric Tons, Crude Steel Equivalent)
NOTE: The ligures in this table are cicu1ted as Production + Imports - Exports; no Occount is taken of changes inproducer, consumer or merchant stocis, or of material re-used after re-rolling.Çonver!on of rtports r-d exrorts into crude steel equivalent has been made using United Notions coeffIcients.
eo Dczin1tion .acing Page £(1) Calculated by lidi on a calendar year basisE Estimated, using available data on production and foreign trade.
II
I
COUNTRY 1967 1968 1969 1970 1971 1972 1973 1974 1975 1976 1977 (P)
Western Euroce3,900 4,072 4,695 4,783 4,818 4,676 4,796 5,283 3,185 4,620 3,955e1gium/Lux
Denmark 1,709 1,619 2,183 2,162 1,932 2,207 2,329 2,322 1,814 2,273 1,814F.R. ofGermany 28,025 34,864 40,104 40,601 35,559 39,970 40,411 35,070 30,263 36,780 33,008France 17,841 17,945 22,291 23,236 21,230 24,336 25,262 24,937 19,261 23,545 E19,580Ireland 309 358 431 423 425 466 471 554 333 477 479Italy 16,832 17,153 18,737 21,113 18,310 20,585 22,551 23,651 17,778 21,758 E20,670Netherlands 4,237 44,427 4,998 5,668 5,010 5,000 5,350 5,682 4,533 5,063 4,463United Kingdom(I 21.474 23,689 24,696 25,433 20,519 22,951 24,907 23,344 20,683 23,026 19,717
Total EEC 94,327 104,157 118,135 123,419 107,813 120,251 126,087 120,843 97,680 117,542 103,686
Austria 1.910 2,248 2,436 2,140 2,727 2,788 3,251 3,363 2,153 '2,704 2,521Finland 1,288 1,340 1,605 1,888 1,447 1,751 2,046 1,877 2,043 1,842 1,547Greece 846 825 946 883 1,034 1,311 1,797 1,583 1,290 1,563 E 1,500Iceland 39 33 32 52 41 35 39 65 47 46 55Norway 1,439 1,415 1,664 1,929 1,/18 1,772 1,957 2,500 2,062 1,789 1,636Portugal 660 582 753 896 845 905 1,146 1,374 1,036 1,113 E 1,490Spain 6,018 1,091 8,513 8,544 7,662 9,508 10,686 12,091 10,909 10,983 9,052Sweden 4,605 4,932 5,671 5,900 5,484 5,567 5,904 6,312 6,328 5,860 3,824Switzerland 2,075 2,193 2,744 2,76 2,406 3,098 3,106 2,606 1,482 2,014 2,254Turkey 780 873 1,466 1,781 1,976 2,131 2,232 3,235 2,948 3,984 E 4,040Yugos1via 2,717 2,618 3,013 3,425 4,130 3,878 3,634 4,240 5,301 4,063 5,185Others 130 143 169 202 195 195 209 157 91 E 138 E 135
Total Westernrurope 116,835 127,450 147,147 154,835 137,759 153,190 162,104 150,246 133,560 153,741 136,925
Eastern EuropeAlbania 44 54 85 77 89 88 120 130 115 E 107 E 118Bulgaria 1,832 2,119 2,230 2,320 2,119 1,503 1,999 2,021 2,197 2,059 E 2,480Czechoslovakia 8,256 8,600 9,255 8,838 9,457 9,599 10,025 10,288 10,812 11,433 E11,248D.R. of Germany 7,472 8,072 8,843 9,080 8,567 8,648 8,439 9,857 9,530 9,908 EI0,220Hungary 2,610 3,144 3,019 3,(ì80 3,221 3,268 3,270 3,806 3,806 3,432 E 3,655Poland 9,991 10,431 11,113 11,684 12,528 13,967 15,838 17,379 17,833 18,310 E18,739RomanIa 4,761 4,336 5,989 6,430 6,932 7,777 8,163 8,937 9,831 11,432 E1l,9ì0
Total Eastern 34,966 36,756 40,534 41,509 42,813 44,850 47,854 51,428 54,124 56,691 E58,370Europe
USSR 97,253 100,813 104,837 110,234 115,364 121,243 129,391 137,554 141,031 145,171 6147,015
North AmericeCanada 9,169 10,151 10,589 11,085 11,753 12,842 14,153 15,459 13,178 12,570 E12,666United States 126,649 137,751 138,680 127,304 127,663 138,410 149,595 144,120 116,821 129,953 133,923
Total North 135,818 147,902 149,269 138,389 139,416 151,253 163,748 159,578 129,999 142,323 146,589America
Other Americe1,905 2,220 3,447 3,286 3,708 3,739 4,126 4,138 4,287 3,314 E 3,595rgentina
Brazil 3,562 4,494 5,532 6,088 7,386 7,662 9,513 12,799 11,241 10,715 El1,975Chile 560 590 782 795 692 800 657 772 565 508 E 560Colombia 417 549 635 685 633 692 651 815 862 728 E 750Cuba E 383 E 388 E 484 E 434 E 441 E 557 E 728 E 919 E 1,071 E 963 E 950Mexico 3,164 3,320 3,706 4,168 4,051 4,684 5,174 6,112 6,211 5,962 E 5,875Peru 321 262 375 460 466 445 645 688 E 786 E 538 E 642Venezuela 1,165 1,425 1,553 1,614 1,693 2,025 2,081 2,734 2,352 2,835 E 2,467Others 510 560 650 590 E 1,000 E 950 E 1,100 E 1,350 E 910 E 1,233 E 1,230
Total Other 11,992 13,808 17,164 18,220 20,070 21,554 24,675 30,328 28,085 26,798 28,064
-24- IIIIIIIIIIIiIIIIII
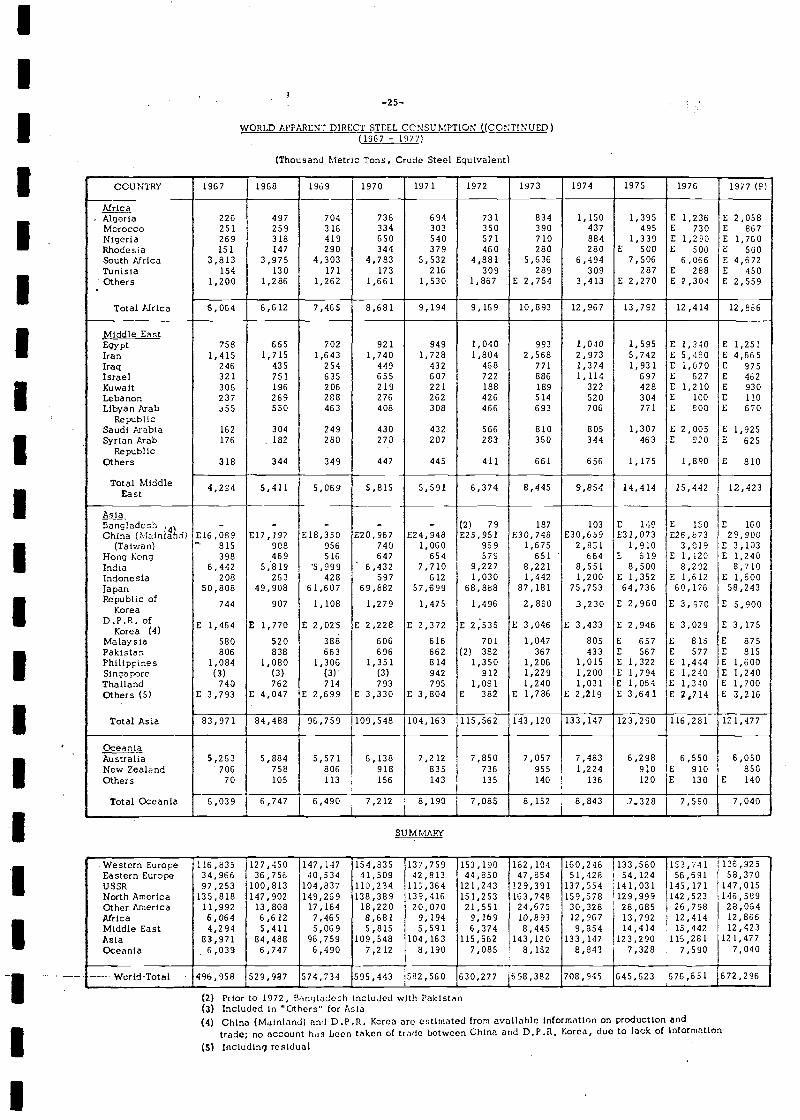
II
I
-25-
WORLD fPPARET DiRECT STEEL CCNSIJMPTION ((C0NTII'rnED)(1967 - 1977)
(Thousand Metric Tons, Crude Steel Equivalent)
SUM MA1
PrIor to 1972, Birtgiadeh included with PakistanIncluded in 'Others' for A510China (Mainland) and D.P.R. Korea are estimated from available informatinri on production andtrade; no account h,s been taken of trade between China and D.P.R. Korea, duo to ick of information
including residual
COUNTRY 1967 1968 1969 1970 1971 1972 1973 1974 1975 1976 1977 (P)
Africa. Algeria 226 497 704 736 694 731 834 1,150 1,395 E 1,236 E 2,058
Morocco 251 259 316 334 303 350 390 437 495 E 730 E 867Nigeria 269 318 419 650 540 571. 710 884 1,339 E 1,290 E 1,760Rhodesia 151 147 290 344 379 460 280 280 E 500 E 500 E 500SouthAfrica 3,813 3,975 4,303 4,783 5,532 4,881 5,636 6,494 7,506 6,066 E 4,672Tunisia 154 130 171 173 216 309 289 309 287 E 288 E 450Others 1,200 1,286 1,262 1,661 1,530 1,867 E 2,754 3,413 E 2,270 E 2,304 E 2,559
TotalMrica 6,064 6,612 7,465 8,681 9,194 9,169 10,893 12,967 13,792 12,414 12,866
Middle EastEgypt 758 665 702 921 949 1,040 993 2,040 1,595 E 1,340 E 1,251Iran 1,415 1,715 1,643 1,740 1,728 1,804 2,568 2,973 5,742 E 5,490 E 4,655Iraq 246 435 254 449 432 458 771 1,374 1,931 E 1,070 E 975Israel 321 751 635 655 607 722 886 1,114 697 E 627 E 462Kuwait 306 196 206 219 221 188 189 322 428 E 1,210 E 930Lebanon 237 269 288 276 262 426 514 520 304 E 100 E 110Libyan Arab j55 550 463 408 308 466 693 706 771 E 800 E 670
RepublicSaudi Arabia 162 304 249 430 432 566 810 805 1,307 E 2,005 E 1,925Syrian Arab 176 .182 280 270 207 283 360 344 463 E 920 E 625
RepublicOthers 318 344 349 447 445 411 661 656 1,175 1,890 E 810
Total Middle 4,224 5,411 5,069 5,815 5,591 6,374 8,445 9,854 14,414 15,442 12,423Ea st
As jaSangladcsh - - - - - (2) 79 187 103 E 140 E 150 E 160China (Mainfd) 616,059 E17,197 618,350 620,967 E24,948 E25,951 630,748 630,659 E31,073 625,573 29,900
(Taiwan) - 815 908 956 740 1,060 969 1,675 2,831 1,910 3,019 E 3,103Hong Kong 398 469 516 647 654 579 651 664 E 619 E 1,120 E 1,240India 6,442 5,819 5,999 6,432 7,710 9,227 8,221 8,551 8,500 8,202 8,710Indonesia 208 263 428 597 612 1,030 1,442 1,200 E 1,352 E 1,612 E 1,600Japan 50,808 49,908 61,607 69,882 57,699 68,888 87,181 75,753 64,736 60,176 58,243Republic of
Korea 744 907 1,108 1,279 1,475 1,496 2,860 3,230 E 2,960 E 3,970 E 5,900D.P.R. of E 1,464 E 1,770 E 2,025 E 2,228 E 2,372 E 2:535 E 3,046 E 3,433 E 2,946 E 3,029 E 3,175
Korea (4)Malaysia 580 520 388 606 616 701 1,047 805 E 657 E 815 E 875Pakistan 806 838 663 696 662 (2) 382 367 433 E 567 E 577 E 815Philippines 1,084 1,080 1,306 1,351 814 1,350 1,206 1,015 E 1,322 E 1,444 E 1,600Sinapore (3) (3) (3) (3) 942 912 1,229 1,200 E 1,794 E 1,240 E 1,240Thailand 740 762 714 793 795 1,081 1,240 1,031 E 1,064 E 1,340 E 1,700Others (5) E 3,793 E 4,047 E 2,699 E 3,330 E 3,804 E 382 E 1,786 E 2,219 E 3,641 E 2,714 E 3,216
TotelAsia 83,971 84,488 96,759 109,548 104,163 115,562 143,120 133,147 123,290 116,281121,477
Ocea nAustralia 5,263 5,884 5,571 6,138 7,212 7,850 7,057 7,483 6,298 6,550 6,050New Zealand 706 758 806 918 835 736 955 1,224 910 E 910 850Others 70 105 113 156 143 135 140 136 120 E 130 E 140
Total Oceania 6,039 6,747 6,490 7,212 8,190 7,085 8,152 8,843 7,328 7,590 7,040
Western Europe 116,831 127,450 147,147 154,835 137,759 153,190 162,104 160,246 133,560 153,741 139,325Eastern Europe 34,966 35,756 40,534 41,509 42,813 44,150 47,854 51,428 54,124 56,691 58,370USSR 97,253 100,813 104,837 110,234 115,364 121,243 129,391 137,554 141,031 145,171 147,015North America 135,818 147,902 149,269 138,389 139,416 151,253 163,748 159,578 129,999 142,523 146,589OtherArnerica 11,992 13,808 17,164 18,220 20,070 21,551 24,675 30,328 28,085 26,798 28,064Africa 6,064 6,612 7,465 8,681 9,194 9,169 10,893 12,967 13,792 12,414 12,866Middle East 4,294 5,411 5,069 5,815 5,591 6,374 8,445 9,854 14,414 15,442 12,423Asia 83,971 84,488 96,759 109,548 104,163 115,562 143,120 133,147 123,290 115,281 121,477Oceania 6,039 6,747 6,490 7,212 8,190 7,085 8,152 8,843 7,328 7,590 7,040
World-Total 496,958 529,987 574,734 595,443 582,560 630,277 698,382 708,945 645,623 676,651 672,296
IIIIIIIIIIIIiI
IiI
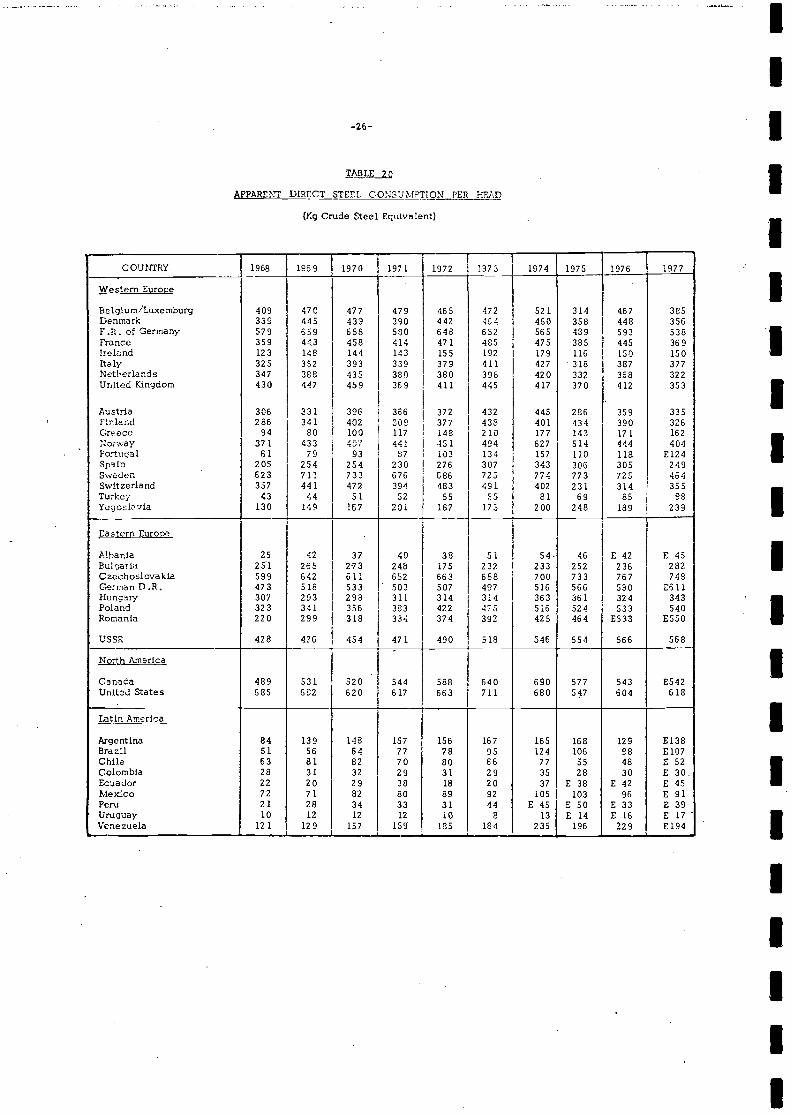
TAB LE_
APPARENT DIRECT STEEL CONSUMPTION PER HIlAD
(Kg Crude Steel Equivalent)
II
I
COUNTRY 1968 1969 1970 1971 1972 1373 1974 1973 1976 1977
Western Europe
Belgium./Luxemburg 409 470 477 479 465 472 521 314 467 385Denmark 339 445 439 390 442 '164 460 356 448 356F.R. of Germany 579 659 658 590 649 652 565 489 593 538Fronce 359 443 458 414 471 485 475 385 445 369lrelcnd 123 148 144 143 155 192 179 116 150 150Italy 325 352 393 339 379 411 427 318 387 377Netherlands 347 388 435 380 380 398 420 332 368 322United Kingdom 430 447 459 369 411 445 417 370 412 353
Austria 306 331 396 366 372 432 445 286 359 335Finland 286 341 402 309 377 433 401 434 390 326Greece 94 80 100 117 148 210 177 143 171 162Nor-ay 371 433 437 441 451 494 627 514 444 404Portugal 61 79 93 87 103 134 157 110 118 8124Spain 205 254 254 230 276 307 343 306 305 249Swaden 623 711 733 676 686 723 774 773 725 464Switzerland 357 441 47. 394 493 491 402 231 314 355Turkey 43 44 51 52 55 55 81 69 85 98Yugoslavia 130 149 167 201 187 173 200 248 189 239
Eastern Europe
Albania 25 42 37 40 38 51 54- 46 E 42 E 45Bulgaria 251 265 273 248 175 232 233 252 236 282Czechoslovakia 599 642 611 652 663 688 700 733 767 749GerrnanD.R. 473 518 533 503 507 497 516 566 590 E511Hungary 307 293 298 311 314 314 363 361 324 343Poland 323 341 356 383 422 475 516 524 533 540Romania 220 299 318 334 374 392 425 464 5533 ESSO
USSR 428 436 454 471 490 518 346 554 566 568
North America
Canada 489 531 520 544 588 640 690 577 543 E542United States 685 662 620 617 663 711 680 547 604 618
Latin America
Argentina 84 139 148 157 156 167 165 168 129 8138Brazil 51 56 64 77 78 95 124 106 98 E107Chile 63 81 82 70 80 66 77 55 48 8 52Colombia 28 31 32 29 31 29 35 28 30 E 30.Ecuador 22 20 29 38 18 20 37 E 38 E 42 E 45Mexico 72 71 82 80 89 92 105 103 96 E 91Peru 21 28 34 33 31 44 E 45 E 50 E 33 E 39Uruguay 10 12 12 12 10 8 13 E 14 E 16 8 17Venezuelat- 121 129 157 159 185 184 235 196 229 E194
-26- IIII'I
IIIIIIIIIIIiI
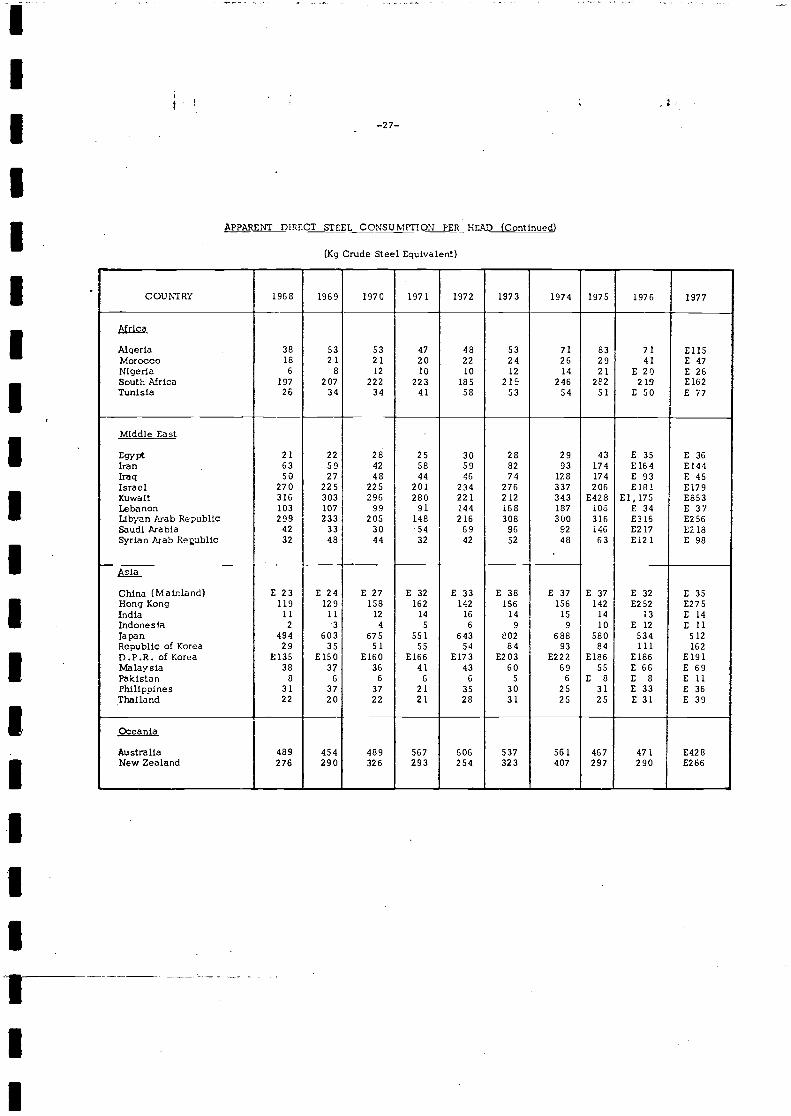
III -27-
IIiIIiIIiIII
I
APPARENT DIRECT STEEL CONSUMPTION PER HEAD (Continued)
(Kg Crudo Steel Equivalent)
COUNTRY 1968 1969 1970 1971 1972 1973 1974 1975 1976 1977
Africa
Algeria 38 53 53 47 48 53 71 83 71 E115Morocco 18 21 21 20 22 24 26 29 41 E 47Nigeria 6 8 12 10 lO 12 14 21 E 20 E 26South Africa 197 207 222 223 185 219 246 22 219 E162Tunisia 26 34 34 41 58 53 54 51 E 50 E 77
Middle East
Egypt 21 22 28 25 30 28 29 43 E 35 E 36Iran 63 59 42 58 59 82 93 174 E164 E144Iraq 50 27 48 44 46 74 128 174 E 93 E 45Israel 270 225 225 201 234 276 337 206 E18l E179Kuwait 316 303 296 280 221 212 343 E428 E1,175 E853Lebanon 103 107 99 91 144 168 187 106 E 34 E 37Libyan Arab Republic 299 233 205 148 216 308 300 316 E316 E256Saudi Ax-able 42 33 30 54 69 96 92 146 E2 17 E2 18Syrian Arab Reublic 32 48 44 32 42 52 48 63 E12 1 E 98
E 23 E 24 E 27 E 32 E 33 E 38 E 37 E 37 E 32 E 35China (Mainland)Hong Kong 119 129 158 162 142 156 156 142 E252 E275India 11 11 12 14 16 14 15 14 13 E 14Indonesia 2 3 4 S 6 9 9 10 E 12 E 11Japan 494 603 675 551 643 02 688 580 534 512Republic of Korea 29 35 51 55 54 84 93 84 ill 162D.P.R. of Korea E135 ElSO E160 E166 E173 E203 E222 E186 E186 E191Malaysia 38 37 36 41 43 60 69 SS EGG E 69Pakistan 8 6 6 6 6 5 6 E 8 E 8 E 11Philippines 31 37 37 21 35 30 25 31 E 33 E 36Thailand 22 20 22 21 28 31 25 25 E 31 E 39
Oceania
Australia 489 454 489 567 606 537 561 467 471 E428New Zealand 276 290 326 293 254 323 407 297 290 E266
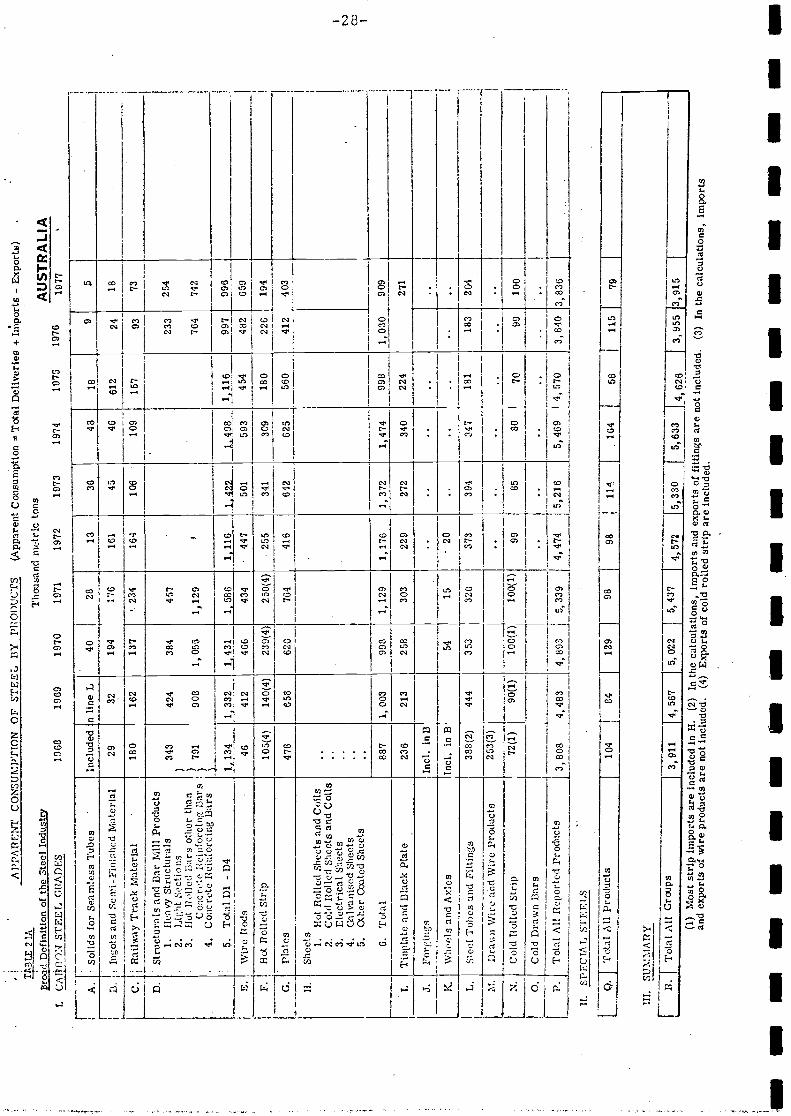
TÄ
BL
t 2 lA
Bro
adD
efin
ition
of
the
Stee
l Ind
ustr
y
I.C
MÍI
OT
ST
EE
L G
I1A
DE
S
11.
SPE
CIA
L S
TE
EL
S
Q.
Tot
al A
ll Pr
oduc
ts
III.
SU
MM
AR
Y
I. T
otal
All
Gro
upsA
PPA
RE
NT
CO
NSU
MPT
ION
OF
STE
EL
BY
PII
OD
UC
TS
(App
aren
t Con
sum
ptio
n =
Ta1
Del
Iver
ies
+ li
ipor
ts -
Exp
orts
)
104
r84
Tho
usan
d m
etri
c to
ns
1968
1969
1970
1971
1972
1073
1974
1975
1976
1291
9898
114
164
56j
115
3,91
14,
567
5,02
2 J
5,4,
572
[5,3
30[
5,63
346
26(1
) M
ost s
trip
impo
rts
are
incl
uded
in H
.(2
)In
the
calc
ulat
ions
, im
port
s an
d ex
port
s of
fitt
ings
are
not i
nclu
ded.
and
expo
rts
of w
ire
prod
ucts
are
not
incl
uded
.(4
) E
xpor
ts o
f co
ld r
olle
d st
rip
are
incl
uded
.
r- 3,95
5
AL
JST
RA
LI
A19
77 79
3,91
5
(3)
In th
e ca
lcul
atio
ns, i
mpo
rts
- -
- -
- -
- -
- -
. - -
- -
- -
- -
- -
A.
Solid
s fo
r Se
amle
ss T
ubes
incl
uded
n li
ne L
4023
1830
4318
B.
lugo
ts a
nd S
emi-
Fini
shed
Mat
erIa
l29
3219
417
616
145
4661
224
18
C.
Rai
lway
Tra
ck M
ater
ial
180
162
137
234
164
106
109
157
9373
D.
Stru
ctur
aIs
and
Bar
Mill
Pro
duct
s1.
Hea
vy S
truc
tura
le2.
Lig
ht S
ectio
ns
fogr
s4.
Con
cret
e R
eiui
orci
ng B
ars
5.T
otal
1)1
- D
4
343
791
424
908
384
1,05
5
457
1,12
9
233
764
254
742
1j4 46
1, 3
32 412
jA31 46
6
1. 5
86 434
1fl 44
7L
422
501
593
1j16 45
4
997
482
996
E.
\Vir
c Po
ds65
9
F.H
ot R
olle
d St
rip
105(
4)14
0(4)
239(
4)25
0(4)
255
341
309
180
226
194
G.
Plat
es47
865
662
076
441
664
262
556
041
240
3
H.
Shee
ts1.
Hut
RoI
Icd
Shee
ts a
nd C
oils
2.C
old
Rol
led
Shee
ts a
nd C
oils
3.E
lect
rica
l Shc
ts4.
Otd
vani
sod
Shee
ts5.
Oth
er Q
ted
Shee
ts
6.T
otal
t
887
1,00
399
81,
129
1,17
61,
372
1,47
499
81,
030
909
T.
Tin
piat
e an
d B
lack
Pla
te23
621
325
830
322
927
234
022
427
1j
J.Fo
rgin
gsm
cl. m
B..
..
K.
Whe
els
and
Axl
esm
d. in
B54
1520
....
....
..t
L.
Stee
l Tub
es a
nd F
ittin
gs38
8(2)
444
353
320
373
394
347
181
183
204
LM
. Dra
en W
iro
and
Wir
e pr
oduc
ts25
3(3)
N.
Co1
d Po
lled
Stri
p72
(1)
90(l
r10
0(1)
100(
1)99
8580
7099
100
O.
Col
d D
raw
n B
ars
TP.
Tot
al A
ll Pe
iort
ed P
rodu
cts
3,80
84,
483
4,80
35,
339
4,47
45,
216
5,46
94,
570
3,84
0 3,
836
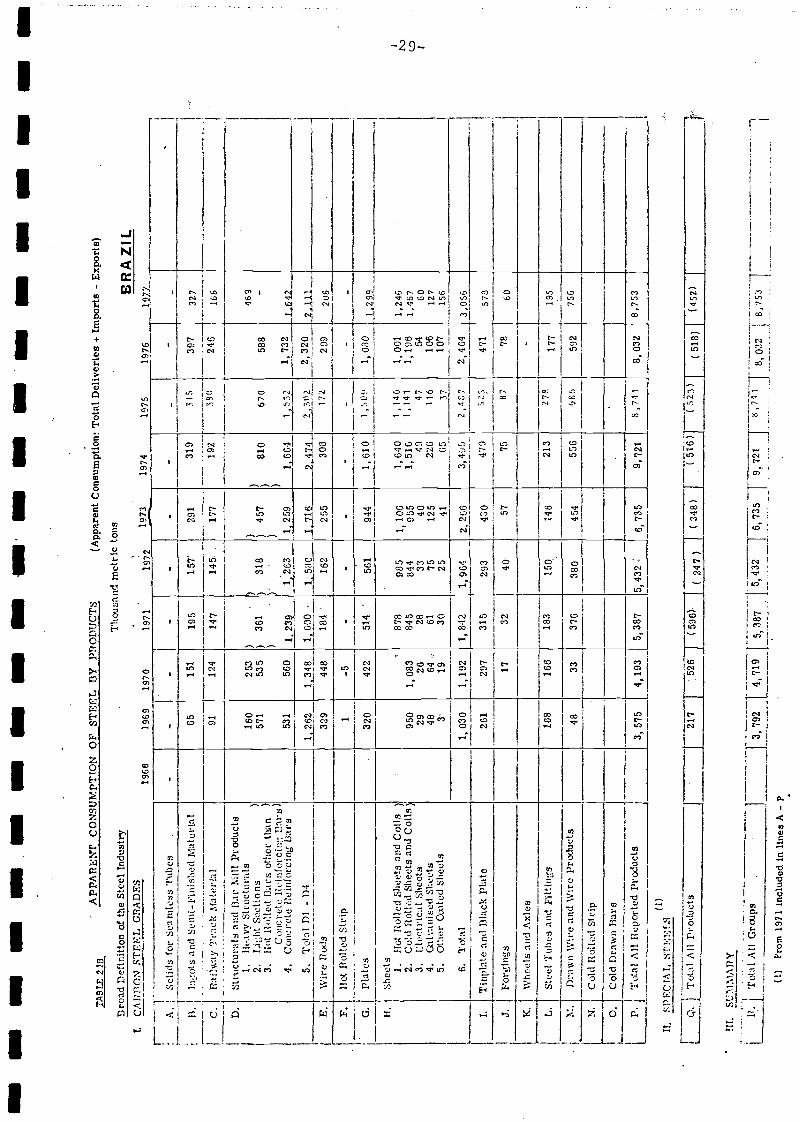
- -
- -
- -
- -
- -
-. -
- -
- -
--
- -
-T
ASt
E 2
13
Bro
:td D
efin
ition
of
the
Stee
l Ind
ustr
y
T.
CA
PflO
N S
TE
EL
GR
AD
ES
II.
SPE
CIA
L S
TE
EL
S
Q. ]
Tot
al A
U P
rodu
ctsAPP
AR
EN
r C
ON
SUM
PTIO
N O
F ST
EE
L B
Y P
RO
DU
CT
S(A
ppar
ent C
onsu
mpt
ion
Tot
al D
eliv
erie
s +
Im
port
8 -
Exp
orts
)
Tho
usan
d m
etri
c to
ns
flu
(596
)(
247
)(3
48)
516)
518)
(452
)
111.
SC3i
IAfl
Y
[___
j'rt
t All
Grc
*ips
3,79
24,
719
5,38
772
1]1i
J21
I
(1)
From
197
1 In
clud
ed I
n lin
es A
- P
A.
--
Solid
s to
r Se
amle
ss T
ubes
--
-
-- -
-- --
--
--
B.
hots
and
Sem
i-Fi
nish
ed M
ater
Ial
6515
119
515
729
131
931
639
732
7
C.
Rai
!way
Tr:
ck M
ater
ial
9112
414
714
517
719
238
024
6
D.
Stru
ctur
ais
and
Bar
Mill
Pro
duct
s1.
Ikav
y St
ruct
urai
s16
025
3)
))
469
2.1i
ht S
uctio
ns3.
lInt
Bol
ted
Bar
s ot
her
than
571
535
)36
1).
318
)45
781
067
058
8-
Co!
Icre
te I
luin
forc
ing
pars
)4.
Cou
erct
e lle
info
rcin
Lia
rs53
156
012
391,
259
1994
1,73
219
42.
6213
481G
001.
sao
j,i1
_oz
2,32
0, w
E.
Vir
e R
ods
329
448
184
192
255
308
172
209
206
F.fl
ot P
olle
d St
rip
i-
--
--
--
-
G.
Plat
es-
320
422
--
514
561
944
1,61
01,
SO
P1,
000
1 f2
99
H.
Shee
ts1.
hot R
olle
d Sh
eets
and
Coi
ls)
'87
898
51
106
1,64
01
»140
1,00
11,
246
2.C
ohi B
oile
d Sh
eets
and
Coi
ls)
950
1,08
384
584
4'9
551,
516
1 »1
411,
196
1,46
73.
Ele
ctri
Cal
She
ets
2926
2833
4049
'754
604.
(kilv
auis
ed S
I:et
s48
6461
7512
522
611
610
612
75.
Otti
er Q
jatc
(l S
heet
s3
1930
2541
(15
3710
715
6
ti.T
otal
1,03
01,
192
1,84
21,
964
2,20
63,
495
2,48
72,
464
3,05
6
T.
Tin
piat
e an
d B
lack
Pla
te26
129
731
529
343
041
952
S47
157
8
J.Fo
rcin
gs17
3240
5775
8778
60
K.
Whe
els
and
Axl
es-
L.
Seci
Tub
es a
nd F
ittin
gs16
816
618
315
Q14
621
327
817
719
5
M.
Dra
wn
Wir
e an
d \V
ire
Prod
ucts
4833
376
380
454
556
592
756
LN
.C
old
Roi
lod
Stri
p
O.
Col
d D
raw
n B
ars
P.T
otal
All
Rep
orte
d Pr
oduc
ts -
3,57
54,
193
5,38
75,
432
6, 7
359,
721
8 74
18,
032
8,75
3BR
AZ
IL19
6819
7319
7419
7519
7
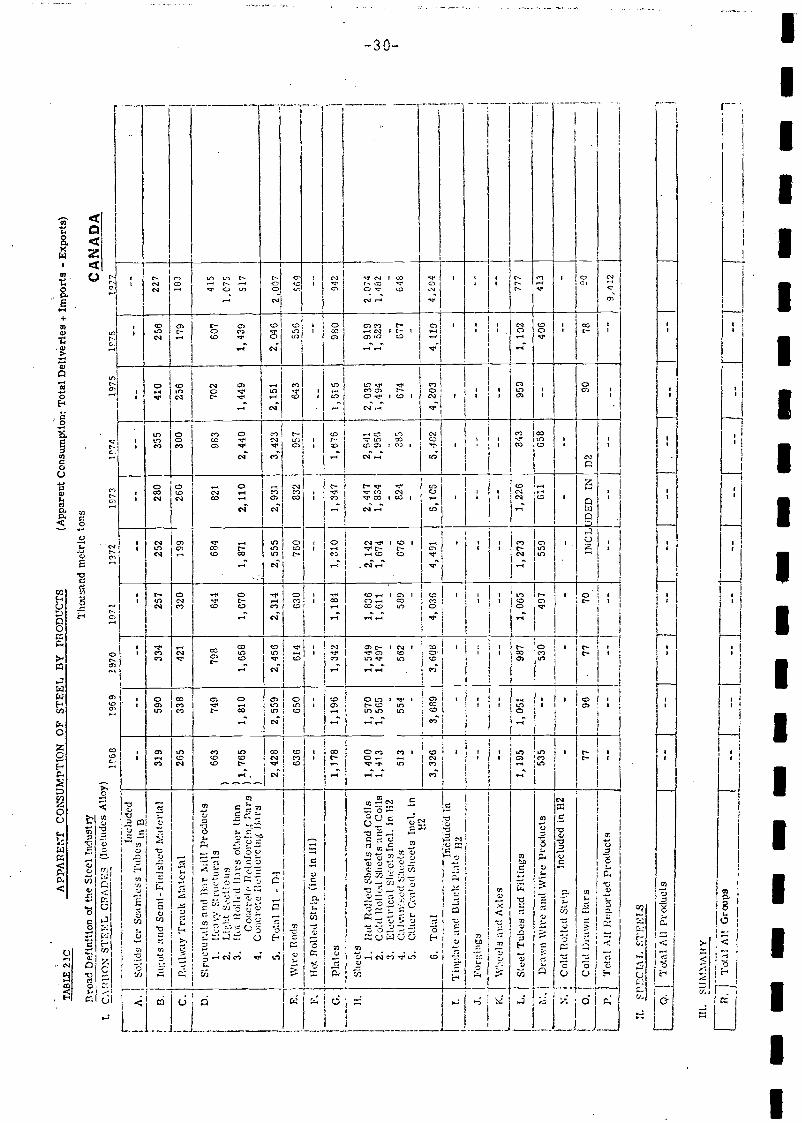
Bro
ad D
efin
ition
of
the
Stee
l 1nd
ust7
T.
C\t?
llOST
FrL
Ofl
AD
TS
(Inc
lude
s A
lloy)
III.
SU
M1A
PY
B. J
Tot
al A
I! G
rips
1969
Il
i
Tho
usan
d m
etri
c to
ns
lC'7
4i °
76
CA
N A
DA
- -
- -
- -
- -
- -
- -
--
- -
- -
--
I_
Incl
uded
----
A.
Solid
t; le
i Sea
mle
ss T
ubes
tB
----
----
----
----
-
13.
ingo
ts z
u,d
Sem
i-Fi
nish
ed M
ater
Ial
319
590
334
257
252
280
355
410
256
227
[_c.
Rai
lway
Tra
ck M
ater
ial
2653
3842
132
019
9260
300
256
179
183
D.
Stru
ctur
aIs
and
lIar
tuill
Pro
duct
s1.
l!ca
vy S
truc
tura
Is66
374
979
864
168
482
198
370
260
741
5
2.L
iht S
'ctjo
s)
1,07
5
Cen
ere
Peiu
foic
inif
lars
i,765
1,81
01,
658
1,67
01,
871
2,11
02,
440
1,44
91,
439
517
4.C
oncr
ete
ilnili
torc
ing
liars
5,T
otal
Dl -
Dl
2,42
82,
559
2,45
62,
314
2,55
52,
931
3,42
32,
151
2, 0
462,
007
E.
Wir
e Il
ods
636
650
614
630
760
832
957
643
556
S60
F.
11t R
olle
d St
rip
(inc
in H
I)-
--
- -
---
G.
Plat
es1,
178
1,19
61,
342
1,18
41,
310
1,34
71,
676
1,51
598
094
2
H.
Shee
ts1.
lint
Boi
led
Shee
ts a
nd C
oils
1,40
01,
570
1,54
91,
836
2,14
22,
447
2,64
12,
035
1,91
92,
074
2.C
old
llolic
d Sh
eets
and
Col
is1,
413
1,56
51,
497
1,61
11,
674
1,83
41,
956
1,49
41,
523
1,48
23.
Llc
ciri
cal S
heet
sbd
,in
112
--
--
--
-4.
CIn
ied
Shee
ts51
355
451
1258
967
682
438
567
467
764
85.
Oth
er C
oate
d Sh
eets
bd,
inp2
--
--
--
--
6.T
otal
3,32
63,
689
3, 6
Q8
4,03
64,
491
5,10
55,
462
4,20
34,
119
4,20
4T
hcT
tide1
ih-
I.T
inpi
ate
aoci
Bla
ck P
hitu
112
--
--
--
-
J.Fo
ring
s--
---
----
--
K.
\V''e
lac
id A
xles
---
---
----
----
----
L.
Stee
tTub
esan
d Fi
tting
s1,
195
1,05
198
71,
065
1,27
31,
226
843
959
1,10
277
7
r:.
Dra
wn
Wir
e an
d W
ire
Pr(x
Iuet
s53
5--
3049
755
961
165
8--
406
413
N.
Col
d fl
otic
d St
rip
Incl
uded
in 1
12--
-
0.1
Col
tI D
raw
n lI
ars
7796
77J
70IN
CL
DE
D I
N D
290
78
P.T
otal
All
P.ep
orte
d Pr
oduc
ts--
----
---
--9,
412
TA
BL
E 2
iCA
PPA
RE
NT
CO
NSU
MPT
ION
OF
STE
EL
BY
PR
OD
uCT
S(A
ppar
ent C
onsu
mpt
ion:
Tot
al D
eliv
erie
s +
Im
port
s -
Exp
orts
)
ir.sr
ctL
ST
EN
ES
[Q
.J
Tot
al A
ll Pr
oduc
ts
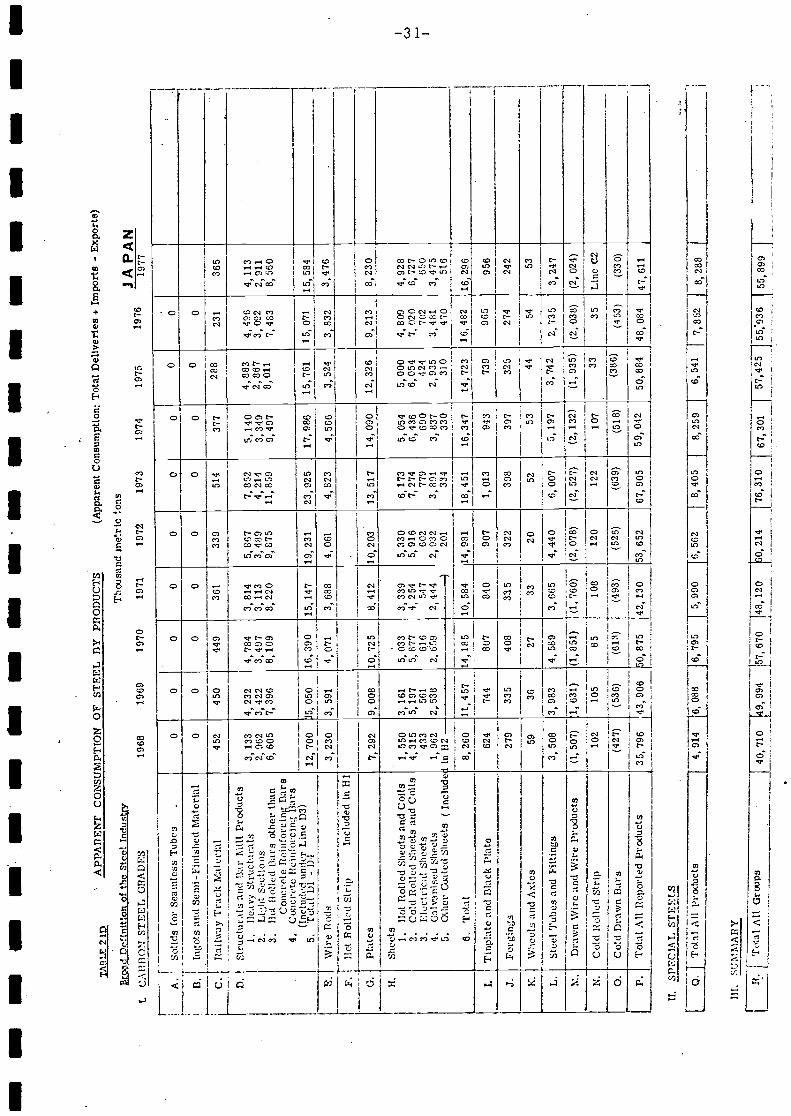
- -
- -
-. -
- -
- -
-, -
- -
- -
- -
- -
-T
AB
LE
2 it
)
rod
Def
initi
on o
f th
e St
eel I
ndus
try
T.
CA
IlB
ON
ST
EE
L G
UA
DE
S
IT.
SPE
CIA
L S
TE
EL
S
Ill.
SIJM
AB
Y
rota
i All
Gri
psJ4
0, 7
1099
467
0j4
8, 1
200,
214
[76,
310
J
67,3
01J
574]
55,
036
55, 8
99J
A.
Solid
s fo
r Se
amle
ss T
ubes
.o
oo
oo
o -o
oo
J
B.
Ingo
ts a
nd S
emi-
Fini
shed
Mat
eria
lO
OO
OO
OO
Oo
C.
Rai
tuy
Tra
ck M
ater
ial
452
450
449
361
339
514
288
231
365
D.
St r
uctu
ra
Ism
lr
Mill
Pro
duct
s1.
Hea
vy S
truc
tura
t3,
133
4,23
24,
784
3,81
45,
867
7,85
25,
140
4,88
34,
496
4,11
32.
Lih
t See
tlo u
s2,
062
3,42
23,
497
3, 1
133,
489
4,21
42,
867
3,09
22,
911
3.H
ot P
olle
d B
ars
othe
r th
an6,
605
7, 3
968,
109
8, 2
209,
875
11,8
598,
011
7,48
38,
560
Con
cret
e R
einf
orci
ng B
ars
4.C
oncr
ete
Iioi
,ifur
cing
liar
su1
5r L
ine
D3)
12, 7
0015
, 050
16, 3
9015
, 147
10, 2
3123
, 925
17, 9
8615
, 761
15, 0
7115
, 584
jL
E.
\Vir
e R
ods
3,23
03,
591
4, O
IL3,
688
4,06
14,
823
4,56
63,
524
.L32
3,47
6
F.H
ot R
ollo
d Si
rip
Incl
uded
in H
l
G.
plat
es7,
292
9,00
810
, 725
8,41
210
, 203
1x51
714
, 090
12, 3
260,
213
8,23
0
H.
Shee
ts 1.H
ot R
olle
d Sh
eets
an.
d C
oils
1, 5
503,
161
5,03
33,
339
5,33
06,
173
5,05
45,
000
4,80
94,
928
2.C
old
Bol
ted
Shee
ts a
nd C
oils
4,31
55,
107
5,87
74,
254
5,91
67,
274
6,43
66,
054
7,02
06,
727
3.E
lect
rica
l She
ets
433
561
616
547
602
'779
690
424
702
650
4.C
alra
nise
d Sh
cet
1,96
22,
538
2,65
92,
444
2,93
23,
891
3,83
72,
935
3,48
13,
475
5.01
0cr
Coa
ted
Shee
ts (
Incl
ude,
in 1
12)
201
334
330
310
470
516
6.T
otal
8,26
011
,457
14, 1
8510
, 584
14, 9
8118
, 451
16, 3
4714
, 723
16, 4
8229
6
I.T
inpi
ate
and
Bla
ck P
late
624
744
807
840
007
1,01
394
373
996
595
5
J.Fo
rgin
gs27
933
540
835
322
398
397
325
274
242
K.
\Vhe
eIan
d A
xles
5936
2733
2052
5344
5453
L.
Stee
l Tub
es a
nd F
litin
gs3,
508
3,98
34,
589
3,66
54,
440
6,00
75,
197
3,74
22,
735
3,24
'?
.D
raw
n \V
ire
and
Wir
e Pr
oduc
ts(1
, 507
)1,
631
)(1
,851
)(1
, 760
)(2
, 078
)(2
,527
)(2
, 132
)(1
,935
)(2
, 038
)(2
, 024
)
N.
Col
d 11
0110
(1 S
trip
102
105
8510
812
012
210
733
35L
ine
2
O.
Col
d D
raw
n B
ars
(427
)(5
36)
(613
)(4
93)
(526
)(6
39)
(518
)(3
86)
(453
)(3
30)
P.T
otal
All
Rep
orte
d Pr
oduc
ts35
, 796
_, 9
0650
, 875
42, 1
3053
, 652
67, 9
0559
, 042
50, 8
8448
, 084
47, 6
11
APP
AII
EN
T C
ON
SUM
PTT
OH
OF
STE
EL
DY
Pfl
OD
UC
TS
(App
aren
t Con
sum
ptio
n: T
otal
Del
iver
ies
+ I
mpo
rts
- E
xpor
ts)
Thc
usan
d m
etri
c to
nsJA
PA
N19
6819
6910
7010
7119
7219
7319
7419
7519
7619
77
LPr
oduc
ts4,
914
8, 0
886,
795
5, 9
906,
562
8,40
58,
259
6,54
1J
7,85
2J
8,28
8
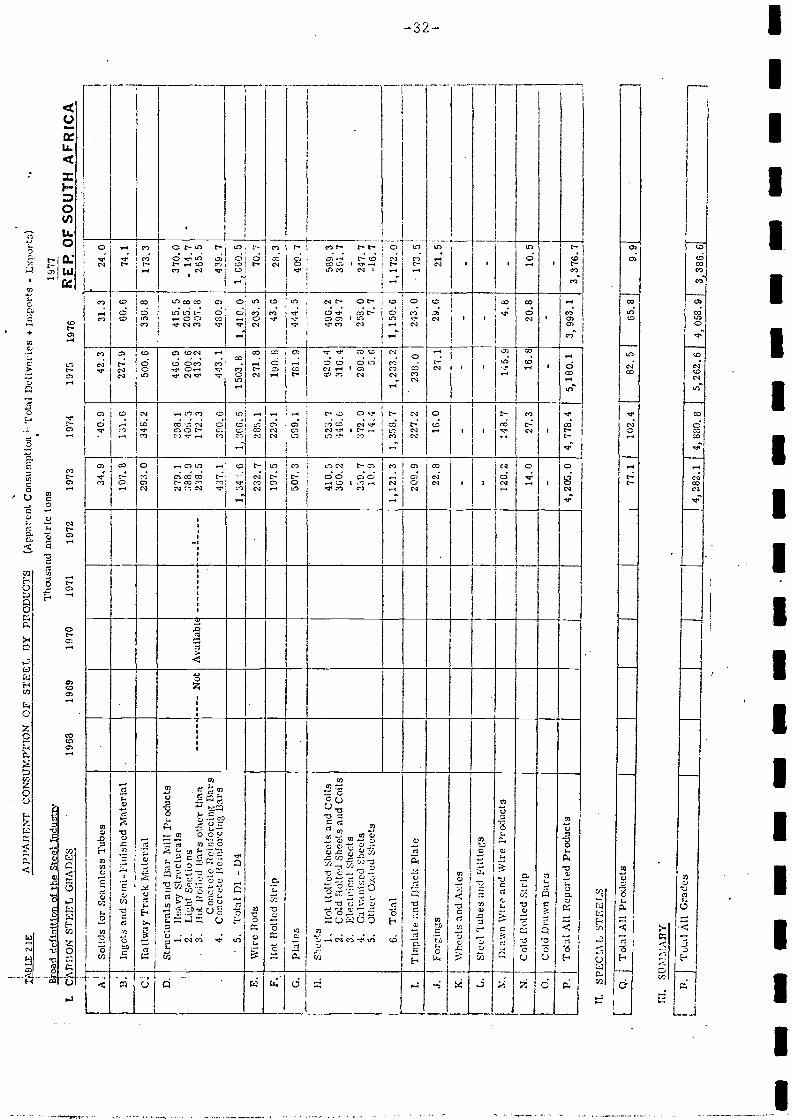
IL S
PEC
L\L
ST
EE
LS
fQ.J
Tot
al A
il Pr
oduc
ts
ru.
SU3i
M\B
y
IP.
1T
otal
Ait
Gra
cic
Li
T
I]
- -
- -
- -
- -
- -
- -
- -
- -
- -
- -
-
Solid
s fo
r Se
amle
ss T
ubes
34.9
40.9
42.3
31.3
24.0
BIn
gots
and
Sem
i-Fi
nish
ed M
ater
ial
107.
813
1.6
227.
960
.674
.1
C D.
Rai
lway
Tra
ck M
ater
ial
293.
034
8.2
500.
635
0.8
173.
3
Stru
ctur
ais
and
Bar
Mill
Pro
duct
s1.
heav
y St
ruct
uraI
s2.
Lig
ht S
ectio
ns3.
hot R
olle
d B
ars
othe
r th
anC
oncr
ete
Rei
nfor
cing
Bar
s4.
Con
cret
e R
einf
orci
ng lI
ars
5.T
otal
Dl -
D4
Not
Ava
ilabl
E
270.
118
8.9
238.
5
437.
1
308.
140
5.3
172.
3
390.
0
446.
920
0.6
413.
2
443.
1
415.
520
5.8
307.
8
480.
9
370.
0-
14.7
265.
5
439.
7
1.36
6.5
1503
.814
1O.o
203.
5
106O
.5
70.7
E.
Wir
e R
ode
232.
728
5.1
271.
8
F.H
ot P
olle
d St
rip
107.
522
9.1
509.
1
523.
744
8.6
- 372.
014
.4
190.
3343
.628
.3
G.
plat
es50
7.3
781.
944
4.5
40°
7
5893
351.
7- 247.
7-1
6.7
H.
Shee
ts 1.H
ot R
olle
d Sh
eets
and
Coi
ls2.
Col
d R
oile
d Sh
eets
and
Coi
ls3.
Ele
ctri
cal S
heet
s4.
Gal
vani
sed
Shee
ts5.
Oth
er C
oate
d Sh
eets
6.T
otal
410.
536
0.2
- 330.
710
.9
520.
431
6.4
-29
0.8
5.6
490.
239
4.7
- 258.
07.
7
1,12
1.3
1,35
8.7
1,23
3.2
1,15
0.6
1,17
2.0
LT
inpl
ate
and
Bla
ck P
late
209.
922
7.2
238.
024
3.0
173.
5
J.Fo
rgin
gs22
.616
.027
.129
.621
.5
K.
Whe
els
and
Axl
es-
t..St
eel T
ubes
and
Fitt
ings
--
-
M.
thaw
n %
Vir
e an
d W
ire
j'roc
luct
g12
0.2
148.
714
5.9
4.8
-
N.
Col
d Il
oile
d St
rip
14.0
27.3
16.8
20.8
10.5
O.
Col
d D
raw
n B
ars
--
-
P.T
otal
All
Rep
orte
d Pr
oduc
ts4,
205.
04,
778.
45,
180.
13,
993.
13,
376.
7
'77.
110
2.4
821
65.8
[9.
9
4,28
2.1
4,88
0.8
5,26
2.6
4,05
8.9
86.6
J
TR
LE
2l
AJ'
I'APE
NT
CO
NSU
MPT
ION
OF
STE
Et B
Y P
POD
UC
TS
(App
aren
t Con
sum
ptio
nT
otal
1)c
livnr
irs
+ I
mpo
rts
- Ix
port
a)
rod
deft
nitln
of
the
Stee
l Ind
ust
Thc
sisa
nd m
etri
c to
nslO
TI
L C
API
3ON
ST
EE
L G
RA
DE
S19
6819
6919
7097
119
7219
7319
7419
7519
76R
EF
OF
SO
UT
H A
FR
ICA
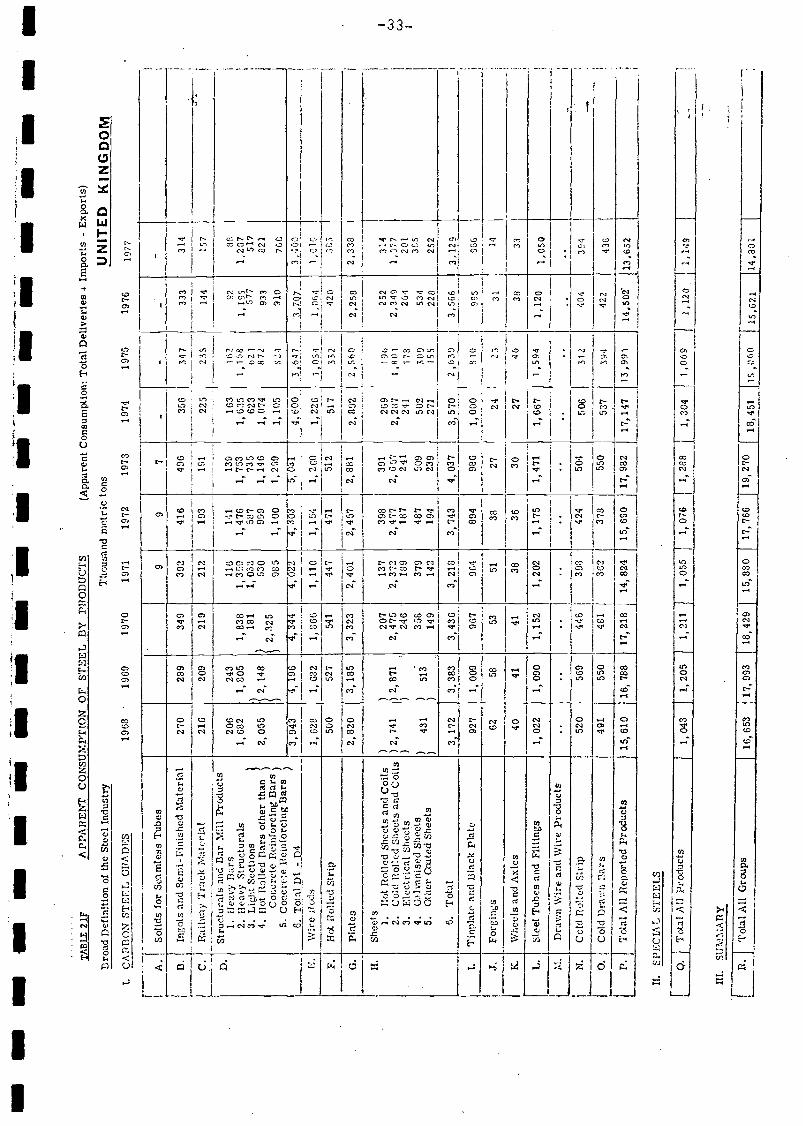
- -
- -
- -,
- -
-- -
- -
- -
- -
- -
TA
BL
E 2
1FA
PPA
I7E
NT
CO
NSU
MPT
ION
OF
STE
EL
DY
Pfl
OD
UC
TS
(App
aren
t Con
sum
ptio
n: T
otal
Del
ivet
'ies
+ I
mpo
rts
- E
xpor
ts)
Bro
ad D
efin
ition
of
the
Stee
l Ind
ustr
yT
hous
and
met
ric
tons
UN
ITE
D K
ING
DO
ML
CA
PUO
N S
TE
EL
GPA
DE
S19
6319
6910
7010
7119
7219
7319
7419
7519
7619
77
IL S
PEC
IAL
ST
EE
LS
[Ql T
otal
All
Prod
ucts
iii.
su:in
yI
Il.
Tot
al A
U G
rips
16, 6
5317
, 993
18,4
2j 1
5,88
0
1,05
51,
076
1,28
8
17, 7
6619
, 270
1,30
41,
069
1,12
0J
1,14
9
A.
Solid
s fo
r Se
amle
ss T
ubes
99
7-
13.
-In
gots
aoc
i Sem
i-Fi
nish
ed M
ater
ial
270
289
349
392
416
496
356
347
333
314
C.
Rai
lway
Tra
ck M
teri
aI21
520
921
921
219
3--
-.-
- -
191- 22
5-
----
235
---- 14
415
7j
D.
Stru
ctur
ais
and
Dar
Mill
Pro
duct
s1.
Hea
vy P
ars
206
243
110
141
139
163
162
9285
2. H
eavy
Str
uctu
raIs
1,68
21,
805
1,83
81,
359
1,47
61,
753
1,63
51
1 8
1, lo
s1,
207
3. L
ight
Sec
tions
318
11,
032
587
735
623
621
577
517
4. f
lot R
olle
d Pa
rs o
ther
than
2 05
5'
2 14
8'
530
999
1,14
61,
074
872
933
821
j
Con
cret
e R
einf
orci
ng B
ars
5C
oncr
ete
Rei
nfor
cing
Bar
s2,
325
985
1,10
01.
250
1,11
)5S1
910
6. T
otal
Di -
D4
3,94
34,
196
4,34
44,
022
4,30
350
314,
600
Ô4
73,
7Q7
3,40
0E
.W
ire
Rod
s1,
628
1,68
21,
866
1,11
01,
154
1, 2
GO
1,22
61
41,
061
1 01
6
F.H
ot R
olle
d St
rip
500
527
541
447
471
512
517
332
420
G.
Plat
es2,
820
3,18
53,
323
2,40
12,
457
2,88
12,
892
2,56
02,
258
2.33
8
H.
Shee
ts1.
lInt
Rol
led
Shce
ts a
nd C
oils
))
207
137
398
391
269
196
252
314
2.C
otd
Boi
led
Shee
ts a
nd C
oils
) 2,
741
) 2,
871
2,47
52,
372
2,47
72,
057
2,28
71
801
2,34
91,
577
j
3.E
lect
rica
l She
ets
))
246
189
187
241
241
178
204
201
4.G
i1va
nisc
d Sh
eets
431
513
356
379
487
509
502
309
534
365
5.O
ther
ted
Shee
ts14
914
219
423
927
155
220
252
6.T
otal
3,17
23,
383
3,43
63,
218
3,74
34,
037
570
2 63
93,
566
3,12
9
T.
Tin
piat
e an
d B
lack
Pla
to92
71,
009
967
964
894
986
1,00
081
090
598
6
J.Fo
rgin
gs62
5853
5138
2724
2331
K.
Whç
ets
and
Axl
es40
4141
3836
3027
4638
33
L.
Stee
l Tub
es a
nd F
ittin
gs1,
022
1,09
01,
152
1,20
21,
175
1,47
11,
667
1 59
41,
120
1,05
0M
.D
raw
n \V
ire
and
Wir
e pr
oduc
ts..
...
...
.N
.C
old
Rol
led
Stri
p52
056
944
8 -
393
424
504
506
312
404
394
O.
Col
d D
raw
n B
ars
491
550
481
362
378
550
394
422
436
Tot
al A
ll R
epor
ted
Prod
ucts
15,6
1016
, 788
17, 2
1814
, 824
15, 6
9017
, 982
- 17
,147
13,9
9114
, 502
13.6
52
18,4
5115
,060
fis,
621
f14.
801
I, 0
431,
205
1,21
1
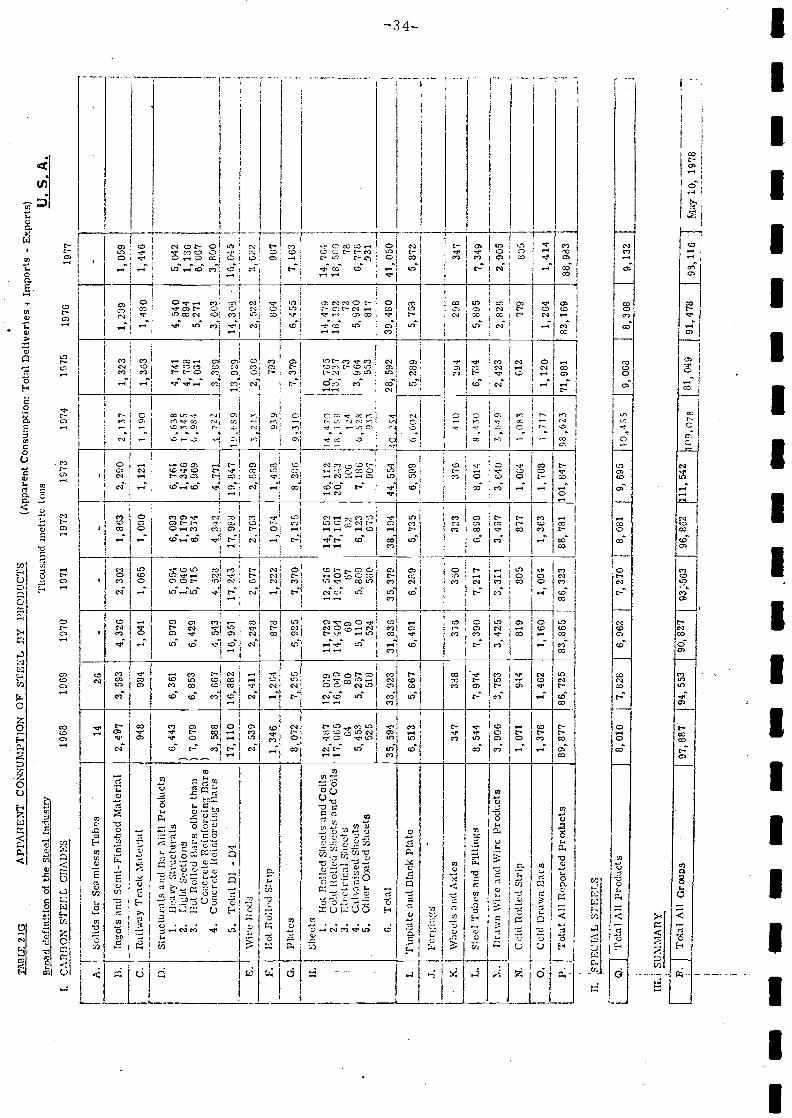
- -
-TA
BL
E 2
1G
Bro
ad d
efin
Itio
n of
the
Ste1
Ind
ustr
y
L C
\DJ3
ON
ST
EE
L G
Í7A
DE
S
IT.
SPE
CIA
L S
TE
EL
S
[Q
. J 'F
etal
All
Prod
uctsA
PPA
PEN
T C
OÑ
SUM
PTIO
N O
F ST
EE
L D
Y J
.'I?O
DIJ
CT
S(A
ppar
ent C
onsu
mpt
ion:
Tot
al D
eliv
erie
s +
Im
port
s-
Exp
orts
)T
houa
d m
etri
c to
es
8,01
0i
7,82
i1 6
,962
7, 2
708,
081
9,69
51O
,4S5
9,06
8L
-U.S
. A.
C)
- -
- -
- -
- -
- -
- -
- -
- -
- -
A.
Solid
s fo
r Se
amle
ss T
ubes
1426
--
B.
Ingo
ts a
nd S
emi-
Fini
shed
Mat
eria
l2,
497
3, 5
93, 3
262,
302
1, 8
632.
290
2 ,
371,
323
1, 2
391,
059
C.
hallw
ay T
rack
Mat
eria
l94
898
41,
041
1, 0
651,
090
1, 1
21i
, i 9
033
31,
480
1,44
6
D.
Stru
ctur
aIs
atid
llar
Mill
Pro
duct
s1.
Hea
vy S
truc
tura
is6,
443
6, 3
615,
979
5, 9
546,
093
6, 7
61,3
84
741
4 54
05,
042
2.L
ieht
Sec
tions
)I,
046
1, 1
791,
346
1 34
54
894
1 13
63.
UG
t flo
llcd
Bar
s ot
her
than
Cou
cret
e R
einf
orci
ng B
ars
)7,
079
)
6, 8
536,
429
5, 'i
56,
3'7
46,
969
(, ,
984
5, 2
716'
067
4.C
oncr
ete
Ilci
nt e
rrin
g I3
ar38
667
4,54
34
523
4343
4 77
1L
223,
399
3,60
380
0
5.T
otal
Dl -
1)4
17, 1
1016
, 882
16, 9
5117
, 243
17, 9
8819
,847
1° (
8913
x929
14, 3
0816
,045
E.
Wir
e Po
ds2,
539
2,41
12,
248
2,67
72,
763
2,88
93L
213
2, 0
302,
522
2,62
21
F.IT
ot I
lollo
ci S
trip
1 34
61
264
878
222
1,05
41,
458
939
793
864
907
G.
Plat
es8,
072
,,j,2
566,
925
7,37
07.
13
, 28Q
9_71
63
H.
Shee
ts1.
11cl
Pol
led
Shec
t. an
d C
oils
12 4
8712
010
11 '7
2912
516
14 1
5216
, 112
4,47
010
, 705
14,4
792.
Col
d Il
olle
d Sh
eets
and
Coi
ls3.
Ele
ctri
cal S
heet
s17
' 065
'4
16 0
49 8014
'404
'60
16' 4
07'
6717
' 181 82
20 2
43 106
i,1
¿'8
13, 2
37 7318
, 192 72
18, 5
00 784.
Ctiv
anis
ed S
heet
s5
453
5 25
75
110
5 80
96
123
7 18
66,
528
3,96
45,
920
6,77
85
Qtu
cr c
itcd
Sh,.c
ts52
551
852
4uS
O67
o90
79
8,j3
817
931
6.T
otal
_33
, 923
31, 8
3635
379
38 1
9444
554
4428
, 592
39,4
8041
, 050
LT
inpl
ate
and
Bla
ck P
late
6,51
35,
867
6,49
16,
289
5,73
56,
599
6 60
25,
289
5,75
85,
872
J.l"
orgi
ngs
K.
Whe
els
and
Axl
es34
738
837
635
032
337
641
030
429
834
7
L.
Stee
l Tub
es a
nd F
ittin
gs8,
544
7,97
4'7,
390
7,21
76,
899
8, 0
148
430
6, 7
345,
805
7,34
9
1.D
raw
n W
ire
and
Wir
e Pr
odct
s3,
906
3, 7
533,
425
3,31
13,
497
3, 6
403,
(49
2,42
32,
8211
2,90
5
Col
d B
olte
d St
rip
1,07
194
481
980
587
71,
064
1 08
361
277
980
5
O.
Col
d 1)
raw
n B
ars
1,37
61,
462
1,16
01,
094
1,36
31,
708
1 71
71,
120
1,26
41,
414
P.T
otal
All
Rep
orte
d Pr
oduc
ts89
, 877
86, 7
2583
, 865
86, 3
2388
, 781
101,
847
98 6
2371
, 981
83, 1
6988
, 983
8,30
89,
132
90, 8
2793
;563
96,8
211
1,54
210
9,07
881
, 049
J 91
, 478
116
J
May
10,
197
8
1968
1969
1070
1971
1972
1973
1974
1975
1970
1977
Ill.
SUM
MA
PY
Tot
al A
U G
raip
sJ
97,8
8794
,

- -
- -
- __
- -
- -
- -
- -
- -
- -
- -
TA
BL
E 2
1HA
PPA
T?E
NT
CO
NSU
MPT
ION
OF
STE
EL
DY
PR
OD
UC
TS
(App
aren
t Con
sum
ptio
n: T
otal
Del
iver
ies
+ I
mpo
rts
- E
xpor
ts)
Bro
ad D
efin
ition
of
the
Stee
l Ind
ustr
y
I.C
AB
I3O
N S
TE
EL
GR
AD
ES
11.
SPE
CIA
L S
TE
EL
S
Tho
ucan
d m
etri
c to
ns
1068
1969
1070
1971
1972
1073
1974
1975
1976
VE
NE
ZU
ELA
A.
Solid
s fo
r Se
amle
ss T
ubes
218
--
--
-
B.
Ingo
ts a
nd S
emi-
Fini
shed
Mat
eria
l5
205
170
8424
820
2
C. .
flai
iway
Tra
ckM
ater
ial
22
13
36
47
j
D.
Stru
ctur
ais
and
Bar
íi1I
Prod
ucts
1.Il
cavy
Str
uctu
raIs
6852
5164
9079
80ilS
2.L
i5ht
Sec
tions
)41
3350
6056
6478
3.H
ot I
ioU
ed li
ars
othe
r th
an)
514
28
32
--
Con
cret
e R
einf
orci
ng B
ars
4.C
oncr
ete
Rei
nfor
cing
lIar
s22
222
027
630
334
428
9
5.T
otal
Di -
Dl
341
317
362
425
499
565
718
(27
E.
Wir
e R
ods
3228
4044
6298
138
123
F.H
o& R
olle
d St
rip
41
11
1-
-
G.
Plat
es38
8296
108
108
6812
214
8
H.
Shee
ts 1.H
ot R
olle
d Sh
eets
and
Coi
ls)
190
5963
6682
182
161
286
2.C
old
Rol
led
Shee
ts a
nd C
oils
)79
9197
10G
118
276
363.
Ele
ctri
cal S
heet
s1
11
1-
--
4.Q
ilvan
ised
She
ets
1238
4345
5253
--
5.O
ther
coa
ted
Shee
ts8
1120
2329
4643
4 7
6.T
otal
210
188
218
322
270
399
480
649
t.T
tnia
te a
nd B
lack
Pla
to65
8097
7910
185
11)1
J.Fo
rgin
gs4
--
--
--
-
K.
Whe
els
and
Axl
es-
--
--
--
-
L.
Stee
l Tub
es a
nd F
ittin
gs19
419
519
318
611
510
318
615
6
.D
raw
n W
ire
and
V/ir
e Pr
oduc
ts51
5551
4045
4528
34
rN
.C
old
io11
ed S
trip
21
12
-
rO. C
old
Dra
wn
Bar
s-
--
--
-
P.T
otal
All
Rep
orte
d Pr
oduc
ts1,
166
1,15
51,
230
1,29
31,
454
1,58
31,
761
1 84
5
fTot
al A
ll pr
oduc
ts15
1821
2447
I63
Dl.
SWd?
dAPY
r. j
Tot
al A
ll G
roup
s1,
170
1,24
81,
314
1,47
81,
630
1,82
4j
1,84
51
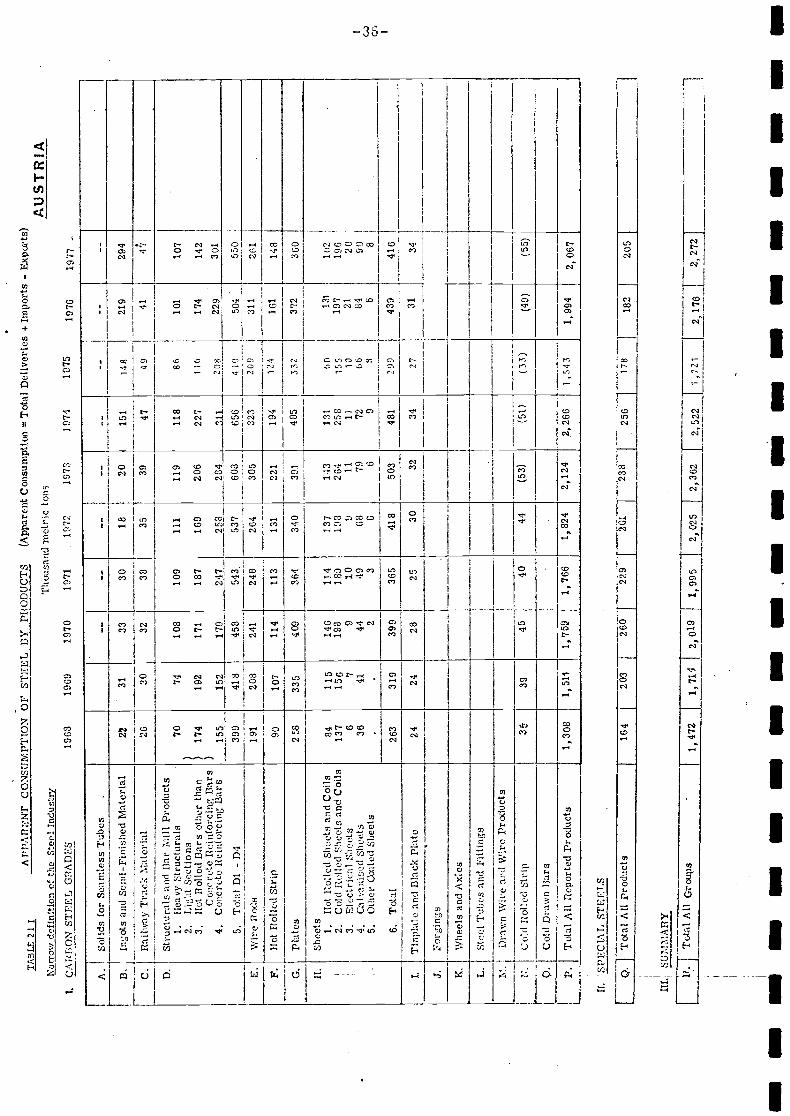
TA
BL
E 2
11C
ON
STJM
IT I
ON
OF
STE
EL
BY
PR
OD
UC
TS
(App
aren
t Con
sum
ptio
n =
Tot
al D
eliv
erie
s +
Im
port
s -
Exp
orts
)
Nar
row
def
initi
on o
f th
e Se
cl I
ndus
try
1.C
AR
BO
N S
TE
EL
GR
AD
ES
A.
Solid
s fo
r Se
amle
ss T
ubos
IL S
PEC
L\L
ST
EE
LS
III.
SU7D
dAR
Y
lì. j
Tot
al A
ll G
roup
s
1908
1969
1070
1971
1972
1973
1074
1075
1,47
21,
714
2,01
91,
995
2,02
5
AU
STR
IAT
hous
and
met
ric
tons 2,
362
I2,5
221,
721
j2,
176
1976
1917
2,27
2
--
- -
- -
- -
- -
- -
- -
- -
- -
-
B.
Ingo
ts a
ird
Sem
i-Fi
nish
ed M
ater
ial
2231
3330
1820
151
47
148 49
219
294
C.
Rai
lway
Tra
ck M
ater
ial
2630
3238
3539
414
D.
Stru
ctur
ais
and
liar
Mill
Pro
duct
s1.
Hea
vy S
truc
tura
Is2.
Lig
ht S
ectio
ns3.
Hot
Rol
led
Bar
s ot
her
than
Con
e re
te R
einf
orci
ng B
ars
4.C
oncr
ete
Rei
nfor
cing
Bar
s
5.T
otal
Dt -
D4
70
)17
4
155
74 192
152
108
171
179
109
187
247
111
169
258
119
206
284
118
227
31t
86 116
208
101
174
229
107
142
301
399
418
458
241
543.
248
537
264
608
305
656
323
410
504
550
E.
V/ir
e B
odH
191
208
209
311
261
F.11
cl R
olle
d St
rip
9010
711
411
313
122
119
412
416
114
8
G.
plat
es25
833
540
936
434
039
148
533
237
2 131
197 21 84 6
L36
0
102
190 20 908
H.
Shee
ts1.
flot
Rol
led
Shoe
t and
Coi
ls2.
Col
d R
olle
d Sh
eets
and
Coi
ls3.
Ele
ctri
cal S
heet
s4.
Ga1
'nis
ecI
Shee
ts5.
Oth
er C
oale
d Sh
eets
6.T
otal
84 137 6
35 .
115
15 41 .
146
198 9 44 2
114
189 10 493
137
198 9 68 6
143
264 ii 79 6
131
258
11 729
60 i10 66
8
263
319
399
365
418
503
481
299
439
416
I.T
inpI
ate
and
Bla
ck P
late
2424
2825
3032
3427
3134
J.Fo
rgin
gs
K.
Whe
els
and
Axl
es
L.
Stee
l Tub
es a
nd F
ittin
gs
M.
Dra
wn
\ViI
C a
nd W
ire
Prod
ucts
N.
Q.
Col
d R
olle
d St
rip
3439
4540
44(5
3)(5
1)(3
3)(4
9)(5
5)
Col
d D
raw
n lI
ars
P.T
otal
AL
I R
epor
ted
Prod
ucts
1,30
81,
511
1, 7
91,
766
1,82
42,
124
.2, 2
661
543
1,99
42,
067
Q.
Tot
al A
ll pr
oduc
ts16
420
326
022
[20
123
825
617
8j
182
205
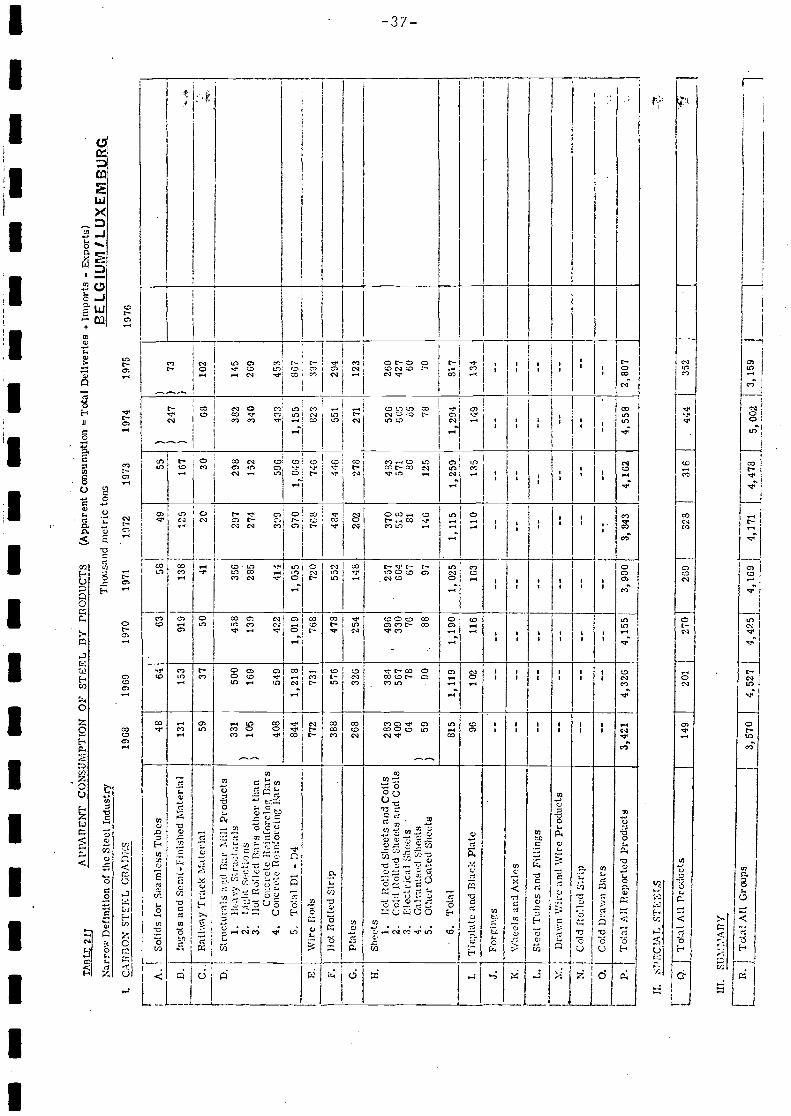
- -
- -
- -
- -
- -
_u.
.ä.-
.. _-
u.._
- -
TA
Bt
217
Nar
row
Def
initi
on o
f th
e St
eel I
ndus
try
LC
ÀI?
F3O
N S
TE
EL
GB
AD
ES
II.
SPE
CIA
L s
TE
EL
s
To.
aI A
ll Pr
oduc
tsAPP
ArI
EN
T C
ON
SUM
PTIO
N O
F ST
EE
L D
Y P
POD
UC
TS
App
aren
t Con
sum
ptio
nT
otal
Del
iver
ies
+ I
mpo
rts
-po
rts)
BE
LG
IUM
F L
UX
EM
BU
RQ
Tho
usan
d m
etri
c to
ns
1968
1969
1970
1971
1072
1973
1974
1975
1976
149
201
270
269
328
L16
444
352
A.
Solid
s fo
r Se
amle
ss T
ubes
4864
631
5840
55)
247
)-
68 382
340
433
----
----
-)
73)
-- 102
145
269
453
B.
p---
- C..
Ingo
ts a
nd S
emi-
Fini
shed
Mat
eria
l--
---
131
153
019
138
125
167 30
298
152
596
Hai
lway
Tra
ck M
ater
ial
5937
5041
20-
D.
Stru
ctur
ais
53cl
Bar
Miii
Pro
duct
s1.
Hea
vy S
truc
tura
is2.
Idgl
it Se
Ctio
ns3.
¡lot
Pol
led
iTht
rs o
ther
than
Con
cret
e fl
einf
orc1
nc B
ars
4.C
oncr
ete
Rei
nfor
cing
lIar
s
5.T
otal
Dl -
1)4
331
105
408
500
169
549
458
139
422
356
285
414
297
274
399
844
1,21
81,
019
1,05
597
01?
046
746
1,15
5
823
867
397
P.W
ire
Pods
772
731
768
720
708
F. G.
Hot
Pol
led
Stri
p38
857
647
855
248
444
655
129
4
123
Plat
es26
832
625
414
820
227
827
1
H.
Shee
ts1.
11cL
Rol
led
Shee
ts a
nd C
oils
2.C
old
Roi
led
Shee
ts a
nd C
oils
3.E
lect
rica
l She
ets
:
6.T
otal
283
409 64 59
384
567 78 90
496
330
7G 88
257
604 67 97
370
518 81
146
433
571 80
125
526
605 85 78
260
427 60 70
815
1,11
91,
190
1,02
51,
115
1,25
91,
294
817
LT
inpi
ate
and
Bla
ck P
late
9610
211
616
311
013
514
913
4:
J.Fo
rgin
gs--
----
----
--
K.
V/h
çels
and
Axl
es--
----
----
----
--
L.
Stee
l Tub
es a
nd F
ittin
gs--
----
----
----
--
M.
Dra
v.'n
V/ir
e an
d W
ire
Prod
uet
----
----
---
N.
Col
d rl
olld
Str
ip--
----
----
----
O.
Col
d D
raw
n B
ars
----
----
---
--.
--
P.T
otal
All
Rep
orte
d Pr
oduc
ts3,
421
4,32
64,
155
3,90
03,
843
4,16
24,
558
2,80
7
4,47
8[5,
002J
3,15
94,
527
4,42
5!4,
169
4,17
11
iII
I.SU
\!'A
I?Y
LT
otal
Ail
Gro
nps
J3,5
70
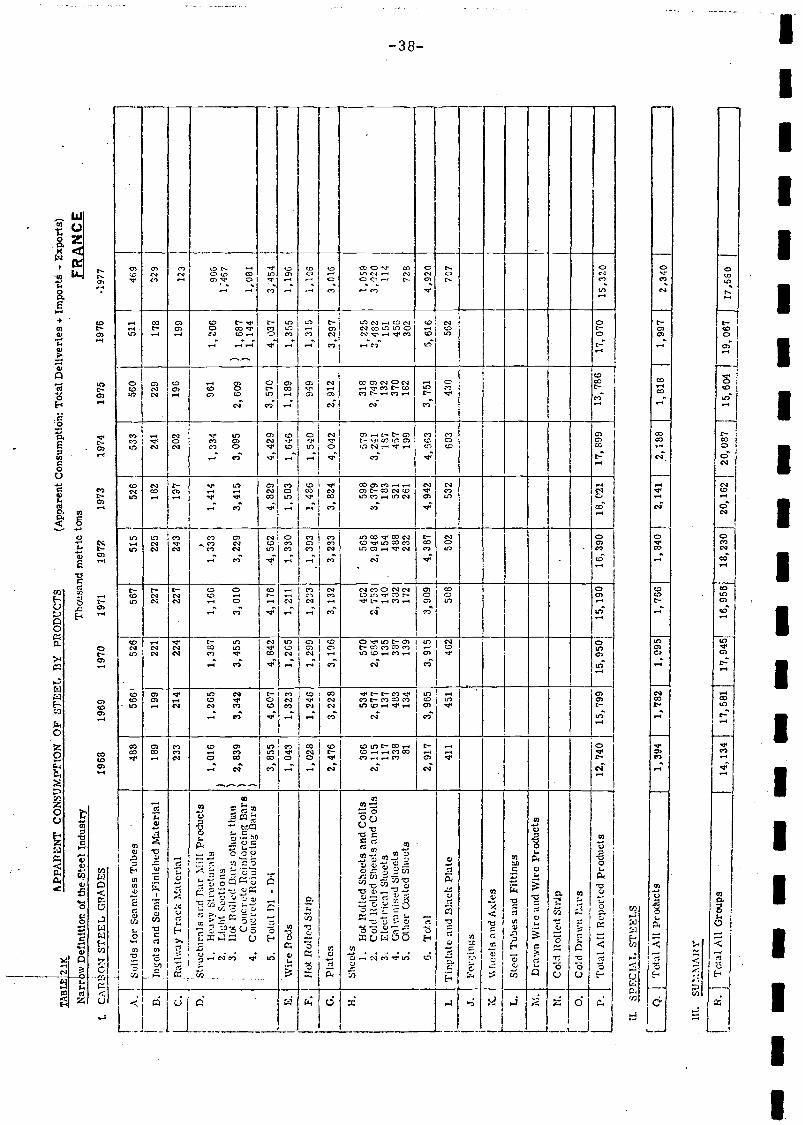
II.
SPE
CIA
L S
TE
EL
S
[(
IT
otal
All
prod
ucts
111.
SU
.:ÂPY
rTf
Tca
l All
¡1,
394
1,78
21,
095
- -
- -
- -
- -
- -
- -
- -
- -
- -
--
A.
Sulid
s fo
r Se
amle
ss T
ubes
488
566
526
567
515
526
533
560
511
469
D.
Ingo
ts a
nd S
emi-
Fini
shed
Mat
eria
L18
919
922
12.
2722
518
224
122
917
832
9
C.
D.
Ritt
way
Tra
ck M
ater
ial
233
214
224
227
243
197
202
196
199
123
Stru
ctur
ais
and
Bar
Mill
Pro
duct
s1.
Hea
vy S
truc
tura
is2.
Lig
ht S
eetlo
3.H
Ot R
olle
d B
ars
othe
r th
anC
oncr
ete
fleu
ifor
cing
Bar
s4.
Con
cret
e R
einf
orci
ng B
ars
5.T
otal
1)1
- D
4
1,01
6
2,83
9)
1,26
5
3,34
2
1,38
7
3,45
5
1,16
6
3,01
0
1,33
3
3,22
9
1,41
4
3,41
5
1,33
4
3,09
5
961
2 60
9
1,20
6
1 68
71,
144
i ;46
7
1,08
1
3,85
54,
607
4,84
24,
176
4, 5
624,
829
4,42
9
1,64
6
3, 5
70
1,18
94L
037
1,35
5
3,45
4
E.
Wir
ePod
s1,
043
1,32
31,
265
1,21
11,
330
1,50
31,
196
F.H
OI
Roi
led
StrI
p1,
028
1,24
61,
299
1,23
31,
393
1, 4
861,
540
949
1,31
51,
106
G.
Plat
es2,
476
3,22
83,
196
3,13
23,
233
3,82
44,
042
2,91
23,
297
3,01
6
H.
Shee
ts L H
ot R
olle
d Sh
eets
and
Coi
ls2.
Col
d R
olle
d Sh
eets
and
Col
ts3.
Ele
ctri
cal S
heet
s4.
Gal
vani
sed
Shee
ts5.
Oth
er (
coat
ed S
heet
s
6.T
otal
366
2,11
511
733
8 81
534
2,67
713
748
313
4
570
2,68
413
538
713
9
462
2,75
314
038
217
2
565
2,94
815
448
823
2
598
3,37
918
352
126
1
579
3,24
118
745
719
9
318
2, 7
49 132
370
182
1 22
53,
482
151
45g
302
1,05
83,
020
114
728
2,91
73,
965
3,91
53,
909
4,38
74,
942
4,66
33,
751
5,61
64,
920
LT
iepl
ate
and
Bla
ck P
late
411
451
462
508
502
532
603
430
562
707
J.Fo
rgin
gs
K.
Whe
els
and
Axl
es
L.
Stee
l Tub
es a
nd F
ittin
gs
M.
Dra
wn
Wir
e an
d SV
ire
Prod
ucts
N.
Col
d R
olle
d St
rap
O.
Col
d D
raw
n B
ars
P.T
otal
Alt
Rep
orte
d pr
oduc
ts12
, 740
15, 7
9915
, 95j
15,1
9016
, 390
18, 0
2117
, 899
13, 7
8617
, 070
15,3
20
TA
BL
E2
1KA
PPA
RE
NT
CO
NSU
MPT
ION
OF
STE
EL
BY
PR
OD
UC
TS
(App
aren
t Con
sum
ptio
n: T
otal
Del
iver
ies
+ I
mpo
rtS
- E
xpor
ts)
Nar
rw D
efIn
ition
of
the
Stee
l Ind
ustr
yT
hous
and
met
ric
tons
FR
AN
CE
t CA
R1O
' ST
EE
L G
RA
DE
S19
6819
6919
7019
7119
7219
7319
7419
7519
76.1
977
18,2
30 J
20,1
20, 0
87J
15, 6
0419
, 067
17,6
60J
14,1
3417
,581
17,9
4516
,956
1,76
61,
840
2,14
12,
188
1,81
81,
997
2,34
0
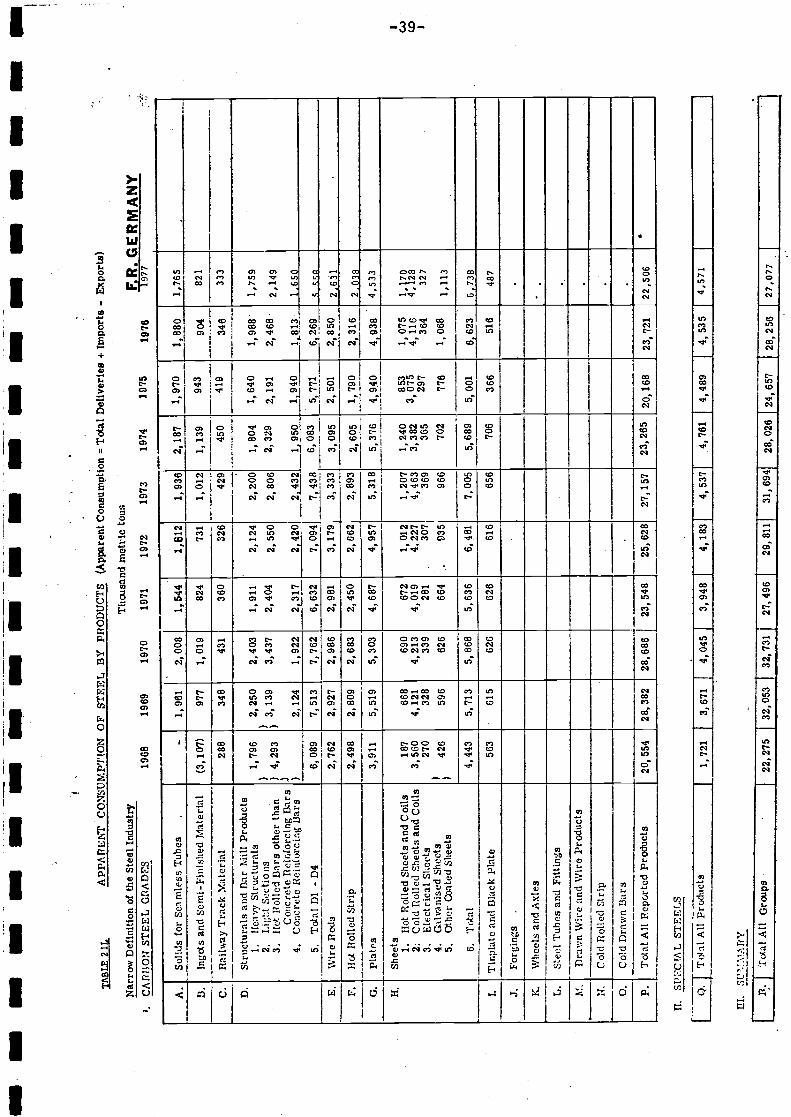
TA
BL
E 2
1L
rl.
SI'I'
CIA
L S
TE
EL
S
[Q.J
Tot
al A
ll Pr
oduc
ts
UI.
SU
'AR
Y
1,72
1
22, 2
75
3,67
1
32, 0
53
-. -
- -
- -
- -
- -
- -
- -
- -
- -
- -
-A
PPA
RE
NT
CO
NSU
MP'
IIO
N O
F ST
EE
T. B
Y P
RO
DU
CT
S (A
ppar
ent C
onsu
mpt
ion
= T
otal
Del
iver
ies
+ im
port
s -
Exp
orts
)
4,04
5
32,7
31
3,94
8
27,4
96
4,18
3
29, 8
11
4,53
7
31,6
94
4,76
1
28,0
26
4,48
94,
535
24,6
5728
,256
4,57
1
27,0
77
A.
Solid
s fo
r Se
.imle
ss T
ubes
.-
1,96
12,
008
1,5.
44l,1
21,
936
2,18
71,
970
101,
765
D.
Ingo
ts a
nd S
emi-
Fini
shed
Mat
eria
l(3
,107
)97
71,
019
824
731
1,01
21,
139
943
982
1
C.
Rai
lway
Tra
ck M
ater
ial
288
348
431
360
326
429
450
419
346
333
D.
Stru
ctur
ais
and
Bar
Mill
Pro
duct
s1.
Hea
vy S
truc
tura
is2.
Lig
ht S
ectio
ns3.
hot R
olle
d B
ars
othe
r th
anC
oncr
ete
Rei
nfor
cing
Bar
s4.
Con
cret
e R
einf
orci
ng B
ars
5.T
otal
Dl -
D4
1,79
6
)4,
293
)
2,25
03,
139
2,12
4
2,40
33,
437
1,92
2
1,91
1
2,40
4
2,31
7
2,12
4
2,55
0
2,42
0
2,20
0
2,80
6
2,43
2
7,43
8
1,80
42,
329
L95
0
1,64
0
2, 1
91
1,94
0
1,98
8
2,46
8
1,81
3
1,75
9
2,14
9
1.65
0
6,08
97,
513
7,76
26,
632
7,09
46,
083
3,09
5
5 77
16L
269
ç cc
E.
Vhr
c B
oda
2,76
22,
927
2,98
62,
981
3,17
93,
333
2,50
12,
850
2,63
1
F.H
ot R
olle
d St
rip
2,49
82,
809
2,68
32,
450
2,66
22,
893
2,60
51,
790
2,31
62.
038
G.
Plat
es3,
911
5,51
95,
303
4,68
74,
957
5,31
85,
376
1,24
03,
382
365
702
4,94
0
853
3,07
529
7
778
4L93
8
1,07
54,
116
364
1,06
8
1,17
04,
128
327
1,11
3
H.
L
Shee
ts1.
Hot
Rol
led
Shee
ts a
nd C
oils
2.C
old
Rol
led
Shee
ts a
nd C
oils
3.E
lect
rica
l She
ets
4.G
atva
nise
dShc
cts
5.O
ther
Coa
ted
Shee
ts
6.T
otal
187
3,56
027
0
426
668
4,12
132
8
596
690
4,21
333
9
626
672
4,01
928
1
664
1,01
24,
227
307
.03
5
1,20
74,
463
369
966
4,44
35,
713
5,86
85,
636
6,48
17,
005
5,68
9
706
5,00
1
366
6,62
3
516
6,73
8
Tin
piat
e an
d B
lack
Pla
te56
361
562
662
661
665
648
7
J.Fo
rgin
gs
K.
Whe
els
and
Axl
es
L.
Stee
l Tub
es a
nd F
ittin
gs
M.
Dra
wn
Wir
e an
d W
ire
Prod
ucts
N.
Col
d R
olle
d St
rip
O.
Col
d D
raw
n B
ars
P.T
otal
All
Rep
orte
d Pr
oduc
ts20
, 554
28, 3
8228
, 686
23, 5
4825
, 628
27,1
5723
, 265
20,1
6823
, 721
22,5
06
B.
Tot
al A
LI
Gra
ps
Nar
row
Def
initi
on o
f th
e St
eel I
ndus
try
Tha
isan
':l m
etri
c to
nsF
.R. G
ER
MA
NY
.C
AR
UO
U S
TE
EL
GR
AD
ES
19G
B19
6919
7019
7119
7219
7319
7419
7519
7619
77
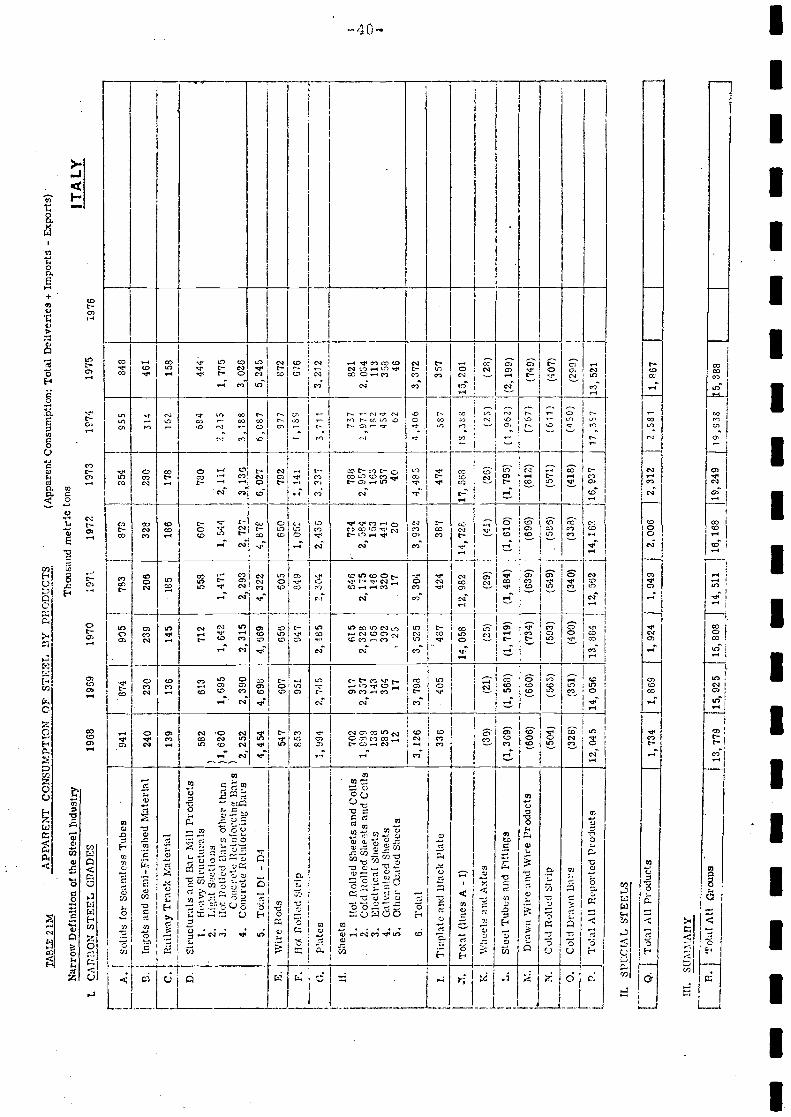
TA
BL
E 2
1M
Nar
row
Def
initi
on o
f th
e St
eel I
ndus
try
1.C
AR
DO
N S
TE
EL
GR
AD
ES
II.
SPE
CIA
L S
TE
EL
S
JTot
al A
ll Pr
oduc
ts1,
734
j 1,8
691,
924
1,94
92,
006
j 2,3
122,
581
11,8
67I
C)
- -
- -
- -.
- -
- -
- -
- -
- -
- -
- -
-
A.
Solid
s fo
r Se
amle
ss T
ubes
941
874
905
783
879
854
955
848
B.
Ingo
ts a
nd S
emi-
Fini
shed
Mat
eria
l24
023
023
920
632
928
031
446
1
C.
Rai
lway
Tra
ck M
ater
ial
139
136
145
185
186
178
162
158
D.
Stru
ctur
aIs
and
Bar
Mill
Pro
duct
s1.
Hea
vy S
truc
tura
Is58
261
371
255
860
778
068
444
42.
Liti
lit S
outlo
us
3.ilo
Pol
led
L1a
rot
her
than
) 1,
620
1,69
51,
642
1,47
11,
544
2,11
11,
215
1, 7
75C
mcr
ete
Rci
nfor
cini
Bar
s4.
Con
cret
e R
einf
orci
ng lI
ars
2,25
22,
390
2,31
52,
293
3j_3
63,
188
3,02
6
5.T
otal
DI
- 1)
44,
454
4,69
84,
069
4,32
24,
878
6,02
76,
087
5,24
5
E.
IVir
e Po
ds54
760
705
600
565
079
297
787
2
F.H
OI
Rol
led
Stri
p85
305
194
784
91,
062
1, 1
41I
189
676
G.
PEite
s1,
904
2,74
52,
885
2,3c
42,
436
3.33
73,
711
3,21
2
JI.
Shee
ts1.
Hut
Rol
led
Shee
ts a
nd C
oils
702
917
615
646
.7.
478
8(3
782
12.
Col
d Po
lled
Shee
ts a
nd C
ells
1,98
92,
357
2,32
82,
175
2, 5
842,
9a7
2,97
12,
034
3.E
lect
rica
l She
ets
138
143
105
146
153
163
192
113
4.G
.uIv
.n!s
cd S
heet
s28
536
439
232
044
253
745
435
85.
Oth
er G
aite
d Sh
eets
1217
,25
1720
4062
46
6.T
otal
3,12
63,
708
3,52
53,
304
3,93
24,
485
4 40
63,
372
T.
Tiu
plat
e an
d B
lack
Pla
te33
640
548
742
438
'?47
458
735
7
1.T
oIal
(tin
es A
- I
)14
, 058
12, 9
8214
, 728
17, 5
6813
,386
15, 2
01
K.
\5"h
eels
md
Axi
es(3
0)(2
1)(2
5)(2
9)(4
1)(2
6)(2
3)(2
8)
L.
Stee
l Tub
es a
nd F
ittin
gs(1
,309
)(1
, 568
)(1
, 719
)(1
, 484
)(1
, 610
)(1
, 795
)(1
962
)(2
, 199
)
M.
Dri
Wir
e an
d W
ire
prod
ucts
(606
)(6
60)
(734
)(6
39)
(696
)(8
12)
(767
)(7
49)
N.
Col
d R
olle
d St
rip
(504
)(5
65)
(593
)(5
49)
(586
)1
(571
)(6
11)
(407
)
O.
Col
d D
raw
n lI
ars
(328
)(3
51)
(400
)(3
40)
(338
)(4
18)
(450
)(2
00)
P.T
elaI
All
Rep
orte
d Pr
oduc
ts12
,045
14, 0
56[1
3 88
412
, 562
14, 1
0216
, 937
17 3
5713
, 521
-
APP
AR
EN
T C
ON
SUM
PTIO
N O
F ST
EE
L B
Y P
RO
DU
CT
S(A
ppar
ent C
onsu
mpt
ion
Tot
al D
eliv
erie
s +
Im
port
i -po
rts)
Tho
usan
d m
etri
c to
nsIT
ALY
1968
1969
1970
1911
1972
1973
1974
1975
1976
irr.
sun
y[[
Fota
i AU
Gro
upa
13, 7
79[1
5, 9
2515
, 808
j14
,511
J
16,1
68¡1
9, 2
4911
9,93
85,
388
j
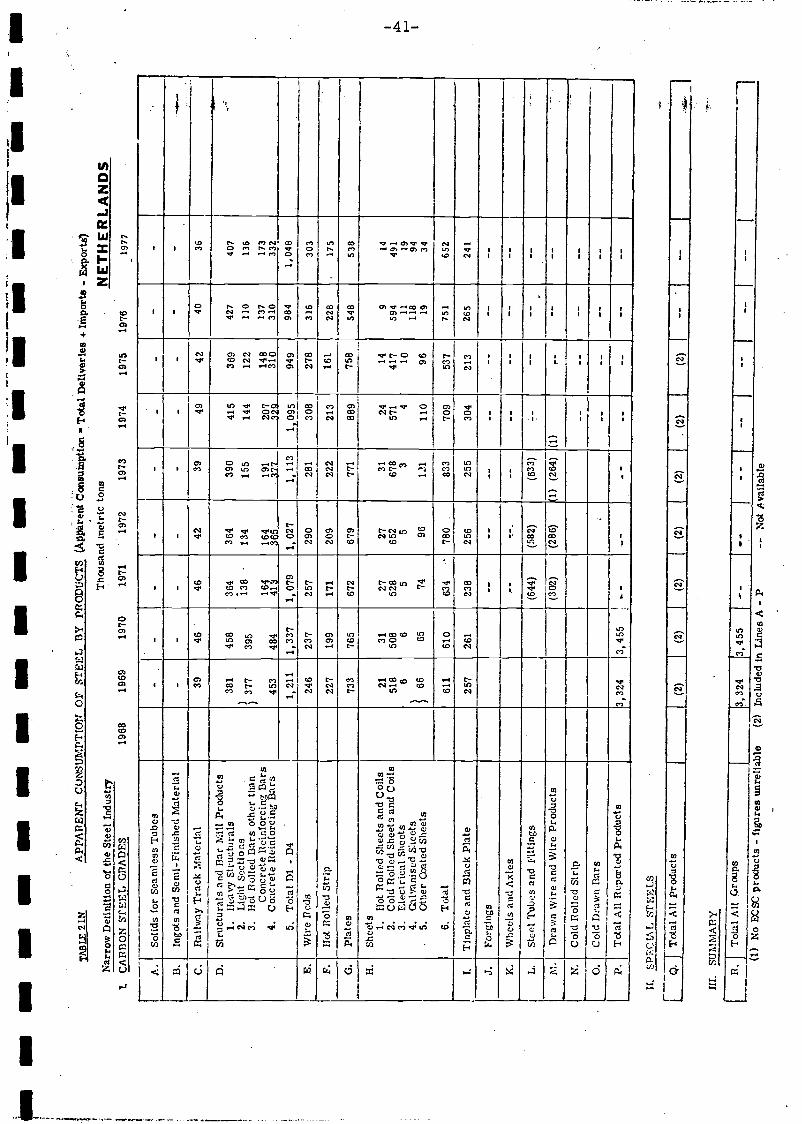
a -
- -
- -
- -
- -
- -
- V
-- -
-. -
- -
- -
TA
BL
E 2
1N
Nar
row
Dez
initl
on o
f th
e St
eel I
ndus
try
1.C
AR
BO
N S
TE
EL
GR
AD
ES
1f.
SPE
CIA
L S
TE
EL
Sr- L
Q.
irr.
sur
irny
Tot
al A
ll Pr
oduc
tsAPP
AR
EN
T C
ON
SUM
PTIO
N O
F ST
EE
L B
Y P
RO
DU
CT
S A
ppre
nt C
onsu
ptto
nT
otal
Del
iver
ies
+ I
mpo
rts
- E
xpor
tsT
hous
and
met
ric
tone
1968
1969
1970
1971
1972
1973
1974
1975
1976
(2)
j--
NE
TH
ER
LAN
DS
1977
A.
Solid
s fo
r Se
amle
ss T
ubes
--
--
--
-
B.
Ingo
ts a
nd S
emi-
Fini
shed
Mat
erIa
l-
--
--
--
-V
C.
Rai
lway
Tra
ck M
ater
ial
3946
4642
3949
4240
36
D.
Stru
ctur
ais
and
Bar
Mill
Pro
duct
s1.
Hea
vy S
truc
tura
Is
3.H
oflo
iied
Bar
s ot
her
thai
Con
cret
e R
einf
orci
ng B
ars
4. C
oacr
ete
Rei
nfor
cing
Bar
s
5.T
otal
Dl -
D4
381
377
453
458
484
364
138
164
41
364
134
164
Sf15
390
155
191
_327
..._.
1,11
3
415
144
207 29_
1x09
5
369
122
148
310
427
110
137
310
407
136
173
332
V
1,21
11,
337
1,07
91,
027
949
984
1,04
8
E.
Wir
e fl
cd24
623
725
729
028
130
827
831
630
3
F.fl
ot R
olle
d St
rip
227
199
171
209
222
213
161
228
175
G.
Plat
es73
376
567
267
977
188
9V
758
548
538
H.
Shee
ts 1.H
ot R
olle
d Sh
eets
and
Col
is2.
Col
d R
oile
d Sh
eets
and
Coi
ls3.
Ele
ctri
cal S
heet
s4.
Gal
vani
sed
Shee
tsV
5O
ther
coa
ted
Shee
ts
6.T
otal
21 518 6 66
31 508 6 65
27 528 5 74
2765
2 5 96
31 678 3
121
24 571 4
110
14 417 10 96
959
4 1111
8 19
1449
1 19 94 34
611
610
634
780
833
709
537
751
652
r.'ri
npla
te a
nd B
lack
Pla
te25
726
123
825
625
530
421
326
524
1
J.Fo
rgin
gs--
----
----
----
K.
Whe
els
and
Axl
es--
----
L.
Stee
l Tub
es a
nd F
ittin
gs(6
44)
(582
)(6
33)
----
--ii.
Dra
wn
Wir
e an
d W
ire
Prod
ucts
(302
)(2
86)
(1)
(264
)(1
),.
----
N.
Col
d R
olle
d St
rip
--
O,
Col
d D
raw
n B
ars
.--
P.T
otal
All
Rep
orte
d Pr
oduc
ts3,
324
3,45
5-
--
----
----
(2)
(2)
(2)
(2)
(2)
(2)
Ln.
Tot
al A
ll G
roup
sj3
,324
3,45
5(1
) N
o E
CSC
pro
duct
s-
figu
res
unre
lIab
le(2
) In
clud
ed in
Lin
es A
- P
-- N
ot A
vaila
ble
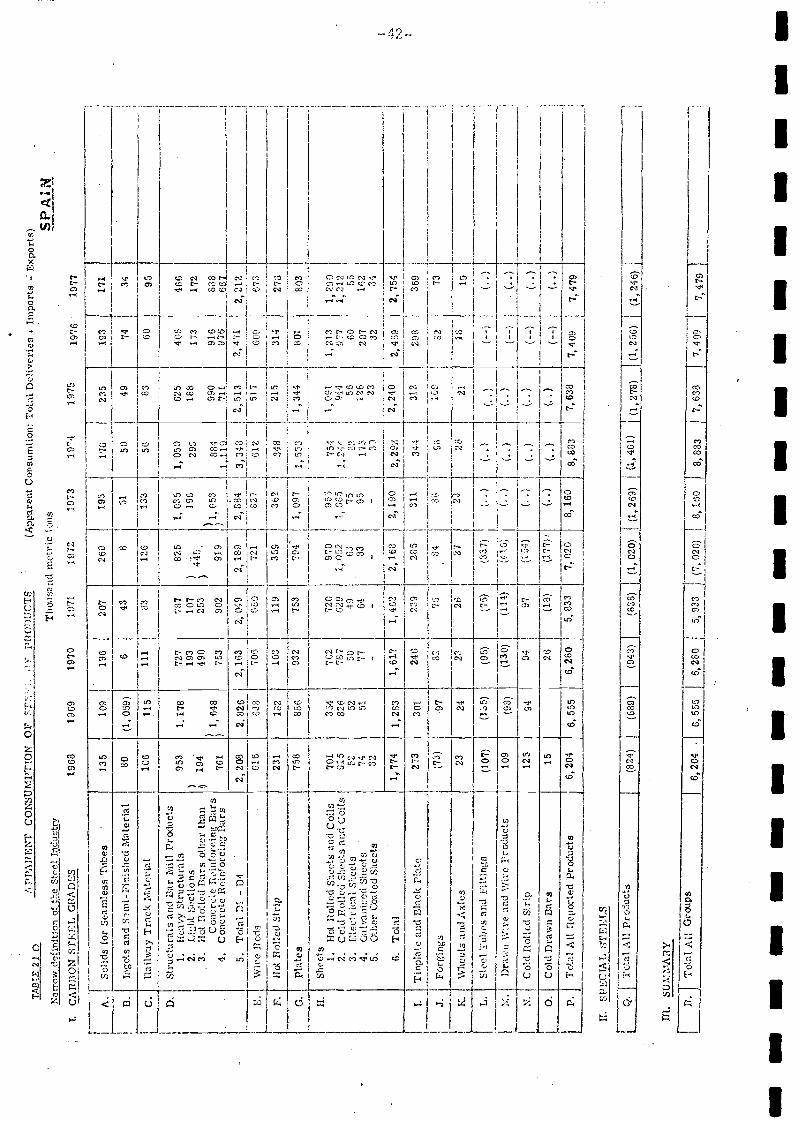
II.
SPE
CiA
L S
TE
EL
S
r III.
SU
Afl
Y
Tct
at A
ll Pr
oduc
ts
fl.J
Tot
al A
ll G
roup
s
(824
)
6,20
4
(689
)(9
43)
(828
)(1
, 020
) T
(1,
269
)
6, 5
556,
280
¡5,
333J
j7, 0
20)
J8,
160
8,88
3J
7,63
8
(1,4
61)
1(1,
278)
(1,2
56)
(1,2
46)
7,49
9
- -
- -
- -
- -
- -
- -
- -
- -
- -
- -
-
A.T
Soijd
for
Seam
less
Tub
es13
510
919
620
726
019
3i'o
235
193
171
B.
Ingo
ts a
nd S
nd-F
inis
hccl
Mat
eria
l80
(1, 0
59)
643
8SI
51)
4974
34
C.
Ïlai
lway
Tra
ck \í
atcv
ial
106
lis11
183
126
133
583
60
D.
Stru
ctur
als
and
Dar
?vi
ll Pr
oduc
ts1.
Hea
vy S
truc
tura
is95
31,
178
727
787
825
i, 03
51,
059
625
405
466
2.L
tghl
Soc
tions
)--
193
107
)-
r 'i)29
188
173
'.17
'.
3.H
ot I
lofl
ed B
ars
othe
r th
an)
194
490
253
Co;
icro
e Il
eitif
orci
ng B
ars
)i 6
48' 1
. 653
884
9091
685
8.
4.C
oncr
ete
Boi
nfor
cing
Bar
s76
1)
7390
291
9)
-71
197
661
37
5.T
otal
Dl -
Dl
2, 2
082,
826
2, 1
632,
049
2, lB
S2,
884
3, 4
32,
513
2, 4
712,
212
LI-:-1
Pods
616
638
706
CO
O72
162
761
251
7co
te:
iF.
IJòt
Rol
led
Stri
p23
118
210
311
935
936
2ìt3
215
314
275
G.
Plat
es75
888
603
257
5379
41,
01,
533
,344
801
803
S
f-II
.Sh
eets 1.
Flot
Rol
led
Shee
ts a
nd C
oils
701
354
7C2
720
970
913
754
1,09
11,
213
1 20
02.
Col
d R
olle
d Sh
eets
and
Coi
ls91
582
678
702
91,
052
01,
24
944
971,
212
3.E
lect
rica
l She
ets
5252
5040
6375
5660
554.
Gal
vani
ucd
5ht
7451
7764
8395
125
207
102
5.O
ther
Coa
ted
Shcc
ts32
--
2332
34
6.T
otal
1,77
41,
283
1, 6
171,
492
2,16
3J
2,19
02,
292
2,24
02,
489
2,75
4
LT
inpi
ate
and
lilac
lç P
lato
273
301
249
239
285
311
344
312
298
369
J.Fo
rgin
gs(7
3)32
7084
-89
3273
Whe
els
nd A
xles
2324
2226
272
2823
19
L.
Stee
l Tub
es a
nd f
Ilin
gs(1
07)
(135
)(0
5)(7
5)(3
37)
(..)
(..)
(--)
(..)
M.
Dra
wn
Wir
e an
d ','
lire
Prod
ucts
109
(98)
(130
)(!
1 i)
(tC
) -
(..)
.(.
.)()
S (
)N
.C
old
Rol
led
Stri
p12
594
9497
(114
)(.
.)(.
)(.
)(-
-)(.
.)O
.C
old
Dra
wn
Bar
s15
29(1
8)(1
77)
(. .)
.(.
. )
()(
P.T
otal
All
Rep
orte
d Pr
oduc
ts6,
204
6, 5
556,
280
5,83
37,
020
8,16
08,
883
7,63
87,
409
7 47
9
TA
Ot.E
21
0.\P
PA1E
NT
CO
NSU
MI'T
ION
OF
ST-
PPO
DU
CT
S(A
ppar
ent C
or's
umtio
n: T
ol.'J
Del
iver
ies
+ I
mpo
rts
- E
xpor
ts)
Nar
row
def
inIt
ion
of th
e St
eel I
ndus
try
Tho
usan
d m
etri
c to
nsS
PA
¡ N
T.
CA
BI3
ON
ST
EE
L G
EA
DE
S19
6819
6919
7010
7119
7219
73i9
419
7519
7619
77
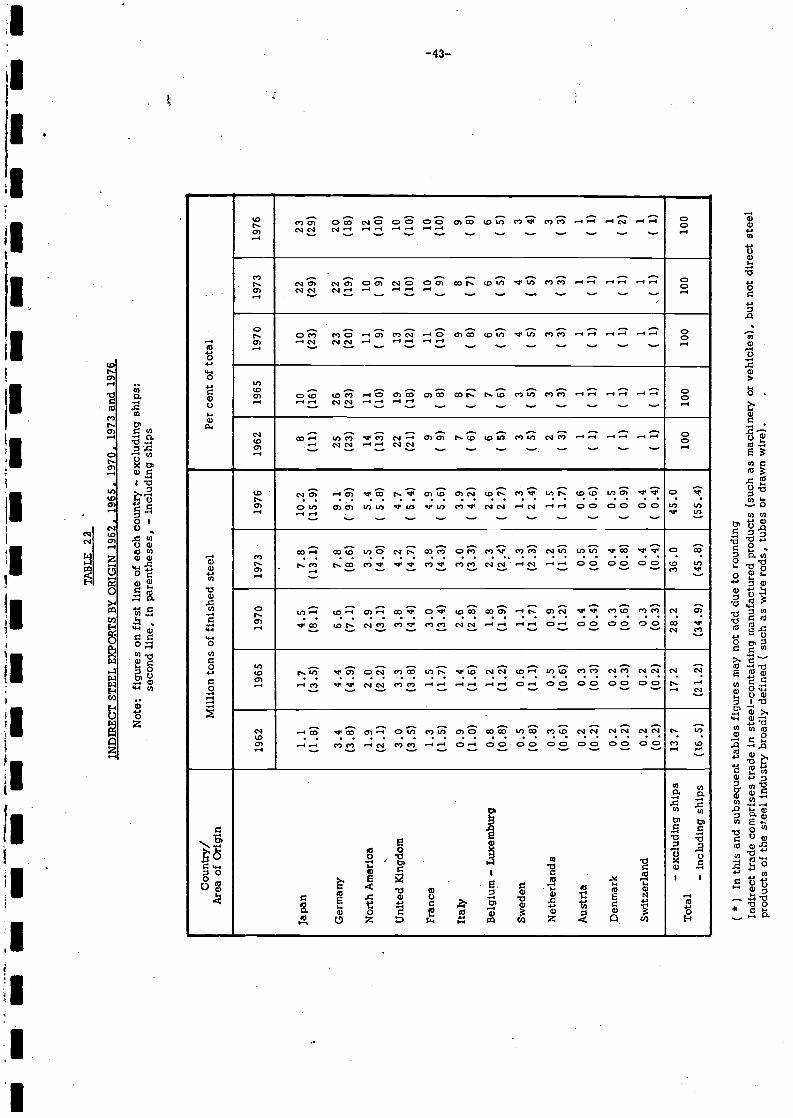
- -.
- -
-. -
- -
- -
- -
- -
- -
- -
- -
-T
AB
LE
22
IND
IRE
CT
ST
EE
LE
XPO
RT
S B
Y O
RIG
IN 1
962.
196
5. 1
970.
197
3 an
d 19
76
Not
e: f
igur
es o
n fi
rst l
ine
of e
ach
coun
try
- ex
clud
ing
ship
s;se
cond
line
, in
pare
nthe
ses,
- in
clud
ing
ship
s
*) I
n th
is a
nd s
ubse
quen
t tab
les
figu
res
may
not
add
due
to r
ound
ing
Indi
rect
trad
e co
mpr
ises
trad
e In
ste
el-c
onta
inin
g m
anuf
actu
red
prod
ucts
(su
ch a
s m
achi
nery
or
vehi
cles
), b
ut n
ot d
irec
t ste
elpr
oduc
ts o
f th
e s1
eel i
ndus
try
broa
dly
defi
ned
C s
uch
as w
ire
rods
, tub
es o
r dr
awn
wir
e).
Mill
ion
tons
of
fini
shed
ste
elPe
r ce
nt o
f to
tal
1962
1965
1970
1973
1976
1962
1965
1970
1973
1976
Japa
n1.
11.
74.
57.
810
.28
1010
2223
(1.8
)(3
.5)
(8.1
)(1
3.1)
(15.
9)(1
1)(1
6)(2
3)(2
9)(2
9)
Ger
man
y3.
44.
46.
67.
89.
125
2623
2220
(3.8
)(4
.9)
(7.1
)(8
.6)
( 99
)(2
3)(2
3)(2
0)(1
9)(1
8)
Nor
thA
mer
ica
1.9
2.0
2.9
3.5
5.4
1411
1110
12
(2.1
)(2
.2)
(3.1
)(4
.0)
( 5.
8)(1
3)(1
0)(
9)(
9)(1
0)
tJni
tedK
tngd
om3.
03.
33.
84.
24.
722
1913
1210
(3.5
)(3
.8)
(4.4
)(4
.7)
( 5.
4)(2
1)(1
8)(1
2)(1
0)(1
0)
Fran
ce1.
31.
53.
03.
84.
99
911
1010
(1.5
)(1
.7)
(3.4
)(4
.3)
( 5.
6)(
9)(
8)(1
0)C
9)
(10)
Ital
y0.
91.
42.
63.
03.
97
89
89
(1.0
)(1
.6)
(2.8
)(3
.3)
( 4.
2)(
6)(
7)(
8)(
7)(
8)B
elgi
um -
Lux
embu
rg0.
81.
21.
82.
32.
66
76
66
(0.8
)(1
.2)
(1.9
)(2
.4)
(2.
7)C
5)
(6)
C 5
)C
s)
( 5)
Swed
en0.
50.
61.
11.
31.
33
34
43
(0.8
)(1
.1)
(1.7
)(2
.3)
C 2
.4)
( 5)
( 5)
C5)
C5)
(4)
Net
herl
ands
0.3
0.5
0.9
1.2
1.5
23
33
3
(0.6
)(0
.6)
(1.2
)(1
.5)
(1.
7)(
3)C
3)
C3)
( 3)
(3)
Aus
tria
0.2
0.3
0.4
0.5
0.6
11
11
1
(0.2
)(0
.3)
(0.4
)(0
.5)
( 0.
6)(
1)(1
)C
1)(1
)(1
)D
enm
ark
0.2
0.2
0.3
0.4
0.5
11
11
1
(0.2
)(0
.3)
(0.6
)(0
.8)
C 0
.9)
(1)
(1)
( 1)
(1)
(2)
Switz
erla
nd0.
20.
20.
30.
40.
41
11
11
(0.2
)(0
.2)
(0.3
)(0
.4)
( 0.
4)(1
)(1
)(1
)(1
)C
1)
- ex
clud
ing
ship
s13
.717
.228
.236
.045
.0T
otal
100
100
100
100
100
- In
clud
ing
ship
s(1
6.5)
(21.
2)(3
4.9)
(45.
8)(5
5.4)
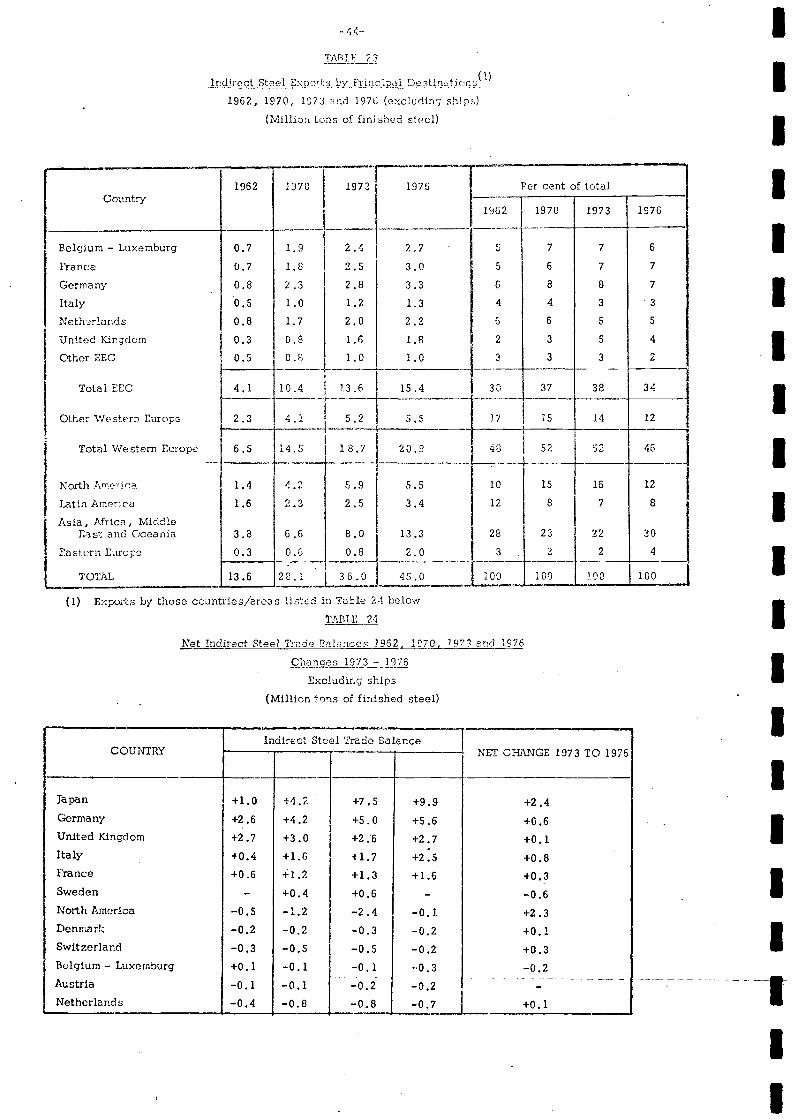
TA8lii 23
Indirect Steel Expo'i: bPrin: ipal De stlnati nns1962, 1970, 1873 end 197t (excluding ships)
(Million tons of fini shed steel)
I
Country1962 1970 1973 1976 Per cent of total
1962 1970 1973 1976
içium-Luxemburg
Gerrrariy
ItalyNetherlandsUnIted lCrgdomOthorEEC
Total EEC
Other Western Europa
j Total Western Europe
North Arie+LatinAmericaAsia, Africa, Middle
East and OceaniaEastern Eurupe
TOTAl.
0.80.50.80 .3
0.5
2.31.01.7
0.80.8
2.81.2
2.01 .6
1.0
3.31.3
2.21 .8
1.0
6
4
6 j
2
3
8
4
6
3
3
8
3
3
7
3
2
4.1 10.4 13,6 15.4 30 37 38 34
2.3 4.1 5.2 5.5 17 15 14 12
6.5 14.5 18.7 20.9 48 52 52 46
1.4
1,6
3.80.3
4.22.3
6.60.6
5.92.5
8.00.8
5.53.4
13.3
2.0
10
12
28
3
15
8
23
2
16
7
22
2
12
8
30
4
13.6 28.1 36.0 45.0 100 100 100 100¡
COUNTRYIndirect Steel Trade Ba1nce
NET CHANGE 1973 TO 1976
Japan +1.0 +4.2 +7.5 +9.9 +2.4Germany +2.6 +4.2 +5.0 +5.6 +0.6United KIngdom +2.7 +3.0 +2.6 +2.7 +0.1Italy +0.4 +1.6 41.7 +2:5 +0.8France +0.6 +1.2 +1.3 +1.6 +0.3Sweden - +0.4 +0.6 - -0.6North AmerIca -0.5 -1.2 -2.4 -0.1 +2.3Denmark -0.2 -0.2 -0.3 -0.2 40.1Switzerland -0.3 -0.5 -0.5 -0.2 +0.3Belgium - Luxemburg +0.1 -0.1 -0.1 0.3 -0.2Austria -0.1 -0.1 -0.2 -0.2 -Netherlands -0.4 -0.8 -0.8 -0.7 +0.1
(i) Exports by those countries/areas listed in Table 24 belowTABLE 24
Net Indirect Steel Trade Balances 1962, 1970, 1973 and 1976Changes 1973 - 1976
Excluding ships(Million tons of finished steel)
IIIIIIIIIIIIIIIIIIII
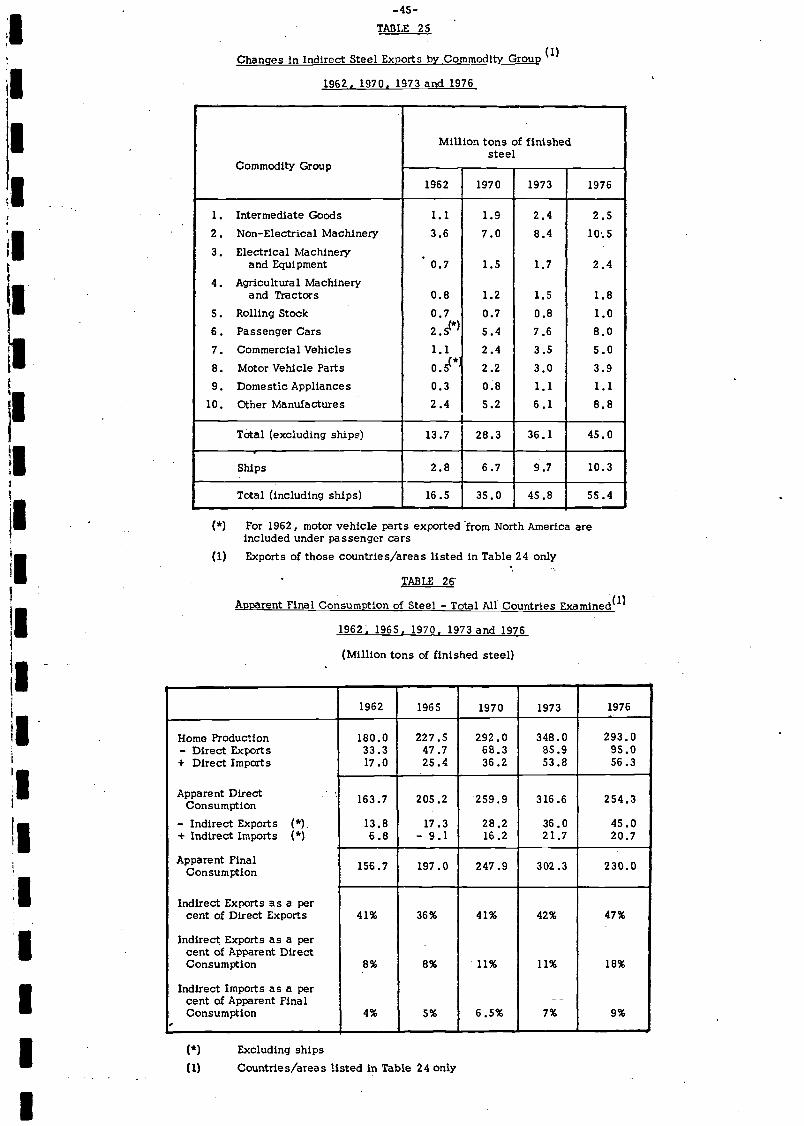
I
-45-TABLE 25
Changes in Indirect Steel Exports by Commodity Group(1)
1962. 1970, 1973 and 1976
TABLE 26
Apparent Final Consumption of Steel - Total All Countries ExaminedW
1962. 1965, 1970. 1973 and 1976
(Million tons of finished steel)
(1) Countries/areas listed in Table 24 only
Million tons of finishedsteel
Commodity Group
1962 1970 1913 1976
1. Intermediate Goods 1.1 1.9 2.4 2.52. Non-Electrical Machinery 3.6 7.0 8.4 1053. Electrical Machinery
and Equipment 0.7 1.5 1.7 2.44. Agricultural Machinery
and Tractors 0.8 1.2 1.5 1.85. Rolling Stock 0.7 0.7 0.8 1.0
(*)6. Passenger Cars 2.5' 5.4 7.6 8.07. Commercial Vehicles 1.1 2.4 3.5 5.0
(*j8. Motor Vehicle Parts 0.5' 2.2 3.0 3.99. DomesticAppliances 0.3 0.8 1.1 1.1
10. Other Manufactures 2.4 5.2 6.1 8.8
Total (excluding ships) 13.7 28.3 36.1 45.0
Ships 2.8 6.7 9.7 10.3
Total (including ships) 16 .5 35.0 45 .8 55.4
1962 1965 1970 1973 1976
Home Production 180.0 227.5 292.0 348.0 293.0- Direct Exports 33.3 47.7 68.3 85.9 95.0+ Direct Imports 17.0 25.4 36.2 53.8 56.3
Apparent DirectConsumption 163.7 205.2 259.9 316.6 254.3
- Indirect Exports (*) 13.8 17.3 28.2 36.0 45.0+ Indirect Imports (*) 6 .8 - 9 . 1 16 .2 21 .7 20.7
Apparent FinalConsumption 156.7 197.0 247.9 302.3 230.0
Indirect Exports as a percentofflirectExports
indirect Exports as a percent of Apparent Direct
41% 36% 41% 42% 47%
Consumption 8% 8% 11% 11% 18%
Indirect Imports as a percent of Apparent Final - -ConsumptIon 4% 5% 6.5% 7% 9%
(*) For 1962, motor vehicle parts exported from North America areIncluded under passenger cars
(1) Exports of those countries/areas listed in Table 24 only
(*) Excluding ships
III
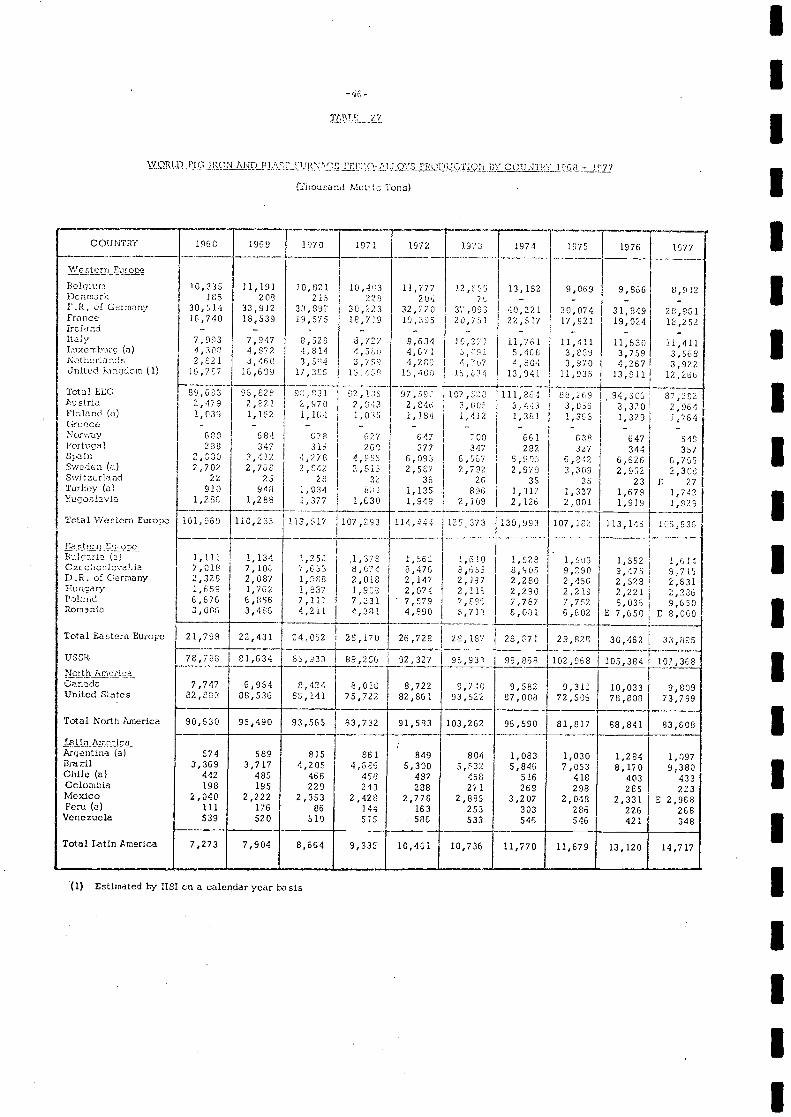
(1) EstImated by lISt on a calendar year basIs
II
IIII
COUNTRY 1C;68 J(J9 lC;70 1971 l72 1973 1971 1975 1976 1977
Wc;tern EwoeBelgium J_0,335 11,191 3.0,821 1O,P)3 11,777 J.? 9 13,152 9,069 9,8C;6 8,917Donm3rk 185 208 215 229 204 ?C; - -r.R. of Girn.ny 30,514 33,912 3389' 30,223 32,220 3Y,C;93 '10,221 30,074 31,849 28,961Franco 16,740 18,539 19,575 1879 19,395 20,751 22,517 17,921 19,024 19,252¡rclond - - - - - - -ItaCy 7,993 7,947 8,529 8,717 9,634 JC,2J 11,761 11,411 11,630 11,411Iuxor:burq (o) 4,306 4,972 1,914 'i,31 4,671 2,C;9i 5,418 3,639 3,759 3,5681ctIcr3.cs 2,621 3,460 3,564 3,259 4,269 1,'7 ,804 3,970 4,267 3,922UnIted Knpcicrn (1) 16,767 16,693 17,366 156C;C; 15,400 16,674 13,94! 11,935 13,911 12,266
Totol E10 8,613 96,828 8C;631 92,15 97,SIC 117,6C; 111,6E3 89,259 9'i,309 87,212¡njstr1 2,479 2,821 2,970 2,146 3,605 3,4Cl 3,056 3,320 2,964Finland (u) 1,919 1,112 1,161 I,OCC; i,J84 1,42 1,381 1,368 1,329 i»4(8eco - - - - - --
Nor'y 680 681 678 627 647 700 661 638 647 548Portugal 288 347 31.3 269 377 347 282 27 344 357SpoIn 2,630 3,112 '1,279 4,926 6,092 6,597 5,901 6,842 6,526 6,795C;wcin:1 () 2,702 2,761 2,642 2,615 2,587 2,782 2,979. 3,309 2,952 2,308Svntzr1and 22 25 28 22 36 26 35 35 23 8 27Turkey (o) 910 943 2,034 801 1,135 896 1,317 1,337 1,679 1,712Yugoslavls 1,768 1,288 1,377 1,630 1,949 2,109 2,126 2,001 1,919 1,929
Total Wesiem Europe iûì,959 110,283 313,517 107,293 114.441 125373 130,993 107,182 113, 143 103,536
Ed Stern E'jrone1,111 1,134 1,252 1,378 1,563 1,6!6 1,528 1,u3 1,552 1,616Czeccelovakia 7,018 7,103 3,653 8,674 8,476 8,955 0,905 9,290 9,175 9,715D.R. of Germany 2,328 2,087 1,088 2,018, 2,147 2,197 2,280 2,456 2,528 2,631
Huncery 1,659 1,762 1,937 1,955 2,074 2,115 2,290 2,219 2,221 2,285Plnr3. 6,676 6,856 7,11) 7,331 7,571 7,698j
7,767 7,752 8,039 9,650flors3nio 3,008 3,485 4,211 4,381 4,850L
6,081 6,602 E 7,650 E 8,000
Total Eastern Europe 21,798 22,431 24,052 25,170 26,728 28,167 26,271 29,828 30,462 33,825
USSR. 78,788 81,634 81,133 85,256 92,327 95,933 99,858 102,958 105,384 107,368North Amefi7aCenado 7,747 6,954 11,424 8,010 8,722 9,740 9,582 9,311 10,033 9,609United Eates 32,883 88,536 85,141 75,722 82,861 93,522 87,008 72,505 78,808 73,799
Tca1 North America 90,630 95,490 93,565 83,732 91,583 103,262 96,590 81,817 68,841 83,608
UtIn AmericaArgentina (a) 574 589 815 861 849 804 1,083 1,030 1,264 1,097
3,369 3,717 4,205 4,386 5,300 5,532 5,846 7,053 8,170 9,380Chile (a) 442 485 456 4513 437 458 516 418 403 433Colombia 198 195 229 2 13 288 271 269 298 2115 223MexIco 2,040 2,222 2,353 2,428 2,778 2,885 3,207 2,048 2,331 E 2,968Peru (a) 111 176 86 144 163 253 303 286 226 268Venezuela 539 520 510 515 586 533 546 546 421 348
Total Latin America 7,273 7,904 8,664 9,335 10,401 10,736 11,770 11,679 13,120 14,717
27 I\QTLD PIG !RCmI ?ip Pl. T1jpç :'ric ;rioys PR D:cr;çN cown<y 1pp -
(Tnound Met Tons) IIIIIIIIIIIIII
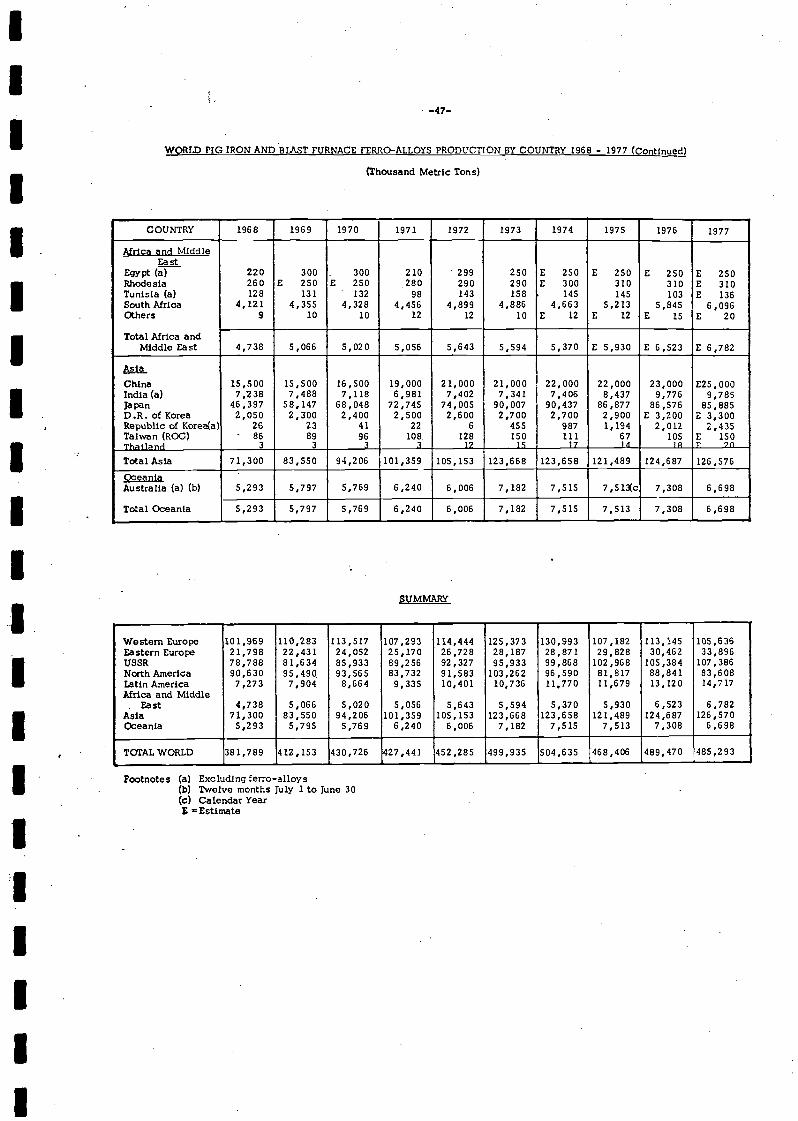
iiiIIi
Footnote s (a) Excluding ferro-alloy sTwelve months July 1 to June 30Calendar Year
E Estimate
-47-
WORlD PIG IRON AND BLAST FURNACE FERRO-ALLOYS PRODUCTION BY COUNTRY 1968 - 1977 (Continued)
(Thousand Metric Tons)
SUMMARY
COUNTRY 1968 1969 1970 1971 1972 1973 1974 1975 1976 1977
Africa and MiddleEa st
Egypt (a) 220 300 300 210 299 250 E 250 E 250 E 250 E 250Rhodesia 260 E 250 E 250 280 290 290 E 300 310 310 E 310Tunisia (a) 128 131 132 98 143 158 145 145 103 E 136SouthAfrioa 4,121 4,355 4,328 4,456 4,899 4,886 4,663 5,213 5,845 6,096Others 9 10 10 12 12 10 E 12 E 12 E 15 E 20
Total Africa andMiddle East 4,738 5,066 5,020 5,056 5,643 5,594 5,370 E 5,930 E 6,523 E 6,782
Asia
China 15,500 15,500 16,500 19,000 21,000 21,000 22,000 22,000 23,000 E25,000India(a) 7,238 7,488 7,118 6,981 7,402 7,341 7,406 8,437 9,776 9,785Japan 46,397 58,147 68,048 72,745 74,005 90,007 90,437 86,877 86,576 85,885D.R. of Korea 2,050 2,300 2,400 2,500 2,600 2,700 2,700 2,900 E 3,200 E 3,300Republic of Korea(a) 26 23 41 22 6 455 987 1,194 2,012 2,435Taiwan (ROC) 86 89 96 108 128 150 111 67 105 E 150Th&1nr1 3 3 3 1? 15 7 14 IR P 2(1
TotalAsia 71,300 83,550 94,206 101,359 105,153 123,668 123,658 121,489 124,687 126,576
OceaniaAustralia (a) (b) 5,293 5,797 5,769 6,240 6,006 7,182 7,515 7,51c 7,308 6,698
Total Oceania 5,293 5,797 5,769 6,240 6,006 7,182 7,515 7,513 7,308 6,698
WesternEurope 101,969 110,283 113,517 107,293 114,444 125,373 130,993 107,182 113,145 105,636EasternEurope 21,798 22,431 24,052 25,170 26,728 28,187 28,871 29,828 30,462 33,896USSR 78,788 81,634 85,933 89,256 92,327 95,933 99,868 102,968 105,384 107,386NorthAmerica 90,630 95,490 93,565 83,732 91,583 103,262 96,590 81,817 88,841 83,608LatinAmerica 7,273 7,904 8,664 9,335 10,401 10,736 11,770 11,679 13,120 14,717Africa and Middle
East 4,738 5,066 5,020 5,056 5,643 5,594 5,370 5,930 6,523 6,782Asia 71,300 83,550 94,206 101,359 105,153 123,668 123,658 121,489 124,687 126,570Oceania 5,293 5,795 5,769 6,240 6,006 7,182 7,515 7,513 7,308 6,698
TAL WORLD 381,789 412,153 430,726 427,441 452,285 499,935 504,635 468,406 489,470 485,293
IIiIIiIIIII
III
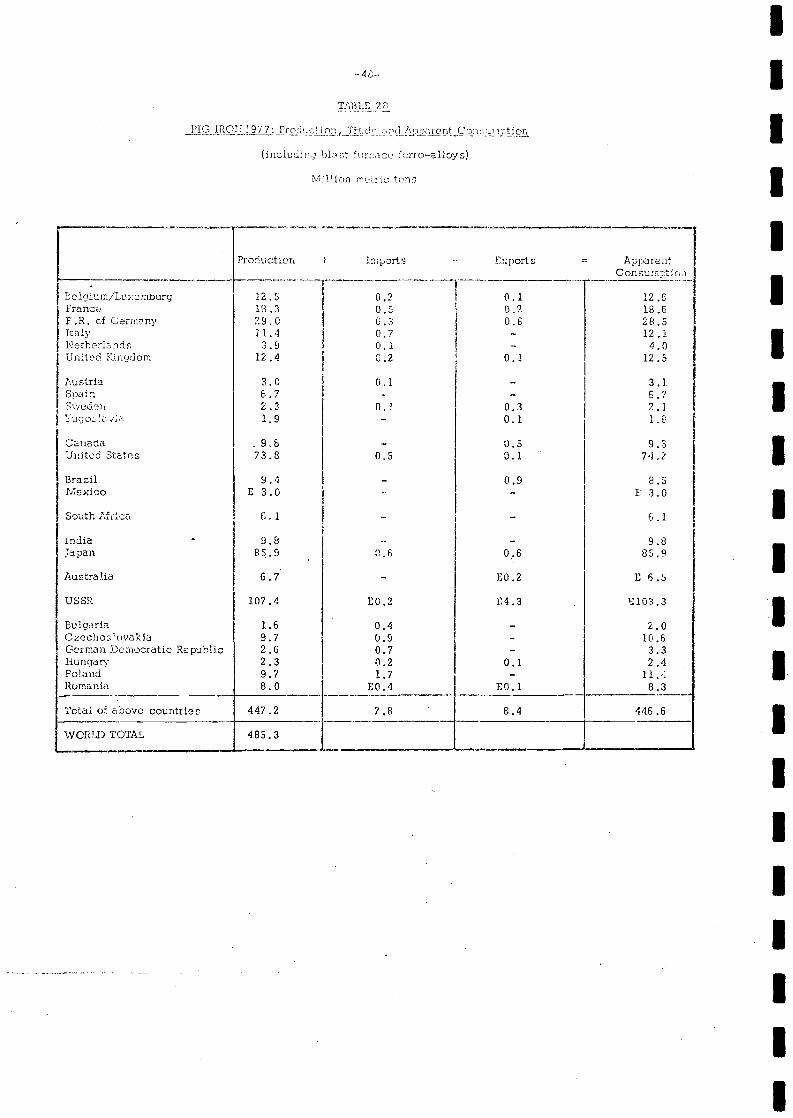
TSLLE 28
PIG IROII 1977: Pro: cton, TiOCl
(inclucìinc kst reç forro--alioys)
Mflj)n nerc tons
I
Production + Imports - Fxports ApparentConsurmtíon
Belaiurn/Le'xemburg 12.5 0.2 0.1 12.6France 18.3 0.5 0. 18.6P.R. cf Germany 29.0 0.3 0.5 28.5Italy 11.4 07 - 12.1Netherlands 3.9 0.1 - 4.0United Yarijdom 12.4 0.2 0.1 12.5
Austria 3.0 0.1 - 3.1Spain 6.7 - - 6.7Sweden 2.3 (1.1 0.3 2.1Yugoet 1.9 - 0.1 I.E
Canada 9.8 - 0.5 9.3Uruted States 73.8 0.5 0.1 74.2
Brazil 9.4 - 0.9 8.5Mexico E 3.0 -- - L 3.0
South Aflco 0. 1 - - 6 .1
India 9.8 - - 9.8Japan 85.9 0.6 0.6 85.9
Australia 6.7 - E0.2 E 6.8
USSR 107.4 E0.2 54.3 E103.3
Bulgaria 1.6 0.4 - 2.0Czechcdovoka 9.7 0.9 10.6German Democratic Republic 2.6 0.7 - 3.3Hungar 2.3 0.2 0.1 2.4Poland 9.7 1.7 - 11.;Romania 8.0 E0.4 E0.1 8.3
Total of CbOve countries 447.2 7.8 8.4 446.6
WORLI) TOTAL 485.3
IIIIIIIIIIIIIIIIIIII
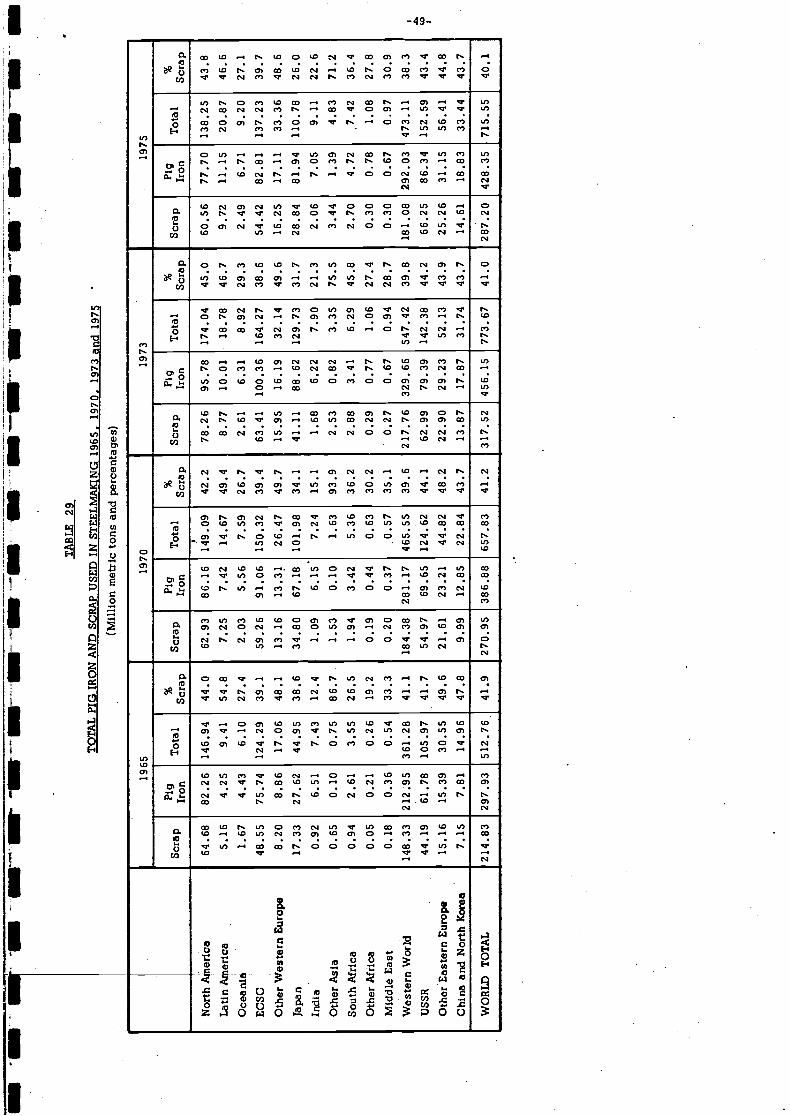
TA
BL
E 2
9
TO
TA
L P
IG I
RO
N A
ND
SC
RA
P U
SED
IN
ST
EE
LM
AK
ING
196
5. 1
970.
197
3 an
d 19
7
(Mill
ion
met
ric
tons
and
per
cent
ages
)
1965
1970
1973
1975
Scra
pPi
gIr
onT
otal
%Sc
rap
Scra
pPi
gIr
onT
otal
Scra
pSc
rap
Pig
Iron
Tot
al%
Scra
pSc
rap
Pig
Iron
Tot
alSc
rap
Nor
thA
neri
ca64
.68
82.2
614
6.94
44.0
62.9
386
.16
149.
0942
.278
.26
95.7
817
4.04
45.0
60.5
677
.70
138.
2543
.8L
atin
Aip
eric
a5.
164.
259.
4154
.87.
257.
4214
.67
49.4
8.77
10.0
118
.78
46.7
9.72
11.1
520
.87
46.6
Oce
ant8
1.67
4.43
6.10
27.4
2.03
5.56
7.59
26.7
2.61
6.31
8.92
29.3
2.49
6.71
9.20
27.1
EC
SC48
.55
75.7
412
4.29
39.1
59.2
691
.06
150.
3239
.463
.41
100.
3616
4.27
38.6
54.4
282
.81
137.
2339
.7
Oth
er W
este
rnE
urop
e8.
208.
8617
.06
48.1
13.1
613
.31
26.4
749
.715
.95
16.1
932
.14
49.6
16.2
517
.11
33.3
648
.6Ja
pan
17.3
327
.62
44.9
538
.634
.80
67.1
810
1.98
34.1
41.1
188
.62
129.
7331
.728
.84
81.9
411
0.78
26.0
Indi
a0.
926.
517.
4312
.41.
096.
15V
7.24
15.1
1.68
6.22
7.90
21.3
2.06
7.05
9.11
22.6
Oth
er A
sia
0.65
0.10
0.75
86.7
1.53
0.10
1.63
93.9
2.53
0.82
3.35
75.5
3.44
1.39
4.83
71.2
Sout
hAfr
ica
0.94
2.61
3.55
26.5
1.94
3.42
5.36
36.2
2.88
3.41
6.29
45.8
2.70
4.72
7.42
36.4
Oth
erA
fric
a0.
050.
210.
2619
.20.
190.
440.
6330
.20.
290.
771.
0627
.40.
300.
781.
0827
.8
Mid
dleE
ast
0.18
0.36
0.54
33.3
0.20
0.37
0.57
35.1
0.27
0.67
0.94
28.7
0.30
0.67
0.97
30.9
Wes
tern
Wor
ld14
8.33
2129
536
1.28
41.1
184.
3828
1.17
465.
5539
.621
7.76
329.
6654
7.42
39.8
181.
0829
2.03
473.
1138
.3U
SSR
44.1
961
.78
105.
9741
.754
.97
69.6
512
4.62
44.1
62.9
979
.39
142.
3844
.266
.25
86.3
415
2.59
43.4
Oth
erE
aste
rnE
urop
e15
.16
15.3
930
.55
49.6
21.6
123
.21
44.8
248
.222
.90
29.2
352
.13
43.9
25.2
631
.15
56.4
144
.8C
hina
and
Nor
th K
orea
7.15
7.81
14.9
647
.89.
9912
.85
22.8
443
.713
.87
17.8
731
.74
43.7
14.6
118
.83
33.4
443
.7
WO
RL
D T
OT
AL
214.
8329
7.93
512.
76,
41.9
270.
9538
6.88
657.
8341
.231
7.52
456.
1577
3.67
41.0
287.
2042
8.35
715.
5540
.1
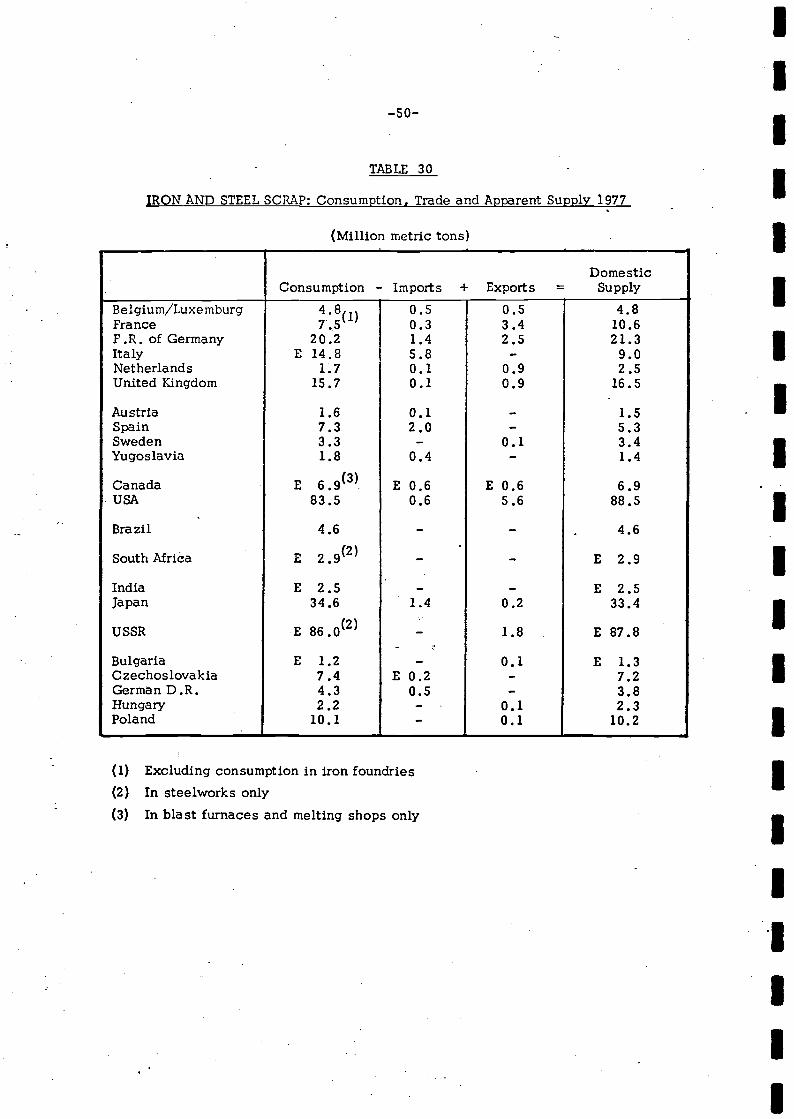
-50-
TABLE 30
IRON AND STEEL SCRAP: Consumption, Trade and Apparent Supply 1977
(Million metric tons)
Excluding consumption in iron foundriesIn steelworks onlyIn blast furnaces and melting shops only
I1
III
DomesticConsumption - Imports + Exports = Supply
Belgium/Luxemburg 4.8(1) 0.5 0.5 4.8France 7.5 0.3 3.4 10.6F.R. of Germany 20.2 1.4 2.5 21.3Italy E 14.8 5.8 - 9.0Netherlands 1.7 0.1 0.9 2.5United Kingdom 15.7 0.1 0.9 16.5
Austria 1.6 0.1 - 1.5Spain 7.3 2.0 - 5.3Sweden 3.3 - 0.1 3.4Yugoslavia 1.8 0.4 - 1.4
Canada E E 0.6 E 0.6 6.9USA 83.5 0.6 5.6 88.5
Brazil 4.6 - - . 4.6
South Afriea E 2.9(2) - - E 2.9
India E 2.5 - - E 2.5Japan 34.6 1.4 0.2 33.4
USSR E 86.0(2) - 1.8 E 87.8
Bulgaria E 1.2 - 0.1 E 1.3Czechoslovakia 7.4 E 0.2 - 7.2GermanD.R. 4.3 0.5 - 3.8Hungary 2.2 - 0.1 2.3Poland 10.1 - 0.1 10.2
IIIIIIIIIIIIIIII
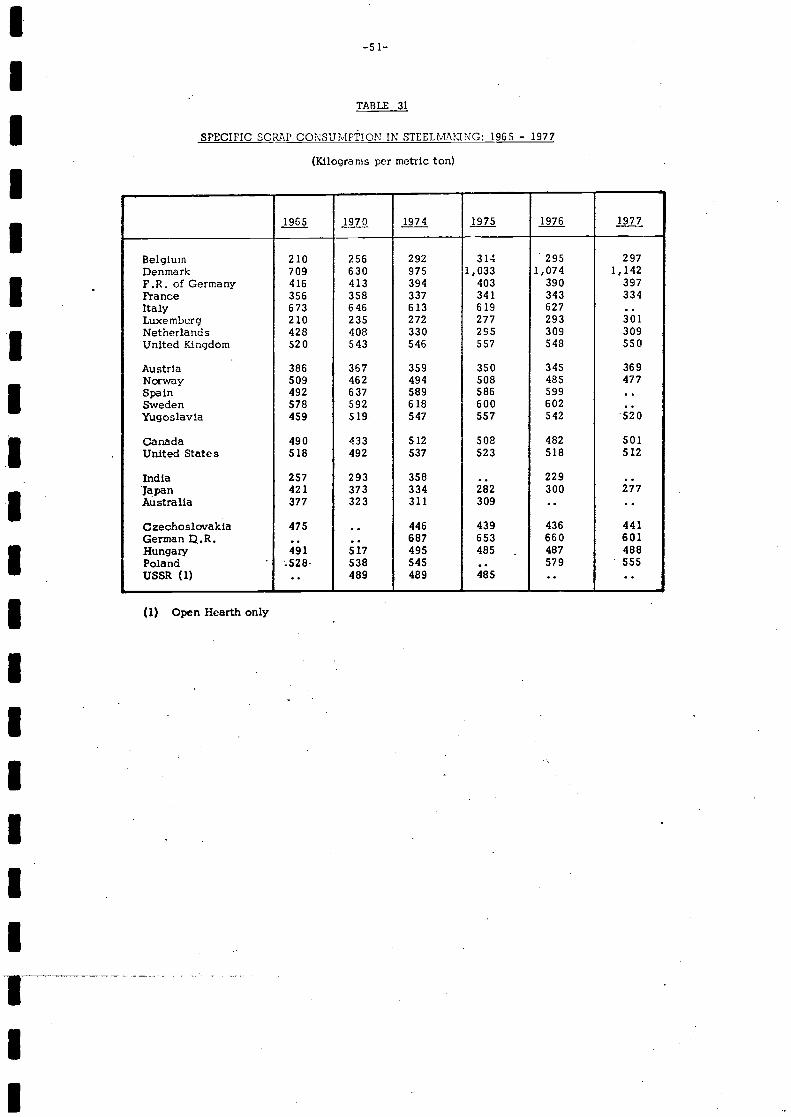
II
i
-51-
TABLE 31
SPECIFIC SCRAP CONSUvlPTION IN STEELMAKING: 1965 - 1977
(Kilograms per metric ton)
(1) Open Hearth only
1965 1970 1974 1975 1976 1977
Belgium 210 256 292 314 295 297Denmark 709 630 975 1,033 1,074 1,142F.R. of Germany 416 413 394 403 390 397France 356 358 337 341 343 334Italy 673 646 613 619 627Luxemburg 210 235 272 277 293 301Netherlands 428 408 330 295 309 309United Kingdom 520 543 546 557 548 550
Austria 386 367 359 350 345 369Norway 509 462 494 508 485 477Spain 492 637 589 586 599Sweden 578. 592 618 600 602Yugoslavia 459 519 547 557 542 520
Canada 490 433 512 508 482 501United States 518 492 537 523 518 512
IndIa 257 293 358 229Japan 421 373 334 282 30Ô 277Australia 377 323 311 309
Czechoslovakia 475 446 439 436 441German I,.R. 687 653 660 601Hungary 491 517 495 485 487 488Poland 528 538 545 579 . 555USSR (1) 489 489 485
IIIIII.1
IIIIIiiiIIi
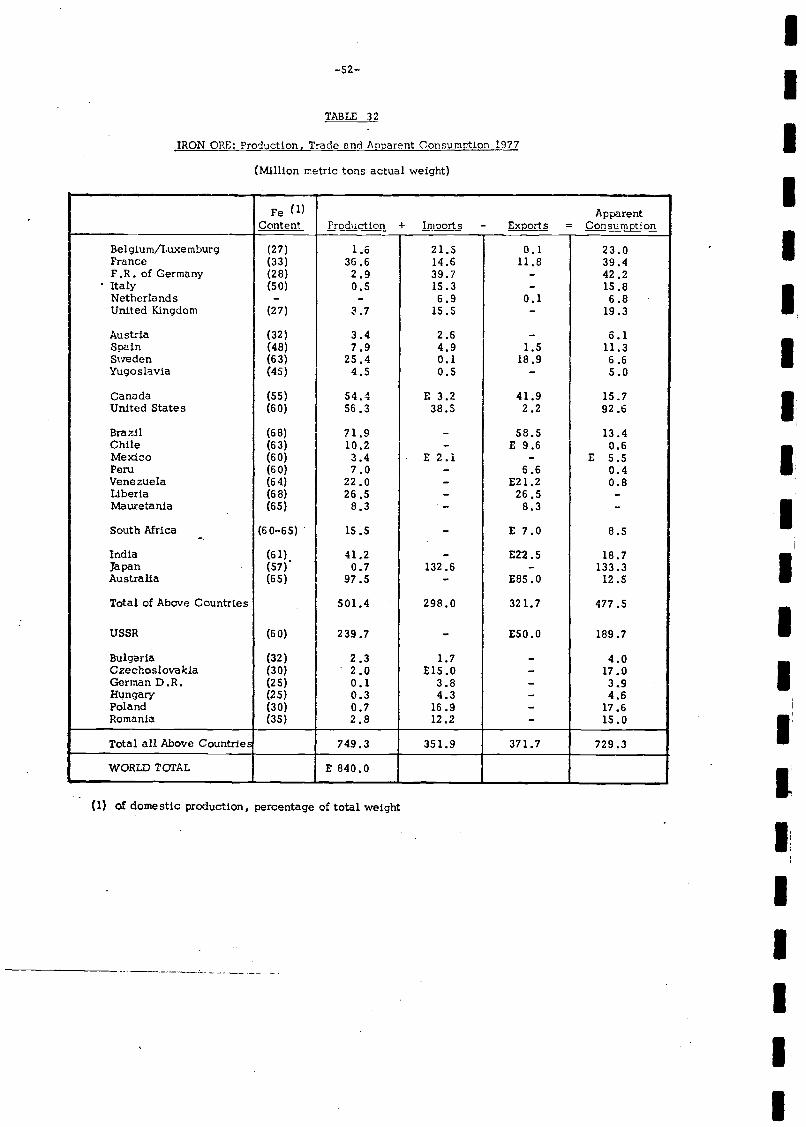
(1) of domestic production, percentage of total weight
III
Fe (i)Content
ApparentProduction + Irnoorts - _rts Consumption
Belgium/Luxemburg (27) 1.6 21.5 0.1 23.0France (33) 36.6 14.6 11.8 39.4P.R. of Germany (28) 2.9 39.7 - 42.2Italy (50) 0.5 15.3 - 15.8Netherlands - - 6.9 0.1 6.8United Kingdom (27) 3.7 15.5 - 19.3
Austria (32) 3.4 2.6 - 6.1SpaIn (48) 7.9 4.9 1.5 11.3Sweden (63) 25.4 0.1 18.9 6.6Yugoslavia (45) 4.5 0.5 - 5.0
Canada (55) 54.4 E 3.2 41.9 15.7United States (60) 56.3 38.5 2.2 92.6
Brazil (68) 71.9 - 58.5 13.4Chile (63) 10.2 - E 9.6 0.6Mexico (60) 3.4 E 2.1 - E 5.5Peru (60) 7.0 - 6.6 0.4Venezuela (64) 22.0 - E21.2 0.8Liberia (68) 26 .5 - 26 .5 -Mauretania (65) 8.3 - 8.3 -
South Mrica (60-65) 15.5 - E 7.0 8.5
India (61) 41.2 - E22.5 18.7Japan (57) 0.7 132.6 - 133.3Australia (65) 97.5 - E85.0 12.5
Total of Above Countries 501.4 298.0 321.7 477.5
USSR (60) 239.7 - E50.0 189.7
Bulgaria (32) 2.3 1.7 - 4.0Czechoslovakia (30) 2.0 E15.0 - 17.0GermanD.R. (25) 0.1 3.8 - 3.9Hungary (25) 0.3 4.3 - 4.6Poland (30) 0.7 16.9 - 17.6Romania (35) 2.8 12.2 - 15.0
TotalallAboveCountries 749.3 351.9 371.7 729.3
WORLDTOTAL E 840.0
I-52- I
TABLE 32
IRON ORE: Production, Trade and Apoarent Consumption 1977
(Million iretric tons actual weight)
IIIIIIIiiIIiI
II
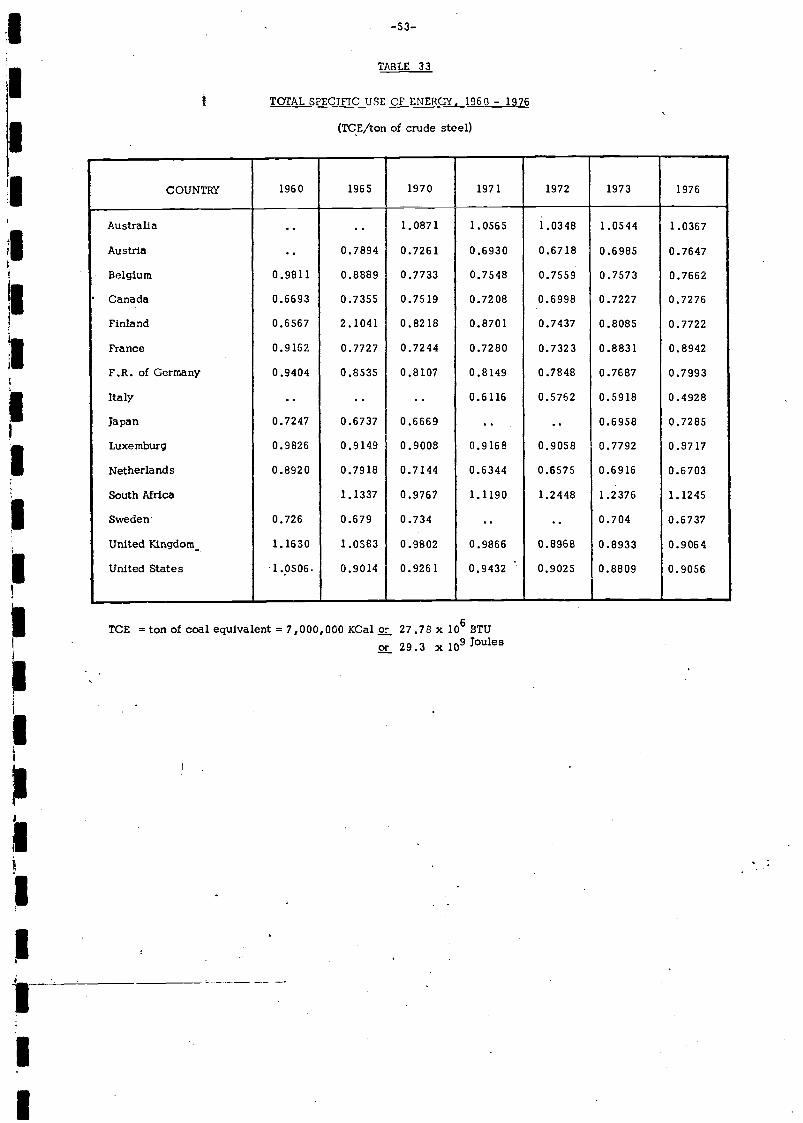
i
a
Îji
iiII
TCE =tonofcoalequlvalent =7,000,000 KCalor 27.78x io6 BTU
29.3 x IO Joules
53-.
TABLE 33
TOTAL SPECIFIC USE OF ENERCY 1960 - 1976
(TCE/ton of crude steel)
COUNTRY 1960 1965 1970 1971 1972 1973 1976
Australia . . . . 1.0871 1.0565 1.0348 1.0544 1.0367
Austria .. 0.7894 0.7261 0.6930 0.6718 0.6985 0.7647
Belgium 0.9811 0.8889 0.7733 0.7548 0.7559 0.7573 0.7662
Canada 0.6693 0.7355 0.7519 0.7208 0.6998 0.7227 0.7275
Finland 0.6567 2.1041 0.8218 0.8701 0.7437 0.8085 0.7722
France 0.9162 0.7727 0.7244 0.7280 0.7323 0.8831 0.8942
F.R. of Germany 0.9404 0.8535 0.8107 0.8149 0.7848 0.7687 0.7993
Italy .. .. .. 0.6116 0.5762 0.5918 0.4928
Japan 0.7247 0.6737 0.6669 .. .. 0.6958 0.7285
Luxemburg 0.9826 0.9149 0.9008 0.9168 0.9058 0.7792 0.8717
Netherlands 0.8920 0.7918 0.7144 0.6344 0.6575 0.6916 0.6703
SouthMrica 1.1337 0.9767 1.1190 1.2448 1.2376 1.1245
Sweden 0.726 0.679 0.734 .. .. 0.704 0.6737
United Kingdom_ 1.1630 1.0583 0.9802 0.9866 0.8968 0.8933 0.9064
United States 1.P506. 0.9014 0.9261 0.9432 0.9025 0.8809 0.9056
IiIii*
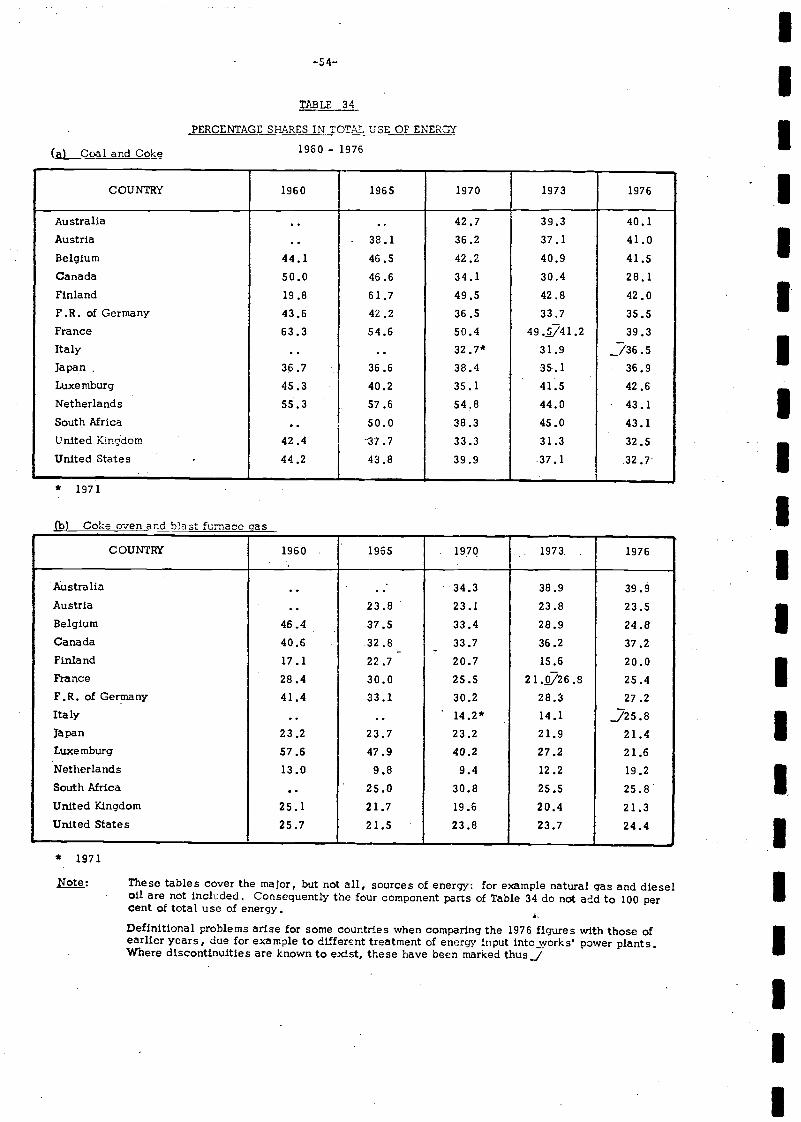
(a) Coal and Coke
(b) Coke oven and blast fui-nace gas
PERCENTAGE SHARES IN TOTAL USE OF ENERGY
1960 - 1976
* 1971
These tables cover the major, but not all, sources of energy: for example natural gas and dieseloil are not included. Consequently the four component parts of Table 34 do not add to 100 percent of total use of energy.
Definitional problems arise for some countries when comparing the 1976 fIgures with those ofearlier years, due for example to different treatment of energy input into works power plants.Where dlscontinulties are known to exist, these have been marked thusj
I
Ii
COUNTRY 1965
Australia .. . e
Austria 38.1Belgium 46.5 -s
Canada s 46.6Finland ¡ 61.7F.R. of Germany . 42.2France . 54.6ItalyJapan . . 36.6Luxemburg 40.2Netherlands 57 .6 . :
South Africa 50.0 :
United Kmgdom -37 7United States 43 .8
COUNTRY 1960 1965 1970
Australia .. .; 34.3 ¡
Austria .. 23.8 23.1 i
Belgium 46.4 37.5 33.4 :
Canada 40.6 32.8 33.7Finland 17.1 22.7 20.7 'France 28.4 30.0 25.5 i
F.R. of Germany 41.4 33.1 30.2Italy .. 14.2* ¡
Japan 23.2 23.7 23.2Luxemburg 57.6 47.9 40.2Netherlands 13.0 9.8 9.4South Africa .. 25.0 30.8United Kingdom 25.1 21.7 19.6 s -
United States 25.7 21.5 23.8 - -
I-54--
ITABLE 34
* 1971
IIIIIIIIIIIiIIII
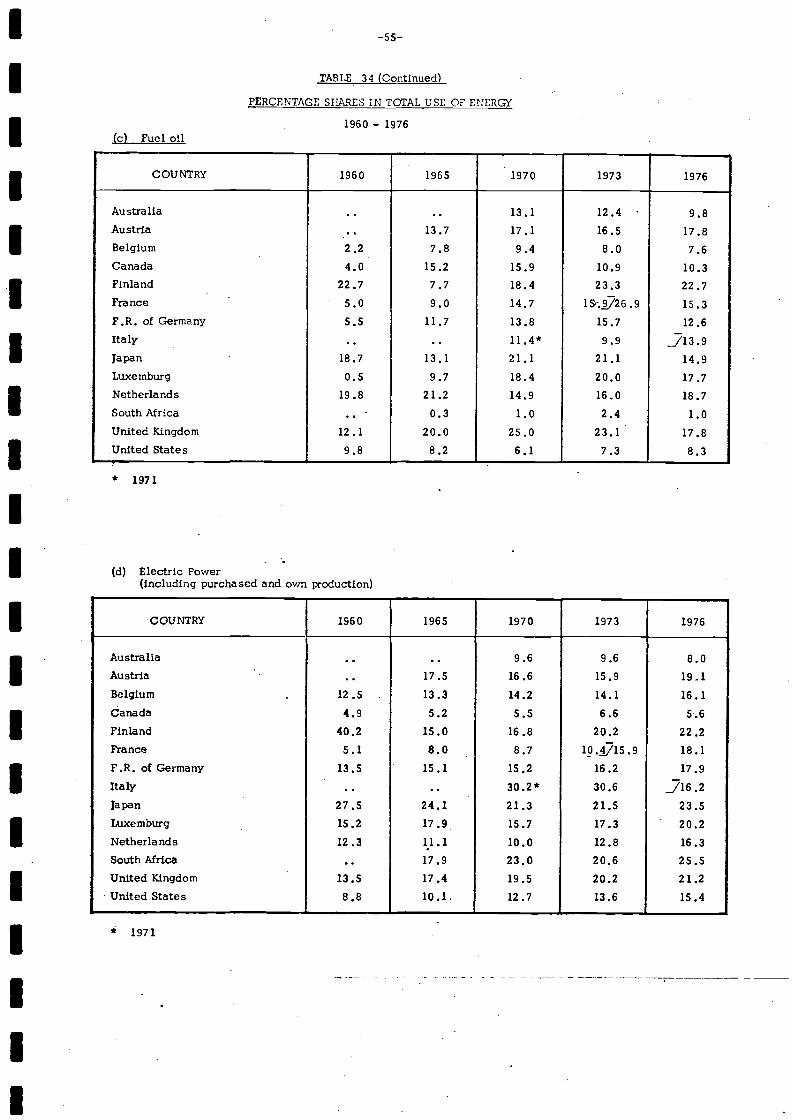
I
* 1971
COUNTRY 1960 1965 1970 1973 1976
AustraliaAustria
.. ..13.7
13.117.1
12.416.5
9.817.8
Belgium 2.2 7.8 9.4 8.0 7.6Canada 4.0 15.2 15.9 10.9 10.3Finland 22.7 7.7 18.4 23.3 22.7France 5.0 9.0 14.7 15; 26.9 15.3F.R. of Germany 5.5 11.7 13.8 15.7 12.6Italy .. 11.4* 9.9 J13.9Japan 18.7 13.1 21.1 21.1 14.9Luxemburg 0.5 9.7 18.4 20.0 17.7Netherlands 19.8 21.2 14.9 16.0 18.7South Africa .. - 0.3 1.0 2.4 1.0United Kingdom 12.1 20.0 25.0 23.1 17.8United States 9.8 8.2 6.1 7.3 8.3
COUNTRY 1960 1965 1970 1973 1976
Australia .. .. 9.6 9.6 8.0Austria .. 17.5 16.6 15.9 19.1Belgium . 12.5 13.3 14.2 14.1 16.1danada 4.9 5.2 55 6.6 5.6Finland 40.2 15.0 16.8 20.2 22.2France 5.1 8.0 8.7 1O.?15.9 18.1F.R. of Germany 13.5 15.1 15.2 16.2 17.9Italy .. .. 30.2* 30.6 .716.2Japan 27.5 24.1 21.3 21.5 23.5Luxemburg 15.2 17.9 15.7 17.3 20.2Netherlands 12.3 11.1 10.0 12.8 16.3SouthMrica .. 17.9 23.0 20.6 25.5United Kingdom 13.5 17.4 19.5 20.2 21.2United States 8.8 10.1. 12.7 13.6 15.4
I -55-
I TABLE 34 (Continued)
PERCENTAGE SHARES IN TOTAL USE OF ENERGY
I (c) Fuel oil1960 - 1976
* 1971
II (d) Electric Power
(including purchased and own production)
IIIIII
IIIiiIIII
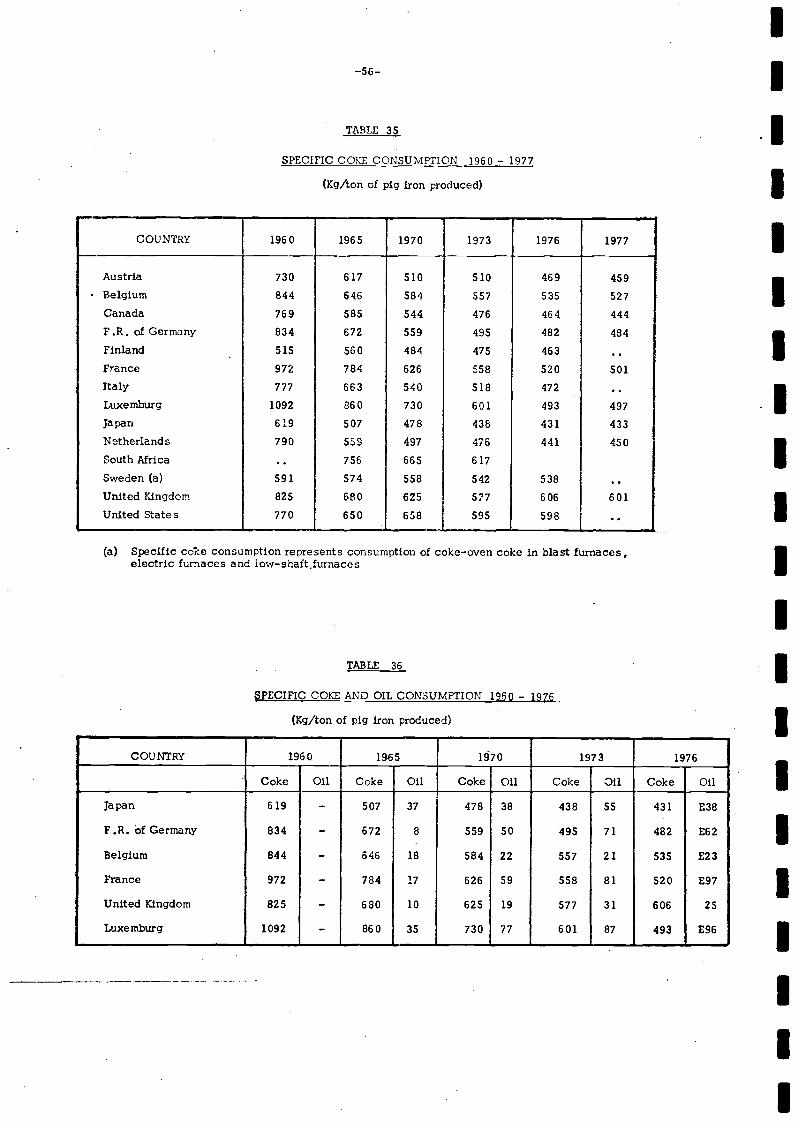
-56-
ThBLE 35
SPECIFIC COKE CONSUMPTION 1960 - 1977
(Kg/ton of pig iron produced)
(a) Specific coke consumption represents consumption of coke-oven coke in blast furnaces,electric furnaces and low- shaít.furnace s
TABLE 36
SPECIFIC COKE AND OIL CONSUMPTION 1960 - 1976
(Kg/ton of pig iron produced)
I
I
COUNTRY 1960 1965 1970 1973 1976 1977
Austria 730 617 510 510 469 459
Belgium 844 646 584 557 535 527
Canada 769 585 544 476 464 444
F.R. of Germany 834 672 559 495 482 484
Finland 515 560 484 475 463
France 972 784 626 558 520 501Italy 777 663 540 518 472
Luxemburg 1092 860 730 601 493 497
Japan 619 507 478 438 431 433
Netherlands 790 559 497 476 441 450
South Africa 756 665 617
Sweden (a) 591 574 558 542 538United Kingdom 825 680 625 577 606 601United States 770 650 658 595 598
COUNTRY 1960 195 I70 1973 1976
Coke Oil Coke Oil Coke 011 Coke Oil Coke Oil
Japan 619 - 507 37 478 38 438 55 431 E38
F.R. of Germany 834 - 672 8 559 50 495 71 482 E62
Belgium 844 - 646 18 584 22 557 21 535 E23
France 972 - 784 17 626 59 558 81 520 E97
United Kingdom 825 - 680 10 625 19 577 31 606 25
Luxemburg 1092 - 860 35 730 77 601 87 493 E96
I1IIIIIIII
IIIIIIII
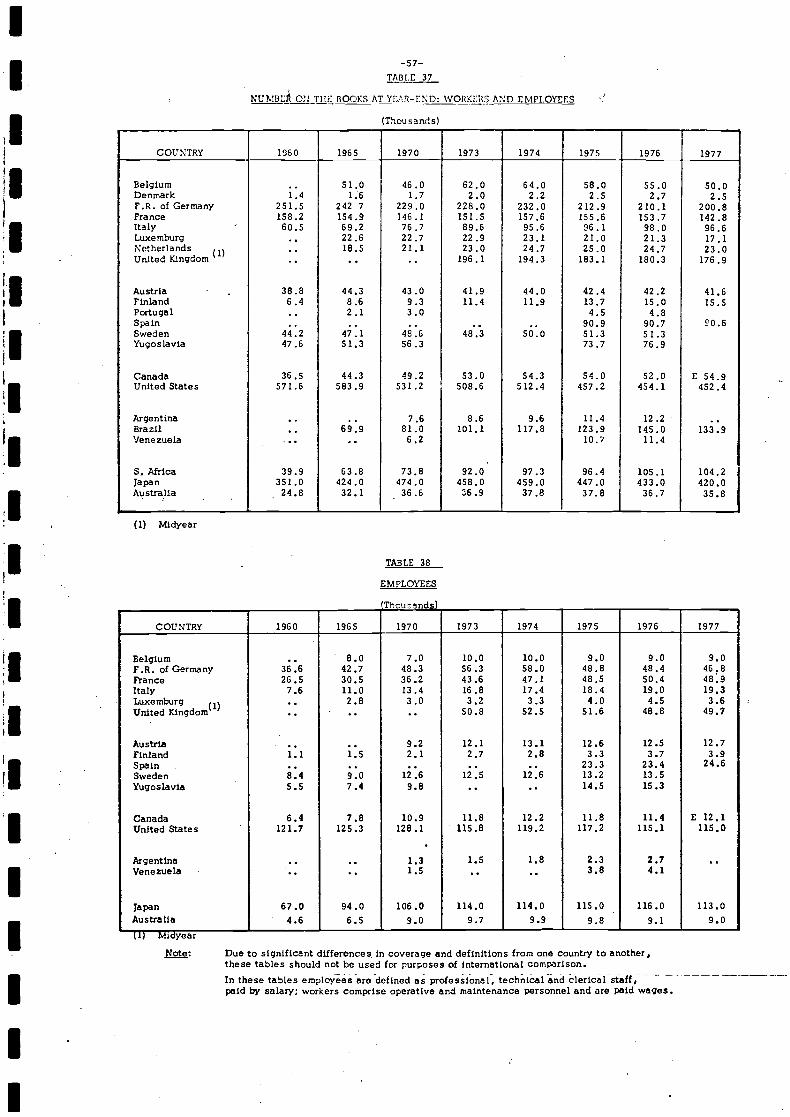
II
-57-TABLE 37
NUMBLI ON THE BOOKS AT YEAR-END: woRKI:Es AND EMPLOYEES
(Thousands)
(1) Midyear
TABLE 38
EMPLOYEES
COUNTRY 1960 1965 1970 1973 1974 1975 1976 1977
Belgium . . 51.0 46.0 62.0 64.0 58.0 SS.0 50.0Denmark 1.4 16 1.7 2.0 2.2 2.5 2.7 2.5P.R. of Germany 251.5 242 7 229.0 228.0 232.0 212.9 210.1 200.8France 158.2 154.9 146.1 151.5 157.6 155.6 153.7 142.8Italy 60.5 69.2 76.7 89.6 95.6 96.1 98.0 95.6Luxemburg .. 22.6 22.7 22.9 23.1 21.0 21.3 17.1Netherlands
(1) . . 18.5 21.1 23.0 24.7 25.0 24.7 23.0United Kingdom .. . . . . 196.1 194.3 183.1 180.3 176.9
Austria 38.8 44.3 43.0 41.9 44.0 42.4 42.2 41.6Finland 6.4 8.6 9.3 11.4 11.9 13.7 15.0 15.5Portugal .. 2.1 3.0 4.5 4.8Spain . . . . . . .. .. 90.9 90.7 60.5Sweden 44.2 47.1 48.6 48.3 50.0 51.3 51.3Yugoslavia 47.6 51.3 56.3 73.7 76.9
Canada 36.5 44.3 49.2 53.0 54.3 54.0 52.0 E 54.9United States 571.6 583.9 531.2 508.6 512.4 457.2 454.1 452.4
Argentina .. . . 7.6 8.6 9.6 11.4 12.2Brazil . . 69.9 81.0 101.1 117.8 123.9 145.0 133.9Venezuela ... .. 6.2 10.7 11.4
S. Africa 39.9 63.8 73.8 92.0 97.3 96.4 105.1 104.2Japan 351.0 424.0 474.0 458.0 459.0 447.0 433.0 420.0Australia 24.8 32.1 36.6 36.9 37.8 37.8 36.7 35.8
COUNTRY 1960 1965 1970 1973 1974 1975 1976 1977
Belgium .. 8.0 7.0 10.0 10.0 9.0 9.0 9.0F.R. of Germany 36.6 42.7 48.3 56.3 58.0 48.8 48.4 46.8'France 26.5 30.5 36.2 43.6 47.1 48.5 50.4 48.9Italy 7.6 11.0 13.4 16.8 17.4 18.4 19.0 19.3Luxemburg .. 2.8 3.0 3.2 3.3 4.0 4.5 3.6United Kingdom .. .. .. 50.8 52.5 51.6 48.8 49.7
Austria .. .. 9.2 12.1 13.1 12.6 12.5 12.7Finland 1.1 1.5 2.1 2.7 2.8 3.3 3.7 3.9Spain .. .. .. .. .. 23.3 23.4 24.6Sweden 8.4 9.0 12.6 12.5 12.6 13.2 13.5Yugoslavia 5.5 7.4 9.8 .. .. 14.5 15.3
Canada 6.4 7.8 10.9 11.8 12.2 11.8 11.4 E 12.1UnitedStates ' 121.7 125.3 128.1 115.8 119.2 117.2 115.1 115.0
Argentina .. .. 1.3 1.5 1.8 2.3 2.7Venezuela '.. .. 1.5 .. 3.8 4.1
Japan 67.0 94.0 106.0 114.0 114.0 115.0 116.0 113.0Australia 4.6 6.5 9.0 9.7 9.9 9.8 9.1 9.0
ixdyear
Nue: Due to significant differences in coverage and definitions from one country to another,these tables should not be used for purposes of international comparison.
In these tables employes are defined as professional, technical and clerical staff,paid by salary; workers comprise operative and maintenance personnel and are paid wages.
IIi'
II
i'
JîiJ
IIiIiIII
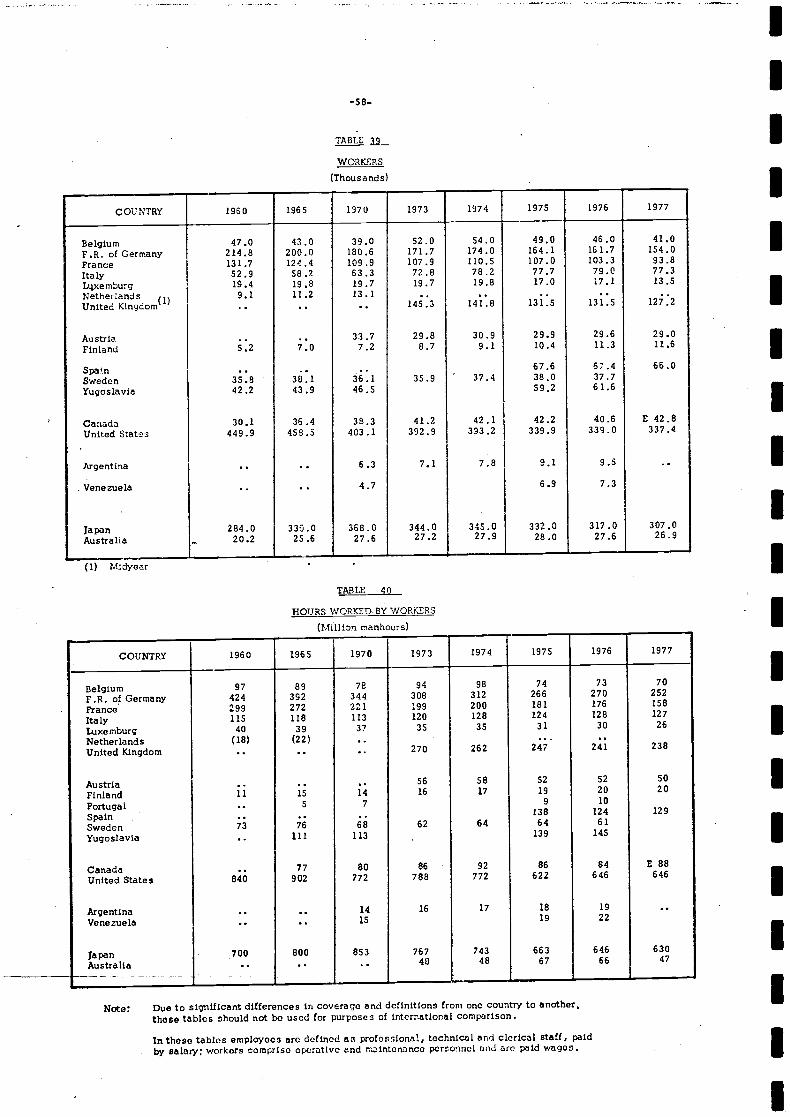
-58-
TABLE 39
WORKERS
(Thousands)
(1) Midyear
TABLE 40
HOURS WORKED BY WORKERS
Million manhours)
Note: Due to significant differences in coverage end definitions froni one country to another,these tables should not be used for purposes of International comparison.
In those tables employees ere defined es profos1onai, technical ai-d clerical staff, paidby salary; workers comprise operative end m3lntonanco personnel and are paid wages.
II
I
COUNTRY 1960 1965 1970 1973 1974 1975 1976 1977
Belgium 47.0 43.0 39.0 52.0 54.0 49.0 46.0 41.0F.R. of Germany 214.8 200.0 180.6 171.7 174.0 164.1 161.7 154.0France 131.7 124.4 109.9 107.9 110.5 107.0 103.3 93.8Italy 52.9 58.2 63.3 72.8 78.2 77.7 79.0 77.3Ltxembwg 19.4 19.8 19.7 19.7 19.8 17.0 17.1 13.5Netherlands 9.1 11.2 13.1 . . .. . .
United Kingdom(1). . . . . . 145.3 141.8 131.5 131.5 127.2
Austria . . . . 33.7 29.8 30.9 29.9 29.6 29.0Finland 5.2 7.0 7.2 8.7 9.1 10.4 11.3 11.6
Spain .. .. .67.6 67.4 66.0
Sweden 35.8 38.1 36.1 35.9 37.4 38.0 37.7Yugoslavia 42.2 43.9 46.5 59.2 61.6
Canada 30.1 36.4 39.3 41.2 42.1 42.2 40.6 E 42.8United Status 449.9 458.5 403.1 392.9 393.2 339.9 339.0 337.4
Argentina .. . . 6.3 7.1 7.8 9.1 9.5
Venezuela .. .. 4.7 6.9 7.3
Japan 284.0 330.0 368.0 344.0 345.0 332.0 317.0 307.0Australia - 20.2 25.6 27.6 27.2 27.9 28.0 27.6 26.9
COUNTRY 1960 1965 1970 1973 1974 1975 1976 1977
Belgium 97 89 78 94 98 74 73 70
F.R. of Germany 424 392 344 308 312 266 270 252
France 299 272 221 199 200 181 176 158
Italy 115 118 113 120 128 124 128 127
Luxemburg 40 39 37 35 35 31 30 26
Netherlands (18) (22) .. .. -United Kingdom .. .. .. 270 262 247 241 238
Austria .. .. .. 56 58 52 52 50
Finland 11 15 14 16 17 19 20 20
Portugal .. 5 7 9 10
Spain .. .. 138 124 129
Swedan 73 76 68 62 64 64 61
Yugoslavia .. 111 113 139 145
Canada .. 77 80 86 92 86 84 E 88
United States 840 902 772 788 772 622 646 646
Argentina .. .. 14 16 17 18 19
Venezuela .. .. 15 19 22
JapanAustralia
700..
800. .
853. .
76748
14348
66367
64666
63047
IIIIIIIIIIIiIIIIIi
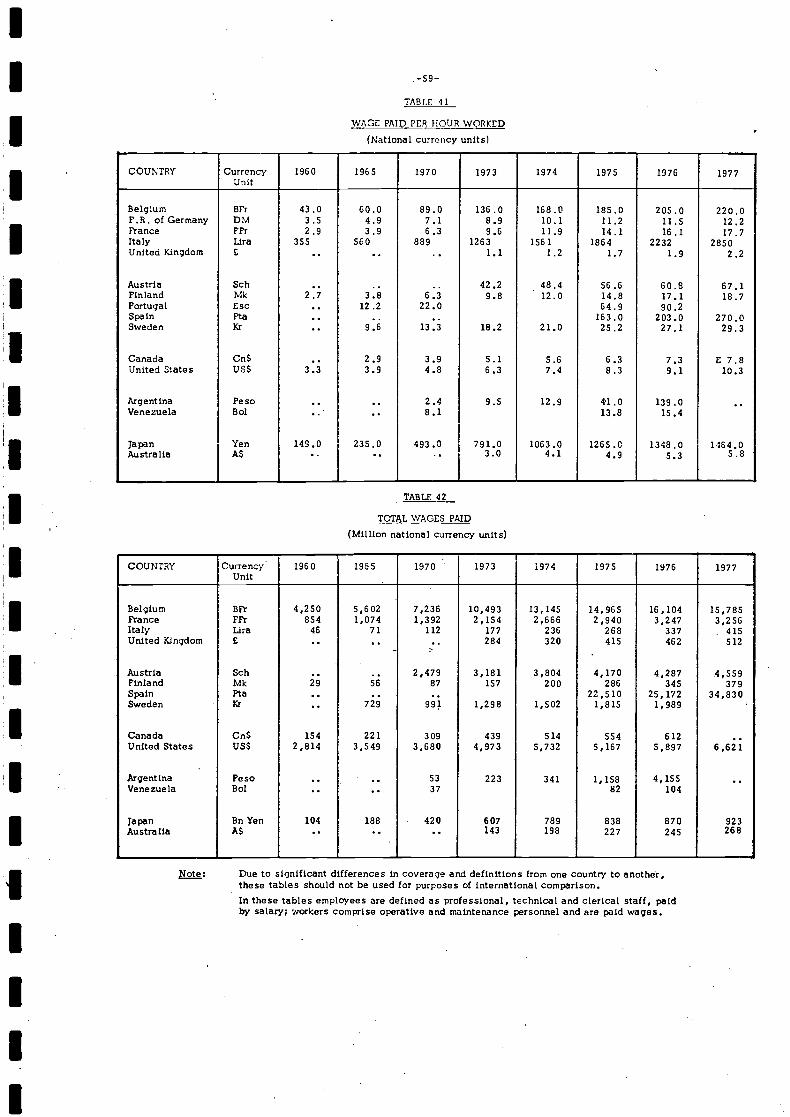
II -59-
I
J
iIIII
Note:
TABLE Il
WAGE PAID PER HOUR WORKED
(National currency units)
TABLE 42
TOTAL WAGES PAID
(Million national currency units)
Due to significant d fferences in coverage arid definitions from one country to another,these tables should not be used for purposes of international comparison.In these tables employees are defined as professional, technical and clerical staff, paidby salary; workers comprise operative and maintenance personnel and are paid wages.
COUNTRY CurrencyUnit
1960 1965 1970 1973 1974 1975 1976 1977
Belgium 3Fr 43.0 60.0 89.0 136.0 168.0 185.0 205.0 220.0F.R. ofGermany DM 3.5 4.9 7.1 8.9 10.1 11.2 11.5 12.2France FFr 2.9 3.9 6.3 9.6 11.9 14.1 16.1 17.7Italy Lira 355 560 889 1263 1561 1864 2232 2850United Kingdom £ .. .. .. 1.1 1.2 1.7 1.9 2.2
Austria Sch .. .. .. 42.2 48.4 56.6 60.8 67.1Finland Mk 2.7 3.8 6.3 9.8 12.0 14.8 17.1 18.7Portugal Esc .. 12.2 22.0 64.9 90.2Spain Pta .. .. .. 163.0 203.0 270.0Sweden Kr .. 9.6 13.3 18.2 21.0 25.2 27.1 29.3
Canada Cn$ .. 2.9 3.9 5.1 5.6 6.3 7.3 £ 7.8United States US$ 3.3 3.9 4.8 6.3 7.4 8.3 9.1 10.3
Argentina Peso .. .. 2.4 9.5 12.9 41.0 139.0Venezuela Bol .. .. 8.1 13.8 15.4
Japan Yen 149.0 235.0 493.0 791.0 1063.0 1265.0 1348.0 1464.0Australia AS .. .. .. 3.0 4.1 49 5.3 5.8
COUNTRY CurrencyUnit
1960 1965 1970 1973 1974 1975 1976 1977
Belgium BFr 4,250 5,602 7,236 10,493 13,145 14,965 16,104 15,785France FFr 854 1,074 1,392 2,154 2,666 2,940 3,247 3,256Italy Lira 46 71 112 177 236 268 337 415United Kingdom £ .. .. .. 284 320 415 462 512
Austria Sch .. .. 2,479 3,181 3,804 4,170 4,287 4,559Finland Mk 29 56 87 157 200 286 345 379Spain Pta .. .. .. 22,510 25,172 34,830Sweden Kr .. 729 991 1,298 1,502 1,815 1,989
Canada CriS 154 221 309 439 514 554 612United States USS 2,814 3,549 3,680 4,973 5,732 5,167 5,897 6,621
Argentina Peso .. .. 53 223 341 1,158 4,155Venezuela Bol .. .. 37 82 104
Japan Bn Yen 104 188 420 607 789 838 870 923Australia AS .. .. .. 143 198 227 245 268
IIIiII
iIIIII
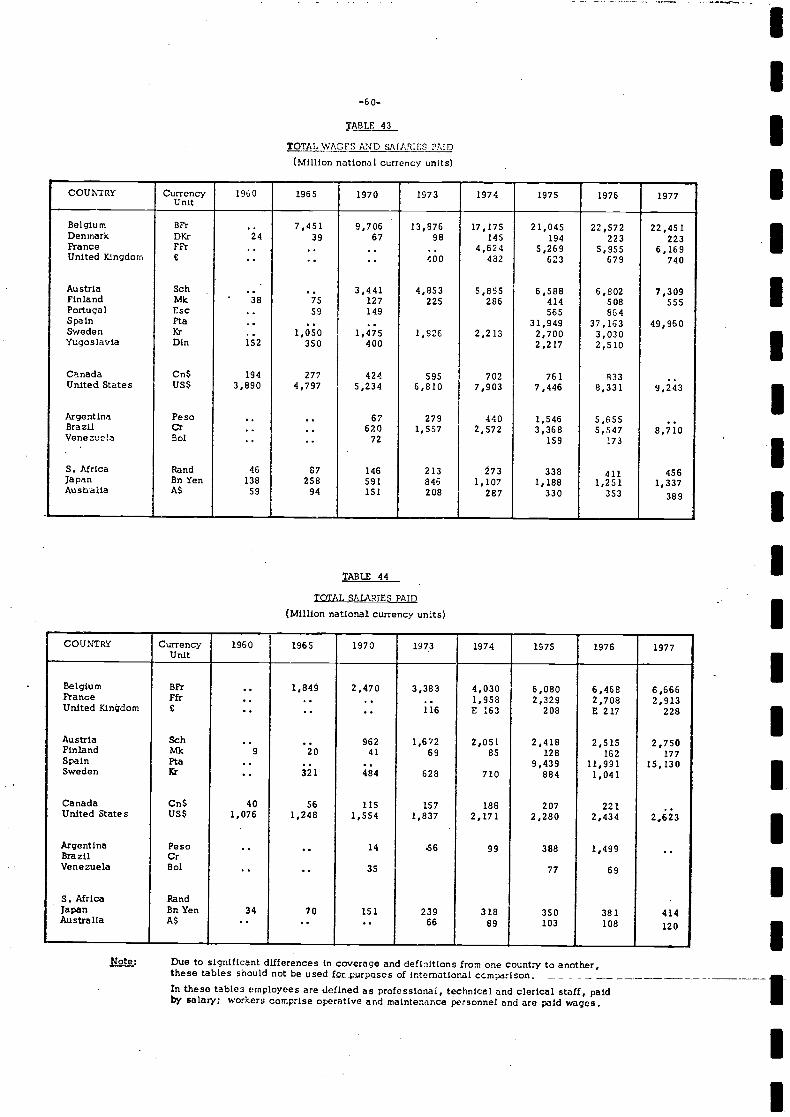
Note:
-60-
TABLE 43
TOTAL WAGFS AND S ARIIS PAID
(Million national currency units)
TABLE 44
ICIALSA1AR1ES PAID
(Million national currency unIts)
Due to sigmificant differences in coverage and definitions from one country to another,these tables should not be used fot purposes of international ccmparlson .----. - -
¡n these tables employees are defined as profcssiona, technical and clerical staff, paidby salary; workers comprise operative and maintenance personnel and are paid wages.
II
I
COUNTRY CurrencyUnit
1960 1965 1970 1973 1974 1975 1976 1977
Belgium 8Fr . . 7,451 9,706 13,876 17,175 21,045 22,572 22,451Denmark DKr 24 39 67 98 145 194 223 223France FFr . . . . . . . 4,624 5,269 5,955 6,169United Kingdom £ .. .. .. 400 482 623 679 740
Austria Sch .. . . 3,441 4,853 5,855 6,588 6,802 7,309Finland Mk 38 75 127 225 286 414 508 555Portugal Esc .. 59 149 565 864Spain Pta .. . . . . 31,949 37,163 49,960Sweden Kr . . 1,050 1,475 1,926 2,213 2,700 3,030Yugoslavia Din 152 350 400 2.217 2,510
Canada CnS 194 277 424 595 702 761 833United States USS 3,890 4,797 5,234 6,810 7,903 7,446 8,331 9,243
Argentina Peso .. .. 67 279 440 1,546 5,655Brazil Cr . . .. 620 1,557 2,572 3,368 5,547 8,710Venezuela Bol .. .. 72 159 173
S. Africa Rand 46 87 146 213 273 338 411 456Japan Bn Yen 138 258 591 846 1,107 1,188 1,251 1,337Austialla AS 59 94 151 208 287 330 389
COUNTRY CurrencyUnit
1960 1965 1970 1973 1974 1975 1976 1977
Belgium BFr .. 1,849 2,470 3,383 4,030 6,080 6,468 6,666France Ffr .. . . . 1,958 2,329 2,708 2,913United Kingdom £ .. .. .. 116 E 163 208 E 217 228
Austria Sch .. .. 962 1,672 2,051 2,418 2,515 2,750Finland Mk 9 20 41 69 85 128 162 177Spain Pta .. . . 9.439 11,991 15,130Sweden Kr .. 321 484 628 710 884 1,041
Canada Cn$ 40 56 115 157 188 207 221United States USS 1,076 1,248 1,554 1,837 2,171 2,280 2,434 2,623
Argentina Peso .. .. 14 .56 99 388 1,499Brazil CrVenezuela Bol .. .. 35 77 69
S. Africa RandJapan BnYen 34 70 151 239 318 350 381 414Australia AS .. .. .. 66 89 103 108 120
IIIIIIIIIIIItIIItI
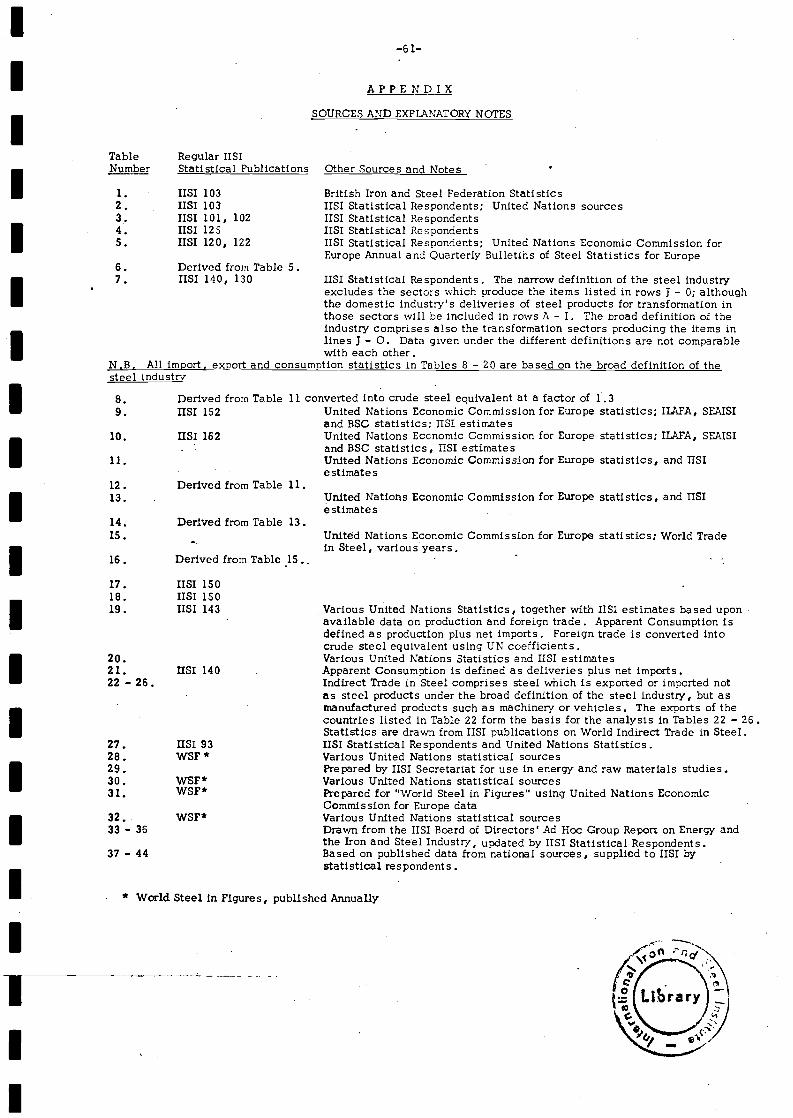
uSI 103USI 103uSI 101, 102uSI 125uSI 120, 122
Derived from Table 5.
* World Steel in Figures, published Annually
-61-
APPENDIX
SOURCES AND EXPLANATORY NOTES
Table Regular uSINumber Statistical Publications Other Sources and Notes
British Iron and Steel Federation StatisticsIISI Statistical Respondents; United Nations sourcesuSI Statistical RespondentslIST Statistical RespondentsTISI Statistical Respondents; United Nations Economic Commission forEurope Annual and Quarterly Bulletíhs of Steel Statistics for Europe
Unitéd Nations Economic Commission for Europein Steel, various years.
statistics; World Trade
Various United Nations Statistics, together with uSI estimates based uponavailable data on production and foreign trade. Apparent Consumption Isdefined as production plus net imports. Foreign trade is converted intocrude steel equivalent using UN coefficients.Various United Nations Statistics and uSI estimatesApparent Consumption is defined as deliveries plus net imports.Indirect Trade in Steel comprises steel which is exported or imported notas steel products under the broad definition of the steel industry, but asmanufactured products such as machinery or vehicles. The exports of thecountries listed in Table 22 form the basis for the analysis In Tables 22 - 26.Statistics are drawn from uSI publications on World Indirect Trade in Steel.TISI Statistical Respondents and United Nations Statistics.Various United Nations statistical sourcesPrepared by IISI Secretariat for use in energy and raw materials studies.Various United Nations statistical sourcesPrepared for "World Steel in Figures using United Nations EconomicCommission for Europe dataVarious United Nations statistical sourcesDrawn from the uSI Board of Directors Ad Hoc Group Report on Energy andthe Iron and Steel Industry, updated by uSI Statistical Respondents.Based on published data from national sources, supplied to 1151 bystatistical respondents.
uSI 140, 130 uSI Statistical Respondents. The narrow definition of the steel industryexcludes the sectors which produce the items listed in rows J - 0; althoughthe domestic industrys deliveries of steel products for transformation inthose sectors wIll be included in rows A - I. The broad definition of theindustry comprises also the transformation sectors producing the items inlines J - O. Data given under the different definitions are not comparablewith each other.
NB. All Imper-t, export and consumption statistics in Tzables 8 - 20 are based on the broad definition of thesteel industry
Derived from Table 11 converted into crude steel equivalent at a factor of 1 .3uSI 152 United Nations Economic Commission for Europe statistics; ILAPA, SEAISI
and BSC statistics; USI estimatesUSI 162 United Nations Eccnomtc Commission for Europe statistics; ILAFA, SEAISI
and BSC statistics, USI estimatesUnited Nations Economic Commission for Europe statistics, and USIestimates
Derived from Table 11.United Nations Economic Commission for Europe statistics, and uSIestimates
Derived from Table 13.
Derived from Table 15.
TISI 150IISI 150USI 143
USI 14022 - 26.
IISI 93WSF *
WSF*WSF*
32.. WSF*33 - 36
37 - 44

- - - - - - - - - - - - - - - - - - - - -