international iso standard 26262-10 -...
TRANSCRIPT
Reference numberISO 26262-10:2012(E)
© ISO 2012
INTERNATIONAL STANDARD
ISO26262-10
First edition2012-08-01
Road vehicles — Functional safety — Part 10: Guideline on ISO 26262
Véhicules routiers — Sécurité fonctionnelle —
Partie 10: Lignes directrices relatives à l'ISO 26262
ISO 26262-10:2012(E)
COPYRIGHT PROTECTED DOCUMENT © ISO 2012 All rights reserved. Unless otherwise specified, no part of this publication may be reproduced or utilized in any form or by any means, electronic or mechanical, including photocopying and microfilm, without permission in writing from either ISO at the address below or ISO's member body in the country of the requester.
ISO copyright office Case postale 56 • CH-1211 Geneva 20 Tel. + 41 22 749 01 11 Fax + 41 22 749 09 47 E-mail [email protected] Web www.iso.org
Published in Switzerland
ii © ISO 2012 – All rights reserved
ISO 26262-10:2012(E)
© ISO 2012 – All rights reserved iii
Contents Page
Foreword ............................................................................................................................................................iv Introduction.........................................................................................................................................................v 1 Scope ......................................................................................................................................................1 2 Normative references............................................................................................................................1 3 Terms, definitions and abbreviated terms..........................................................................................2 4 Key concepts of ISO 26262...................................................................................................................2 4.1 Functional safety for automotive systems (relationship with IEC 61508) .......................................2 4.2 Item, system, element, component, hardware part and software unit.............................................4 4.3 Relationship between faults, errors and failures ...............................................................................5 5 Selected topics regarding safety management..................................................................................6 5.1 Work product .........................................................................................................................................6 5.2 Confirmation measures ........................................................................................................................6 5.3 Understanding of safety cases ............................................................................................................9 6 Concept phase and system development.........................................................................................10 6.1 General .................................................................................................................................................10 6.2 Example of hazard analysis and risk assessment...........................................................................10 6.3 An observation regarding controllability classification ..................................................................11 6.4 External measures...............................................................................................................................12 6.5 Example of combining safety goals ..................................................................................................13 7 Safety process requirement structure - Flow and sequence of safety requirements..................14 8 Concerning hardware development ..................................................................................................17 8.1 The classification of random hardware faults ..................................................................................17 8.2 Example of residual failure rate and local single-point fault metric evaluation ...........................22 8.3 Further explanation concerning hardware .......................................................................................34 9 Safety element out of context ............................................................................................................36 9.1 Safety element out of context development .....................................................................................36 9.2 Use cases .............................................................................................................................................37 10 An example of proven in use argument ............................................................................................45 10.1 General .................................................................................................................................................45 10.2 Item definition and definition of the proven in use candidate ........................................................46 10.3 Change analysis ..................................................................................................................................46 10.4 Target values for proven in use .........................................................................................................46 11 Concerning ASIL decomposition.......................................................................................................47 11.1 Objective of ASIL decomposition ......................................................................................................47 11.2 Description of ASIL decomposition ..................................................................................................47 11.3 An example of ASIL decomposition ..................................................................................................47 Annex A (informative) ISO 26262 and microcontrollers ..............................................................................51 Annex B (informative) Fault tree construction and applications ................................................................73 Bibliography......................................................................................................................................................89
ISO 26262-10:2012(E)
iv © ISO 2012 – All rights reserved
Foreword
ISO (the International Organization for Standardization) is a worldwide federation of national standards bodies (ISO member bodies). The work of preparing International Standards is normally carried out through ISO technical committees. Each member body interested in a subject for which a technical committee has been established has the right to be represented on that committee. International organizations, governmental and non-governmental, in liaison with ISO, also take part in the work. ISO collaborates closely with the International Electrotechnical Commission (IEC) on all matters of electrotechnical standardization.
International Standards are drafted in accordance with the rules given in the ISO/IEC Directives, Part 2.
The main task of technical committees is to prepare International Standards. Draft International Standards adopted by the technical committees are circulated to the member bodies for voting. Publication as an International Standard requires approval by at least 75 % of the member bodies casting a vote.
Attention is drawn to the possibility that some of the elements of this document may be the subject of patent rights. ISO shall not be held responsible for identifying any or all such patent rights.
ISO 26262-10 was prepared by Technical Committee ISO/TC 22, Road vehicles, Subcommittee SC 3, Electrical and electronic equipment.
ISO 26262 consists of the following parts, under the general title Road vehicles — Functional safety:
⎯ Part 1: Vocabulary
⎯ Part 2: Management of functional safety
⎯ Part 3: Concept phase
⎯ Part 4: Product development at the system level
⎯ Part 5: Product development at the hardware level
⎯ Part 6: Product development at the software level
⎯ Part 7: Production and operation
⎯ Part 8: Supporting processes
⎯ Part 9: Automotive Safety Integrity Level (ASIL)-oriented and safety-oriented analyses
⎯ Part 10: Guideline on ISO 26262
ISO 26262-10:2012(E)
© ISO 2012 – All rights reserved v
Introduction
ISO 26262 is the adaptation of IEC 61508 to comply with needs specific to the application sector of electrical and/or electronic (E/E) systems within road vehicles.
This adaptation applies to all activities during the safety lifecycle of safety-related systems comprised of electrical, electronic and software components.
Safety is one of the key issues of future automobile development. New functionalities not only in areas such as driver assistance, propulsion, in vehicle dynamics control and active and passive safety systems increasingly touch the domain of system safety engineering. Development and integration of these functionalities will strengthen the need for safe system development processes and the need to provide evidence that all reasonable system safety objectives are satisfied.
With the trend of increasing technological complexity, software content and mechatronic implementation, there are increasing risks from systematic failures and random hardware failures. ISO 26262 includes guidance to avoid these risks by providing appropriate requirements and processes.
System safety is achieved through a number of safety measures, which are implemented in a variety of technologies (e.g. mechanical, hydraulic, pneumatic, electrical, electronic, programmable electronic) and applied at the various levels of the development process. Although ISO 26262 is concerned with functional safety of E/E systems, it provides a framework within which safety-related systems based on other technologies can be considered. ISO 26262:
a) provides an automotive safety lifecycle (management, development, production, operation, service, decommissioning) and supports tailoring the necessary activities during these lifecycle phases;
b) provides an automotive-specific risk-based approach to determine integrity levels [Automotive Safety Integrity Levels (ASIL)];
c) uses ASILs to specify applicable requirements of ISO 26262 so as to avoid unreasonable residual risk;
d) provides requirements for validation and confirmation measures to ensure a sufficient and acceptable level of safety being achieved;
e) provides requirements for relations with suppliers.
Functional safety is influenced by the development process (including such activities as requirements specification, design, implementation, integration, verification, validation and configuration), the production and service processes and by the management processes.
Safety issues are intertwined with common function-oriented and quality-oriented development activities and work products. ISO 26262 addresses the safety-related aspects of development activities and work products.
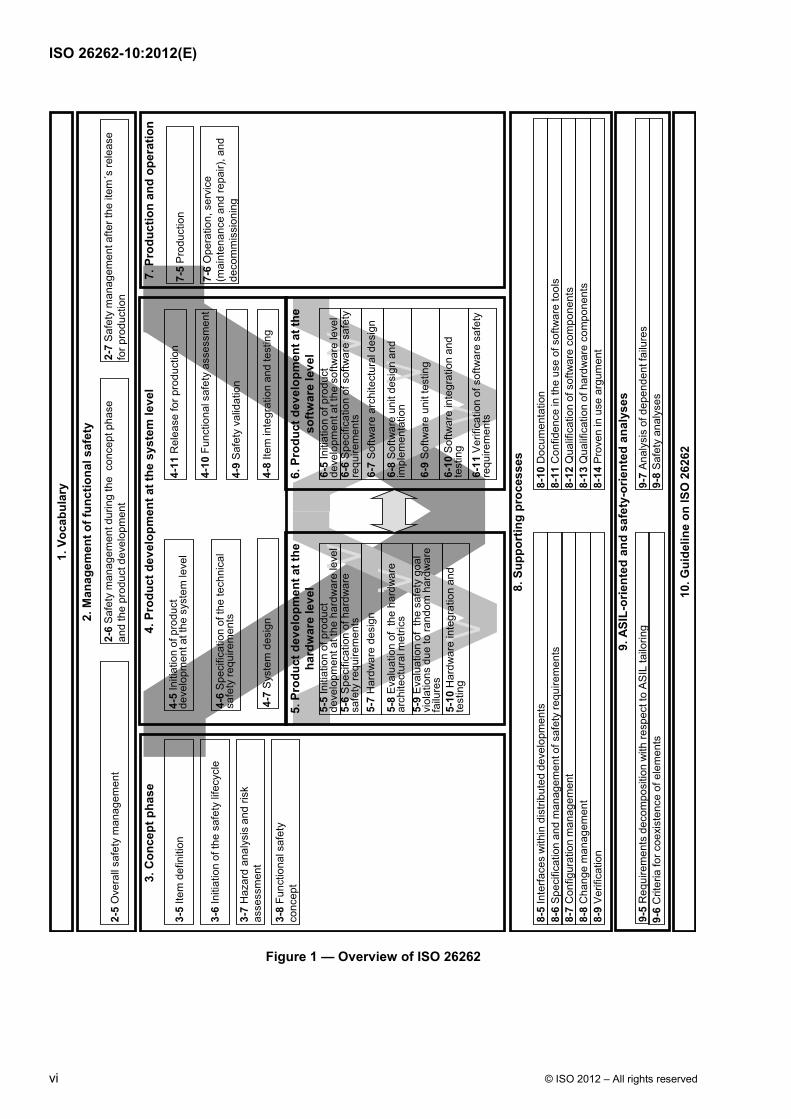
Figure 1 shows the overall structure of this edition of ISO 26262. ISO 26262 is based upon a V-model as a reference process model for the different phases of product development. Within the figure:
⎯ the shaded “V”s represent the interconnection between ISO 26262-3, ISO 26262-4, ISO 26262-5, ISO 26262-6 and ISO 26262-7;
⎯ the specific clauses are indicated in the following manner: “m-n”, where “m” represents the number of the particular part and “n” indicates the number of the clause within that part.
EXAMPLE “2-6” represents Clause 6 of ISO 26262-2.
ISO 26262-10:2012(E)
vi © ISO 2012 – All rights reserved
3. C
once
pt p
hase
2. M
anag
emen
t of f
unct
iona
l saf
ety
2-5
Ove
rall
safe
ty m
anag
emen
t2-
6S
afet
y m
anag
emen
t dur
ing
the
con
cept
pha
se
and
the
prod
uct d
evel
opm
ent
7. P
rodu
ctio
n an
d op
erat
ion
6-5
Initi
atio
n of
pro
duct
de
velo
pmen
t at t
he s
oftw
are
leve
l6-
6S
peci
ficat
ion
of s
oftw
are
safe
ty
requ
irem
ents
6-7
Sof
twar
e ar
chite
ctur
al d
esig
n
6-8
Sof
twar
e un
it de
sign
and
im
plem
enta
tion
6-9
Sof
twar
e un
it te
stin
g
6-10
Sof
twar
e in
tegr
atio
n an
d te
stin
g
6-11
Ver
ifica
tion
of s
oftw
are
safe
ty
requ
irem
ents
5-5
Initi
atio
n of
pro
duct
de
velo
pmen
t at t
he h
ardw
are
leve
l5-
6S
peci
ficat
ion
of h
ardw
are
safe
ty re
quire
men
ts5-
7H
ardw
are
desi
gn
5-8
Eva
luat
ion
of t
he h
ardw
are
arch
itect
ural
met
rics
5-10
Har
dwar
e in
tegr
atio
n an
d te
stin
g
2-7
Saf
ety
man
agem
ent a
fter t
he it
em´s
rele
ase
for p
rodu
ctio
n
3-6
Initi
atio
n of
the
safe
ty li
fecy
cle
1. V
ocab
ular
y
3-5
Item
def
initi
on
3-7
Haz
ard
anal
ysis
and
risk
asse
ssm
ent
3-8
Func
tiona
l saf
ety
conc
ept
7-6
Ope
ratio
n, s
ervi
ce
(mai
nten
ance
and
repa
ir), a
nd
deco
mm
issi
onin
g
7-5
Pro
duct
ion
8. S
uppo
rtin
g pr
oces
ses
8-5
Inte
rface
s w
ithin
dis
tribu
ted
deve
lopm
ents
8-6
Spe
cific
atio
n an
d m
anag
emen
t of s
afet
y re
quire
men
ts
8-8
Cha
nge
man
agem
ent
8-9
Ver
ifica
tion
8-7
Con
figur
atio
n m
anag
emen
t
4. P
rodu
ct d
evel
opm
ent a
t the
sys
tem
leve
l
4-5
Initi
atio
n of
pro
duct
de
velo
pmen
t at t
he s
yste
m le
vel
4-7
Sys
tem
des
ign
4-8
Item
inte
grat
ion
and
test
ing
4-9
Saf
ety
valid
atio
n
4-10
Func
tiona
l saf
ety
asse
ssm
ent
4-11
Rel
ease
for p
rodu
ctio
n
6. P
rodu
ct d
evel
opm
ent a
t the
softw
are
leve
l5.
Pro
duct
dev
elop
men
t at t
heha
rdw
are
leve
l
5-9
Eva
luat
ion
of t
he s
afet
y go
al
viol
atio
ns d
ue to
rand
om h
ardw
are
failu
res
4-6
Spe
cific
atio
n of
the
tech
nica
l sa
fety
requ
irem
ents
9. A
SIL-
orie
nted
and
saf
ety-
orie
nted
ana
lyse
s9-
5R
equi
rem
ents
dec
ompo
sitio
n w
ith re
spec
t to
AS
IL ta
ilorin
g9-
6C
riter
ia fo
r coe
xist
ence
of e
lem
ents
8-10
Doc
umen
tatio
n8-
11C
onfid
ence
in th
e us
e of
sof
twar
e to
ols
8-13
Qua
lific
atio
n of
har
dwar
e co
mpo
nent
s8-
14P
rove
n in
use
arg
umen
t
8-12
Qua
lific
atio
n of
sof
twar
e co
mpo
nent
s
9-7
Ana
lysi
s of
dep
ende
nt fa
ilure
s9-
8S
afet
y an
alys
es
10. G
uide
line
on IS
O 2
6262
Figure 1 — Overview of ISO 26262
INTERNATIONAL STANDARD ISO 26262-10:2012(E)
© ISO 2012 – All rights reserved 1
Road vehicles — Functional safety —
Part 10: Guideline on ISO 26262
1 Scope
ISO 26262 is intended to be applied to safety-related systems that include one or more electrical and/or electronic (E/E) systems and that are installed in series production passenger cars with a maximum gross vehicle mass up to 3 500 kg. ISO 26262 does not address unique E/E systems in special purpose vehicles such as vehicles designed for drivers with disabilities.
Systems and their components released for production, or systems and their components already under development prior to the publication date of ISO 26262, are exempted from the scope. For further development or alterations based on systems and their components released for production prior to the publication of ISO 26262, only the modifications will be developed in accordance with ISO 26262.
ISO 26262 addresses possible hazards caused by malfunctioning behaviour of E/E safety-related systems, including interaction of these systems. It does not address hazards related to electric shock, fire, smoke, heat, radiation, toxicity, flammability, reactivity, corrosion, release of energy and similar hazards, unless directly caused by malfunctioning behaviour of E/E safety-related systems.
ISO 26262 does not address the nominal performance of E/E systems, even if dedicated functional performance standards exist for these systems (e.g. active and passive safety systems, brake systems, Adaptive Cruise Control).
This part of ISO 26262 provides an overview of ISO 26262, as well as giving additional explanations, and is intended to enhance the understanding of the other parts of ISO 26262. It has an informative character only and describes the general concepts of ISO 26262 in order to facilitate comprehension. The explanation expands from general concepts to specific contents.
In the case of inconsistencies between this part of ISO 26262 and another part of ISO 26262, the requirements, recommendations and information specified in the other part of ISO 26262 apply.
2 Normative references
The following referenced documents are indispensable for the application of this document. For dated references, only the edition cited applies. For undated references, the latest edition of the referenced document (including any amendments) applies.
ISO 26262-1:2011, Road vehicles — Functional safety — Part 1: Vocabulary
ISO 26262-2:2011, Road vehicles — Functional safety — Part 2: Management of functional safety
ISO 26262-3:2011, Road vehicles — Functional safety — Part 3: Concept phase
ISO 26262-4:2011, Road vehicles — Functional safety — Part 4: Product development at the system level
ISO 26262-5:2011, Road vehicles — Functional safety — Part 5: Product development at the hardware level
ISO 26262-6:2011, Road vehicles — Functional safety — Part 6: Product development at the software level
ISO 26262-7:2011, Road vehicles — Functional safety — Part 7: Production and operation
ISO 26262-10:2012(E)
2 © ISO 2012 – All rights reserved
ISO 26262-8:2011, Road vehicles — Functional safety — Part 8: Supporting processes
ISO 26262-9:2011, Road vehicles — Functional safety — Part 9: Automotive Safety Integrity Level (ASIL)-oriented and safety-oriented analyses
3 Terms, definitions and abbreviated terms
For the purposes of this document, the terms, definitions and abbreviated terms given in ISO 26262-1:2011 apply.
4 Key concepts of ISO 26262
4.1 Functional safety for automotive systems (relationship with IEC 61508)
IEC 61508, Functional safety of electrical/electronic/programmable electronic safety-related systems, is designated by IEC as a generic standard and a basic safety publication. This means that industry sectors will base their own standards for functional safety on the requirements of IEC 61508.
In the automotive industry, there are a number of issues with applying IEC 61508 directly. Some of these issues and corresponding differences in ISO 26262 are described below.
IEC 61508 is based upon the model of “equipment under control”, for example an industrial plant that has an associated control system as follows:
a) A hazard analysis identifies the hazards associated with the equipment under control (including the equipment control system), to which risk reduction measures will be applied. This can be achieved through E/E/PE systems, or other technology safety-related systems (e.g. a safety valve), or external measures (e.g. a physical containment of the plant). ISO 26262 contains a normative automotive scheme for hazard classification based on severity, probability of exposure and controllability.
b) Risk reduction allocated to E/E/PE systems is achieved through safety functions, which are designated as such. These safety functions are either part of a separate protection system or can be incorporated into the plant control. It is not always possible to make this distinction in automotive systems. The safety of a vehicle depends on the behaviour of the control systems themselves.
ISO 26262 uses the concept of safety goals and a safety concept as follows:
⎯ a hazard analysis and risk assessment identifies hazards and hazardous events that need to be prevented, mitigated or controlled;
⎯ a safety goal is formulated for each hazardous event;
⎯ an Automotive Safety Integrity Level (ASIL) is associated with each safety goal;
⎯ the functional safety concept is a statement of the functionality to achieve the safety goal(s);
⎯ the technical safety concept is a statement of how this functionality is implemented on the system level by hardware and software; and
⎯ software safety requirements and hardware safety requirements state the specific safety requirements which will be implemented as part of the software and hardware design.
EXAMPLE
⎯ The airbag system: one of the hazards is unintended deployment.
⎯ An associated safety goal is that the airbag does not deploy unless a crash occurs that requires the deployment.
ISO 26262-10:2012(E)
© ISO 2012 – All rights reserved 3
⎯ The functional safety concept can specify a redundant function to detect whether the vehicle is in a collision.
⎯ The technical safety concept can specify the implementation of two independent accelerometers with different axial orientations and two independent firing circuits. The squib deploys if both are closed.
IEC 61508 is aimed at singular or low volume systems. The system is built and tested, then installed on the plant, and then safety validation is performed. For mass-market systems such as road vehicles, safety validation is performed before the release for volume (series) production. Therefore, the order of lifecycle activities in ISO 26262 is different. Related to this, ISO 26262-7 addresses requirements for production. These are not covered in IEC 61508.
IEC 61508 does not address specific requirements for managing development across multiple organizations and supply chains, whereas ISO 26262 addresses explicitly the issue, including the Development Interface Agreement (DIA) [see ISO 26262-8:2011, Clause 5 (Interfaces within distributed developments)], because automotive systems are produced by one or more suppliers of the customer, e.g. the vehicle manufacturer, the supplier of the customer, or the customer.
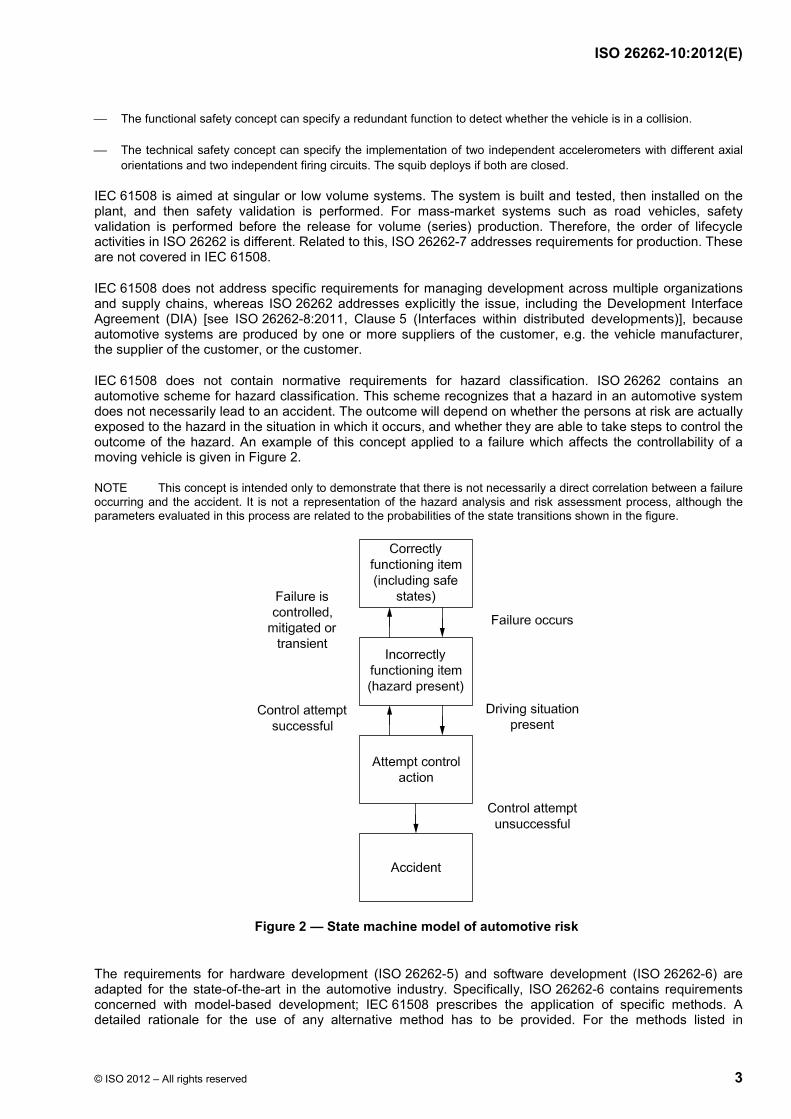
IEC 61508 does not contain normative requirements for hazard classification. ISO 26262 contains an automotive scheme for hazard classification. This scheme recognizes that a hazard in an automotive system does not necessarily lead to an accident. The outcome will depend on whether the persons at risk are actually exposed to the hazard in the situation in which it occurs, and whether they are able to take steps to control the outcome of the hazard. An example of this concept applied to a failure which affects the controllability of a moving vehicle is given in Figure 2.
NOTE This concept is intended only to demonstrate that there is not necessarily a direct correlation between a failure occurring and the accident. It is not a representation of the hazard analysis and risk assessment process, although the parameters evaluated in this process are related to the probabilities of the state transitions shown in the figure.
Figure 2 — State machine model of automotive risk
The requirements for hardware development (ISO 26262-5) and software development (ISO 26262-6) are adapted for the state-of-the-art in the automotive industry. Specifically, ISO 26262-6 contains requirements concerned with model-based development; IEC 61508 prescribes the application of specific methods. A detailed rationale for the use of any alternative method has to be provided. For the methods listed in
ISO 26262-10:2012(E)
4 © ISO 2012 – All rights reserved
ISO 26262, specific goals are provided. To achieve these goals, the provided methods can be applied, or a rationale that alternative methods can also achieve the goal is provided.
Safety requirements in ISO 26262 are assigned an ASIL (Automotive Safety Integrity Level) rather than a SIL (Safety Integrity Level). The main motivation for this is that the SIL in IEC 61508 is stated in probabilistic terms (see IEC 61508-1:2010, Table 3). IEC 61508 states: "It is accepted that only with respect to the hardware safety integrity will it be possible to quantify and apply reliability prediction techniques in assessing whether the target failure measures have been met. Qualitative techniques and judgements have to be made with respect to the precautions necessary to meet the target failure measures with respect to the systematic safety integrity." An ASIL is not based on this probabilistic requirement concerning the occurrence of the hazard; however, there are probabilistic targets associated with compliance to the requirements of an ASIL.
4.2 Item, system, element, component, hardware part and software unit
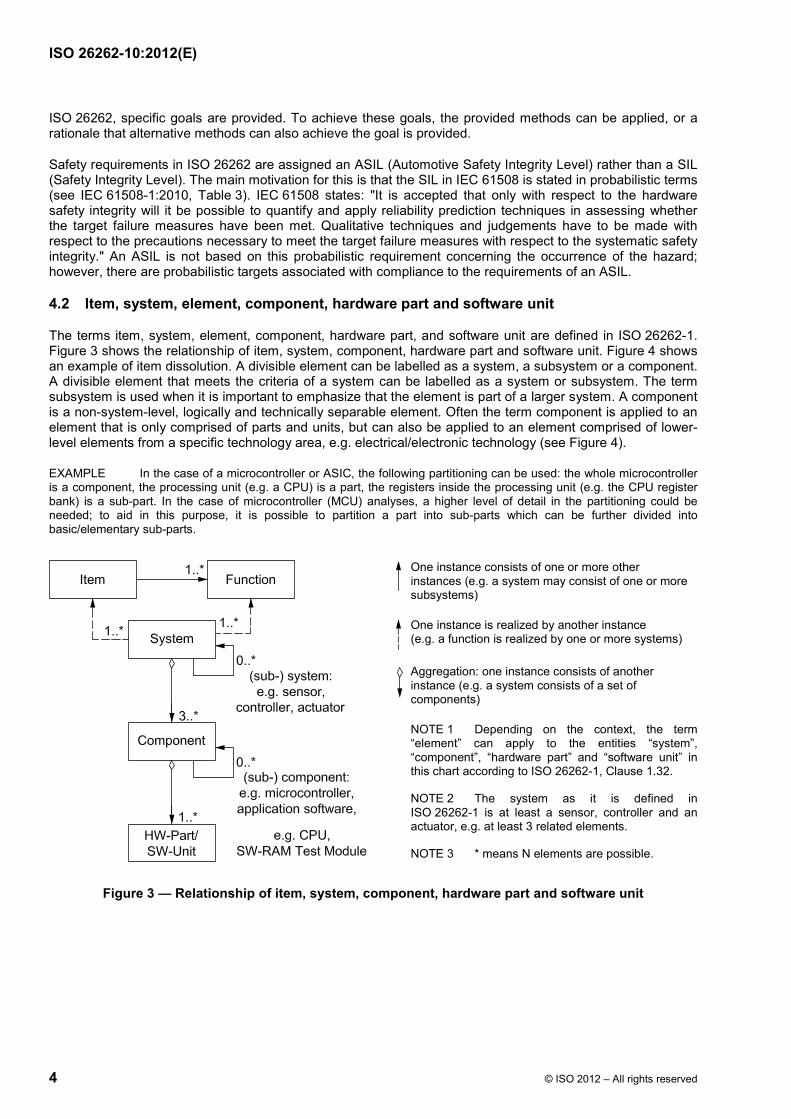
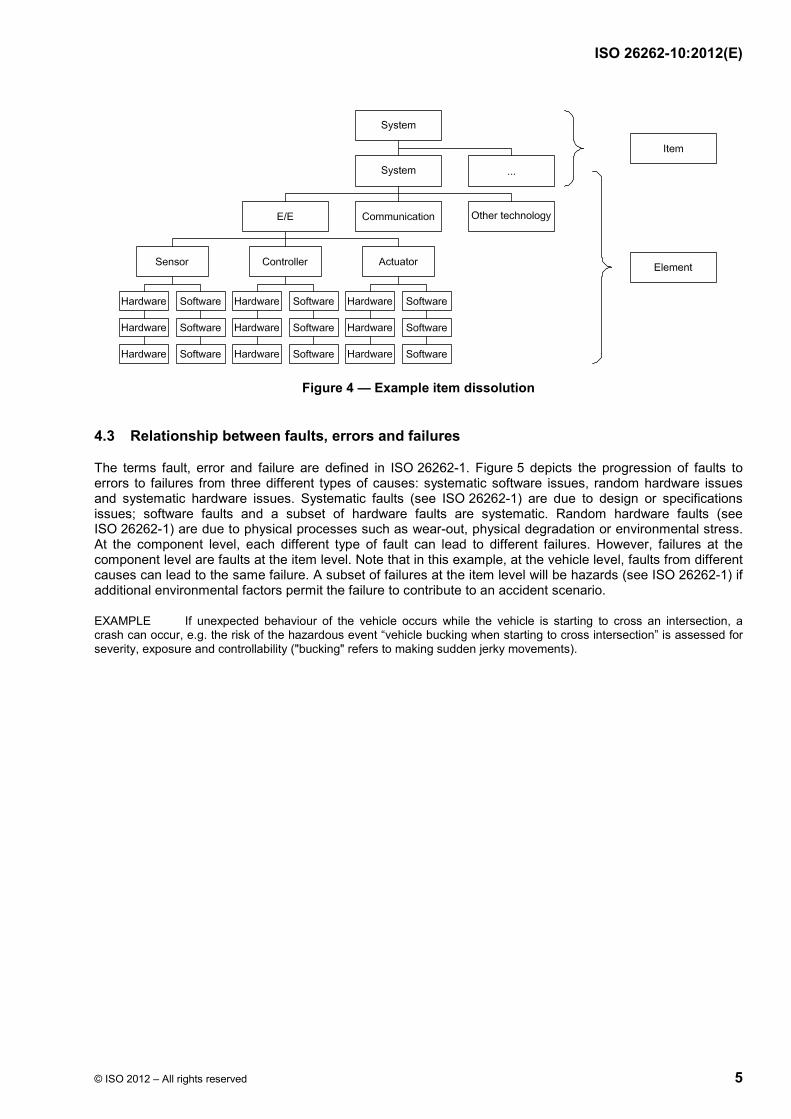
The terms item, system, element, component, hardware part, and software unit are defined in ISO 26262-1. Figure 3 shows the relationship of item, system, component, hardware part and software unit. Figure 4 shows an example of item dissolution. A divisible element can be labelled as a system, a subsystem or a component. A divisible element that meets the criteria of a system can be labelled as a system or subsystem. The term subsystem is used when it is important to emphasize that the element is part of a larger system. A component is a non-system-level, logically and technically separable element. Often the term component is applied to an element that is only comprised of parts and units, but can also be applied to an element comprised of lower-level elements from a specific technology area, e.g. electrical/electronic technology (see Figure 4).
EXAMPLE In the case of a microcontroller or ASIC, the following partitioning can be used: the whole microcontroller is a component, the processing unit (e.g. a CPU) is a part, the registers inside the processing unit (e.g. the CPU register bank) is a sub-part. In the case of microcontroller (MCU) analyses, a higher level of detail in the partitioning could be needed; to aid in this purpose, it is possible to partition a part into sub-parts which can be further divided into basic/elementary sub-parts.
One instance consists of one or more other instances (e.g. a system may consist of one or more subsystems)
One instance is realized by another instance (e.g. a function is realized by one or more systems)
Aggregation: one instance consists of another instance (e.g. a system consists of a set of components)
NOTE 1 Depending on the context, the term “element” can apply to the entities “system”, “component”, “hardware part” and “software unit” in this chart according to ISO 26262-1, Clause 1.32.
NOTE 2 The system as it is defined in ISO 26262-1 is at least a sensor, controller and an actuator, e.g. at least 3 related elements.
NOTE 3 * means N elements are possible.
Figure 3 — Relationship of item, system, component, hardware part and software unit
ISO 26262-10:2012(E)
© ISO 2012 – All rights reserved 5
Figure 4 — Example item dissolution
4.3 Relationship between faults, errors and failures
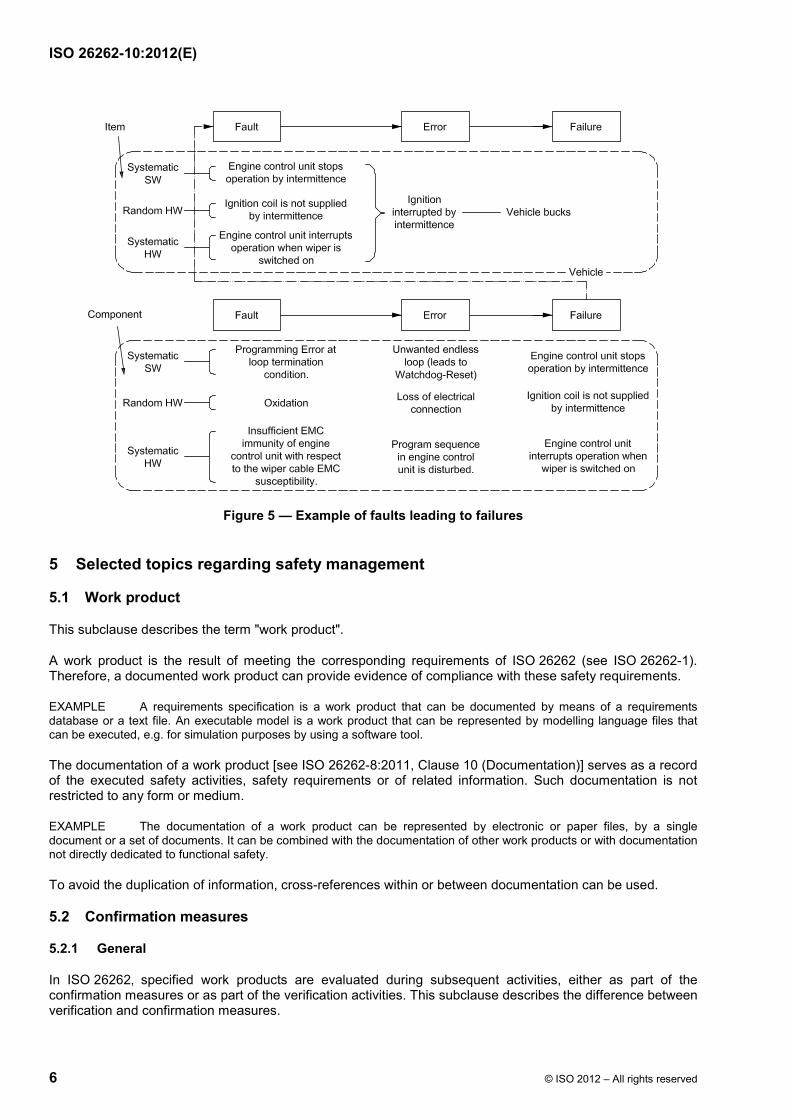
The terms fault, error and failure are defined in ISO 26262-1. Figure 5 depicts the progression of faults to errors to failures from three different types of causes: systematic software issues, random hardware issues and systematic hardware issues. Systematic faults (see ISO 26262-1) are due to design or specifications issues; software faults and a subset of hardware faults are systematic. Random hardware faults (see ISO 26262-1) are due to physical processes such as wear-out, physical degradation or environmental stress. At the component level, each different type of fault can lead to different failures. However, failures at the component level are faults at the item level. Note that in this example, at the vehicle level, faults from different causes can lead to the same failure. A subset of failures at the item level will be hazards (see ISO 26262-1) if additional environmental factors permit the failure to contribute to an accident scenario.
EXAMPLE If unexpected behaviour of the vehicle occurs while the vehicle is starting to cross an intersection, a crash can occur, e.g. the risk of the hazardous event “vehicle bucking when starting to cross intersection” is assessed for severity, exposure and controllability ("bucking" refers to making sudden jerky movements).
ISO 26262-10:2012(E)
6 © ISO 2012 – All rights reserved
Figure 5 — Example of faults leading to failures
5 Selected topics regarding safety management
5.1 Work product
This subclause describes the term "work product".
A work product is the result of meeting the corresponding requirements of ISO 26262 (see ISO 26262-1). Therefore, a documented work product can provide evidence of compliance with these safety requirements.
EXAMPLE A requirements specification is a work product that can be documented by means of a requirements database or a text file. An executable model is a work product that can be represented by modelling language files that can be executed, e.g. for simulation purposes by using a software tool.
The documentation of a work product [see ISO 26262-8:2011, Clause 10 (Documentation)] serves as a record of the executed safety activities, safety requirements or of related information. Such documentation is not restricted to any form or medium.
EXAMPLE The documentation of a work product can be represented by electronic or paper files, by a single document or a set of documents. It can be combined with the documentation of other work products or with documentation not directly dedicated to functional safety.
To avoid the duplication of information, cross-references within or between documentation can be used.
5.2 Confirmation measures
5.2.1 General
In ISO 26262, specified work products are evaluated during subsequent activities, either as part of the confirmation measures or as part of the verification activities. This subclause describes the difference between verification and confirmation measures.
ISO 26262-10:2012(E)
© ISO 2012 – All rights reserved 7
On the one hand, the verification activities are performed to determine the completeness and correct specification, or implementation, of safety requirements. The verification of work products can include:
⎯ verification reviews to verify the specification, or implementation, of derived safety requirements against the safety requirements at a higher level, regarding completeness and correctness; or
⎯ the execution of test cases or the examination of test results to provide evidence of the fulfilment of specified safety requirements, by exercising the item or its element(s).
The verification activities are specified in ISO 26262-3, ISO 26262-4, ISO 26262-5 and ISO 26262-6. Furthermore, generic requirements regarding the verification activities in ISO 26262 are specified in ISO 26262-8:2011, Clause 9 (Verification), and further details specific to the verification of safety requirements are specified in ISO 26262-8:2011, Clause 6 (Specification and management of safety requirements).
On the other hand, the confirmation measures are performed to evaluate the item's achievement of functional safety, including a confirmation of:
⎯ the proper definition, tailoring and execution of the safety activities performed during the item development and of the implemented safety processes, with regard to the ISO 26262 requirements; and
⎯ the proper content of the work products with regard to the corresponding ISO 26262 requirements.
The confirmation measures are specified in ISO 26262-2:2011, Clause 6 (Safety management during the concept phase and the product development).
EXAMPLE If an ASIL decomposition is applied during the system design phase:
⎯ the verification of the resulting system design is performed against the technical safety concept (see ISO 26262-4:2011, 7.4.8); and
⎯ the confirmation of the correct application of the ASIL decomposition can be performed as part of a functional safety assessment, with regard to ISO 26262-9:2011, Clause 5 (Requirements decomposition with respect to ASIL tailoring), including the confirmation that a dependent failure analysis has been performed and justifies the claim of sufficient independence between the elements that implement the corresponding redundant safety requirements.
5.2.2 Functional safety assessment
If the highest ASIL of the item's safety goals is ASIL C or D, a functional safety assessment is performed to evaluate an item's achievement of functional safety. In ISO 26262-2, certain aspects of a functional safety assessment are described separately, i.e. the functional safety audit and the confirmation reviews.
A functional safety assessment includes:
a) a review of the appropriateness and effectiveness of the implemented safety measures that can be assessed during the item development;
b) an evaluation of the work products that are required by the safety plan. The review of selected work products is emphasised. These are coined as confirmation reviews and aim to confirm the compliance of such work products with the corresponding requirements of ISO 26262; and
c) one or more functional safety audits to evaluate the implementation of the processes required for functional safety.
A functional safety assessment can be repeated or updated.
EXAMPLE 1 A functional safety assessment update because of a change of the item, or element(s) of the item, that is identified by the change management as having an impact on the functional safety of the item [see ISO 26262-8:2011, Clause 8 (Change management)].
ISO 26262-10:2012(E)
8 © ISO 2012 – All rights reserved
EXAMPLE 2 An iteration of a functional safety assessment triggered by the follow-up of a functional safety assessment report that included a recommendation for a conditional acceptance or rejection of the item's functional safety. In this case, the iteration includes a follow-up of the recommendations resulting from the previous functional safety assessment(s), including an evaluation of the performed corrective actions, if applicable.
If the highest ASIL of the item's safety goals is ASIL B, a functional safety assessment can be omitted or performed less rigorously. However, even if the functional safety assessment is not performed, other confirmation measures are still performed, i.e. the confirmation reviews of the hazard analysis and risk assessment, the safety plan, the item integration and testing plan, the validation plan, the applicable safety analyses, the proven in use arguments (if applicable), and the completeness of the safety case (see ISO 26262-2:2011, Table 1).
If the highest ASIL of the item's safety goals is ASIL A, there is no requirement or recommendation in ISO 26262 for or against performing a functional safety assessment. However, confirmation reviews of the hazard analysis and risk assessment and of the applicable safety analyses are still performed.
In the case of a distributed development, the scope of a functional assessment includes the work products generated, and the processes and safety measures implemented, by a vehicle manufacturer and the suppliers in the item's supply chain [see ISO 26262-2 and ISO 26262-8:2011, Clause 5 (Interfaces within distributed developments)].
The purpose of a functional safety assessment is to evaluate an item's achievement of functional safety, which is only possible at the item level. Therefore, a functional safety assessment at the premises of a supplier (that develops elements of the item) refers only to an assessment with a limited scope, which essentially serves as an input for the subsequent functional safety assessment activities (at the customer level). As the final customer in the item development, the vehicle manufacturer appoints person(s) to perform a functional safety assessment in its full scope, so as to judge an item's achievement of functional safety. This judgement includes providing a recommendation for acceptance, conditional acceptance, or rejection of the item's functional safety.
NOTE For the case where a Tier 1 supplier is responsible for the item development including vehicle integration, this supplier takes over the aforementioned role of the vehicle manufacturer.
In a practical manner, a functional safety assessment in the case of a distributed development can thus be broken down into:
⎯ functional safety assessments with a limited scope at the supplier's premises, concerning the suppliers in the supply chain. The applicable ASIL is the highest inherited ASIL (of the item's safety goals) across the elements, of the item, that are developed by the supplier (see also ISO 26262-8:2011, 5.4.5); and
⎯ a final functional safety assessment that includes a judgement of the functional safety achieved by the integrated item, e.g. performed by the vehicle manufacturer. The applicable ASIL is the highest ASIL of the item's safety goals (see also ISO 26262-2).
EXAMPLE A vehicle manufacturer develops an item with an ASIL D Safety Goal (SG1) and an ASIL A Safety Goal (SG2), and will perform a functional safety assessment regarding this item. It is possible that, for example, a Tier 2 or Tier 3 supplier only develops ASIL A elements of the item, i.e. only elements that inherit the ASIL of SG2 [however, refer to ISO 26262-9:2011, Clause 6 (Criteria for coexistence of elements), if applicable]. There is no requirement or recommendation (for or against) in ISO 26262 to perform a functional safety assessment at this supplier's premises regarding this item development.
The scope, procedure (e.g. work products to be made available by the supplier, work products to be reviewed by the customer) and execution of a functional safety assessment concerning the interface between a customer and a supplier are specified in the corresponding Development Interface Agreement [see ISO 26262-8:2011, Clause 5 (Interfaces within distributed developments)].
EXAMPLE DIA between a vehicle manufacturer (customer) and a Tier 1 supplier. DIA between a Tier 1 supplier (customer) and a Tier 2 supplier.
ISO 26262-10:2012(E)
© ISO 2012 – All rights reserved 9
A possible manner to perform a functional safety assessment in the case of a distributed development is that the vehicle manufacturer and the suppliers in the supply chain each address those aspects of the assessment activities [see bullets a), b) and c) above] for which the respective party is responsible for, as follows:
⎯ a supplier reviews the safety measures implemented in the developed elements including their appropriateness and effectiveness to comply with the corresponding safety goals or safety requirements (provided by the customer or developed by the supplier), and evaluates its implemented processes and the applicable work products. A supplier also evaluates the potential impacts of the developed elements on the item's functional safety, e.g. identifies whether implemented safety measures can lead to new hazards; and
⎯ the vehicle manufacturer evaluates the functional safety of the integrated item. A part of the evaluation can be based on the work products or information provided by one or more suppliers, including reports of the functional safety assessments performed at supplier's premises.
NOTE A customer can evaluate the safety measures implemented by a supplier and the work products made available by a supplier. A customer can also evaluate the processes implemented by a supplier at the supplier's premises (see ISO 26262-8:2011, 5.4.4.8)
5.3 Understanding of safety cases
5.3.1 Interpretation of safety cases
The purpose of a safety case is to provide a clear, comprehensive and defensible argument, supported by evidence, that an item is free from unreasonable risk when operated in an intended context.
The guidance given here focuses on the scope of ISO 26262.
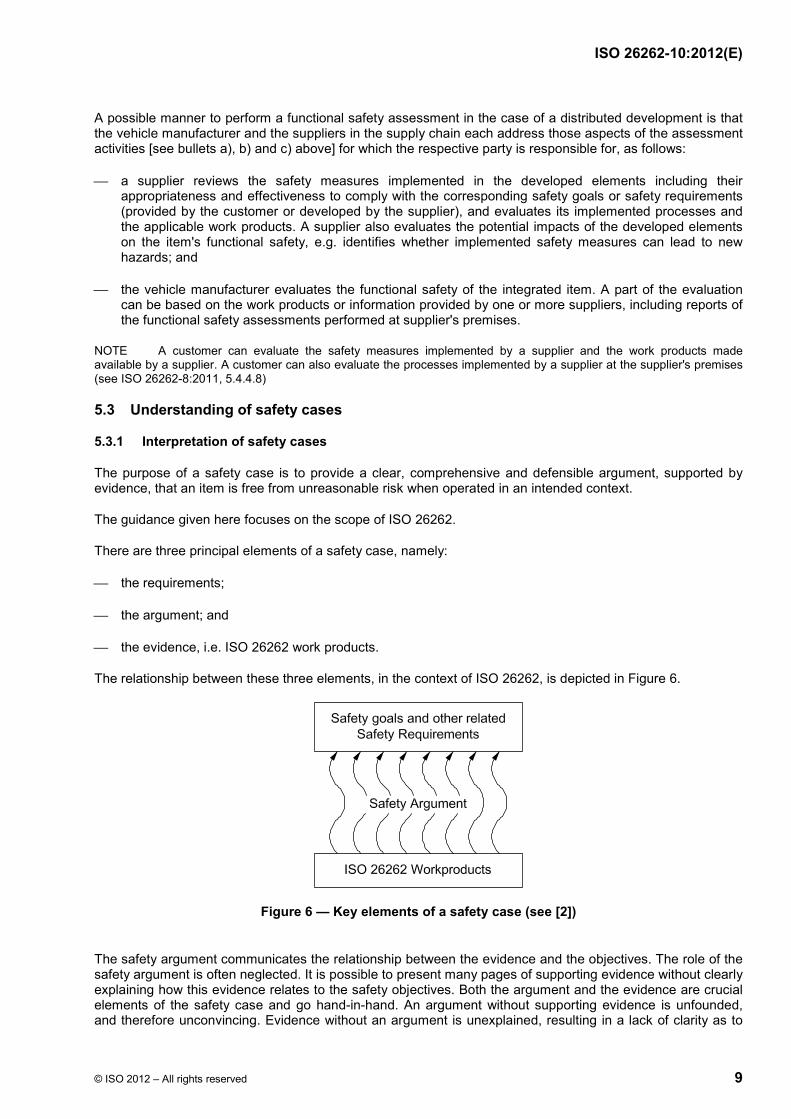
There are three principal elements of a safety case, namely:
⎯ the requirements;
⎯ the argument; and
⎯ the evidence, i.e. ISO 26262 work products.
The relationship between these three elements, in the context of ISO 26262, is depicted in Figure 6.
Figure 6 — Key elements of a safety case (see [2])
The safety argument communicates the relationship between the evidence and the objectives. The role of the safety argument is often neglected. It is possible to present many pages of supporting evidence without clearly explaining how this evidence relates to the safety objectives. Both the argument and the evidence are crucial elements of the safety case and go hand-in-hand. An argument without supporting evidence is unfounded, and therefore unconvincing. Evidence without an argument is unexplained, resulting in a lack of clarity as to
ISO 26262-10:2012(E)
10 © ISO 2012 – All rights reserved
how the safety objectives have been satisfied. Safety cases are communicated through the development and presentation of safety case reports. The role of a safety case report is to summarize the safety argument and then reference the reports capturing the supporting safety evidence (e.g. test reports).
Safety arguments used to date in other industries have often been communicated in safety case reports through narrative text. Narrative text can describe how a safety objective has been interpreted, allocated and decomposed, ultimately leading to references to evidence that demonstrate fulfilment of lower-level safety claims. Alternatively, it is becoming increasingly popular to use graphical argument notations (such as Claims–Argument–Evidence and the Goal Structuring Notation [2]) to visually and explicitly represent the individual elements of a safety argument (requirements, claims, evidence and context) and the relationships that exist between these elements (i.e. how individual requirements are supported by specific claims, how claims are supported by evidence and the assumed context that is defined for the argument).
A safety argument that argues safety through direct appeal to features of the implemented item (e.g. the behaviour of a timing watchdog) is often termed a product argument. A safety argument that argues safety through appeal to features of the development and assessment process (e.g. the design notation adopted) is often termed a process argument.
Both types of argument can be used to achieve a sound argument for the safety of the item where a process argument can be seen as providing the confidence in the evidences used in the product argument.
5.3.2 Safety case development lifecycle
The development of a safety case can be treated as an incremental activity that is integrated with the rest of the development phases of the safety lifecycle.
NOTE The safety plan can include the planning for incremental steps and the preliminary versions of the safety case.
Such an approach allows intermediate versions of the safety case at given milestones of the product development. For example, a preliminary version of the safety case can be created after the verification of the technical safety requirements; an interim version of the safety case can be created after the verification of the system design; and the final version can be created just prior to the functional safety assessment.
The safety case is subject to a confirmation review as given in ISO 26262-2:2011, 6.4.7 (Confirmation measures: types, independency and authority).
If the item is modified, the impact on the safety case is evaluated and, if necessary, the safety case is updated considering modifications.
6 Concept phase and system development
6.1 General
This section provides an overview of the principles behind the hazard analysis and risk classification using simplified examples to the concepts.
6.2 Example of hazard analysis and risk assessment
6.2.1 General
Consider the example of an item controlling an energy storage device embedded in the vehicle. For the purpose of this example, the stored energy is intended to be released only if the vehicle is running greater than or equal to 15 km/h. The release of the stored energy at less than 15 km/h can lead to the overheating and consequent explosion of the device.
ISO 26262-10:2012(E)
© ISO 2012 – All rights reserved 11
6.2.2 Analysis 1
a) Hazard identification
⎯ failure leading to an unwanted release of energy of the device that can result in an explosion
b) Hazardous event
For the purpose of this example, the driving situation considered for the hazard analysis and risk assessment is:
⎯ driving less than 15 km/h in a traffic congestion
An unwanted release of energy due to a failure in the item occurs. The energy storage device explodes, causing severe harm to the occupants of the vehicle.
c) Classification of the identified hazardous event
The explosion leads to life-threatening injuries for the passengers of the vehicle, with survival uncertain, so the severity is estimated as S3.
The vehicle is travelling in traffic congestion, below the speed of 15 km/h. Based on traffic statistic for the target market of the vehicle, the exposure of this situation could be estimated as E3 (occurring between 1 % and 10 % of the driving time).
The ability of the driver or the passengers of the vehicles to control the item failure and the explosion of the device is considered as implausible: this controllability could be estimated as C3 (difficult to control or uncontrollable).
The application of ISO 26262-3:2011, Table 4: ASIL determination leads to an ASIL C.
6.2.3 Analysis 2
a) Hazard identification
⎯ failure does not lead to the release of energy
b) Hazardous event
⎯ any driving situation
A failure in the item occurs but does not lead to the release of any energy from the storage device, so it leads to no harm.
c) Classification of the identified hazardous event
Since the item failure does not lead to harm, the severity is classified as S0 and controllability does not need to be determined. Therefore a safety goal does not need to be defined.
6.3 An observation regarding controllability classification
As explained in ISO 26262-3:2011, Clause 7 (Hazard analysis and risk assessment), the controllability represents an estimation of the probability that the driver or other traffic participant is able to avoid the specific harm.
In the simplest case, only one outcome is considered for a given hazardous event, and the controllability represents an estimation of the probability that this outcome is avoided. However, there can be other cases. For example, a severe outcome (e.g. severity class S2) can be possible but relatively easy to avoid (e.g. controllability C1), while a less severe outcome (e.g. S1) is more difficult to avoid (e.g. C3). Assuming that the
ISO 26262-10:2012(E)
12 © ISO 2012 – All rights reserved
exposure class is E4, the following set of values can be the result, which illustrates that it is not necessarily the highest severity that leads to the highest ASIL:
⎯ E4, S2, C1 => ASIL A
⎯ E4, S1, C3 => ASIL B
In this example, ASIL B is an appropriate classification of the hazardous event.
6.4 External measures
6.4.1 General
An external measure is a measure separate and distinct from the item that reduces or mitigates the risks resulting from a failure of the item.
6.4.2 Example of vehicle-dependent external measures 1
Vehicle A is equipped with a manually operated transmission gear box which can be left in any gear, including neutral, upon key off. Vehicle B is equipped with an automated gear box which, at key off, maintains one gear engaged and a normally closed clutch. Both vehicles have the added item, Electrical Parking Brake (EPB).
A scenario is analyzed for both vehicles which includes:
⎯ The vehicle is parked (key off, driver not present).
⎯ Parked surface is kerbside and sloped, located in a populated urban area.
⎯ A failure involving a sudden loss of EPB occurs.
In this scenario, Vehicle A, when left in neutral at key off (a situation that corresponds to a reasonably foreseeable misuse), will potentially move if left unattended. This can result in an assessed controllability rating of C3, a severity rating of S2 or higher depending on the presence of nearby vulnerable persons, and an exposure ranking greater than E0. Depending on the exposure rating actually assigned, the ratings proposed result in an assigned ASIL classification between QM and C.
Vehicle B however always engages a gear so does not move, thus there is no resulting hazard. The vehicle-dependent external measures included in this design contribute to the elimination of risk for this scenario, but only if the robotized gear box and the EPB can be shown to be sufficiently independent.
6.4.3 Example of vehicle-dependent external measures 2
Vehicle A is equipped with dynamic stability control in addition to a Stop & Start feature. Vehicle B is only equipped with the Stop & Start feature.
A scenario is analyzed for both vehicles which includes:
⎯ The vehicle is being driven at medium-high speed [50 km/h<v<90 km/h].
⎯ The road surface is paved and dry, and in a suburban area.
⎯ The vehicle is approaching a medium curvature bend in the road.
⎯ The vehicle speed and road curvature contribute to a medium-high lateral acceleration.
⎯ A failure in the Stop & Start feature triggering an undesired engine shutdown results in a sudden loss of traction power during the scenario.
As a result of the sudden loss of traction power, a yaw moment is induced on the vehicle, requiring the driver to adjust steering input to re-establish the control of the vehicle. Performing this manoeuvre in Vehicle B can be shown to have a lower controllability, which can contribute to an ASIL rating of C or D. By contrast, the
ISO 26262-10:2012(E)
© ISO 2012 – All rights reserved 13
dynamic stability control feature in Vehicle A limits the effects of the lateral instability. As a result, the controllability rating will be lower for Vehicle A. Therefore, the vehicle-dependent external measures provided by the dynamic stability control contribute to the reduction of risk for this scenario. However, this is the case only if it can be shown that the failure in the Stop & Start function being considered cannot propagate to the dynamic stability control function and is not a dependent failure with regard to both functions.
6.5 Example of combining safety goals
6.5.1 Introduction
Safety goals are top-level safety requirements for the item. They lead to the functional safety requirements needed to avoid an unreasonable risk for an hazardous event. They are determined in the concept phase in accordance with ISO 26262-3:2011, 7.4.8. When safety goals are similar or refer to the same hazard in different situations, they can be combined into a single safety goal with the highest ASIL of the original safety goals. This can simplify the further development, as fewer safety goals have to be managed, while still covering all the identified hazards.
6.5.2 General
In the following example, the item, the safety goals and the ASIL classifications shown are only intended to illustrate the safety goal combination process. This example does not reflect the application of ISO 26262 on a similar real-life project. In particular, it is not complete in terms of failure modes identification, situation analysis and the assessment of vehicle level effects.
For simplicity, the example is limited to the composition of two safety goals, but the same approach can be extended to a higher number of initial safety goals.
6.5.3 Function definition
Consider a vehicle equipped with an Electrical Parking Brake (EPB) system. The EPB system, when activated by a specific driver’s request, applies brake torque to the vehicle's rear wheels to prevent unintended vehicle movement while parked (parking function).
6.5.4 Safety goals applying to the same hazard in different situations
6.5.4.1 Hazard analysis and risk assessment
To simplify the example, consider the following failure mode of the parking function:
⎯ unintended parking brake activation.
NOTE In this context, the term “unintended activation” is intended as a function actuation without the driver’s request.
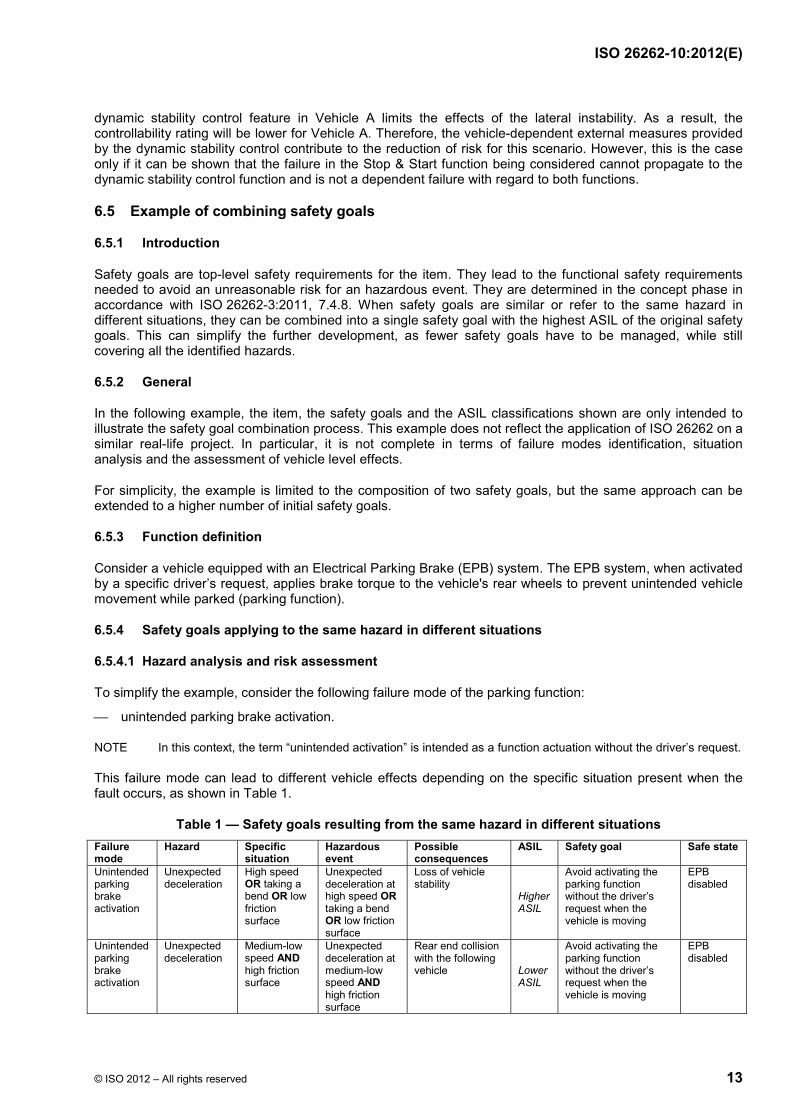
This failure mode can lead to different vehicle effects depending on the specific situation present when the fault occurs, as shown in Table 1.
Table 1 — Safety goals resulting from the same hazard in different situations Failure mode
Hazard Specific situation
Hazardous event
Possible consequences
ASIL Safety goal Safe state
Unintended parking brake activation
Unexpected deceleration
High speed OR taking a bend OR low friction surface
Unexpected deceleration at high speed OR taking a bend OR low friction surface
Loss of vehicle stability
Higher ASIL
Avoid activating the parking function without the driver’s request when the vehicle is moving
EPB disabled
Unintended parking brake activation
Unexpected deceleration
Medium-low speed AND high friction surface
Unexpected deceleration at medium-low speed AND high friction surface
Rear end collision with the following vehicle Lower
ASIL
Avoid activating the parking function without the driver’s request when the vehicle is moving
EPB disabled
ISO 26262-10:2012(E)
14 © ISO 2012 – All rights reserved
6.5.4.2 Safety goals elaboration
As shown above, the same safety goals and safe states are applicable to both situations. Therefore, the following safety goal can be defined:
⎯ Safety goal: Avoid activating the parking function when the vehicle is moving, without the driver’s request.
⎯ Safe state: EPB disabled.
⎯ ASIL: Higher ASIL determined in Table 1 is assigned to this safety goal.
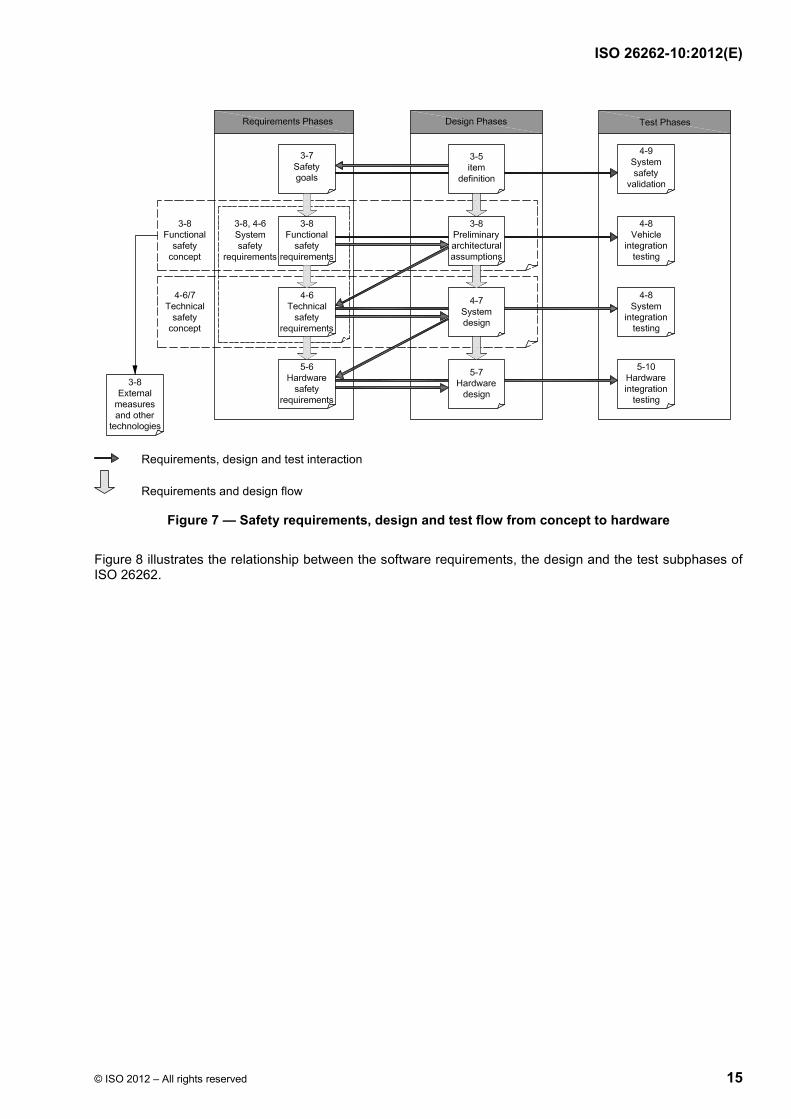
7 Safety process requirement structure - Flow and sequence of safety requirements
The flow and sequence of the safety requirement development in accordance with ISO 26262 is illustrated in Figure 7 and Figure 8, and outlined below. The specific clauses are indicated in the following manner: “m-n”, where “m” represents the number of the part and “n” indicates the number of the clause or subclause within that part.
A hazard analysis and risk assessment is performed to identify the risks and to define the safety goals for these risks. [See ISO 26262-3:2011, Clause 7 (Hazard analysis and risk assessment).]
A functional safety concept is derived which specifies functional safety requirements to satisfy the safety goals. These requirements define the safety mechanisms and the other safety measures that will be used for the item. In addition, the system architectural elements that support these requirements are identified. [See ISO 26262-3:2011, Clause 8 (Functional safety concept).]
A technical safety concept is derived which specifies the technical safety requirements and their allocation to system elements for implementation by the system design. These technical safety requirements will indicate the partitioning of the elements between the hardware and the software. [See ISO 26262-4:2011, Clause 6 (Specification of the technical safety requirements).]
The system design will be developed in accordance with the technical safety requirements. Their implementation can be specified in the system design specification. [See ISO 26262-4:2011, Clause 7 (System design).]
Finally, the hardware and software safety requirements will be provided to comply with the technical safety requirements and the system design. [See ISO 26262-5:2011, Clause 6 (Specification of hardware safety requirements) and ISO 26262-6:2011, Clause 6 (Specification of software safety requirements).]
Figure 7 illustrates the relationship between the hardware requirements and the design phases of ISO 26262.
ISO 26262-10:2012(E)
© ISO 2012 – All rights reserved 15
Requirements, design and test interaction
Requirements and design flow
Figure 7 — Safety requirements, design and test flow from concept to hardware
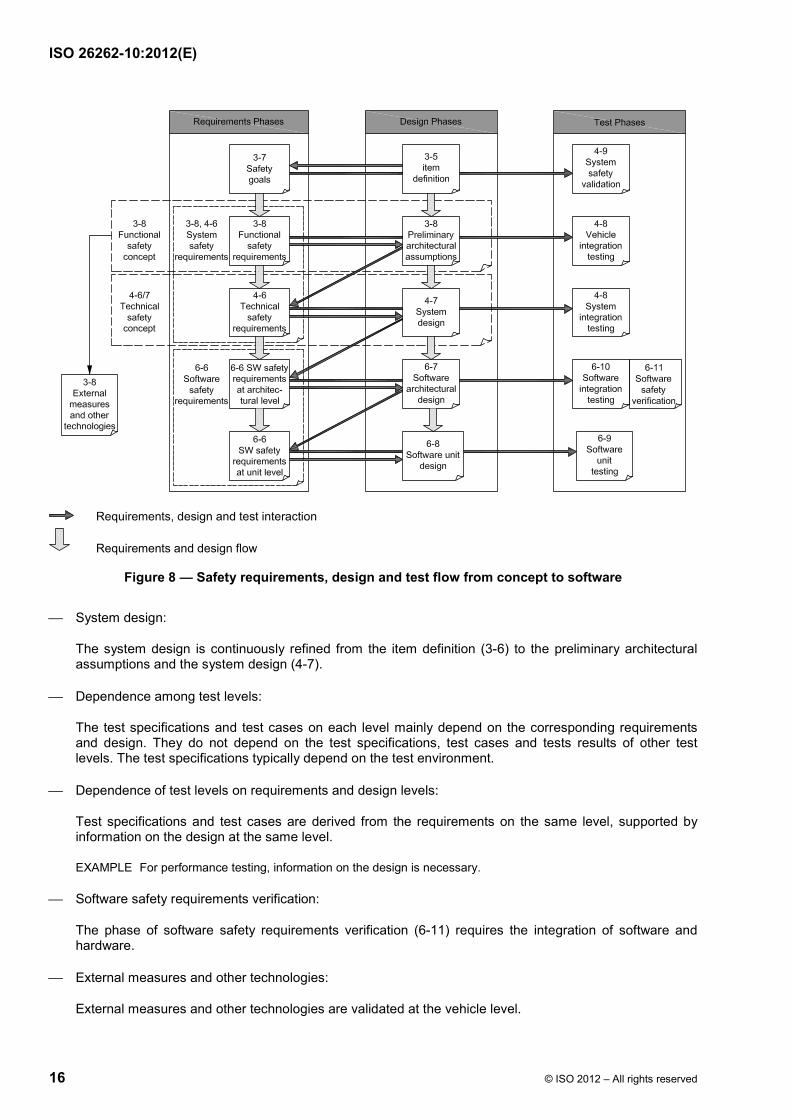
Figure 8 illustrates the relationship between the software requirements, the design and the test subphases of ISO 26262.
ISO 26262-10:2012(E)
16 © ISO 2012 – All rights reserved
Requirements, design and test interaction
Requirements and design flow
Figure 8 — Safety requirements, design and test flow from concept to software
⎯ System design:
The system design is continuously refined from the item definition (3-6) to the preliminary architectural assumptions and the system design (4-7).
⎯ Dependence among test levels:
The test specifications and test cases on each level mainly depend on the corresponding requirements and design. They do not depend on the test specifications, test cases and tests results of other test levels. The test specifications typically depend on the test environment.
⎯ Dependence of test levels on requirements and design levels:
Test specifications and test cases are derived from the requirements on the same level, supported by information on the design at the same level.
EXAMPLE For performance testing, information on the design is necessary.
⎯ Software safety requirements verification:
The phase of software safety requirements verification (6-11) requires the integration of software and hardware.
⎯ External measures and other technologies:
External measures and other technologies are validated at the vehicle level.

ISO 26262-10:2012(E)
© ISO 2012 – All rights reserved 17
8 Concerning hardware development
8.1 The classification of random hardware faults
8.1.1 General
In general, the combinations of faults that are considered are limited to combinations of two independent hardware faults, unless analysis based on the functional or technical safety concept has shown that n point faults with n > 2 are relevant. Therefore, for a given safety goal and a given HW element a fault can be classified in most cases as either:
a) single-point fault;
b) residual fault;
c) detected dual-point fault;
d) perceived dual-point fault;
e) latent dual-point fault; or
f) safe fault.
Explanations on the various fault classes, as well as examples, are given below.
8.1.2 Single-point fault
This fault:
⎯ can lead directly to the violation of a safety goal; and
⎯ is a fault of a hardware element for which not one safety mechanism prevents some of the faults of the hardware element from violating the safety goal.
EXAMPLE An unsupervised resistor for which at least one failure mode (e.g. open circuit) has the potential to violate the safety goal.
NOTE If a hardware part has at least one safety mechanism (e.g. a watchdog for a microcontroller), then none of the faults of that part are classified as a single-point faults. The faults for which the safety mechanisms do not prevent the violation of the safety goal are classified as residual faults.
8.1.3 Residual fault
This fault:
⎯ can lead directly to the violation of the safety goal; and
⎯ is a fault of a hardware element for which at least one safety mechanism prevents some of the faults of the hardware element from violating the safety goal.
EXAMPLE If a Random Access Memory (RAM) module is only checked by a checkerboard RAM test safety mechanism, certain kinds of bridging faults are not detected. The violation of the safety goals due to these faults are not prevented by the safety mechanism. These faults are examples of residual faults.
NOTE The safety mechanism has less than 100 % diagnostic coverage in this case.
ISO 26262-10:2012(E)
18 © ISO 2012 – All rights reserved
8.1.4 Detected dual-point fault
This fault:
⎯ contributes to the violation of the safety goal;
⎯ can only lead to a safety goal violation in combination with one other independent hardware fault that is related to the dual-point fault; and
⎯ is detected by a safety mechanism which prevents it from being latent.
EXAMPLE 1 Flash memory that is protected by parity: a single bit fault which is detected and triggers a reaction according to the technical safety concept, like switching off the system and informing the driver via a warning lamp.
EXAMPLE 2 Flash memory that is protected by Error Detection and Correction Code (EDC): faults in the EDC logic that are detected by a test and a reaction is triggered according to the technical safety concept, like informing the driver via a warning lamp.
In the case of a transient fault, where a safety mechanism restores the item to a fault-free state, such a fault can be considered as a detected dual-point fault even if the driver is never informed about its existence.
EXAMPLE A transient bit flip which is corrected by an Error Detection and Correction Code (EDC) before the data is provided to the CPU and is corrected later on by writing back the correct value. Logging can be used to distinguish between intermittent faults and true transient faults.
8.1.5 Perceived dual-point fault
This fault:
⎯ contributes to the violation of the safety goal but will only lead to a safety goal violation in combination with one other independent hardware fault that is related to the dual-point fault; and
⎯ is perceived by the driver with or without detection by a safety mechanism within a prescribed time;
EXAMPLE A dual-point fault can be perceived by the driver if the functionality is significantly and unambiguously affected by the consequence of the fault.
NOTE If a dual-point fault is perceived by the driver as well as detected by a safety mechanism it can be classified as either a detected or a perceived dual-point fault. It cannot be classified as both simultaneously since the latent-fault metric would be incorrectly calculated due to the fact that one fault would then contribute to the detected dual-point faults as well as to the perceived dual-point faults, counting this fault twice.
8.1.6 Latent dual-point fault
This fault:
⎯ contributes to the violation of the safety goal but will only lead to the violation of the safety goal in combination with one other independent fault; and
⎯ is neither detected by a safety mechanism nor perceived by the driver. Until the occurrence of the second independent fault, the system is still operable and the driver is not informed about the fault.
EXAMPLE 1 In the case of a flash memory that is protected by EDC: a permanent single bit fault for which the value is corrected by the EDC when read but that is neither corrected in the flash memory nor signalled. In this case, the fault cannot lead to a safety goal violation (since the faulty bit is corrected), but it is neither detected (since the single bit fault is not signalled) nor perceived (since there is no impact on the functionality of the application). If an additional fault occurs in the EDC logic, it can lead to a loss of control of this single bit fault, leading to a potential violation of the safety goal.
EXAMPLE 2 In the case of a flash memory which is protected by EDC: a fault in the EDC logic leading to an unavailability of the EDC which is not detected by a test.
ISO 26262-10:2012(E)
© ISO 2012 – All rights reserved 19
8.1.7 Safe fault
Safe faults can be faults of one of two categories:
a) all n point faults with n > 2, unless the safety concept shows them to be a relevant contributor to a safety goal violation, or
d) faults that will not contribute to the violation of a safety goal.
EXAMPLE 1 In the case of a flash memory that is protected by EDC and a Cyclic Redundancy Check (CRC): a single bit fault which is corrected by EDC but is not signalled. The fault is prevented from violating the safety goal but is not signalled by the EDC. If the EDC logic fails, the fault is detected by the CRC and the system switched off. Only if a single bit fault in the flash is present, the EDC logic fails and the CRC checksum supervision fails, can a violation of a safety goal occur (n=3).
EXAMPLE 2 In case three resistors are connected in series to overcome the problem of a single-point fault in the case of a short circuit, the short circuit of each individual resistor can be considered to be a safe fault as three independent short circuits are needed (n=3).
8.1.8 Flow diagram for fault classification and fault class contribution calculation
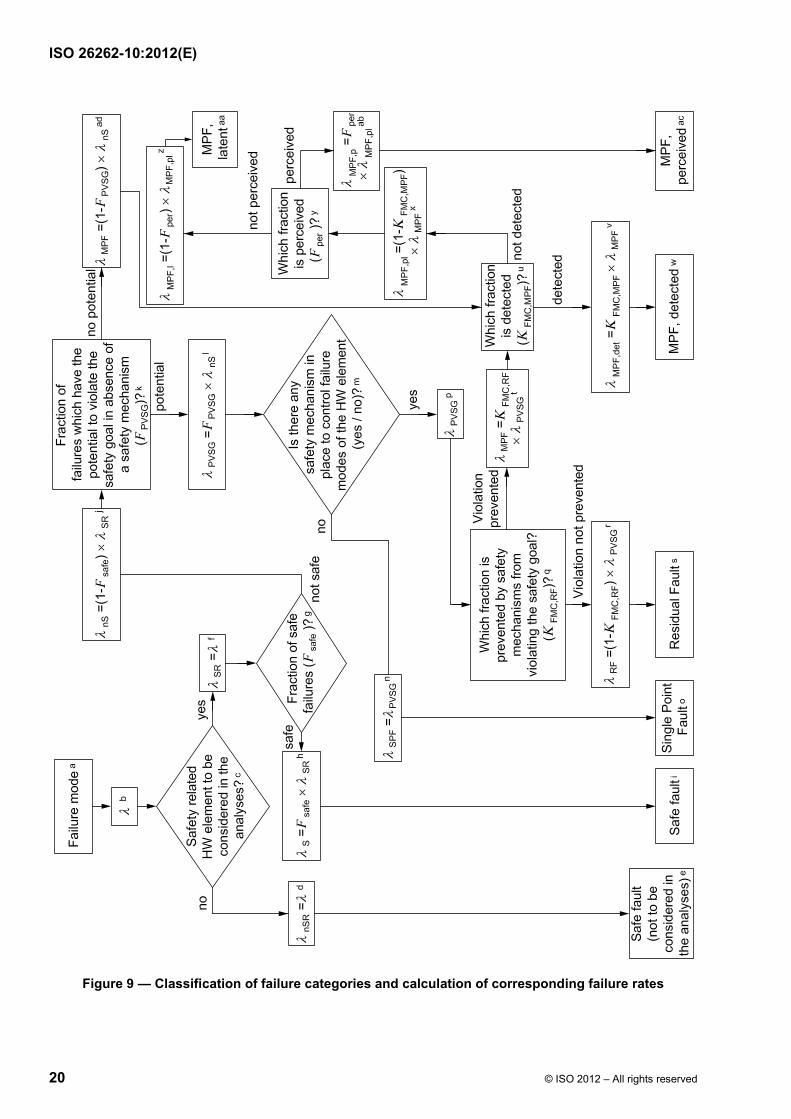
Failure modes of a hardware element can be classified as shown in ISO 26262-5:2011, Figure B.1 and using the flow diagram described in ISO 26262-5:2011, Figure B.2. Figure 9 shows the calculation of the various failure rates considering the basic failure rate and coverage of the different failure modes (residual vs. latent).
ISO 26262-10:2012(E)
20 © ISO 2012 – All rights reserved
Figure 9 — Classification of failure categories and calculation of corresponding failure rates
ISO 26262-10:2012(E)
© ISO 2012 – All rights reserved 21
a Failure mode to be analyzed.
b λ is the failure rate associated with the failure mode under consideration.
c If any failure mode of the HW element which is analyzed is safety-related, then the hardware element is safety-related.
d λnSR is the “not Safety-Related” failure rate. λnSR = λ if all failure modes of the HW element under consideration are not safety-related.
e Faults that are not safety-related are safe faults and are not included in the single-point fault metric or the latent-fault metric.
f λSR is the “Safety-Related” failure rate. They are considered within the single-point fault metric and the latent-fault metric.
g Fsafe is the fraction of safe faults of this failure mode. Safe faults do not significantly contribute to the violation of the safety goal. For complex HW elements (e.g. microcontrollers), it is difficult to give the exact proportion. In this case, a conservative Fsafe of 0,5 (i.e. 50 %) can be assumed.
h λS is the failure rate for the “Safe” faults. It is equal to λSR x Fsafe.
i The λS will contribute to the total rate of safe faults.
j λnS is the “not Safe” failure rate. These include the single-point faults, residual faults and multiple-point faults (with n = 2). It is equal to (1 – Fsafe) x λSR.
k FPVSG is the fraction of λnS that have the potential to directly violate the safety goal without considering any of the safety mechanisms that can exist to prevent this.
l λPVSG is the failure rate of the faults which have the potential to directly violate the safety goal without considering any safety mechanisms that can exist to prevent this. It is equal to FPVSG * λnS.
m Determine if the faults leading to the failure mode under consideration are single-point faults. They are if no safety mechanism is implemented to prevent any fault of the hardware element under consideration from violating a safety goal.
n λSPF is the “Single-Point Faults” failure rate. If there is not at least one safety mechanism present to control failures of the considered hardware element, all λPVSG are single-point faults.
o λSPF will contribute to the total rate of single-point faults.
p If the HW element under consideration has at least one safety mechanism which prevents at least one of its failures from violating a safety goal, the faults leading to the failure under consideration are not single-point faults. In the following procedure, the λPVSG is split up into residual fault and detected, perceived and latent multiple-point faults.
q What fraction of λPVSG is prevented by safety mechanisms from violating the safety goal? This fraction is equivalent to the failure mode coverage with respect to residual faults [see also ISO 26262-5:2011, Annex E (Example calculation of hardware architectural metrics: “single-point fault metric” and “latent-fault metric”)]. KFMC,RF is the acronym of the failure mode coverage with respect to residual faults.
r λRF is the “Residual Fault” failure rate. λRF = (1 – KFMC,RF) x λPVSG
s λRF contributes to the total rate of residual faults.
t λMPF is the “Multiple-Point Faults” failure rate. λMPF = KFMC,RF x λPVSG.

ISO 26262-10:2012(E)
22 © ISO 2012 – All rights reserved
u Identify detected and not detected faults. KFMC,MPF is the failure mode coverage with respect to multiple-point faults.
NOTE There are two sources for multiple-point faults:
⎯ faults which could lead to a safety goal violation, but for which a safety mechanism exists to prevent this;
⎯ faults which by themselves cannot lead to a violation of the safety goal, but which contribute to a multiple-point failure scenario.
Depending on the source of the multiple-point fault, the failure mode coverage with respect to multiple-point faults can vary.
v λMPF,det is the “Multiple-Point Faults, detected” failure rate. λMPF,det = λMPF * KFMC,MPF.
w λMPF,det contributes to the total rate of detected multiple-point faults.
x λMPF,pl is the “Multiple-Point Faults, perceived or latent” failure rate.
y Fper is the fraction of the λMPF,pl which is perceived by the driver.
z λMPF,l is the “Multiple-Point Faults, latent” failure rate.
aa λMPF,l contributes to the total rate of latent multiple-point faults.
ab λMPF,p is the “Multiple-Point Faults, perceived” failure rate.
ac λMPF,p contributes to the total rate of perceived multiple-point faults.
ad λMPF is the “Multiple-Point Faults” failure rate.
8.1.9 How to consider the failure rate of multiple-point faults related to software-based safety mechanisms addressing random hardware failures
While systematic faults of software and hardware are not quantified in ISO 26262, a failure rate can be calculated for random hardware failures of hardware resources that support the execution of the software-based safety mechanisms addressing random hardware failures.
If those hardware resources are shared with functions which have the potential to directly violate a safety goal, then the fault models are chosen to reflect this and potential dependent failures are considered.
8.2 Example of residual failure rate and local single-point fault metric evaluation
8.2.1 General
This example demonstrates a way to evaluate the residual failure rate λRF,Sensor, the single-point failure rate λSPF and the localized version of the single-point fault metric MSPFM,Sensor of a sensor. In this example, the sensor is compared to the value of another sensor where both sensors measure the same physical quantity and have known tolerances. The values of a sensor, A_Master, are used by a feature of the application. The values of the other sensor, A_Checker, are solely used to validate values of sensor A_Master.
This monitoring is referenced in ISO 26262-5:2011, Annex D either as “Sensor Rationality Check” or as “Input comparison/voting”.
Only faults of the sensor A_Master are classified and evaluated in this example. Faults of sensor A_Checker are not addressed here.
ISO 26262-10:2012(E)
© ISO 2012 – All rights reserved 23
Since sensor A_Master has a safety mechanism defined, all remaining faults which have the potential to violate the safety goal and which are not controlled (i.e. the violation of the safety goal is not prevented) are classified as residual faults. The single-point failure rate λSPF is (per definition) equal to zero.
8.2.2 Technical safety requirement for sensor A_Master
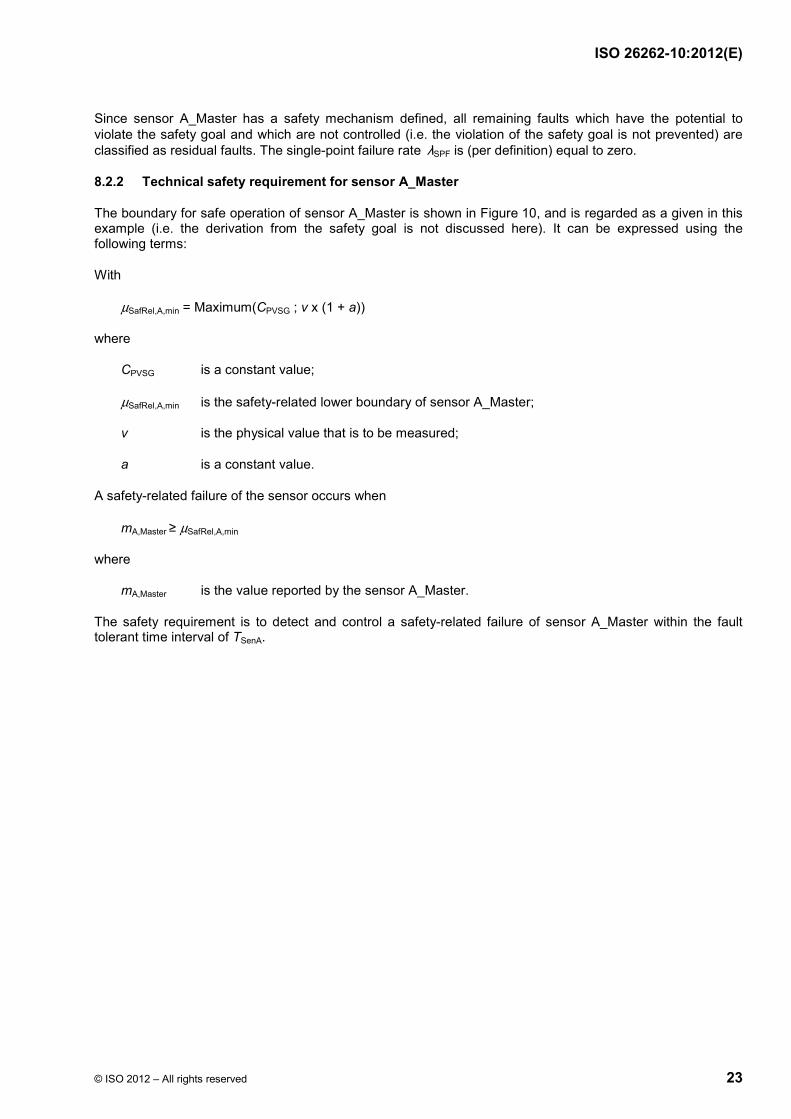
The boundary for safe operation of sensor A_Master is shown in Figure 10, and is regarded as a given in this example (i.e. the derivation from the safety goal is not discussed here). It can be expressed using the following terms:
With
µSafRel,A,min = Maximum(CPVSG ; v x (1 + a))
where
CPVSG is a constant value;
µSafRel,A,min is the safety-related lower boundary of sensor A_Master;
v is the physical value that is to be measured;
a is a constant value.
A safety-related failure of the sensor occurs when
mA,Master ≥ µSafRel,A,min
where
mA,Master is the value reported by the sensor A_Master.
The safety requirement is to detect and control a safety-related failure of sensor A_Master within the fault tolerant time interval of TSenA.
ISO 26262-10:2012(E)
24 © ISO 2012 – All rights reserved
Key: 1 safety-related lower boundary µSafRel,A,min of sensor A_Master 2 return value of an ideal sensor with zero tolerance (as reference) 3 faults with the potential to violate the safety goal
Figure 10 — The boundary for safe operation of sensor A_Master
In Figure 10, the x axis is the real physical value v to be measured, the y axis is the value mA,Master reported by sensor A_Master. The dashed line shows the return value of an ideal sensor (i.e. a sensor with zero tolerance) as a reference. The solid line shows µSafRel,A,min. If the sensor A_Master reports a value mA,Master that is on or above the solid line, a violation of a safety goal can occur.
8.2.3 Description of the safety mechanism
The elements of the safety mechanisms are the sensor A_Checker and the monitor hardware, which consists of a microcontroller with embedded software. The software periodically compares the values of the two sensors with each other, with the periodicity being smaller than the fault tolerant time TSenA. The evaluation is done by the following pseudo code:
∆A = mA,Master – mA,Checker
if ∆A ≥ ∆Max then failure is TRUE
if failure is TRUE then switch into safe state
where
mA,Master is the value reported by the sensor A_Master;
mA,Checker is the value reported by the sensor A_Checker;
∆Max is a predefined constant maximum threshold used as pass/fail criteria.
It is assumed that the sensors have the following known tolerances:
mA,Master = v +/- cA,Master
ISO 26262-10:2012(E)
© ISO 2012 – All rights reserved 25
mA,Checker = v +/- cA,Checker
where
mA,Master is the value reported by the sensor A_Master;
mA,Checker is the value reported by the sensor A_Checker;
cA,Master is a constant value representing the tolerance of sensor A_Master;
cA,Checker is a constant value representing the tolerance of sensor A_Checker;
v is the physical value to be measured.
The value ∆Max is chosen so that a failure of sensor A_Master that can violate the safety goal is detected. To prevent false failure detections, ∆Max is selected considering the tolerances of each sensor and other tolerances summarized in cA,other e.g. effects of sampling at different times:
∆Max ≥ cA,Master + cA,Checker + cA,other
With this approach, the worst case of an undetected failure is:
µA,Master,wc = mA,Checker + ∆Max
= v + cA,Checker + ∆Max
where
µA,Master,wc is the worst case detection threshold, i.e. the maximum value mA,Master of sensor A_Master that is not detected as a failure;
mA,Checker is the value reported by the sensor A_Checker;
∆Max is a predefined constant maximum threshold used as pass/fail criteria;
v is the physical value to be measured.
Every value mA,Master above µA,Master,wc is classified as a sensor failure.
Depending on the tolerance values, different detection scenarios are possible. Two examples are visualized in Figure 11 and Figure 12.
ISO 26262-10:2012(E)
26 © ISO 2012 – All rights reserved
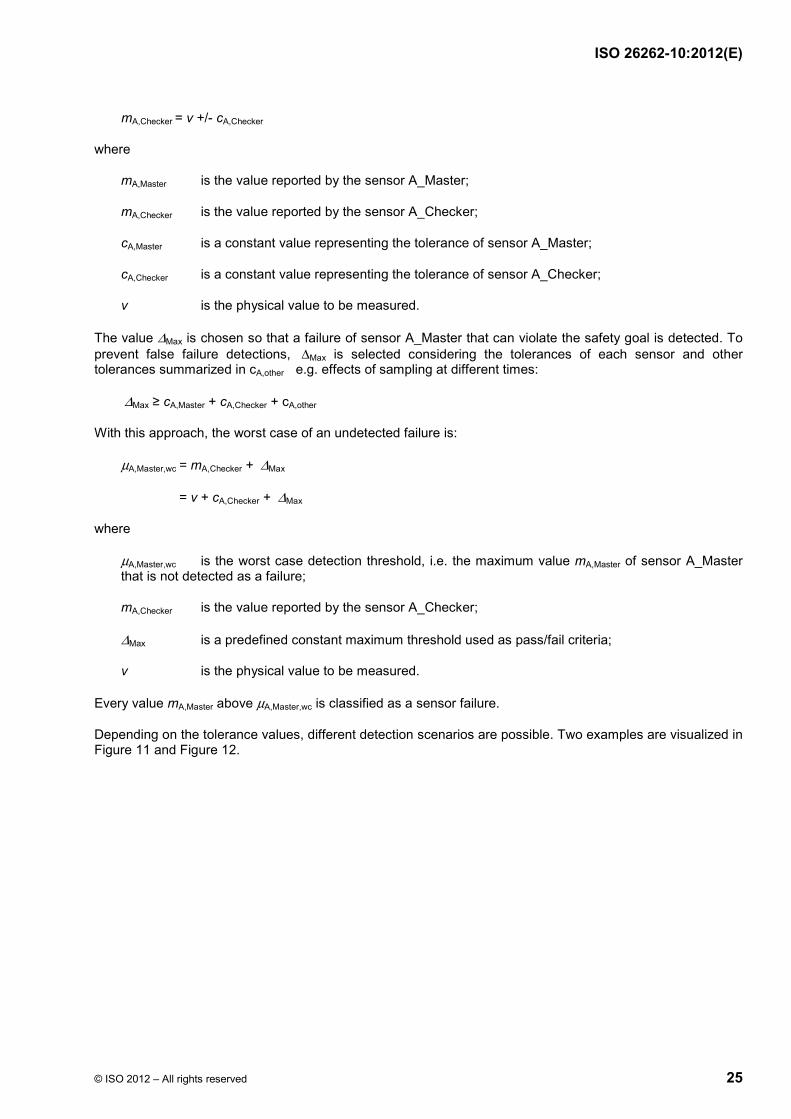
Key: 1 safety-related lower boundary µSafRel,A,min of sensor A_Master 2 return value of an ideal sensor with zero tolerance (as reference) 3 worst case detection threshold µA,Master,wc 4 dual-point faults, detected 5 detected faults with no potential to violate the safety goal 6 residual faults
Figure 11 — Example 1 of worst case detection threshold (too high)
Three regions are indicated by arrows in Figure 11.
Region 5 - “detected faults with no potential to violate the safety goal” are faults that are detected by the safety mechanism because they are above the worst case detection threshold µA,Master,wc but alone would not cause a violation of the safety goal because they are below the safety-related lower boundary µSafRel,A,min.
Region 4 - “dual-point faults, detected” are faults that could cause a violation of the safety goal but are detected and mitigated by the safety mechanism. They are above both the worst case detection threshold µA,Master,wc and the safety-related lower boundary µSafRel,A,min. The dual-point nature of these faults means that it would require a failure of the safety mechanism and the sensor to cause a potential violation of the safety goal.
Region 6 - “residual faults” are not detected by the safety mechanism and can directly lead to a violation of the safety goal. The region µSafRel,A,min < µA,Master,wc for v � [v1, v2] lies below the worst case detection threshold µA,Master,wc but above the safety-related lower boundary µSafRel,A,min.
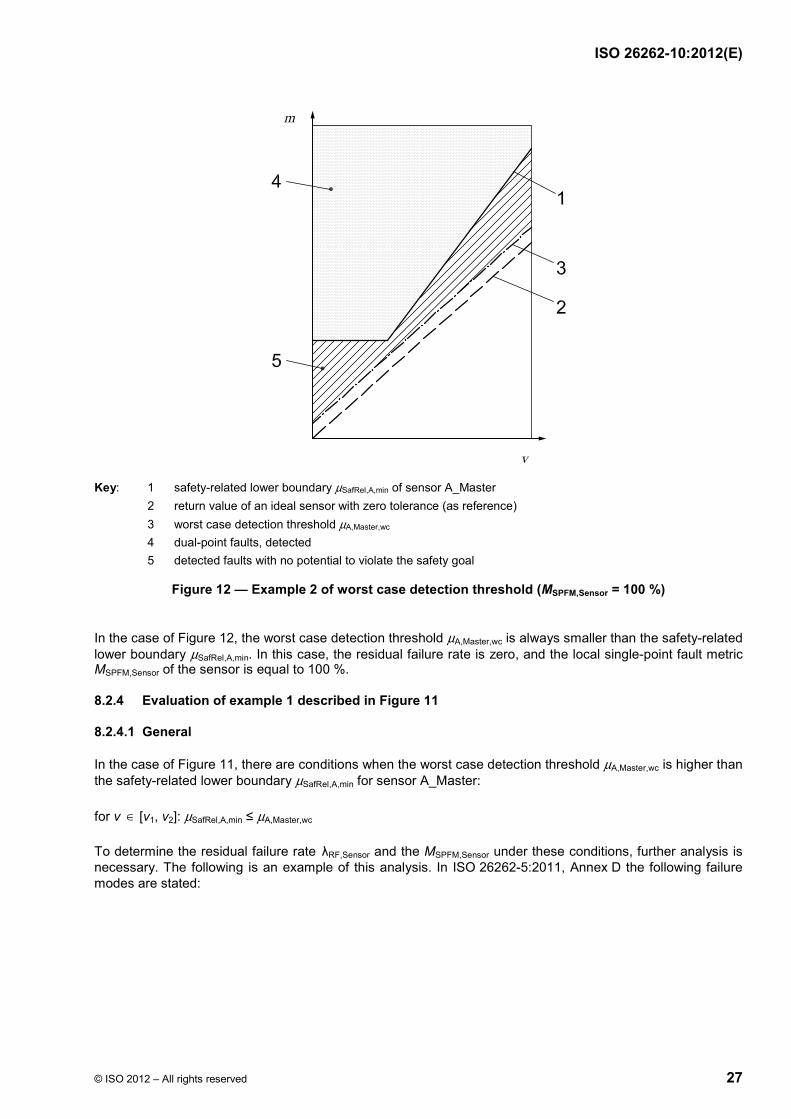
ISO 26262-10:2012(E)
© ISO 2012 – All rights reserved 27
Key: 1 safety-related lower boundary µSafRel,A,min of sensor A_Master 2 return value of an ideal sensor with zero tolerance (as reference) 3 worst case detection threshold µA,Master,wc 4 dual-point faults, detected 5 detected faults with no potential to violate the safety goal
Figure 12 — Example 2 of worst case detection threshold (MSPFM,Sensor = 100 %)
In the case of Figure 12, the worst case detection threshold µA,Master,wc is always smaller than the safety-related lower boundary µSafRel,A,min. In this case, the residual failure rate is zero, and the local single-point fault metric MSPFM,Sensor of the sensor is equal to 100 %.
8.2.4 Evaluation of example 1 described in Figure 11
8.2.4.1 General
In the case of Figure 11, there are conditions when the worst case detection threshold µA,Master,wc is higher than the safety-related lower boundary µSafRel,A,min for sensor A_Master:
for v ∈ [v1, v2]: µSafRel,A,min ≤ µA,Master,wc
To determine the residual failure rate λRF,Sensor and the MSPFM,Sensor under these conditions, further analysis is necessary. The following is an example of this analysis. In ISO 26262-5:2011, Annex D the following failure modes are stated:
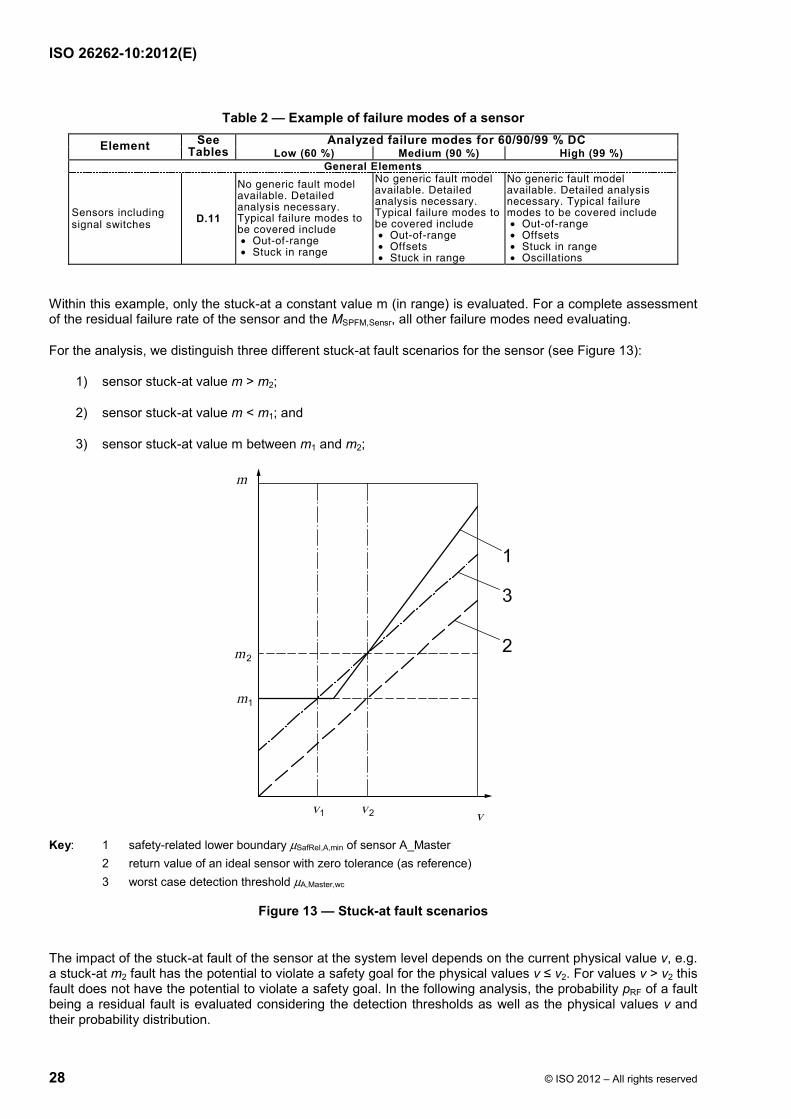
ISO 26262-10:2012(E)
28 © ISO 2012 – All rights reserved
Table 2 — Example of failure modes of a sensor Analyzed failure modes for 60/90/99 % DC Element See
Tables Low (60 %) Medium (90 %) High (99 %) General Elements
Sensors including signal switches D.11
No generic fault model available. Detailed analysis necessary. Typical failure modes to be covered include • Out-of-range • Stuck in range
No generic fault model available. Detailed analysis necessary. Typical failure modes to be covered include • Out-of-range • Offsets • Stuck in range
No generic fault model available. Detailed analysis necessary. Typical failure modes to be covered include • Out-of-range • Offsets • Stuck in range • Oscillations
Within this example, only the stuck-at a constant value m (in range) is evaluated. For a complete assessment of the residual failure rate of the sensor and the MSPFM,Sensr, all other failure modes need evaluating.
For the analysis, we distinguish three different stuck-at fault scenarios for the sensor (see Figure 13):
1) sensor stuck-at value m > m2;
2) sensor stuck-at value m < m1; and
3) sensor stuck-at value m between m1 and m2;
Key: 1 safety-related lower boundary µSafRel,A,min of sensor A_Master 2 return value of an ideal sensor with zero tolerance (as reference) 3 worst case detection threshold µA,Master,wc
Figure 13 — Stuck-at fault scenarios
The impact of the stuck-at fault of the sensor at the system level depends on the current physical value v, e.g. a stuck-at m2 fault has the potential to violate a safety goal for the physical values v ≤ v2. For values v > v2 this fault does not have the potential to violate a safety goal. In the following analysis, the probability pRF of a fault being a residual fault is evaluated considering the detection thresholds as well as the physical values v and their probability distribution.
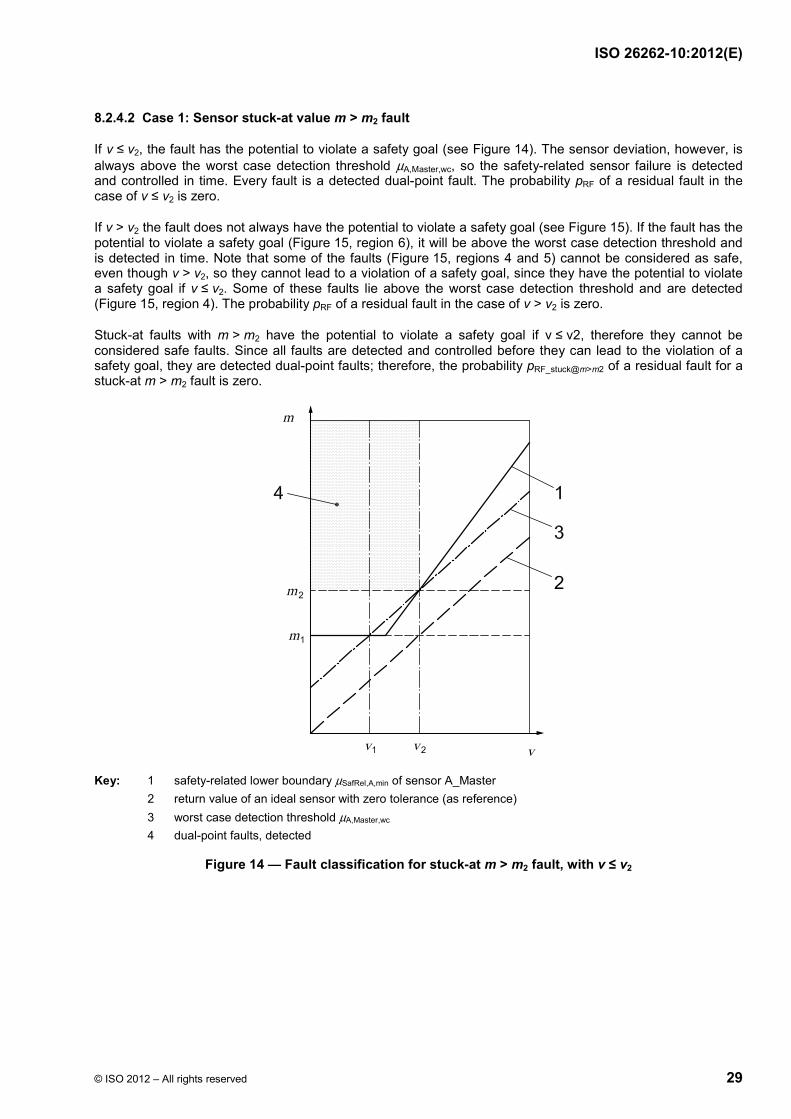
ISO 26262-10:2012(E)
© ISO 2012 – All rights reserved 29
8.2.4.2 Case 1: Sensor stuck-at value m > m2 fault
If v ≤ v2, the fault has the potential to violate a safety goal (see Figure 14). The sensor deviation, however, is always above the worst case detection threshold µA,Master,wc, so the safety-related sensor failure is detected and controlled in time. Every fault is a detected dual-point fault. The probability pRF of a residual fault in the case of v ≤ v2 is zero.
If v > v2 the fault does not always have the potential to violate a safety goal (see Figure 15). If the fault has the potential to violate a safety goal (Figure 15, region 6), it will be above the worst case detection threshold and is detected in time. Note that some of the faults (Figure 15, regions 4 and 5) cannot be considered as safe, even though v > v2, so they cannot lead to a violation of a safety goal, since they have the potential to violate a safety goal if v ≤ v2. Some of these faults lie above the worst case detection threshold and are detected (Figure 15, region 4). The probability pRF of a residual fault in the case of v > v2 is zero.
Stuck-at faults with m > m2 have the potential to violate a safety goal if v ≤ v2, therefore they cannot be considered safe faults. Since all faults are detected and controlled before they can lead to the violation of a safety goal, they are detected dual-point faults; therefore, the probability pRF_stuck@m>m2 of a residual fault for a stuck-at m > m2 fault is zero.
Key: 1 safety-related lower boundary µSafRel,A,min of sensor A_Master 2 return value of an ideal sensor with zero tolerance (as reference) 3 worst case detection threshold µA,Master,wc 4 dual-point faults, detected
Figure 14 — Fault classification for stuck-at m > m2 fault, with v ≤ v2
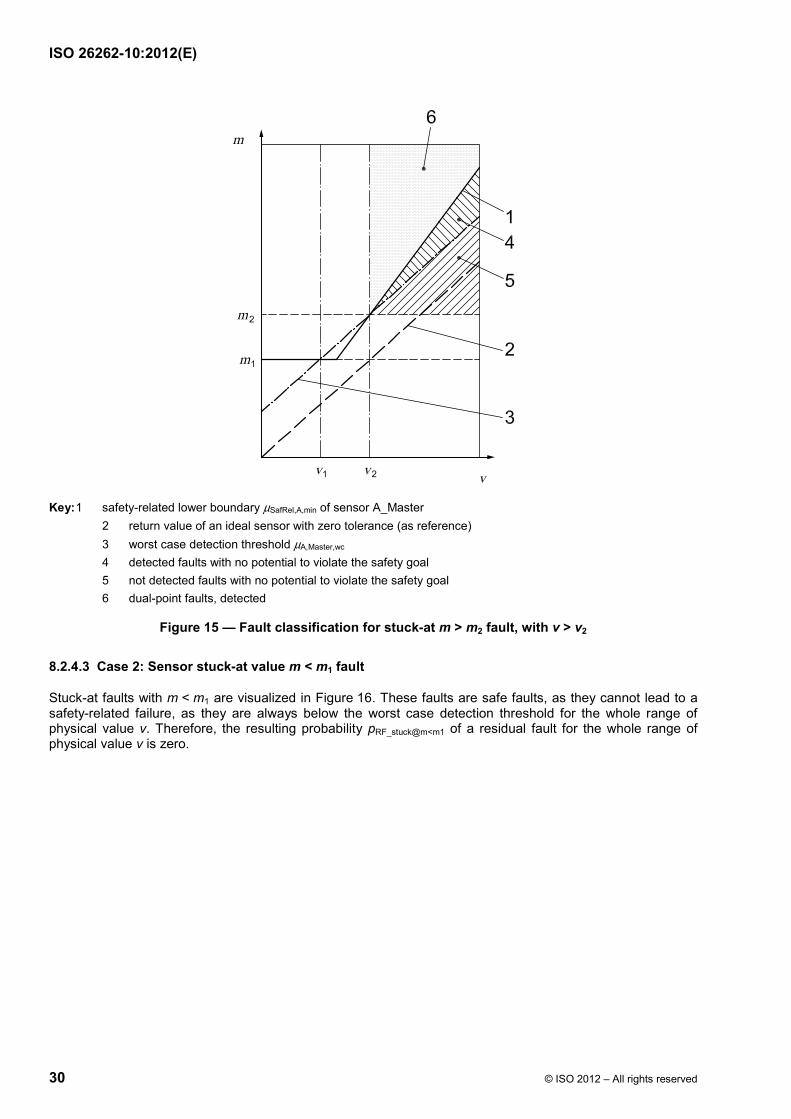
ISO 26262-10:2012(E)
30 © ISO 2012 – All rights reserved
Key: 1 safety-related lower boundary µSafRel,A,min of sensor A_Master 2 return value of an ideal sensor with zero tolerance (as reference) 3 worst case detection threshold µA,Master,wc 4 detected faults with no potential to violate the safety goal 5 not detected faults with no potential to violate the safety goal 6 dual-point faults, detected
Figure 15 — Fault classification for stuck-at m > m2 fault, with v > v2
8.2.4.3 Case 2: Sensor stuck-at value m < m1 fault
Stuck-at faults with m < m1 are visualized in Figure 16. These faults are safe faults, as they cannot lead to a safety-related failure, as they are always below the worst case detection threshold for the whole range of physical value v. Therefore, the resulting probability pRF_stuck@m<m1 of a residual fault for the whole range of physical value v is zero.

ISO 26262-10:2012(E)
© ISO 2012 – All rights reserved 31
Key: 1 safety-related lower boundary µSafRel,A,min of sensor A_Master 2 return value of an ideal sensor with zero tolerance (as reference) 3 worst case detection threshold µA,Master,wc 4 safe faults, undetected 5 safe faults, detected
Figure 16 — Fault classification for stuck-at m < m1 fault
8.2.4.4 Case 3: Sensor stuck-at value m ∈ [m1, m2] fault
The potential to violate a safety goal and the detection of a stuck-at fault with m � [m1, m2] depend on the current physical value v (see Figure 17), i.e. the probability of a violation of a safety goal depends on the current value of v at the time when the fault occurs. The probability of a stuck-at residual fault, pRF_stuck@m � [m1,
m2], is evaluated for three different intervals of v at the time of fault occurrence:
⎯ v < v1;
⎯ v1 ≤ v ≤ v2; and
⎯ v > v2.
For each of these conditions, the probability of a residual fault is evaluated separately. The final probability of a residual fault is calculated using the value of these three probabilities:
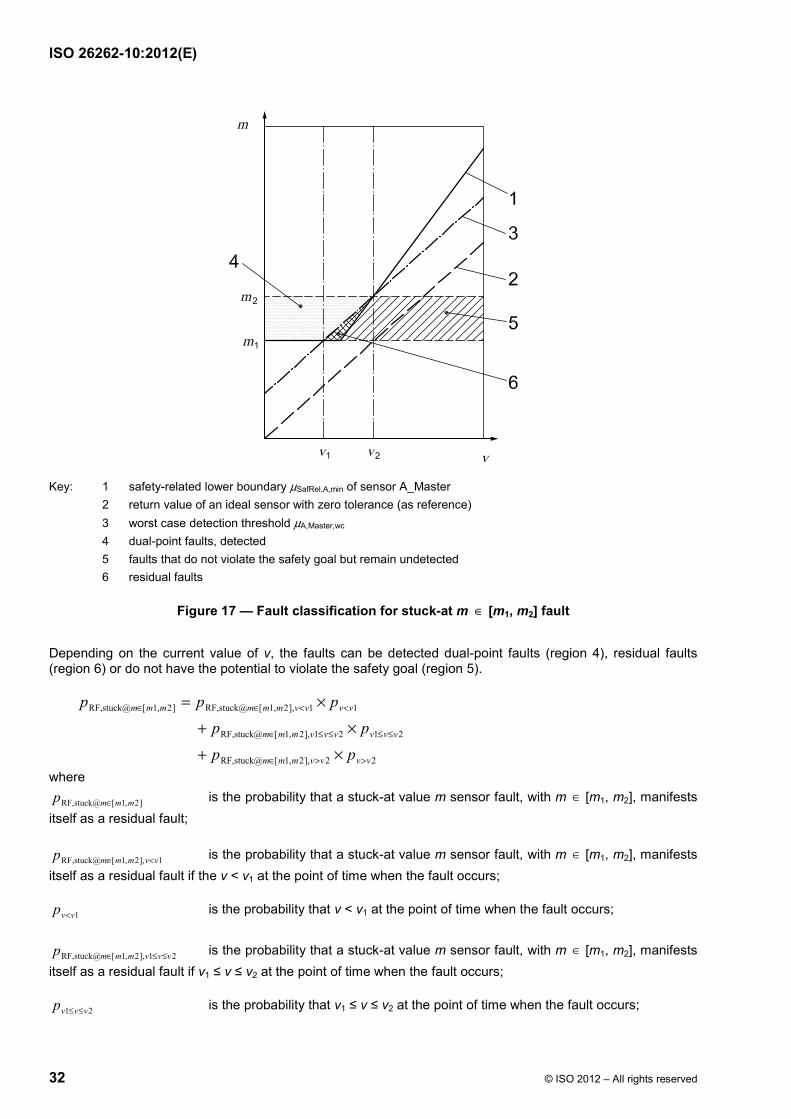
ISO 26262-10:2012(E)
32 © ISO 2012 – All rights reserved
Key: 1 safety-related lower boundary µSafRel,A,min of sensor A_Master 2 return value of an ideal sensor with zero tolerance (as reference) 3 worst case detection threshold µA,Master,wc 4 dual-point faults, detected 5 faults that do not violate the safety goal but remain undetected 6 residual faults
Figure 17 — Fault classification for stuck-at m ∈ [m1, m2] fault
Depending on the current value of v, the faults can be detected dual-point faults (region 4), residual faults (region 6) or do not have the potential to violate the safety goal (region 5).
22],2,1[stuck@RF,
2121],2,1[stuck@RF,
11],2,1[stuck@RF,]2,1[stuck@RF,
vvvvmmm
vvvvvvmmm
vvvvmmmmmm
pp
pp
ppp
>>∈
≤≤≤≤∈
<<∈∈
×+
×+
×=
where
]2,1[stuck@RF, mmmp ∈ is the probability that a stuck-at value m sensor fault, with m ∈ [m1, m2], manifests itself as a residual fault;
1],2,1[stuck@RF, vvmmmp <∈ is the probability that a stuck-at value m sensor fault, with m ∈ [m1, m2], manifests itself as a residual fault if the v < v1 at the point of time when the fault occurs;
1vvp < is the probability that v < v1 at the point of time when the fault occurs;
21],2,1[stuck@RF, vvvmmmp ≤≤∈ is the probability that a stuck-at value m sensor fault, with m ∈ [m1, m2], manifests itself as a residual fault if v1 ≤ v ≤ v2 at the point of time when the fault occurs;
21 vvvp ≤≤ is the probability that v1 ≤ v ≤ v2 at the point of time when the fault occurs;
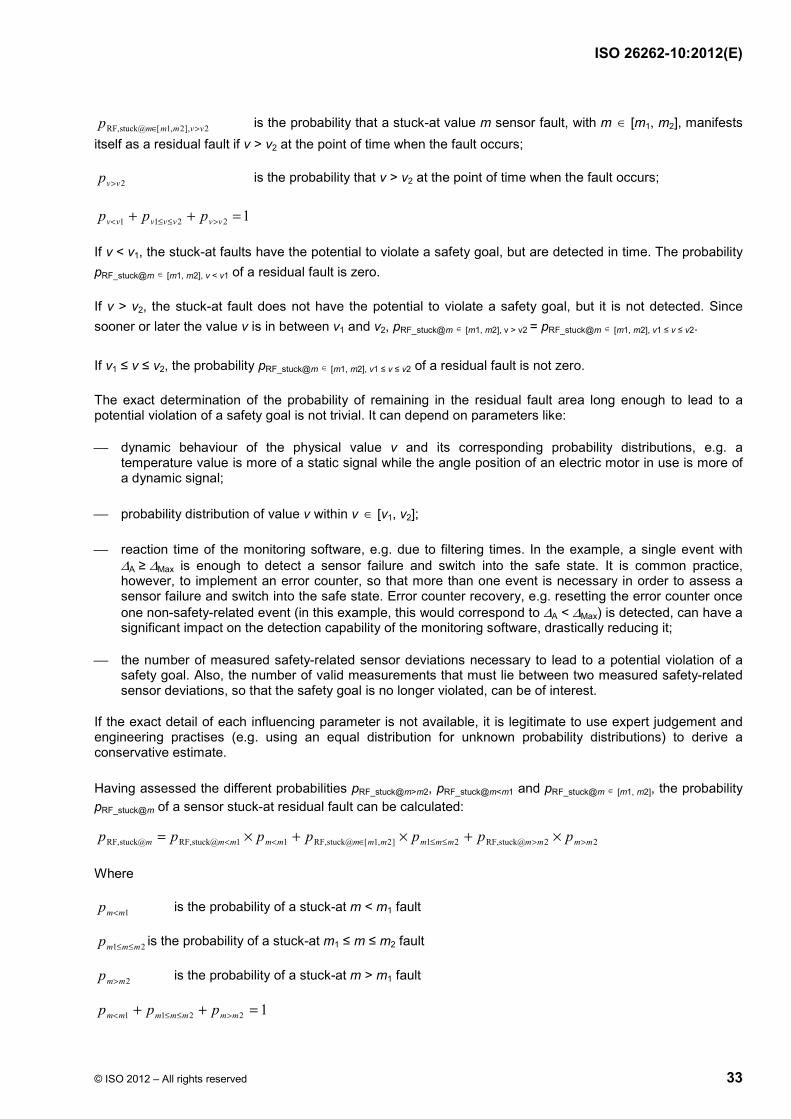
ISO 26262-10:2012(E)
© ISO 2012 – All rights reserved 33
2],2,1[stuck@RF, vvmmmp >∈ is the probability that a stuck-at value m sensor fault, with m ∈ [m1, m2], manifests itself as a residual fault if v > v2 at the point of time when the fault occurs;
2vvp > is the probability that v > v2 at the point of time when the fault occurs;
12211 =++ >≤≤< vvvvvvv ppp
If v < v1, the stuck-at faults have the potential to violate a safety goal, but are detected in time. The probability pRF_stuck@m ∈ [m1, m2], v < v1 of a residual fault is zero.
If v > v2, the stuck-at fault does not have the potential to violate a safety goal, but it is not detected. Since sooner or later the value v is in between v1 and v2, pRF_stuck@m ∈ [m1, m2], v > v2 = pRF_stuck@m ∈ [m1, m2], v1 ≤ v ≤ v2.
If v1 ≤ v ≤ v2, the probability pRF_stuck@m ∈ [m1, m2], v1 ≤ v ≤ v2 of a residual fault is not zero.
The exact determination of the probability of remaining in the residual fault area long enough to lead to a potential violation of a safety goal is not trivial. It can depend on parameters like:
⎯ dynamic behaviour of the physical value v and its corresponding probability distributions, e.g. a temperature value is more of a static signal while the angle position of an electric motor in use is more of a dynamic signal;
⎯ probability distribution of value v within v ∈ [v1, v2];
⎯ reaction time of the monitoring software, e.g. due to filtering times. In the example, a single event with ∆A ≥ ∆Max is enough to detect a sensor failure and switch into the safe state. It is common practice, however, to implement an error counter, so that more than one event is necessary in order to assess a sensor failure and switch into the safe state. Error counter recovery, e.g. resetting the error counter once one non-safety-related event (in this example, this would correspond to ∆A < ∆Max) is detected, can have a significant impact on the detection capability of the monitoring software, drastically reducing it;
⎯ the number of measured safety-related sensor deviations necessary to lead to a potential violation of a safety goal. Also, the number of valid measurements that must lie between two measured safety-related sensor deviations, so that the safety goal is no longer violated, can be of interest.
If the exact detail of each influencing parameter is not available, it is legitimate to use expert judgement and engineering practises (e.g. using an equal distribution for unknown probability distributions) to derive a conservative estimate.
Having assessed the different probabilities pRF_stuck@m>m2, pRF_stuck@m<m1 and pRF_stuck@m ∈ [m1, m2], the probability pRF_stuck@m of a sensor stuck-at residual fault can be calculated:
22stuck@RF,21]2,1[stuck@RF,11stuck@RF,stuck@RF, mmmmmmmmmmmmmmm ppppppp >>≤≤∈<< ×+×+×=
Where
1mmp < is the probability of a stuck-at m < m1 fault
21 mmmp ≤≤ is the probability of a stuck-at m1 ≤ m ≤ m2 fault
2mmp > is the probability of a stuck-at m > m1 fault
12211 =++ >≤≤< mmmmmmm ppp
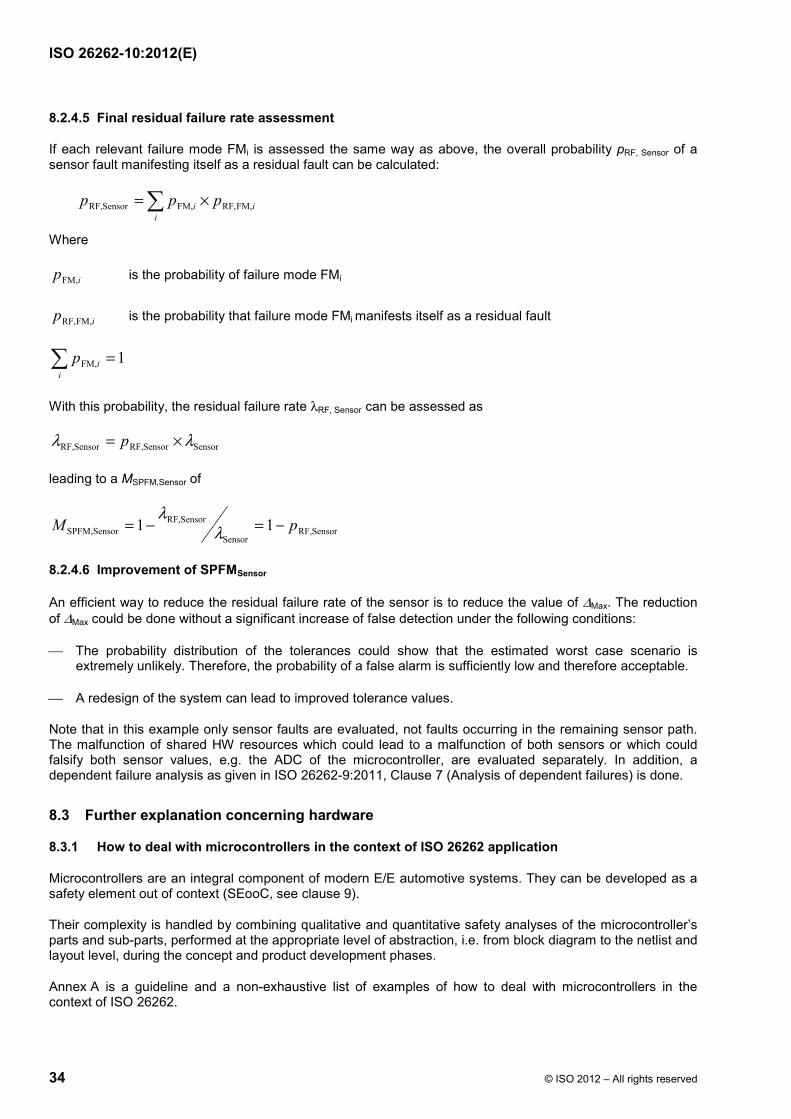
ISO 26262-10:2012(E)
34 © ISO 2012 – All rights reserved
8.2.4.5 Final residual failure rate assessment
If each relevant failure mode FMi is assessed the same way as above, the overall probability pRF, Sensor of a sensor fault manifesting itself as a residual fault can be calculated:
∑ ×=i
ii ppp FM,RF,FM,SensorRF,
Where
ipFM, is the probability of failure mode FMi
ip FM,RF, is the probability that failure mode FMi manifests itself as a residual fault
∑ =i
ip 1FM,
With this probability, the residual failure rate λRF, Sensor can be assessed as
SensorSensorRF,SensorRF, λλ ×= p
leading to a MSPFM,Sensor of
SensorRF,Sensor
SensorRF,SensorSPFM, 11 pM −=−= λ
λ
8.2.4.6 Improvement of SPFMSensor
An efficient way to reduce the residual failure rate of the sensor is to reduce the value of ∆Max. The reduction of ∆Max could be done without a significant increase of false detection under the following conditions:
⎯ The probability distribution of the tolerances could show that the estimated worst case scenario is extremely unlikely. Therefore, the probability of a false alarm is sufficiently low and therefore acceptable.
⎯ A redesign of the system can lead to improved tolerance values.
Note that in this example only sensor faults are evaluated, not faults occurring in the remaining sensor path. The malfunction of shared HW resources which could lead to a malfunction of both sensors or which could falsify both sensor values, e.g. the ADC of the microcontroller, are evaluated separately. In addition, a dependent failure analysis as given in ISO 26262-9:2011, Clause 7 (Analysis of dependent failures) is done.
8.3 Further explanation concerning hardware
8.3.1 How to deal with microcontrollers in the context of ISO 26262 application
Microcontrollers are an integral component of modern E/E automotive systems. They can be developed as a safety element out of context (SEooC, see clause 9).
Their complexity is handled by combining qualitative and quantitative safety analyses of the microcontroller’s parts and sub-parts, performed at the appropriate level of abstraction, i.e. from block diagram to the netlist and layout level, during the concept and product development phases.
Annex A is a guideline and a non-exhaustive list of examples of how to deal with microcontrollers in the context of ISO 26262.
ISO 26262-10:2012(E)
© ISO 2012 – All rights reserved 35
It describes a method for the calculation of failure rates of a microcontroller, including how to consider permanent and transient faults.
It includes examples of:
⎯ dependent failures analysis;
⎯ avoidance of systematic failures during microcontroller design;
⎯ verification of the safety mechanisms of the microcontroller; and
⎯ consideration of the microcontroller stand-alone analysis at the system level.
8.3.2 Safety analysis methods
Annex B discusses techniques for analysing system fault modes, including inductive and deductive analysis, and includes an example of fault tree analysis.
8.3.3 Consideration of exposure duration in the calculation of Probabilistic Metric for random Hardware Failures (PMHF)
As described in ISO 26262-5:2011, 9.4.2.3, quantitative analysis provides evidence that target values of requirement ISO 26262-5:2011, 9.4.2.1 have been achieved. As given in ISO 26262-5:2011, 9.4.2.3, this quantitative analysis considers the exposure duration in the case of dual-point faults.
Based on the Note 2 in ISO 26262-5:2011, 9.4.2.3, the exposure duration starts as soon as the fault occurs.
It includes:
⎯ the multiple-point fault detection interval associated with each safety mechanism, or the lifetime of the vehicle if the fault is not indicated to the driver (latent fault);
⎯ the maximum duration of a trip (in the case where the driver is requested to stop in a safe manner); and
⎯ the average time interval between a warning and the vehicle repair in a workshop (in the case where the driver is alerted to have the vehicle repaired).
The following example is provided to show a possible way to consider the exposure duration. In this example, it is assumed that an intended functionality (the mission block “m”) is supervised by a safety mechanism “sm”.
The value of the probabilistic metric for random hardware failures MPMHF, considering the conditional probability that a failure of the safety mechanism is followed by a failure of the mission block, can be calculated using the formula:
Lifetime
SMdetectedDPF,sm,LifetimelatentDPF,sm,LifetimeDPFm,LifetimeRFm,PMHF
)(5,0T
TTTM
τλλλλ ×+××××+×=
Where
MPMHF is the value for the probabilistic metric for random hardware failures (PMHF)
λm,RF is the residual failure rate of the intended functionality (the mission block “m”)
λm,DPF is the dual-point failure rate of the mission block “m”
TLifetime is the vehicle lifetime
ISO 26262-10:2012(E)
36 © ISO 2012 – All rights reserved
λsm,DPF,latent is the latent dual-point failure rate of the safety mechanism “sm”
λsm,DPF,detected is the detected dual-point failure rate of the safety mechanism “sm”
SMτ is the multiple-point fault detection interval of the safety mechanism “sm”
If the term SMdetectedDPF,sm,DPFm, ** τλλ , representing the probability of a mission failure in combination
with a failure of the corresponding safety mechanism within one SMτ , is very small [e.g. if SMτ is in the order of one driving cycle (even with λm,DPF = λsm,latent = 1000 FIT the contribution ≤ 10-12 1/h within this example)], it can be neglected, simplifying the formula:
LifetimelatentDPF,sm,DPFm,RFPMHF 5,0 TM ×××+= λλλ
If conditional probability does not apply, e.g. the order of failure is irrelevant, the formula changes to
LifetimelatentDPF,sm,DPFm,RFPMHF TM ××+= λλλ
9 Safety element out of context
9.1 Safety element out of context development
The automotive industry develops generic elements for different applications and for different customers. These generic elements can be developed independently by different organizations. In such cases, assumptions are made about the requirements and the design, including the safety requirements that are allocated to the element by higher design levels and on the design external to the element.
Such an element can be developed by treating it as a safety element out of context (SEooC). An SEooC is a safety-related element which is not developed for a specific item. This means it is not developed in the context of a particular vehicle.
An SEooC can be a system, an array of systems, a subsystem, a software component, a hardware component or a part. Examples of SEooCs include system controllers, ECUs, microcontrollers, software implementing a communication protocol or an AUTOSAR software component.
An SEooC cannot be an item as the development of an item always requires the context of a vehicle intended for series production. In the case where the SEooC is a system, this system is not developed in this context, and therefore it is not an item.
SEooCs differ from qualified components described in ISO 26262-8:2011, Clause 12 (Qualification of software components) and ISO 26262-8:2011, Clause 13 (Qualification of hardware components):
⎯ An SEooC is developed, based on assumptions, in accordance with ISO 26262. It is intended to be used in multiple different items when the validity of its assumptions can be established during integration of the SEooC.
⎯ Qualification of software and hardware components addresses the use of pre-existing elements for an item developed under ISO 26262. The components are not necessarily designed for reusability nor developed under ISO 26262.
Table 3 describes the intended use of qualification, safety element out of context and the proven in use argument for different software elements.
The classification of the software components in the Table 3 is as described in ISO 26262-6:2011, 7.4.6.
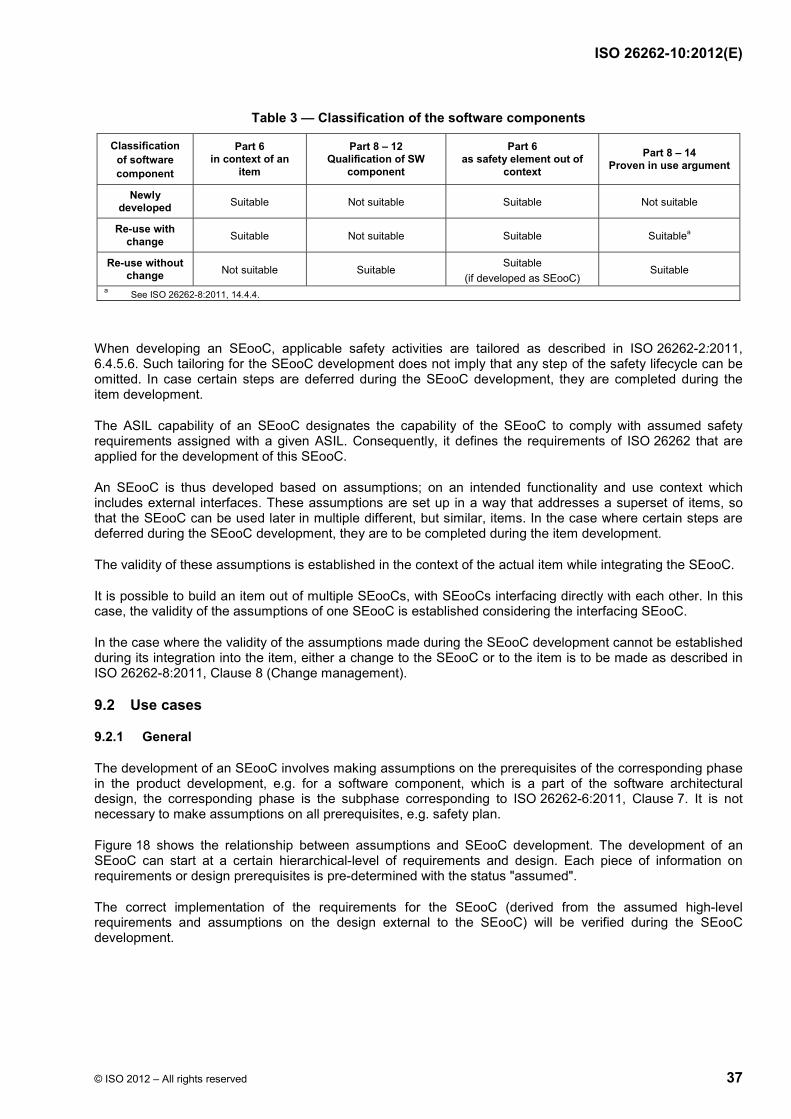
ISO 26262-10:2012(E)
© ISO 2012 – All rights reserved 37
Table 3 — Classification of the software components
Classification of software component
Part 6 in context of an
item
Part 8 – 12 Qualification of SW
component
Part 6 as safety element out of
context
Part 8 – 14 Proven in use argument
Newly developed Suitable Not suitable Suitable Not suitable
Re-use with change Suitable Not suitable Suitable Suitablea
Re-use without change Not suitable Suitable Suitable
(if developed as SEooC) Suitable a See ISO 26262-8:2011, 14.4.4.
When developing an SEooC, applicable safety activities are tailored as described in ISO 26262-2:2011, 6.4.5.6. Such tailoring for the SEooC development does not imply that any step of the safety lifecycle can be omitted. In case certain steps are deferred during the SEooC development, they are completed during the item development.
The ASIL capability of an SEooC designates the capability of the SEooC to comply with assumed safety requirements assigned with a given ASIL. Consequently, it defines the requirements of ISO 26262 that are applied for the development of this SEooC.
An SEooC is thus developed based on assumptions; on an intended functionality and use context which includes external interfaces. These assumptions are set up in a way that addresses a superset of items, so that the SEooC can be used later in multiple different, but similar, items. In the case where certain steps are deferred during the SEooC development, they are to be completed during the item development.
The validity of these assumptions is established in the context of the actual item while integrating the SEooC.
It is possible to build an item out of multiple SEooCs, with SEooCs interfacing directly with each other. In this case, the validity of the assumptions of one SEooC is established considering the interfacing SEooC.
In the case where the validity of the assumptions made during the SEooC development cannot be established during its integration into the item, either a change to the SEooC or to the item is to be made as described in ISO 26262-8:2011, Clause 8 (Change management).
9.2 Use cases
9.2.1 General
The development of an SEooC involves making assumptions on the prerequisites of the corresponding phase in the product development, e.g. for a software component, which is a part of the software architectural design, the corresponding phase is the subphase corresponding to ISO 26262-6:2011, Clause 7. It is not necessary to make assumptions on all prerequisites, e.g. safety plan.
Figure 18 shows the relationship between assumptions and SEooC development. The development of an SEooC can start at a certain hierarchical-level of requirements and design. Each piece of information on requirements or design prerequisites is pre-determined with the status "assumed".
The correct implementation of the requirements for the SEooC (derived from the assumed high-level requirements and assumptions on the design external to the SEooC) will be verified during the SEooC development.
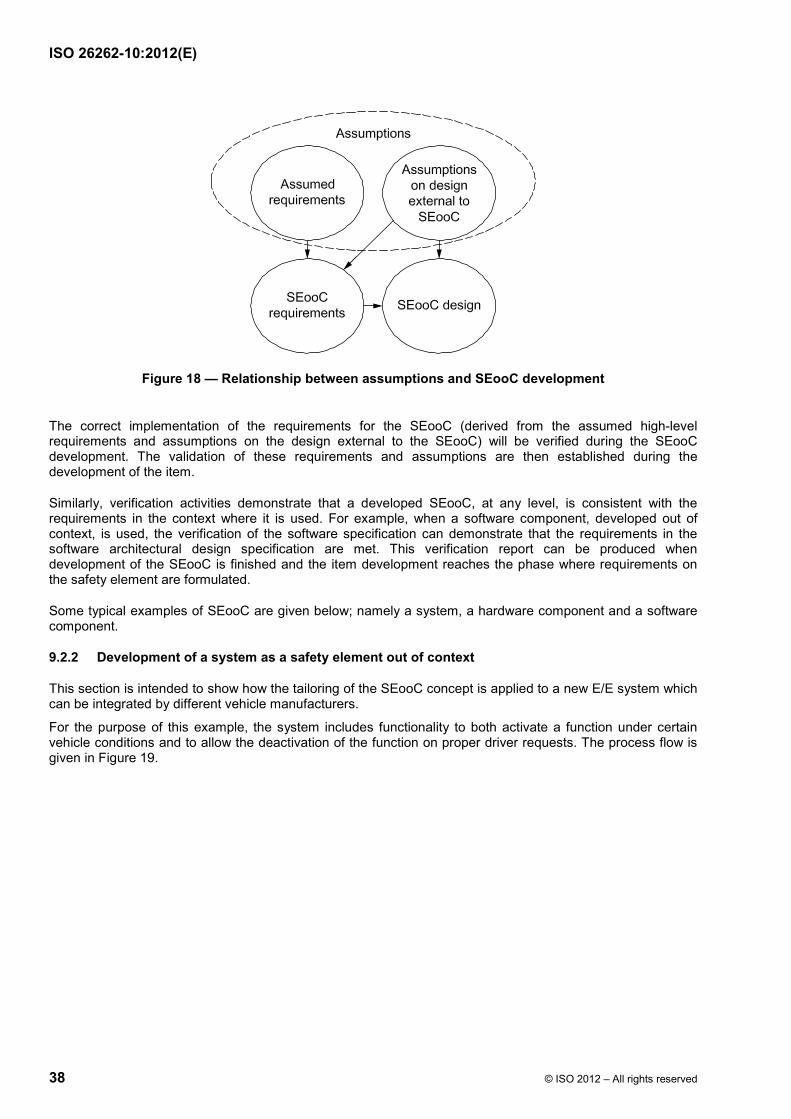
ISO 26262-10:2012(E)
38 © ISO 2012 – All rights reserved
Figure 18 — Relationship between assumptions and SEooC development
The correct implementation of the requirements for the SEooC (derived from the assumed high-level requirements and assumptions on the design external to the SEooC) will be verified during the SEooC development. The validation of these requirements and assumptions are then established during the development of the item.
Similarly, verification activities demonstrate that a developed SEooC, at any level, is consistent with the requirements in the context where it is used. For example, when a software component, developed out of context, is used, the verification of the software specification can demonstrate that the requirements in the software architectural design specification are met. This verification report can be produced when development of the SEooC is finished and the item development reaches the phase where requirements on the safety element are formulated.
Some typical examples of SEooC are given below; namely a system, a hardware component and a software component.
9.2.2 Development of a system as a safety element out of context
This section is intended to show how the tailoring of the SEooC concept is applied to a new E/E system which can be integrated by different vehicle manufacturers.
For the purpose of this example, the system includes functionality to both activate a function under certain vehicle conditions and to allow the deactivation of the function on proper driver requests. The process flow is given in Figure 19.
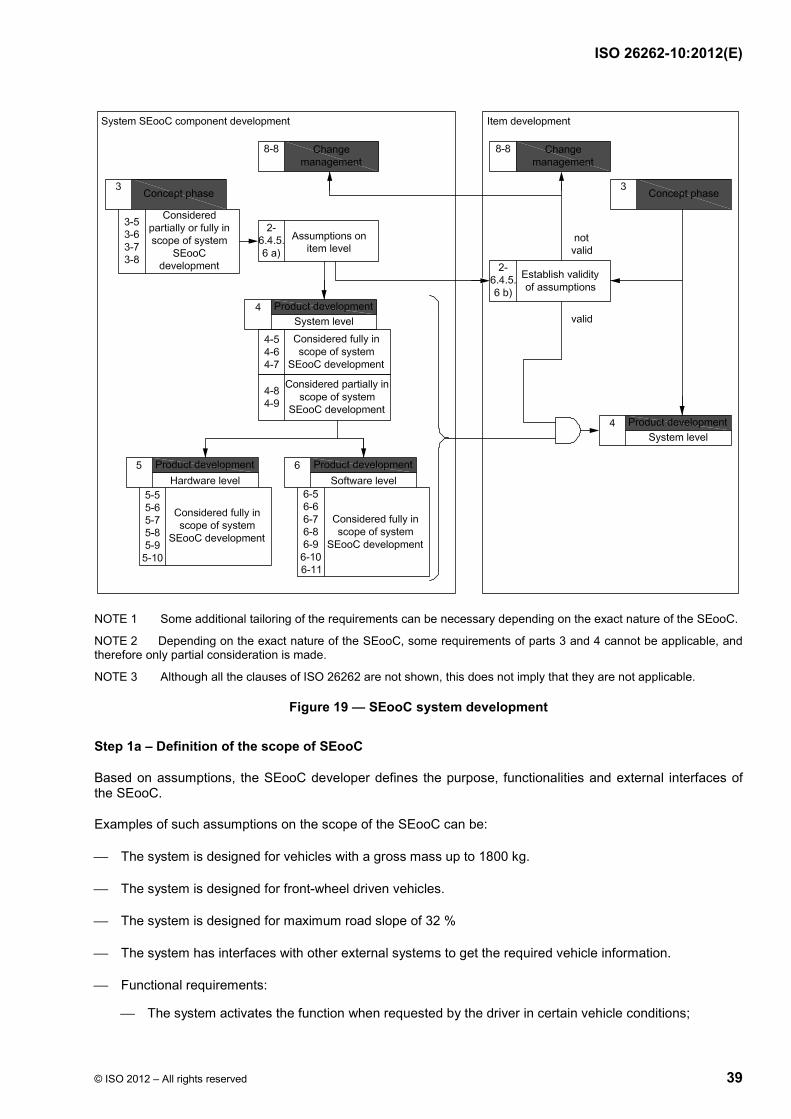
ISO 26262-10:2012(E)
© ISO 2012 – All rights reserved 39
NOTE 1 Some additional tailoring of the requirements can be necessary depending on the exact nature of the SEooC.
NOTE 2 Depending on the exact nature of the SEooC, some requirements of parts 3 and 4 cannot be applicable, and therefore only partial consideration is made.
NOTE 3 Although all the clauses of ISO 26262 are not shown, this does not imply that they are not applicable.
Figure 19 — SEooC system development
Step 1a – Definition of the scope of SEooC
Based on assumptions, the SEooC developer defines the purpose, functionalities and external interfaces of the SEooC.
Examples of such assumptions on the scope of the SEooC can be:
⎯ The system is designed for vehicles with a gross mass up to 1800 kg.
⎯ The system is designed for front-wheel driven vehicles.
⎯ The system is designed for maximum road slope of 32 %
⎯ The system has interfaces with other external systems to get the required vehicle information.
⎯ Functional requirements:
⎯ The system activates the function when requested by the driver in certain vehicle conditions;
ISO 26262-10:2012(E)
40 © ISO 2012 – All rights reserved
⎯ The system deactivates the function when requested by the driver.
Step 1b – Assumptions on safety requirements for the SEooC
The development of an SEooC needs to make assumptions about the item definition, the safety goals of the item and the corresponding functional safety requirements related to the SEooC functionality in order to iden-tify the technical safety requirements of the SEooC.
Examples of assumptions on the functional safety requirements allocated to the SEooC can be:
⎯ The system does not activate the function at high vehicle speeds (ASIL x).
⎯ The system does not deactivate the functionality when the driver request is not detected (ASIL y).
In order to achieve the assumed safety goals, specific assumptions on the context are defined.
Examples of assumptions on the context of the SEooC can be:
⎯ An external source will provide information at the requested ASIL enabling the system to detect the proper vehicle condition (ASIL x).
⎯ An external source will provide information about the driver request at the requested ASIL (ASIL y).
Step 2 – Development of the SEooC
When the technical safety requirements have been derived from the assumed functional safety requirements of the item, the SEooC is developed following the requirements of ISO 26262.
Step 3 – Work products
At the end of the SEooC development, the work products that show that the derived technical safety requirements are fulfilled are made available. All necessary information from the work products is then provided to the item integrator, including SEooC safety requirements and the assumptions made on the context.
Step 4 – Integration of the SEooC into the item
During item development, the safety goals and the functional safety requirements are specified. The functional safety requirements of the item are matched with the functional safety requirements assumed for the SEooC to establish their validity.
In the case of an SEooC assumption mismatch, a change management activity, beginning with an impact analysis, is conducted as described by ISO 26262-8:2011, Clause 8 (Change management). Potential outcomes include:
⎯ the difference can be deemed to be acceptable with regard to the achievement of the safety goal, and no action is taken;
⎯ the difference can be deemed to impact the achievement of the safety goal, and a change can be necessary to either the item definition or the functional safety concept;
⎯ the difference can be deemed to impact the safety goal, and a change is required to the SEooC component (including possibly a change of component).
9.2.3 Development of a hardware component as a safety element out of context
9.2.3.1 General
This section uses the microcontroller (MCU) example of Annex A as an example hardware component SEooC. The process flow is given in Figure 20.
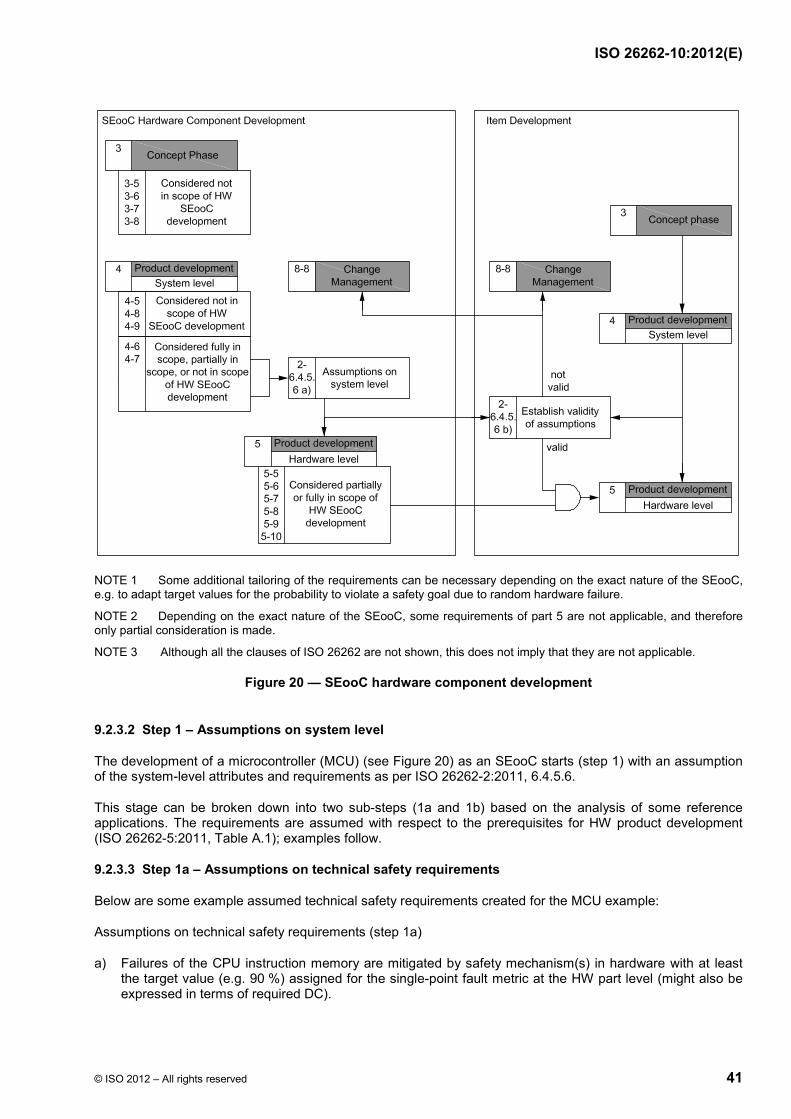
ISO 26262-10:2012(E)
© ISO 2012 – All rights reserved 41
NOTE 1 Some additional tailoring of the requirements can be necessary depending on the exact nature of the SEooC, e.g. to adapt target values for the probability to violate a safety goal due to random hardware failure.
NOTE 2 Depending on the exact nature of the SEooC, some requirements of part 5 are not applicable, and therefore only partial consideration is made.
NOTE 3 Although all the clauses of ISO 26262 are not shown, this does not imply that they are not applicable.
Figure 20 — SEooC hardware component development
9.2.3.2 Step 1 – Assumptions on system level
The development of a microcontroller (MCU) (see Figure 20) as an SEooC starts (step 1) with an assumption of the system-level attributes and requirements as per ISO 26262-2:2011, 6.4.5.6.
This stage can be broken down into two sub-steps (1a and 1b) based on the analysis of some reference applications. The requirements are assumed with respect to the prerequisites for HW product development (ISO 26262-5:2011, Table A.1); examples follow.
9.2.3.3 Step 1a – Assumptions on technical safety requirements
Below are some example assumed technical safety requirements created for the MCU example:
Assumptions on technical safety requirements (step 1a)
a) Failures of the CPU instruction memory are mitigated by safety mechanism(s) in hardware with at least the target value (e.g. 90 %) assigned for the single-point fault metric at the HW part level (might also be expressed in terms of required DC).

ISO 26262-10:2012(E)
42 © ISO 2012 – All rights reserved
b) The contribution of the MCU to the total probability of violation of a safety goal is no more than 10 % of the allowed probability for the relevant ASIL.
c) The MCU implements a safe state defined as all I/O driving outputs to a low state when reset is asserted.
d) Any safety mechanisms implemented related to the processing function completes in less than 10 milliseconds (assigned portion of the fault tolerant time interval).
e) Debug interfaces of the MCU are not used during safety-related operation. Therefore, any faults in the debug logic will be considered safe faults.
f) A memory protection unit is present to provide the possibility of separating software tasks with different ASILs.
ASIL capability is established at this step.
9.2.3.4 Step 1b – Assumptions on system-level design
Some examples of system-level design assumptions, external to the SEooC:
a) The system will implement a safety mechanism on the power supply to the MCU to detect over voltage and under voltage failure modes.
b) The system will implement a windowed watchdog safety mechanism external to the MCU to detect either clocking or program sequence failures of the MCU.
c) A software test will be implemented to detect latent faults in the EDC safety mechanism of the MCU (SM4).
d) A SW-based test (SM2) is executed at key-on to verify the absence of latent faults in the logical monitor-ing of program sequence of CPU (SM1).
9.2.3.5 Step 2 – Execution of hardware development
On the basis of these decisions (assumed technical safety requirements and assumptions related to the design external to the SEooC), the SEooC is developed (step 2) as written in ISO 26262-5, and each applicable work product is prepared. For example, the evaluation of safety goal violations due to random HW failures (see work product written in ISO 26262-5:2011, 9.5.1) is done considering the SEooC assumptions including any budget for FIT rate found in the assumed technical safety requirements. On the basis of the SEooC assumptions, the safety analyses and the analysis of dependent failures internal to the MCU are performed according to ISO 26262-9.
For the MCU example in A.3.5, the safety requirement a) is fulfilled because the single-point fault metric of memory is greater than the 90 % target assigned at that HW part level (99,8 %, permanent faults and 99,69 % transient faults). The assumption c) on system design is implemented by safety mechanism SM4.
9.2.3.6 Step 3 – Work products
At the end of the MCU product development (step 3), the necessary information from the work products is provided to the system integrator; this includes the following documentation: assumed requirements, assumptions related to the design external to the SEooC and applicable work products of ISO26262 (for example, the report on the probability of a violation of a safety goal due to random HW failure).
9.2.3.7 Step 4 – Integration of the SEooC into the item
When the MCU developed as an SEooC is considered in the context of the item HW product development phase, the validity of all SEooC assumptions including SEooC assumed technical safety requirements and the assumptions related to the design external to the SEooC are established (step 4). It is plausible that mismatches between SEooC assumptions and system requirements will occur. For example, the item
ISO 26262-10:2012(E)
© ISO 2012 – All rights reserved 43
developer could decide not to implement an assumed external component. As a consequence, the evaluation of safety goal violations due to random HW failures done by the SEooC developer might no longer be consistent with the item.
In the case of an SEooC assumption mismatch, a change management activity beginning with impact analysis is conducted as written in ISO 26262-8:2011, Clause 8 (Change management). Potential outcomes include:
⎯ The difference can be deemed to be acceptable with regard to the achievement of the safety goal, and no action is taken.
⎯ The difference can be deemed to impact the achievement of the safety goal, and a change can be necessary to either the functional safety concept or the technical safety requirements.
⎯ The difference can be deemed to impact the achievement of the safety goal, and a change is required to the SEooC component (including possibly a change of component).
⎯ The difference can be deemed to impact the achievement of the safety goal, and therefore safety metrics are recalculated, but the recalculated metrics show that the design meets the system targets, so no change is necessary.
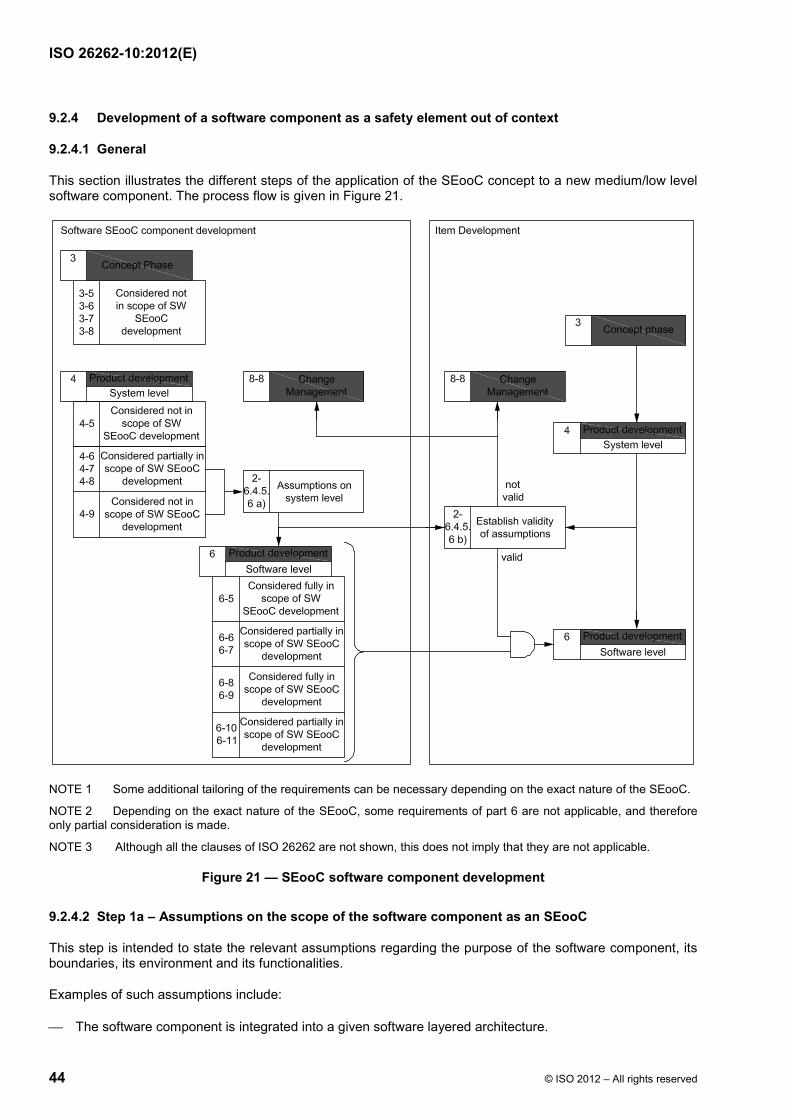
ISO 26262-10:2012(E)
44 © ISO 2012 – All rights reserved
9.2.4 Development of a software component as a safety element out of context
9.2.4.1 General
This section illustrates the different steps of the application of the SEooC concept to a new medium/low level software component. The process flow is given in Figure 21.
NOTE 1 Some additional tailoring of the requirements can be necessary depending on the exact nature of the SEooC.
NOTE 2 Depending on the exact nature of the SEooC, some requirements of part 6 are not applicable, and therefore only partial consideration is made.
NOTE 3 Although all the clauses of ISO 26262 are not shown, this does not imply that they are not applicable.
Figure 21 — SEooC software component development
9.2.4.2 Step 1a – Assumptions on the scope of the software component as an SEooC
This step is intended to state the relevant assumptions regarding the purpose of the software component, its boundaries, its environment and its functionalities.
Examples of such assumptions include:
⎯ The software component is integrated into a given software layered architecture.
ISO 26262-10:2012(E)
© ISO 2012 – All rights reserved 45
⎯ Any potential interference caused by the software component is detected and handled by its environment.
⎯ The software component provides the following functions: list of the functional software requirements.
9.2.4.3 Step 1b – Assumptions on the safety requirements of the software component
Step 1b is intended to make assumptions on higher level safety requirements that potentially impact the software component in order to derive its software safety requirements. For example, if a given set of data calculated by the software component is assumed to be of high integrity (ASIL x), then the resulting software safety requirements allocated to the SEooC can be:
⎯ The software component detects any corruption on the following input data: list of input data (ASIL x);
⎯ The software component signals the following error conditions: list of error conditions (ASIL x);
⎯ A default value is returned with a fault status for any error condition detected (ASIL x);
⎯ The software component returns the following results coded with CRC and a status (ASIL x).
9.2.4.4 Step 2 – Development of the software component
Once the necessary assumptions on the software component are explicitly stated, the SEooC is developed in accordance with the requirements of ISO 26262-6 corresponding to its ASIL capability (ASIL x in this example). All applicable work products are made available for further integration in different contexts, including the work products related to the verification of the assumed software safety requirements.
9.2.4.5 Step 3 – Integration of the software component in a new particular context
Before the software component is integrated with other software components in a new particular context, the validity of all the assumptions made on this SEooC are checked with regard to this context. This includes the assumed software safety requirements with their ASIL capability and all the assumptions made on the purpose, boundaries, environment and functionalities of the software component (see 9.2.4.2 and 9.2.4.3).
In the case where some assumptions regarding the software component do not fit with this new context, an impact analysis is initiated in accordance with ISO 26262-8:2011, Clause 8 (Change management). Potential outcomes of the impact analysis include:
⎯ The discrepancies are acceptable with regard to the achievement of the safety requirements applicable at the software architectural design level, and no further action is taken.
⎯ The discrepancies impact the achievement of the safety requirements applicable at the software architectural design level. Depending on the particular case, a change is applied in accordance with ISO 26262-8:2011, Clause 8 (Change management), either to the software component, or to the safety requirements applicable at the software architectural design level.
NOTE: In the case where the integration of a software component in a particular software architectural design results in the coexistence of software safety-related elements that have different ASILs assigned, the criteria for coexistence of elements are fulfilled as described in ISO 26262-9:2011, Clause 6 (Criteria for coexistence of elements), or alternatively the elements with lower ASILs are upgraded to the higher ASIL.
10 An example of proven in use argument
10.1 General
The item and its requirements described in this clause are an example. The safety goal, its ASIL and the following requirements are given to illustrate the proven in use argument defined in ISO 26262-8:2011, Clause 14 (Proven in use argument). This example does not reflect what the application of ISO 26262 on a similar real-life example would be.
ISO 26262-10:2012(E)
46 © ISO 2012 – All rights reserved
10.2 Item definition and definition of the proven in use candidate
A vehicle manufacturer wants to integrate a new functionality into a new vehicle. For the purpose of this example, the item implementing this functionality is composed of sensors, one ECU that includes the complete hardware and software necessary to the functionality, and one actuator.
The incorrect activation of the functionality is ranked ASIL C by the vehicle manufacturer. The corresponding safety goal is derived into an ASIL C functional safety requirement allocated to the ECU.
The supplier of the ECU proposes to carry over an existing ECU already in the field.
The differences between the previous use of the ECU and its intended use in the new application are analysed. The analysis shows that the software has to be modified to implement the new functionality by changing calibration data, but the ECU hardware can be carried over without modification. The supplier intends to substitute the demonstration of compliance to requirements of ISO 26262-5 by a proven in use argument for the hardware of the ECU. The hardware of the ECU is therefore the proven in use candidate.
10.3 Change analysis
To establish a proven in use credit, the supplier performs a change analysis of the proven in use candidate.
This analysis shows that no change that could have an impact on the safety behaviour of the proven in use candidate has been introduced since the beginning of its production.
Moreover, the analysis shows that the differences between the previous use of the proven in use candidate and its intended use have no safety impact:
⎯ the candidate’s boundary is within the specification limits;
⎯ the previous integration environment requires the same technical behaviour; and
⎯ the cause and effects at the boundary of the candidate are the same in the previous and future integration environments.
10.4 Target values for proven in use
To establish the validity of the proven in use argument, the supplier estimates the number of cumulated hours the proven in use candidate has been in the field. The supplier also analyses the field data from the service period for any safety-related event, i.e. any reported event that would potentially cause, or contribute to, the violation of a safety goal or a safety requirement regarding the intended usage of the candidate in the new item.
The estimation of the duration of the service history is performed, based on the number of produced vehicles embedding the proven in use candidate, together with their production date and data on the typical usage of a vehicle in this segment of the market (number of driving hours per year).
The service history is based on the field return of the different vehicles embedding the proven in use candidate:
⎯ Warranty claims;
⎯ In-the-field defects analyses; or
⎯ Return of defective parts from the vehicle manufacturers.
At the date of the initiation of the hardware development of the item, these analyses show that no safety-related event has occurred in the field. The total cumulated driving hours are estimated to be less than the target for the definite proven in use status for an ASIL C, but meet the interim service period as defined in ISO 26262-8:2011, 14.4.5.2.5.

ISO 26262-10:2012(E)
© ISO 2012 – All rights reserved 47
The conclusion is then as follows:
⎯ The development of the item can carry on taking credit that the hardware of the ECU is provisionally anticipated to be proven in use.
⎯ The field observation continues to obtain a definite proven in use status (see ISO 26262-8:2011, 14.4.5.2.5 and ISO 26262-8:2011, 14.4.5.2.6).
11 Concerning ASIL decomposition
11.1 Objective of ASIL decomposition
The objective of ASIL decomposition is to apply redundancy in order to comply with the safety goal with respect to systematic failures. ASIL decomposition can result in redundant requirements and their corresponding decomposed ASILs implemented by sufficiently independent elements.
11.2 Description of ASIL decomposition
ASIL decomposition refers to the allocation of redundant safety requirements to sufficiently independent ele-ments of the item. Redundancy in this context does not necessarily imply classical modular redundancy (see ISO 26262-1:2011, 1.94).
EXAMPLE The main processor of an ECU can be monitored by a redundant monitoring processor, both of which are independently capable of initiating a defined safe state, even if the monitoring processor is not able to fulfil the functional requirements allocated to the ECU.
ASIL decomposition can only be understood in the context of systematic failures, that is, the methods and measures applied to reduce the likelihood of these failures. The requirements on the evaluation of the hardware architectural metrics and the evaluation of safety goal violations due to random hardware failures will remain unchanged by ASIL decomposition (see ISO 26262:9:2011, 5.4.5).
EXAMPLE In the case of an ASIL B(D) decomposition, it is not allowed to decompose the ASIL D target for the evaluation of the hardware architectural metrics into separate ASIL B targets for each HW element. As written in ISO 26262:5:2011, 8.2, target values can be assigned to hardware elements, but those targets are assigned case-by-case based on an analysis started at the level of the whole hardware of the item. The target metric according to the safety goal applies at the item level.
In such a decomposed architecture, the relevant safety goal is only violated if both elements violate their decomposed safety requirements simultaneously.
The permitted decompositions in ISO 26262 are described in ISO 26262-9:2011, Clause 5 (Requirements decomposition with respect to ASIL tailoring).
11.3 An example of ASIL decomposition
11.3.1 General
The item and its requirements described in this clause are examples. The safety goal, its ASIL and the following requirements are only designed to illustrate the ASIL decomposition process. This example does not reflect what the application of ISO 26262 on a similar real-life example would be.
11.3.2 Item definition
Consider the example of a system with an actuator that is triggered on demand by the driver using a dashboard switch. For the purpose of this example, the actuator provides a comfort function if the vehicle is at zero speed, but can cause hazards if activated above 15 km/h.
For the purpose of this example, the initial architecture of the item is as follows:
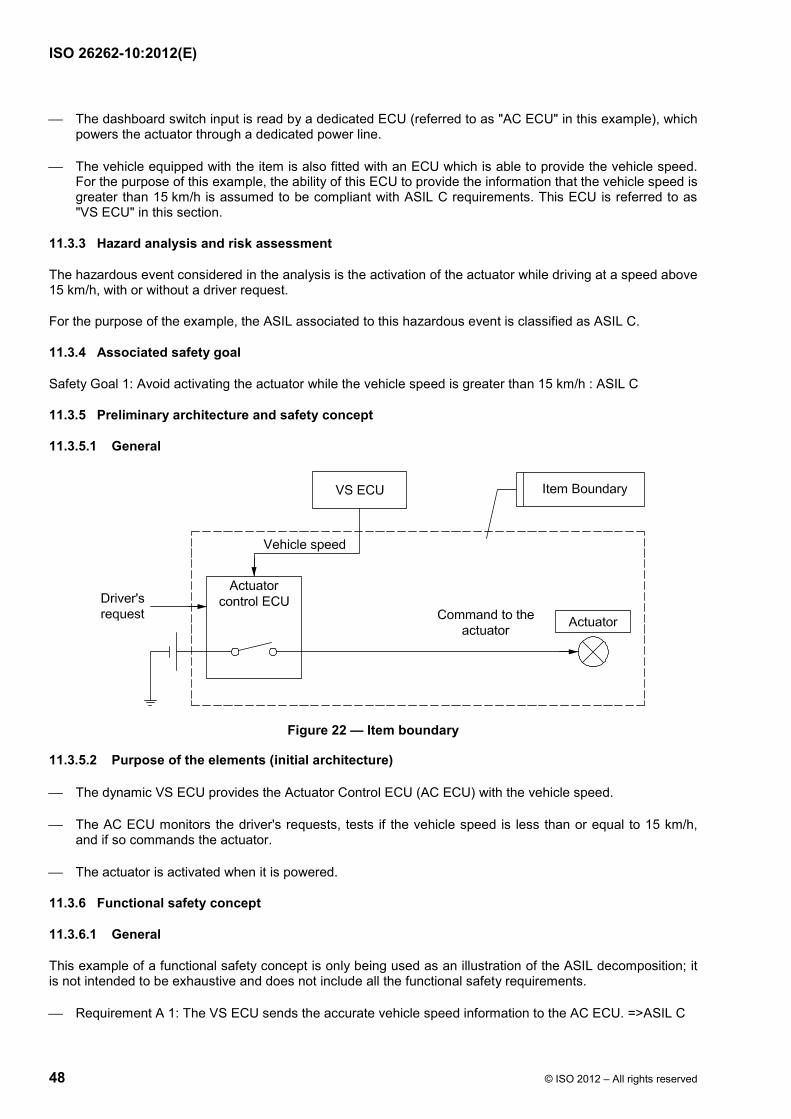
ISO 26262-10:2012(E)
48 © ISO 2012 – All rights reserved
⎯ The dashboard switch input is read by a dedicated ECU (referred to as "AC ECU" in this example), which powers the actuator through a dedicated power line.
⎯ The vehicle equipped with the item is also fitted with an ECU which is able to provide the vehicle speed. For the purpose of this example, the ability of this ECU to provide the information that the vehicle speed is greater than 15 km/h is assumed to be compliant with ASIL C requirements. This ECU is referred to as "VS ECU" in this section.
11.3.3 Hazard analysis and risk assessment
The hazardous event considered in the analysis is the activation of the actuator while driving at a speed above 15 km/h, with or without a driver request.
For the purpose of the example, the ASIL associated to this hazardous event is classified as ASIL C.
11.3.4 Associated safety goal
Safety Goal 1: Avoid activating the actuator while the vehicle speed is greater than 15 km/h : ASIL C
11.3.5 Preliminary architecture and safety concept
11.3.5.1 General
Figure 22 — Item boundary
11.3.5.2 Purpose of the elements (initial architecture)
⎯ The dynamic VS ECU provides the Actuator Control ECU (AC ECU) with the vehicle speed.
⎯ The AC ECU monitors the driver's requests, tests if the vehicle speed is less than or equal to 15 km/h, and if so commands the actuator.
⎯ The actuator is activated when it is powered.
11.3.6 Functional safety concept
11.3.6.1 General
This example of a functional safety concept is only being used as an illustration of the ASIL decomposition; it is not intended to be exhaustive and does not include all the functional safety requirements.
⎯ Requirement A 1: The VS ECU sends the accurate vehicle speed information to the AC ECU. =>ASIL C
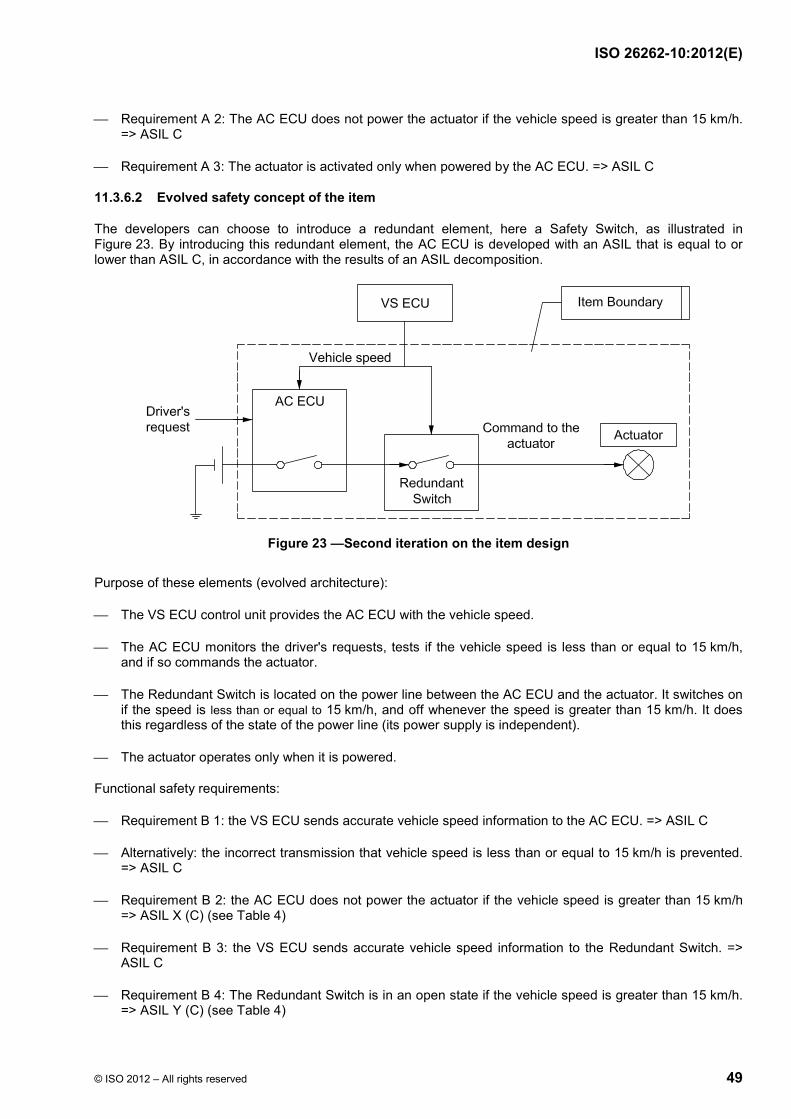
ISO 26262-10:2012(E)
© ISO 2012 – All rights reserved 49
⎯ Requirement A 2: The AC ECU does not power the actuator if the vehicle speed is greater than 15 km/h. => ASIL C
⎯ Requirement A 3: The actuator is activated only when powered by the AC ECU. => ASIL C
11.3.6.2 Evolved safety concept of the item
The developers can choose to introduce a redundant element, here a Safety Switch, as illustrated in Figure 23. By introducing this redundant element, the AC ECU is developed with an ASIL that is equal to or lower than ASIL C, in accordance with the results of an ASIL decomposition.
Figure 23 —Second iteration on the item design
Purpose of these elements (evolved architecture):
⎯ The VS ECU control unit provides the AC ECU with the vehicle speed.
⎯ The AC ECU monitors the driver's requests, tests if the vehicle speed is less than or equal to 15 km/h, and if so commands the actuator.
⎯ The Redundant Switch is located on the power line between the AC ECU and the actuator. It switches on if the speed is less than or equal to 15 km/h, and off whenever the speed is greater than 15 km/h. It does this regardless of the state of the power line (its power supply is independent).
⎯ The actuator operates only when it is powered.
Functional safety requirements:
⎯ Requirement B 1: the VS ECU sends accurate vehicle speed information to the AC ECU. => ASIL C
⎯ Alternatively: the incorrect transmission that vehicle speed is less than or equal to 15 km/h is prevented. => ASIL C
⎯ Requirement B 2: the AC ECU does not power the actuator if the vehicle speed is greater than 15 km/h => ASIL X (C) (see Table 4)
⎯ Requirement B 3: the VS ECU sends accurate vehicle speed information to the Redundant Switch. => ASIL C
⎯ Requirement B 4: The Redundant Switch is in an open state if the vehicle speed is greater than 15 km/h. => ASIL Y (C) (see Table 4)
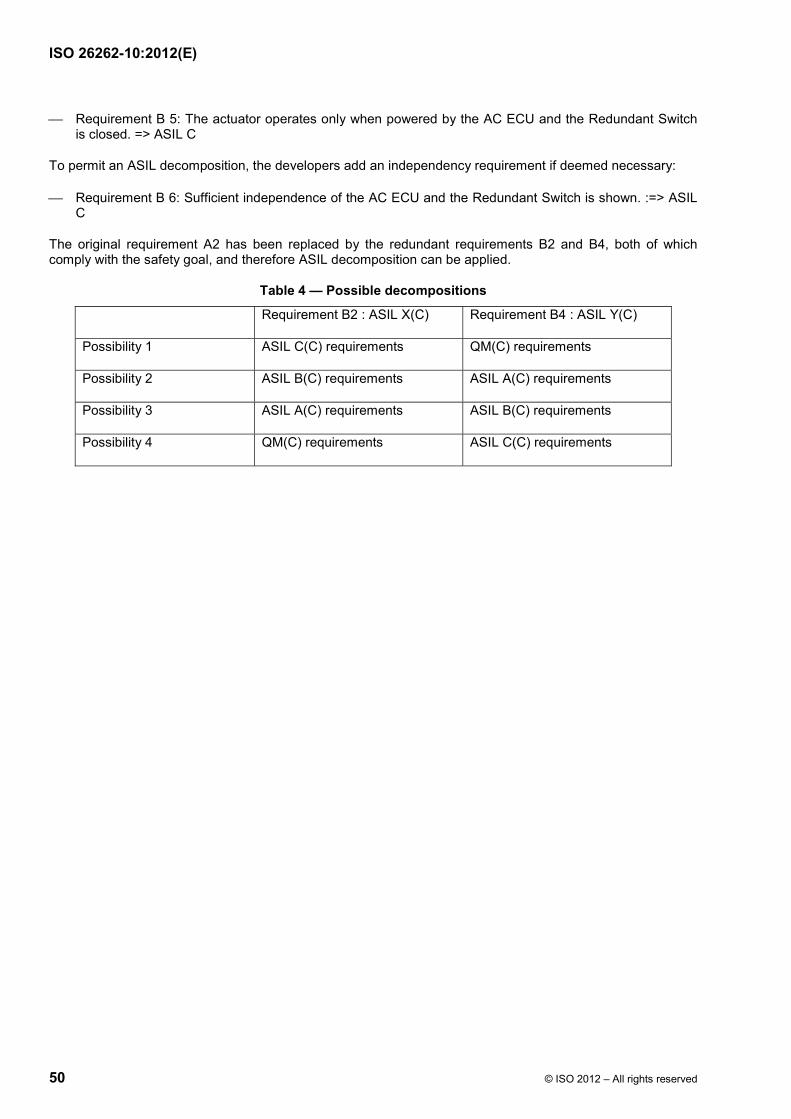
ISO 26262-10:2012(E)
50 © ISO 2012 – All rights reserved
⎯ Requirement B 5: The actuator operates only when powered by the AC ECU and the Redundant Switch is closed. => ASIL C
To permit an ASIL decomposition, the developers add an independency requirement if deemed necessary:
⎯ Requirement B 6: Sufficient independence of the AC ECU and the Redundant Switch is shown. :=> ASIL C
The original requirement A2 has been replaced by the redundant requirements B2 and B4, both of which comply with the safety goal, and therefore ASIL decomposition can be applied.
Table 4 — Possible decompositions
Requirement B2 : ASIL X(C) Requirement B4 : ASIL Y(C)
Possibility 1 ASIL C(C) requirements QM(C) requirements
Possibility 2 ASIL B(C) requirements ASIL A(C) requirements
Possibility 3 ASIL A(C) requirements ASIL B(C) requirements
Possibility 4 QM(C) requirements ASIL C(C) requirements
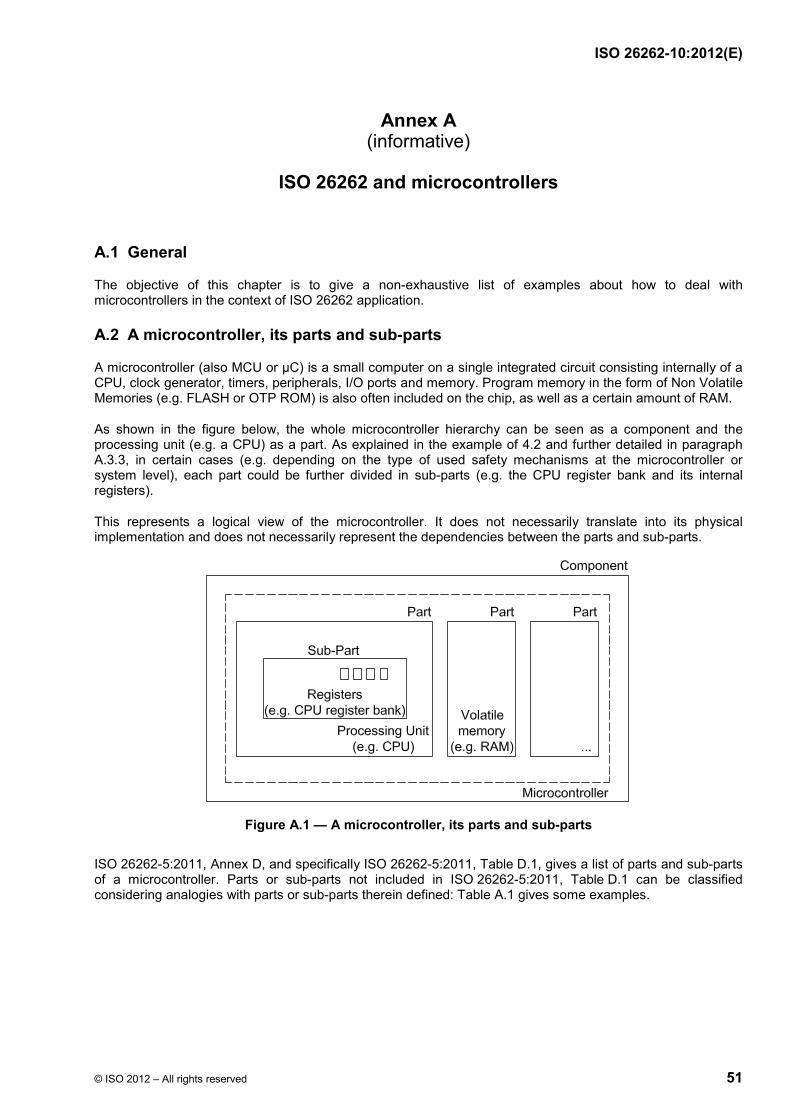
ISO 26262-10:2012(E)
© ISO 2012 – All rights reserved 51
Annex A (informative)
ISO 26262 and microcontrollers
A.1 General
The objective of this chapter is to give a non-exhaustive list of examples about how to deal with microcontrollers in the context of ISO 26262 application.
A.2 A microcontroller, its parts and sub-parts
A microcontroller (also MCU or µC) is a small computer on a single integrated circuit consisting internally of a CPU, clock generator, timers, peripherals, I/O ports and memory. Program memory in the form of Non Volatile Memories (e.g. FLASH or OTP ROM) is also often included on the chip, as well as a certain amount of RAM.
As shown in the figure below, the whole microcontroller hierarchy can be seen as a component and the processing unit (e.g. a CPU) as a part. As explained in the example of 4.2 and further detailed in paragraph A.3.3, in certain cases (e.g. depending on the type of used safety mechanisms at the microcontroller or system level), each part could be further divided in sub-parts (e.g. the CPU register bank and its internal registers).
This represents a logical view of the microcontroller. It does not necessarily translate into its physical implementation and does not necessarily represent the dependencies between the parts and sub-parts.
Figure A.1 — A microcontroller, its parts and sub-parts
ISO 26262-5:2011, Annex D, and specifically ISO 26262-5:2011, Table D.1, gives a list of parts and sub-parts of a microcontroller. Parts or sub-parts not included in ISO 26262-5:2011, Table D.1 can be classified considering analogies with parts or sub-parts therein defined: Table A.1 gives some examples.
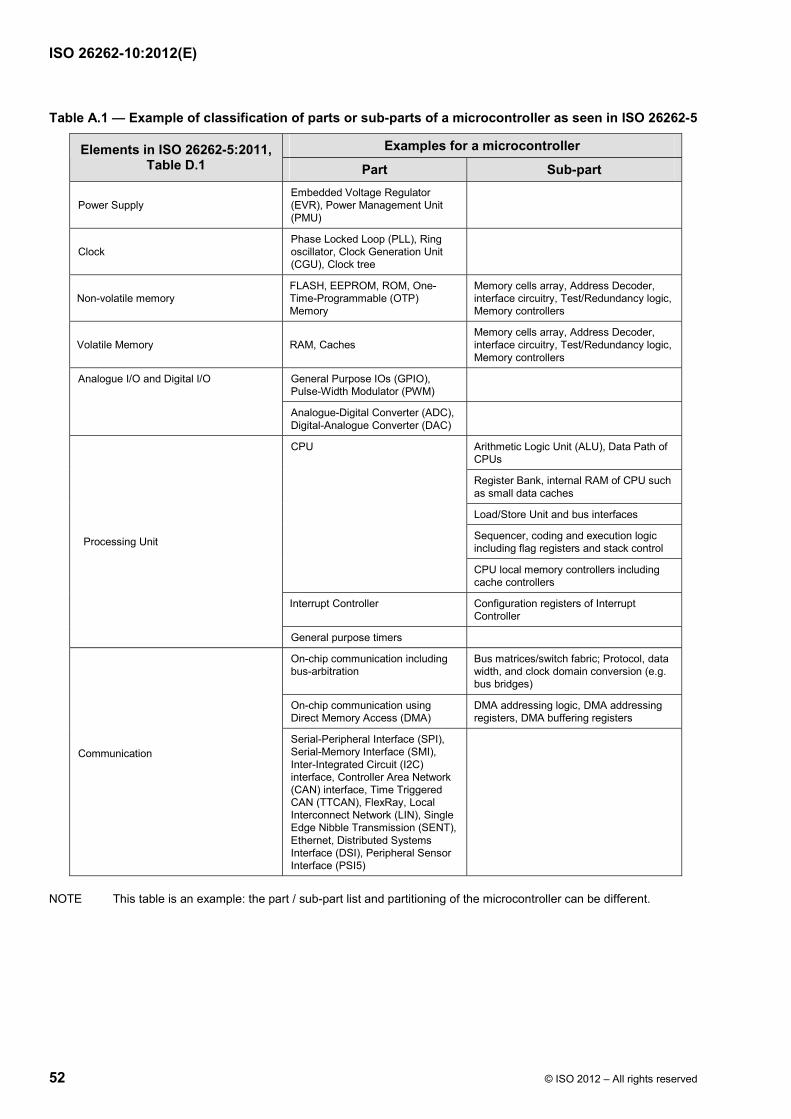
ISO 26262-10:2012(E)
52 © ISO 2012 – All rights reserved
Table A.1 — Example of classification of parts or sub-parts of a microcontroller as seen in ISO 26262-5
Examples for a microcontroller Elements in ISO 26262-5:2011, Table D.1 Part Sub-part
Power Supply Embedded Voltage Regulator (EVR), Power Management Unit (PMU)
Clock Phase Locked Loop (PLL), Ring oscillator, Clock Generation Unit (CGU), Clock tree
Non-volatile memory FLASH, EEPROM, ROM, One-Time-Programmable (OTP) Memory
Memory cells array, Address Decoder, interface circuitry, Test/Redundancy logic, Memory controllers
Volatile Memory RAM, Caches Memory cells array, Address Decoder, interface circuitry, Test/Redundancy logic, Memory controllers
General Purpose IOs (GPIO), Pulse-Width Modulator (PWM)
Analogue I/O and Digital I/O
Analogue-Digital Converter (ADC), Digital-Analogue Converter (DAC)
Arithmetic Logic Unit (ALU), Data Path of CPUs
Register Bank, internal RAM of CPU such as small data caches
Load/Store Unit and bus interfaces
Sequencer, coding and execution logic including flag registers and stack control
CPU
CPU local memory controllers including cache controllers
Interrupt Controller Configuration registers of Interrupt Controller
Processing Unit
General purpose timers
On-chip communication including bus-arbitration
Bus matrices/switch fabric; Protocol, data width, and clock domain conversion (e.g. bus bridges)
On-chip communication using Direct Memory Access (DMA)
DMA addressing logic, DMA addressing registers, DMA buffering registers
Communication
Serial-Peripheral Interface (SPI), Serial-Memory Interface (SMI), Inter-Integrated Circuit (I2C) interface, Controller Area Network (CAN) interface, Time Triggered CAN (TTCAN), FlexRay, Local Interconnect Network (LIN), Single Edge Nibble Transmission (SENT), Ethernet, Distributed Systems Interface (DSI), Peripheral Sensor Interface (PSI5)
NOTE This table is an example: the part / sub-part list and partitioning of the microcontroller can be different.
ISO 26262-10:2012(E)
© ISO 2012 – All rights reserved 53
A.3 Overview of microcontroller development and safety analysis as seen in ISO 26262
A.3.1 General
If a microcontroller is developed as a part of an item development compliant with ISO 26262, it is developed based on the safety requirements, which are derived from the top-level safety goals of the item. Targets for HW architectural metrics and Probabilistic Metric for random Hardware Failures are allocated to the item: in this case, the microcontroller is just one of the elements. As seen in the example of ISO 26262-5:2011, 8.2, to facilitate distributed developments, target values can be assigned to the microcontroller itself. The safety analysis of a microcontroller is performed based on the requirements and recommendations defined in ISO 26262-5:2011, 7.4.3 and in ISO 26262-9:2011, Clause 8 (Safety analysis).
On the other hand, in the case that the target item does not yet exist, the microcontroller can be developed as a safety element out of context (SEooC, refer to Clause 8 of this part). In this case, the development is done based on assumptions on the conditions of the microcontroller usage (Assumptions of Use), and then the validity of the assumptions is established based on the microcontroller requirements derived from the safety goals of the item in which the microcontroller is to be used.
The analyses and related examples described in the following part of this section are done assuming the microcontroller is an SEooC, but the described methods (e.g. the method for failure rates computation of a microcontroller) are still valid if the microcontroller is not considered a SEooC. When those analyses are conducted considering the stand-alone microcontroller, appropriate assumptions are made. Section A.3.9 describes how to adapt and verify those analyses and assumptions at system level. At the stand-alone microcontroller level, each requirement of ISO 26262-5, ISO 26262-8 and ISO 26262-9 (e.g. related to safety analyses, dependent failures analysis, verification, etc. ) remains valid.
A.3.2 Qualitative and quantitative analysis of a microcontroller
As seen in ISO 26262-9:2011, 8.2, qualitative and quantitative safety analyses are performed at the appropriate level of abstraction during the concept and product development phases. In the case of a microcontroller:
a) Qualitative analysis is useful to identify failures. One of the possible ways in which it can be performed uses information derived from microcontroller block diagrams and information derived from ISO 26262-5:2011, Annex D.
NOTE 1 ISO 26262-5:2011, Annex D can be used as a starting point for diagnostic coverage (DC) with the claimed DC supported by a proper rationale.
NOTE 2 Qualitative analysis includes dependent failure analysis of this part as seen in A.3.6 (Example of dependent failures analysis).
b) Quantitative analysis is performed using a combination of:
i) Logical block level structuring;
ii) Information derived from the microcontroller Register Transfer Level (RTL) description (to obtain functional information) and gate-level net list (to obtain functional and structural information);
iii) Information to evaluate potential unspecified interaction of sub-functions (dependent failures, see section A.3.6);
iv) Layout information - only available in the final stage;
v) Information for the verification of diagnostic coverage with respect to some specific fault models such as bridging faults. This can be applicable to only some cases like the points of comparison between a part and its corresponding safety mechanism; and
ISO 26262-10:2012(E)
54 © ISO 2012 – All rights reserved
vi) Expert judgement supported by rationale and careful consideration of the effectiveness of the system-level measures.
NOTE 1 The analysis of dependent failures is performed on a qualitative basis because no general and sufficiently reliable method exists for quantifying such failures.
NOTE 2 This information can be progressively available during the microcontroller development phase. Therefore, the analysis could be repeated based on the latest information.
EXAMPLE 1 The evaluation of dependent failures starts early in design. Design measures are specified to avoid and reveal potential sources of dependent failures or to detect their effect on the “System on Chip” safety performance. Layout confirmation is used in the final design stage.
EXAMPLE 2 During a first step of the quantitative analysis, a pre-DFT pre-layout gate-level net list could be available, while later the analysis is repeated using post-DFT and post-layout gate-level net list (DFT = Design for Test).
c) Since the parts and sub-parts of a microcontroller can be implemented in a single physical component, both dependent failures analysis and analysis of independence or freedom from interference are important analyses for microcontrollers. See paragraph A.3.6 for further details.
A.3.3 A method for failure rates computation of a microcontroller
A.3.3.1 General
Requirements and recommendations for the failure rates computation in general are defined in ISO 26262-5, and requirements about the computation of metrics are given in its Annex C.
Following the example given in ISO 26262-5:2011, Annex E, the failure rates and the metrics can be computed in the following way for microcontrollers:
⎯ First, the microcontroller is divided into parts or sub-parts.
NOTE 1 Assumptions on the independence of identified parts are verified during the dependent failure analysis.
NOTE 2 The necessary level of detail (e.g. if to stop at part level or if to go down to sub-part or elementary sub-part level) can depend on the stage of the analysis and on the safety mechanisms used (inside the microcontroller or at the system level).
EXAMPLE 1 If the functionality of the CPU is monitored by a different CPU running in lockstep, the analysis does not need to consider each and every CPU internal register while more detail can be needed for the lock-step comparator. If on the other hand the functionality of the CPU is monitored by a SW self-test, a detailed analysis of the various CPU sub-parts can be appropriate.
EXAMPLE 2 The confidence of the computation is proportional to the level of detail: a low level of detail could be appropriate for analysis at concept stage while a higher level detail could be appropriate for analysis at the development stage.
NOTE 3 Due to the complexity of modern microcontrollers (hundreds or thousands of parts and sub-parts), to guarantee completeness of the analysis, it is helpful to support the division process with automatic tools. Care is taken to ensure microcontroller level analysis across module boundaries. Partitions are done along levels of RTL hierarchy if RTL is available.
⎯ Second, the failure rates of each part or sub-part can be computed using one of the following two methods:
1) If the total failure rate of the whole microcontroller die (i.e. excluding package and bonding) is given (in FIT), then the failure rate of the part or sub-part could be assumed to be equal to the occupying area of the part or sub-part (i.e. area related to gates, flip-flops and related interconnections) divided by the total area of the microcontroller die multiplied by the total failure rate.
ISO 26262-10:2012(E)
© ISO 2012 – All rights reserved 55
NOTE 1 For mixed signal chips with power stages, this approach is applied within each domain, as the total failure rate for the digital domain can be different from the analogue and power domain.
NOTE 2 A detailed knowledge of the microcontroller can be useful.
EXAMPLE If a CPU area occupies 3 % of the whole microcontroller die area, then its failure rate could be assumed to be equal to 3 % of the total microcontroller die failure rate.
2) If the base failure rates, i.e. the failure rate of basic sub-parts like gates of the microcontroller, are given, then the failure rate of the part or sub-part could be assumed to be equal to the sum of the number of those basic sub-parts multiplied by its failure rate.
NOTE 1 A detailed knowledge of the microcontroller can be useful.
NOTE 2 See paragraph A.3.4 for examples for how to derive the base failure rate values.
⎯ The evaluation is completed by classifying the faults into safe faults, residual faults, detected dual-point faults and latent dual-point faults.
EXAMPLE Certain portions of a debug unit implemented inside a CPU are safety-related (because the CPU itself is safety-related), but they themselves cannot lead to a direct violation of the safety goal or their occurrence cannot significantly increase the probability of violation of the safety goal.
⎯ Finally, the failure mode coverage with respect to residual and latent faults of that part or sub-part is determined.
EXAMPLE The failure mode coverage associated with a certain failure rate can be computed by dividing the sub-part into smaller sub-parts, and for each of them compute the expected capability of the safety mechanisms to cover each sub-part. For example, the failure mode coverage of a failure in the CPU register bank can be computed by dividing the register bank into smaller sub-parts, each one related to the specific register (e.g. R0, R1,…), and computing the failure mode coverage of the safety mechanism for each of them, e.g. combining the failure mode coverage for each of the corresponding low-level failure modes.
NOTE 1 The effectiveness of safety mechanisms could be affected by dependent failures. Adequate measures are considered as listed in section A.3.6.
NOTE 2 Since the fault detection ability of the vehicle driver cannot be considered at this level of analysis, the concept of perceived fault is not applicable at microcontroller level. See paragraph A.3.9 for further details about how to combine microcontroller level information with the application.
NOTE 3 Due to the complexity of modern microcontrollers (millions of gates), fault injection methods can assist the computation and be used for verification of the amount of safe faults and especially of the failure mode coverage. See paragraph A.3.8.2 for further details. Fault injection is not the only method, and other approaches are possible as described in paragraph A.3.8.2.
A.3.3.2 How to consider transient faults
As seen in Note 2 of ISO 26262-5:2011, 8.4.7, the transient faults are considered when shown to be relevant due, for instance, to the technology used. They can be addressed either by specifying and verifying a dedicated target “single-point fault metric” value to them or by a qualitative rationale.
When the quantitative approach is used, failure rates and metrics for transient faults can be computed the following example given in ISO 26262-5:2011, Annex E, supported by the following method:
⎯ First, the microcontroller is divided into parts or sub-parts as for paragraph A.3.3
NOTE Due to the amount and density of memory elements in RAM memories, the resulting failure rates for transient faults can be significantly higher than the ones related to processing logic or other parts of a microcontroller. Therefore, as recommended in Note 1 of ISO 26262-5:2011, 8.4.7, it can be helpful to compute a separate failure rate (and metric) for RAM memories and for the other parts of the microcontroller.
ISO 26262-10:2012(E)
56 © ISO 2012 – All rights reserved
⎯ Second, the failure rates of each part or sub-part are computed using the base failure rate for transient faults.
EXAMPLE Following the method defined in A.3.3, the base failure rate can be computed as a function of the base failure rate with respect to single-event upset and single-event transient and the related interested portion of circuit (for example expressed in number of flip-flops and gates). See paragraph A.3.4 for examples of how to derive the base failure rate values.
⎯ Finally, the evaluation is completed by classifying the faults into safe faults and residual faults, i.e. the amount of safe faults related to the failure rate of that part or sub-part.
NOTE For estimations of the amount of safe transient faults, when there is a clear dependency from the application software and if that software is not available during the microcontroller development, a 50 %-50 % estimation could be acceptable. When the application software is available or if there is a direct dependency on microcontroller architecture, a specific analysis to determine this value could be preferable.
EXAMPLE A fault in a register storing a safety-related constant (i.e. a value written only once but read at each clock cycle and, if wrong, violating the safety goal) is never safe. If instead, for example, the register is written every 10 ms but used for a safety-related calculation only once, 1 ms after it is written, a random transient fault in the register would result in 90 % safe faults because in the remaining 90 % of the clock cycles, a fault in that register will not cause a violation of the safety goal.
NOTE 1 As seen in Note 2 of ISO 26262-5:2011, 8.4.7, transient faults can be addressed via a single-point fault metric. Transient faults are not considered as far as latent faults are concerned. No failure mode coverage for latent faults is computed for transients because the root cause rapidly disappears (per definition of transient). Furthermore, it is assumed that in the greatest majority of the cases, the effect will rapidly be repaired, e.g. by a following power-down cycle removing the erroneous state of the flip-flop or memory cell that was changed by the transient fault, before a second fault can cause the occurrence of a multiple-point failure. In special cases, this could not be valid and additional measures can be necessary, though these can be addressed on a case by case basis.
NOTE 2 Transient faults are contained within the affected sub-part and do not spread inadvertently to other sub-parts if they are not logically connected.
NOTE 3 Some of the coverage values of safety mechanisms defined in tables from D.2 to D.14 of ISO 26262-5:2011, Annex D are valid for permanent faults only. This important distinction can be found in the related safety mechanism description, in which it is written how the coverage value can be considered for transient faults.
EXAMPLE The typical value of the coverage of RAM March test (ISO 26262-5:2011, Table D.6) is rated HIGH. However in the related description (ISO 26262-5:2011, D.2.5.3), it is written that these types of tests are not effective for soft error detection. Therefore, for example, the coverage of RAM March test with respect to transient faults is zero.
When the qualitative approach is used, a rationale is given based on the verification of the effectiveness of the safety mechanisms implemented (either internal to the microcontroller or at system level) to cover the transient faults.
EXAMPLE For data path elements, time-redundancy in processing of data (i.e. process the same information more than once) would already guarantee a high level of protection against transient faults.
A.3.4 How to derive base failure rates that can be used for microcontrollers
A.3.4.1 General
As seen in ISO 26262-5:2011, 8.4.3, failure rates data can be derived from a recognized industry source. The following list gives an example of standards and handbooks from which it is possible to derive the base failure rates for the method defined in paragraphs A.3.3 and A.3.3.2:
⎯ for permanent faults: data provided by semiconductor industries or use of standards such as IEC/TR 62380 [8]; SN 29500 [6];
NOTE For permanent faults: data provided by semiconductor industries can be based on the number of (random) failures divided by equivalent device hours. These are obtained from field data or from accelerated life testing (as defined in standards such as JEDEC and AEC) scaled to a mission profile (e.g. temperature, on/off periods) with the assumption
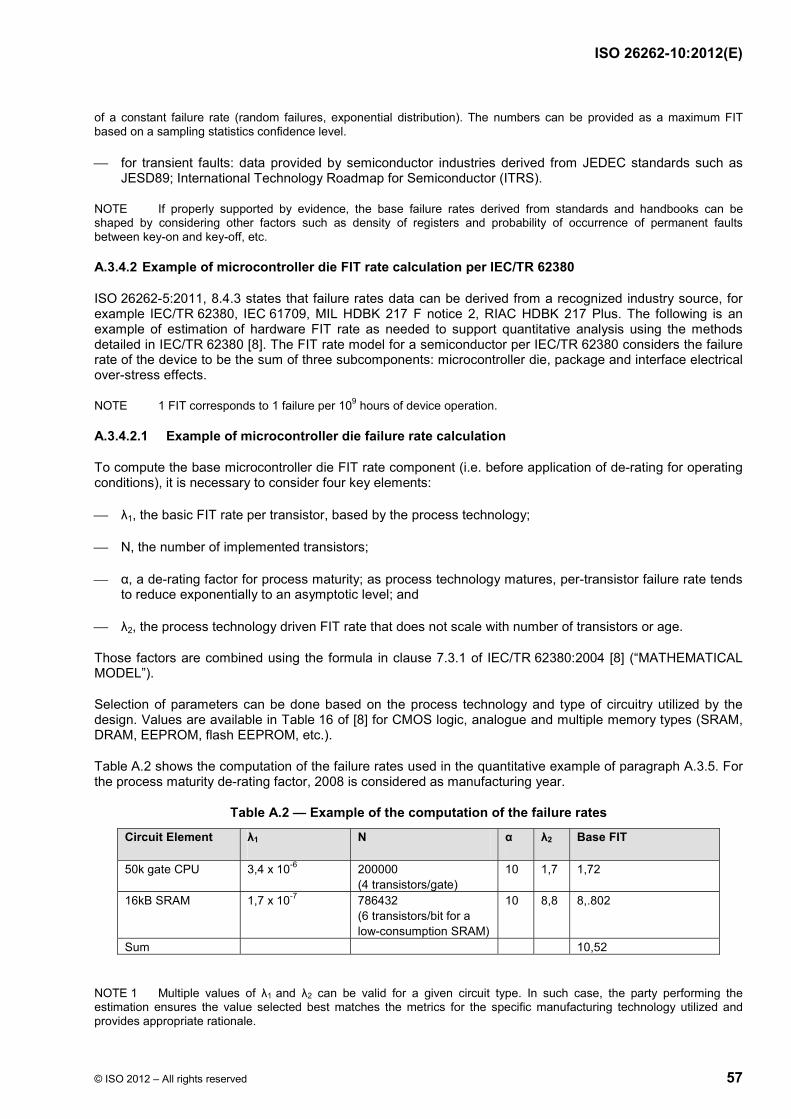
ISO 26262-10:2012(E)
© ISO 2012 – All rights reserved 57
of a constant failure rate (random failures, exponential distribution). The numbers can be provided as a maximum FIT based on a sampling statistics confidence level.
⎯ for transient faults: data provided by semiconductor industries derived from JEDEC standards such as JESD89; International Technology Roadmap for Semiconductor (ITRS).
NOTE If properly supported by evidence, the base failure rates derived from standards and handbooks can be shaped by considering other factors such as density of registers and probability of occurrence of permanent faults between key-on and key-off, etc.
A.3.4.2 Example of microcontroller die FIT rate calculation per IEC/TR 62380
ISO 26262-5:2011, 8.4.3 states that failure rates data can be derived from a recognized industry source, for example IEC/TR 62380, IEC 61709, MIL HDBK 217 F notice 2, RIAC HDBK 217 Plus. The following is an example of estimation of hardware FIT rate as needed to support quantitative analysis using the methods detailed in IEC/TR 62380 [8]. The FIT rate model for a semiconductor per IEC/TR 62380 considers the failure rate of the device to be the sum of three subcomponents: microcontroller die, package and interface electrical over-stress effects.
NOTE 1 FIT corresponds to 1 failure per 109 hours of device operation.
A.3.4.2.1 Example of microcontroller die failure rate calculation
To compute the base microcontroller die FIT rate component (i.e. before application of de-rating for operating conditions), it is necessary to consider four key elements:
⎯ λ1, the basic FIT rate per transistor, based by the process technology;
⎯ N, the number of implemented transistors;
⎯ α, a de-rating factor for process maturity; as process technology matures, per-transistor failure rate tends to reduce exponentially to an asymptotic level; and
⎯ λ2, the process technology driven FIT rate that does not scale with number of transistors or age.
Those factors are combined using the formula in clause 7.3.1 of IEC/TR 62380:2004 [8] (“MATHEMATICAL MODEL”).
Selection of parameters can be done based on the process technology and type of circuitry utilized by the design. Values are available in Table 16 of [8] for CMOS logic, analogue and multiple memory types (SRAM, DRAM, EEPROM, flash EEPROM, etc.).
Table A.2 shows the computation of the failure rates used in the quantitative example of paragraph A.3.5. For the process maturity de-rating factor, 2008 is considered as manufacturing year.
Table A.2 — Example of the computation of the failure rates
Circuit Element λ1 N α λ2 Base FIT
50k gate CPU 3,4 x 10⁻⁶ 200000 (4 transistors/gate)
10 1,7 1,72
16kB SRAM 1,7 x 10⁻⁷ 786432 (6 transistors/bit for a low-consumption SRAM)
10 8,8 8,.802
Sum 10,52
NOTE 1 Multiple values of λ1 and λ2 can be valid for a given circuit type. In such case, the party performing the estimation ensures the value selected best matches the metrics for the specific manufacturing technology utilized and provides appropriate rationale.
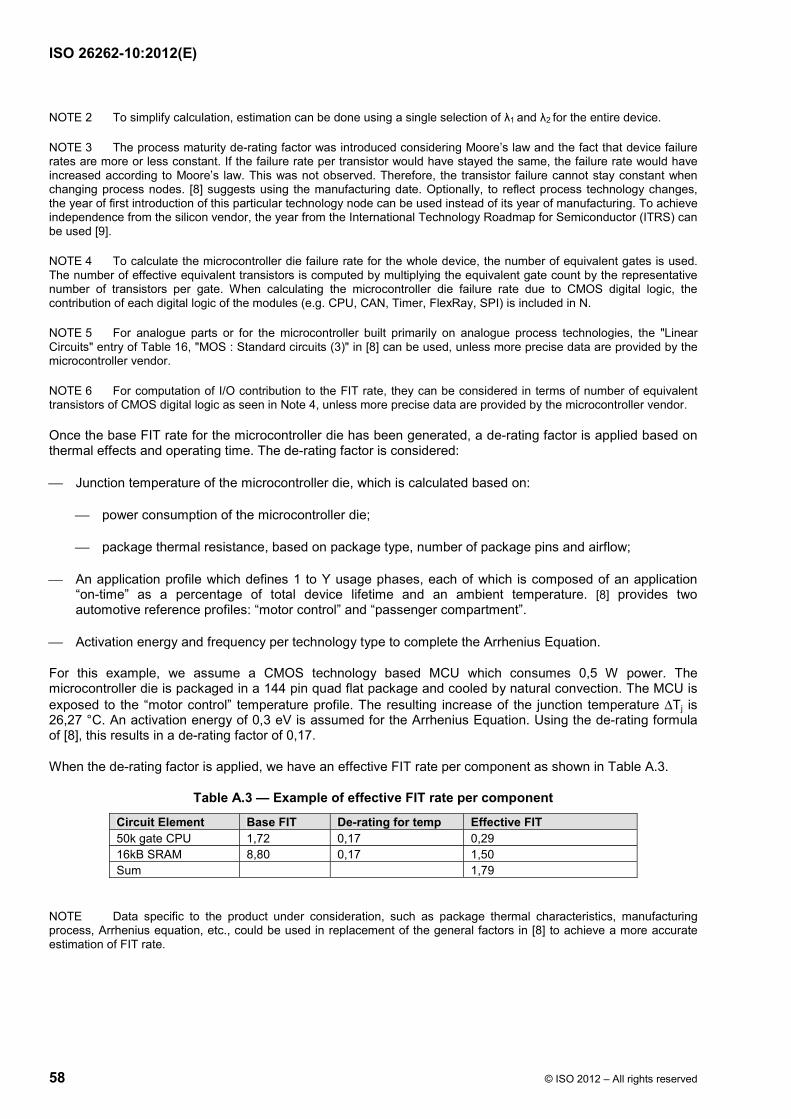
ISO 26262-10:2012(E)
58 © ISO 2012 – All rights reserved
NOTE 2 To simplify calculation, estimation can be done using a single selection of λ1 and λ2 for the entire device.
NOTE 3 The process maturity de-rating factor was introduced considering Moore’s law and the fact that device failure rates are more or less constant. If the failure rate per transistor would have stayed the same, the failure rate would have increased according to Moore’s law. This was not observed. Therefore, the transistor failure cannot stay constant when changing process nodes. [8] suggests using the manufacturing date. Optionally, to reflect process technology changes, the year of first introduction of this particular technology node can be used instead of its year of manufacturing. To achieve independence from the silicon vendor, the year from the International Technology Roadmap for Semiconductor (ITRS) can be used [9].
NOTE 4 To calculate the microcontroller die failure rate for the whole device, the number of equivalent gates is used. The number of effective equivalent transistors is computed by multiplying the equivalent gate count by the representative number of transistors per gate. When calculating the microcontroller die failure rate due to CMOS digital logic, the contribution of each digital logic of the modules (e.g. CPU, CAN, Timer, FlexRay, SPI) is included in N.
NOTE 5 For analogue parts or for the microcontroller built primarily on analogue process technologies, the "Linear Circuits" entry of Table 16, "MOS : Standard circuits (3)" in [8] can be used, unless more precise data are provided by the microcontroller vendor.
NOTE 6 For computation of I/O contribution to the FIT rate, they can be considered in terms of number of equivalent transistors of CMOS digital logic as seen in Note 4, unless more precise data are provided by the microcontroller vendor.
Once the base FIT rate for the microcontroller die has been generated, a de-rating factor is applied based on thermal effects and operating time. The de-rating factor is considered:
⎯ Junction temperature of the microcontroller die, which is calculated based on:
⎯ power consumption of the microcontroller die;
⎯ package thermal resistance, based on package type, number of package pins and airflow;
⎯ An application profile which defines 1 to Y usage phases, each of which is composed of an application “on-time” as a percentage of total device lifetime and an ambient temperature. [8] provides two automotive reference profiles: “motor control” and “passenger compartment”.
⎯ Activation energy and frequency per technology type to complete the Arrhenius Equation.
For this example, we assume a CMOS technology based MCU which consumes 0,5 W power. The microcontroller die is packaged in a 144 pin quad flat package and cooled by natural convection. The MCU is exposed to the “motor control” temperature profile. The resulting increase of the junction temperature ∆Tj is 26,27 °C. An activation energy of 0,3 eV is assumed for the Arrhenius Equation. Using the de-rating formula of [8], this results in a de-rating factor of 0,17.
When the de-rating factor is applied, we have an effective FIT rate per component as shown in Table A.3.
Table A.3 — Example of effective FIT rate per component
Circuit Element Base FIT De-rating for temp Effective FIT 50k gate CPU 1,72 0,17 0,29 16kB SRAM 8,80 0,17 1,50 Sum 1,79
NOTE Data specific to the product under consideration, such as package thermal characteristics, manufacturing process, Arrhenius equation, etc., could be used in replacement of the general factors in [8] to achieve a more accurate estimation of FIT rate.
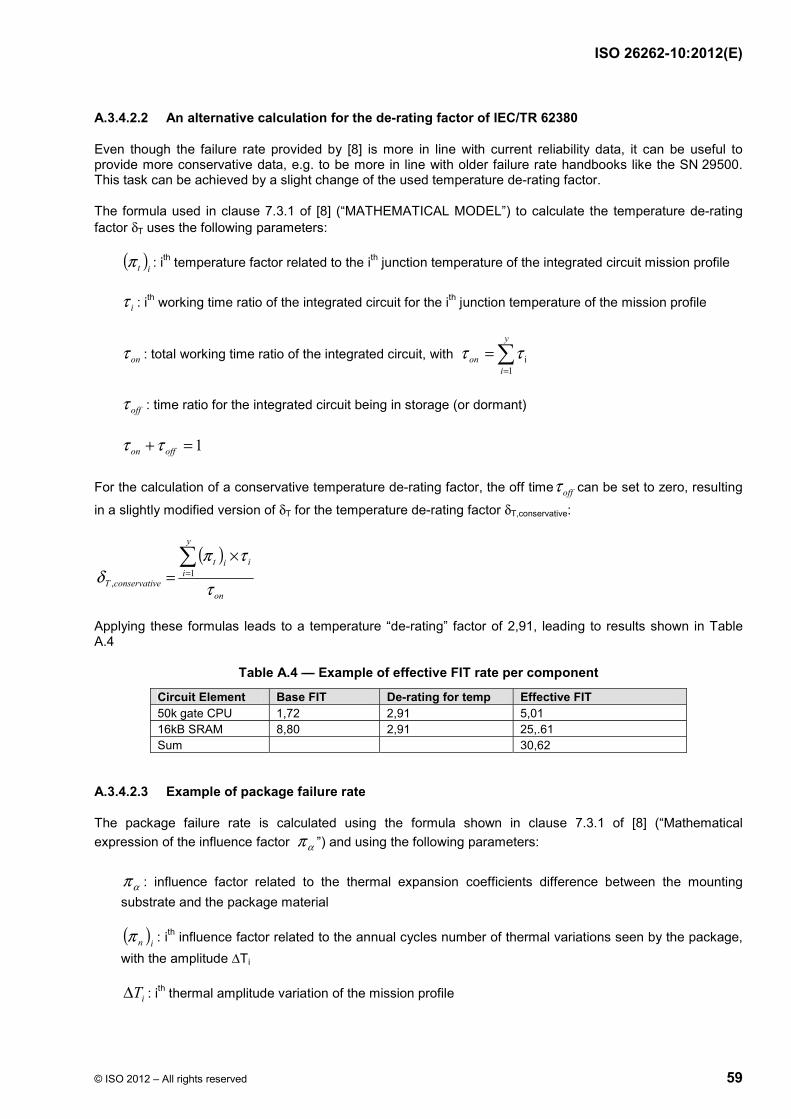
ISO 26262-10:2012(E)
© ISO 2012 – All rights reserved 59
A.3.4.2.2 An alternative calculation for the de-rating factor of IEC/TR 62380
Even though the failure rate provided by [8] is more in line with current reliability data, it can be useful to provide more conservative data, e.g. to be more in line with older failure rate handbooks like the SN 29500. This task can be achieved by a slight change of the used temperature de-rating factor.
The formula used in clause 7.3.1 of [8] (“MATHEMATICAL MODEL”) to calculate the temperature de-rating factor δT uses the following parameters:
( )itπ : ith temperature factor related to the ith junction temperature of the integrated circuit mission profile
iτ : ith working time ratio of the integrated circuit for the ith junction temperature of the mission profile
onτ : total working time ratio of the integrated circuit, with ∑=
=y
ion
1iττ
offτ : time ratio for the integrated circuit being in storage (or dormant)
1=+ offon ττ
For the calculation of a conservative temperature de-rating factor, the off time offτ can be set to zero, resulting
in a slightly modified version of δT for the temperature de-rating factor δT,conservative:
( )
on
y
iiit
veconservatiT τ
τπδ
∑=
×= 1
,
Applying these formulas leads to a temperature “de-rating” factor of 2,91, leading to results shown in Table A.4
Table A.4 — Example of effective FIT rate per component
Circuit Element Base FIT De-rating for temp Effective FIT 50k gate CPU 1,72 2,91 5,01 16kB SRAM 8,80 2,91 25,.61 Sum 30,62
A.3.4.2.3 Example of package failure rate
The package failure rate is calculated using the formula shown in clause 7.3.1 of [8] (“Mathematical expression of the influence factor απ ”) and using the following parameters:
απ : influence factor related to the thermal expansion coefficients difference between the mounting substrate and the package material
( )inπ : ith influence factor related to the annual cycles number of thermal variations seen by the package, with the amplitude ∆Ti
iT∆ : ith thermal amplitude variation of the mission profile
ISO 26262-10:2012(E)
60 © ISO 2012 – All rights reserved
3λ : base failure rate of the integrated circuit package
For this example, we assume a CMOS technology based MCU which consumes 0,5 W power. The microcontroller die is packaged in a 144 pin quad flat package and cooled by natural convection, leading to a junction temperature increase of ∆Tj = 26,27 °C. The MCU is exposed to the “motor control” temperature profile.
The influencing factor πα is calculated using the formula shown in clause 7.3.1 of [8] (“Mathematical expression of the influence factor"), with αs, αc being the linear thermal expansion coefficients for the substrate and the component respectively. In this example we assume FR4 as mounting substrate and a plastic package for which the table delivers the values αs = 16 and αc = 21,5.
Since for a automotive profile the number of cycles/year ≤ 8 760(πn)i is calculated using the formula in clause 7.3.1 of [8] ("Mathematical expression of the influence factor ( )inπ ”), with in : Annual number of cycles with the amplitude ∆Ti
To calculate λ3 in FIT, the formula for peripheral connections packages is used, using a width of 20 mm and a pitch of 0,5 mm as shown in Table 17b of [8].
Using the “motor control” temperature profile, this results in a total failure rate for the package of
λpackage = 207 FIT
The package failure rate can be equally distributed among the pins, leading to a pin failure rate of
λpin = 1,44 FIT
NOTE Package failure rate estimation is based on the knowledge of the construction and thermal characteristics of the device package and the system’s printed circuit board. Instead of using [8], a joint conservative estimation of package FIT rate by MCU supplier and system implementer can be used.
A.3.4.2.4 Example of failure rate resulting from electrical overstress
The failure rate for whole device due to electrical overstress can be calculated using the formula shown in clause 7.3.1 of [8] (“MATHEMATICAL MODEL”). If the device has a direct connection to the external environment, i.e. the device is an interface, πI is equal to one. If the device is not an interface, i.e. it has no direct connection to the external environment, πI is equal to zero.
[8] offers different λEOS for various electrical environments. Unfortunately, an automotive electrical environment is not given. Instead the “civilian avionics (on board calculators)” can be chosen:
FITEOS 20=λ
This results in a failure rate due to electrical overstress for the whole device of either
FIToverstress 20=λ , if the device has a direct contact to the external environment, or
FIToverstress 0=λ in every other case.
To forecast the impact of electrical overstress on the device is not trivial. If no particular impact can be argued, then λoverstress can be added to λdie to increase the overall microcontroller die failure rate of the whole device.
NOTE For some analysis standards, electrical over-stress can be considered a systematic failure mode and reduced to zero FIT for calculation of random failure metrics.
ISO 26262-10:2012(E)
© ISO 2012 – All rights reserved 61
A.3.5 Example of quantitative analysis
The following is an example of a quantitative analysis using the method described in paragraph A.3.3.
NOTE 1 Numbers used in this example (e.g. failure rates, amount of safe faults and failure mode coverage) are examples. They can vary from architecture to architecture.
NOTE 2 The following examples divide a portion of the microcontroller into the sub-parts level. As discussed in paragraph A.3.3, the necessary level of detail can depend on the stage of the analysis and on the safety mechanisms used.
NOTE 3 The following examples use the quantitative approach to compute a dedicated target “single-point fault metric” value for transient faults. As discussed in paragraph A.3.3.2, transient faults can be also addressed by qualitative rationale.
The example considers a small portion of a microcontroller, i.e. only two parts:
a) A small CPU, divided in five sub-parts: register bank, ALU, load-store unit, control logic and debug. Each sub-part is further divided in several sub-parts.
b) A 16KB of RAM divided in three sub-parts: cell array, address decoder and logic for end-of-line test, and management of spare rows (redundancies) of RAM.
NOTE 1 The FIT numbers shown in the example do not include peripherals or other features such as package, handling or overstress. They are given just as an example of a possible method for FIT rate computation. For this reason, those values are not comparable with FIT rates of a complete packaged microcontroller as shown for example in SN 29500.
NOTE 2 The aim of the following example is to avoid a requirement that each smallest microcontroller sub-part be addressed in the system-level analysis. At system-level analysis, component or part level detail can be sufficient. The aim of this example is to provide evidence that for a microcontroller at stand-alone level, a deeper analysis (e.g. at sub-part level) can be needed in order to compute with the required accuracy the failure rates and failure mode coverage of parts and sub-parts, to be used afterwards by system engineers. In other words, without an accurate and detailed microcontroller stand-alone level analysis, it can be very difficult to have good data for system-level analysis.
The following four safety mechanisms are considered:
1) An HW safety mechanism (SM1) performing a logical monitoring of program sequence of CPU. This safety mechanism is able to detect with certain coverage the faults in the control logic that could cause the software to run out of sequence. However, this safety mechanism is poor at detecting faults (such as wrong arithmetic operations) leading to wrong data.
NOTE In this example, it is assumed that each detected permanent single bit faults affecting the CPU is signalled to the system (e.g. by activating an output signal of the microcontroller). A requirement is set at system level to make proper use of this signal (e.g. to enter a safe state and inform the driver). For suspect transient faults, the CPU can try to remove these faults by a reset. If the fault persists, it means it is permanent, and therefore it can be signalled to the system as previously described. If the fault disappears (i.e. it was really transient), the CPU can continue.
2) A software-based safety mechanism addressing random hardware failures (SM2) executed at key-on to verify the absence of latent faults in the logical monitoring of program sequence of CPU (SM1).
3) A Single-Error Correction and Double-Error Detection EDC for the RAM (SM3).
NOTE In this example, it is assumed that each detected permanent single bit fault – even if corrected by the EDC — is signalled to the SW (e.g. by an interrupt), and the SW reacts accordingly. A requirement is set at system level to make proper use of this event (e.g. to go in a safe state and inform the driver). For suspected transient faults corrected by EDC, the CPU can try to remove these faults by writing back in the memory the correct value. If the fault persists, it means it is permanent and therefore is signalled to the system as previously described. If the fault disappears (i.e. it was transient), the CPU can continue. To distinguish intermittent and transient faults, counting numbers of corrections could be a possible method.
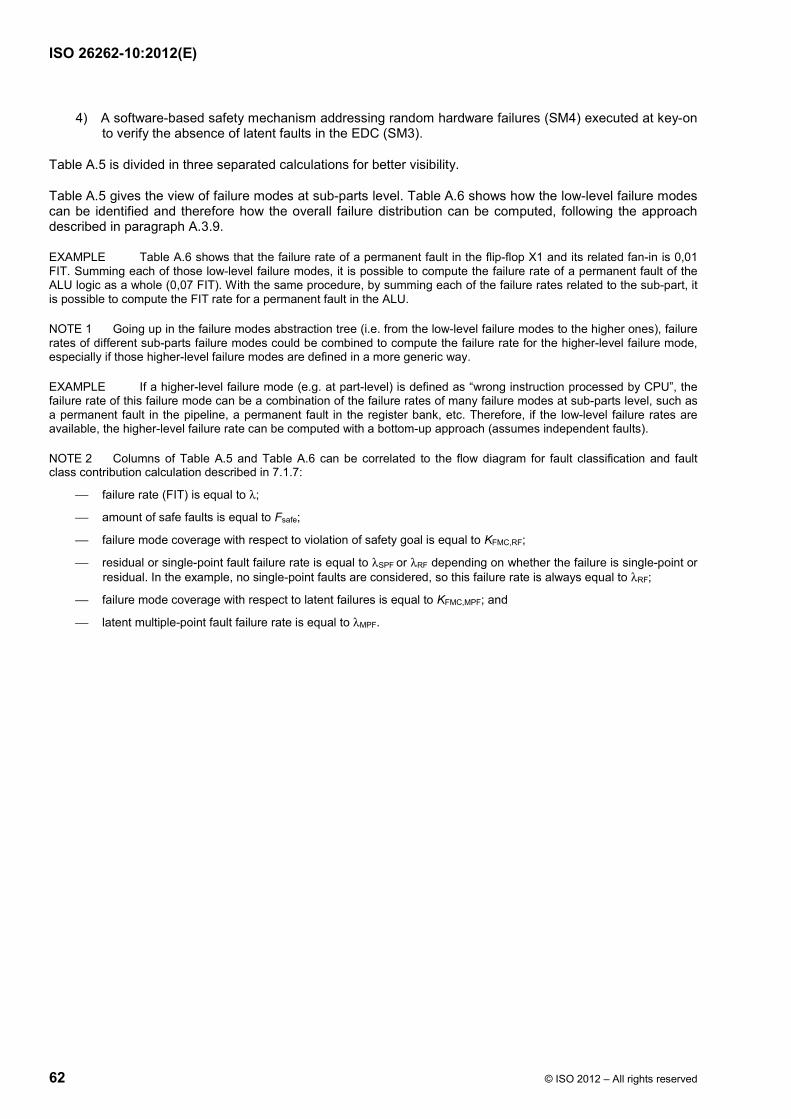
ISO 26262-10:2012(E)
62 © ISO 2012 – All rights reserved
4) A software-based safety mechanism addressing random hardware failures (SM4) executed at key-on to verify the absence of latent faults in the EDC (SM3).
Table A.5 is divided in three separated calculations for better visibility.
Table A.5 gives the view of failure modes at sub-parts level. Table A.6 shows how the low-level failure modes can be identified and therefore how the overall failure distribution can be computed, following the approach described in paragraph A.3.9.
EXAMPLE Table A.6 shows that the failure rate of a permanent fault in the flip-flop X1 and its related fan-in is 0,01 FIT. Summing each of those low-level failure modes, it is possible to compute the failure rate of a permanent fault of the ALU logic as a whole (0,07 FIT). With the same procedure, by summing each of the failure rates related to the sub-part, it is possible to compute the FIT rate for a permanent fault in the ALU.
NOTE 1 Going up in the failure modes abstraction tree (i.e. from the low-level failure modes to the higher ones), failure rates of different sub-parts failure modes could be combined to compute the failure rate for the higher-level failure mode, especially if those higher-level failure modes are defined in a more generic way.
EXAMPLE If a higher-level failure mode (e.g. at part-level) is defined as “wrong instruction processed by CPU”, the failure rate of this failure mode can be a combination of the failure rates of many failure modes at sub-parts level, such as a permanent fault in the pipeline, a permanent fault in the register bank, etc. Therefore, if the low-level failure rates are available, the higher-level failure rate can be computed with a bottom-up approach (assumes independent faults).
NOTE 2 Columns of Table A.5 and Table A.6 can be correlated to the flow diagram for fault classification and fault class contribution calculation described in 7.1.7:
⎯ failure rate (FIT) is equal to λ;
⎯ amount of safe faults is equal to Fsafe;
⎯ failure mode coverage with respect to violation of safety goal is equal to KFMC,RF;
⎯ residual or single-point fault failure rate is equal to λSPF or λRF depending on whether the failure is single-point or residual. In the example, no single-point faults are considered, so this failure rate is always equal to λRF;
⎯ failure mode coverage with respect to latent failures is equal to KFMC,MPF; and
⎯ latent multiple-point fault failure rate is equal to λMPF.
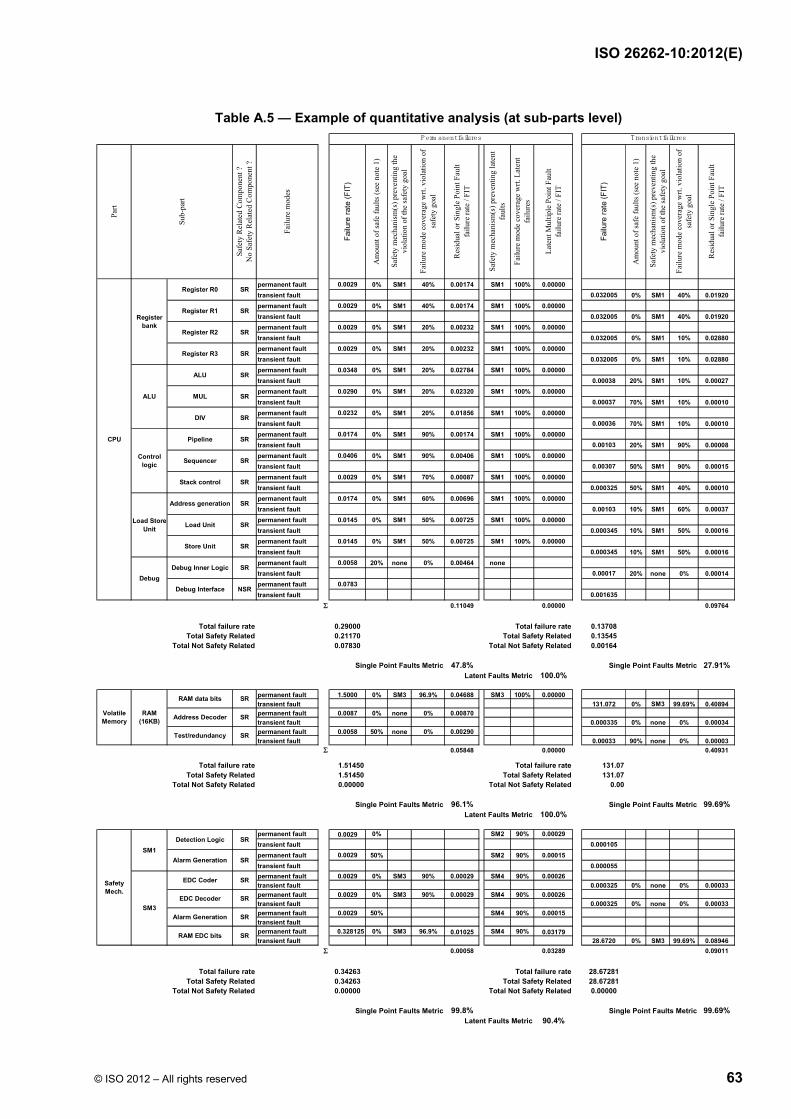
ISO 26262-10:2012(E)
© ISO 2012 – All rights reserved 63
Table A.5 — Example of quantitative analysis (at sub-parts level)
permanent fault 0.0029 0% SM1 40% 0.00174 SM1 100% 0.00000transient fault 0.032005 0% SM1 40% 0.01920permanent fault 0.0029 0% SM1 40% 0.00174 SM1 100% 0.00000transient fault 0.032005 0% SM1 40% 0.01920permanent fault 0.0029 0% SM1 20% 0.00232 SM1 100% 0.00000transient fault 0.032005 0% SM1 10% 0.02880permanent fault 0.0029 0% SM1 20% 0.00232 SM1 100% 0.00000transient fault 0.032005 0% SM1 10% 0.02880permanent fault 0.0348 0% SM1 20% 0.02784 SM1 100% 0.00000transient fault 0.00038 20% SM1 10% 0.00027permanent fault 0.0290 0% SM1 20% 0.02320 SM1 100% 0.00000transient fault 0.00037 70% SM1 10% 0.00010permanent fault 0.0232 0% SM1 20% 0.01856 SM1 100% 0.00000transient fault 0.00036 70% SM1 10% 0.00010permanent fault 0.0174 0% SM1 90% 0.00174 SM1 100% 0.00000transient fault 0.00103 20% SM1 90% 0.00008permanent fault 0.0406 0% SM1 90% 0.00406 SM1 100% 0.00000transient fault 0.00307 50% SM1 90% 0.00015permanent fault 0.0029 0% SM1 70% 0.00087 SM1 100% 0.00000transient fault 0.000325 50% SM1 40% 0.00010permanent fault 0.0174 0% SM1 60% 0.00696 SM1 100% 0.00000transient fault 0.00103 10% SM1 60% 0.00037permanent fault 0.0145 0% SM1 50% 0.00725 SM1 100% 0.00000transient fault 0.000345 10% SM1 50% 0.00016permanent fault 0.0145 0% SM1 50% 0.00725 SM1 100% 0.00000transient fault 0.000345 10% SM1 50% 0.00016permanent fault 0.0058 20% none 0% 0.00464 nonetransient fault 0.00017 20% none 0% 0.00014permanent fault 0.0783transient fault 0.001635
Σ 0.11049 0.00000 0.09764
Total failure rate 0.29000 Total failure rate 0.13708Total Safety Related 0.21170 Total Safety Related 0.13545
Total Not Safety Related 0.07830 Total Not Safety Related 0.00164
Single Point Faults Metric 47.8% Single Point Faults Metric 27.91%Latent Faults Metric 100.0%
permanent fault 1.5000 0% SM3 96.9% 0.04688 SM3 100% 0.00000transient fault 131.072 0% SM3 99.69% 0.40894permanent fault 0.0087 0% none 0% 0.00870transient fault 0.000335 0% none 0% 0.00034permanent fault 0.0058 50% none 0% 0.00290transient fault 0.00033 90% none 0% 0.00003
Σ 0.05848 0.00000 0.40931
Total failure rate 1.51450 Total failure rate 131.07Total Safety Related 1.51450 Total Safety Related 131.07
Total Not Safety Related 0.00000 Total Not Safety Related 0.00
Single Point Faults Metric 96.1% Single Point Faults Metric 99.69%Latent Faults Metric 100.0%
permanent fault 0.0029 0% SM2 90% 0.00029transient fault 0.000105permanent fault 0.0029 50% SM2 90% 0.00015transient fault 0.000055permanent fault 0.0029 0% SM3 90% 0.00029 SM4 90% 0.00026transient fault 0.000325 0% none 0% 0.00033permanent fault 0.0029 0% SM3 90% 0.00029 SM4 90% 0.00026transient fault 0.000325 0% none 0% 0.00033permanent fault 0.0029 50% SM4 90% 0.00015transient faultpermanent fault 0.328125 0% SM3 96.9% 0.01025 SM4 90% 0.03179transient fault 28.6720 0% SM3 99.69% 0.08946
Σ 0.00058 0.03289 0.09011
Total failure rate 0.34263 Total failure rate 28.67281Total Safety Related 0.34263 Total Safety Related 28.67281
Total Not Safety Related 0.00000 Total Not Safety Related 0.00000
Single Point Faults Metric 99.8% Single Point Faults Metric 99.69%Latent Faults Metric 90.4%
Sub-
part
CPU
RAM EDC bits SR
SR
SR
EDC Decoder
SafetyMech.
SM3
SR
NSR
Volatile Memory
RAM(16KB) Address Decoder SR
Test/redundancy SR
SR
Debug Inner Logic
Stack control
Load Unit
Store Unit
Register bank
SR
SR
SR
Control logic
Register R1
Pipeline
ALU
Address generation
MUL
Failu
re m
odes
SR
DIV
SR
SR
SR
Register R2
Register R3
SR
Register R0
Part
Safe
ty m
echa
nism
(s) p
reve
ntin
g la
tent
fa
ults
Failu
re m
ode
cove
rage
wrt.
Lat
ent
failu
res
Safe
ty R
elat
ed C
ompo
nent
?N
o Sa
fety
Rel
ated
Com
pone
nt ?
Failu
re ra
te (F
IT)
Am
ount
of s
afe
faul
ts (s
ee n
ote
1)
Failu
re m
ode
cove
rage
wrt.
vio
latio
n of
sa
fety
goa
l
Res
idua
l or S
ingl
e Po
int F
ault
failu
re ra
te /
FIT
Transient failures
Res
idua
l or S
ingl
e Po
int F
ault
failu
re ra
te /
FIT
Failu
re m
ode
cove
rage
wrt.
vio
latio
n of
sa
fety
goa
l
P erm anent failures
Safe
ty m
echa
nism
(s) p
reve
ntin
g th
e vi
olat
ion
of th
e sa
fety
goa
l
Am
ount
of s
afe
faul
ts (s
ee n
ote
1)
Safe
ty m
echa
nism
(s) p
reve
ntin
g th
e vi
olat
ion
of th
e sa
fety
goa
l
Failu
re ra
te (F
IT)
Late
nt M
ultip
le P
oint
Fau
ltfa
ilure
rate
/ FI
T
Load StoreUnit
RAM data bits
SR
SR
SR
SR
Debug Interface
Sequencer
ALU
Debug
Alarm Generation SR
SM1Detection Logic SR
Alarm Generation SR
EDC Coder
SR
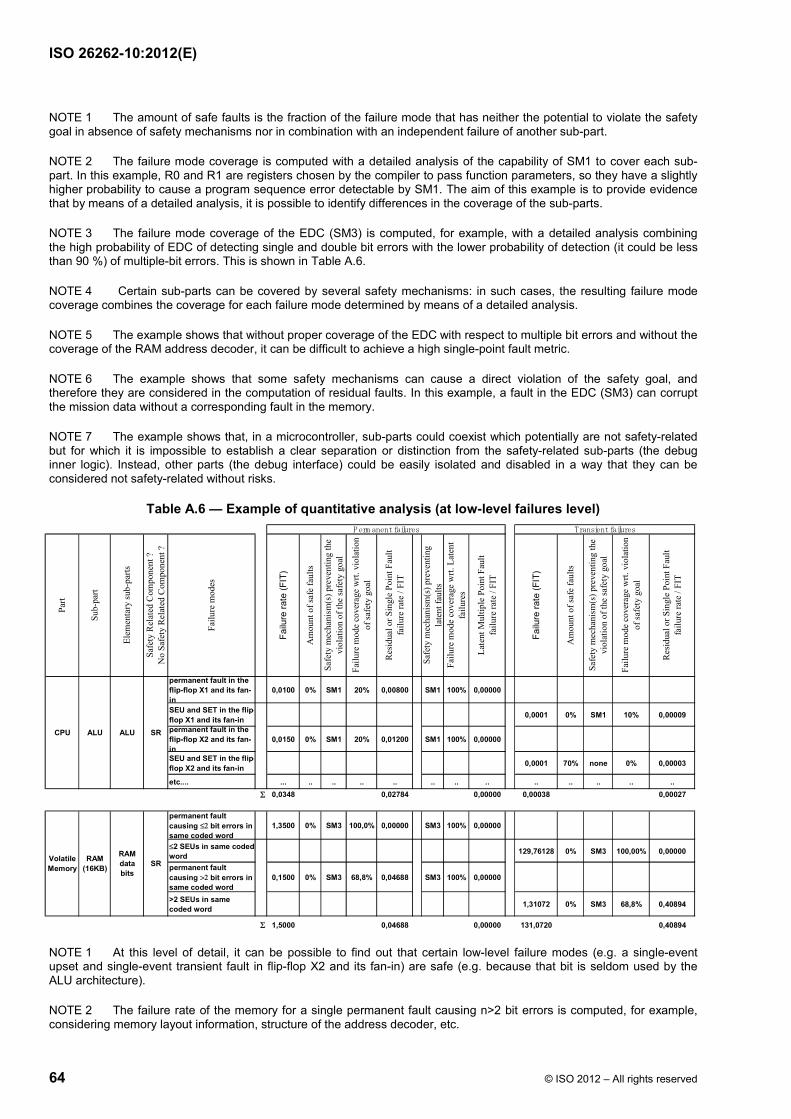
ISO 26262-10:2012(E)
64 © ISO 2012 – All rights reserved
NOTE 1 The amount of safe faults is the fraction of the failure mode that has neither the potential to violate the safety goal in absence of safety mechanisms nor in combination with an independent failure of another sub-part.
NOTE 2 The failure mode coverage is computed with a detailed analysis of the capability of SM1 to cover each sub-part. In this example, R0 and R1 are registers chosen by the compiler to pass function parameters, so they have a slightly higher probability to cause a program sequence error detectable by SM1. The aim of this example is to provide evidence that by means of a detailed analysis, it is possible to identify differences in the coverage of the sub-parts.
NOTE 3 The failure mode coverage of the EDC (SM3) is computed, for example, with a detailed analysis combining the high probability of EDC of detecting single and double bit errors with the lower probability of detection (it could be less than 90 %) of multiple-bit errors. This is shown in Table A.6.
NOTE 4 Certain sub-parts can be covered by several safety mechanisms: in such cases, the resulting failure mode coverage combines the coverage for each failure mode determined by means of a detailed analysis.
NOTE 5 The example shows that without proper coverage of the EDC with respect to multiple bit errors and without the coverage of the RAM address decoder, it can be difficult to achieve a high single-point fault metric.
NOTE 6 The example shows that some safety mechanisms can cause a direct violation of the safety goal, and therefore they are considered in the computation of residual faults. In this example, a fault in the EDC (SM3) can corrupt the mission data without a corresponding fault in the memory.
NOTE 7 The example shows that, in a microcontroller, sub-parts could coexist which potentially are not safety-related but for which it is impossible to establish a clear separation or distinction from the safety-related sub-parts (the debug inner logic). Instead, other parts (the debug interface) could be easily isolated and disabled in a way that they can be considered not safety-related without risks.
Table A.6 — Example of quantitative analysis (at low-level failures level)
NOTE 1 At this level of detail, it can be possible to find out that certain low-level failure modes (e.g. a single-event upset and single-event transient fault in flip-flop X2 and its fan-in) are safe (e.g. because that bit is seldom used by the ALU architecture).
NOTE 2 The failure rate of the memory for a single permanent fault causing n>2 bit errors is computed, for example, considering memory layout information, structure of the address decoder, etc.
permanent fault in the flip-flop X1 and its fan-in
0,0100 0% SM1 20% 0,00800 SM1 100% 0,00000
SEU and SET in the flip-flop X1 and its fan-in 0,0001 0% SM1 10% 0,00009
permanent fault in the flip-flop X2 and its fan-in
0,0150 0% SM1 20% 0,01200 SM1 100% 0,00000
SEU and SET in the flip-flop X2 and its fan-in 0,0001 70% none 0% 0,00003
etc.... ... .. .. .. .. .. .. .. .. .. .. .. ..Σ 0,0348 0,02784 0,00000 0,00038 0,00027
permanent fault causing ≤2 bit errors in same coded word
1,3500 0% SM3 100,0% 0,00000 SM3 100% 0,00000
≤2 SEUs in same coded word 129,76128 0% SM3 100,00% 0,00000
permanent fault causing >2 bit errors in same coded word
0,1500 0% SM3 68,8% 0,04688 SM3 100% 0,00000
>2 SEUs in same coded word 1,31072 0% SM3 68,8% 0,40894
Σ 1,5000 0,04688 0,00000 131,0720 0,40894
Safe
ty m
echa
nism
(s) p
reve
ntin
g th
e vi
olat
ion
of th
e sa
fety
goa
l
Transient failuresPerm anent failures
Safe
ty m
echa
nism
(s) p
reve
ntin
g th
e vi
olat
ion
of th
e sa
fety
goa
l
Res
idua
l or S
ingl
e Po
int F
ault
failu
re ra
te /
FIT
Failu
re m
ode
cove
rage
wrt.
Lat
ent
failu
res
Safe
ty m
echa
nism
(s) p
reve
ntin
g la
tent
faul
ts
Failu
re m
ode
cove
rage
wrt.
vio
latio
n of
safe
ty g
oal
Am
ount
of s
afe
faul
ts
Failu
re ra
te (F
IT)
ALU
Volatile Memory
RAM (16KB)
Res
idua
l or S
ingl
e Po
int F
ault
failu
re ra
te /
FIT
Failu
re ra
te (F
IT)
Sub-
part
Am
ount
of s
afe
faul
ts
Failu
re m
ode
cove
rage
wrt.
vio
latio
n of
safe
ty g
oal
CPU
Part
Late
nt M
ultip
le P
oint
Fau
ltfa
ilure
rate
/ FI
T
RAM data bits
SR
SR
Elem
enta
ry su
b-pa
rts
ALU
Safe
ty R
elat
ed C
ompo
nent
?N
o Sa
fety
Rel
ated
Com
pone
nt ?
Failu
re m
odes
ISO 26262-10:2012(E)
© ISO 2012 – All rights reserved 65
NOTE 3 The EDC (SM3) coverage for >2 bit errors is computed with a detailed analysis considering the number of bits in each coded word (in this case 32) and the number of code bits (in this case 7). Depending on those parameters, coverage can be much higher.
A.3.6 Example of dependent failures analysis
The general requirements and recommendations related to identification, evaluation and resolution of dependent failures are respectively defined in ISO 26262-9.
The dependent failures analysis is structured into the following steps:
1) Identify parts which could be subject to dependent failures.
NOTE 1 Structures of parts which are claimed to be independent to each other in the safety concept of the microcontroller can be susceptible to dependent failure.
NOTE 2 The identification can be supported by deductive safety analyses: Events assumed to be independent in a dual and multiple-point failures analysis provide useful information about parts vulnerable to dependent failures.
2) Identify sources for potential dependent failures. The topics listed in this section and other foreseeable physical and logical dependent failure sources (shared logical parts and signals) are considered, including effects due to the coexistence of functions with different ASILs.
3) Identify the coupling mechanism between the parts enabling dependent failures.
4) Qualitatively list and evaluate the measures to prevent the dependent failures.
5) Qualitatively list and evaluate the design measures taken to control the effect caused by the remaining dependent failures on each structure of parts identified in step 1.
NOTE As stated in the Note of ISO 26262-9:2011, 7.4.2, the analysis of dependent failures is performed on a qualitative basis because no general and sufficiently reliable method exists for quantifying such failures.
As written in Note 1 of ISO 26262-9:2011, 7.4.4, the evaluation of dependent failures can be supported by appropriate checklists, i.e. checklists based on field experience. Those checklists aim to provide the analysts with representative examples of root causes and coupling factors such as: same design, same process, same component, same interface and proximity.
Table A.7 lists the topics considered for dependent failures evaluation as seen in ISO 26262-9:2011, 7.4.4. The table also gives a non-exhaustive example of initiators and coupling mechanisms that could lead to dependent failures with examples for avoidance or detection measures.
NOTE The listed measures are just some of the possible options. Other measures for avoidance or detection of dependent failures are possible, e.g. based on system-level safety mechanisms.
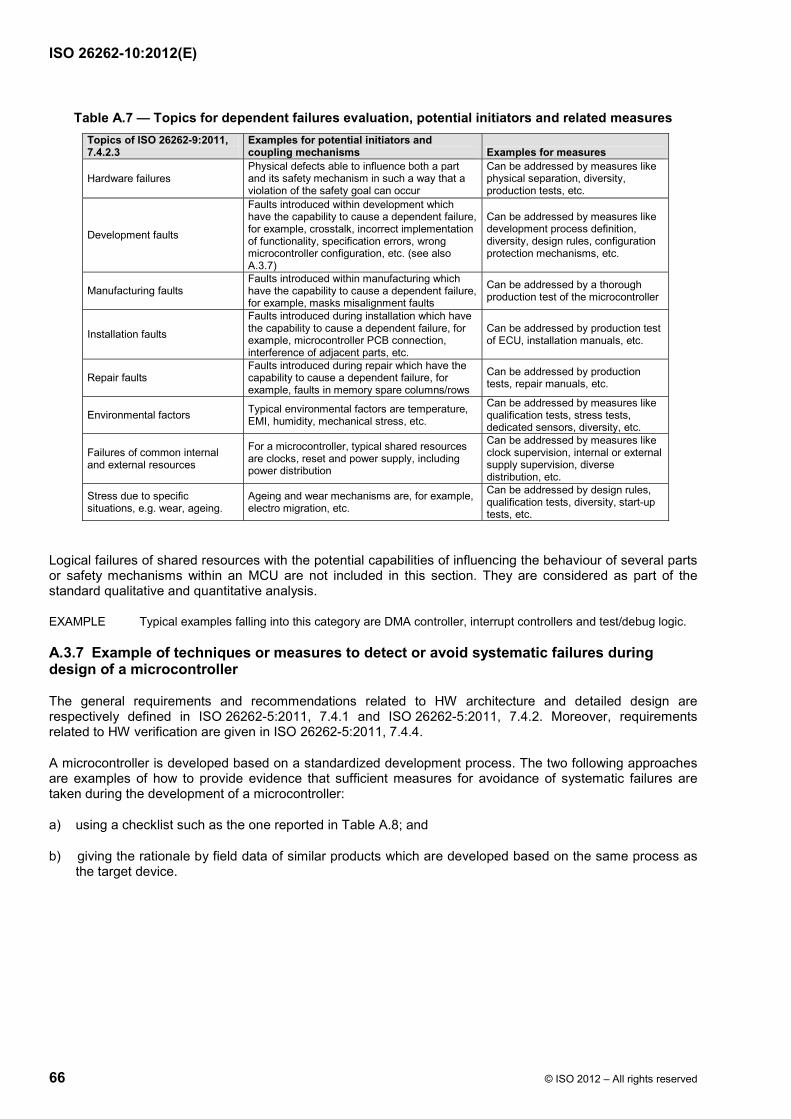
ISO 26262-10:2012(E)
66 © ISO 2012 – All rights reserved
Table A.7 — Topics for dependent failures evaluation, potential initiators and related measures Topics of ISO 26262-9:2011, 7.4.2.3
Examples for potential initiators and coupling mechanisms Examples for measures
Hardware failures Physical defects able to influence both a part and its safety mechanism in such a way that a violation of the safety goal can occur
Can be addressed by measures like physical separation, diversity, production tests, etc.
Development faults
Faults introduced within development which have the capability to cause a dependent failure, for example, crosstalk, incorrect implementation of functionality, specification errors, wrong microcontroller configuration, etc. (see also A.3.7)
Can be addressed by measures like development process definition, diversity, design rules, configuration protection mechanisms, etc.
Manufacturing faults Faults introduced within manufacturing which have the capability to cause a dependent failure, for example, masks misalignment faults
Can be addressed by a thorough production test of the microcontroller
Installation faults
Faults introduced during installation which have the capability to cause a dependent failure, for example, microcontroller PCB connection, interference of adjacent parts, etc.
Can be addressed by production test of ECU, installation manuals, etc.
Repair faults Faults introduced during repair which have the capability to cause a dependent failure, for example, faults in memory spare columns/rows
Can be addressed by production tests, repair manuals, etc.
Environmental factors Typical environmental factors are temperature, EMI, humidity, mechanical stress, etc.
Can be addressed by measures like qualification tests, stress tests, dedicated sensors, diversity, etc.
Failures of common internal and external resources
For a microcontroller, typical shared resources are clocks, reset and power supply, including power distribution
Can be addressed by measures like clock supervision, internal or external supply supervision, diverse distribution, etc.
Stress due to specific situations, e.g. wear, ageing.
Ageing and wear mechanisms are, for example, electro migration, etc.
Can be addressed by design rules, qualification tests, diversity, start-up tests, etc.
Logical failures of shared resources with the potential capabilities of influencing the behaviour of several parts or safety mechanisms within an MCU are not included in this section. They are considered as part of the standard qualitative and quantitative analysis.
EXAMPLE Typical examples falling into this category are DMA controller, interrupt controllers and test/debug logic.
A.3.7 Example of techniques or measures to detect or avoid systematic failures during design of a microcontroller
The general requirements and recommendations related to HW architecture and detailed design are respectively defined in ISO 26262-5:2011, 7.4.1 and ISO 26262-5:2011, 7.4.2. Moreover, requirements related to HW verification are given in ISO 26262-5:2011, 7.4.4.
A microcontroller is developed based on a standardized development process. The two following approaches are examples of how to provide evidence that sufficient measures for avoidance of systematic failures are taken during the development of a microcontroller:
a) using a checklist such as the one reported in Table A.8; and
b) giving the rationale by field data of similar products which are developed based on the same process as the target device.
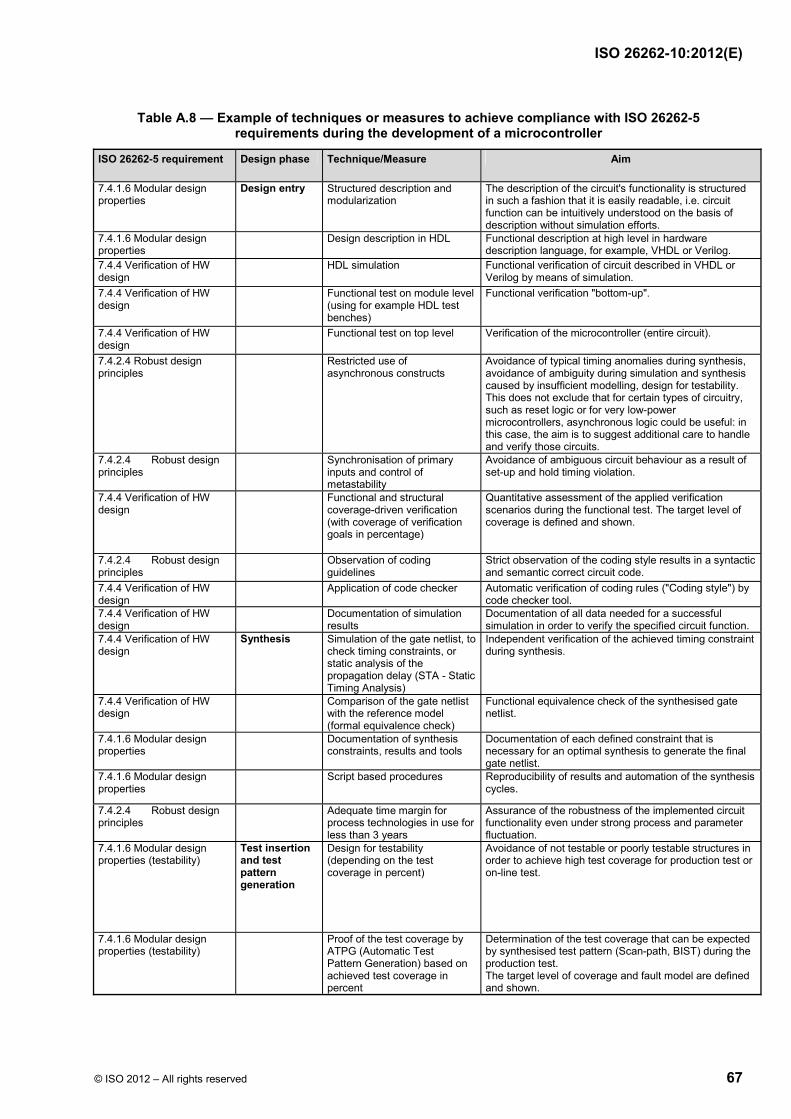
ISO 26262-10:2012(E)
© ISO 2012 – All rights reserved 67
Table A.8 — Example of techniques or measures to achieve compliance with ISO 26262-5 requirements during the development of a microcontroller
ISO 26262-5 requirement Design phase Technique/Measure Aim
7.4.1.6 Modular design properties
Design entry Structured description and modularization
The description of the circuit's functionality is structured in such a fashion that it is easily readable, i.e. circuit function can be intuitively understood on the basis of description without simulation efforts.
7.4.1.6 Modular design properties
Design description in HDL Functional description at high level in hardware description language, for example, VHDL or Verilog.
7.4.4 Verification of HW design
HDL simulation Functional verification of circuit described in VHDL or Verilog by means of simulation.
7.4.4 Verification of HW design
Functional test on module level (using for example HDL test benches)
Functional verification "bottom-up".
7.4.4 Verification of HW design
Functional test on top level Verification of the microcontroller (entire circuit).
7.4.2.4 Robust design principles
Restricted use of asynchronous constructs
Avoidance of typical timing anomalies during synthesis, avoidance of ambiguity during simulation and synthesis caused by insufficient modelling, design for testability. This does not exclude that for certain types of circuitry, such as reset logic or for very low-power microcontrollers, asynchronous logic could be useful: in this case, the aim is to suggest additional care to handle and verify those circuits.
7.4.2.4 Robust design principles
Synchronisation of primary inputs and control of metastability
Avoidance of ambiguous circuit behaviour as a result of set-up and hold timing violation.
7.4.4 Verification of HW design
Functional and structural coverage-driven verification (with coverage of verification goals in percentage)
Quantitative assessment of the applied verification scenarios during the functional test. The target level of coverage is defined and shown.
7.4.2.4 Robust design principles
Observation of coding guidelines
Strict observation of the coding style results in a syntactic and semantic correct circuit code.
7.4.4 Verification of HW design
Application of code checker Automatic verification of coding rules ("Coding style") by code checker tool.
7.4.4 Verification of HW design
Documentation of simulation results
Documentation of all data needed for a successful simulation in order to verify the specified circuit function.
7.4.4 Verification of HW design
Synthesis Simulation of the gate netlist, to check timing constraints, or static analysis of the propagation delay (STA - Static Timing Analysis)
Independent verification of the achieved timing constraint during synthesis.
7.4.4 Verification of HW design
Comparison of the gate netlist with the reference model (formal equivalence check)
Functional equivalence check of the synthesised gate netlist.
7.4.1.6 Modular design properties
Documentation of synthesis constraints, results and tools
Documentation of each defined constraint that is necessary for an optimal synthesis to generate the final gate netlist.
7.4.1.6 Modular design properties
Script based procedures Reproducibility of results and automation of the synthesis cycles.
7.4.2.4 Robust design principles
Adequate time margin for process technologies in use for less than 3 years
Assurance of the robustness of the implemented circuit functionality even under strong process and parameter fluctuation.
7.4.1.6 Modular design properties (testability)
Test insertion and test pattern generation
Design for testability (depending on the test coverage in percent)
Avoidance of not testable or poorly testable structures in order to achieve high test coverage for production test or on-line test.
7.4.1.6 Modular design properties (testability)
Proof of the test coverage by ATPG (Automatic Test Pattern Generation) based on achieved test coverage in percent
Determination of the test coverage that can be expected by synthesised test pattern (Scan-path, BIST) during the production test. The target level of coverage and fault model are defined and shown.
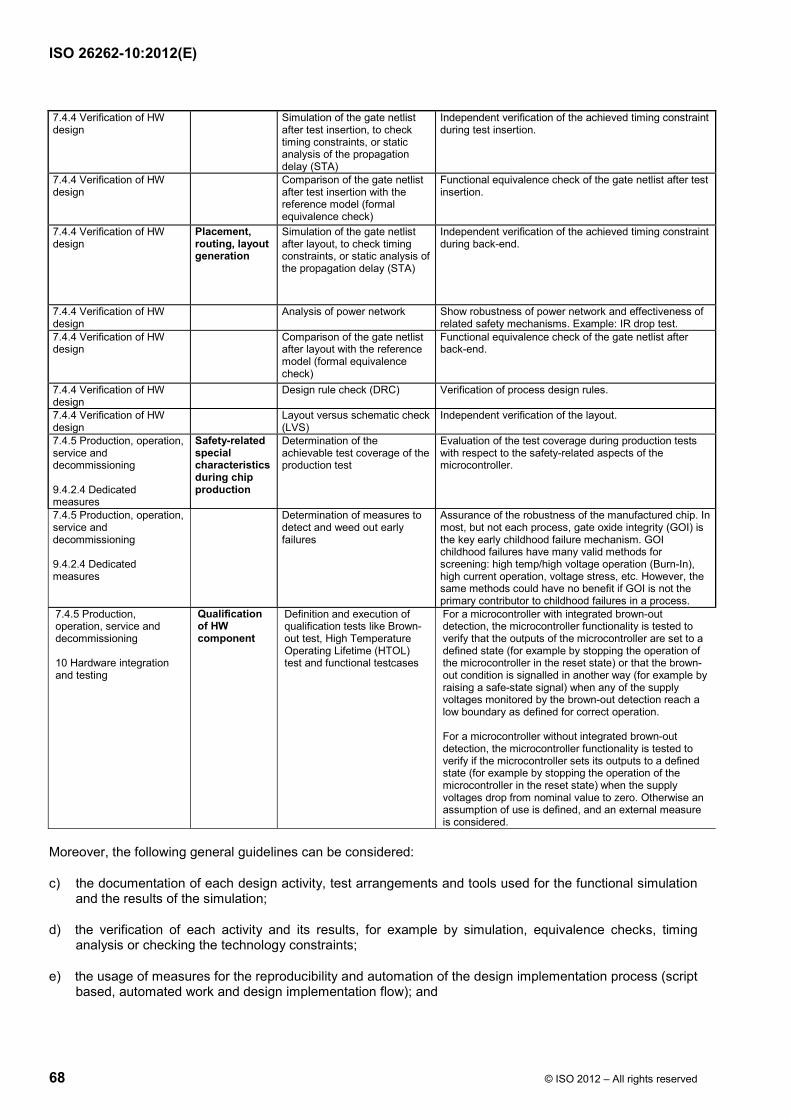
ISO 26262-10:2012(E)
68 © ISO 2012 – All rights reserved
7.4.4 Verification of HW design
Simulation of the gate netlist after test insertion, to check timing constraints, or static analysis of the propagation delay (STA)
Independent verification of the achieved timing constraint during test insertion.
7.4.4 Verification of HW design
Comparison of the gate netlist after test insertion with the reference model (formal equivalence check)
Functional equivalence check of the gate netlist after test insertion.
7.4.4 Verification of HW design
Placement, routing, layout generation
Simulation of the gate netlist after layout, to check timing constraints, or static analysis of the propagation delay (STA)
Independent verification of the achieved timing constraint during back-end.
7.4.4 Verification of HW design
Analysis of power network Show robustness of power network and effectiveness of related safety mechanisms. Example: IR drop test.
7.4.4 Verification of HW design
Comparison of the gate netlist after layout with the reference model (formal equivalence check)
Functional equivalence check of the gate netlist after back-end.
7.4.4 Verification of HW design
Design rule check (DRC) Verification of process design rules.
7.4.4 Verification of HW design
Layout versus schematic check (LVS)
Independent verification of the layout.
7.4.5 Production, operation, service and decommissioning 9.4.2.4 Dedicated measures
Safety-related special characteristics during chip production
Determination of the achievable test coverage of the production test
Evaluation of the test coverage during production tests with respect to the safety-related aspects of the microcontroller.
7.4.5 Production, operation, service and decommissioning 9.4.2.4 Dedicated measures
Determination of measures to detect and weed out early failures
Assurance of the robustness of the manufactured chip. In most, but not each process, gate oxide integrity (GOI) is the key early childhood failure mechanism. GOI childhood failures have many valid methods for screening: high temp/high voltage operation (Burn-In), high current operation, voltage stress, etc. However, the same methods could have no benefit if GOI is not the primary contributor to childhood failures in a process.
7.4.5 Production, operation, service and decommissioning 10 Hardware integration and testing
Qualification of HW component
Definition and execution of qualification tests like Brown-out test, High Temperature Operating Lifetime (HTOL) test and functional testcases
For a microcontroller with integrated brown-out detection, the microcontroller functionality is tested to verify that the outputs of the microcontroller are set to a defined state (for example by stopping the operation of the microcontroller in the reset state) or that the brown-out condition is signalled in another way (for example by raising a safe-state signal) when any of the supply voltages monitored by the brown-out detection reach a low boundary as defined for correct operation. For a microcontroller without integrated brown-out detection, the microcontroller functionality is tested to verify if the microcontroller sets its outputs to a defined state (for example by stopping the operation of the microcontroller in the reset state) when the supply voltages drop from nominal value to zero. Otherwise an assumption of use is defined, and an external measure is considered.
Moreover, the following general guidelines can be considered:
c) the documentation of each design activity, test arrangements and tools used for the functional simulation and the results of the simulation;
d) the verification of each activity and its results, for example by simulation, equivalence checks, timing analysis or checking the technology constraints;
e) the usage of measures for the reproducibility and automation of the design implementation process (script based, automated work and design implementation flow); and
ISO 26262-10:2012(E)
© ISO 2012 – All rights reserved 69
NOTE This implies ability to freeze tool versions to enable reproducibility in the future in compliance with the legal requirements.
f) the usage – for 3rd party soft-cores and hard-cores – of validated macro blocks and to comply with each constraint and proceeding defined by the macro core provider if practicable.
A.3.8 Microcontroller HW design verification
A.3.8.1 General
As seen in ISO 26262-5:2011, 7.4.4.1, the hardware design is verified as given in ISO 26262-8:2011, Clause 9 (Evaluation of safety goal violations due to random hardware failures), for compliance and completeness with respect to the hardware safety requirements.
Fault injection is just one of the possible methods for verification, and other approaches are possible.
EXAMPLE 1 Either usage of expert judgement or previous proven results when state of the art solutions exist as higher level protocols on communication elements (e.g. SW layer on CAN communications as defined in IEC 61784).
The choice and depth of verification can depend on the stage of the analysis and on the safety mechanisms used (inside the microcontroller or at the system level).
EXAMPLE 2 Following the reasoning of Example 1 of paragraph A.3.3, in the case of a full HW redundancy (e.g. usage of dual core lock step solutions in which each of the outputs of two identical CPUs are compared by HW at each clock cycle), the verification of the failure mode coverage does not need to consider each and every CPU internal register. Instead, a more detailed verification can be needed for the CPU interfaces and for the lock-step comparator.
A.3.8.2 Verification using fault injection simulation
As mentioned in ISO 26262-5:2011, Table 3, fault injection simulation during development phase is a valid method to verify completeness and correctness of safety mechanism implementation with respect to hardware safety requirements.
This is especially true for microcontrollers for which fault insertion testing of single-event upset at HW level is impractical or even impossible for certain fault models. Therefore, fault injection using design models (e.g. fault injection done on the gate-level netlist) is helpful to complete the verification step.
NOTE 1 Fault injection can be used both for permanent (e.g. stuck-at faults) and transient (e.g . single-event upset) faults.
NOTE 2 ISO 26262-5:2011, Table D.1 shows that d.c. fault models (others than stuck-at 0 and 1) need to be considered to be able to claim a high level of diagnostic coverage for certain elements when no other suitable evidence is available. It also describes that it is not intended to require an exhaustive analysis of those fault models and that, if properly exercised, methods derived from stuck-at simulations (like N-detect testing, see references [3]-[5]) are known to be effective for verification of d.c. fault models as well.
EXAMPLE 1 A suitable way to simplify the verification of d.c. faults can be to provide evidence that the fault distribution of stuck-open/bridging faults is a very limited portion of the whole d.c. fault models population, i.e. much lower than the stuck-at 0/1 fault population.
EXAMPLE 2 Since exhaustiveness is not required, the d.c. fault models analysis can be applied to a sub-set of the microcontroller sub-parts selected depending on their possible impact from d.c. fault models (for example comparators) or on a statistical basis.
EXAMPLE 3 For N-detect testing, “properly exercised” means that N different detections of the same fault are guaranteed by the pattern set (i.e. pattern richness). N can range from 5 to 10.
EXAMPLE 4 In general, HW safety mechanisms can be more effective to detect each kind of d.c. fault and easier to be verified using e.g. the N-detect approach. On the other hand, in the case of a software-based safety mechanism addressing random hardware failures, it can be difficult with the N-detect technique to gain a high level of confidence in the pattern richness due to the possible change of the context between subsequent executions of the test at run time. In this case, alternative solutions can be applicable (e.g. [7]).
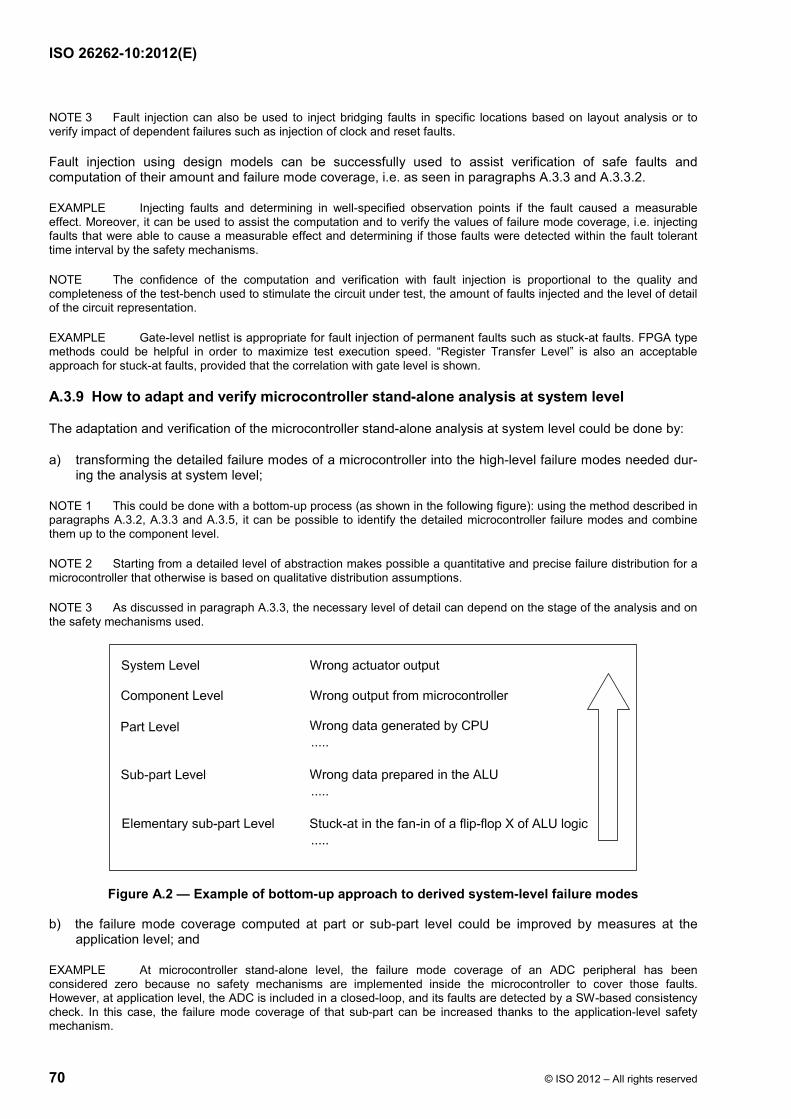
ISO 26262-10:2012(E)
70 © ISO 2012 – All rights reserved
NOTE 3 Fault injection can also be used to inject bridging faults in specific locations based on layout analysis or to verify impact of dependent failures such as injection of clock and reset faults.
Fault injection using design models can be successfully used to assist verification of safe faults and computation of their amount and failure mode coverage, i.e. as seen in paragraphs A.3.3 and A.3.3.2.
EXAMPLE Injecting faults and determining in well-specified observation points if the fault caused a measurable effect. Moreover, it can be used to assist the computation and to verify the values of failure mode coverage, i.e. injecting faults that were able to cause a measurable effect and determining if those faults were detected within the fault tolerant time interval by the safety mechanisms.
NOTE The confidence of the computation and verification with fault injection is proportional to the quality and completeness of the test-bench used to stimulate the circuit under test, the amount of faults injected and the level of detail of the circuit representation.
EXAMPLE Gate-level netlist is appropriate for fault injection of permanent faults such as stuck-at faults. FPGA type methods could be helpful in order to maximize test execution speed. “Register Transfer Level” is also an acceptable approach for stuck-at faults, provided that the correlation with gate level is shown.
A.3.9 How to adapt and verify microcontroller stand-alone analysis at system level
The adaptation and verification of the microcontroller stand-alone analysis at system level could be done by:
a) transforming the detailed failure modes of a microcontroller into the high-level failure modes needed dur-ing the analysis at system level;
NOTE 1 This could be done with a bottom-up process (as shown in the following figure): using the method described in paragraphs A.3.2, A.3.3 and A.3.5, it can be possible to identify the detailed microcontroller failure modes and combine them up to the component level.
NOTE 2 Starting from a detailed level of abstraction makes possible a quantitative and precise failure distribution for a microcontroller that otherwise is based on qualitative distribution assumptions.
NOTE 3 As discussed in paragraph A.3.3, the necessary level of detail can depend on the stage of the analysis and on the safety mechanisms used.
Figure A.2 — Example of bottom-up approach to derived system-level failure modes
b) the failure mode coverage computed at part or sub-part level could be improved by measures at the application level; and
EXAMPLE At microcontroller stand-alone level, the failure mode coverage of an ADC peripheral has been considered zero because no safety mechanisms are implemented inside the microcontroller to cover those faults. However, at application level, the ADC is included in a closed-loop, and its faults are detected by a SW-based consistency check. In this case, the failure mode coverage of that sub-part can be increased thanks to the application-level safety mechanism.
ISO 26262-10:2012(E)
© ISO 2012 – All rights reserved 71
c) the failure mode coverage computed at part or sub-part level could have been calculated under certain specific assumptions (“assumptions of use”).
NOTE In this case the assumptions are verified at application-level, and if not valid, other assumptions could be made and failure mode coverage recalculated based on the new assumptions.
EXAMPLE At microcontroller stand-alone level, a permanent latent fault of the memory has been considered detected because each single-error correction is signalled by the EDC to the CPU. The assumption was that a software driver had been implemented to handle this event. However, for performance reasons, this software driver was not implemented, and therefore the assumption is not valid anymore. An alternative measure is to program the microcontroller to send the error correction flag directly to the outside world. The latent fault coverage of the memory can be recalculated.
A.3.10 Example of safety documentation for an SEooC microcontroller
As seen in paragraph 8.2.3.6, for a microcontroller developed as SEooC, the necessary information from the work products is provided to the system integrator, including documentation of assumed requirements, assumptions related to the design external to the SEooC and applicable work products.
On that basis, the safety documentation for an SEooC microcontroller can include the following documents or a sub-set of them as specified in the DIA:
⎯ the safety case related to the microcontroller, see ISO 26262-2:2011, 6.5.3;
⎯ the safety plan for the microcontroller, see ISO 26262-2:2011, 6.5.1 and ISO 26262-5:2011, 5.5;
⎯ other plans as seen in ISO 26262-8, when applicable, such as configuration management plan, change management plan, impact analysis and change request plan, verification plan, documentation management plan and SW tool qualification plan;
⎯ the evidence related to the execution of the applicable steps of a safety plan as seen in ISO 26262-2;
⎯ the HW specifications as seen in ISO 26262-5, such as HW safety requirements specification, hardware-software Interface (HSI) specification and HW design specification;
⎯ the reports related to the execution of the applicable steps of the verification plan and other plans as seen in ISO 26262-5 and ISO 26262-8, such as HW safety requirements verification report, hardware design verification report, and hardware integration and verification report;
⎯ the reports related to safety analyses as seen in ISO 26262-5, ISO 26262-8 and ISO 26262-9, such as hardware safety analysis report, review report of the effectiveness of the architecture of the microcontroller to cope with random hardware failures, review report of evaluation of safety goal violations due to random hardware failures and results of analyses of dependent failures.
NOTE The DIA specifies which documents are made available and what level of detail is provided to the microcontroller’s customer.
Moreover, it is worthwhile to collect the following information:
⎯ the description of ISO 26262 lifecycle tailored for the microcontroller; list of applicable work products (description of which work products of the ISO 26262 lifecycle are applicable for the microcontroller);
⎯ the description of the microcontroller safety architecture with an abstract description of microcontroller functionalities and description of safety mechanisms;
⎯ the description of Assumptions of Use (AoU) of the microcontroller with respect to its intended use, including: assumption on the microcontroller safe state; assumptions on fault tolerant time interval and multiple-point faults detection interval; assumptions on the microcontroller context, including its external interfaces;
ISO 26262-10:2012(E)
72 © ISO 2012 – All rights reserved
⎯ the description of the microcontroller configuration and related HW and/or SW procedures to control a failure after its detection;
⎯ the description of safety analysis results at microcontroller level useful for the system integrator, such as description of fault models, failure modes and failure rates considered in the analysis; HW architectural metrics (single-point fault and latent-fault metrics); Probabilistic Metric for random Hardware Failures (PMHF); evaluation of each cause of safety goal violation (ISO 26262-5:2011, 9.4.3); description of dependent failures initiators; description of assumed or implemented measures for avoidance or detection of dependent failures; description of AoUs on which safety analysis are based (e.g. software-based safety mechanisms addressing random hardware failures, etc.);
⎯ the description of the functional safety assessment process; list of confirmation measures and description of the independency level; summary of process for avoidance of systematic failures in the microcontroller.
NOTE This documentation can be combined in one document named a “Safety Manual” or “Safety Application Note” of the SEooC microcontroller.
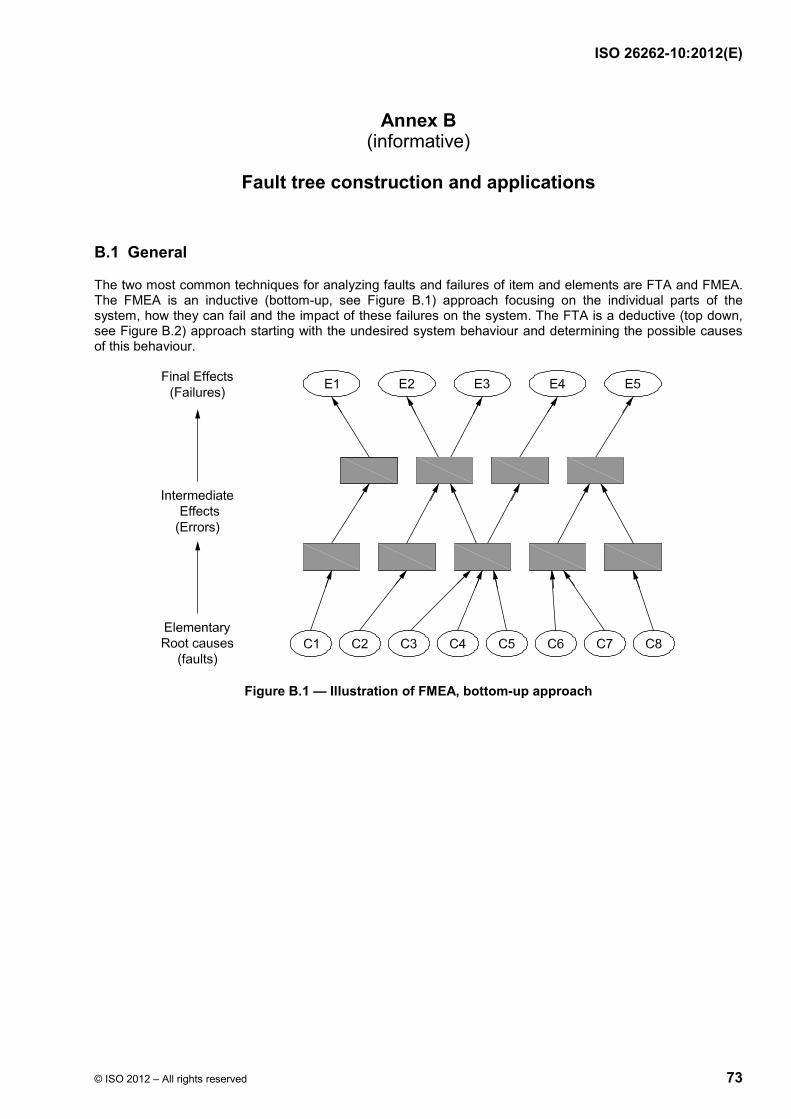
ISO 26262-10:2012(E)
© ISO 2012 – All rights reserved 73
Annex B (informative)
Fault tree construction and applications
B.1 General
The two most common techniques for analyzing faults and failures of item and elements are FTA and FMEA. The FMEA is an inductive (bottom-up, see Figure B.1) approach focusing on the individual parts of the system, how they can fail and the impact of these failures on the system. The FTA is a deductive (top down, see Figure B.2) approach starting with the undesired system behaviour and determining the possible causes of this behaviour.
Figure B.1 — Illustration of FMEA, bottom-up approach
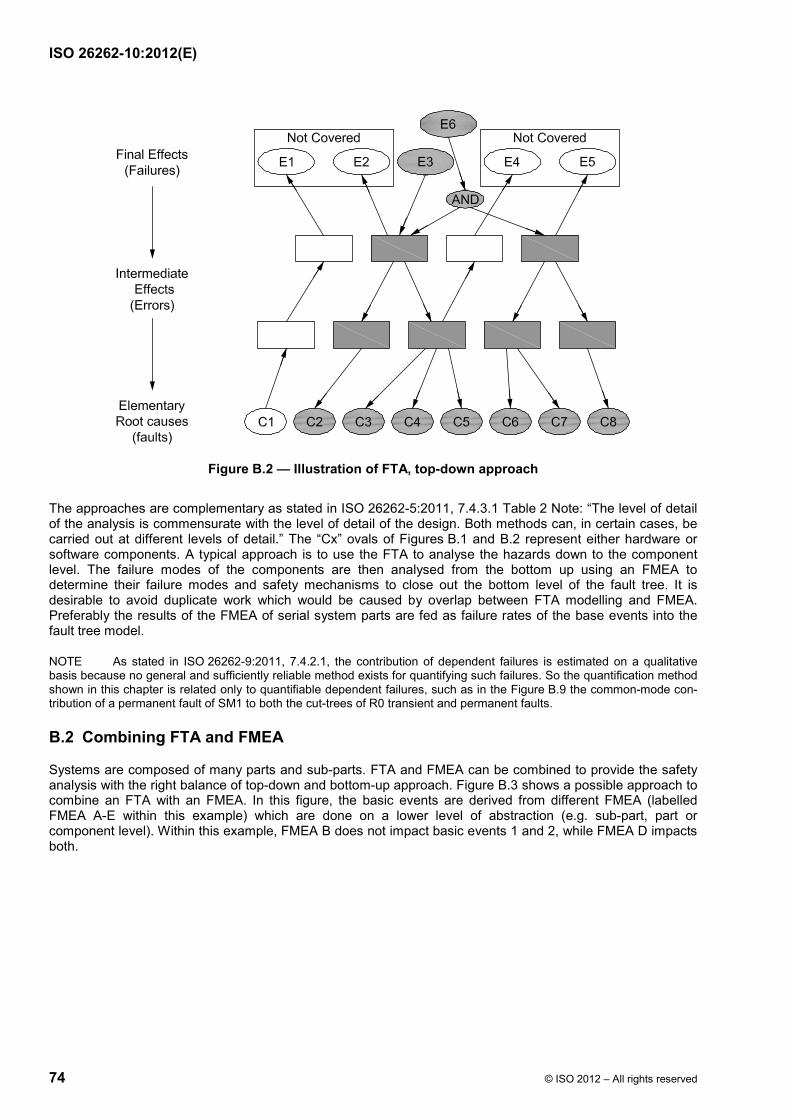
ISO 26262-10:2012(E)
74 © ISO 2012 – All rights reserved
Figure B.2 — Illustration of FTA, top-down approach
The approaches are complementary as stated in ISO 26262-5:2011, 7.4.3.1 Table 2 Note: “The level of detail of the analysis is commensurate with the level of detail of the design. Both methods can, in certain cases, be carried out at different levels of detail.” The “Cx” ovals of Figures B.1 and B.2 represent either hardware or software components. A typical approach is to use the FTA to analyse the hazards down to the component level. The failure modes of the components are then analysed from the bottom up using an FMEA to determine their failure modes and safety mechanisms to close out the bottom level of the fault tree. It is desirable to avoid duplicate work which would be caused by overlap between FTA modelling and FMEA. Preferably the results of the FMEA of serial system parts are fed as failure rates of the base events into the fault tree model.
NOTE As stated in ISO 26262-9:2011, 7.4.2.1, the contribution of dependent failures is estimated on a qualitative basis because no general and sufficiently reliable method exists for quantifying such failures. So the quantification method shown in this chapter is related only to quantifiable dependent failures, such as in the Figure B.9 the common-mode con-tribution of a permanent fault of SM1 to both the cut-trees of R0 transient and permanent faults.
B.2 Combining FTA and FMEA
Systems are composed of many parts and sub-parts. FTA and FMEA can be combined to provide the safety analysis with the right balance of top-down and bottom-up approach. Figure B.3 shows a possible approach to combine an FTA with an FMEA. In this figure, the basic events are derived from different FMEA (labelled FMEA A-E within this example) which are done on a lower level of abstraction (e.g. sub-part, part or component level). Within this example, FMEA B does not impact basic events 1 and 2, while FMEA D impacts both.
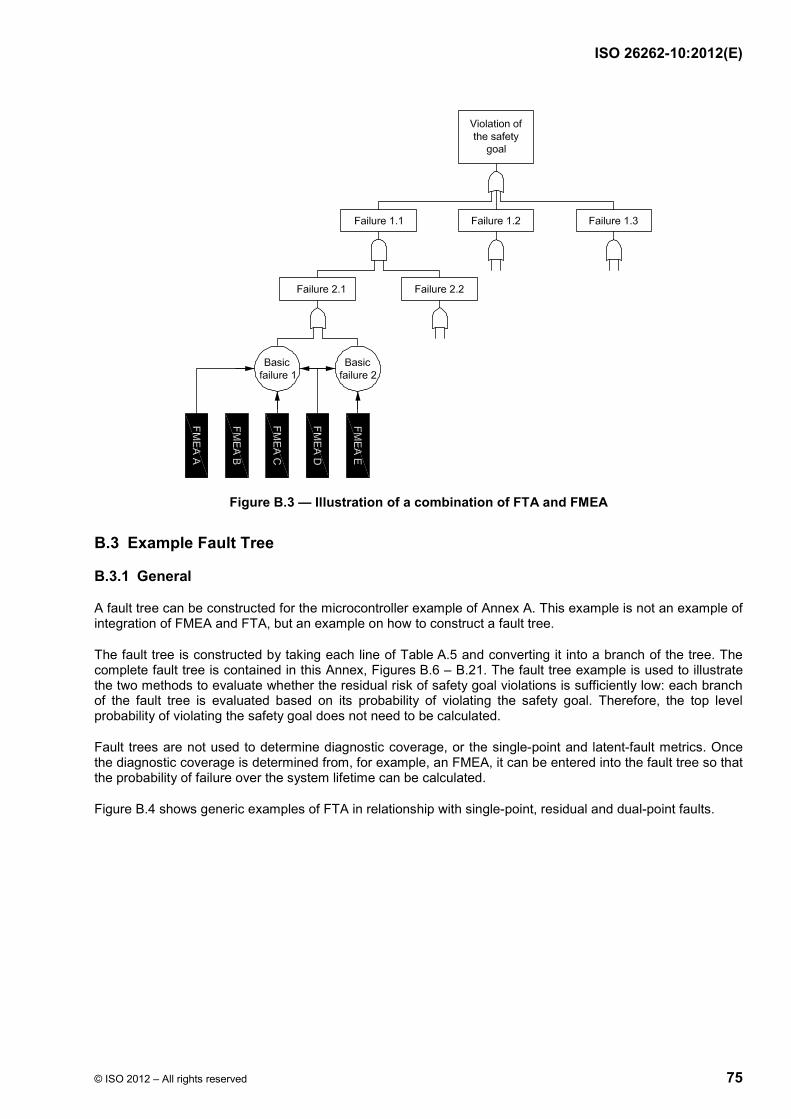
ISO 26262-10:2012(E)
© ISO 2012 – All rights reserved 75
Figure B.3 — Illustration of a combination of FTA and FMEA
B.3 Example Fault Tree
B.3.1 General
A fault tree can be constructed for the microcontroller example of Annex A. This example is not an example of integration of FMEA and FTA, but an example on how to construct a fault tree.
The fault tree is constructed by taking each line of Table A.5 and converting it into a branch of the tree. The complete fault tree is contained in this Annex, Figures B.6 – B.21. The fault tree example is used to illustrate the two methods to evaluate whether the residual risk of safety goal violations is sufficiently low: each branch of the fault tree is evaluated based on its probability of violating the safety goal. Therefore, the top level probability of violating the safety goal does not need to be calculated.
Fault trees are not used to determine diagnostic coverage, or the single-point and latent-fault metrics. Once the diagnostic coverage is determined from, for example, an FMEA, it can be entered into the fault tree so that the probability of failure over the system lifetime can be calculated.
Figure B.4 shows generic examples of FTA in relationship with single-point, residual and dual-point faults.
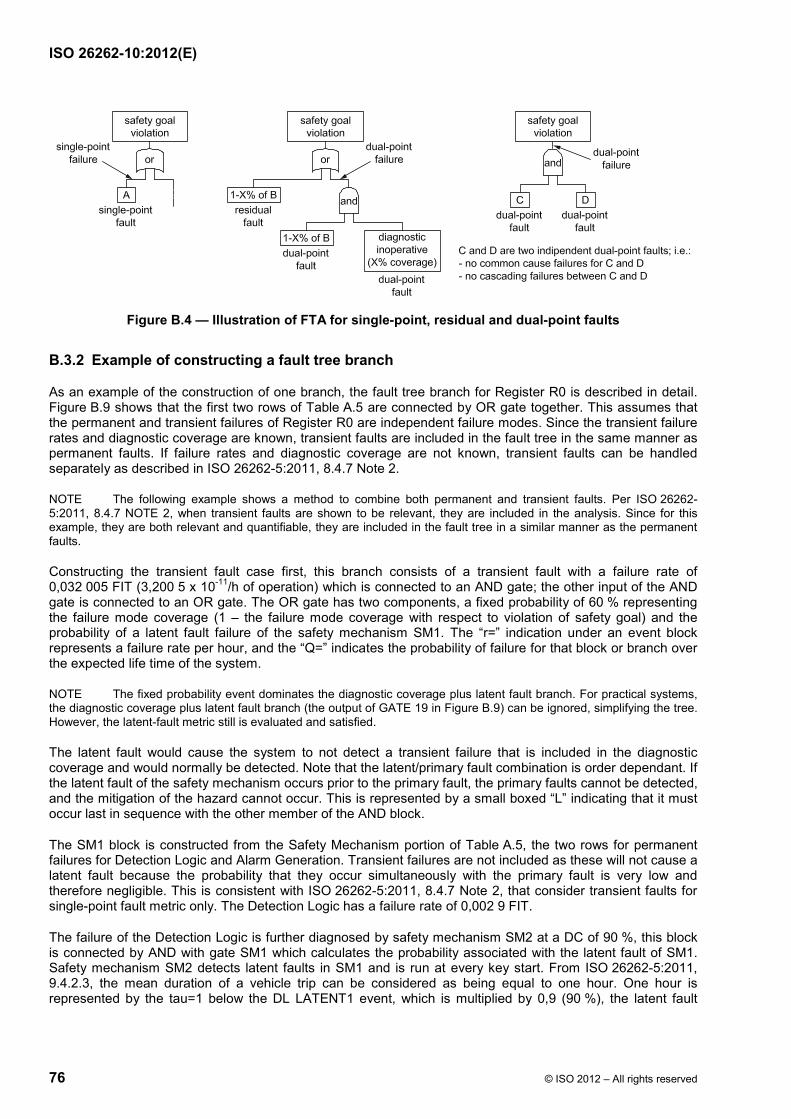
ISO 26262-10:2012(E)
76 © ISO 2012 – All rights reserved
Figure B.4 — Illustration of FTA for single-point, residual and dual-point faults
B.3.2 Example of constructing a fault tree branch
As an example of the construction of one branch, the fault tree branch for Register R0 is described in detail. Figure B.9 shows that the first two rows of Table A.5 are connected by OR gate together. This assumes that the permanent and transient failures of Register R0 are independent failure modes. Since the transient failure rates and diagnostic coverage are known, transient faults are included in the fault tree in the same manner as permanent faults. If failure rates and diagnostic coverage are not known, transient faults can be handled separately as described in ISO 26262-5:2011, 8.4.7 Note 2.
NOTE The following example shows a method to combine both permanent and transient faults. Per ISO 26262-5:2011, 8.4.7 NOTE 2, when transient faults are shown to be relevant, they are included in the analysis. Since for this example, they are both relevant and quantifiable, they are included in the fault tree in a similar manner as the permanent faults.
Constructing the transient fault case first, this branch consists of a transient fault with a failure rate of 0,032 005 FIT (3,200 5 x 10-11/h of operation) which is connected to an AND gate; the other input of the AND gate is connected to an OR gate. The OR gate has two components, a fixed probability of 60 % representing the failure mode coverage (1 – the failure mode coverage with respect to violation of safety goal) and the probability of a latent fault failure of the safety mechanism SM1. The “r=” indication under an event block represents a failure rate per hour, and the “Q=” indicates the probability of failure for that block or branch over the expected life time of the system.
NOTE The fixed probability event dominates the diagnostic coverage plus latent fault branch. For practical systems, the diagnostic coverage plus latent fault branch (the output of GATE 19 in Figure B.9) can be ignored, simplifying the tree. However, the latent-fault metric still is evaluated and satisfied.
The latent fault would cause the system to not detect a transient failure that is included in the diagnostic coverage and would normally be detected. Note that the latent/primary fault combination is order dependant. If the latent fault of the safety mechanism occurs prior to the primary fault, the primary faults cannot be detected, and the mitigation of the hazard cannot occur. This is represented by a small boxed “L” indicating that it must occur last in sequence with the other member of the AND block.
The SM1 block is constructed from the Safety Mechanism portion of Table A.5, the two rows for permanent failures for Detection Logic and Alarm Generation. Transient failures are not included as these will not cause a latent fault because the probability that they occur simultaneously with the primary fault is very low and therefore negligible. This is consistent with ISO 26262-5:2011, 8.4.7 Note 2, that consider transient faults for single-point fault metric only. The Detection Logic has a failure rate of 0,002 9 FIT.
The failure of the Detection Logic is further diagnosed by safety mechanism SM2 at a DC of 90 %, this block is connected by AND with gate SM1 which calculates the probability associated with the latent fault of SM1. Safety mechanism SM2 detects latent faults in SM1 and is run at every key start. From ISO 26262-5:2011, 9.4.2.3, the mean duration of a vehicle trip can be considered as being equal to one hour. One hour is represented by the tau=1 below the DL LATENT1 event, which is multiplied by 0,9 (90 %), the latent fault
ISO 26262-10:2012(E)
© ISO 2012 – All rights reserved 77
coverage of SM2. The portion of the Alarm Generation faults not covered by SM2 is represented by the standard failure rate event ALARM LATENT multiplied by 0,1 (10 % = 1 – latent fault DC).
The permanent fault branch is constructed in a similar manner. The underlining of the triangular-shaped SM1 block indicates that it is not simply a copy of the existing SM1 block in the transient fault portion of the tree but exactly the same failure mode. This can be useful in common mode failure analysis; for example, in Figure B.9, the AND blocks TRANS R0 and PERM R0 contain a common branch.
The example of Table A.5 contains safe faults. Considering the safe faults, the failure rate for basic events is adjusted. For example, the transient ALU fault (row 10 in Table A.5, 20 % safe faults) 0,000 38 FIT is multiplied by 0,8 (1 – 20 %), 3,8x10⁻¹³/h * 0,8 = 3,04 x10⁻¹³/h.
B.4 Probability analysis using the fault tree
Typical quantitative data for component failures are documented as failure rates. For a complex fault tree with many ANDs and ORs, the individual failure rates cannot be combined into an overall system failure rate. For example, a system consisting of two blocks which are connected by an AND-Gate and which have an exponential distribution where both failure rates of λ1 and λ2 are very small (both λ*t values are very small where t represents the system lifetime), will have an approximate probability of failure of λ1 *t * λ2 *t or λ1 λ2 t2.
If the system is an ASIL D system and the failure rate targets of ISO 26262-5:2011, Table 7 are used, the target failure probability per hour is < 10-8/h which refers to a different time frame than λ1λ2t2. One potential way to handle the situation is to use the target failure probability per hour of 10-8/h at system lifetime 10-8/h*t and ensure that λ1λ2t2 ≤ 10-8/h*t or λ1λ2t ≤ 10-8/h. This requires knowledge of the system lifetime, which can be obtained from past usage profiles or system requirements. The fault tree of this Annex was created assuming an arbitrary 5000 h system lifetime.
For the R0 TRANSIENT branch, the probability of a missed detection is primarily due to a lack of diagnostic coverage (Q=0,6) and not due to a latent fault (Q=2,175 x 10-9). This is typical of most practical systems unless the DC is equal to or very close to 100 %. For the cases where the latent fault probabilities are negligible, removing them from the FTA analysis greatly simplifies the analysis. The latent-fault metric is still documented as a separate part of the safety case.
Within the approach of ISO 26262-5:2011, 9.4.3, the probability of a safety-related fault is evaluated at a hardware part level. If this analysis is carried out by means of an FTA, the FTA is structured in such a way that the evaluation at HW part level is possible.
Within this example, this is done in Figure B.6. In ISO 26262-5:2011, 9.4.3.5 and 9.4.3.6, the requirements are given in form of a correlation between the failure rate class of the hardware part and its diagnostic coverage. If the evaluation is done within the FTA, it is useful to translate the requirements of ISO 26262-5:2011, 9.4.3.5 and 9.4.3.6 into an effective requirement concerning the residual failure rate or the single-point failure rate of the hardware part. If, for example, the failure rate class 1 is chosen to be the ASIL D target divided by 100, and the ASIL D target is chosen to be < 10-8 h-1, the requirement of ISO 26262-5:2011, 9.4.3.6 can be reformulated to λRF,HW part ≤ 10-10 h-1, with λRF,HW part being the residual failure rate of the hardware part. In Figure B.6, we see that the probability of a CPU failure leading to a potential violation of a safety goal over the lifetime of 5000 h is 1,040 631 * 10-6. This results in a corresponding probability of 2,08 * 10-10 per hour. Since this value is greater than the required residual failure rate, the requirements of 9.4.3.6 would not be fulfilled.
Using the FTA as described to evaluate the fulfilment of ISO 26262-5:2011, 9.4.3.5 or 9.4.3.6, is conservative since the effective requirements refer to the residual or single-point failure rate of the HW part; the FTA, however, provides the probability also including the dual-point failure scenarios.
Since the FTA does not address the requirements of ISO 26262-5:2011, 9.4.3.11, an additional analysis is necessary to provide evidence that the corresponding requirements concerning the dual-point failure scenarios are fulfilled.
If a rationale is provided, the failure rate class ranking can be divided by a number lower than 100. In this case, it is ensured that a correct ranking is maintained while considering the single-point fault, residual faults and higher degree cut-sets together.
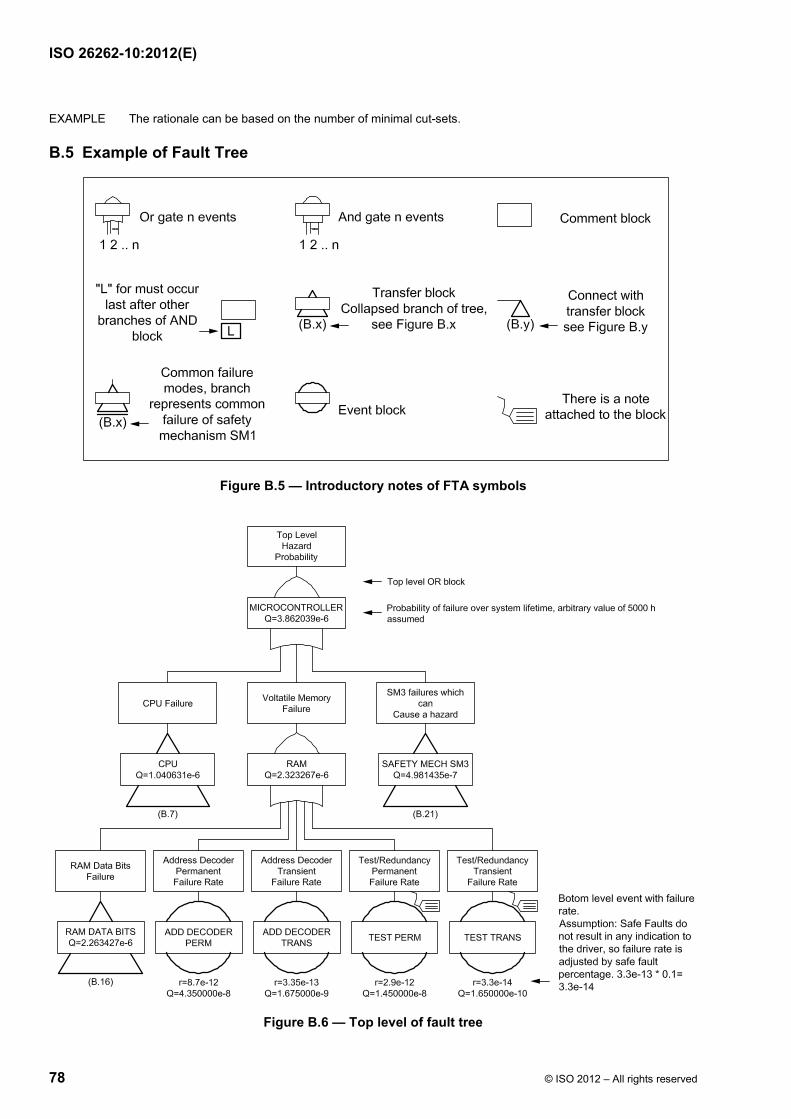
ISO 26262-10:2012(E)
78 © ISO 2012 – All rights reserved
EXAMPLE The rationale can be based on the number of minimal cut-sets.
B.5 Example of Fault Tree
Figure B.5 — Introductory notes of FTA symbols
Figure B.6 — Top level of fault tree
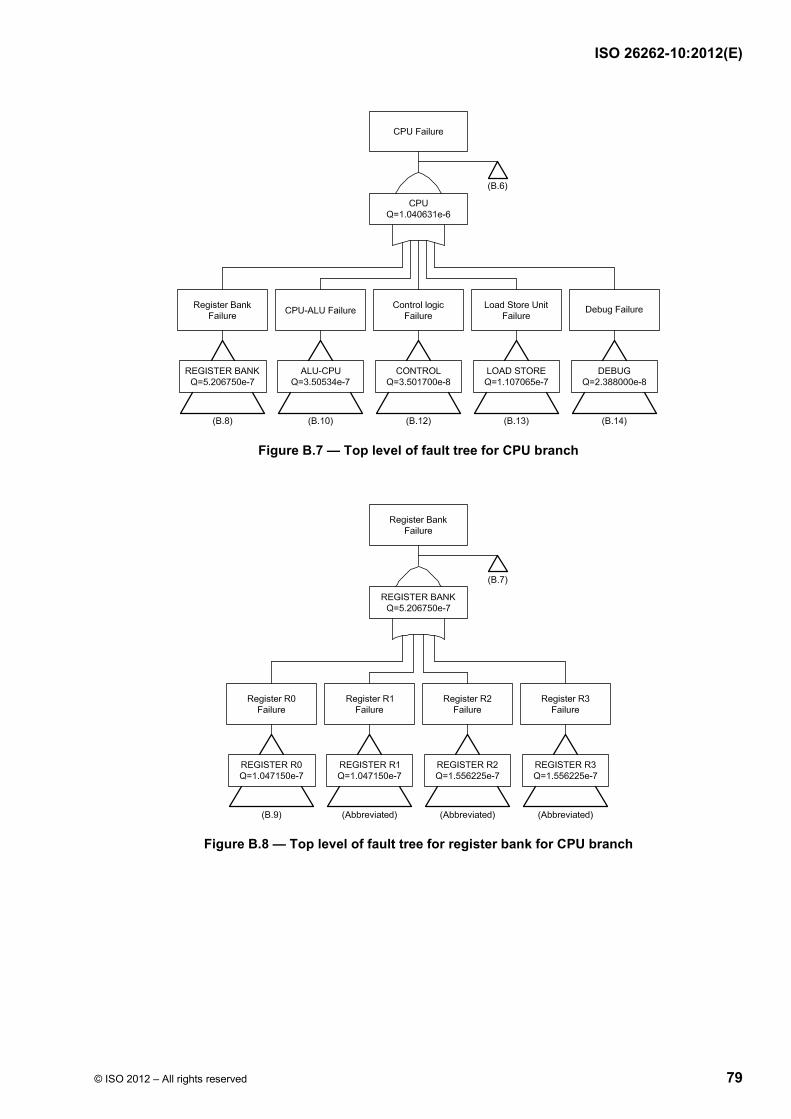
ISO 26262-10:2012(E)
© ISO 2012 – All rights reserved 79
Figure B.7 — Top level of fault tree for CPU branch
Figure B.8 — Top level of fault tree for register bank for CPU branch
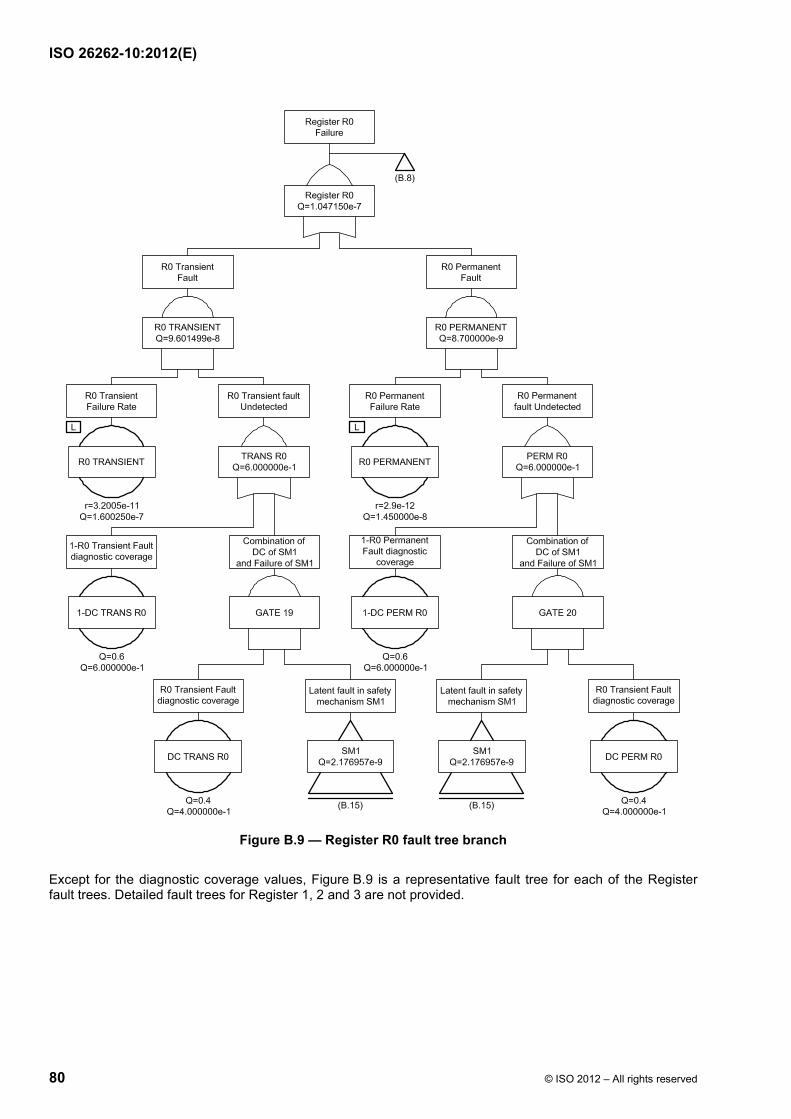
ISO 26262-10:2012(E)
80 © ISO 2012 – All rights reserved
Figure B.9 — Register R0 fault tree branch
Except for the diagnostic coverage values, Figure B.9 is a representative fault tree for each of the Register fault trees. Detailed fault trees for Register 1, 2 and 3 are not provided.
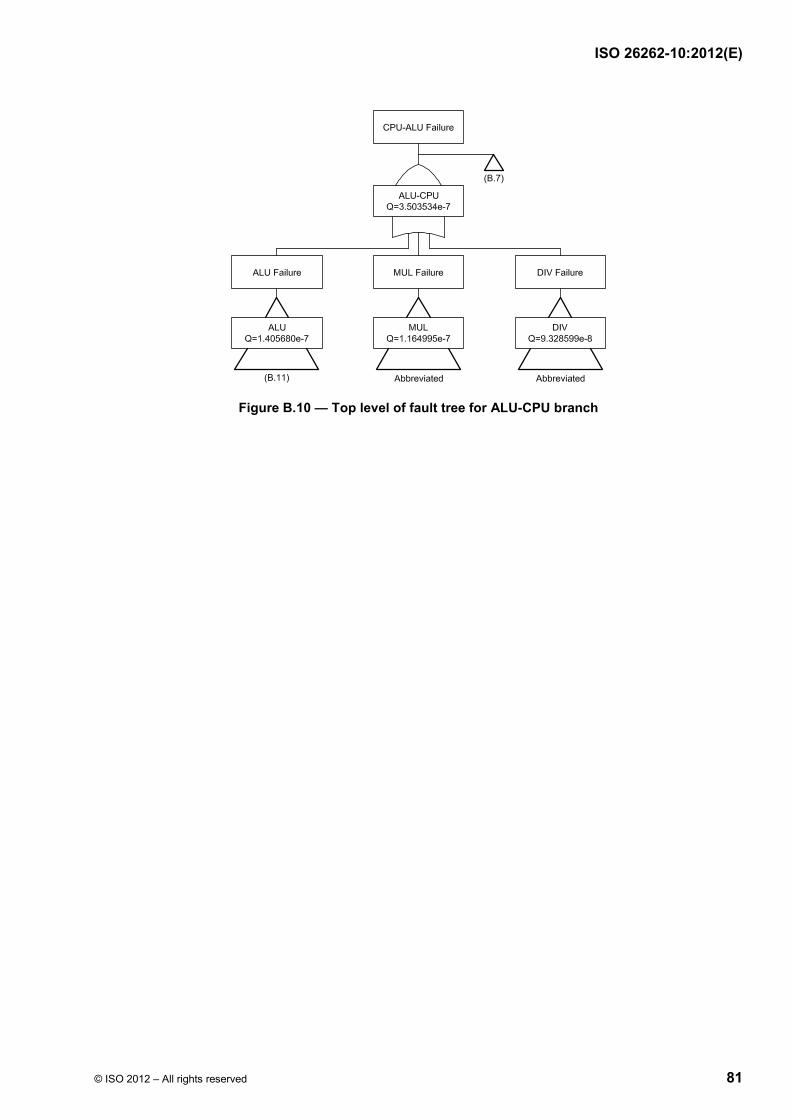
ISO 26262-10:2012(E)
© ISO 2012 – All rights reserved 81
Figure B.10 — Top level of fault tree for ALU-CPU branch
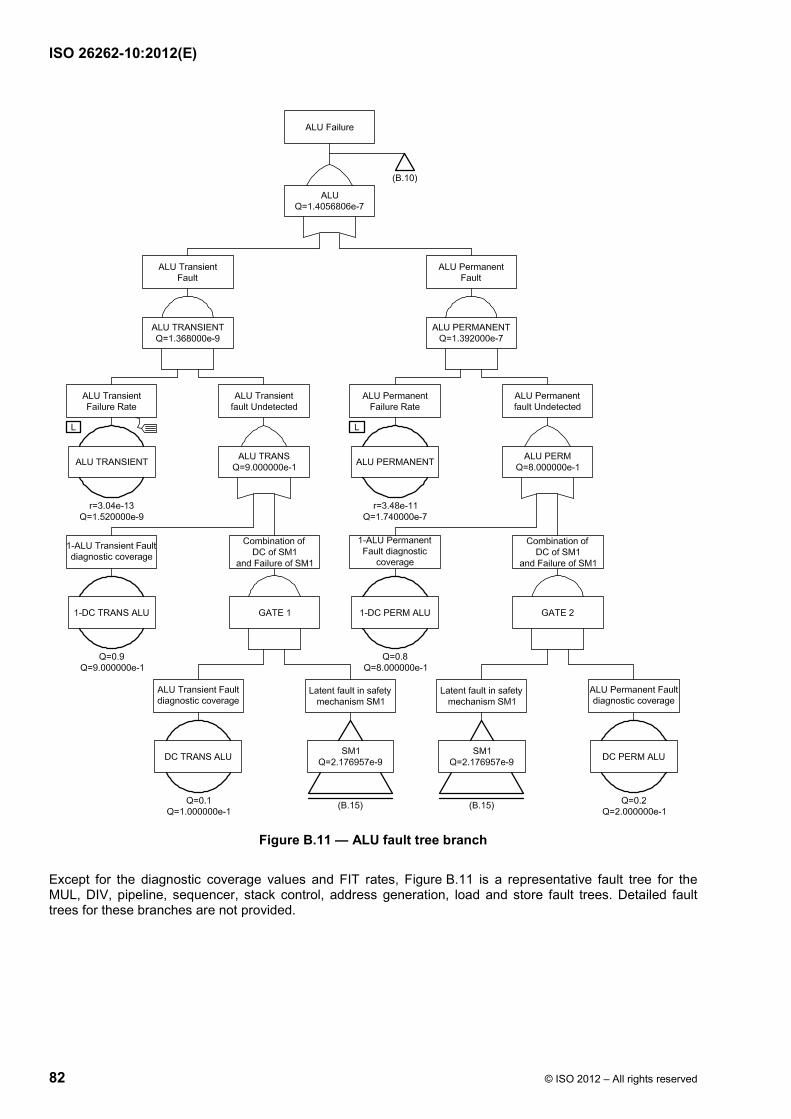
ISO 26262-10:2012(E)
82 © ISO 2012 – All rights reserved
Figure B.11 — ALU fault tree branch
Except for the diagnostic coverage values and FIT rates, Figure B.11 is a representative fault tree for the MUL, DIV, pipeline, sequencer, stack control, address generation, load and store fault trees. Detailed fault trees for these branches are not provided.
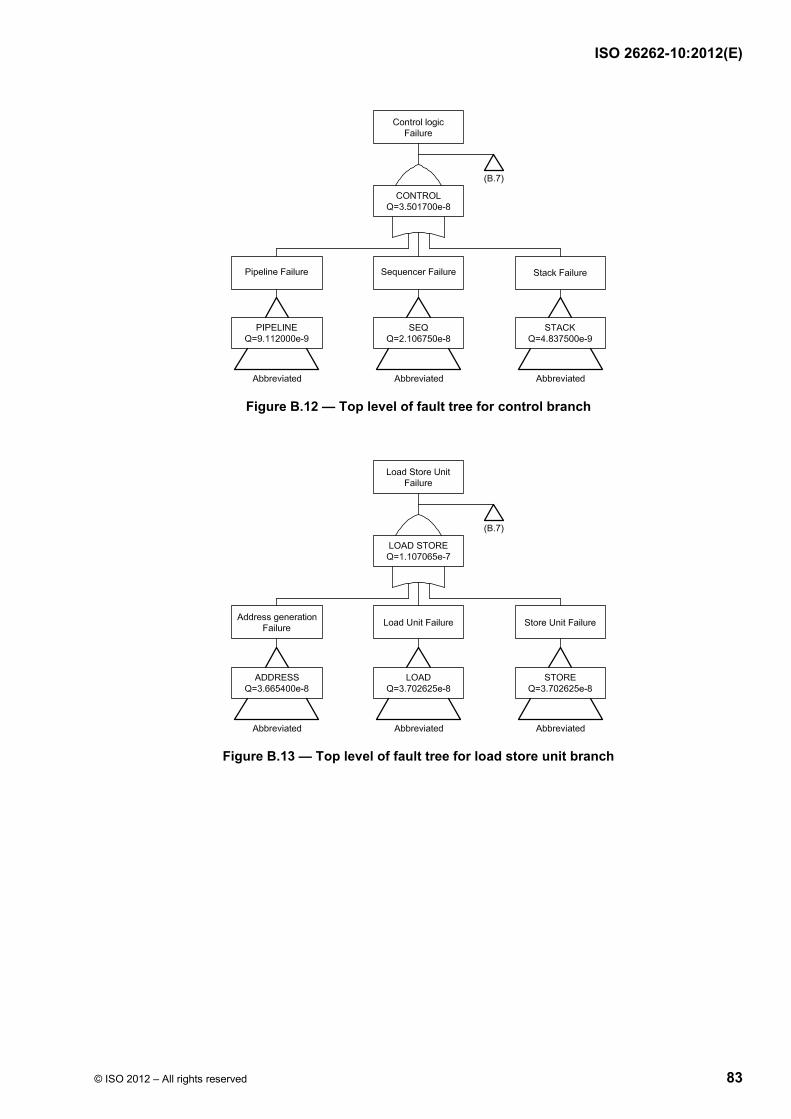
ISO 26262-10:2012(E)
© ISO 2012 – All rights reserved 83
Figure B.12 — Top level of fault tree for control branch
Figure B.13 — Top level of fault tree for load store unit branch
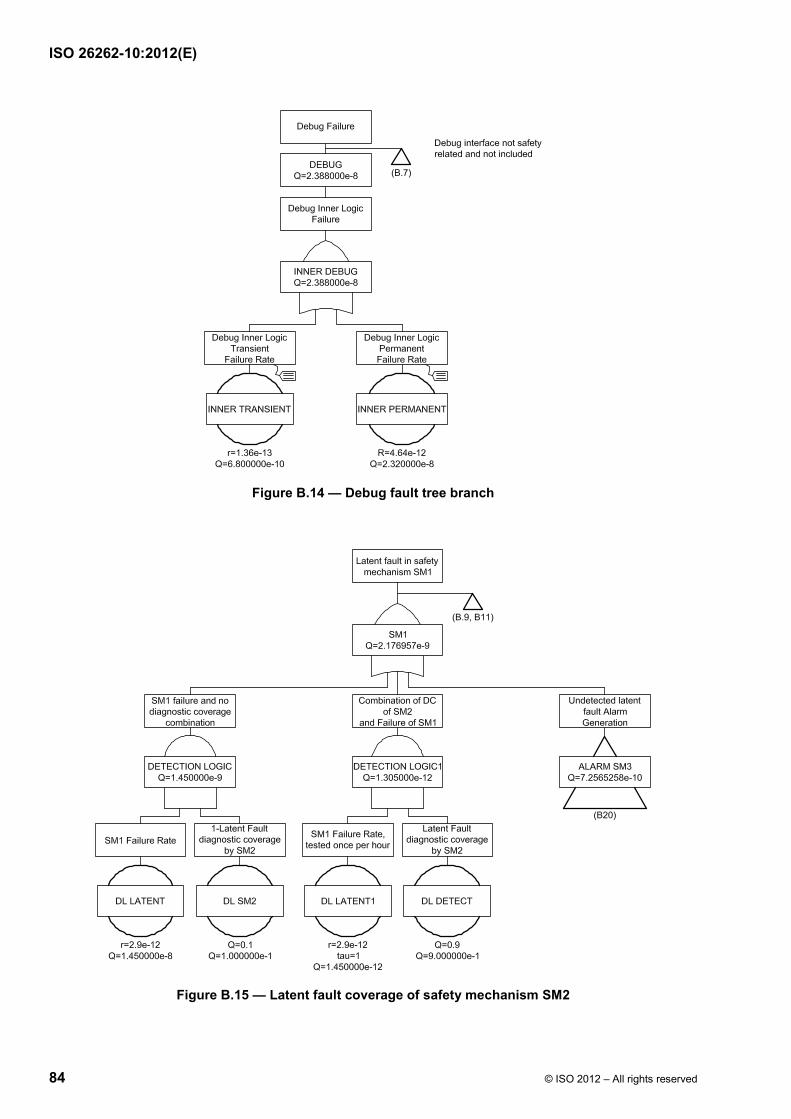
ISO 26262-10:2012(E)
84 © ISO 2012 – All rights reserved
Figure B.14 — Debug fault tree branch
Figure B.15 — Latent fault coverage of safety mechanism SM2
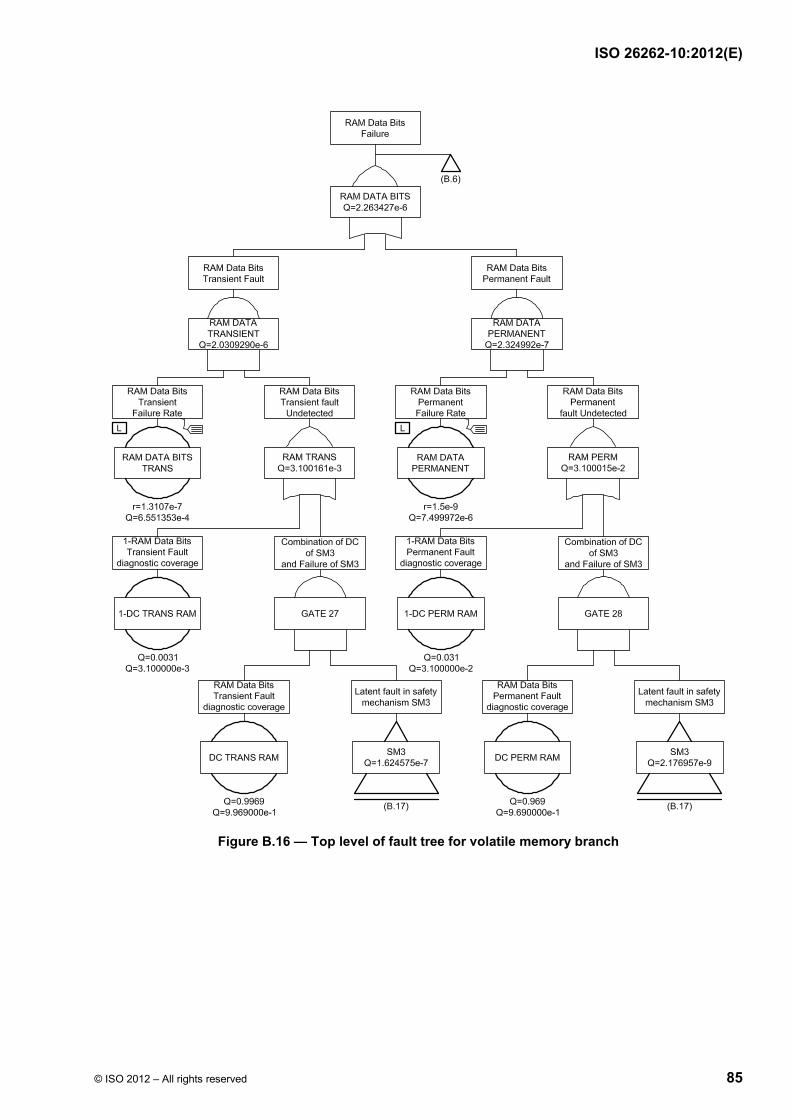
ISO 26262-10:2012(E)
© ISO 2012 – All rights reserved 85
Figure B.16 — Top level of fault tree for volatile memory branch
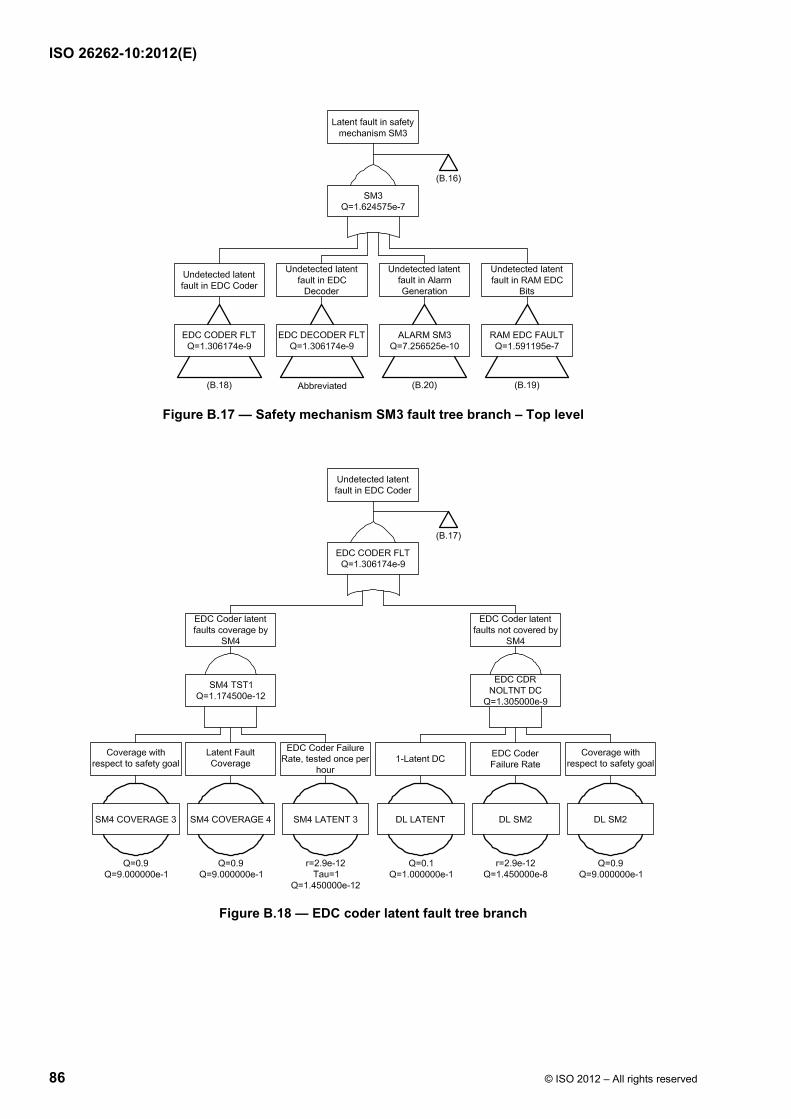
ISO 26262-10:2012(E)
86 © ISO 2012 – All rights reserved
Figure B.17 — Safety mechanism SM3 fault tree branch – Top level
Figure B.18 — EDC coder latent fault tree branch
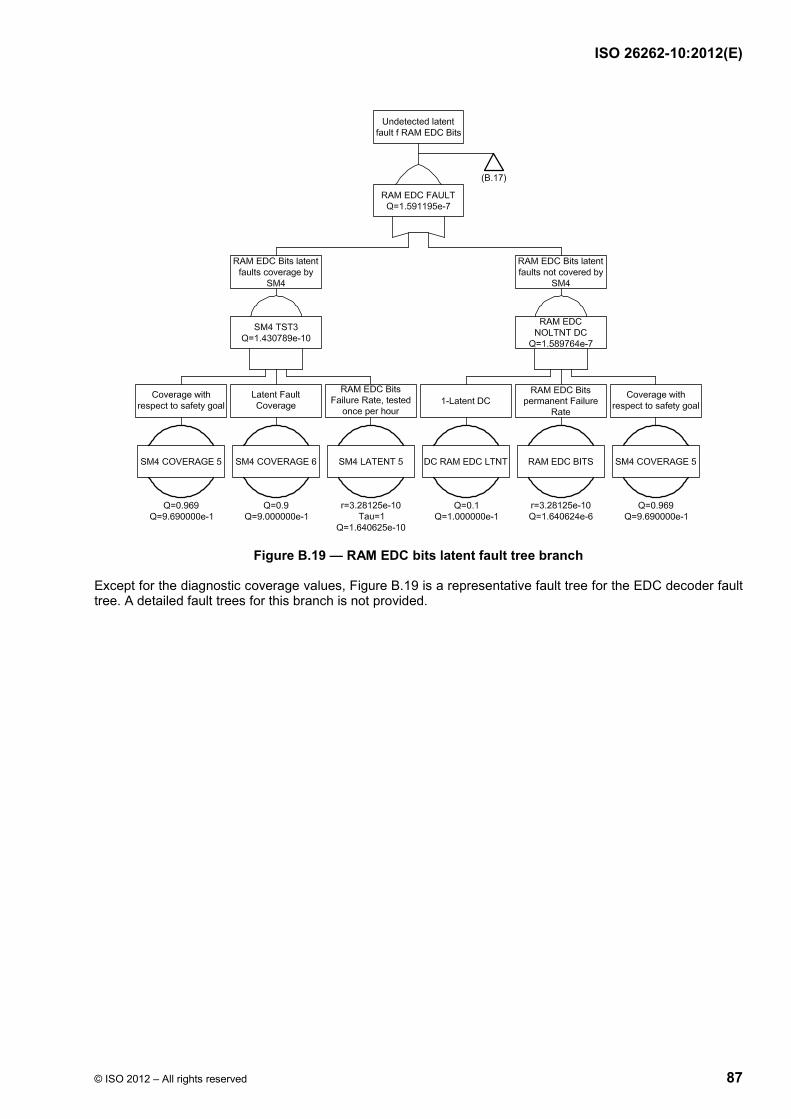
ISO 26262-10:2012(E)
© ISO 2012 – All rights reserved 87
Figure B.19 — RAM EDC bits latent fault tree branch
Except for the diagnostic coverage values, Figure B.19 is a representative fault tree for the EDC decoder fault tree. A detailed fault trees for this branch is not provided.
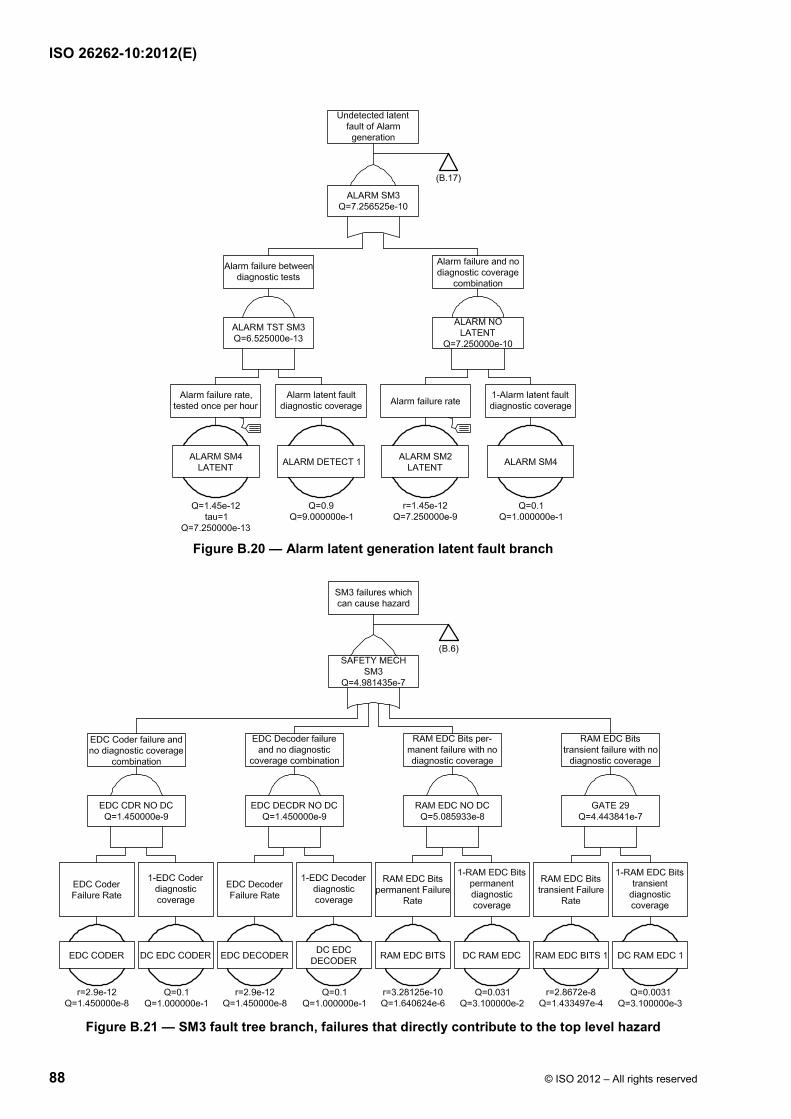
ISO 26262-10:2012(E)
88 © ISO 2012 – All rights reserved
Figure B.20 — Alarm latent generation latent fault branch
Figure B.21 — SM3 fault tree branch, failures that directly contribute to the top level hazard
ISO 26262-10:2012(E)
© ISO 2012 – All rights reserved 89
Bibliography
[1] IEC 61508 (all parts), Functional safety of electrical/electronic/programmable electronic safety-related systems
[2] Kelly, T. P., Arguing Safety – A Systematic Approach to Safety Case Management, DPhil Thesis, Department of Computer Science, University of York, UK, 1998
[3] Enamul Amyeen, M., et al., "Evaluation of the Quality of N-Detect Scan ATPG Patterns on a Processor", Proceedings of the International Test Conference 2004, ITC'04, p.669-678
[4] Benware, B., et al., "Impact of Multiple-Detect Test Patterns on Product Quality", Proc. of the International Test Conference 2003, ITC'03, pp. 1031-1040
[5] Patel, J. H., "Stuck-At Fault: A Fault Model for the Next Millennium?", Proceedings of the International Test Conference 1998, ITC'98, pp.1166
[6] Siemens AG, "Failure Rates of Components – Expected Values, General", SN 29500 (2004)
[7] Paschalis, A., and Gizopoulos, D., Effective Software-Based Self-Test Strategies for On-Line Periodic Testing of Embedded Processors. IEEE Transactions on Computer-Aided Design of Integrated Circuits and Systems, 24, 1 (Jan.2005), 88-99
[8] IEC/TR 62380:2004, Reliability data handbook — Universal model for reliability prediction of electronics components, PCBs and equipment
[9] The International Technology Roadmap For Semiconductors (ITRS), 2009 Edition
[10] IEC 61709, Electric components — Reliability — Reference conditions for failure rates and stress models for conversion
[11] IEC 61784 (all parts), Industrial communication networks — Profiles

ISO 26262-10:2012(E)
ICS 43.040.10 Price based on 89 pages
© ISO 2012 – All rights reserved