international journal of business, management and …ijbmas.in/6.1.19/28-48 prabhakar...
TRANSCRIPT

Page 28
RESEARCH ARTICLE Vol.6.Issue.1.2019 Jan-Mar
INTERNATIONAL JOURNAL OF BUSINESS, MANAGEMENT
AND ALLIED SCIENCES (IJBMAS)
A Peer Reviewed International Research Journal
IMPACT OF SOCIO-ECONOMIC FACTORS ON BRAND PREFERENCES OF CONSUMERS OF TWO-WHEELERS ACROSS THE RURAL AND URBAN
MARKETS IN VIJAYAWADA - A COMPARATIVE STUDY
PRABHAKAR BETHAPUDI Assistant Professor, KBN College – PG Centre
[email protected]. https://doi.org/10.33329/ijbmas.6119.28
ABSTRACT
In the present scenario, the study of consumer behaviour is essential for all
business units. Consumers are the kings of markets. The business organization
can't be run without consumers for their products. The process of all the activities
of the business concerns ends with consumers and consumer satisfaction. The
study of Consumer Behaviour is complex and very often not considered rational,
because of many variables involved and their tendency to interact with and
influence each other. A further challenge is that consumer personalities differ
across borders and also between and within regions. The vulnerable consumer,
who does not always have access to the same number of choices as the average
consumer, also needs to be taken into account. Influencing consumer behaviour is
in fact about targeting the right people with the right message. Greater importance
is also placed on consumer retention with the relationship. Relationship marketing
is an influential asset for consumer behaviour analysis, as it has a keen interest in
the re-discovery of the true meaning of marketing through the re-affirmation of
the importance of the consumer or buyer. The consumers who want to mobile
today consider personal transport as one of their basic need. In India, the two-
wheelers are used for a variety of purposes. Particularly in urban areas for going
to work, visiting people, carrying loads, outdoor jobs like selling and assembling.
In rural areas, it enables people to travel more frequently to nearby towns for their
daily needs. An empirical study through survey was conducted on 750
respondents in rural and urban markets in Vijayawada. The research aimed to
analyze the brand perception of respondents across the categories of the place of
residence.
Keywords: Consumer Perception, Brand Preferences, Chi-square, Correlation,
Socio-economic factors.
PRABHAKAR BETHAPUDI ISSN:2349-4638 Vol.6. Issue.1.2019 (Jan-Mar)
Int.J.Buss.Mang.& Allied.Sci. (ISSN:2349-4638) 29
1. Introduction
Consumer Behaviour is the study of when, why, how, and where people do or do not buy a
product. It blends elements from Psychology, Sociology, Cultural Anthropology and Economics. It
attempts to understand the buyer decision-making process, both individually and in groups.
According to Edward, "It studies characteristics of individual consumers such as demographics and
behavioural variables in an attempt to understand people's wants. It also tries to assess influences
groups such as family, friends, reference groups and society in general".
India is so culturally diverse that it may seem impossible that there exists just one consumer
ideal, but it appears that globalization has led to the transcending of this cultural boundary. The
study deals what consumers buy, why they buy, how they buy when they buy, where they buy, how
frequently they buy and how they dispose of the product after use. Consumer Research investigates
and analyze Consumer Behaviour and provide manufacturers and dealers with important data and
insight for determining features and promotional strategy. The evaluation of the marketing concept
from mere selling to consumer-oriented marketing has resulted in buyer behaviour becoming an
independent discipline. The growth of consumerism and consumer legislation emphasizes the
importance that is given to the consumer. Consumer behaviour focuses on how individuals make the
decision to spend their available resources.
Indian consumers are amongst the most discerning consumers in the world. In the present
scenario the behavior of the consumers is moving from Presumers, those who love to get involved
with, push, fund, and promote products and services before they are realized, to the Customers, who
move from passively consuming a product towards funding or investing in the brands they buy from.
However, consumers are often looking for both a financial and an emotional return. Therefore
only brands that are open, friendly, honest, trusted, transparent and somewhat „human‟ will prove
able to attract enthusiastic Customers. Now a day's consumers behavior is moving towards the mega
trend of transparency. Brands must move from ‘having nothing to hide’, to pro-actively ‘showing and
proving they have nothing to hide’, and go beyond speaking lofty statements on 'values' or 'culture' to
real, unambiguous and clear evidence or statements about actual results.
2. Review of Literature
Dr. Ronald Mani and Debasis Tripathy, (April 2013) in their article "A Study on Consumer
buying behaviour towards Two-Wheeler bikes in context of Indian Market" stated that the two-
wheeler manufacturers must concentrate on mileage and technology as per the requirements of the
consumers to mobilize more customers towards their brands. According to their study majority of the
youth are attracted towards the new style and latest designs. So they suggested that this factor should
also be considered along with the mileage and price which is considered by the middle-aged people
while manufacturing. They conclude that Honda and Bajaj customers' satisfaction levels are very high
when compared to TVS.
Dr. Sardar Gugloth And Margani Soma Sekhara (2012) in their research article “A study
relating to the decision-making process of purchasing two-wheelers in the rural area of Andhra
Pradesh" states that rural market is not fully encased by marketers. Currently, there is a high demand
for two-wheelers across all these segments. With the growing economy, people are left with more
disposable income to be spent on meeting their mobility needs such as two-wheelers. Banks and other
financial institutions have an assortment of vehicle loan schemes with attractive rates of interest and a
convenient number of installments, it will give additional support to the automobile sector, to boost
sales across various segments. Then only Automobile companies could significantly increase their
market share by extending attention on rural areas.

PRABHAKAR BETHAPUDI ISSN:2349-4638 Vol.6. Issue.1.2019 (Jan-Mar)
Int.J.Buss.Mang.& Allied.Sci. (ISSN:2349-4638) 30
Faiz Ahmed Shaikh (2012) in his study "A Critical Analysis of Consumer buying behavior of
two-wheelers (observations pertinent to Ahmednagar city, Maharashtra)" states that the data on the
basis of proportion and chi-square test indicates that Hero Motor Corp. and Honda Motorcycles and
Scooters India Pvt. Ltd. are the most preferred manufacturers and therefore they are the market
leaders in the two-wheeler segment. The sales are strongly correlated with the age group of
consumers. Interestingly the purchase of two wheeler is independent of the annual income of buyer,
this could perhaps be due to the easy loan available and customer-friendly marketing strategies
adopted by the dealers. A significant proportion of the customers prefer to buy a two-wheeler in the
range of Rs. 41,000-50,000 having a fuel efficiency of 45-55 Kmpl. The non-gear model is preferred by
38.33% and with gear (4 gears) model is preferred by 40.00% consumers. The data is further correlated
with the gender of the consumer. Presumably, females and aged males prefer non-gear vehicle
whereas male, in general, prefers a vehicle with gear. As for maintenance of the vehicle is concerned
the general consensus among consumers indicates they prefer servicing the vehicle once in four
months. Further, the majority of the consumers happen to have a vehicle that is 1 to 5 years old
indicating old two-wheeler vehicles are rapidly being replaced. Finally, the colour of the vehicle
seems to play an important role in consumer preference. The observations indicate a strong affinity
for the red colour, followed by the black and blue colour of the vehicle
Ranjit Mundu, Herat Trivedi and Yuvraj Kurade (2011) in his article "Analysis of Factors
Influencing Two Wheeler Purchases by Women" states that the results of the analysis reinforce many
commonly held notions. Women tend to base their buying decision on the ease of handling of the
vehicle. The weight and the height of a two-wheeler are also given due importance. Also, the mileage
and price are considered as important factors, especially for the population that has an annual income
of less than 40000. First-time buyers are more affected by the price of the vehicle. Pune women also
give importance to the comfort level that the vehicle offers them. Women from Pune city seek two-
wheelers with high mileage and good handling. Buyers are not too swayed by style and tend to prefer
vehicles that offer a mileage greater than 45.
Rajesh Mahrotra And Sachin Kumar Sharma, (2012) in their research article “An empirical
study of buying behaviour of the Two-wheeler users in Jaipur district" have stated many factors
which affect the consumers' buying behaviour. The two-wheelers buying decision depends on
various factors viz. mileage, engine power, model, price, and weight of the two-wheeler. The matured
people in age and people with family are giving more priority to mileage. Due to the increase in the
purchasing power of the customers, the price of the two-wheelers is the least important factor in all
age group of people. Education factor also plays an important role at the time of purchasing two-
wheeler. As per their study Customer are giving more importance to mileage as well as engine power
in the product. They are least bothered about the price. If the price is more and mileage and power
exists in the product they are ready to buy it. Their study suggests that manufacturers should offer
more varieties of products to their prospective customer and must focus on the mileage and capacity
of the two-wheeler.
3. Objectives
To study the Impact of Socio-Economic factors of respondents on the Brand perception of
two-wheelers across the categories of place i.e., Rural and Urban.
To identify the most significant reason for buying two-wheelers in rural and urban markets
4. Research Methodology
4.1 Population frame: The population frame for this study would be the male consumers of two-
wheeler Motorcycles in two Mandals namely Vijayawada(Urban) and Vijayawada(Rural) in the
district of Krishna, State of Andhra Pradesh in India.

PRABHAKAR BETHAPUDI ISSN:2349-4638 Vol.6. Issue.1.2019 (Jan-Mar)
Int.J.Buss.Mang.& Allied.Sci. (ISSN:2349-4638) 31
4.2 Sampling Frame: The sampling frame for this present research would be the two Mandals of
Krishna District, namely Vijayawada (Urban) and Vijayawada (Rural).
4.3 Sample Structure: The sample structure was made up of 66.67 percent of the total sample size
from Vijayawada(Urban) and 33.33% of the sample size from Vijayawada(Rural).
4.4 Sample Subjects: The sample subjects for the present research are the Consumers of Hero,
Honda, Bajaj, TVS and Yamaha.
4.5 Sample Size: Out of the total population of Motorcycle users in Vijayawada(Urban & Rural) a
sample of 750 male respondents from different occupations, age groups, incomes et.al., was selected
through stratified random sampling in two Mandals of Krishna District, namely Vijayawada (Urban)
and Vijayawada (Rural). The sample size was divided between the two mandals in the proportion of
Population. To minimize the sampling error, data was collected from 821 respondents (i.e., 536 from
Urban and 285 from Rural). The response rate of the sample was 100 percent in both Urban and Rural
market. 71 questionnaires were discarded due to erroneousness and hence data from 750 (i.e. 500
from Urban and 250 from rural) respondents was finally captured and analyzed for the study.
4.6 Data Collection: For this study, the data was collected both from primary and secondary sources.
4.7 Primary Data: Primary data was collected by opinion studies through field survey method using
the structured questionnaire in the form of the personal interview from sample respondents of 500
from Vijayawada(Urban) regions and 250 respondents from Vijayawada(Rural) thus making a total
sample size of 750 respondents.
4.8 Secondary Data: Secondary data has been collected from the published articles, annual report and
other reviews of literature available in magazines and Automobile journals.
4.9 Methods of Analysis - Statistical Tools: In this research, the researcher applied the Chi-square
test for analyzing the significance of Brand preferences and Socio-Economic factors across the rural
and Urban Regions. The statistical tool Correlation was used to identify the most significant reason
across the rural and urban markets. In this study, the hypothesis was tested with the help of SPSS
software Version 23.
4.10 Response Rate: To minimize the sampling error, data was collected from 821 respondents (i.e.,
536 from Urban and 285 from Rural). The response rate of the sample was 100 percent in both Urban
and Rural market. 71 questionnaires were discarded due to erroneousness and hence data from 750
(i.e. 500 from Urban and 250 from Rural) respondents was finally captured and analyzed for the
study.
5. Demographic Profile of the Sample
The literature review of the present study reveals that the Socio-economic characteristics of consumers
play a crucial role in their consumption behaviour. Hence the researcher considered consider the
significant factors identified in the review for the present study viz., gender, age, marital status,
educational level, occupational status, monthly income, the family size which influence the purchase
decisions of the consumers both for essential goods and other comforts of life. So it is worthwhile to
assess the socio-economic profile of the selected respondents before proceeding to the analyses of the
objectives.
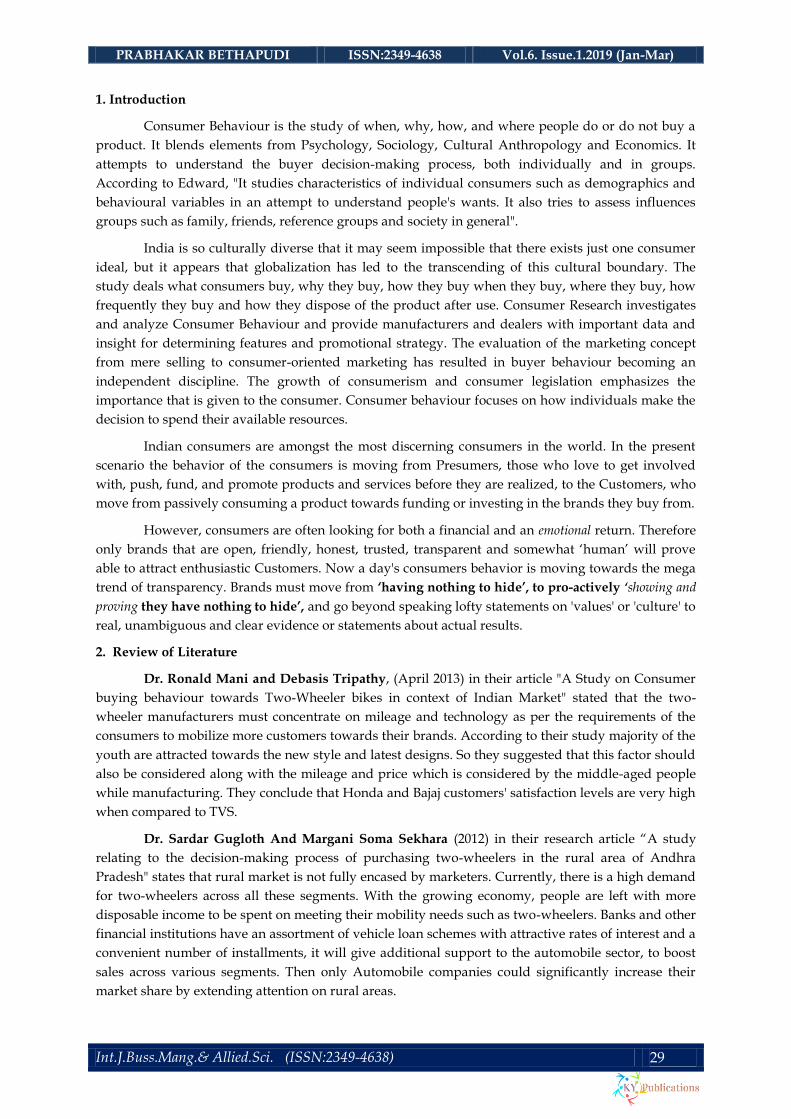
5.1 Gender
The below Table shows the Gender of the respondents. It is observed that, out of 750 respondents
selected for the study, all are male respondents and none of them are female. Though female uses
mopeds as a mode of their personal transport they don't ride motorcycles. Hence the researcher
selected only male respondents for this study.
PRABHAKAR BETHAPUDI ISSN:2349-4638 Vol.6. Issue.1.2019 (Jan-Mar)
Int.J.Buss.Mang.& Allied.Sci. (ISSN:2349-4638) 32
Table 1: Gender of the Respondents
Variable and Category Place of Residence
Total Rural Urban
Gender Male Count 250 500 750
% within Gender 33.3% 66.7% 100.0%
% within the Place of Residence 100.0% 100.0% 100.0%
% of Total 33.3% 66.7% 100.0%
Total Count 250 500 750
% within Gender 33.3% 66.7% 100.0%
% within the Place of Residence 100.0% 100.0% 100.0%
% of Total 33.3% 66.7% 100.0%
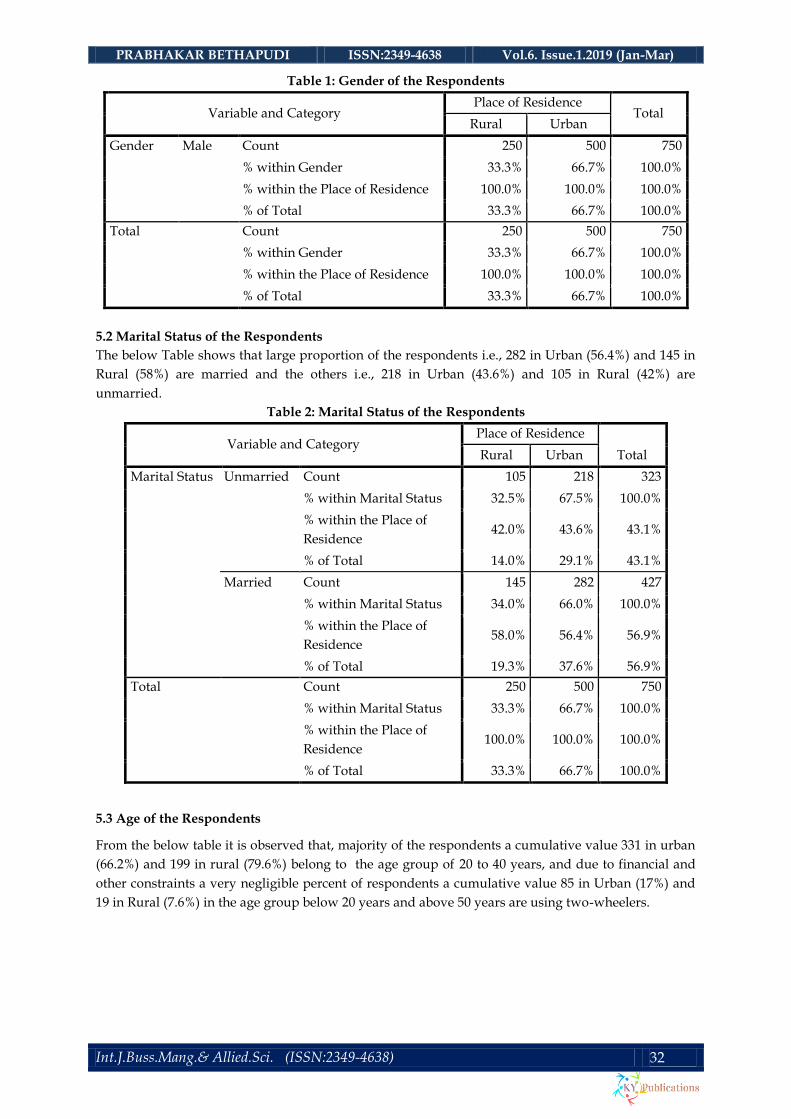
5.2 Marital Status of the Respondents
The below Table shows that large proportion of the respondents i.e., 282 in Urban (56.4%) and 145 in
Rural (58%) are married and the others i.e., 218 in Urban (43.6%) and 105 in Rural (42%) are
unmarried.
Table 2: Marital Status of the Respondents
Variable and Category Place of Residence
Total Rural Urban
Marital Status Unmarried Count 105 218 323
% within Marital Status 32.5% 67.5% 100.0%
% within the Place of
Residence 42.0% 43.6% 43.1%
% of Total 14.0% 29.1% 43.1%
Married Count 145 282 427
% within Marital Status 34.0% 66.0% 100.0%
% within the Place of
Residence 58.0% 56.4% 56.9%
% of Total 19.3% 37.6% 56.9%
Total Count 250 500 750
% within Marital Status 33.3% 66.7% 100.0%
% within the Place of
Residence 100.0% 100.0% 100.0%
% of Total 33.3% 66.7% 100.0%
5.3 Age of the Respondents
From the below table it is observed that, majority of the respondents a cumulative value 331 in urban
(66.2%) and 199 in rural (79.6%) belong to the age group of 20 to 40 years, and due to financial and
other constraints a very negligible percent of respondents a cumulative value 85 in Urban (17%) and
19 in Rural (7.6%) in the age group below 20 years and above 50 years are using two-wheelers.

PRABHAKAR BETHAPUDI ISSN:2349-4638 Vol.6. Issue.1.2019 (Jan-Mar)
Int.J.Buss.Mang.& Allied.Sci. (ISSN:2349-4638) 33
Table 3: Age of the Respondents
Variable and Category Place of Residence
Total Rural Urban
Age Below 20 Count 8 28 36
% within Age 22.2% 77.8% 100.0%
% within the Place of Residence 3.2% 5.6% 4.8%
% of Total 1.1% 3.7% 4.8%
20 - 30 Count 102 155 257
% within Age 39.7% 60.3% 100.0%
% within the Place of Residence 40.8% 31.0% 34.3%
% of Total 13.6% 20.7% 34.3%
31 - 40 Count 97 176 273
% within Age 35.5% 64.5% 100.0%
% within the Place of Residence 38.8% 35.2% 36.4%
% of Total 12.9% 23.5% 36.4%
41 - 50 Count 32 84 116
% within Age 27.6% 72.4% 100.0%
% within the Place of Residence 12.8% 16.8% 15.5%
% of Total 4.3% 11.2% 15.5%
Above 50 Count 11 57 68
% within Age 16.2% 83.8% 100.0%
% within the Place of Residence 4.4% 11.4% 9.1%
% of Total 1.5% 7.6% 9.1%
Total Count 250 500 750
% within Age 33.3% 66.7% 100.0%
% within the Place of Residence 100.0% 100.0% 100.0%
% of Total 33.3% 66.7% 100.0%
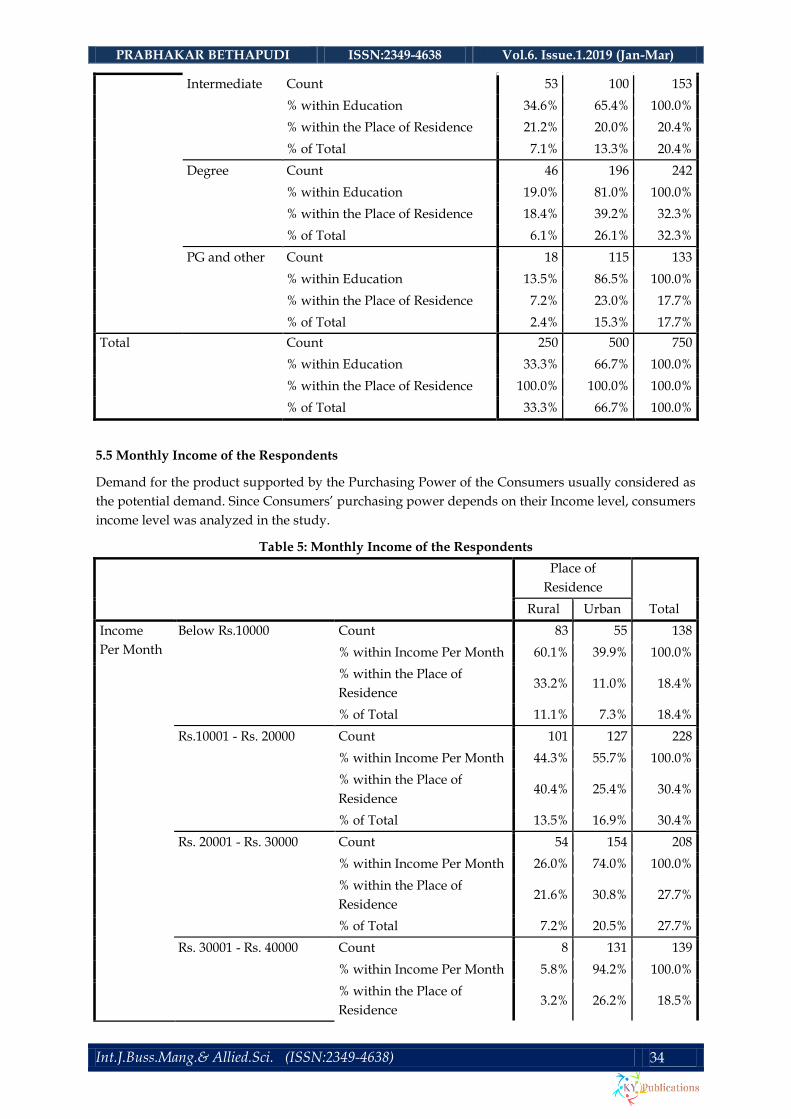
5.4 Education and Qualification of Respondents
From the below Table it is observed that the highest proportion of respondents i.e., (62.2%) in Urban
are Graduates and Postgraduates and 53.2% in Rural had Secondary School Certificate and Below
SSC.
Table 4: Education of the Respondents
Variable and Category Place of Residence
Total Rural Urban
Education
Below SSC Count 60 20 80
% within Education 75.0% 25.0% 100.0%
% within the Place of Residence 24.0% 4.0% 10.7%
% of Total 8.0% 2.7% 10.7%
SSC Count 73 69 142
% within Education 51.4% 48.6% 100.0%
% within the Place of Residence 29.2% 13.8% 18.9%
% of Total 9.7% 9.2% 18.9%
PRABHAKAR BETHAPUDI ISSN:2349-4638 Vol.6. Issue.1.2019 (Jan-Mar)
Int.J.Buss.Mang.& Allied.Sci. (ISSN:2349-4638) 34
Intermediate Count 53 100 153
% within Education 34.6% 65.4% 100.0%
% within the Place of Residence 21.2% 20.0% 20.4%
% of Total 7.1% 13.3% 20.4%
Degree Count 46 196 242
% within Education 19.0% 81.0% 100.0%
% within the Place of Residence 18.4% 39.2% 32.3%
% of Total 6.1% 26.1% 32.3%
PG and other Count 18 115 133
% within Education 13.5% 86.5% 100.0%
% within the Place of Residence 7.2% 23.0% 17.7%
% of Total 2.4% 15.3% 17.7%
Total Count 250 500 750
% within Education 33.3% 66.7% 100.0%
% within the Place of Residence 100.0% 100.0% 100.0%
% of Total 33.3% 66.7% 100.0%
5.5 Monthly Income of the Respondents
Demand for the product supported by the Purchasing Power of the Consumers usually considered as
the potential demand. Since Consumers‟ purchasing power depends on their Income level, consumers
income level was analyzed in the study.
Table 5: Monthly Income of the Respondents
Place of
Residence
Total Rural Urban
Income
Per Month
Below Rs.10000 Count 83 55 138
% within Income Per Month 60.1% 39.9% 100.0%
% within the Place of
Residence 33.2% 11.0% 18.4%
% of Total 11.1% 7.3% 18.4%
Rs.10001 - Rs. 20000 Count 101 127 228
% within Income Per Month 44.3% 55.7% 100.0%
% within the Place of
Residence 40.4% 25.4% 30.4%
% of Total 13.5% 16.9% 30.4%
Rs. 20001 - Rs. 30000 Count 54 154 208
% within Income Per Month 26.0% 74.0% 100.0%
% within the Place of
Residence 21.6% 30.8% 27.7%
% of Total 7.2% 20.5% 27.7%
Rs. 30001 - Rs. 40000 Count 8 131 139
% within Income Per Month 5.8% 94.2% 100.0%
% within the Place of
Residence 3.2% 26.2% 18.5%
PRABHAKAR BETHAPUDI ISSN:2349-4638 Vol.6. Issue.1.2019 (Jan-Mar)
Int.J.Buss.Mang.& Allied.Sci. (ISSN:2349-4638) 35
% of Total 1.1% 17.5% 18.5%
Above Rs. 40000 Count 4 33 37
% within Income Per Month 10.8% 89.2% 100.0%
% within the Place of
Residence 1.6% 6.6% 4.9%
% of Total 0.5% 4.4% 4.9%
Total Count 250 500 750
% within Income Per Month 33.3% 66.7% 100.0%
% within the Place of
Residence 100.0% 100.0% 100.0%
% of Total 33.3% 66.7% 100.0%
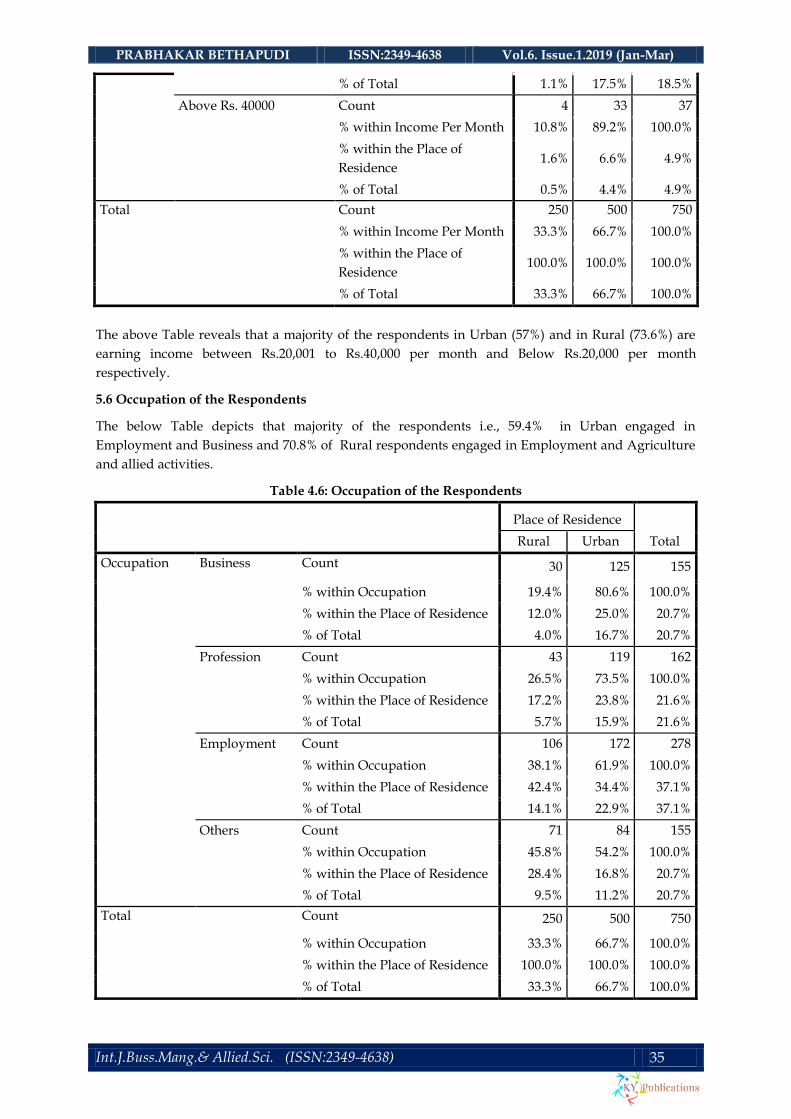
The above Table reveals that a majority of the respondents in Urban (57%) and in Rural (73.6%) are
earning income between Rs.20,001 to Rs.40,000 per month and Below Rs.20,000 per month
respectively.
5.6 Occupation of the Respondents
The below Table depicts that majority of the respondents i.e., 59.4% in Urban engaged in
Employment and Business and 70.8% of Rural respondents engaged in Employment and Agriculture
and allied activities.
Table 4.6: Occupation of the Respondents
Place of Residence
Total Rural Urban
Occupation Business Count 30 125 155
% within Occupation 19.4% 80.6% 100.0%
% within the Place of Residence 12.0% 25.0% 20.7%
% of Total 4.0% 16.7% 20.7%
Profession Count 43 119 162
% within Occupation 26.5% 73.5% 100.0%
% within the Place of Residence 17.2% 23.8% 21.6%
% of Total 5.7% 15.9% 21.6%
Employment Count 106 172 278
% within Occupation 38.1% 61.9% 100.0%
% within the Place of Residence 42.4% 34.4% 37.1%
% of Total 14.1% 22.9% 37.1%
Others Count 71 84 155
% within Occupation 45.8% 54.2% 100.0%
% within the Place of Residence 28.4% 16.8% 20.7%
% of Total 9.5% 11.2% 20.7%
Total Count 250 500 750
% within Occupation 33.3% 66.7% 100.0%
% within the Place of Residence 100.0% 100.0% 100.0%
% of Total 33.3% 66.7% 100.0%
PRABHAKAR BETHAPUDI ISSN:2349-4638 Vol.6. Issue.1.2019 (Jan-Mar)
Int.J.Buss.Mang.& Allied.Sci. (ISSN:2349-4638) 36
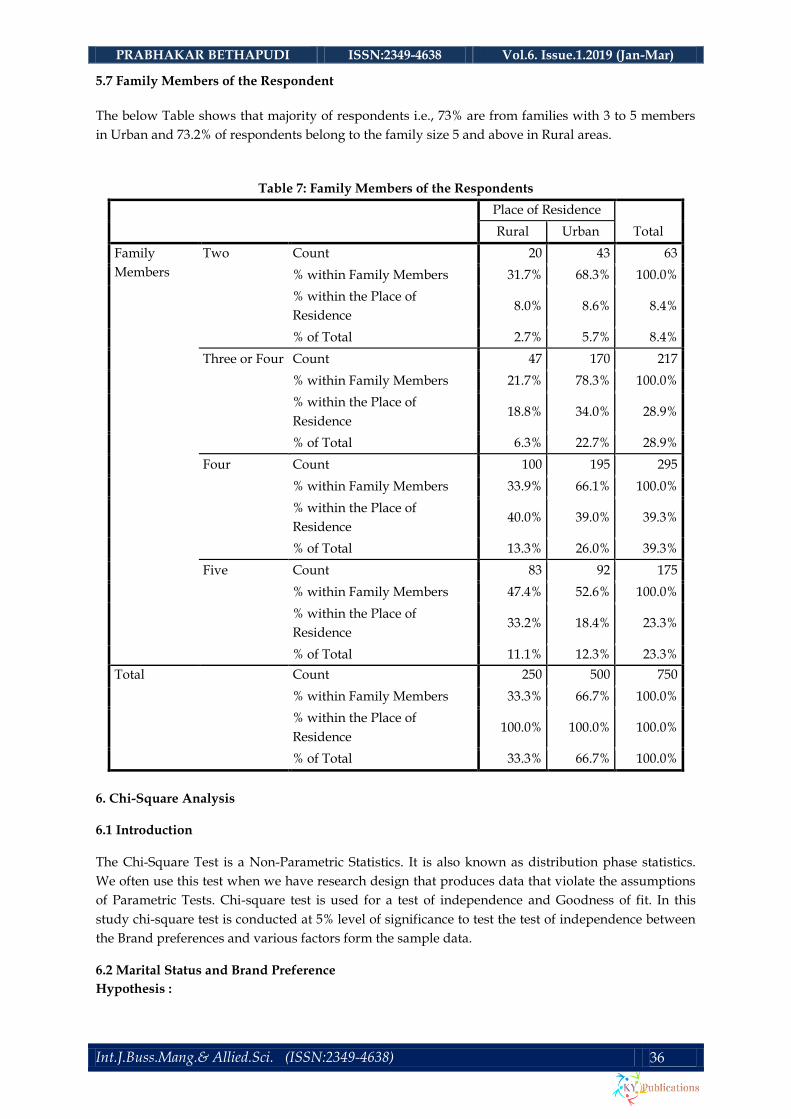
5.7 Family Members of the Respondent
The below Table shows that majority of respondents i.e., 73% are from families with 3 to 5 members
in Urban and 73.2% of respondents belong to the family size 5 and above in Rural areas.
Table 7: Family Members of the Respondents
Place of Residence
Total Rural Urban
Family
Members
Two Count 20 43 63
% within Family Members 31.7% 68.3% 100.0%
% within the Place of
Residence 8.0% 8.6% 8.4%
% of Total 2.7% 5.7% 8.4%
Three or Four Count 47 170 217
% within Family Members 21.7% 78.3% 100.0%
% within the Place of
Residence 18.8% 34.0% 28.9%
% of Total 6.3% 22.7% 28.9%
Four Count 100 195 295
% within Family Members 33.9% 66.1% 100.0%
% within the Place of
Residence 40.0% 39.0% 39.3%
% of Total 13.3% 26.0% 39.3%
Five Count 83 92 175
% within Family Members 47.4% 52.6% 100.0%
% within the Place of
Residence 33.2% 18.4% 23.3%
% of Total 11.1% 12.3% 23.3%
Total Count 250 500 750
% within Family Members 33.3% 66.7% 100.0%
% within the Place of
Residence 100.0% 100.0% 100.0%
% of Total 33.3% 66.7% 100.0%
6. Chi-Square Analysis
6.1 Introduction
The Chi-Square Test is a Non-Parametric Statistics. It is also known as distribution phase statistics.
We often use this test when we have research design that produces data that violate the assumptions
of Parametric Tests. Chi-square test is used for a test of independence and Goodness of fit. In this
study chi-square test is conducted at 5% level of significance to test the test of independence between
the Brand preferences and various factors form the sample data.
6.2 Marital Status and Brand Preference
Hypothesis :

PRABHAKAR BETHAPUDI ISSN:2349-4638 Vol.6. Issue.1.2019 (Jan-Mar)
Int.J.Buss.Mang.& Allied.Sci. (ISSN:2349-4638) 37
H01: There is no significant association between Marital Status and Brand Preference
H11: There is a significant association between Marital Status and Brand Preference
Table 8 Chi-Square Test Results
Place of Residence Value df
Asymptotic
Significance
(2-sided)
Rural Pearson Chi-Square 14.811b 4 .005
Likelihood Ratio 14.887 4 .005
Linear-by-Linear Association 4.040 1 .044
N of Valid Cases 250
Urban Pearson Chi-Square 7.159c 4 .128
Likelihood Ratio 7.182 4 .127
Linear-by-Linear Association 1.211 1 .271
N of Valid Cases 500
Findings:
Rural Market – H01 is Rejected
Since the calculated P value in Rural region (0.005) is less than the tabulated value the Null
hypothesis is rejected. Hence it is inferred that there is a significant association between Marital Status
and Brand Preferences of the Consumers in Rural Market
Urban Market – H01 is Accepted
Since the calculated P value in the Urban region (0.128) is greater than the tabulated value the Null
hypothesis is accepted. Hence it is inferred that there is no significant association between Marital
Status and Brand Preferences of the Consumers in Urban Market.
6.3 Age and Brand Preference
Hypothesis :
H02: There is no significant association between Age and Brand Preference
H12: There is a significant association between Age and Brand Preference
Table 9: Chi-Square Tests Results
Place of Residence Value df Asymptotic Significance
(2-sided)
Rural Pearson Chi-Square 60.117b 16 .000
Likelihood Ratio 52.332 16 .000
Linear-by-Linear Association 13.176 1 .000
N of Valid Cases 250
Urban Pearson Chi-Square 47.620c 16 .000
Likelihood Ratio 53.102 16 .000
Linear-by-Linear Association 14.791 1 .000
N of Valid Cases 500
Findings:
Rural Market – H02 is Rejected

PRABHAKAR BETHAPUDI ISSN:2349-4638 Vol.6. Issue.1.2019 (Jan-Mar)
Int.J.Buss.Mang.& Allied.Sci. (ISSN:2349-4638) 38
Since the calculated P value in Rural region (0.000) is less than the tabulated value the Null
hypothesis is rejected. Hence it is inferred that there is a significant association between Age and
Brand Preferences of the Consumers in Rural Market
Urban Market – H02 is Rejected
Since the calculated P value in the Urban region (0.000) is less than the tabulated value the Null
hypothesis is rejected. Hence it is inferred that there is a significant association between Age and
Brand Preferences of the Consumers in Urban Market.
6.4. Education and Brand Preference
Hypothesis :
H03: There is no significant association between Education and Brand Preference
H13: There is a significant association between Education and Brand Preference
Table 10: Chi-Square Tests Results
Place of Residence Value df
Asymptotic
Significance (2-
sided)
Rural Pearson Chi-Square 60.783b 16 .000
Likelihood Ratio 63.794 16 .000
Linear-by-Linear Association 21.924 1 .000
N of Valid Cases 250
Urban Pearson Chi-Square 58.888c 16 .000
Likelihood Ratio 59.043 16 .000
Linear-by-Linear Association .369 1 .544
N of Valid Cases 500
Findings:
Rural Market – H03 is Rejected
Since the calculated P value in Rural region (0.000) is less than the tabulated value the Null
hypothesis is rejected. Hence it is inferred that there is a significant association between Education
and Brand Preferences of the Consumers in Rural Market
Urban Market – H03 is Rejected
Since the calculated P value in the Urban region (0.000) is less than the tabulated value the Null
hypothesis is rejected. Hence it is inferred that there is a significant association between Education
and Brand Preferences of the Consumers in Urban Market.
6.5. Income and Brand Preference
Hypothesis :
H04: There is no significant association between Income and Brand Preference
H14: There is a significant association between Income and Brand Preference

PRABHAKAR BETHAPUDI ISSN:2349-4638 Vol.6. Issue.1.2019 (Jan-Mar)
Int.J.Buss.Mang.& Allied.Sci. (ISSN:2349-4638) 39
Table 11: Chi-Square Tests Results
Place of Residence Value df
Asymptotic
Significance (2-
sided)
Rural Pearson Chi-Square 39.826b 16 .001
Likelihood Ratio 38.997 16 .001
Linear-by-Linear Association 5.531 1 .019
N of Valid Cases 250
Urban Pearson Chi-Square 41.899c 16 .000
Likelihood Ratio 42.947 16 .000
Linear-by-Linear Association 10.776 1 .001
N of Valid Cases 500
Findings:
Rural Market – H04 is Rejected
Since the calculated P value in Rural region (0.001) is less than the tabulated value the Null
hypothesis is rejected. Hence it is inferred that there is a significant association between Income and
Brand Preferences of the Consumers in Rural Market
Urban Market – H04 is Rejected
Since the calculated P value in the Urban region (0.000) is less than the tabulated value the Null
hypothesis is rejected. Hence it is inferred that there is a significant association between Income and
Brand Preferences of the Consumers in Urban Market.
6.6. Occupation and Brand Preference
Hypothesis:
H05: There is no significant association between Occupation and Brand Preference
H15: There is a significant association between Occupation and Brand Preference
Table 12: Chi-Square Tests Results
Place of Residence Value df
Asymptotic
Significance (2-
sided)
Rural Pearson Chi-Square 31.122b 12 .002
Likelihood Ratio 30.246 12 .003
Linear-by-Linear Association .976 1 .323
N of Valid Cases 250
Urban Pearson Chi-Square 33.770c 12 .001
Likelihood Ratio 34.282 12 .001
Linear-by-Linear Association .028 1 .868
N of Valid Cases 500
Findings:
Rural Market – H05 is Rejected
Since the calculated P value in Rural region (0.002) is less than the tabulated value the Null
hypothesis is rejected. Hence it is inferred that there is a significant association between Occupation
and Brand Preferences of the Consumers in Rural Market

PRABHAKAR BETHAPUDI ISSN:2349-4638 Vol.6. Issue.1.2019 (Jan-Mar)
Int.J.Buss.Mang.& Allied.Sci. (ISSN:2349-4638) 40
Urban Market – H05 is Rejected
Since the calculated P value in the Urban region (0.001) is less than the tabulated value the Null
hypothesis is rejected. Hence it is inferred that there is a significant association between Occupation
and Brand Preferences of the Consumers in Urban Market.
6.7 Mode of Purchase and Brand Preference
Hypothesis:
H06: There is no significant association between Mode of Purchase and Brand Preference
H16: There is a significant association between Mode of Purchase and Brand Preference
Table 13: Chi-Square Tests
Place of Residence Value df
Asymptotic
Significance (2-sided)
Rural Pearson Chi-Square 27.306b 4 .000
Likelihood Ratio 26.230 4 .000
Linear-by-Linear Association 10.733 1 .001
N of Valid Cases 250
Urban Pearson Chi-Square 12.116c 4 .017
Likelihood Ratio 13.245 4 .010
Linear-by-Linear Association .056 1 .813
N of Valid Cases 500
Findings:
Rural Market – H06 is Rejected
Since the calculated P value in Rural region (0.000) is less than the tabulated value the Null
hypothesis is rejected. Hence it is inferred that there is a significant association between Mode of
Purchase and Brand Preferences of the Consumers in Rural Market
Urban Market – H06 is Rejected
Since the calculated P value in the Urban region (0.017) is less than the tabulated value the Null
hypothesis is rejected. Hence it is inferred that there is a significant association between Mode of
Purchase and Brand Preferences of the Consumers in Urban Market.
6.8 Mode of Credit Purchase and Brand Preference
Hypothesis:
H07: There is no significant association between Mode of Credit and Brand Preference
H17: There is a significant association between Mode of Credit and Brand Preference
Table 14: Chi-Square Tests
Place of Residence Value df Asymptotic Significance (2-
sided)
Rural Pearson Chi-Square 21.389b 8 .006
Likelihood Ratio 21.214 8 .007
Linear-by-Linear Association 9.189 1 .002
N of Valid Cases 250
Urban Pearson Chi-Square 21.742c 8 .005
Likelihood Ratio 22.649 8 .004
Linear-by-Linear Association 1.445 1 .229
N of Valid Cases 500
PRABHAKAR BETHAPUDI ISSN:2349-4638 Vol.6. Issue.1.2019 (Jan-Mar)
Int.J.Buss.Mang.& Allied.Sci. (ISSN:2349-4638) 41
Findings:
Rural Market – H07 is Rejected
Since the calculated P value in Rural region (0.006) is less than the tabulated value the Null
hypothesis is rejected. Hence it is inferred that there is a significant association between Mode of
Credit Purchase and Brand Preferences of the Consumers in Rural Market
Urban Market – H07 is Rejected
Since the calculated P value in the Urban region (0.005) is less than the tabulated value the Null
hypothesis is rejected. Hence it is inferred that there is a significant association between Mode of
Credit Purchase and Brand Preferences of the Consumers in Urban Market.
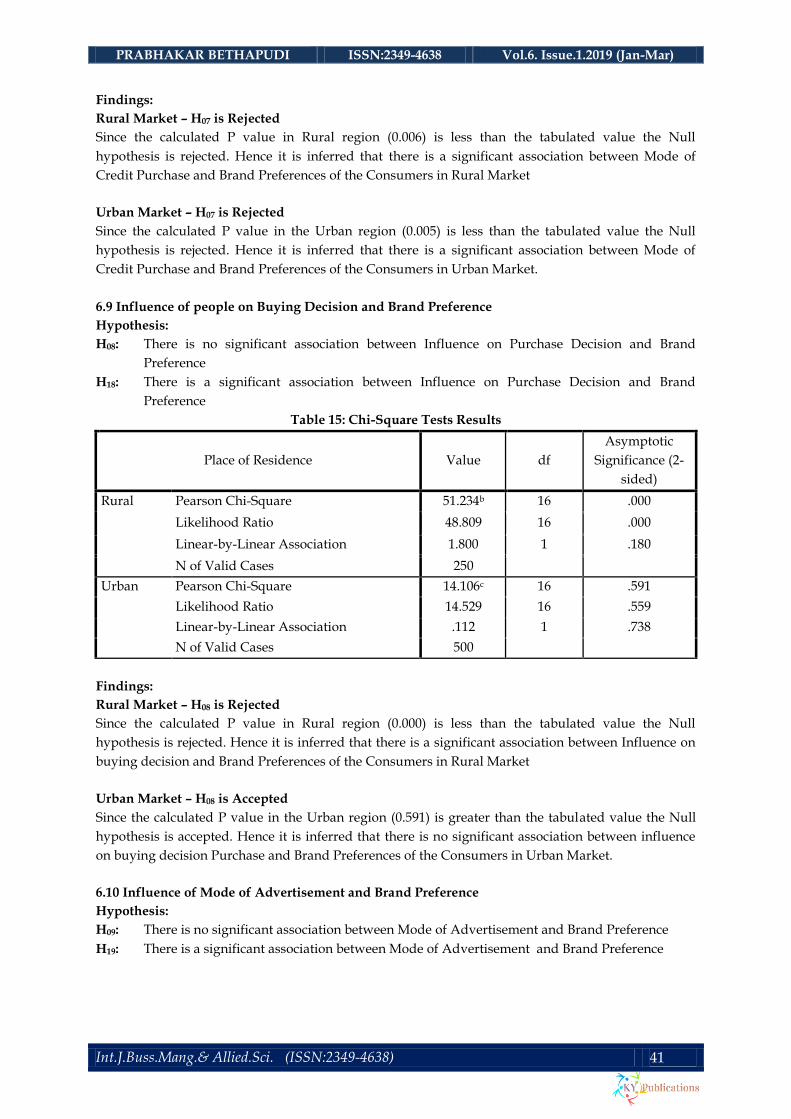
6.9 Influence of people on Buying Decision and Brand Preference
Hypothesis:
H08: There is no significant association between Influence on Purchase Decision and Brand
Preference
H18: There is a significant association between Influence on Purchase Decision and Brand
Preference
Table 15: Chi-Square Tests Results
Place of Residence Value df
Asymptotic
Significance (2-
sided)
Rural Pearson Chi-Square 51.234b 16 .000
Likelihood Ratio 48.809 16 .000
Linear-by-Linear Association 1.800 1 .180
N of Valid Cases 250
Urban Pearson Chi-Square 14.106c 16 .591
Likelihood Ratio 14.529 16 .559
Linear-by-Linear Association .112 1 .738
N of Valid Cases 500
Findings:
Rural Market – H08 is Rejected
Since the calculated P value in Rural region (0.000) is less than the tabulated value the Null
hypothesis is rejected. Hence it is inferred that there is a significant association between Influence on
buying decision and Brand Preferences of the Consumers in Rural Market
Urban Market – H08 is Accepted
Since the calculated P value in the Urban region (0.591) is greater than the tabulated value the Null
hypothesis is accepted. Hence it is inferred that there is no significant association between influence
on buying decision Purchase and Brand Preferences of the Consumers in Urban Market.
6.10 Influence of Mode of Advertisement and Brand Preference
Hypothesis:
H09: There is no significant association between Mode of Advertisement and Brand Preference
H19: There is a significant association between Mode of Advertisement and Brand Preference

PRABHAKAR BETHAPUDI ISSN:2349-4638 Vol.6. Issue.1.2019 (Jan-Mar)
Int.J.Buss.Mang.& Allied.Sci. (ISSN:2349-4638) 42
Table 16 : Chi-Square Tests
Place of Residence Value df
Asymptotic
Significance (2-
sided)
Rural Pearson Chi-Square 34.875b 16 .004
Likelihood Ratio 30.255 16 .017
Linear-by-Linear Association .000 1 .999
N of Valid Cases 250
Urban Pearson Chi-Square 37.112c 16 .002
Likelihood Ratio 37.859 16 .002
Linear-by-Linear Association .309 1 .578
N of Valid Cases 500
a. 4 cells (16.0%) have expected count less than 5. The minimum expected count is 1.53.
b. 12 cells (48.0%) have expected count less than 5. The minimum expected count is .36.
c. 7 cells (28.0%) have expected count less than 5. The minimum expected count is 1.19.
Findings:
Rural Market – H09 is Rejected
Since the calculated P value in Rural region (0.004) is less than the tabulated value the Null
hypothesis is rejected. Hence it is inferred that there is a significant association between Mode of
Credit Purchase and Brand Preferences of the Consumers in Rural Market
Urban Market – H09 is Rejected
Since the calculated P value in the Urban region (0.002) is less than the tabulated value the Null
hypothesis is rejected. Hence it is inferred that there is a significant association between influence on
buying decision Purchase and Brand Preferences of the Consumers in Urban Market.
6.11 Kilometers Ride Per Day and Brand Preference
Hypothesis:
H010: There is no significant association between Kilometers Ride per day and Brand Preference
H110: There is a significant association between Kilometers Ride per day and Brand Preference
Table 17: Chi-Square Tests Results
Place of Residence Value df
Asymptotic
Significance (2-
sided)
Rural Pearson Chi-Square 23.394b 20 .270
Likelihood Ratio 26.898 20 .138
Linear-by-Linear Association 3.141 1 .076
N of Valid Cases 250
Urban Pearson Chi-Square 31.493c 20 .049
Likelihood Ratio 33.546 20 .029
Linear-by-Linear Association 4.056 1 .044
N of Valid Cases 500
PRABHAKAR BETHAPUDI ISSN:2349-4638 Vol.6. Issue.1.2019 (Jan-Mar)
Int.J.Buss.Mang.& Allied.Sci. (ISSN:2349-4638) 43
Findings:
Rural Market – H010 is Accepted
Since the calculated P value in Rural region (0.270) is greater than the tabulated value the Null
hypothesis is accepted. Hence it is inferred that there is no significant association between Kilometers
Ride per day and Brand Preferences of the Consumers in Rural Market
Urban Market – H010 is Rejected
Since the calculated P value in the Urban region (0.049) is less than the tabulated value the Null
hypothesis is rejected. Hence it is inferred that there is a significant association between Kilometers
ride per day Purchase and Brand Preferences of the Consumers in Urban Market.
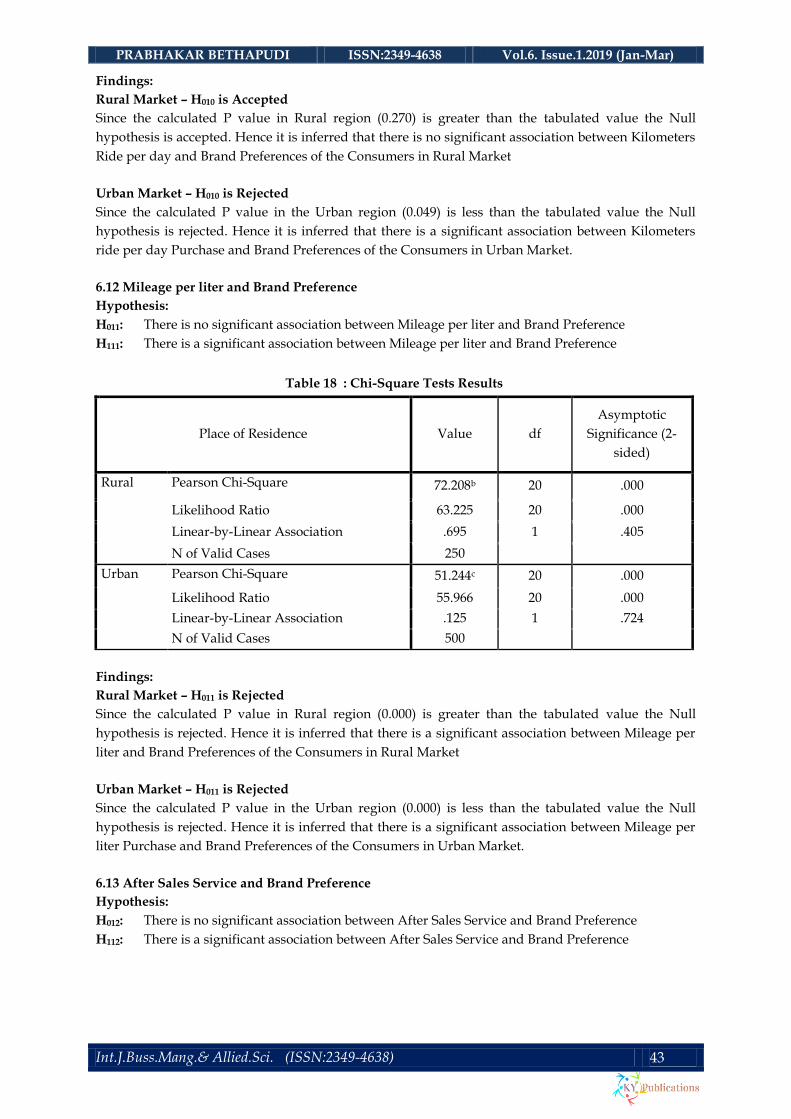
6.12 Mileage per liter and Brand Preference
Hypothesis:
H011: There is no significant association between Mileage per liter and Brand Preference
H111: There is a significant association between Mileage per liter and Brand Preference
Table 18 : Chi-Square Tests Results
Place of Residence Value df
Asymptotic
Significance (2-
sided)
Rural Pearson Chi-Square 72.208b 20 .000
Likelihood Ratio 63.225 20 .000
Linear-by-Linear Association .695 1 .405
N of Valid Cases 250
Urban Pearson Chi-Square 51.244c 20 .000
Likelihood Ratio 55.966 20 .000
Linear-by-Linear Association .125 1 .724
N of Valid Cases 500
Findings:
Rural Market – H011 is Rejected
Since the calculated P value in Rural region (0.000) is greater than the tabulated value the Null
hypothesis is rejected. Hence it is inferred that there is a significant association between Mileage per
liter and Brand Preferences of the Consumers in Rural Market
Urban Market – H011 is Rejected
Since the calculated P value in the Urban region (0.000) is less than the tabulated value the Null
hypothesis is rejected. Hence it is inferred that there is a significant association between Mileage per
liter Purchase and Brand Preferences of the Consumers in Urban Market.
6.13 After Sales Service and Brand Preference
Hypothesis:
H012: There is no significant association between After Sales Service and Brand Preference
H112: There is a significant association between After Sales Service and Brand Preference

PRABHAKAR BETHAPUDI ISSN:2349-4638 Vol.6. Issue.1.2019 (Jan-Mar)
Int.J.Buss.Mang.& Allied.Sci. (ISSN:2349-4638) 44
Table 19 : Chi-Square Tests Results
Place of Residence Value df
Asymptotic
Significance (2-
sided)
Rural Pearson Chi-Square 40.223b 16 .001
Likelihood Ratio 40.175 16 .001
Linear-by-Linear Association .984 1 .321
N of Valid Cases 250
Urban Pearson Chi-Square 83.308c 16 .000
Likelihood Ratio 88.151 16 .000
Linear-by-Linear Association .611 1 .435
N of Valid Cases 500
Findings:
Rural Market – H012 is Rejected
Since the calculated P value in Rural region (0.001) is greater than the tabulated value the Null
hypothesis is rejected. Hence it is inferred that there is a significant association between After Sales
Service and Brand Preferences of the Consumers in Rural Market
Urban Market – H012 is Rejected
Since the calculated P value in the Urban region (0.000) is less than the tabulated value the Null
hypothesis is rejected. Hence it is inferred that there is a significant association between After Sales
Service and Brand Preferences of the Consumers in Urban Market.
6.14 Pickup and Brand Preference
Hypothesis:
H013: There is no significant association between Pickup and Brand Preference
H113: There is a significant association between Pickup and Brand Preference
Table 20 : Chi-Square Tests Results
Place of Residence Value df
Asymptotic
Significance (2-
sided)
Rural Pearson Chi-Square 65.519b 16 .000
Likelihood Ratio 72.208 16 .000
Linear-by-Linear Association 2.112 1 .146
N of Valid Cases 250
Urban Pearson Chi-Square 75.473c 16 .000
Likelihood Ratio 72.873 16 .000
Linear-by-Linear Association 26.328 1 .000
N of Valid Cases 500

PRABHAKAR BETHAPUDI ISSN:2349-4638 Vol.6. Issue.1.2019 (Jan-Mar)
Int.J.Buss.Mang.& Allied.Sci. (ISSN:2349-4638) 45
Findings:
Rural Market – H013 is Rejected
Since the calculated P value in Rural region (0.000) is greater than the tabulated value the Null
hypothesis is rejected. Hence it is inferred that there is a significant association between Pickup and
Brand Preferences of the Consumers in Rural Market
Urban Market – H013 is Rejected
Since the calculated P value in the Urban region (0.000) is less than the tabulated value the Null
hypothesis is rejected. Hence it is inferred that there is a significant association between Pickup and
Brand Preferences of the Consumers in Urban Market.
6.15 Price and Brand Preference
Hypothesis:
H014: There is no significant association between Price and Brand Preference
H114: There is a significant association between Price and Brand Preference
Table 21: Chi-Square Tests Results
Place of Residence Value df
Asymptotic
Significance (2-
sided)
Rural Pearson Chi-Square 33.156b 16 .007
Likelihood Ratio 34.661 16 .004
Linear-by-Linear Association .058 1 .809
N of Valid Cases 250
Urban Pearson Chi-Square 49.925c 16 .000
Likelihood Ratio 57.524 16 .000
Linear-by-Linear Association 1.293 1 .256
N of Valid Cases 500
Findings:
Rural Market – H014 is Rejected
Since the calculated P value in Rural region (0.007) is greater than the tabulated value the Null
hypothesis is rejected. Hence it is inferred that there is a significant association between Price and
Brand Preferences of the Consumers in Rural Market
Urban Market – H014 is Rejected
Since the calculated P value in the Urban region (0.000) is less than the tabulated value the Null
hypothesis is rejected. Hence it is inferred that there is a significant association between Price and
Brand Preferences of the Consumers in Urban Market.
6.16 Correlation Analysis of Rural Market
Table 22: Correlations Analysis of Rural Market
Necessity /
Compulsor
y for Work
Convenienc
e / Reach in
Time
Status /
Neighbo
urs using
Influence
of Family
Influence
of Friends
Save
Transport
Cost
Necessity /
Compulsory for
Work
Pearson
Correlation 1 .333** .415** .199** .020 .077
Sig. (2-tailed) .000 .000 .002 .755 .223
N 250 250 250 250 250 250

PRABHAKAR BETHAPUDI ISSN:2349-4638 Vol.6. Issue.1.2019 (Jan-Mar)
Int.J.Buss.Mang.& Allied.Sci. (ISSN:2349-4638) 46
Convenience /
Reach in Time
Pearson
Correlation .333** 1 .238** .339** .093 .188**
Sig. (2-tailed) .000 .000 .000 .142 .003
N 250 250 250 250 250 250
Status /
Neighbours using
Pearson
Correlation .415** .238** 1 .157* .072 .087
Sig. (2-tailed) .000 .000 .013 .259 .173
N 250 250 250 250 250 250
Influence of
Family
Pearson
Correlation .199** .339** .157* 1 .045 .097
Sig. (2-tailed) .002 .000 .013 .482 .127
N 250 250 250 250 250 250
Influence of
Friens
Pearson
Correlation .020 .093 .072 .045 1 -.038
Sig. (2-tailed) .755 .142 .259 .482 .555
N 250 250 250 250 250 250
Save Transport
Cost
Pearson
Correlation .077 .188** .087 .097 -.038 1
Sig. (2-tailed) .223 .003 .173 .127 .555
N 250 250 250 250 250 250
**. Correlation is significant at the 0.01 level (2-tailed).
*. Correlation is significant at the 0.05 level (2-tailed).
6.17 Correlation Analysis of Urban Market
Table 23: Correlations Analysis of Urban Market
Necessity / Compulsory
for Work
Convenience / Reach in
Time
Status / Neighbours
using Influence of Family
Influence of
Friends
Save Transport
Cost
Necessity /
Compulsory
for Work
Pearson Correlation
1 .315** .428** .144** .004 .048
Sig. (2-tailed) .000 .000 .001 .933 .281
N 500 500 500 500 500 500
Convenience
/ Reach in
Time
Pearson Correlation
.315** 1 .200** .335** .038 .106*
Sig. (2-tailed) .000 .000 .000 .396 .018
N 500 500 500 500 500 500
Status /
Neighbours
using
Pearson Correlation
.428** .200** 1 .104* .097* .129**
Sig. (2-tailed) .000 .000 .020 .031 .004
N 500 500 500 500 500 500
Influence of
Family
Pearson Correlation
.144** .335** .104* 1 -.013 .182**
Sig. (2-tailed) .001 .000 .020 .776 .000
N 500 500 500 500 500 500
Influence of
Friends
Pearson Correlation
.004 .038 .097* -.013 1 -.107*
Sig. (2-tailed) .933 .396 .031 .776 .017
N 500 500 500 500 500 500
Save
Transport
Cost
Pearson Correlation
.048 .106* .129** .182** -.107* 1
Sig. (2-tailed) .281 .018 .004 .000 .017
N 500 500 500 500 500 500
**. Correlation is significant at the 0.01 level (2-tailed).
*. Correlation is significant at the 0.05 level (2-tailed).
PRABHAKAR BETHAPUDI ISSN:2349-4638 Vol.6. Issue.1.2019 (Jan-Mar)
Int.J.Buss.Mang.& Allied.Sci. (ISSN:2349-4638) 47
From the above tables, it is inferred that Convenience and Reach in Time in rural Status and
Neigbhours using are in urban are the highly significant and most influencing reason for buying the
two-wheelers across the categories of the place of residence.
6. Conclusion
From this study, it is found that Convenience and Reach in Time in rural, Status and Neigbhours
using in urban are the highly significant and most influencing reason for buying the two-wheelers
across the categories of the place of residence. In rural areas there exist significant association among
Brand Preference, Marital Status, Age, Education, Income, Occupation, Mode of purchase, Peers
influence, Mode of advertisement, Mileage, After sale service, Pickup and Price in Rural region. In
urban areas there exist significant association among Brand Preference, Age, Education, Income,
Occupation, Mode of advertisement, Mileage and After sale service, Pickup and Price.
References
[1]. ASHWIN S. CHANDORE and DR. T. R. DESHMUKH (2014), DESIGN OF TWO-WHEELER
SEAT: A REVIEW, “International Journal of Pure and Applied Research in Engineering and
Technology” May, Vol.2(9), p.450-458.
[2]. B. A. Abdul Karim, (2012), “A Study of Two-Wheelers Consumer Buying Behavior in
Tirunelveli City (Tamil Nadu)”, Asia Pacific Journal of Research in Business Management, Vol.3,
Issue 3, p. 116-127.
[3]. Dr. Duggani Yuvaraju and S Durga Rao, “Customer Satisfaction towardsHonda Two
Wheelers: A Case Study in Tirupati”, IOSR Journal of Business and Management, May 2014, Vol.
16, Issue 5. Ver. I, P.65-74.
[4]. Dr. M Sakthivel Murugan and R M Shanthi, “Perception of Women Consumers towards the
Purchase Decision of Two Wheelers in India – A Study With Reference to Metropolitan
Cities”, International Research Journal of Business and Management, February 2014, Vol. II, p.25-
35.
[5]. Dr. Ronald Mani and Debasis Tripathy, "A Study on Consumer buying behaviour towards
Two-Wheeler bikes in context of Indian Market" International Journal of Advanced Research in
Management, January - April 2013, Vol.4, issue 1, p.65-73.
[6]. Dr. Sardar Gugloth and Margani Soma Sekhara, "A study relating to the decision-making
process of purchasing two-wheeler's in the rural area of Andhra Pradesh", Global Journal of
Commerce and Management Perspectives, 2012, Vol. 1(2), p.14-18.
[7]. Dr. Abhijeet Agashe and Dr. Rupesh Pais (2014) "Analysis of Brand Image of Two Wheeler
Manufacturers in India using Field Data-Based Model", Indian Journal of Research in
Management, Business, and Social Sciences, January, Vol.2, Issue . 1, p.50-54.
[8]. 1Faiz Ahmed Shaikh, "ACritical Analysis of Consumer buying behavior of two-wheelers
(observations pertinent toAhmednagarcity, Maharashtra), Indian Streams Research Journal,
August 2012, Vol. 2, Issue. 7, p.1-7.
[9]. Kevin Keller(2012), “Marketing Management”, Pearson Education Ltd,p 170.
[10]. Laldinliana, “Consumer behavior towards Two wheelers and Four wheelers: A study on
Rural and Urban Mizoram”, Indian Journal of Marketing, October 2012, p.53-57.
[11]. Oyama (2012), "The Mint”, Vol VI, p.08.
[12]. Pawan Chabra(2011),“BrandJourneyBajajAuto”,4PsBusinessandMarketing,VolVI, p 31-35.
[13]. Philip Kotler (2012), “Marketing Management”, Pearson EducationLtd,p147-148.
[14]. Prof Rajesh Mahrotra and Sachin Kumar Sharma (2012) “An empirical study of buying
behaviour of the two-wheeler users in Jaipur district” Journal of Asian Research Consortium,
October, Vol. 1 issue 5.

PRABHAKAR BETHAPUDI ISSN:2349-4638 Vol.6. Issue.1.2019 (Jan-Mar)
Int.J.Buss.Mang.& Allied.Sci. (ISSN:2349-4638) 48
[15]. Rajesh Mahrotra and Sachin Kumar Sharma, “An empirical study of buying behaviour of the
Two-wheeler users in Jaipur district”, Asian Journal of Research in Marketing, October 2012,
Volume 1, Issue 5. P.24-35.
[16]. Ranjit Mundu, Herat Trivedi and Yuvraj Kurade (2011) in his article “Analysis of Factors
Influencing Two Wheeler Purchases by Women” Beacon – Management Review – SIBM, p.11- 15
[17]. Shashank Srivastava(2012), “Outlook India”, VolL11, No 08, p 42.
[18]. Sheetal Soni and Abhishek Soni, “Consumer Behaviour towards Two-Wheeler Bikes – A
Comparative Study of Rural and Urban Consumers of Jodhpur District of Rajasthan",
International Journal of Global Research Analyst, December 2012, Volume. 1, issue. 7, p.91-92
[19]. V.Senthil Raja (2014), Vibration Reducer for Two-wheeler by Magnetic Absorbing System",
Scholars Journal of Engineering and Technology, Vol.2(2A), p.168-172.