international journal of engineering research & innovation
TRANSCRIPT

International Journal of Engineering Research amp Innovation
SPRING SUMMER 2019
VOLUME 11 NUMBER 1
Editor-in-Chief Mark Rajai PhD California State University Northridge
Published by the
International Association of Journals amp Conferences
WWWIJERIORG Print ISSN 2152-4157 Online ISSN 2152-4165
INTERNATIONAL JOURNAL OF
ENGINEERING RESEARCH AND INNOVATION
CUTTING EDGE JOURNAL OF RESEARCH AND INNOVATION IN ENGINEERING
Mark Rajai PhD
Editor-in-Chief California State University-Northridge College of Engineering and Computer Science Room JD 4510 Northridge CA 91330 Office (818) 677-5003 Email mrajaicsunedu
Contact us
wwwiajcorgwwwijeriorg
wwwijmeus wwwtiijorg
Print ISSN 2152-4157
Online ISSN 2152-4165
bull Manuscripts should be sent electronically to
the manuscript editor Dr Philip Weinsier
at philipwbgsuedu
For submission guidelines visit
wwwijeriorgsubmissions
IJERI SUBMISSIONS
bull The International Journal of Modern Engineering (IJME)
For more information visit wwwijmeus
bull The Technology Interface International Journal (TIIJ)
For more information visit wwwtiijorg
OTHER IAJC JOURNALS
bull Contact the chair of the International
Review Board Dr Philip Weinsier at
philipwbgsuedu
For more information visit
wwwijeriorgeditorial
a TO JOIN THE REVIEW BOARD
bull IJERI is the second official journal of the International
Association of Journals and Conferences (IAJC)
bull IJERI is a high-quality independent journal steered by
a distinguished board of directors and supported by an
international review board representing many well-
known universities colleges and corporations in the
US and abroad
bull IJERI has an impact factor of 158 placing it among
an elite group of most-cited engineering journals
worldwide
ABOUT IJERI
INDEXING ORGANIZATIONS
bull IJERI is indexed by numerous agencies
For a complete listing please visit us at
wwwijeriorg
mdashmdashmdashmdashmdashmdashmdashmdashmdashmdashmdashmdashmdashmdashmdashmdashmdashmdashmdashmdashmdashmdashmdashmdashmdashmdashmdashmdashmdashmdashmdashmdashmdashmdashmdashmdashmdashmdashmdashmdashmdashmdashmdashmdashmdashmdashmdashmdashmdashmdash
mdashmdashmdashmdashmdashmdashmdashmdashmdashmdashmdashmdashmdashmdashmdashmdashmdashmdashmdashmdashmdashmdashmdashmdashmdashmdashmdashmdashmdashmdashmdashmdashmdashmdashmdashmdashmdashmdashmdashmdashmdashmdashmdashmdashmdashmdashndashmdashmdashmdashmdash
INTERNATIONAL JOURNAL OF ENGINEERING RESEARCH AND INNOVATION
INTERNATIONAL JOURNAL OF ENGINEERING
RESEARCH AND INNOVATION The INTERNATIONAL JOURNAL OF ENGINEERING RESEARCH AND
INNOVATION (IJERI) is an independent and not-for-profit publication which
aims to provide the engineering community with a resource and forum for scholar-
ly expression and reflection
IJERI is published twice annually (fall and spring issues) and includes peer-
reviewed research articles editorials and commentary that contribute to our un-
derstanding of the issues problems and research associated with engineering and
related fields The journal encourages the submission of manuscripts from private
public and academic sectors The views expressed are those of the authors and do
not necessarily reflect the opinions of the IJERI editors
EDITORIAL OFFICE
Mark Rajai PhD
Editor-in-Chief
Office (818) 677-2167
Email ijmeeditoriajcorg
Dept of Manufacturing Systems
Engineering amp Management
California State University-
Northridge
18111 Nordhoff Street
Northridge CA 91330-8332
THE INTERNATIONAL JOURNAL OF ENGINEERING
RESEARCH AND INNOVATION EDITORS
Editor-in-Chief
Mark Rajai
California State University-Northridge
Associate Editors
Paul Wilder
Vincennes University
Li Tan
Purdue University North Central
Production Editor
Philip Weinsier
Bowling Green State University-Firelands
Subscription Editor
Morteza Sadat-Hossieny
Northern Kentucky University
Web Administrator
Saeed Namyar
Advanced Information Systems
Manuscript Editor
Philip Weinsier
Bowling Green State University-Firelands
Copy Editors
Li Tan
Purdue University North Central
Ahmad Sarfaraz
California State University-Northridge
Technical Editors
Marilyn Dyrud
Oregon Institute of Technology
Publisher
Bowling Green State University Firelands
Editorrsquos Note Academic Active-Shooter Incidents 3
Philip Weinsier IJERI Manuscript Editor
Analyzing Response Communication Mitigation Methods through Simulation Modeling 5
Katherine E Reichart Purdue University Anna R Larson Purdue University
Kristal K Smith Purdue University J Eric Dietz Purdue University
Developing an Open Source Inexpensive Large-Scale Polar Configuration 3D Printer 13
Sourabh Prashant Deshpande University of Cincinnati Shrinivas Kulkarni Michigan Technological University
Sid Shah Michigan Technological University John Irwin Michigan Technological University
A Comparative Study of the Thermal Efficiency of Solar Vacuum-Tube versus Flat-Plate Collectors
for Water Heating Systems 23
SV Vishnu Samudrala Zimmer Biomet Ahmed ElSawy Tennessee Technological University
Mohan Rao Tennessee Technological University Stephen Idem Tennessee Technological University
Design and Development of a GUI for RF Communications 30
Ehsan Sheybani University of South Florida Giti Javidi University of South Florida
A Diagnostic Clock for Verification of Image Time Synchronization 37
Curtis Cohenour Ohio University
Assessing the Effectiveness of an Automatic Door Lock System by Discharge Detection to Lower
Casualties during an Academic Active Shooter Incident 46
Jae Yong Lee Purdue University James Eric Dietz Purdue University
Instructions for Authors Manuscript Formatting Requirements 53
mdashmdashmdashmdashmdashmdashmdashmdashmdashmdashmdashmdashmdashmdashmdashmdashmdashmdashmdashmdashmdashmdashmdashmdashmdashmdashmdashmdashmdashmdashmdashmdashmdashmdashmdashmdashmdashmdashmdashmdashmdashmdashmdashmdashmdashmdashndashmdashmdashmdashmdash
mdashmdashmdashmdashmdashmdashmdashmdashmdashmdashmdashmdashmdashmdashmdashmdashmdashmdashmdashmdashmdashmdashmdashmdashmdashmdashmdashmdashmdashmdashmdashmdashmdashmdashmdashmdashmdashmdashmdashmdashmdashmdashmdashmdashmdashmdashndashmdashmdashmdashmdash
INTERNATIONAL JOURNAL OF ENGINEERING RESEARCH AND INNOVATION | V11 N1 SPRINGSUMMER 2019
TABLE OF CONTENTS
Philip Weinsier IJERI Manuscript Editor
mdashmdashmdashmdashmdashmdashmdashmdashmdashmdashmdashmdashmdashmdashmdashmdashmdashmdashmdashmdashmdashmdashmdashmdashmdashmdashmdashmdashmdashmdashmdashmdashmdashmdashmdashmdashmdashmdashmdashmdashmdashmdashmdashmdashmdashmdashmdashmdashmdashmdashmdashndashmdashmdashmdashmdash
IN THIS ISSUE (P46)
ACADEMIC ACTIVE-SHOOTER INCIDENTS
So many of our children have experienced violent
deaths in our nationrsquos schools the one place we would
like to think where our children will be safe outside of
their homes Yet anyone listening to the news since the
inventions of radio and TV are hearing otherwise By
any measure and regardless of the sourcemdashthe National
Education Association (NEA) the American Federation
of Teachers (AFT) Everytown (for gun safety) K12ac-
ademics CNNmdashtoo many of our children have lost
their lives in school shootings Due to media attention
TV viewers can be forgiven if they perceive school
shootings as a relatively new phenomenonmdash15 events
in 2019 alone 39 between 2010 and 2018 and another
147 deaths between 2000 and 2010 But according to
these same sources there were another 98 incidents go-
ing back to 1764 In that first recorded event nine of the
11 children and the schoolmaster were shot and killed
Mass school shootingsmdashas if it should make a differ-
ence how many children are slaughtered even one
should be cause for national concern and federal ac-
tionmdashcomprise only 1 of school gun violence inci-
dents while logging 28 of the total number of deaths
But lest we think that all of these shootings were perpe-
trated by crazed current or former students (40) or
facultystaff or resource officers it should be noted that
44 are actually suicides and attempted suicides unin-
tentional shootings and legal interventions not sure
what that last category is At least in New York 79 of
active-shooter incidents in schools were perpetrated by
a school-aged student (and a current or recent graduate
of the school)
The next question that we all ask is where are these
children getting their guns As the vast majority of
these shooters are under 18 they are not buying the
guns themselves (at least not legally) Evidence suggests
that 78 of them get their weapons from their own
homes or those of friends and relatives So far all one
can say is that there is a problem a problem that has
myriad facets Given that government irrespective of
your opinion of the current administration is either in-
capable or simply not doing enough on its end to miti-
gate the problem society is trying to find its own solu-
tions Instead of getting guns out of the hands of poten-
tial shootersmdashone facet of the problem that our elected
officials will argue ad nauseam without effective re-
sultsmdashthere are many researchers working on scenarios
to keep students safe or at least as safe as possible
when an active-shooter situation arises Currently
runhidefight (RHF) is a national mantra for being pre-
pared for such events But according to the authors of
this featured article (see Assessing the Effectiveness of
an Automatic Door Lock System by Discharge Detec-
tion to Lower Casualties during an Academic Active
Shooter Incident on p46) modeling a scenario similar
to the Parkland shooting suggests that the application of
RHF without situational awareness of the shooterrsquos lo-
cation could cause higher casualty rates by an average
of more than 126 individuals Thus in their study the
authors compared the casualty rates of two models
The first model consisted only of hide (shelter-in-
place) and run (evacuate) The second model applied the
first modelrsquos components with an automatic door lock
system which was triggered by discharge detection To
exclude human participation and to prevent physiologi-
cal and psychological impact agent-based modeling
(ABM) was used to recreate a one-story academic infra-
structure with 26 lecture halls and three exits containing
600 unarmed individuals The flexibility of ABM allows
multiple iterations while manipulating various parame-
ters The ABM approach in active-shooter research also
eliminates human error and logistical issues The out-
come of this study evaluates the effectiveness of an au-
tomated door lock system based on firearm discharge
detection with a campus-wide alert system to conduct
lockdown
As frustrating and embarrassing as it has been for
well centuries now it is my sincere hope that our tech-
niques for increasing student safety will outpace the
ability of frustrated revengeful and deranged individu-
als to enter our schools and harm our children And by
harm I mean not only save the anguish on the part of
the parents in their childrenrsquos deaths but also the life-
long debilitating and mentally scarring effects on those
surviving such shootings
mdashmdashmdashmdashmdashmdashmdashmdashmdashmdashmdashmdashmdashmdashmdashmdashmdashmdashmdashmdashmdashmdashmdashmdashmdashmdashmdashmdashmdashmdashmdashmdashmdashmdashmdashmdashmdashmdashmdashmdashmdashmdashmdashmdashmdashmdashndashmdashmdashmdashmdash
EDITORrsquoS NOTE (IN THIS ISSUE) ACADEMIC ACTIVE-SHOOTER INCIDENTS 3
mdashmdashmdashmdashmdashmdashmdashmdashmdashmdashmdashmdashmdashmdashmdashmdashmdashmdashmdashmdashmdashmdashmdashmdashmdashmdashmdashmdashmdashmdashmdashmdashmdashmdashmdashmdashmdashmdashmdashmdashmdashmdashmdashmdashmdashmdashndashmdashmdashmdashmdash
mdashmdashmdashmdashmdashmdashmdashmdashmdashmdashmdashmdashmdashmdashmdashmdashmdashmdashmdashmdashmdashmdashmdashmdashmdashmdashmdashmdashmdashmdashmdashmdashmdashmdashmdashmdashmdashmdashmdashmdashmdashmdashmdashmdashmdashmdashndashmdashmdashmdashmdash
4 INTERNATIONAL JOURNAL OF ENGINEERING RESEARCH AND INNOVATION | V11 N1 SPRINGSUMMER 2019
State University of New York (NY) North Carolina AampT State University (NC)
Michigan Tech (MI)
Purdue University Northwest (IN) Zamfara AC Development (NIGERIA)
Virginia State University (VA)
Memphis University (TN) Guru Nanak Dev Engineering (INDIA)
Bowling Green State Univ Firelands (OH)
Minnesota State University (MN) Texas AampM University Kingsville (TX)
Illinois State University (IL)
Iowa State University (IA) Eastern Illinois University (IL)
Indiana State University (IN)
Ohio University (OH) Claflin University (SC)
North Carolina AampT State University (NC)
Alabama AampM University (AL) Ferris State University (MI)
Appalachian State University (NC)
Oregon Institute of Technology (OR) Elizabeth City State University (NC)
Tennessee Technological University (TN)
Millersville University (PA) University of Tennessee Chattanooga (TN)
Zagazig University EGYPT) Utah Valley University (UT)
Abu Dhabi University (UAE)
Purdue Polytechnic (IN) Penn State University (PA)
Safety Engineer in Sonelgaz (ALGERIA)
City University of New York (NY) Central Connecticut State University (CT)
University of Louisiana Lafayette (LA)
North Dakota State University (ND) North Carolina AampT University (NC)
Indiana University Purdue (IN)
Michigan Tech (MI) Eastern Illinois University (IL)
Bowling Green State University (OH)
Millersville University (PA) Purdue Polytechnic (IN)
North Dakota State University (ND)
Abu Dhabi University (UAE) Purdue University Calumet (IN)
Bowling Green State University (OH)
Southeast Missouri State University (MO) Bowling Green State University (OH)
Ohio University (OH)
Penn State University Berks (PA) Central Michigan University (MI)
Florida AampM University (FL)
Penn State University (PA) ARUP Corporation
University of Louisiana (LA)
University of Southern Indiana (IN) Eastern Illinois University (IL)
Cal State Poly Pomona (CA)
Excelsior College (NY) Jackson State University (MS)
Penn State Berks (PA)
California State University Fresno (CA) Michigan Tech (MI)
Mohammed Abdallah Paul Akangah
Nasser Alaraje
Ali Alavizadeh Lawal Anka
Jahangir Ansari
Kevin Berisso Pankaj Bhambri
Michelle Brodke
Shaobiao Cai Rajab Challoo
Isaac Chang
Shu-Hui (Susan) Chang Rigoberto Chinchilla
Phil Cochrane
Curtis Cohenour Emily Crawford
Dongyang (Sunny) Deng
ZT Deng Sagar Deshpande
David Domermuth
Marilyn Dyrud Mehran Elahi
Ahmed Elsawy
Cindy English Ignatius Fomunung
Ahmed Gawad Mohsen Hamidi
Mamoon Hammad
Gene Harding Bernd Haupt
Youcef Himri
Delowar Hossain Xiaobing Hou
Shelton Houston
Ying Huang Christian Bock-Hyeng
Pete Hylton
John Irwin Toqeer Israr
Sudershan Jetley
Alex Johnson Rex Kanu
Reza Karim
Manish Kewalramani Tae-Hoon Kim
Chris Kluse
Doug Koch Resmi Krishnankuttyrema
Zaki Kuruppalil
Shiyoung Lee Soo-Yen (Samson) Lee
Chao Li
Dale Litwhiler Mani Manivannan
GH Massiha
Thomas McDonald David Melton
Shokoufeh Mirzaei
Sam Mryyan Jessica Murphy
Rungun Nathan
Arun Nambiar Aurenice Oliveira
University of Central Missouri (MO) Purdue Fort Wayne (IN)
Community College of Rhode Island (RI)
Sardar Patel University (INDIA) Virginia State University (VA)
Broadcom Corporation
Warsaw University of Tech (POLAND) University of West Florida (FL)
California State University-Fullerton (CA)
Wireless Systems Engineer Brigham Young University (UT)
DeSales University (PA)
Baker College (MI) Michigan Technological University (MI)
Zagros Oil amp Gas Company (IRAN)
St Cloud State University (MN) Shahrood University of Technology (IRAN)
North Carolina AampT State University (NC)
Government Engineering College (INDIA) Wentworth Institute of Technology (MA)
Southern Illinois University (IL)
Ohio University (OH) Camarines Sur Polytechnic (PHILIPPINES)
Missouri University of Science amp Tech (MO)
University of Houston Downtown (TX) University of Central Missouri (MO)
University of South Florida Polytechnic (FL) Central Connecticut State University (CT)
Texas AampM University (TX)
Thammasat University (THAILAND) Central Connecticut State University (CT)
Purdue University (IN)
University of Pittsburgh Johnstown (PA) Purdue University Calumet (IN)
Sam Houston State University (TX)
Ohio University (OH) Jackson State University (MS)
Missouri Western State University (MO)
Troy Ollison Reynaldo Pablo
Basile Panoutsopoulos
Shahera Patel Thongchai Phairoh
Huyu Qu
Desire Rasolomampionona Michael Reynolds
Nina Robson
Marla Rogers Dale Rowe
Karen Ruggles
Anca Sala Alex Sergeyev
Mehdi Shabaninejad
Hiral Shah Mojtaba Shivaie
Musibau Shofoluwe
Amitkumar B Solanki Jiahui Song
Carl Spezia
Michelle Surerus Harold Terano
Sanjay Tewari
Vassilios Tzouanas Jeff Ulmer
Abraham Walton Haoyu Wang
Jyhwen Wang
Boonsap Witchayangkoon Shuju Wu
Baijian (Justin) Yang
Eunice Yang Xiaoli (Lucy) Yang
Faruk Yildiz
Yuqiu You Pao-Chiang Yuan
Jinwen Zhu
Editorial Review Board Members
ANALYZING RESPONSE COMMUNICATION MITIGATION
METHODS THROUGH SIMULATION MODELING mdashmdashmdashmdashmdashmdashmdashmdashmdashmdashmdashmdashmdashmdashmdashmdashmdashmdashmdashmdashmdashmdashmdashmdashmdashmdashmdashmdashmdashmdashmdashmdashmdashmdashmdashmdashmdashmdashmdashmdashmdashmdashmdashmdashmdashmdashndashmdashmdashmdashmdash
Katherine E Reichart Purdue University Anna R Larson Purdue University Kristal K Smith Purdue University
J Eric Dietz Purdue University
When modeling active shooter scenarios communicating
proper procedures saves lives Notifying authorities increas-
es response time which prevents fatal casualties The shoot-
er will engage the police instead In the 2015 Orlando night-
club shooting police were notified at 202 am from an off-
duty officer acting as a security guard (Ellis Fantz Karimi
amp McLoughlin 2016) This was four minutes after shooting
started However additional external communication did
not only come from the Orlando police department Rather
the nightclub itself used social media to communicate with
patrons People inside also provided personal and external
communication to the police or family members Active
shooters represent a scenario in which communication and
procedure must be set in place prior to the emergency to
accurately work In this way simulation modeling can pro-
vide ldquopracticerdquo in the distribution of responders areas of
weakness and effective communication Choosing a simu-
lation modeling source means selecting a system that pro-
vides multiple modeling scenarios AnyLogic Personal
Learning Edition (PLE) affords the creation of limited yet
diverse models Using agent-based logic modeling commu-
nication could be as realistic and individualized as needed
Venue Case Studies
Venues must adapt to different daily scenarios as crowds
change with the event Therefore getting an accurate evacu-
ation time is difficult mostly because publishing this data
has the potential to hurt a venuersquos security Based on evacu-
ation times in apartment buildings the average time it takes
to start evacuating (from a fire) is approximately
10 minutes assuming alert systems are in place (Proulx
1995) In combination with that time the average evacua-
tion took approximately 22 minutes to complete However
this study was done on apartment buildings as opposed to a
large event venue like a stadium Given the magnitude of
such evacuation times are more akin to typical exit proce-
dures However these times are not measured and may be
skewed as patrons are not forced to leave Therefore the
aforementioned study may be more useful to compare tim-
ing than data collected from an after-hours event This study
also took mobility constraints into consideration involving
those with special needs Ultimately the study does show
that communication effects evacuation rates The next step
was to compare this information to large event venues and
their communication methods
Abstract
Emergencies rely heavily on succinct and controlled an-
nouncements from a singular verified source However this
has been an ideal not reality Often veritable communica-
tion has occurred after events as official sources may not
have been available to comment or provide personal instruc-
tion to individuals Current communication simulation mod-
eling involves communication systems in commutation with
actual communication Systems are not the only way infor-
mation is spread In this study the authors analyzed formal
and informal response methods in an emergency at a large
event By comparing multiple methods in a systems dynam-
ic model the researchers estimated the relative value of four
communication sources in terms of impact and response
metrics The results influenced subsequent agent-based
models that reflected a real evacuation of messaging The
study resulted in increased understanding of evacuation
communication procedures as well as the simultaneous test-
ing of multiple forms of communication The models
proved that the most reliable and rapid communication has
the most impact on saving lives Additionally these proce-
dures gave insight into communication effectiveness as well
as the best combinations of messaging Thus these models
as estimates should offer insight into the current communi-
cation response procedures and their future applications
Introduction
Current communication simulation modeling should in-
volve communication systems in commutation with actual
communication Consider that an Amber alert and an online
network might be similar in communication structure but
not in actual practice Miscommunication in an online net-
work means losing all connection In an emergency false
and inconsistent messages occur According to the Depart-
ment of Homeland Security emergencies rely heavily on
succinct and controlled announcements from a singular veri-
fied source However this is an ideal as opposed to the real-
ity (DHS 2014) Communication will often be announced
after the event as official sources may not be available to
comment immediately or provide personal instruction to
individuals Worse the communication itself will stem from
various sources that may worsen the emergency An exam-
ple of multiple sources would be the difference between
formal and informal sources
mdashmdashmdashmdashmdashmdashmdashmdashmdashmdashmdashmdashmdashmdashmdashmdashmdashmdashmdashmdashmdashmdashmdashmdashmdashmdashmdashmdashmdashmdashmdashmdashmdashmdashmdashmdashmdashmdashmdashmdashmdashmdashmdashmdashmdashmdashmdashmdashmdashmdash
INTERNATIONAL JOURNAL OF ENGINEERING RESEARCH AND INNOVATION | V11 N1 SPRINGSUMMER 2019 5
mdashmdashmdashmdashmdashmdashmdashmdashmdashmdashmdashmdashmdashmdashmdashmdashmdashmdashmdashmdashmdashmdashmdashmdashmdashmdashmdashmdashmdashmdashmdashmdashmdashmdashmdashmdashmdashmdashmdashmdashmdashmdashmdashmdashmdashmdashndashmdashmdashmdashmdash
mdashmdashmdashmdashmdashmdashmdashmdashmdashmdashmdashmdashmdashmdashmdashmdashmdashmdashmdashmdashmdashmdashmdashmdashmdashmdashmdashmdashmdashmdashmdashmdashmdashmdashmdashmdashmdashmdashmdashmdashmdashmdashmdashmdashmdashmdashndashmdashmdashmdashmdash
6 INTERNATIONAL JOURNAL OF ENGINEERING RESEARCH AND INNOVATION | V11 N1 SPRINGSUMMER 2019
In a 2014 study of Ladd Pebbles Stadium in Mobile Ala-
bama focusing on stadium design researchers spoke to the
international standard of eight minutes for a stadium evacu-
ation to occur This study focused on the physical limita-
tions associated with evacuations (crowding collisions
social norms etc) However very little attention was paid
to communication factors that could affect timing in an
emergency Instead the study focused on evacuation flow
rate simulation and avoiding and assuming communication
dynamics (Aldana Fox Diehl amp Dimitoglou 2014) How-
ever case studies show how vital communication is to evac-
uation planning At ATampT Stadium staff members are giv-
en a rundown on their tasks of the day and what to expect in
terms of safety at the beginning of each shift These task
sheets include updates and reminders for the event and pro-
vide photos of what the passes and wristbands look like so
there are no copies (ATampT 2018) It also reminds them if
they see something to say something Each staff member is
also expected to get a formal safety briefing from their su-
pervisor prior to doors opening
However arenas are not the only example of a large event
venue University stadiums arenas and event centers are
typically less secure and at higher risk for an emergency
Surveying three universities and their plans offered a more
comprehensive list of evacuation procedures and methods
Additionally these case studies offered the opportunity to
see how they communicated information consistently to
both long-time and first-time visitors Though they also
showed methods related to staffing this was not an im-
portant factor for the current research project Townson
University has a public version of their arenarsquos emergency
response plan and they outline a list of important infor-
mation items for their event staff to know before their event
This list covers familiarizing staff and contractors on emer-
gency procedures fire procedures emergency exit policies
equipment and seating policies and other general rules
The Townson report also covers the procedures during an
emergency As soon as an incident occurs it is noted on the
PA and via a bullhorn in case of a fire alarm or PA equip-
ment failure the TUPD will designate a safe location out-
side management will direct patrons during evacuation and
will use the radio for communication and an operations
commander will be assigned These procedures are based on
the National Incident Management System (NIMS) the
National Response Framework (NRF) and the Incident
Command System (ICS) These provide guidelines for pre-
paredness and compliance Anyone involved in security
management should be fully aware especially when ensur-
ing the safety of over several hundred people (Towson
2018) From these case studies responses require necessary
preparation and practice Based on this information evacua-
tion times should be estimated at approximately 20 minutes
for an average venue with systems in place prior to the
event itself This time includes both the processing and ac-
tual physical evacuation time The communication methods
employed by these venues will be further explored in the
following section
Emergency Communication Methods
In 2008 the Department of Homeland Security designed a
planning guide for emergencies in stadiums The guide has
a section for a notification system during emergencies Dur-
ing emergencies understanding the different reactions that
people can have is important to consider Using the different
possibilities can be helpful in designing an efficient notifi-
cation system The employees also need to be trained on all
aspects of the system to be sure that communication will be
effective Using common language during emergencies al-
lows for everyone to understand The guide also advises
everyone to ensure that they have a plan for displaying in-
formation (screens jumbotrons etc) along with having
employees check areas without any displays (DHS 2008)
Thus communication response methods should relate to
two communication systems visual and audio Sight and
hearing are the primary ways that any person will begin to
understand a message
Stadiums typically have public announcement systems
that will take into consideration both visual and auditory
public announcement systems but do not capitalize on addi-
tional communication systems that may be available to their
audience According to Kenneth Burke the percentage rate
of text messages being opened is 99 Burkersquos article also
states that 95 of text messages are opened within three
minutes and on average they are read in under five seconds
(Bankers 2018) This statistic is particularly useful consid-
ering that many stadiums have fan text messaging that could
evolve into an emergency communication service For ex-
ample Bankers Life Fieldhouse a stadium in Indianapolis
Indiana offers several different fan information services
Among website information is the texting service that is
offered to fans Bankers Life Fieldhouse offers a texting
service that fans can use if they ever encounter anything
suspicious during events The service is anonymous so they
can inform building management without needing to give
any personal information Bankers Life Fieldhouse also
specifies that if the service is misused the number will be
blocked for a full 24 hours (2018)
According to Cutlip and Centerrsquos Effective Public Rela-
tions (2013) there are serval communication methods to
apply to audiences (Broom Sha Seshadrinathan Center amp
Cutlip 2013) Among the various communication models
mdashmdashmdashmdashmdashmdashmdashmdashmdashmdashmdashmdashmdashmdashmdashmdashmdashmdashmdashmdashmdashmdashmdashmdashmdashmdashmdashmdashmdashmdashmdashmdashmdashmdashmdashmdashmdashmdashmdashmdashmdashmdashmdashmdashmdashmdashndashmdashmdashmdashmdash
and relevant to communications in emergency management
the mass communication model is the most effective The
mass communications model has six elements 1) the send-
er 2) the message 3) the medium or channel 4) the receiv-
ers 5) relationship contexts and 6) the social environment
Therefore the sender is the source of the impact and can
influence how it is received (Broom et al 2013) Conse-
quently credibility intensifies information and could impact
how effective a message is A message is information that is
sent or given to someone
Furthermore from Cutlip and Center messages are cate-
gorized into ldquotext verbal multimedia print etcrdquo (Broom et
al 2013) Assumption suggests that emergency manage-
ment messages have to be clear and concise However in-
terpretation occurs when communicating with the masses
and must be considered as a potential obstacle when crafting
a message (Broom et al 2013) The medium or channel that
a message uses has equal importance to the message From
a 1971 body language study face-to-face communication
delivers effective communication information yet 70-90
of communication is through nonverbal cues like gestures
and facial expressions (Mehrabian 1971) Such direct com-
munication is valuable but using technology as a medium
for communication such as social media has resulted in
creating more ways to communicate during emergencies
(Broom et al 2013) These options should be explored
more fully in terms of emergency communications
Alertus Technologies is a unified mass notification com-
munication system Alertus is often used for large events
and companies for emergency situations Alertus utilizes a
combination of communication methods to maximize the
possibility of reaching all parties The different methods
include text messaging email public announcement sys-
tems digital signage and desktop computers A few compa-
nies that utilize Alertus Technologies include Disney
ESPN and Toronto Pan AM Sports Centre (Alertus Tech-
nologies 2018) This technology system appears to encom-
pass all communication systems However the full system
relies on the combination of systems Whether this combi-
nation is effective or not depends on how accurate or effec-
tive the communication is Alertus does what many arenas
are capable of but in a way that puts the control in a uni-
fied separate entity
Methodology
In developing a way to model response communication
the authors determined that a system dynamics model would
provide a new look at response communication Response
communication requires speed time and people Balancing
these three variables is essential to effective communica-
tion Some constants such as communication and evacua-
tion rate can be influenced by these variables Thus com-
munication is a system that can be made more effective and
accurate through modeling The systems dynamics model
being used was based on a Bass diffusion model Developed
in 1969 by Frank M Bass and John A Norton a Bass diffu-
sion model represents how a potential market is affected by
advertisers and word of mouth (1987) Advertising has the
potential to spread a concise clear and strong message with
little to no resources Thus this model is a great reference
for emergency communication
Regarding this specific project the Bass Diffusion model
was changed to reflect emergency communication This
method was chosen based on how well advertisement mir-
rors communication It necessitates and requires effective
understanding but also showcases errors that are corrected
based on an alternate system Bass diffusion takes commu-
nication by word of mouth into consideration and is a large
part of emergency communication If all emergency com-
munication systems were to fail word of mouth would still
be prevalent Thus word of mouth acts as a constant in this
current model of emergency response communication
However it has an obvious error rate regarding miscommu-
nication and timely understanding
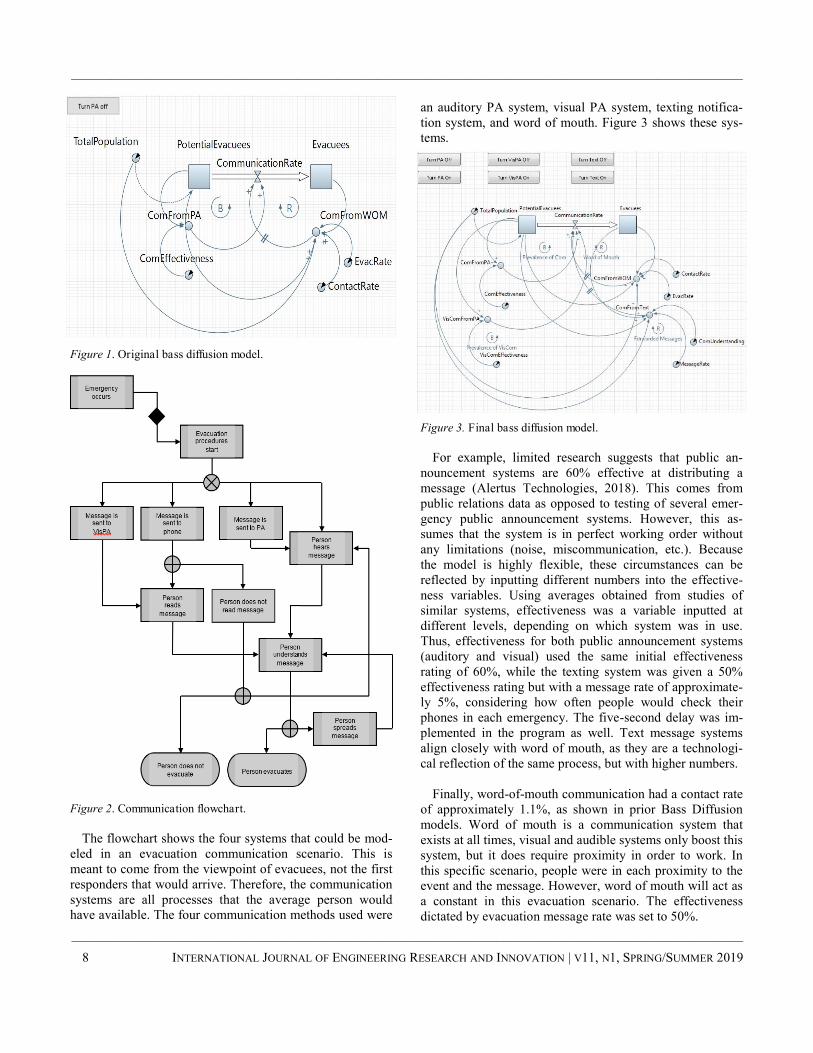
Bass Diffusion Model
Figure 1 shows how initial method research was conduct-
ed in order to see how well a Bass Diffusion model could
adapt to emergency communication By replacing the popu-
lation to reflect the emergency at hand the communication
rate was no longer influenced by advertisement but by an
auditory public announcement (PA) system As mentioned
earlier word-of-mouth communication is still reflected and
influenced by contact rate and the evacuation message rate
(Norton amp Bass 1987) The model appeared to accurately
reflect evacuation message procedures including a delay
that reflects understanding or processing time
Regarding this study the error lies in uniformity of mes-
sage Different communication systems have different chal-
lenges The message to evacuate goes through several dif-
ferent paths thus some of the messages are delayed wheth-
er through human or technologically dictated circumstances
Developing a flowchart allowed the authors to show the
specific challenges associated with each system and how
they could apply to the model Figure 2 shows how the steps
associated with each system should result in understanding
This is where the Bass Diffusion model ends as understand-
ing implies that they have fully received the evacuation
message This does not account for the actual time that it
would take for a person to evacuate (a lengthier process)
mdashmdashmdashmdashmdashmdashmdashmdashmdashmdashmdashmdashmdashmdashmdashmdashmdashmdashmdashmdashmdashmdashmdashmdashmdashmdashmdashmdashmdashmdashmdashmdashmdashmdashmdashmdashmdashmdashmdashmdashmdashmdashmdashmdashmdashmdashndashmdashmdashmdashmdash
ANALYZING RESPONSE COMMUNICATION MITIGATION METHODS THROUGH SIMULATION MODELING 7
mdashmdashmdashmdashmdashmdashmdashmdashmdashmdashmdashmdashmdashmdashmdashmdashmdashmdashmdashmdashmdashmdashmdashmdashmdashmdashmdashmdashmdashmdashmdashmdashmdashmdashmdashmdashmdashmdashmdashmdashmdashmdashmdashmdashmdashmdashndashmdashmdashmdashmdash
mdashmdashmdashmdashmdashmdashmdashmdashmdashmdashmdashmdashmdashmdashmdashmdashmdashmdashmdashmdashmdashmdashmdashmdashmdashmdashmdashmdashmdashmdashmdashmdashmdashmdashmdashmdashmdashmdashmdashmdashmdashmdashmdashmdashmdashmdashndashmdashmdashmdashmdash
8 INTERNATIONAL JOURNAL OF ENGINEERING RESEARCH AND INNOVATION | V11 N1 SPRINGSUMMER 2019
an auditory PA system visual PA system texting notifica-
tion system and word of mouth Figure 3 shows these sys-
tems
Figure 3 Final bass diffusion model
For example limited research suggests that public an-
nouncement systems are 60 effective at distributing a
message (Alertus Technologies 2018) This comes from
public relations data as opposed to testing of several emer-
gency public announcement systems However this as-
sumes that the system is in perfect working order without
any limitations (noise miscommunication etc) Because
the model is highly flexible these circumstances can be
reflected by inputting different numbers into the effective-
ness variables Using averages obtained from studies of
similar systems effectiveness was a variable inputted at
different levels depending on which system was in use
Thus effectiveness for both public announcement systems
(auditory and visual) used the same initial effectiveness
rating of 60 while the texting system was given a 50
effectiveness rating but with a message rate of approximate-
ly 5 considering how often people would check their
phones in each emergency The five-second delay was im-
plemented in the program as well Text message systems
align closely with word of mouth as they are a technologi-
cal reflection of the same process but with higher numbers
Finally word-of-mouth communication had a contact rate
of approximately 11 as shown in prior Bass Diffusion
models Word of mouth is a communication system that
exists at all times visual and audible systems only boost this
system but it does require proximity in order to work In
this specific scenario people were in each proximity to the
event and the message However word of mouth will act as
a constant in this evacuation scenario The effectiveness
dictated by evacuation message rate was set to 50
Figure 1 Original bass diffusion model
Figure 2 Communication flowchart
The flowchart shows the four systems that could be mod-
eled in an evacuation communication scenario This is
meant to come from the viewpoint of evacuees not the first
responders that would arrive Therefore the communication
systems are all processes that the average person would
have available The four communication methods used were
mdashmdashmdashmdashmdashmdashmdashmdashmdashmdashmdashmdashmdashmdashmdashmdashmdashmdashmdashmdashmdashmdashmdashmdashmdashmdashmdashmdashmdashmdashmdashmdashmdashmdashmdashmdashmdashmdashmdashmdashmdashmdashmdashmdashmdashmdashndashmdashmdashmdashmdash
Pedestrian Traffic Model
Using an agent was necessary to show the second part of
the flowchart in which the message is spread through behav-
ior People are the distributors of messages and their behav-
ior should be considered Stadium evacuation simulation
has been used previously to measure crowd dynamics In
the aforementioned 2014 study of Ladd Pebbles Stadium
the researchers compared crowd simulation models The
chosen model was behavioral using agent-based modeling
as a means of crowd simulation This allows for a more ful-
ly formed approach to stadium emergency evacuation and
verifies that simulation can be used as a valid approach to
evacuation research (Aldana et al 2014)
Through AnyLogic 8rsquos pedestrian traffic library the mes-
sage spread can be shown in real time Figure 4 shows how
the message can be spread based on word-of-mouth data
Using a statechart one can base the message on a specific
variable as opposed to a parameter Therefore a statechart
was created to manipulate the message variable as opposed
to manipulating the parameters to reflect a variable The
statechart uses the same understanding and contact rate as
word-of-mouth communication This validates the Bass
Diffusion Model By using actual agents the modeling is
more successful than the systems dynamics model at dis-
playing contact information Additionally pedestrian mod-
eling will eventually show the full extent of evacuation as a
result of the communication systems not just the system
itself
Figure 4 Pedestrian model statechart
The physical structure of the pedestrian model is meant to
reflect stadium seating so that communication rate is as
close to realistic as possible Figure 5 shows that the model
uses two waiting areas with separate agents The agents all
begin as blue until the evacuation order is released Then
the message is sent Once one person has the message they
will turn red depending on contact and proximity Error is
included to account for misunderstanding due to chaos and
human error
Figure 5 Final pedestrian model
Ultimately the final pedestrian model simulates one nec-
essary communication method Additional methods will
require further modelling to validate and continue testing
This is something the researchers hope to pursue in the fu-
ture especially as new communication methods become
popular
Results
Using the results from the systems dynamics model the
researchers modeled the effectiveness of different commu-
nication systems Using word of mouth as a constant three
communication methods were compared against those ini-
tial values In the following charts (Figures 6-10) two lines
are shown The darker line is the level of potential evacuees
(the initial population) and the level of evacuees (the
amount of people that successfully received the message)
Acting as constant word of mouth effectively distributed
information in approximately 22 minutes As a reminder
this is not an evacuation time but the communication mes-
sage time As seen in Figure 6 the halfway point for the
communication rate is much further than any other system
mdashmdashmdashmdashmdashmdashmdashmdashmdashmdashmdashmdashmdashmdashmdashmdashmdashmdashmdashmdashmdashmdashmdashmdashmdashmdashmdashmdashmdashmdashmdashmdashmdashmdashmdashmdashmdashmdashmdashmdashmdashmdashmdashmdashmdashmdashndashmdashmdashmdashmdash
ANALYZING RESPONSE COMMUNICATION MITIGATION METHODS THROUGH SIMULATION MODELING 9
mdashmdashmdashmdashmdashmdashmdashmdashmdashmdashmdashmdashmdashmdashmdashmdashmdashmdashmdashmdashmdashmdashmdashmdashmdashmdashmdashmdashmdashmdashmdashmdashmdashmdashmdashmdashmdashmdashmdashmdashmdashmdashmdashmdashmdashmdashndashmdashmdashmdashmdash
mdashmdashmdashmdashmdashmdashmdashmdashmdashmdashmdashmdashmdashmdashmdashmdashmdashmdashmdashmdashmdashmdashmdashmdashmdashmdashmdashmdashmdashmdashmdashmdashmdashmdashmdashmdashmdashmdashmdashmdashmdashmdashmdashmdashmdashmdashndashmdashmdashmdashmdash
10 INTERNATIONAL JOURNAL OF ENGINEERING RESEARCH AND INNOVATION | V11 N1 SPRINGSUMMER 2019
Figure 6 Word-of-mouth communication only
Comparatively in Figure 7 a text system in combination
with word-of-mouth communication is only slightly better
taking approximately 20 minutes to spread an evacuation
message The system in question acted similarly if a single
message was sent and spread amongst a stadiumrsquos fan ser-
vice list This would give a large event area the greatest
chance at reaching patrons without using social media It
should be noted that this parameter will need to be studied
further to establish proper manipulation and realistic bound-
aries
Figure 7 Text system only
However the systems that were more successful at issu-
ing the message were the public announcement systems In
Figure 8 the audible public announcement system took ap-
proximately 10 minutes to communicate an evacuation mes-
sage As previously noted these conditions were almost
ideal for the public announcement system but also assumed
consistent communication being relayed at reasonable inter-
vals This system is necessary but also ignores some special
populations In Figure 9 the visual system was overwhelm-
ingly the best at successfully displaying an evacuation mes-
sage The system took approximately eight minutes to effec-
tively communicate an evacuation message This includes
the timing and understanding delay incorporated into the
data Additionally the authors included an example of all of
the combined communication methods in Figure 10 This
model took approximately nine minutes to complete show-
ing how multiple communication methods may negatively
affect a message spread when factoring in additional error
rates The all-methods communication scenario also reflects
an inundated communication system in which a consistent
error message breeds inaccuracies and response times
Figure 8 PA system only
Figure 9 VisPA system only
Figure 10 All communication methods
Ultimately the knowledge obtained from the resulting
information will help improve and test emergency commu-
nication methods This can be seen in the pedestrian model
in Figure 11 The pedestrian traffic model shows that con-
tact with the message was more realistic than a systems
model The model shows that contact rate does influence
how quickly a message spreads and how word of mouth is
the greatest influencer for that message In this project
word-of-mouth communication was shown to improve com-
munications and introduce error into any communication
mdashmdashmdashmdashmdashmdashmdashmdashmdashmdashmdashmdashmdashmdashmdashmdashmdashmdashmdashmdashmdashmdashmdashmdashmdashmdashmdashmdashmdashmdashmdashmdashmdashmdashmdashmdashmdashmdashmdashmdashmdashmdashmdashmdashmdashmdashndashmdashmdashmdashmdash
system Therefore it is possibly the greatest asset or hin-
drance to response communication The pedestrian model
helps validate that theory while also allowing further test-
ing to occur Though not yet in use this pedestrian traffic
model has applicability to other communication methods
and provides a more realistic understanding of how commu-
nication would occur in an actual emergency as opposed to
a hypothetical one The model above shows how contact
rate affects method spread as the blue dots change to red
when the message is effectively spread
Figure 11 Pedestrian traffic model
Discussion
Though all the communication systems are shown differ-
ently exploring communication contact rate as a key to ef-
fectiveness will need to be considered in subsequent trials
For example text messaging systems have the potential to
be the most effective evacuation communication method as
it can reach most people and is still accessible to those with
disabilities and those not in the main area of the stadium
where the visual and audible public announcement systems
are used However there is a possible issue in that the num-
ber of patrons on their phones could overload the cellular
signal and the text message does not go through undoing all
of the benefits Additionally audible public announcements
are the next most effective evacuation communication meth-
od This method is also capable of reaching all patrons not
only those in the main areas However the consideration of
those with special needs should occur as this method does
hinder the deaf or hard of hearing Also audible public an-
nouncements need to be used cautiously as aggressively
loud and commanding announcements could increase panic
and induce anxiety Testing will follow to see how valid this
system is to an actual evacuation Finally visual public an-
nouncement systems are the least effective of all three meth-
ods but the best in terms of understanding This method can
only reach patrons in the main areas and those who can
read observe and understand what is announced It does
not take blind patrons into consideration However if the
visual public announcement is flashed on and off it could
draw more attention to the message Additionally more
information could be given via visual public announcement
systems information which could be more easily updated
Conclusions
Though examining the results appears to suggest that the
visual public announcement system was the most effective
model this was only in regards to one factor It only reaches
a certain number of patrons at one time Therefore all meth-
ods of communication should use three reliable systems to
issue an evacuation message However the message would
need to be uniform and accurate for this model to work
While it is not feasible for all three methods to be consist-
ently running at the same time each situation would require
a specific combination of the three This question will re-
quire more consistent testing to deduce the correct order and
should be used in combination with the pedestrian model to
achieve the most realistic results As testing continues this
same question will apply to the pedestrian model and con-
tact rate Additionally incorporating social media as a com-
munication method will be considered moving forward
However this method has more complex intricacies with
obsolescence of equipment being a distinct possibility
Notably many of these systems can be altered to ensure
that they perform more effectively than their standards
These differences may mean that one system is more effec-
tive than another at a certain venue event or scenario
These alterations continue to affect word-of-mouth commu-
nication thus all three methods should be considered in
addition to this method Word-of-mouth communication
continues to be the communication at the base of each meth-
od deciding effectiveness and understanding of evacuation
The faster a message is understood the better the outcome
of an evacuation By assisting individual security the venue
is better prepared for an emergency The faster they re-
spond the more lives saved Therefore communicating
proper responses to patrons is the difference between life
and death
mdashmdashmdashmdashmdashmdashmdashmdashmdashmdashmdashmdashmdashmdashmdashmdashmdashmdashmdashmdashmdashmdashmdashmdashmdashmdashmdashmdashmdashmdashmdashmdashmdashmdashmdashmdashmdashmdashmdashmdashmdashmdashmdashmdashmdashmdashndashmdashmdashmdashmdash
ANALYZING RESPONSE COMMUNICATION MITIGATION METHODS THROUGH SIMULATION MODELING 11
mdashmdashmdashmdashmdashmdashmdashmdashmdashmdashmdashmdashmdashmdashmdashmdashmdashmdashmdashmdashmdashmdashmdashmdashmdashmdashmdashmdashmdashmdashmdashmdashmdashmdashmdashmdashmdashmdashmdashmdashmdashmdashmdashmdashmdashmdashndashmdashmdashmdashmdash
mdashmdashmdashmdashmdashmdashmdashmdashmdashmdashmdashmdashmdashmdashmdashmdashmdashmdashmdashmdashmdashmdashmdashmdashmdashmdashmdashmdashmdashmdashmdashmdashmdashmdashmdashmdashmdashmdashmdashmdashmdashmdashmdashmdashmdashmdashndashmdashmdashmdashmdash
12 INTERNATIONAL JOURNAL OF ENGINEERING RESEARCH AND INNOVATION | V11 N1 SPRINGSUMMER 2019
References
Aldana N Fox C Diehl E amp Dimitoglou G (2014) A
study of stadium exit design on evacuation perfor-
mance Proceedings of the 27th International Confer-
ence on Computer Applications in Industry and Engi-
neering Cary NC International Society for Computers
and Their Applications
Alertus Technologies (2018) Mobile notification Re-
trieved from httpswwwalertuscompersonal
ATampT Stadium operations manual (2018) Retrieved from
httpsattstadiumcomsitesdefaultfilesdc-content-
filesCity20of20Arlington20Policiespdf
Bankers Life Fieldhouse (2018) Fan guide Retrieved from
httpwwwbankerslifefieldhousecomarena-
informationfan-guide
Broom G M Sha B L Seshadrinathan S Center A H
amp Cutlip S M (2013) Cutlip and Centerrsquos effective
public relations (11th ed) Upper Saddle River NJ
Pearson
Burke K (2016) 73 texting statistics that answer all your
questions Retrieved from httpswwwtextrequestcom
blogtexting-statistics-answer-questions
Centers for Disease Control and Prevention [CDC] (2018)
Emergency preparedness and response Social media
Retrieved from httpsemergencycdcgovsocialmedia
indexasp
Department of Homeland Security [DHS] (2008) Evacua-
tion planning guide for stadiums Retrieved from
httpswwwdhsgovsitesdefaultfilespublications
evacuation-planning-guide-stadiums-508pdf
Department of Homeland Security [DHS] (2014) Com-
municating in an emergency Federal Emergency Man-
agement Agency Retrieved from https
trainingfemagovemiwebisis242bstudent
20manualsm_03pdf
Ellis R Fantz A Karimi F amp McLoughlin E C
(2016) Orlando shooting 49 killed shooter pledged
ISIS allegiance CNN Retrieved from https
wwwcnncom20160612usorlando-nightclub-
shootingindexhtml
Mehrabian A (1971) Silent messages Belmont CA
Wadsworth
Mileti D S amp Sorensen J H (1990) Communication of
emergency public warnings A social science perspec-
tive and state-of-the-art assessment Washington DC
FEMA Retrieved from httpsdoi1021726137387
Norton J A amp Bass F M (1987) A diffusion theory
model of adoption and substitution for successive gen-
erations of high-technology products Management
Science 33(9) 1-19
Proulx G (1995) Evacuation time and movement in apart-
ment buildings Fire Safety Journal 24(3) 229-246
Retrieved from httpsdoiorg1010160379-7112(95)
00023-M
Towson University (2018) Emergencies Retrieved from
httpswwwtowsonedupublicsafetyemergencies
Biographies
KATHERINE REICHART is a graduate student in
Homeland Security in the Computer Information Technolo-
gy program at Purdue University Her previous degree is in
professional writing also from Purdue University Addi-
tionally she is a member of the Purdue Homeland Security
Institute She has been involved in several research projects
in the institute Additionally she is an assistant editor on
several books in progress concerning those research topics
Her research will continue to focus on communication and
reporting methods of large event security Katherine
Reichart may be reached at kreicharpurdueedu
ANNA LARSON works for General Electr ic in De-
troit MI She earned her BS in Computer Information Tech-
nology from Purdue University and MS in Computer and
Information Technology 2018 from her alma mater Her
interests include disaster network communication and
cyberforensics Anna Larson may be reached at lar-
sonapurdueedu
KRISTAL SMITH works for Blue Horseshoe in Boul-
der CO She recently graduated from Purdue University
with her BS in Computer and Information Technology
While there she researched and participated in projects re-
garding emergency preparedness Kristal Smith may be
reached at smit2265purdueedu
J ERIC DIETZ PE graduated in 1984 with a BS and
again in 1986 with an MS in chemical engineering both
from the Rose-Hulman Institute of Technology He earned
his PhD in chemical engineering in 1994 from Purdue Uni-
versity where he is now a professor In 2004 he retired as a
Lieutenant Colonel from the US Army Thus his research
interests include optimization of emergency response
homeland security and defense energy security and engag-
ing veterans in higher education Dr Dietz may be reached
at jedietzpurdueedu
Abstract
Various 3D printer configurations such as Cartesian
printers operate similarly to a CNC machining center and
Delta printers that have a stationary build platform with the
use of three motors located on pillars controlling the end
effector location A less popular configuration is a Polar
system which utilizes a rotating table a Z translation con-
trolled by a linear actuator located beyond the edge of the
rotating table and a horizontal arm connected to the Z-axis
that translates the end effector along the center axis The
Polar 3D printer configuration being the simplest was cho-
sen in order to scale up to build and test a low-cost large-
scale 3D printer with a build envelope of 183m x 183m x
153m (6ft x 6ft x 5ft)
This open source hardware 3D printer (OSALS-Polar) can
be produced for approximately $5000 for materials assum-
ing that labor is provided by the user To 3D print a part
any CAD software is used to output a stereo lithography
(stl) file open source slicing software (Cura) to generate
the G-code file and open source software (Franklin) to op-
erate the 3D printer Testing the 3D printer requires calibra-
tion of the three axes to produce the desired positioning of
the Theta-axis rotation R-axis horizontal arm translation
and Z-axis vertical translation with the inputs into the
Franklin software Also the system is set to start at a zero
location according to distances set from the end-stop limit
switches The final testing of the OSALS-Polar produced
small extruded parts although the accuracy and scaling up
to larger parts not accomplished during this study Future
testing may encounter limitations in the size of prints due to
material cooling at various rates causing warpage Introduc-
tion
3D printing technology has become quite common and
increasingly applications for direct digital manufacturing
are being implemented RepRap (self-replicating machines)
3D printers (Sells Bailard Smith Bowyer amp Olliver 2010
Gibb 2014) are open source 3D printer designs available
for anyone to build According to Wittbrodt et al (2013)
the cost of an open source 3D printer used for printing
household components such as a pierogi mold or paper
towel holder can be recuperated within a year or two if a
reasonably fair number of household items are printed using
the 3D printer (Wittbrodt et al 2013 Wittbrodt 2014) The
3D printer build envelope (printer platform times the print-
ing height capability) can be a limitation of direct digital
manufacturing if the part exceeds this build envelope
Common desktop 3D printers have a build envelope of
203 mm (8 in) length x 203 mm (8 in) and width x 153
mm (6 in) height Larger-scale 3D printers ranging from
5 to 10 times the size of the common desktop 3D printers
are typically very expensive to produce
Methods of joining 3D-printed parts via acetone have
been successful in producing parts such as wind turbine
blades (Deshpande Rao Pradhan amp Irwin 2016) although
this method requires several manufacturing steps and can
decrease overall part accuracy The goal of the OSALS-
Polar is to manufacture larger 3D-printed parts (such as
wind turbine blades or propeller blades) that can be printed
in a single setup without needing to be joined together
Wind turbine blades can operate at potentially high RPMs
and any structural concerns lead directly to safety concerns
making it advantageous to 3D print as one continuous part
To overcome size restrictions of desktop 3D printers the
OSALS-Polar can cost under $5000 for materials assuming
the user provides the labor In this paper the authors de-
scribe the assembly and testing of the OSALS-Polar with a
build envelope of 183m x 183m x 153m (6ft x 6ft x 5ft)
The build instructions for this system are also described
here The open source software used to create the slice file
was Cura to operate OSALS-Polar the open source soft-
ware Franklin was used
Introduction
Currently there are many different 3D printer configura-
tions such as the X Y Z Cartesian coordinate 3D printers
that operate similar to a CNC machining center or the Del-
ta which has a stationary build platform with the extruder
operated by three vertical axis translations located on a tri-
angular base A less popular method for controlling the
movement of the axes is a Polar system Figure 1 shows a
benchmark 3D printer produced by Polar3D and its main
components This particular 3D printer has a build envelope
of 203m m (8 in) diameter x 153 mm (6 in) height The
Polar 3D system was used as a datum design to develop the
initial 91 OSALS-Polar CAD design and a set of manufac-
turing drawings The Polar 3D system utilizes a rotating
table (Theta-axis) with a horizontal arm (R-axis) that trans-
mdashmdashmdashmdashmdashmdashmdashmdashmdashmdashmdashmdashmdashmdashmdashmdashmdashmdashmdashmdashmdashmdashmdashmdashmdashmdashmdashmdashmdashmdashmdashmdashmdashmdashmdashmdashmdashmdashmdashmdashmdashmdashmdashmdashmdashmdashndashmdashmdashmdashmdash
Sourabh Prashant Deshpande University of Cincinnati Shrinivas Kulkarni Michigan Technological University
Sid Shah Michigan Technological University John Irwin Michigan Technological University
DEVELOPING AN OPEN SOURCE INEXPENSIVE
LARGE-SCALE POLAR CONFIGURATION 3D PRINTER
mdashmdashmdashmdashmdashmdashmdashmdashmdashmdashmdashmdashmdashmdashmdashmdashmdashmdashmdashmdashmdashmdashmdashmdashmdashmdashmdashmdashmdashmdashmdashmdashmdashmdashmdashmdashmdashmdashmdashmdashmdashmdashmdashmdashmdashmdashmdashmdashmdashmdash
INTERNATIONAL JOURNAL OF ENGINEERING RESEARCH AND INNOVATION | V11 N1 SPRINGSUMMER 2019 13
mdashmdashmdashmdashmdashmdashmdashmdashmdashmdashmdashmdashmdashmdashmdashmdashmdashmdashmdashmdashmdashmdashmdashmdashmdashmdashmdashmdashmdashmdashmdashmdashmdashmdashmdashmdashmdashmdashmdashmdashmdashmdashmdashmdashmdashmdashndashmdashmdashmdashmdash
mdashmdashmdashmdashmdashmdashmdashmdashmdashmdashmdashmdashmdashmdashmdashmdashmdashmdashmdashmdashmdashmdashmdashmdashmdashmdashmdashmdashmdashmdashmdashmdashmdashmdashmdashmdashmdashmdashmdashmdashmdashmdashmdashmdashmdashmdashndashmdashmdashmdashmdash
14 INTERNATIONAL JOURNAL OF ENGINEERING RESEARCH AND INNOVATION | V11 N1 SPRINGSUMMER 2019
lates the extruder along a single axis to and from the center
of the printing surface The vertical (Z-axis) translation in
this system is controlled by a linear power screw and guides
located beyond the edge of the rotating surface This Polar
style 3D printer was determined to be the simplest design
when compared to the Cartesian and Delta styles to up-
scale
Figure 1 Polar3D printer (About 2014) Reprinted with
permission
Review of Related 3D Printing Systems
Rapid developments in the field of 3D printing technolo-
gy have ranged in applications from prototyping to direct
digital manufacturing Berman (2012) compares the revolu-
tion of 3D printing technology with the digital books revo-
lution and foresees its use in several promising applications
such as medicine and construction Gebler Uiterkamp amp
Visser (2014) discussed 3D printing technology in terms of
sustainability and asserted that this technology will lower
resource demands energy use and carbon dioxide emis-
sions over the entire lifecycle According to Wohlers
(2013) use of additive manufacturing technology for direct
part production has increased by more than 25 in the last
few years
Significant efforts are underway to build a large-scale 3D
printing system to manufacture large-scale industrial com-
ponents Barnett and Gosselin (2013) designed a novel large
-scale 3D printer with a cable-suspended mechanism and a
full scaffolding solution However most of the research on
large-scale 3D printers is based on Cartesian and Delta sys-
tem configurations A typical Polar 3D printing system has
a higher build volume with fewer components when com-
pared with other types (Yusuf 2015) A true Polar 3D print-
er has a rotating build plate (Theta-axis) with the vertical
arm (Z-axis) and the extruder placed on the horizontal arm
(R-axis) Any point on a flat plane can be defined by know-
ing its angle theta pole vertical location and a measure of
radius from an axis through the given pole (Horn amp Haus-
man 2017)
A Cincinnati-based Polar 3D technology company uses
fused-filament fabrication technology for a Polar 3D printer
having 2032 mm (8 in) diameter 15875 mm (625 in)
height with connectivity features such as Wi-Fi Ethernet
and USB (About 2014) R-360 is an open source Polar 3D
printer with 210 mm (826 in) disc x 200 mm (787 in)
with a total printing volume of 6927000 mm3 (42271 in3)
It uses PLA or ABS as the printing material and has a maxi-
mum printing speed of 150 mms along with features such
as cloud slicing (Replicator 2013 Farcas 2016) Another
Polar 3D printer with 3048 mm (12 in) diameter and
150 mm (59 in) height has some major features which
include the use of four extruders and Decapede electronics
for driving 10 stepper motors (Anderson 2014) The
PiMaker 3D printer also uses the Polar system with
2794 mm (11 in) diameter and 2032 mm (8 in) height
with an overall volume of over 10650000 mm3 (650 in3)
(Steele 2016) 3D printers have also been made on modest
budgets such as a senior project by Hoy (2016) who devel-
oped a Polar 3D printer having 1778 mm (7 in) diameter
that uses PLA filament
Polar 3D Printer Design
The OSALS-Polar is designed manufactured and assem-
bled by configuring the Theta-axis Z-axis and R-axis re-
spectively Engineering requirements are mapped using
QFD methodology The material for the table surface verti-
cal and horizontal supports and the rotation drive system
are selected using the decision matrix method Accordingly
the major items selected are a tubular steel structure circu-
lar glass printing plate circular steel plate table extruded
aluminum horizontal arm and stepper motors for axis mo-
tion PFMEA is carried out to identify and reduce the poten-
tial failures in the system The circular glass printing plate
has the highest RPN value for which the use of glass edge
guards is recommended to avoid breakage andor injury
The main frame is made up of steel I-beams and steel
tubular sections welded together to manufacture the table
frame Then pivot tabs welded to both the bottom frame
and table frame provide assembly alignment and leveling
capabilities The steel table has a center shaft that is placed
in the table frame center bearing after proper lubrication of
all the parts Figure 2 shows the assembly after fixing the
table roller bearings center bearing and the casters to the
frame
Vertical Z-axis
Horizontal R-axis
Table Theta-axis
mdashmdashmdashmdashmdashmdashmdashmdashmdashmdashmdashmdashmdashmdashmdashmdashmdashmdashmdashmdashmdashmdashmdashmdashmdashmdashmdashmdashmdashmdashmdashmdashmdashmdashmdashmdashmdashmdashmdashmdashmdashmdashmdashmdashmdashmdashndashmdashmdashmdashmdash
Figure 2 Frame assembly
The main power transmission component for the Theta-
axis rotating table is a stepper motor turning a spur gear
driving an internal ring gear The internal ring gear is manu-
factured by machining 10 segments that together form the
15875 mm (625 in) pitch diameter internal ring gear The
pinion gear is mounted to a NEMA 34-stepper motor that
drives the ring gear Despite several challenges introduced
in the system such as improper mating of the ring gear sec-
tions providing larger clearance holes on the ring gear seg-
ment enabled smoother motion The use of flexible pads in
stepper motor mounting also helped to minimize the inaccu-
racies in the gear alignment (Pradhan Irwin Siddegowda
amp Harsha 2016) The internal gear drive mechanism shown
in Figure 3 facilitates improved rotary motion of the table
over the originally designed center worm-gear configuration
that had many backlash issues
Figure 3 Theta-axis drive mechanism
Figure 4 shows how the vertical Z-axis beam is bolted
securely to the main frame which supports the horizontal
arm R-axis and the extruder The Z-axis mounting bracket is
used to attach the R-axis motor accommodate the acme nut
and also fix the R-axis horizontal arm in place The acme
rod is coupled to the Z-axis motor shaft with a straight cou-
pling with no gearing or reduction Two guide rails are de-
signed for the travel of the Z-axis FEA was carried out on
the system after which support brackets were added from
the guide rails to the vertical Z-axis beam accordingly in
order to avoid the deflection of the extruder through its trav-
el
Figure 4 Vertical Z-axis
The R-axis carriage wheels are locked into grooves on the
R-axis horizontal arm while a timing belt drive system
shown in Figure 5 controls the translating motion Figure 6
shows how the extruder extruder motor and hot end are
integrated into the carriage assembly The extruder hot end
bracket and spool holder were manufactured using 3D
printing
Figure 5 Drive system R-axis
Polar 3D Printer Controls
An electrical box houses the circuitry and auxiliary elec-
tronic components Figure 7 shows how the unit is fixed to
the back side of the vertical arm of the OSALS-Polar
Main Frame
Table Frame
Ring Gear Segment
Motor and Pinion Gear
Z-axis Mounting Bracket
R-axis
Guide Rails
Z-axis Vertical Beam
Timing Belt Drive System
mdashmdashmdashmdashmdashmdashmdashmdashmdashmdashmdashmdashmdashmdashmdashmdashmdashmdashmdashmdashmdashmdashmdashmdashmdashmdashmdashmdashmdashmdashmdashmdashmdashmdashmdashmdashmdashmdashmdashmdashmdashmdashmdashmdashmdashmdashndashmdashmdashmdashmdash
DEVELOPING AN OPEN SOURCE INEXPENSIVE LARGE-SCALE POLAR CONFIGURATION 3D PRINTER 15
mdashmdashmdashmdashmdashmdashmdashmdashmdashmdashmdashmdashmdashmdashmdashmdashmdashmdashmdashmdashmdashmdashmdashmdashmdashmdashmdashmdashmdashmdashmdashmdashmdashmdashmdashmdashmdashmdashmdashmdashmdashmdashmdashmdashmdashmdashndashmdashmdashmdashmdash
mdashmdashmdashmdashmdashmdashmdashmdashmdashmdashmdashmdashmdashmdashmdashmdashmdashmdashmdashmdashmdashmdashmdashmdashmdashmdashmdashmdashmdashmdashmdashmdashmdashmdashmdashmdashmdashmdashmdashmdashmdashmdashmdashmdashmdashmdashndashmdashmdashmdashmdash
16 INTERNATIONAL JOURNAL OF ENGINEERING RESEARCH AND INNOVATION | V11 N1 SPRINGSUMMER 2019
Figure 6 Carriage assembly R-axis
Figure 7 Electrical box layout
The circuitry includes RAMPS 14 controller and a Bea-
glebone connected with a bridge board All of the electrical
components were integrated into the RAMPS 14 controller
Figure 8 shows the wiring diagram for the RAMPS 14 To
adhere to the ldquoaffordablerdquo goal of the OSALS-Polar stepper
motors were used rather than servo motors to facilitate the
movement of the three axes The motion of the axes is ena-
bled by three DQ542MA micro-step drivers Each stepper
driver is controlled by Franklin firmware through a Pololu
A4988 stepper driver carrier mounted on the RAMPS 14
board The steps per revolution and the input current for
each axis motor were set using the DIP switches on the mi-
cro-step drivers The DIP switches were set with 1 3 6 and
8 in the ldquoonrdquo position and 2 4 5 and 7 in the ldquooffrdquo posi-
tion Switches 1 2 and 3 were set to the on off and on
positions respectively to match the motor current
(amperes) of 191 at peak and 136 RMS Switch 4 was set
to the off position so that standstill current would be half of
the selected dynamic current The Micro step resolution was
set to 6400 by setting switches 5 6 7 and 8 to the off on
off and on positions respectively
The RAMPS 14 also controls the extruder assembly
which consists of an extruder motor a hot end to melt the
filament a cooling fan to control the outer temperature of
the hot end and a thermistor to indicate the hot end temper-
ature Figure 8 shows the wiring diagram for RAMPS 14 A
Pololu A4988 stepper driver carrier was also used to control
the extruder motor however for this motor no micro-step
driver was needed The stepper drivers get power from a
36V power supply Power for the extruder motor fan and
the hot end are provided through the RAMPS 14 Since no
heated bed is used in this printer a 12V power supply is
connected to the heated bed port to externally power the
RAMPS 14 and direct that power to the extruder motor hot
end and fan
Figure 8 Ramps 14 wiring diagram
Figure 9 shows how mechanical end stops on each axis
allow the printer to start from a reference point End stops
can be mounted on the maximum or minimum position of
an axis Since the zero for this printer is set at the center of
the rotating table the end stops are located at the maximum
position for the R-axis and Z-axis Thus the end stops are
connected to the pins corresponding to the maximum posi-
tion on the RAMPS 14 board
Carriage Assembly
Circuitry
Stepper Drivers
Power Supply
mdashmdashmdashmdashmdashmdashmdashmdashmdashmdashmdashmdashmdashmdashmdashmdashmdashmdashmdashmdashmdashmdashmdashmdashmdashmdashmdashmdashmdashmdashmdashmdashmdashmdashmdashmdashmdashmdashmdashmdashmdashmdashmdashmdashmdashmdashndashmdashmdashmdashmdash
Figure 9 End stop mounting
The RAMPS 14 circuit board is connected to a Beagle-
bone loaded with the Franklin firmware The OSALS-Polar
can be operated by connecting to the Beaglebone using an
Ethernet cable from any host computer Figure 10 shows
how the Franklin software is accessed through a Web ad-
dress in order to pull up a user interface The printer config-
uration setup is completed on this user interface The vari-
ous attributes of the Franklin firmware are then mapped
with the pins on RAMPS 14 using the pin assignments
shown in Table 1
Figure 11 shows the flow of signals from Beaglebone to
the axis motors and the extruder assembly This figure also
shows a schematic diagram of the various components con-
trolled by the Franklin firmware
Z-axis
R-axis
Theta-axis
Axis Motors Extruder Assembly
R Axis Theta Axis Z Axis
X_STEP_PIN 54 Y_STEP_PIN 60 Z_STEP_PIN 46 E_STEP_PIN 26
X_DIR_PIN 55 Y_DIR_PIN 61 Z_DIR_PIN 48 E_DIR_PIN 28
X_ENABLE_PIN 38 Y_ENABLE_PIN 56 Z_ENABLE_PIN 62 E_ENABLE_PIN 24
X_MIN_PIN 3 Y_MIN_PIN 14 Z_MIN_PIN 18 FAN_PIN 9
X_MAX_PIN 2 Y_MAX_PIN 15 Z_MAX_PIN 19 HEATER_PIN 10
THERMISTOR 13
Table 1 Pin mapping
Figure 10 Franklin software settings
mdashmdashmdashmdashmdashmdashmdashmdashmdashmdashmdashmdashmdashmdashmdashmdashmdashmdashmdashmdashmdashmdashmdashmdashmdashmdashmdashmdashmdashmdashmdashmdashmdashmdashmdashmdashmdashmdashmdashmdashmdashmdashmdashmdashmdashmdashndashmdashmdashmdashmdash
DEVELOPING AN OPEN SOURCE INEXPENSIVE LARGE-SCALE POLAR CONFIGURATION 3D PRINTER 17
mdashmdashmdashmdashmdashmdashmdashmdashmdashmdashmdashmdashmdashmdashmdashmdashmdashmdashmdashmdashmdashmdashmdashmdashmdashmdashmdashmdashmdashmdashmdashmdashmdashmdashmdashmdashmdashmdashmdashmdashmdashmdashmdashmdashmdashmdashndashmdashmdashmdashmdash
mdashmdashmdashmdashmdashmdashmdashmdashmdashmdashmdashmdashmdashmdashmdashmdashmdashmdashmdashmdashmdashmdashmdashmdashmdashmdashmdashmdashmdashmdashmdashmdashmdashmdashmdashmdashmdashmdashmdashmdashmdashmdashmdashmdashmdashmdashndashmdashmdashmdashmdash
18 INTERNATIONAL JOURNAL OF ENGINEERING RESEARCH AND INNOVATION | V11 N1 SPRINGSUMMER 2019
Figure 11 Electrical component diagram
OSALS-Polar Operation Methods
3D printing is carried out by using CAD to output a stereo
lithography (stl) file slicing software (Cura) to generate the
G-code file and Franklin to operate the OSALS-Polar Sie-
mens PLM NX CAD software can be used to insert the for-
mulas and expressions for the parametric modeling intent
(Irwin 2013) and to export it in an stl file format The stl
file is loaded in Cura and prepared for 3D printing Some
overhang parts shallower than 45ordm may require the use of
support material (France 2013) The machine type in Cura
is set to Custom FDM printer with PLA material The poly-
mer filament used can be either polylactic acid (PLA) or
acrylonitrile butadiene styrene (ABS) converting it into a
physical object by depositing it in thin sequential layers
PLA is used in this printer rather than ABS because of its
lower melting temperature and superior adhesion to the
glass substrate The layer height shell thickness fill densi-
ty print speed retraction distance and print temperature are
some of the parameters that are set and calibrated as per the
print material and output quality requirements The slicing
software converts this stl file into consecutive thin layers to
generate G-code (Cano 2015) The commonly used open
source slicing software includes Cura and Slic3r Repetier
The Polar 3D company provides cloud services where the
CAD model can be converted to slices online and then
downloaded to run the code
Franklin is a Web-based 3D control system to regulate the
machining process parameters with any internet-connected
device The main function of this software shown in Figure
12 is to drive the hardware systems by integrating with the
slicer software program (Wijnen Anzalone Haselhuhn
Sanders amp Pearce 2016)
Figure 12 Franklin software
The software aims to be more powerful and user-friendly
by having improved robustness system reliability (error
checking) and a powerful scripted interface to smoothly run
the G-code specifically for the large-scale 3D printing and
sophisticated scientificmedical designs The main commu-
nication interfaces for this software include
1 Web socket connection to the browser or script client
(JSON array)
2 Franklin Server and Franklin Python driver (JSON
array)
3 Franklin Python driver and Franklin C driver (binary
packet)
4 Franklin C driver and Franklin interface (physical
serial line)
Calibrating the printer is important in order to ensure the
accuracy of positioning of the nozzle and distance traveled
along the respective axes Calibration includes choosing the
right amount of current and micro-stepping for the three
axes It is also important to calibrate the absolute zero posi-
tion for the three axes The dip switches on the motor driv-
ers are used to set the amount of current for each motor and
were set to half current for this system Micro-stepping is
decided based on the torque requirements and the necessary
motion accuracy The motor stepper drivers were set to 800
pulses per revolution for the Z-axis and 6400 pulses per
revolution for the Theta- and R-axes Micro-steps are also
set using the dip switches on the stepper motor drivers The
number of revolutions are calculated to enter Franklin soft-
ware based on the 200-step-per-revolution motors Equation
1 was used to calculate the new steps for the R- and Z-axes
(Pearce 2014) For the Theta-axis the distances are re-
placed with the desired and actual angles which can be cali-
brated by the same method
Beaglebone-
Franklin Firmware
RAMPS 14
Stepper Motor
Driver
Extruder
Assembly
Thermistor
Extruder Motor
Hot End
Axes Motors
(R Theta and Z) Cooling Fan
Franklin Software
Franklin Firmware
Handling low-level interface
(Temp control GPIO pins
Stepper motors control) and
communicating with serial
interface
Franklin Server
Web interface by handling
multiple devices
Franklin C Driver
Handling
functions written
in C++
Franklin Python
Driver
mdashmdashmdashmdashmdashmdashmdashmdashmdashmdashmdashmdashmdashmdashmdashmdashmdashmdashmdashmdashmdashmdashmdashmdashmdashmdashmdashmdashmdashmdashmdashmdashmdashmdashmdashmdashmdashmdashmdashmdashmdashmdashmdashmdashmdashmdashndashmdashmdashmdashmdash
Steps in firmware x Desired distance
Actual distance traveled during testing (1)
The Z-axis travel was calculated as 254 mmrev by con-
verting the 0100-inch pitch for the 1rdquo-10-threads-per-inch
acme screw to metric units Finally the Theta-axis travel
has 500 teeth on the internal ring gear and 24 teeth on the
pinion thus from Equation 2 the table rotates 1728 de-
grees per motor revolution
(2)
Finally Table 2 shows that the Franklin software requires
an entry for stepsmm or stepsdegree for each motor based
on the motor stepper driver pulses per revolution The num-
ber of micro-step pulses per revolution are divided by the
travel per revolution for each axis as given by Equation 3
Franklin Coupling setting (stepsmm) =
Micro stepsAxis travel (mmrev or degreesrev) (3)
To finely tune the OSALS-Polar Equation 4 was used to
calculate a calibrated number of steps for the R- and Z-axes
(Pierce 2014) For the Theta-axis the distances were re-
placed with the desired and actual angles which can be cali-
brated by the same method
Calibrated Franklin Coupling setting (stepsmm) =
Original stepsmm in Franklin x Desired distance (4)
Actual distance traveled during testing
Absolute zero was calibrated by first marking the center
on the rotating table Reference positions are set by homing
the machine using the Franklin interface The limit switch
positions in Franklin are changed to specify the distance
between reference points and absolute zero For the R-axis
a fixed end stop was placed on the horizontal arm bracket
and the switch position calibrated to 820 mm in Franklin
Similarly for setting the Z-axis switch position can be cali-
brated by using a paper gage (01 mm thickness) on at least
four equiangular points of the circular base Currently the
Z-axis switch position was set to 96 mm For the Theta-axis
the reference point used was zero The movement accuracy
for the Z- and R-axes were tested by using dial indicators to
validate that the software could manually jog the axis the
desired distances For the theta axis one complete revolu-
tion is measured when the axis is jogged 360ordm When the
OSALS-Polar is successfully calibrated it is ready to create
a 3D-printed part
Results of 3D Printing
By manually jogging the Z- and R-axes in the Franklin
interface measurements taken with a 12-inch travel dial
indicator length gage indicate precision from zero to 1 mm
For the Theta-axis a 360ordm rotation varies within 1ordm indicat-
ed by an alignment mark on the table and stationary frame
Causes for variations in travel of the R- and Theta-axes are
due to the timing belt and gear as well as the ring gear and
pinion interfaces Adjusting the Theta-axis motor too tightly
against the internal ring gear will cause the gear teeth to
bind and stop rotating So the looser fit in the mating of the
gear teeth causes some backlash The R-axis belt having a
9525 mm pitch yields a travel of 17145 mm per motor
revolution so a finer pitch belt will improve the R-axis pre-
cision The Z-axis accuracy is due to the tight connection of
the motor shaft to the acme screw eliminating backlash and
slippage
Figure 13 shows various geometries for testing the
OSALS-Polar which include a cylinder and cuboid Initial
test results for the 50x50x5 mm-high part were unsuccessful
in achieving accurate and smooth surface results The print-
ing time was estimated at 15 minutes which was approxi-
mately the time for the trial test Figures 14 and 15 show the
actual printed part and the top surface which is angled low-
er towards the center of the printing surface This result was
consistent with all sample test prints and was likely caused
by the R-axis planar misalignment with the Theta-axis table
surface The R-axis arm deflected slightly downward as the
extruder mechanism reached the end of its travel at the cen-
ter of the table The deflection of the R-axis arm caused the
extruder nozzle to drag over the surface of the part as the
Theta-axis rotated and the R-axis translated thereby form-
ing a buildup of plastic on the leading edge of the printed
path
te e th r in g g e a rT h e ta -a x is tr a v e l (d e g re e s re v ) = 3 6 0
te e th p in io n
Axis Steps Number of teeth Pitch type Pitch
(inches) Pitch per revolution Micro-steps Actual Steps
r 200 18 Linear 0375 17145 mmrev 6400 3732 mm
theta 200 Pinion 24
Circular - 1728 degreesrev 6400 37037degree Ring Gear 500
z 200 - Acme 01 254 mmrev 800 31496mm
Table 2 Step values set in Franklin
mdashmdashmdashmdashmdashmdashmdashmdashmdashmdashmdashmdashmdashmdashmdashmdashmdashmdashmdashmdashmdashmdashmdashmdashmdashmdashmdashmdashmdashmdashmdashmdashmdashmdashmdashmdashmdashmdashmdashmdashmdashmdashmdashmdashmdashmdashndashmdashmdashmdashmdash
DEVELOPING AN OPEN SOURCE INEXPENSIVE LARGE-SCALE POLAR CONFIGURATION 3D PRINTER 19
mdashmdashmdashmdashmdashmdashmdashmdashmdashmdashmdashmdashmdashmdashmdashmdashmdashmdashmdashmdashmdashmdashmdashmdashmdashmdashmdashmdashmdashmdashmdashmdashmdashmdashmdashmdashmdashmdashmdashmdashmdashmdashmdashmdashmdashmdashndashmdashmdashmdashmdash
mdashmdashmdashmdashmdashmdashmdashmdashmdashmdashmdashmdashmdashmdashmdashmdashmdashmdashmdashmdashmdashmdashmdashmdashmdashmdashmdashmdashmdashmdashmdashmdashmdashmdashmdashmdashmdashmdashmdashmdashmdashmdashmdashmdashmdashmdashndashmdashmdashmdashmdash
20 INTERNATIONAL JOURNAL OF ENGINEERING RESEARCH AND INNOVATION | V11 N1 SPRINGSUMMER 2019
Figure 13 Cura file 50x50x5mm high
Figure 14 Initial test part 50x50x5mm high
Figure 15 Part accuracy
The results of the 50x50x5 mm-high part were difficult to
measure with precise accuracy due to the uneven surface
Unwanted movement of the horizontal arm was reduced by
adding additional screws to secure the vertical axis guide
rods to the mounting rails which improved the stability of
the arm The PLA material spool was removed from the
R-axis extruder assembly to decrease possible deflection of
the arm but this did not significantly improve print quality
The Theta- and R-axes motors need to move simultaneously
for the extruder tool to move in a straight line using conver-
sions performed in the Franklin C driver which sends the
Franklin Firmware a list of numbers of steps to move in
either the positive or negative direction The firmware takes
this list and sends the steps to the motors The reason for the
inaccuracies in the 3D-printed part can be attributed to the
Theta- and R-axes not operating simultaneously at the same
speed The Franklin coupling settings (stepsmm) in Delta-
style 3D printers using the Franklin Firmware have had all
motors for the extruder tool movement set to the same
stepmm value
Using a larger diameter nozzle will alleviate some inaccu-
racies due to the large scale of the OSALS-Polar and re-
duce overall printing time Proper retraction and travel
speed settings in the Cura software will minimize the string-
ing and oozing issues in the part Some of the other issues
that arose during testing included hot-end jamming though
only when the nozzle was too close to the table Adjusting
the Z-axis motor switch settings during the calibration pro-
cess will correct this problem
Conclusions
The advantages of the OSALS-Polar 3D printer include a
large print volume but with a large mechanical device
there are disadvantages in the scaling-up of inaccuracies in
planar and perpendicularity of components The OSALS-
Polar can successfully operate in the R- and Z-axes with
precision with 1 mm accuracy and in the Theta-axis within
1ordm The Franklin software efficiently controls the tempera-
ture of the hot end at the desired 210ordm C within a range of
plusmn2ordm The Franklin software can operate the extruder motor
to feed the 3-mm-diameter PLA material through the hot
end nozzle at the desired rate The G-code generated from
Cura for a cylinder and cuboid test are not producing an
accurate result at this time but all three axes are operating
automatically when the G-code is initiated
The OSALS-Polar is deemed a partial success at this
point due to having accomplished most of the projectrsquos
goals This printer was relatively inexpensive to constructmdash
under $5000 for materials It operates using open source
Franklin software that is continuously being improved The
mdashmdashmdashmdashmdashmdashmdashmdashmdashmdashmdashmdashmdashmdashmdashmdashmdashmdashmdashmdashmdashmdashmdashmdashmdashmdashmdashmdashmdashmdashmdashmdashmdashmdashmdashmdashmdashmdashmdashmdashmdashmdashmdashmdashmdashmdashndashmdashmdashmdashmdash
final testing of the system produced small extruded parts
although the accuracy and scaling up to larger-sized parts
was not accomplished Further work is planned in order to
determine if the inaccuracies in the printed parts are due to
the non-planar R-axis and Theta-axis table The level of the
R-axis arm and the printing surface can be adjusted with
metal shims New conversions may be necessary by the
Franklin C driver to take into account the differences in the
stepsmm Franklin coupling settings for the Theta- and
R-axes motors In the future testing of larger parts may
encounter limitations in the size of prints due to material
cooling at various rates and causing warpage
Acknowledgements
Appreciation for troubleshooting of the Franklin software
for Gerald Anzalone research engineer Michigan Techno-
logical University Also assistance in testing data collec-
tion and troubleshooting of the OSALS-Polar from MS in
Mechanical Engineering students Sachin Rana and Divy
Patel is much appreciated
References
About Polar 3D LLC (2014) Retrieved from https
aboutPolar3dcomprinter
Anderson T (2014) Theta printer A 3D printer with 4
extruders that can move independently and simultane-
ously Retrieved from httpshackadayioproject812-
theta-printer
Barnett E amp Gosselin C (2015) Large-scale 3D printing
with a cable-suspended robot Additive Manufacturing
7 27-44
Berman B (2012) 3-D printing The new industrial revolu-
tion Business Horizons 55(2) 155-162
Cano L M (2015) 3D printing A powerful new curricu-
lum tool for your school library a powerful new cur-
riculum tool for your school library Goleta CA ABC-
CLIO
Deshpande S Rao N Pradhan N amp Irwin J L (2016
November) Hybrid polymer additive manufacturing of
a Darrieus type vertical axis wind turbine design to
improve power generation efficiency Proceedings of
the ASME 2016 International Mechanical Engineering
Congress and Exposition New York ASME
France A K (2013) Make 3D printing The essential
guide to 3D printers Sebastapol CA Maker Media
Inc
Farcas K (2016) R 360 Retrieved from httprepraporg
wikiR_360
Gebler M Uiterkamp A J S amp Visser C (2014) A
global sustainability perspective on 3D printing tech-
nologies Energy Policy 74 158-167
Gibb A (2014) Building open source hardware DIY man-
ufacturing for hackers and makers Carmel IN Pear-
son Education
Horne R amp Hausman K K (2017) 3D printing for dum-
mies New York John Wiley amp Sons
Hoy B (2016) Design and implementation of a three di-
mensional printer using a cylindrical printing process
Retrieved from httpsdigitalcommonscalpolyeducgi
viewcontentcgireferer=httpssearchyahoocom
amphttpsredir=1amparticle=1370ampcontext=eesp
Irwin J (2013) Wind turbine blade CAD models used as
scaffolding technique to teach design engineers Engi-
neering Design Graphics Journal 77(2) 1949-1967
Pearce J M (2014) MOST RepRap build Retrieved from
httpwwwappropediaorg
MOST_RepRap_BuildCalibration
Pradhan N K Irwin J L Siddegowda B R amp Harsha
S (2016) Design and fabrication of the power trans-
mission system of a large scale 3D printer Proceedings
of the Association of Technology Management and
Applied Engineering Conference New York ATMAE
Replicator Warehouse R-360 The most simple and modu-
lar 3D printer (2013) Retrieved from https
wwwkickstartercomprojects2132002936r-360-the-
most-simple-and-modular-3d-printer
Sells E Bailard S Smith Z Bowyer A amp Olliver V
(2010) RepRap the replicating rapid prototyper Max-
imizing customizability by breeding the means of pro-
duction In F T Pillar amp M M Tseng (Eds) Hand-
book of research in mass customization and personali-
zation (pp 568-580) River Edge NJ World Scientific
Steele W (2013) PiMaker 3D printer Retrieved from
httpswwwthingiversecomthing128700
Wijnen B Anzalone G C Haselhuhn A S Sanders P
G amp Pearce J M (2016) Free and open source con-
trol software for 3-D motion and processing Journal of
Open Research Software 4(1) Retrieved from http
dxdoiorg105334jors78 Wittbrodt B T (2014) Development of practical applica-
tions for RepRap style 3-D printers in engineering
(Unpublished doctoral dissertation) Michigan Techno-
logical University Houghton MI
Wittbrodt B T Glover A G Laureto J Anzalone G
C Oppliger D Irwin J L amp Pearce J M (2013)
Life-cycle economic analysis of distributed manufactur-
ing with open source 3-D printers Mechatronics 23(6)
713-726
Wohlers T (2013) Wohlers report 2013 Additive manu-
facturing and 3D printing state of the industrymdashAnnual
worldwide progress report Fort Collins CO Wohlers
Associates
Yusuf B (2015) 3D printers explained Delta Cartesian
Polar Scara Retrieved from httpsall3dpcomknow-
your-fdm-3d-printers-cartesian-delta-Polar-and-scara
mdashmdashmdashmdashmdashmdashmdashmdashmdashmdashmdashmdashmdashmdashmdashmdashmdashmdashmdashmdashmdashmdashmdashmdashmdashmdashmdashmdashmdashmdashmdashmdashmdashmdashmdashmdashmdashmdashmdashmdashmdashmdashmdashmdashmdashmdashndashmdashmdashmdashmdash
DEVELOPING AN OPEN SOURCE INEXPENSIVE LARGE-SCALE POLAR CONFIGURATION 3D PRINTER 21
mdashmdashmdashmdashmdashmdashmdashmdashmdashmdashmdashmdashmdashmdashmdashmdashmdashmdashmdashmdashmdashmdashmdashmdashmdashmdashmdashmdashmdashmdashmdashmdashmdashmdashmdashmdashmdashmdashmdashmdashmdashmdashmdashmdashmdashmdashndashmdashmdashmdashmdash
mdashmdashmdashmdashmdashmdashmdashmdashmdashmdashmdashmdashmdashmdashmdashmdashmdashmdashmdashmdashmdashmdashmdashmdashmdashmdashmdashmdashmdashmdashmdashmdashmdashmdashmdashmdashmdashmdashmdashmdashmdashmdashmdashmdashmdashmdashndashmdashmdashmdashmdash
22 INTERNATIONAL JOURNAL OF ENGINEERING RESEARCH AND INNOVATION | V11 N1 SPRINGSUMMER 2019
Biographies
SOURABH PRASHANT DESHPANDE is a PhD stu-
dent in the Mechanical Engineering Program at the Univer-
sity of Cincinnati with a focus on additive manufacturing
Mr Deshpande may be reached at sourabhdmtuedu
SHRINIVAS KULKARNI is an MS student in the
Mechanical Engineering Program at Michigan Technologi-
cal University with a focus on additive manufacturing Mr
Kulkarni may be reached at skulkar2mtuedu
SID SHAH is an MS student in the Mechanical Engi-
neering Program at Michigan Technological University
with a focus on additive manufacturing Mr Shah may be
reached at ssshah1mtuedu
JOHN IRWIN is a professor of mechanical engineer -
ing technology at Michigan Technological University He
earned his EdD in Curriculum and Instruction in 2005 from
Wayne State University Dr Irwinrsquos research interests in-
clude STEM education CADCAM and CAE residential
wind turbine design and additive manufacturing methods
Dr Irwin may be reached at jlirwinmtuedu
-plate collector was enclosed by double-glazing that admit-
ted solar radiation and minimized convection heat transfer
losses to the environment The shell of the collector was
insulated to reduce conduction losses This system likewise
utilized a coiled copper heat exchanger coil to transfer heat
from the working fluid to an insulated storage tank The
water flow through the receiver was obtained by means of
an off-the-shelf circulation pump As described subsequent-
ly this system was then fully instrumented to measure the
working fluid flow rate and temperatures as well as the
receiver and cover plate temperature in an effort to esti-
mate thermal losses The goal of the present study was to
assess whether a solar water heating system constructed
using relatively inexpensive scavenged components could
exhibit thermal efficiency equivalent to that of a more ex-
pensive vacuum tube solar collector system that is available
for sale
It has been demonstrated (ASHRAE 2015) through the
use of STCs that the combination of effective convection
suppression and selective surface absorption yields im-
proved thermal efficiency at high temperatures Like the
FPC STCs collect both direct and diffuse radiation How-
ever their efficiency is higher at low incidence angles
which gives STC an advantage over FPC in day-long per-
formance Depending on the solar insolation level of the
locality the authors found that working fluid outlet temper-
atures of 80degC to 200degC can be achieved (Made-in-China
nd) Fundamental studies of STC thermal performance
have been reported by Duffie and Beckman (1991) Budi-
hardjo and Morrison (2009) Rittidech and Wannapakne
(2007) and Ma Lu Zhang and Liang (2010) Kim and Seo
(2007) and Shah and Furbo (2004) employed evacuated
tube collectors made from a two-layered glass tube with
circular fins and a U-tube absorber Measured collector
efficiencies were 558 and 60 respectively
The study reported by Tripanagnostopoulos Souliotis
and Nousia (2000) using a flat-plate collector model
achieved a minimum outlet temperature of 50C and had a
collector efficiency of 80 Zelzouli Guizani Sebai and
Kerkeni (2012) concluded that the number of FPCs that can
Abstract
The world runs on the energy generated from the com-
bustion of non-renewable energy sources such as fossil
fuels (coal petrol and diesel) causing an increase in atmos-
pheric pollution Due to recent scientific discoveries the
use of renewable energy sources is made possible economi-
cal and environmentally friendly Specifically solar energy
has the greatest potential of all the worldrsquos renewable ener-
gy sources To absorb the sunrsquos radiation and convert it to
heat solar collectors are needed This preliminary experi-
mental study focused on comparing the thermal perfor-
mance of a commercially marketed solar water heating sys-
tem that featured an evacuated-tube solar collector (STC) to
that of a system that utilized a flat-plate collector (FPC)
constructed using an air conditioning radiator as the collec-
tor The STC system generally exhibited a 14 higher effi-
ciency than the FPC system The FPC system was relatively
inefficient in the absence of direct sunlight whereas the
STC system remained effective even without direct solar
irradiation
Introduction
This investigation experimentally compared the thermal
performance of two solar water-heating systems One sys-
tem employed a commercially available heat pipe evacuated
-tube solar collector (STC) The system utilized a pump to
transfer the heated waterglycol mixture from the receiver
to an insulated storage tank The tank had a built-in copper
heat exchanger coil to transfer heat from the working fluid
to the potable water in the tank thereby preventing the two
fluids from mixing The complete closed-loop system in-
cluded an expansion tank and a control unit containing the
circulation pump pressure gauge tempering valve pressure
relief valve and flow meter The other system considered in
this study used a repurposed air conditioner radiator as a
flat-plate collector (FPC) It consisted of an array of serpen-
tine tubes through which water was circulated The pres-
ence of high-density corrugated fins attached to the tubes
increased the absorption of incident solar radiation The flat
mdashmdashmdashmdashmdashmdashmdashmdashmdashmdashmdashmdashmdashmdashmdashmdashmdashmdashmdashmdashmdashmdashmdashmdashmdashmdashmdashmdashmdashmdashmdashmdashmdashmdashmdashmdashmdashmdashmdashmdashmdashmdashmdashmdashmdashmdashndashmdashmdashmdashmdash
SV Vishnu Samudrala Zimmer Biomet Ahmed ElSawy Tennessee Technological University
Mohan Rao Tennessee Technological University Stephen Idem Tennessee Technological University
A COMPARATIVE STUDY OF THE THERMAL
EFFICIENCY OF SOLAR VACUUM-TUBE VERSUS
FLAT-PLATE COLLECTORS FOR WATER
HEATING SYSTEMS
mdashmdashmdashmdashmdashmdashmdashmdashmdashmdashmdashmdashmdashmdashmdashmdashmdashmdashmdashmdashmdashmdashmdashmdashmdashmdashmdashmdashmdashmdashmdashmdashmdashmdashmdashmdashmdashmdashmdashmdashmdashmdashmdashmdashmdashmdashmdashmdashmdashmdash
INTERNATIONAL JOURNAL OF ENGINEERING RESEARCH AND INNOVATION | V11 N1 SPRINGSUMMER 2019 23
mdashmdashmdashmdashmdashmdashmdashmdashmdashmdashmdashmdashmdashmdashmdashmdashmdashmdashmdashmdashmdashmdashmdashmdashmdashmdashmdashmdashmdashmdashmdashmdashmdashmdashmdashmdashmdashmdashmdashmdashmdashmdashmdashmdashmdashmdashndashmdashmdashmdashmdash
mdashmdashmdashmdashmdashmdashmdashmdashmdashmdashmdashmdashmdashmdashmdashmdashmdashmdashmdashmdashmdashmdashmdashmdashmdashmdashmdashmdashmdashmdashmdashmdashmdashmdashmdashmdashmdashmdashmdashmdashmdashmdashmdashmdashmdashmdashndashmdashmdashmdashmdash
24 INTERNATIONAL JOURNAL OF ENGINEERING RESEARCH AND INNOVATION | V11 N1 SPRINGSUMMER 2019
be connected in series is limited When collectors are con-
nected in series the outlet temperature of each collector
will increase when compared to parallel or series-parallel
connected collectors and this leads to an increase in ther-
mal losses due to increased temperature differences
Jouhari Touhmeh and Moukhayber (2015) demonstrated
that by combining both flat-plate and evacuated-tube collec-
tors the thermal performance of the compound collector
was improved Ben Slama (2012) conducted experiments
on an integrated flat-plateevacuated-tube collector and
found that the efficiency of double glazing was 42
whereas with single glazing the efficiency was 30
Shukla Sumathy Erickson and Goung (2013) summarized
the current state-of-the-art concerning system components
of solar water heaters such as the collector storage tank
and heat exchanger and likewise discussed various ap-
proaches to improving performance and cost effectiveness
of solar water heaters The FPC is usually permanently
fixed in position and does not require any tracking of the
sun The collectors should be placed directly towards the
equator facing due south in the northern hemisphere The
ideal tilt angle of the collector is equal to the latitude of the
location with angle variations of 10-15degC depending on
the application According to the test results of Duffie and
Beckman (1991) they are capable of producing tempera-
tures up to 100degC above the ambient temperature FPCs are
the most common type of collectors used in solar water
heating systems in Africa supplying hot water in hotels
hospitals and to wealthier households (Karaekezi amp Ranga
1997)
Experimental Setup
The STC utilized in this current study was a commercial-
ly available Duda Energy (model SC5815) solar collector
(Duda nd) It consisted of 15 parallel transparent glass
tubes supported on a frame and connected to a header pipe
In each instance the evacuated tube outer diameter was
58 mm (228 in) and the overall length was 180m
(709 in) The tubes were evenly spaced on the frame such
that the overall footprint of the STC was 2050 mm 1145
mm (807 in 467 in) complete details are provided in
Duda (nd) and Samudrala (2016) The STC was mounted
on the roof of a building with a pitch of approximately 28
and was oriented due south Reflective insulation was
placed beneath the STC to minimize losses and to enhance
the solar energy incident on the backside of the tube array
The flexible steel pipes leading tofrom the STC were
wrapped with standard 6-mm-thick (025 in) foam insula-
tion Each individual collector tube consisted of two con-
centric glass tubes The annulus between the tubes was
evacuated to minimize convection heat loss to the environ-
ment The tubes were constructed using borosilicate or soda
lime glass which is resistant to high temperatures and has a
high transmittance for solar irradiation A flat or curved
aluminum or copper fin was attached to a metal heat pipe
running through the inner tube The inner glass tube and fin
was covered with a selective coating that maximizes ab-
sorption of solar energy
The hollow copper heat pipe within the tube contained a
small volume of a low-pressure alcoholwater liquid as
well as some additional additives to prevent corrosion or
oxidation This partial vacuum enabled the liquid to vapor-
ize at a prescribed temperature which is lower than would
be possible at atmospheric pressure When solar radiation
was incident on the surface of the heat pipe the liquid in the
heat pipe was vaporized due to the absorption of heat
Therein the increased vapor pressure drove the hot vapor to
the top portion of the heat pipe which consisted of a ldquohot
bulbrdquo inserted through a copper well located within a con-
necting manifold A waterglycol mixture flowed through
the manifold and heat was transferred to the working fluid
as it flowed past the hot bulb condensers in the manifold
As the hot vapor in the heat pipe lost energy it cooled and
subsequently condensed Then it flowed back down the heat
pipe through a wickporous mesh by a combination of grav-
ity and capillary action This cyclic process of alternating
evaporation and condensation of the liquid within the sealed
heat pipe continued as long as radiant energy was incident
upon the vacuum tubes Per Tripanagnostopoulos et al
(2000) a depiction of the STC closed-loop solar water heat-
ing system is provided in Figure 1
Figure 1 STC solar water heating system Printed with
permission
mdashmdashmdashmdashmdashmdashmdashmdashmdashmdashmdashmdashmdashmdashmdashmdashmdashmdashmdashmdashmdashmdashmdashmdashmdashmdashmdashmdashmdashmdashmdashmdashmdashmdashmdashmdashmdashmdashmdashmdashmdashmdashmdashmdashmdashmdashndashmdashmdashmdashmdash
The working station supplied with the STC system in-
cluded an integrated flow meter with a digital display Like-
wise the working station contained a flow controller and
pressure relief valve The water storage tank used in con-
junction with the STC system consisted of two concentric
tanks one larger and one smaller The annular gap between
the tanks was filled with mineral wool to reduce heat loss
Copper-constantan thermocouples were mounted at the inlet
and outlet of the STC header to record the waterglycol
temperatures The ambient temperature and solar insolation
data were downloaded directly from a local weather station
Further details regarding this aspect of the current study are
available in the study by Samudrala (2016)
The FPC considered in this current study (Chittireddy
2017 Chittireddy ElSawy amp Idem 2018) was fully instru-
mented to measure such variables as water flow rate and
temperature rise solar insolation and receiver and cover
plate temperatures Figure 2 shows a photograph of the ap-
paratus Throughout the experiments the flat-plate receiver
was positioned to face directly south and was inclined at an
angle so that solar insolation was directed normally onto the
apparatus This orientation was maintained throughout the
duration of the experiments Major components of the FPC
solar collector system considered in this study were
1 The receiver plate (a repurposed air conditioner radi-
ator)
2 A water storage tank
3 The casing for the collector and insulation on the
bottom to reduce heat loss
4 Two layers of glazing cover
5 A linear actuator to control the inclination of the col-
lector
6 A water-circulating pump
Figure 2 FPC solar water heating system Printed with
permission
Other components of the FPC system included calibrated
temperature sensors a water mass flow-rate sensor and a
data acquisition system An air conditioner radiator was
selected as the receiver plate The radiator coil consisted of
a single continuous serpentine tube configured in three rows
by means of headers Each row of the radiator had 22
straight finned-tube sections that were parallel to one anoth-
er and were arranged in a single plane The thickness of the
fins was 025 mm and there were 591 continuous plate fins
per meter The cross-sectional area of the receiver plate was
073m 056m The material of the tubes was copper and
the fins were constructed from aluminum These fins were
coated with black paint to increase solar heat absorptivity
Two acrylic sheets were employed as glazing for the FPC
Plexiglas was used because it has a transmittance closely
equivalent to optical glass The total light transmittance of
Plexiglas is 92 and the emissivity is 086 (Chittireddy
et al 2018) Radiation losses from the glass cover were
reduced since it is transparent to the short-wave radiation
emitted by the sun and is nearly opaque to long-wave ther-
mal radiation emitted by the absorber plate
In this experiment double parallel glazing was used
Each glazing had a thickness of 6 mm The distance be-
tween the two cover plates was 19 mm and distance be-
tween the absorber plate and the lower cover plate was
36 mm Eleven copper-constantan thermocouples were used
to measure the temperature at prescribed locations on the
receiver and cover plates as well as the inlet and water tem-
peratures Three thermocouples were mounted to the upper
cover plate three were attached to the lower cover plate
and three thermocouples were affixed to the receiver plate
and the resulting values were averaged Two thermocouples
were used to measure the inlet and outlet temperatures of
the receiver plate by inserting them directly into the 13-mm
-diameter steel pipes leading tofrom the copper pipes in the
radiator Prior to installation in the solar water heater each
temperature sensor was calibrated using a reference immer-
sion thermometer
Water flow was measured using a calibrated flow sensor
The flow sensor required a voltage input of 5-18VDC
(supplied by the data acquisition system) It was capable of
measuring flow rates from 1 to 30 Lmin over a temperature
range of -25ordmC to +80ordmC The water flow sensor was in-
stalled in a 15m-long pipe which was between the outlet of
the collector and the storage tank A sufficient length of
pipe was employed upstream of the flow sensor to ensure
that the entering flow was fully developed The casing re-
ceiver plate and water storage tank used with the FPC were
mounted on a moving trolley The data acquisition system
was placed on another moving trolley Each time an experi-
ment was performed the experimental setup mounted on
mdashmdashmdashmdashmdashmdashmdashmdashmdashmdashmdashmdashmdashmdashmdashmdashmdashmdashmdashmdashmdashmdashmdashmdashmdashmdashmdashmdashmdashmdashmdashmdashmdashmdashmdashmdashmdashmdashmdashmdashmdashmdashmdashmdashmdashmdashndashmdashmdashmdashmdash
A COMPARATIVE STUDY OF THE THERMAL EFFICIENCY OF SOLAR VACUUM-TUBE VERSUS FLAT-PLATE COLLECTORS 25
FOR WATER HEATING SYSTEMS
Actuator
Insulated water tank
Solar collector
mdashmdashmdashmdashmdashmdashmdashmdashmdashmdashmdashmdashmdashmdashmdashmdashmdashmdashmdashmdashmdashmdashmdashmdashmdashmdashmdashmdashmdashmdashmdashmdashmdashmdashmdashmdashmdashmdashmdashmdashmdashmdashmdashmdashmdashmdashndashmdashmdashmdashmdash
mdashmdashmdashmdashmdashmdashmdashmdashmdashmdashmdashmdashmdashmdashmdashmdashmdashmdashmdashmdashmdashmdashmdashmdashmdashmdashmdashmdashmdashmdashmdashmdashmdashmdashmdashmdashmdashmdashmdashmdashmdashmdashmdashmdashmdashmdashndashmdashmdashmdashmdash
26 INTERNATIONAL JOURNAL OF ENGINEERING RESEARCH AND INNOVATION | V11 N1 SPRINGSUMMER 2019
the trolleys was moved out into an open area to receive so-
lar radiation In every instance the solar water heater was
manually positioned facing south during the acquisition of
performance data Once the setup was initially positioned
the setup was not further adjusted (ie solar tracking was
not employed while measurements were being performed)
The casing was placed on horizontal bars capable of mov-
ing vertically The horizontal bar was connected to a
12VDC linear actuator to raise the casing vertically and to
align the receiverrsquos placement so that it was perpendicular
to the solar irradiation at the start of the experiments The
storage tank was placed under the casing and a 12VDC cir-
culating pump was connected to circulate the heat transfer
fluid through the solar collector
The solar thermal systems utilized solar collectors located
remotely from the storage tank Both systems used a pump
to circulate a waterpropylene glycol mixture between the
storage tank and the collector in a continuous loop and back
again to the storage tank In each instance a copper heat
exchanger coil located in the insulated storage tank was
used to transfer heat acquired by the collectors from work-
ing fluid to the potable water present in the tank without
mixing the fluids together In general this is advantageous
since the storage tanks can be placed indoors reducing heat
loss in winter months In addition backup heating systems
may be installed in the storage tanks to supply enough heat
to meet the demands of the user in case of cloudy or rainy
weather Furthermore this permits placing the tank close to
where the water will be used thereby reducing the time
needed for hot water to flow from the tap
Data Acquisition and Reduction
A Raspberry Pi system was used to connect all of the
temperature sensors for data acquisition The Raspberry Pi
is a low-cost credit card-sized computer that plugs into a
computer monitor or TV and uses a standard keyboard and
mouse A simple Python code was used to configure the
temperature sensors The data were collected and exported
to a csv file for further analysis An open source computer
hardware and software system was used to acquire the data
from each of the experimental setups The performance of a
solar water heater was characterized by how efficiently it
could convert the energy of incident solar energy to a corre-
sponding increase in the temperature of a circulating hot
waterglycol mixture The thermal efficiency of each collec-
tor considered in the present study was calculated using
Equation 1
(1)
where
ṁ = Mass flow rate in kgsec
Cp = Specific heat capacity in Jkg-K
Ac = Collector area in m2
Gt = Global solar radiation on the collector in Wm2
To = Collector outlet temperature in K
Ti = Collector inlet temperature in K
In this instance ṁ refers to the measured waterglycol
mass flow rate through the system and To and Ti are the
temperatures recorded at the collator inlet and outlet re-
spectively The quantity Gt is the measured solar radiation
incident upon the collectors as measured by the local
weather station Likewise AC denotes the effective cross
section of each collector and CP indicates the average
working fluid specific heat
Results
The testing of the STC and FPC solar water heating sys-
tems was performed under different ambient seasonal tem-
peratures Various weather conditionsmdashcloudy rainy and
sunnymdashwere encountered throughout the test program The
measurements were conducted approximately five hours a
day and were initiated around noon when the sun was at its
highest elevation The data were acquired every 13 seconds
throughout the test cycle Figure 3 illustrates the perfor-
mance of the STC system on different days subject to dis-
parate ambient temperatures and levels of solar insolation
in terms of the measured outlet waterglycol temperatures
At noon (peak incident solar radiation) the collector effi-
ciency calculated by means of Equation 1 for cold weather
conditions was 698 At that time the global solar radia-
tion was found to be 812 Wattm2 The useful energy col-
lected was 1136 kJday By comparison measurements
conducted later in the season under warm conditions yield-
ed a calculated collector efficiency at noon of 815 when
the measured global solar irradiation was found to be
842 Wattm2 The energy collected in the STC system was
determined to be 1401 kJday Under similar conditions of
ambient temperature and incident radiation intensity STC
systems exhibited approximately 14 higher efficiency
than the FPC system
Figure 4 shows a comparison of the thermal performance
of the STC and the FPC solar water heating systems consid-
ered in this study on the same day Both systems were
charged with a similar waterglycol mixture In this in-
stance the initial ambient temperature was 71F At the
start of the experiments the measured waterglycol temper-
ature stored in the insulated tank in the STC apparatus was
79F whereas the corresponding initial waterglycol tem-
perature for the FPC system was 98F At the end of experi-
p o i
c
c t
m C T T η
A G
mdashmdashmdashmdashmdashmdashmdashmdashmdashmdashmdashmdashmdashmdashmdashmdashmdashmdashmdashmdashmdashmdashmdashmdashmdashmdashmdashmdashmdashmdashmdashmdashmdashmdashmdashmdashmdashmdashmdashmdashmdashmdashmdashmdashmdashmdashndashmdashmdashmdashmdash
ment the solar vacuum tube collector waterglycol tempera-
ture reached 147F This temperature was similar to that of
the flat-plate collector both systems yielded the same outlet
temperature over the duration of the experiments but the
STC temperature rose to its final value more quickly Since
the ambient temperature was warm the collectors per-
formed similarly
Figure 3 STC performance comparison in cold and warm
weather
Figure 4 Daily performance comparison of STC and FPC solar
water heating systems in warm weather
Figure 5 provides an additional comparison of the STC
and FPC solar water heating systems At the start of the
experiments the ambient temperature was 86F In this
case the initial waterglycol temperature for the STC sys-
tem was also 86F However at the start of the measure-
ments the working fluid temperature in the FPC system
was 80F Upon the completion of the tests the final water
glycol temperature recorded leaving the STC system was
134F and the equivalent temperature for the FPC was
130F In this instance the STC system yielded a higher
final temperature but for both systems the rate of tempera-
ture increase was almost identical The calculated collector
efficiency of the STC system at noon was determined to be
887 when the incident solar radiation was 904 Wm2
That corresponded to a useful daily energy collection for
the STC system of 1636 kJday
Figure 5 Daily performance comparison of STC and FPC solar
water heating systems in hot weather
Conclusions
This preliminary study compared the thermal perfor-
mance of a commercially marketed solar water heating sys-
tem that featured an evacuated-tube solar collector to that of
a system that utilized a flat-plate collector constructed using
an air conditioning radiator as the collector Although an
extensive side-by-side comparison of the thermal efficiency
of the two systems proved to be impractical the STC sys-
tem generally exhibited a 14 higher efficiency than the
FPC system It should be pointed out that the water heater
systems considered in this study employed different water
glycol mixture flow rates and had unequal cross sections
Likewise the same inclination angle of each collector was
not consistent and each system utilized different storage
tanks that were not equally insulated Collectively these
differences between the two solar heating systems make it
difficult to definitively compare the two approaches in
terms of thermal efficiency
While flat-plate collectors are widely used in solar water
heating applications they are inefficient in the absence of
direct sunlight By comparison STC systems are relatively
more effective even without direct solar irradiation The
simple flat-plate collector considered in this study was as-
sembled using readily available spare components It was
designed to work in sunny and warm climates However
the benefit of using the FPC system was reduced when
there were cloudy rainy or windy weather conditions So-
lar water heating systems that employ evacuated-tube col-
mdashmdashmdashmdashmdashmdashmdashmdashmdashmdashmdashmdashmdashmdashmdashmdashmdashmdashmdashmdashmdashmdashmdashmdashmdashmdashmdashmdashmdashmdashmdashmdashmdashmdashmdashmdashmdashmdashmdashmdashmdashmdashmdashmdashmdashmdashndashmdashmdashmdashmdash
A COMPARATIVE STUDY OF THE THERMAL EFFICIENCY OF SOLAR VACUUM-TUBE VERSUS FLAT-PLATE COLLECTORS 27
FOR WATER HEATING SYSTEMS
mdashmdashmdashmdashmdashmdashmdashmdashmdashmdashmdashmdashmdashmdashmdashmdashmdashmdashmdashmdashmdashmdashmdashmdashmdashmdashmdashmdashmdashmdashmdashmdashmdashmdashmdashmdashmdashmdashmdashmdashmdashmdashmdashmdashmdashmdashndashmdashmdashmdashmdash
mdashmdashmdashmdashmdashmdashmdashmdashmdashmdashmdashmdashmdashmdashmdashmdashmdashmdashmdashmdashmdashmdashmdashmdashmdashmdashmdashmdashmdashmdashmdashmdashmdashmdashmdashmdashmdashmdashmdashmdashmdashmdashmdashmdashmdashmdashndashmdashmdashmdashmdash
28 INTERNATIONAL JOURNAL OF ENGINEERING RESEARCH AND INNOVATION | V11 N1 SPRINGSUMMER 2019
lectors similar to those employed in the present study may
be more energy efficient than the flat-plate collectors due
to their unique construction Since the concentric coated-
glass tubes are vacuum-sealed heat loss associated with
convection heat transfer is reduced to a great extent Alt-
hough the STC system was deemed more thermally effi-
cient it was far more expensive than the FPC system How-
ever a detailed analysis of the relative initial and annual
operating costs of the two systems was beyond the scope of
the present study
References
ASHRAE (2015) Handbook HVAC applications Atlanta
ASHRAE
Ben Slama R (2012) Experimentation of a plane solar
integrated collector storage water heater Energy and
Power Engineering 4(2) 67-76
Budihardjo I amp Morrison G L (2009) Performance of
water-in-glass evacuated tube solar water heaters
Solar Energy 83(1) 49-56
Chittireddy V R (2017) A study of flat plate solar
collector with air conditioner radiator as absorber
plate (Masterrsquos thesis) Retrieved from ProQuest
Dissertations and Theses Database (UMI No
10246377)
Chittireddy V R ElSawy A amp Idem S (2018) Study of
a flat plate solar collector with an air conditioner
radiator as a heat absorber for a domestic water
heater Paper presented at the International Conference
on Renewable Energies and Power Quality doi https
doiorg1024084repqj16205
Duda diesel (nd) Retrieved from https
wwwdudadieselcom
Duffie J A amp Beckman W A (1991) Solar engineering
of thermal processes 2nd ed New York Wiley-
Interscience
Jouhari M Touhmeh S amp Moukhayber N (2015)
Manufacturing and thermal performance test of
(compound) solar collector in Damascus City Journal
of Biomedical Science and Engineering 8(6) 370-379
Karaekezi S amp Ranga T (1997) Renewable energy
technologies in Africa London Zed Book Ltd
Kim Y amp Seo T (2007) Thermal performances
comparisons of the glass solar vacuum tube solar
collectors with shapes of absorber tube Renewable
Energy 32(5) 772-795
Ma L Lu Z Zhang J amp Liang R (2010) Thermal
performance analysis of the glass Solar Vacuum tube
collector with U-tube Building and Environment 45
(9) 1959-1967
Made-in-China (nd) Retrieved from httpswwwmade-in
-chinacom
Rittidech S amp Wannapakne S (2007) Experimental
study of the performance of a solar collector by closed-
end oscillating heat pipe (CEoHP) Applied Thermal
Engineering 27 1978-1985
Samudrala S V Vishnu (2016) A comparative study on
the thermal efficiency of solar vacuum-tube vs flat-
plate collectors for water heating systems (Masterrsquos
thesis) Retrieved from ProQuest Dissertations and
Theses Database (UMI No 10243376)
Shah L J amp Furbo S (2004) Vertical evacuated tubular-
collectors utilizing solar radiation from all directions
Applied Energy 78(4) 371-395
Shukla R Sumathy K Erickson P amp Goung J (2013)
Recent advances in the solar water heating systems A
review Renewable and Sustainable Energy Reviews
19 173-190
Tripanagnostopoulos Y Souliotis M amp Nousia T
(2000) Solar collectors with colored absorbers Solar
Energy 68(4) 343-356
Zelzouli K Guizani A Sebai R amp Kerkeni C (2012)
Solar thermal systems performances versus flat plate
solar collectors connected in series Engineering 4(12)
881-893
Biographies
VENKAT VISHNU DEEPAK SAMUDRALA is a
manufacturing engineer at Zimmer Biomet and holds an
MS degree from Tennessee Technological University
(2016) in mechanical engineering He was born in Hydera-
bad India and holds a BS degree from SCSVMV Universi-
ty India (2010) in mechanical engineering While pursuing
his BS degree he developed a profound interest in energy
systems which inspired him to work on solar water heating
systems as his masterrsquos thesis Currently he lives in Mem-
phis Tennessee and is working on a continuous improve-
ment project focused on reducing product manufacturing
time Mr Samudrala may be reached at
ssamudral42studentstntechedu
AHMED ELSAWY joined Tennessee Technological
University as a professor and chairperson in the Department
of Manufacturing and Engineering Technology in July
1999 Prior to joining TTU he was a professor and graduate
program coordinator in the Department of Industrial Tech-
nology at the University of Northern Iowa the founding
director of the Manufacturing Engineering Program at St
Cloud State University in Minnesota and a full professor at
the Department of Mechanical Design and Production Engi-
neering at Cairo University His teaching and research inter-
ests include material processing metallurgy and manufac-
turing systems recycling and reuse of solid waste materials
renewable energy and sustainability Dr Elsawy advised
mdashmdashmdashmdashmdashmdashmdashmdashmdashmdashmdashmdashmdashmdashmdashmdashmdashmdashmdashmdashmdashmdashmdashmdashmdashmdashmdashmdashmdashmdashmdashmdashmdashmdashmdashmdashmdashmdashmdashmdashmdashmdashmdashmdashmdashmdashndashmdashmdashmdashmdash
several masterrsquos and doctoral students who hold academic
and industrial positions in the USA Germany and Taiwan
Dr Elsawy may be reached at aelsawytntechedu
MOHAN D RAO is a professor and chair of Mechan-
ical Engineering at Tennessee Technological University
Previously he was a professor of Mechanical Engineering
at Michigan Tech Dr Rao is a fellow of ASME and SAE
He has conducted research in different areas of automotive
body and powertrain dynamics acoustics and vibration
over a span of 30 years He has over 100 publications in
technical journals and conference proceedings He has ad-
vised 9 PhD and 35 MS students Dr Rao has received a
US Fulbright award National Science Foundation Research
Initiation award and was honored by the NASA Marshall
Space Flight Center for his work on the damping of the
Hubble Space Telescope truss system Dr Rao may be
reached at mraotntechedu
STEPHEN IDEM is a professor in the Depar tment of
Mechanical Engineering at Tennessee Tech University He
received his PhD in mechanical engineering from Purdue
University He has more than 30 years of experience in the
areas of scale model testing fluid flow measurement and
thermal modeling Currently he is engaged in projects to
measure airflow and pressure loss characteristics of residen-
tial HVAC duct systems He has created a numerical model
of downdraft evaporative cooling tower performance which
is being verified experimentally He has extensive experi-
ence performing flow and pressure measurements on scale
models of primary and secondary air supply ducts wind
boxes and exhaust stacks of coal-fired power plants to im-
prove their thermal performance He has developed an
online cleanliness factor model of the convection passes in
coal-fired power plants He has likewise created numerical
models of transient heat exchanger performance Dr Idem
may be reached at sidemtntechedu
mdashmdashmdashmdashmdashmdashmdashmdashmdashmdashmdashmdashmdashmdashmdashmdashmdashmdashmdashmdashmdashmdashmdashmdashmdashmdashmdashmdashmdashmdashmdashmdashmdashmdashmdashmdashmdashmdashmdashmdashmdashmdashmdashmdashmdashmdashndashmdashmdashmdashmdash
A COMPARATIVE STUDY OF THE THERMAL EFFICIENCY OF SOLAR VACUUM-TUBE VERSUS FLAT-PLATE COLLECTORS 29
FOR WATER HEATING SYSTEMS
ra 1992) dimension reduction and noise removal
(Sheybani 2011) and senior design (Garcia-Otero amp Shey-
bani 2011)
RF engineers specialize in creating various devices that
operate within the radio frequency spectrum Some of the
devices they work with include antennas radios WiFi and
mobile phones In this current study the RF engineer was in
the process of developing an antenna for a NASA project
called EcoSAR a radar tool designed to help scientists bet-
ter understand the carbon cycle by measuring biomass for-
est height density and extent This project was designed to
help him by creating a GUI that could import analyze and
export data
Technical Details
A GUI is a type of computer-human interface on a com-
puter It solves the blank screen problem that confronted
early computer users (Norman 1988) A computer-human
interface is a ldquomeans by which people and computers com-
municate with each otherrdquo (Interface 2019) GUI binds the
user of the computer system to the operation and potential
of the computer system More specifically a GUI is a speci-
fication for the look and feel of the computer sys-
tem (Bonsiepe 1989) GUIs usually have common charac-
teristics such as windows icons menus and pushbuttons
(WIMP) Collectively WIMPs are pictures that bring forth
a certain action or action space The user issues commands
via the GUI to computer applications GUIs usually have
three major components (Hayes amp Baran 1989) a window-
ing system an imaging model and an application program
interface (API) The windowing system builds the windows
menus and dialog boxes that appear on the screen The im-
aging model defines the fonts and graphics that appear on
the screen WIMPs are products of both the windowing sys-
tem and imaging model Finally the API is the means by
which the user specifies how and what windows and
graphics appear on the screen
The proposed GUI consists of the following platforms
data input selection menu scientific computation and re-
sults display The scientific computations include file type
conversion S-parameter polar-rectangular conversion
Smith chart and graphsplots The GUI was designed in
MATLAB and as a result MATLAB libraries were used
for parts of the design and development of the GUI
Abstract
In this paper the authors describe the requirements and
features necessary to develop a GUI for RF airborne space-
craft and satellite communications The proposed GUI is
responsive to the variety of devices and tools an RF engi-
neer would need to accomplish everyday tasks This in-
cludes but is not limited to Smith charts polar plots Bode
diagrams and different types of data files associated with
these graphs or charts The GUI was designed and devel-
oped in MATLAB with Adobe Photoshop used to create a
custom background The user interface was fully tested and
validated for functionality and ability to import plot and
export data for Smith charts polar plots and Bode dia-
grams The GUI also has a toolbar file browser with picture
display custom background and a static textbox that dis-
plays the plotted data
Introduction
Following are the details of the steps that were taken in
order to apply signal processing and data analytics algo-
rithms in the design of a graphical user interface (GUI) for
satellite and RF communications Users may follow these
steps with the specified set of hardware and software to get
the same configuration on the proper RF communications
and device design These projects were implemented under
the supervision of NASA scientists and faculty advisors in
dedicated NASA labs Using lessons learned in this study
and the authorsrsquo previous experience in data visualization
and signal processing research and training relevant labs
were designed to enhance the Computer Engineering pro-
gram at the Virginia State University (VSU) The classes
and labs covered a variety of topics including computer
simulations and networking (Javidi amp Sheybani 2008)
(Sheybani amp Javidi 2007) visualization and virtual labs
(Sheybani amp Javidi 2006) image processing (Sheybani
Garcia-Otero Adnani amp Javidi 2012) game design
(Ouyang Yang Franklin Michaelson Morge et al 2010)
STEM education (Javidi amp Sheybani 2008) (Javidi amp
Sheybani 2010) spike removal (Sheybani Mengshoel amp
Poll 2010) feature detection (Varde Rundensteiner Javidi
Sheybani amp Liang 2007) wireless communications (Hardy
Javidi Denton Campbell amp Sheybani 2007) (Badombena-
Wanta amp Sheybani 2010) network architecture (Sheybani
amp Sankar 2002) optical communications (Sheybani amp Aro-
mdashmdashmdashmdashmdashmdashmdashmdashmdashmdashmdashmdashmdashmdashmdashmdashmdashmdashmdashmdashmdashmdashmdashmdashmdashmdashmdashmdashmdashmdashmdashmdashmdashmdashmdashmdashmdashmdashmdashmdashmdashmdashmdashmdashmdashmdashndashmdashmdashmdashmdash Ehsan Sheybani University of South Florida Giti Javidi University of South Florida
DESIGN AND DEVELOPMENT OF A GUI
FOR RF COMMUNICATIONS
mdashmdashmdashmdashmdashmdashmdashmdashmdashmdashmdashmdashmdashmdashmdashmdashmdashmdashmdashmdashmdashmdashmdashmdashmdashmdashmdashmdashmdashmdashmdashmdashmdashmdashmdashmdashmdashmdashmdashmdashmdashmdashmdashmdashmdashmdashndashmdashmdashmdashmdash
30 INTERNATIONAL JOURNAL OF ENGINEERING RESEARCH AND INNOVATION | V11 N1 SPRINGSUMMER 2019
mdashmdashmdashmdashmdashmdashmdashmdashmdashmdashmdashmdashmdashmdashmdashmdashmdashmdashmdashmdashmdashmdashmdashmdashmdashmdashmdashmdashmdashmdashmdashmdashmdashmdashmdashmdashmdashmdashmdashmdashmdashmdashmdashmdashmdashmdashndashmdashmdashmdashmdash
The GUI is capable of importing three main data types
(CSV) (DAT) and (SNP) files CSV stands for a ldquocomma
separated valuerdquo This is a plain text file that separates each
form of data with a comma Figure 1 shows how CSV files
can be written in either Notepad or Excel and when used
properly they can import and export data from Excel to
MATLAB and vice versa
Figure 1 A CSV file written in Notepad
DAT files are primarily associated with ldquodatardquo They can
be used to store various types of data such as text graphics
attachments in emails and general binary code In most
instances it is best to open a DAT file with the program that
created it Users can also open a DAT file with an editor
such as Notepad to view the contents inside However it is
not guaranteed that all of the contents of the file will be
readable when using an editor to open it SNP files which
are also known as touchtone files have five different file
types (S1P) (S2P) (S3P) (S4P) and (SNP) The differ-
ences between these file types are the number of ports pre-
sent (see Table 1)
Table 1 The number of ports and S-parameters associated with
each file type
The ldquoSrdquo in S-parameters stands for scattering Figure 2
shows examples of how S-parameters come in matrices with
the number of rows and columns equal to the number of
ports These S-matrices allow users to describe complicated
networks as ldquoblack boxesrdquo (Zhou amp Chen 2008)
S-parameters are considered complex because both phase
and magnitude change the network However most micro-
wave and RF engineers are only concerned with the magni-
tude These engineers use S-parameters to refer to the RF
ldquovoltage out vs voltage inrdquo
Figure 2 S-parameter matrices
(S11) Refers to the reflection on port 1 as an inci-
dence of port 1
(S12) Refers to the reflection on port 1 as an inci-
dence of port 2
(S22) Refers to the reflection on port 2 as an inci-
dence of port 2
(S21) Refers to the reflection on port 2 as an inci-
dence of port 1
Since three-port measurements are extremely difficult to
obtain accurately the authors chose to focus only on one-
and two-port systems However the aforementioned meth-
odology would continue for all of the S-parameters present
These data formats are all associated with specific graphs
Figure 3 shows that the first graph the Bode diagram con-
sists of both phase and magnitude plots The magnitude plot
expresses the magnitude of the frequency response gain
either linearly or in decibels The phase plot expresses the
frequency response phase shift in either degrees or radians
(Zhou amp Chen 2008)
Figure 3 A Bode diagram
mdashmdashmdashmdashmdashmdashmdashmdashmdashmdashmdashmdashmdashmdashmdashmdashmdashmdashmdashmdashmdashmdashmdashmdashmdashmdashmdashmdashmdashmdashmdashmdashmdashmdashmdashmdashmdashmdashmdashmdashmdashmdashmdashmdashmdashmdashndashmdashmdashmdashmdash
DESIGN AND DEVELOPMENT OF A GUI FOR RF COMMUNICATIONS 31
File type Number of ports Number of
S-parameters saved
s1p 1 1
s2p 2 4
s3p 3 9
s4p 4 16
sNp N N2
1 1 o n e -p o r tS
1 1 1 2
2 1 2 2
tw o -p o r tS S
S S
1 1 1 2 1 3
2 1 2 2 2 3
3 1 3 2 3 3
th re e -p o r t
S S S
S S S
S S S
mdashmdashmdashmdashmdashmdashmdashmdashmdashmdashmdashmdashmdashmdashmdashmdashmdashmdashmdashmdashmdashmdashmdashmdashmdashmdashmdashmdashmdashmdashmdashmdashmdashmdashmdashmdashmdashmdashmdashmdashmdashmdashmdashmdashmdashmdashndashmdashmdashmdashmdash
mdashmdashmdashmdashmdashmdashmdashmdashmdashmdashmdashmdashmdashmdashmdashmdashmdashmdashmdashmdashmdashmdashmdashmdashmdashmdashmdashmdashmdashmdashmdashmdashmdashmdashmdashmdashmdashmdashmdashmdashmdashmdashmdashmdashmdashmdashndashmdashmdashmdashmdash
32 INTERNATIONAL JOURNAL OF ENGINEERING RESEARCH AND INNOVATION | V11 N1 SPRINGSUMMER 2019
Figure 4 shows the next graph a polar plot This is a two-
dimensional system that plots polar coordinates in a Carte-
sian plane and then draws the polar grid on the plane These
plots sometimes display the voltage reflection coefficient
This plays an important role in helping microwave engi-
neers with impendence matching Polar plots are also simi-
lar to X amp Y plots However instead of plotting data at
X versus Y they plot ldquoRrdquo (magnitude) at an angle between
0 and 360 degrees
Figure 4 A polar plot
Figure 5 shows the last graph a Smith chart The capabil-
ities of this chart are limitless and it is standard in micro-
wave engineering The Smith chart is a plot of complex
reflection overlaid with impendence andor admittance grids
referenced to a 1-ohm characteristic impendence Smith
charts help assist RF engineers in many ways but some of
the most notable tasks include impendence matching dis-
playing antenna impendence and visualizing the impend-
ence of a transmission line There are two types of Smith
charts the classic chart displays only positive real impend-
ences while the more modern chart displays imaginary im-
pendences from negative infinity to positive infinity (Gawa
2006)
Methods and Procedures
To create this GUI MATLAB was used to program
develop the GUI and Adobe Photoshop was used to create
the custom background The hardest part of the project was
writing the code to make the GUI accomplish various tasks
When complications were encountered the authors used
various problem-solving methods The ldquohelprdquo and ldquodocrdquo
functions in MATLAB and MATLAB online forums were
used extensively General steps to implementing this project
were as follows
1 Researching data types and graphs
2 Brainstorming what the end result should look like
3 Creating flow charts
4 Developing program code
5 Ensuring the GUI could accomplish the assigned
tasks
6 Creating a custom background
7 Adding extras (static text display toolbar file brows-
er etc)
8 Cleaning up code for efficiency
9 Finishing poster and final paper
Figure 5 A Smith chart
Results and Discussion
Figure 6 shows the completed GUI One attractive feature
is the backgroundlayout This custom background was cre-
ated in Photoshop and saved as a JPG and then placed on a
panel in MATLAB The background of the GUI needed a
visual appeal or style to it The panels helped increase the
overall intuitiveness of the design This was because it gave
everything its own special area as opposed to the thin and
basic borders MATLAB had to offer The input function
was placed in the toolbar of the GUI From there one can
select and import files located within the file directory The
GUI was programmed to automatically plot the Smith chart
polar plot and Bode diagram when certain data were im-
ported allowing the user to import any file type and still
plot it correctly In addition to these features the input al-
lows the user to import M-files as well Figure 7 shows how
to access the import feature using the path File Open
(Select Data) Open
mdashmdashmdashmdashmdashmdashmdashmdashmdashmdashmdashmdashmdashmdashmdashmdashmdashmdashmdashmdashmdashmdashmdashmdashmdashmdashmdashmdashmdashmdashmdashmdashmdashmdashmdashmdashmdashmdashmdashmdashmdashmdashmdashmdashmdashmdashndashmdashmdashmdashmdash
Figure 6 The completed GUI
Figure 7 GUI file menu
Another feature added to the GUI was the ability to graph
multiple plots By using this feature two sets of data could
be displayed on one plot simultaneously Figure 8 shows
how this can be highly effective in helping RF engineers
compare results
Figure 8 Multiple sets of data plotted on one Smith chart
An export button was also created that allows the user to
export data anywhere within the file directory However
instead of an ldquoopenrdquo button the user would see a ldquosaverdquo
option To access the import feature File Save (Name
amp Location) Save
The Bode diagram section is located in the large rectangu-
lar area of the GUI Here the user can select the number of
options and change how to view the imported data The first
option the user can manipulate is the Y-axis for the magni-
tude and phase plots Under the magnitude option the user
can choose from either linear or log (dB) and under the
phase option the user can choose degrees or radians The
second option to choose is the real and imaginary axis of the
Bode diagram Figure 9 shows how this option allows users
to select the axis most practical for their research
(a) The real axis
(b) The imaginary axis Figure 9 The axes
The interface has checkboxes to allow users to select
which color they would like their graph or specific
S-parameters to appear in This allows users to more easily
distinguish different sets of data In addition to adding color
checkboxes checkboxes to select between solid and dotted
lines were added This also helps users distinguish between
different sets of data To graph random data the ldquoBoderdquo
mdashmdashmdashmdashmdashmdashmdashmdashmdashmdashmdashmdashmdashmdashmdashmdashmdashmdashmdashmdashmdashmdashmdashmdashmdashmdashmdashmdashmdashmdashmdashmdashmdashmdashmdashmdashmdashmdashmdashmdashmdashmdashmdashmdashmdashmdashndashmdashmdashmdashmdash
DESIGN AND DEVELOPMENT OF A GUI FOR RF COMMUNICATIONS 33
mdashmdashmdashmdashmdashmdashmdashmdashmdashmdashmdashmdashmdashmdashmdashmdashmdashmdashmdashmdashmdashmdashmdashmdashmdashmdashmdashmdashmdashmdashmdashmdashmdashmdashmdashmdashmdashmdashmdashmdashmdashmdashmdashmdashmdashmdashndashmdashmdashmdashmdash
mdashmdashmdashmdashmdashmdashmdashmdashmdashmdashmdashmdashmdashmdashmdashmdashmdashmdashmdashmdashmdashmdashmdashmdashmdashmdashmdashmdashmdashmdashmdashmdashmdashmdashmdashmdashmdashmdashmdashmdashmdashmdashmdashmdashmdashmdashndashmdashmdashmdashmdash
34 INTERNATIONAL JOURNAL OF ENGINEERING RESEARCH AND INNOVATION | V11 N1 SPRINGSUMMER 2019
button was added and the ldquoenlargerdquo button was added right
beneath it to display a larger version of the Bode diagram in
a separate window This helps engineers get a closer look at
the data plot in case the view on the GUI is not large
enough The same approach was used for other types of
graphs The control panel is the long rectangular panel lo-
cated on the left side of the GUI Here the user can perform
a of actions such as view data or reset graphs When the
users click on the ldquofilerdquo button they are able to select any
image file within the file directory that can be added to the
list box below to be selected (see Figure 10)
Figure 10 The ldquo filerdquo button and image selector listbox
A ldquodata resultsrdquo static textbox was added to the control
panel This box is used to view the data of the image cur-
rently selected in the list box This allows the user to see the
data being plotted or selected Additionally Figures 11 and
12 show how users can view the data being plotted in Note-
pad by going to the toolbar and selecting the data A reset
button was added to the control panel to allow users to reset
the current graph back to a blank state This button does not
reset all the graphs at once so users can erase one graph at a
time The amplifier button located on the toolbar can be
used to generate a Smith chart After the button is selected
users are taken through a wizard-style setup to select what
type of Smith chart they would like to generate This feature
is extremely useful because it allows users to create differ-
ent types of Smith charts that may be hard to duplicate using
the Smith chart located on the GUI (see Figures 13 and 14)
Figure 11 The ldquodata resultsrdquo static textbox
Figure 12 Data displayed in Notepad after using the ldquodatardquo
function
(a) Step 1
(b) Step 2 Figure 13 The amplifier process
mdashmdashmdashmdashmdashmdashmdashmdashmdashmdashmdashmdashmdashmdashmdashmdashmdashmdashmdashmdashmdashmdashmdashmdashmdashmdashmdashmdashmdashmdashmdashmdashmdashmdashmdashmdashmdashmdashmdashmdashmdashmdashmdashmdashmdashmdashndashmdashmdashmdashmdash
Figure 14 Results of the amplifier generator
The angular average function was also added to the
toolbar Figure 15 shows how this function plots various
polar plots and saves them to the file directory A help menu
was also added to the toolbar Here users can access help
using the GUI through demos and help menus In addition
to finding help users can obtain contact information for the
help desk
Figure 15 The angular average of some random data
Conclusions and Future Work
This project was extremely successful The most prized
accomplishments throughout this entire experience was the
comprehensive set of features for manipulating and display-
ing data and the custom background that worked well with
all of the functions The plan for future work is to take the
code written in MATLAB create an iPhoneiPad-
compatible app that could do the same thing that this GUI
did and enable users to accomplish these tasks from an iPad
or iPhone
Acknowledgments
This research was funded by 2010 and 2011 NASA CI-
PAIR and NASA NSTI Research Grants and supported by
Goddard Space Flight Center and NASA Langley Research
Center We would like to thank the NASA team of collabo-
rators lead by Dr Deshpande and our colleagues at Virginia
State University for their time and thoughtful insights dur-
ing ad hoc research gatherings In addition the authors wish
to extend their gratification to the anonymous reviewers for
their time assistance and patience
References
Badombena-Wanta S amp Sheybani E O (2010) Mobile
communications for development Enabling strategic
and low-cost e-applications for rural and remote areas
Proceedings of Wireless Telecommunications Symposi-
um Piscataway NJ IEEE doi 101109
WTS20105479644
Bonsiepe G (1989) Interpretations of human user inter-
face Visible Language 24(3) 262-285
Hayes F amp Baran N (1989 July) A guide to GUIs Byte
4 250-257
Garcia-Otero S amp Sheybani E (2010) Engineering senior
design course (ldquonew and improvedrdquo) Proceedings of
ASEE Annual Conference Washington DC ASEE
Gawa A (2006) Smith chart Retrieved from http
amanogawacomarchivedocsG-tutorialpdf
Hardy M Javidi G Denton L Campbell Y amp Shey-
bani E (2007) Enhancing research capacity and devel-
oping wireless communications curriculum for students
in computer science and engineering Proceedings of
IEEESECon 2007 Piscataway NJ IEEE doi
101109SECON2007342995
Interface (2019) Business Dictionary Retrieved from
httpwwwbusinessdictionarycomdefinition
interfacehtml
Javidi G amp Sheybani E (2008) Content-based computer
simulation of a networking course An assessment
mdashmdashmdashmdashmdashmdashmdashmdashmdashmdashmdashmdashmdashmdashmdashmdashmdashmdashmdashmdashmdashmdashmdashmdashmdashmdashmdashmdashmdashmdashmdashmdashmdashmdashmdashmdashmdashmdashmdashmdashmdashmdashmdashmdashmdashmdashndashmdashmdashmdashmdash
DESIGN AND DEVELOPMENT OF A GUI FOR RF COMMUNICATIONS 35
mdashmdashmdashmdashmdashmdashmdashmdashmdashmdashmdashmdashmdashmdashmdashmdashmdashmdashmdashmdashmdashmdashmdashmdashmdashmdashmdashmdashmdashmdashmdashmdashmdashmdashmdashmdashmdashmdashmdashmdashmdashmdashmdashmdashmdashmdashndashmdashmdashmdashmdash
mdashmdashmdashmdashmdashmdashmdashmdashmdashmdashmdashmdashmdashmdashmdashmdashmdashmdashmdashmdashmdashmdashmdashmdashmdashmdashmdashmdashmdashmdashmdashmdashmdashmdashmdashmdashmdashmdashmdashmdashmdashmdashmdashmdashmdashmdashndashmdashmdashmdashmdash
36 INTERNATIONAL JOURNAL OF ENGINEERING RESEARCH AND INNOVATION | V11 N1 SPRINGSUMMER 2019
Journal of Computers 3(3) 64-72
Javidi G amp Sheybani E (2010) Making youth excited
about STEM education Journal of Computing Sciences
in Colleges 26(1) 140-147
Norman D (1988) The psychology of everyday things
New York Basic Books
Ouyang Y Yang S Franklin T Michaelson K Morge
S Sheybani EhellipNarayan S (2010) Games sims
and virtual worlds in K-20 STEM education
Proceedings of 21st International SITE Conference
Chesapeake VA Association for the Advancement of
Computing in Education
Sheybani E amp Arora K (1993) Measurement of temporal
coherence of underwater optical scattered field
Microwave and Optical Technology Letters 6(2) 151-
154
Sheybani E amp Sankar R (2002) Integrated network
architecture and signal processing for telemammography
Proceedings of IEEEICASSP Piscatawny NJ IEEE
Sheybani E amp Javidi G (2006) Visualization effects in
virtual engineering labs II Proceedings of IEEEFIE
Piscataway NJ IEEE
Sheybani E (2011) Dimensionality reduction and noise
removal in wireless sensor networks Proceedings of
2011 4th IFIP International Conference on New
Technologies Mobility and Security Piscataway NJ
IEEE doi 101109NTMS20115721151
Sheybani E amp Javidi G (2007) Development and
evaluation of an educational computer network
software Proceedings of IEEESECon 2007
Piscataway NJ IEEE doi 101109
SECON2007342904
Sheybani E O Mengshoel O J amp Poll S (2010)
Removing spikes while preserving data and noise using
wavelet filter banks Proceedings of IEEE Aerospace
Conference Piscataway NJ IEEE doi 101109
AERO20105446821
Sheybani E Garcia-Otero S Adnani F Javidi G amp
Deshpande M (2012) An algorithm for real-time blind
image quality comparison and assessment International
Journal of Electrical and Computer Engineering 2(1)
doi httpdxdoiorg1011591ijecev2i1112
Varde A Rundensteiner E Javidi G Sheybani E amp
Liang J (2007) Learning the relative importance of
features in image data Proceedings of IEEE ICDErsquos
DBRank-07 Piscataway NJ IEEE doi 101109
ICDEW20074400998
Zhou Y amp Chen Y (2008) Properties of mixed-mode S-
parameters Microwave and Optical Technology
Letters 50(11) 2869-2874
Biographies
EHSAN SHEYBANI earned his BS MS and PhD in
electrical engineering from UF FSU and USF respectively
His main research area is applications of communication
signal processing and data analysis He has been involved
in teaching practicing researching and consulting
applications of DSP in technology system analysis and
data sciences for the past 20 years He has a long list of
publications and research grants including projects with
NASA NSF NIH DoD DEd and industry partners
Currently he serves as a faculty member at the University
of South Florida Dr Sheybani may be reached at
sheybaniusfedu
GITI JAVIDI earned her BS from the University of
Central Oklahoma and MS and PhD from the University of
South Florida Her main research area is human computer
interaction data visualization and STEM education She
has been involved in teaching computer science and
conducting research in that area for the past 16 years Dr
Javidi has a long list of publications and research grants
including projects with NASA NSF MSIP and industry
partners Currently she serves as a faculty member at the
University of South Florida Dr Javidi may be reached at
javidiusfedu
A DIAGNOSTIC CLOCK FOR VERIFICATION
OF IMAGE TIME SYNCHRONIZATION mdashmdashmdashmdashmdashmdashmdashmdashmdashmdashmdashmdashmdashmdashmdashmdashmdashmdashmdashmdashmdashmdashmdashmdashmdashmdashmdashmdashmdashmdashmdashmdashmdashmdashmdashmdashmdashmdashmdashmdashmdashmdashmdashmdashmdashmdashndashmdashmdashmdashmdash
Curtis Cohenour Ohio University
Abstract
The GPS clock is a diagnostic tool for measuring time
synchronization errors in aerial surveillance systems Aerial
surveillance systems are used in many civilian and military
applications including law enforcement border security
military situational awareness and military forensics The
goal is to collect images and project them onto the local
terrain such that the images form a map A common exam-
ple is Google Earth Aerial platforms can include drones
fixed or rotary winged aircraft and lighter-than-air vehicles
An aerial surveillance system consists of an imaging system
and a navigation system The navigation system is used to
determine the camera position and attitude known as the
pose which contains the necessary information required for
the projection of the image onto the terrain The images and
pose come from two sources and must be synchronized
Any error in the synchronization will create a projection
error
One method of determining when an image has been cap-
tured is to take a picture of a clock The GPS-synchronized
clock creates a display of the GPS time that can be recorded
in an image By taking images of the clock using the sur-
veillance system each image will have a true time from the
image of the GPS clock and a time derived from the pose If
the synchronization is correct they will match Any differ-
ence between the clock time from the image and the time
from the pose is an error that must be corrected In this pa-
per the author describes the operation testing and accuracy
of the clock Tests were performed using an independent
GPS receiver and a precise time protocol (PTP) server The
resolution of the clock was 1 millisecond (ms) and the ac-
curacy was 01 ms Case studies describe how the clock is
used to discover and subsequently correct timing errors in a
surveillance system
Introduction
Aerial surveillance is used in many civilian and military
applications including law enforcement (Ersoy
Palaniappan Seetharaman amp Rao 2012) border security
and improved situational awareness (Bryant Johnson Kent
Nowak amp Rogers 2008) The goal is to collect images and
project them onto the local terrain such that the image forms
a map A common example is Google Earth (GE) where
for example the image of a road overlays a map of the road
Images are captured by a camera while the pose is most
often generated by an integrated global positioning system
(GPS)inertial measurement unit (IMU) Distortion in the
camera image and errors in the GPSIMU will result in er-
rors in the projection These errors have been studied in
detail and are well documented in the literature for camera
models (Cohenour Price Rovito and van Graas 2015) and
corrected pose data (Cohenour Price Rovito amp van Graas
2015) The assumption was made that the pose would be
synchronized with the image as the author was unable to
find research into projection errors caused by time synchro-
nization errors nor any device to measure these errors It
was also assumed to not always be true that an image is
synced with the pose as will be seen in the case studies
below In this paper the author describes a means of testing
this assumption
The pose by default includes an accurate time If the
image includes the time the two can be compared directly
The GPS clock provides a mechanism for including the time
in the image The clock was used as a diagnostic tool Data
were collected and analyzed and the results used to diag-
nose correct and ultimately verify the synchronization of
the image and the pose The details of the projection are
described in a number of papers for camera models
(Cohenour et al 2015) corrected pose date (Cohenour et
al 2015) and others (Wolf 1974 Tsai 1987 Di amp Li
2004) The projection is based on the camera pose (position
and attitude) that corresponds to the image The pose will
have random errors that generate random errors in projec-
tion For example errors in GE can range from a few centi-
meters to a few meters depending on the aerial survey used
In this current study the focus was on errors that occurred
because the pose data were not captured at the same time
the image was captured
The pose data typically come from an integrated GPS
IMU while the image data come from a camera or a bank of
cameras The pose and image data are placed in one-to-one
correspondence But what happens if there is an extra mes-
sage in the IMU buffer or the image buffer If this happens
then the images will be off by one or more frames GPS is a
four-dimensional positioning system it produces position in
three dimensions and time The position errors are typically
less than 10m (Kaplan 1996) A 10m error in time is
10m300e6ms = 33ns An aerial surveillance camera typi-
cally operates with an integration time of 1ms If an aircraft
is traveling at 85ms then the 1ms is 085 of aircraft travel
mdashmdashmdashmdashmdashmdashmdashmdashmdashmdashmdashmdashmdashmdashmdashmdashmdashmdashmdashmdashmdashmdashmdashmdashmdashmdashmdashmdashmdashmdashmdashmdashmdashmdashmdashmdashmdashmdashmdashmdashmdashmdashmdashmdashmdashmdashmdashmdashmdashmdash
INTERNATIONAL JOURNAL OF ENGINEERING RESEARCH AND INNOVATION | V11 N1 SPRINGSUMMER 2019 37
mdashmdashmdashmdashmdashmdashmdashmdashmdashmdashmdashmdashmdashmdashmdashmdashmdashmdashmdashmdashmdashmdashmdashmdashmdashmdashmdashmdashmdashmdashmdashmdashmdashmdashmdashmdashmdashmdashmdashmdashmdashmdashmdashmdashmdashmdashndashmdashmdashmdashmdash
mdashmdashmdashmdashmdashmdashmdashmdashmdashmdashmdashmdashmdashmdashmdashmdashmdashmdashmdashmdashmdashmdashmdashmdashmdashmdashmdashmdashmdashmdashmdashmdashmdashmdashmdashmdashmdashmdashmdashmdashmdashmdashmdashmdashmdashmdashndashmdashmdashmdashmdash
38 INTERNATIONAL JOURNAL OF ENGINEERING RESEARCH AND INNOVATION | V11 N1 SPRINGSUMMER 2019
The GPS time is available for free with an accuracy much
greater than that needed for image time registration This
provides an opportunity for verifying the synchronization of
the pose and the image If there is an accurate clock in the
image the clock time can be compared with the GPS time
in the pose If they match the synchronization is confirmed
If they do not match then hardware or software modifica-
tions are required
GPS Clock Version 1
The original clock Version 1 was not designed specifi-
cally for testing image synchronization and so was modified
for this purpose The clock displayed the minutes and sec-
onds with six gray code bits (Dewar amp Stevens 2012) and
milliseconds with 10 gray code bits Two additional indica-
tors were also displayed The first indicated a valid display
labeled ldquoGPS Okrdquo the second indicator changed state each
time the GPS receiver time sync pulse was received and was
labeled 1 pulse per second (1PPS) Gray code was used in
the clock because only one bit changes at a time If binary
were used the transition from 7 to 8 which in binary is
0111b to 1000b could be read as 0000b or 1111b which
would be 0 or 15 in decimal Version 1 of the clock had a
number of issues
1 Heavy about 35 pounds
2 Separate gray code displays for minutes seconds
and milliseconds
3 No diagnostics for the GPS receiver
4 No way to test the LEDs and drivers
5 Second update occurs 20ms after the 1PPS
6 LEDs are dim
7 Requires 120V alternating current (AC) power
8 Satellite tracking issues
While 35 pounds is not prohibitively heavy the clock was
awkward hard to carry and sometimes used in areas inac-
cessible to autos The clock did not operate on batteries
which could cause issues in remote locations The separate
gray code displays for minutes seconds and milliseconds
meant that multiple bits would sometimes change at the
same time If the change occurred while the exposure was
being made this would create errors since the second up-
date was 20ms late The milliseconds must be read first and
then the seconds adjusted With no receiver diagnostics
simple problems like a bad antenna cable could not be diag-
nosed There was no way to test for a bad LED or driver
The LEDs were not bright enough for use outdoors in the
sun or with a short 01ms integration time Finally receiver
tracking was optimized for survey work and would not track
satellites that were not clearly visible This led to trouble
getting a solution if the antenna did not have a clear view of
the sky
GPS Clock Version 2
Version 2 of the clock resolved all of the aforementioned
issues (see Figure 1) The clock was lightweight designed
for remote use included diagnostics and worked well in
direct sunlight There were test buttons for the LEDs a liq-
uid crystal display (LCD) and a diagnostic RS-232C port
Figure 1 The GPS clock version 2
The GPS clock version 2 used an Arduino Mega 2560 R3
as the computing platform The Arduino Mega (2017) had
four serial ports 54 digital inputoutput (IO) ports and mul-
tiple hardware and software interrupts The GPS receiver
was manufactured by ITEAD and used a RoyalTek REB-
4216 chip The receiver tracked reflected satellites operated
with a limited view of the sky and could often generate a
solution indoors The receiver was selected because it was
the only GPS Arduino shield (at the time of writing) with a
1PPS output All of the receiver outputs were echoed to an
RS-232 serial port for diagnostics
The LED outputs were buffered generating an intense
white light of 12000 mcd The LEDs could easily be seen
in bright sunshine A felt cover was provided to eliminate
reflections when operating in direct sun The LEDs IO pins
and buffers could be tested using two buttons ldquoall onrdquo and
ldquoall offrdquo The time display was 16 bits with 10 bits dedicat-
ed to the fraction All 16 bits were a single gray code word
This complicated manual decoding but ensured that no more
than one bit changed at a time The fraction was 10 bits
therefore the resolution was 2-12 11024th of a second or
09766 ms The resolution was approximately 1ms which
was adequate for an airborne imaging system that typically
has a minimum exposure time of 1 or 2ms
mdashmdashmdashmdashmdashmdashmdashmdashmdashmdashmdashmdashmdashmdashmdashmdashmdashmdashmdashmdashmdashmdashmdashmdashmdashmdashmdashmdashmdashmdashmdashmdashmdashmdashmdashmdashmdashmdashmdashmdashmdashmdashmdashmdashmdashmdashndashmdashmdashmdashmdash
GPS time was kept in seconds of the week starting with 0
at 00000 coordinated universal time (UTC) on Sunday
The six most significant bits of the LED display showed the
GPS time modulo 64 There are 86400 seconds in a day so
8640064 is 1350 with a remainder of zero This happy
coincidence ensured that there would be a continuous rollo-
ver over each day and each week The aerial surveillance
system was assumed to have a time error of less than
32 seconds This could be verified with a single frame of
data and a watch Assuming that the system met this re-
quirement the error would be at most a few seconds and a
modulo 64 second clock would be adequate
An LCD was provided on the clock The LCD displayed
the clock version validinvalid the number of satellite vehi-
cles (SVs) tracked the leap second and a graphic indicating
serial data received The number of SVs tracked was a key
piece of troubleshooting data as was the serial data graphic
The GPS receiver sent out six National Marine Electronics
Association (NMEA) messages The Arduino decoded two
of these messages to extract the time of day validinvalid
and the number of SVs All of the messages were echoed to
a serial port on the left side of the clock for user diagnostics
Finally the clock was lightweight only 35 pounds
8x12x3 with a carry handle and powered by six AA
batteries or an AC adapter The clock and accessories were
shipped in a small Pelican case
Hardware and Software
Figure 2 shows a hardware block diagram of the GPS
clock The ITEAD GPS receiver sends serial data to the
Arduino Mega via serial port 2 The baud rate is 9600 with
eight data bits one stop bit and no parity These data are
converted to RS-232 signal levels using a MAX-232-CPE
and outputted to a 9-pin d-shell serial port The 1PPS signal
is routed to the Arduino on pin 2 interrupt 0 The Arduino
processes the data and outputs to 18 LEDs which are con-
nected to three SN74LS07 hex buffers and drivers with
open-collector high-voltage outputs (Texas Instruments
2016) The LEDs are connected to the battery or AC adapter
and do not draw power through the Arduino voltage regula-
tor There are 16 LEDs for the time display one for the
1PPS and one for the valid indicator The Arduino drives a
backlit LCD display There is an analog contrast adjustment
for the LCD
There are four button inputs to the Arduino lamp test
buttons ldquoall onrdquo and ldquoall offrdquo and leap second ldquouprdquo and
ldquodownrdquo The lamp test buttons override the normal LED
outputs and verify the Arduino output the buffer and the
LED Not shown is the power A switched barrel jack dis-
connects the batteries when the AC adapter is connected
An on-off switch connects the power to the clock The clock
can operate for about two hours on six AA batteries An
SMA female connector is provided on the left side of the
clock for connection to an amplified 33V GPS antenna
Figure 3 shows a software block diagram for the clock
which is interrupt-driven The 1PPS event sets the seconds
of the day based on the input from the serial parser and ze-
ros out the 11024-second timer This starts the
11024-second counter at zero on the 1pps event From here
on the 11024-second clock increment will be referred to as
1 ms for brevity
Figure 2 GPS clock version 2 hardware block diagram
Figure 3 Software block diagram of the GPS clock
The ITEAD receiver generates six NMEA output messag-
es The serial parser reads and parses the recommended
minimum data (RMC) and global positioning system fixed
data (GGA) messages other messages are not parsed to
reduce processor load All messages are passed via hard-
ware to the diagnostic serial port The RMC message is
parsed to extract the UTC time and the valid flag The GGA
message provides the number of SVs in the solution The
seconds of the day (SOD) is computed based on the hour
minutes and seconds in the RMC message The RMC mes-
sage completes 750 ms into the seconds and is one second
old at the time of the next 1PPS The leap seconds are added
to the SOD to convert UTC SOD to GPS SOD The GPS
SOD is all that is needed for the clock because the seconds
in a day 86400 is an even multiple of 64 During the 1PPS
event if the time is valid the clock is reset to the (SOD
GPS + 1) modulo 64 the milliseconds is set to zero and the
millisecond timer timer 2 is set to zero
mdashmdashmdashmdashmdashmdashmdashmdashmdashmdashmdashmdashmdashmdashmdashmdashmdashmdashmdashmdashmdashmdashmdashmdashmdashmdashmdashmdashmdashmdashmdashmdashmdashmdashmdashmdashmdashmdashmdashmdashmdashmdashmdashmdashmdashmdashndashmdashmdashmdashmdash
A DIAGNOSTIC CLOCK FOR VERIFICATION OF IMAGE TIME SYNCHRONIZATION 39
mdashmdashmdashmdashmdashmdashmdashmdashmdashmdashmdashmdashmdashmdashmdashmdashmdashmdashmdashmdashmdashmdashmdashmdashmdashmdashmdashmdashmdashmdashmdashmdashmdashmdashmdashmdashmdashmdashmdashmdashmdashmdashmdashmdashmdashmdashndashmdashmdashmdashmdash
mdashmdashmdashmdashmdashmdashmdashmdashmdashmdashmdashmdashmdashmdashmdashmdashmdashmdashmdashmdashmdashmdashmdashmdashmdashmdashmdashmdashmdashmdashmdashmdashmdashmdashmdashmdashmdashmdashmdashmdashmdashmdashmdashmdashmdashmdashndashmdashmdashmdashmdash
40 INTERNATIONAL JOURNAL OF ENGINEERING RESEARCH AND INNOVATION | V11 N1 SPRINGSUMMER 2019
The 11024 event is tied to timer 2 The timer pre-scaler is
set to 64 The clock is 16 MHz so the timer counts at 250
KHz The counter should time out at 2500001024-1=
2431406 The timer is set to 243 and the remainder
01406 is accumulated until it is greater than 10 When this
happens one is subtracted from the accumulator and the
timer is set to 244 In this way the clock remains accurate
If this were not done then the last millisecond 1023 would
be over four milliseconds long This is further complicated
by the inaccuracy of the Arduino clocks The clock was
tested with three different Arduinos to investigate the varia-
bility in the oscillators The average number of microsec-
onds per 1PPS was 1e6 for a perfect oscillator The results
for the three units tested were 992592 1001216 and
1000002 The GPS 1PPS had an error of less than 1μs so
it could be used to calibrate the Arduino internal oscillator
To compensate for the oscillator errors the average value of
the microseconds per 1PPS was divided by four and used in
the above calculation instead of 250000
The REB 4216 receiver does not reveal the leap second
To convert from UTC to GPS the leap second is needed
The current leap second is 18 as of August 2017 and can
change twice per year during the first week epoch in Janu-
ary and the first week epoch in July The current leap sec-
ond is officially available on line at https
wwwnavcenuscggov but is more easily found by doing a
Google search for ldquoGPS leap secondsrdquo The conversion is
given by Equation 1[IS-GPS-200]
GPS = UTC + Leap seconds (1)
where GPS is the seconds of the week in GPS time UTC is
the seconds of the week in UTC and Leap seconds is the
integer number of leap seconds
The leap second was stored in a EEPROM and manipulat-
ed by two buttons ldquouprdquo and ldquodownrdquo When the leap second
was changed it was stored in the EEPROM During startup
the EEPROM was read to initialize the leap seconds The
LED test buttons were implemented in the 11024 event
During this event the seconds and milliseconds were com-
puted as well as the status of the valid and 1PPS LEDS The
seconds and milliseconds were converted to gray code If
neither LED test button was pushed the data were placed on
the Arduino IO ports If the ldquoall onrdquo button was pressed the
IO ports were set to on if ldquoall offrdquo was pressed then the IO
ports were set to off In this way the IO ports the buffers
and the LEDs were tested Data displayed on the LCD in-
cluded the GPS clock software revision on the top line and
key data on the second line The second line of the display
included ldquovalrdquoldquoinvrdquo to indicate the status of the clock the
number of satellites the number of leap seconds and a ro-
tating slash to indicate that the GPS messages were being
received
Verification
Accuracy of the GPS clock was verified in a number of
ways First the 1PPS signal was checked against a Novatel
survey receiver second a precise time protocol-enabled
camera (Kaplan 1996) was used and third a Novatel re-
ceiver was used Figure 4 shows a histogram of the error
collected from 31521 images
Figure 4 Histogram of clock errors (31521 measurements)
The first test conducted was to determine the accuracy of
the 1PPS interrupt A NovAtel PWRPAK-4-3151W PN
01016783 was connected to an AeroAntenna AT575-9W-
TNCF-000-05-26-NM amplified antenna The 1PPS was
connected to the Arduino interrupt 0 IO pin 2 The interrupt
routine was set up to toggle the 1PPS LED on the Arduino
The Arduino output was connected to the NovAtel Event1
input The NovAtel ldquoMarkTime OnNewrdquo log (Novatel
2015) was used to determine the interrupt delay This test
showed a delay of 11 micros which is the time required to pro-
cess the interrupt Figure 5 shows how the second and third
tests were set up Table 1 provides descriptions of the com-
ponents
The camera was powered using power over Ethernet
(POE) Communications and control of the camera was by
gigabyte Ethernet A PTP (IEEE 2008) time server was
connected to the camera to provide microsecond-level abso-
lute time to the camera In this configuration a console ap-
plication running on the laptop triggered and recorded 10
images about 08 seconds apart Each image was saved us-
ing the PTP time in microseconds The PTP time is Temps
Atomique International (TAI) seconds since January 1
-02 0 02 04 06 08 1 120
50
100
150
200
250
300
NOV Time Error (ms)
Co
un
t
mdashmdashmdashmdashmdashmdashmdashmdashmdashmdashmdashmdashmdashmdashmdashmdashmdashmdashmdashmdashmdashmdashmdashmdashmdashmdashmdashmdashmdashmdashmdashmdashmdashmdashmdashmdashmdashmdashmdashmdashmdashmdashmdashmdashmdashmdashndashmdashmdashmdashmdash
1970 (McCarthy amp Seidelmann 2009) TAI is always ahead
of GPS by 19 seconds (Time Service Dept nd) and can
be determined using Equation 2
GPS = PTP + 19s (2)
where PTP is seconds since January 1 1970
Figure 5 Test configuration for the clock
Table 1 Equipment used for clock testing
PTP time synchronization in the camera is known to be
within 2 μs (Allied Vision 2016) If the PTP time from the
camera is correct then this would be all that is required to
validate the clock readings to the millisecond To check the
camera PTP time the sync 1 output of the camera was tied
to the Event 1 input of the Novatel Using MATLAB the
console app was executed and the file namesPTP times
were extracted The Novatel logs were collected and the
time extracted Each image was read and the first 20 bytes
of the image were replaced with the GPS time from the No-
vatel receiver This was done 10 images at a time to ensure
that there were no buffering errors Later when processing
the images the PTP time was extracted from the file name
and the GPS time was extracted from the image
Other items in the test setup included a NetGear Ethernet
switch and Cat 5E Ethernet cables This set up was used for
all of the results in the following section Tests were con-
ducted with the lens aperture at max an exposure time of
01 ms and a gain of 35 dB This produced images having
an exposure much shorter than the resolution of the clock
Figure 6(a) shows that the LEDs and clock were clearly
visible Figure 6(a) also shows image one of 31521 images
used to verify the clock accuracy The images were pro-
cessed automatically using MATLAB First the location of
the LEDs was captured This was done by displaying image
one and clicking on each of the 18 LEDs The location of
the LEDs was saved and indicated by circles in Figure 6(a)
Once this was completed the LED locations could be used
for all images as long as the clock and camera were not
moved
(a) The first of 31521 images (b) Mask for bit G15
used for clock verification
Figure 6 The LEDs and clock are clearly visible
For each image the LEDs are read as follows a mask is
generated for each LED position with a value of one within
a radius of pixels Figure 6(b) shows the mask for LED
G15 The mask and the image are multiplied element by
element and the results are summed This gives a low value
for an LED that is off and a high value for an LED that is
on This is repeated for each of the 16 gray code LEDs the
1PPS and the valid LED A threshold value is chosen mid-
way between on and off to differentiate the two states In
this way the 16 gray code bits are extracted This is done
for each image The gray code values for each image are
converted to seconds using Equation 3 Note that the clock
reading is by definition modulo 64
(3)
where Gry is the clock reading in gray code gry2int()
converts in gray code to an integer and 1024 converts
clock increments to seconds Additional MATLAB scripts are available from the author (see contact information
included with this paper)
Item Description
Camera Allied Vision Manta G-319B
Novatel Novatel PWRPAK-4-3151W PN 01016783
PTP Server Time Machine TM2000A
Switch NetGear ProSAFE GS108
Antennas Generic Magnetic Base L1 Patch Antenna
g ry 2 in t(G ry ) =
1 0 2 4M o d G P S
mdashmdashmdashmdashmdashmdashmdashmdashmdashmdashmdashmdashmdashmdashmdashmdashmdashmdashmdashmdashmdashmdashmdashmdashmdashmdashmdashmdashmdashmdashmdashmdashmdashmdashmdashmdashmdashmdashmdashmdashmdashmdashmdashmdashmdashmdashndashmdashmdashmdashmdash
A DIAGNOSTIC CLOCK FOR VERIFICATION OF IMAGE TIME SYNCHRONIZATION 41
mdashmdashmdashmdashmdashmdashmdashmdashmdashmdashmdashmdashmdashmdashmdashmdashmdashmdashmdashmdashmdashmdashmdashmdashmdashmdashmdashmdashmdashmdashmdashmdashmdashmdashmdashmdashmdashmdashmdashmdashmdashmdashmdashmdashmdashmdashndashmdashmdashmdashmdash
mdashmdashmdashmdashmdashmdashmdashmdashmdashmdashmdashmdashmdashmdashmdashmdashmdashmdashmdashmdashmdashmdashmdashmdashmdashmdashmdashmdashmdashmdashmdashmdashmdashmdashmdashmdashmdashmdashmdashmdashmdashmdashmdashmdashmdashmdashndashmdashmdashmdashmdash
42 INTERNATIONAL JOURNAL OF ENGINEERING RESEARCH AND INNOVATION | V11 N1 SPRINGSUMMER 2019
The MATLAB code for this conversion is decGPS=gray2int(Gry)
ModGPS=decGPS1024
When in use it was assumed that the clock was correct so
the error was the time stampmdashthe GPS clock time in the
image The time stamp error can be computed using Equa-
tion 4
ModTimeStamp = mod(TimeStamp64)
Err = ModTimeStamp ‒ ModGPS (4)
if (Err lt -32) Err = Err + 64
where TimeStamp is the time stamp in GPS time mod(a b)
returns the remainder of ab and Err is the clock error
Note that the ldquoifrdquo statement compensates for events where
the ModGPS and the ModTimeStamps occur on opposite
sides of the 64 second boundary
Using the setup above the clock distribution was 05 ms
plusmn03 ms as seen in the histogram of Figure 4 The camera
was triggered asynchronously so that the errors should form
a uniform error distribution in Figure 4 Theoretically the
distribution of the error should be a uniform distribution
with a mean of 05 ms and standard deviation of 028 ms
(Miller amp Freund 1977) which is very close to the meas-
ured values of 05 for the mean and 03 for the standard de-
viation The clock resolution was 1 ms while the actual
accuracy is better than 01 ms To understand why examine
what happens to images taken at various times A through D
in Figure 7 The clock reads 0000 in the range 0000 to
0001 and 0001 in the range from 0001 to 0002 An im-
age taken at B will have a time stamp of 00011 but the
clock will read 0001 and the error is 01 ms The same
applies for C where the error is 09 ms The image taken at
A has a time stamp of 000047 and the clock reads 0000 so
the error is 047 ms All of the errors will map into the range
of 0 to 1 ms
Figure 7 Timeline showing various image capture times
Now consider the image at D This time stamp is 0001
but the clock could be in transition and read either 0000 or
0001 If the clock reads 0000 then the time error for D is
1 ms If the cock reads 0001 then the time error reads 0 So
the image at D could have an error of 0 or 1 ms The same
argument can be made for the image taken at E This is il-
lustrated in Figure 8 Note that most of the images occur
between B and C Since they are random in time they map
to a uniform distribution with an error between 0 and 1 ms
The points at D and E may map to 0 ms plusmn a few microsec-
onds or to 1 ms plusmn a few microseconds The result is the plot
in Figure 4 The camera integration time is 01 ms for the
data collected in Figure 4 This results in a few observations
in the range of 100 to 107 ms
Figure 8 Mapping of image times to error space
The GPS clock has an LED to indicate that the clock is
valid The clock may go to invalid if the GPS solution is
corrupt due to jamming an antenna failure poor visibility
of the sky or other reasons If this happens the valid LED
should turn off To test this the clock was allowed to sync
to GPS time Data recording was started and the GPS an-
tenna was disconnected After a period of time the antenna
connector was reconnected and the clock synced The data
were checked and the invalid state started almost immedi-
ately when the antenna was disconnected When the antenna
was reconnected the time recovered and the clock returned
to valid All measurements with the valid indicator on were
correct For accuracy the imaging system should be set for
a short integration time The recommended exposure time is
01 ms to extract maximum accuracy from the clock This
can usually be achieved by setting the integration time
01 ms and increasing the gain The clock does not have to
be visible as long as the LEDs can be seen in the image An
underexposed image will work because the LEDs are very
bright If a longer exposure time is used the results will be
smeared but the results are still meaningful Some systems
using webcams for example do not allow the user to con-
trol the exposure This is illustrated in the two tests that fol-
low
Two tests were performed using 1 ms and 2 ms integra-
tion times For a 1 ms exposure with 1661 images the
mean is 67 μs and the standard deviation is 06 ms or
00 plusmn 06 ms For a 2 ms exposure with 3701 images the
mean is -04ms with a standard deviation of 10 ms
mdashmdashmdashmdashmdashmdashmdashmdashmdashmdashmdashmdashmdashmdashmdashmdashmdashmdashmdashmdashmdashmdashmdashmdashmdashmdashmdashmdashmdashmdashmdashmdashmdashmdashmdashmdashmdashmdashmdashmdashmdashmdashmdashmdashmdashmdashndashmdashmdashmdashmdash
Case Studies
Version 1 of the clock was developed in 2009 and used to
troubleshoot fix and ultimately verify a number of sys-
tems Case studies are provided here to give the reader an
appreciation of how time sync errors can arise and how the
clock can be used to investigate and correct the any syn-
chronization errors Seven case studies are listed in Table 2
Some of these cases were investigated thoroughly and docu-
mented in publications in others the results were transmit-
ted and results were never communicated to the author
Table 2 Table of case studies using the clock
Case 1 The Novatel ldquoInsPva OnMarkrdquo log was used but
this log was not supported by Novatel There was an inter-
polation error that returned the positon and attitude at the
wrong time The correct log is the ldquoMark1Pva OnNewrdquo log
There is a -10 ms error in the ldquoInsPva OnMarkrdquo log that
reaches as high as 50 ms near the one-second boundary
This indicates that perhaps the Novatel has housekeeping
chores on the one-second boundary that create issues with
the unsupported log
Case 2 The system was switched to use the ldquoMark1Pva
OnNewrdquo log This created additional problems with yaw
errors from IMU Knowing the time tags were correct led to
an examination of the errors Based on this test it became
clear that the ldquoInsPva OnMarkrdquo log has errors that cannot be
explained Novatel was contacted and the user was advised
to do a firmware update This corrected the error
Case 3 A nadir (down looking) camera system mounted on
the Ohio University Avionics Center DC-3 was tested using
the clock The system had zero time errors and no modifi-
cations were required
Case 4 Two independent nadir camera systems were
mounted on the Ohio University Avionics Center DC-3
Both of these systems used Allied Vision PTP cameras
Both systems were tested using the clock and found to have
correct time tags
Case 5 A number of the Version 1 clock shortcomings were
revealed A 30 frames per second (FPS) with a long lens
was tested using Version 1 of the clock It was required to
position the clock outside in order for the camera to capture
the entire clock in the image The sun was so bright that the
LEDs could not be read Folding tables and sawhorses were
used to provide shade so that the clock could be read The
clock was placed in an area that was surrounded by build-
ings that obscured portions of the sky The GPS receiver
lost lock many times and slowed the data collection Once
usable data were obtained from the clock it was discovered
that the images were off by 1 to 3 frames The system hard-
ware included a divide-by-four circuit in the line between
the camera sync and the Novatel mark input The error oc-
curred because the divide-by-four counter was not reset and
not synced with the software The software system was re-
configured to reset the divide-by-four circuit when imaging
was started This resulted in synced images
Case 6 An imaging system similar to that described in
Cohenour et al (Camera 2015) and Conehour et al
(Corrected 2015) recorded at a rate of 3 frames per second
There was a time tag error of 016 The camera sync and the
Novatel mark input were driven by an external time source
The error was frac12 of the frame rate One possible source of
the error could be that the camera was triggered on the posi-
tive edge of the signal and the Novatel was triggered on the
negative edge Changing edge sensitivity of either the cam-
era or the Novatel is trivial The author did not receive any
feedback on the resolution of this issue This is a good ex-
ample of the utility of the clock an easily correctable prob-
lem but difficult to isolate without the clock
Case 7 A forward-looking camera system was installed on
the Ohio University Avionic Engineering Center Beechcraft
Barron The system included both IR and visible spectra
cameras A breadboard prototype of the Version 2 clock
was used to test the time tagging of the visible camera The
LEDs used on the clock are not suitable for IR
The cameras were triggered by a Novatel 1PPS signal
The software written for Microsoft Windows received No-
vatel position and attitude data as well as image data The
visible camera was tested and found to be off by 1 second
Software changes were made to correct this problem The
system was retested and shown to be correct Flight data
were recorded using the system When the images were
projected there were large time synchronization errors The
data for a turn were analyzed to determine if the images
matched the pose data The horizon was tracked in a number
of images to estimate the roll The estimated roll from the
Case Description
1 Incorrect Novatel Log
2 Novatel Log Error
3 DC 3 Camera System
4 DC 3 PTP System
5 Hi Rate Data Collection
6 12 frame error
7 Forward Looking EO and IR
mdashmdashmdashmdashmdashmdashmdashmdashmdashmdashmdashmdashmdashmdashmdashmdashmdashmdashmdashmdashmdashmdashmdashmdashmdashmdashmdashmdashmdashmdashmdashmdashmdashmdashmdashmdashmdashmdashmdashmdashmdashmdashmdashmdashmdashmdashndashmdashmdashmdashmdash
A DIAGNOSTIC CLOCK FOR VERIFICATION OF IMAGE TIME SYNCHRONIZATION 43
mdashmdashmdashmdashmdashmdashmdashmdashmdashmdashmdashmdashmdashmdashmdashmdashmdashmdashmdashmdashmdashmdashmdashmdashmdashmdashmdashmdashmdashmdashmdashmdashmdashmdashmdashmdashmdashmdashmdashmdashmdashmdashmdashmdashmdashmdashndashmdashmdashmdashmdash
mdashmdashmdashmdashmdashmdashmdashmdashmdashmdashmdashmdashmdashmdashmdashmdashmdashmdashmdashmdashmdashmdashmdashmdashmdashmdashmdashmdashmdashmdashmdashmdashmdashmdashmdashmdashmdashmdashmdashmdashmdashmdashmdashmdashmdashmdashndashmdashmdashmdashmdash
44 INTERNATIONAL JOURNAL OF ENGINEERING RESEARCH AND INNOVATION | V11 N1 SPRINGSUMMER 2019
images was correlated with the IMU roll The time error of
the images was determined to be 14 seconds This shows
how buffering or other issues can cause problems The pro-
ject was shelved due to a failure of the IR camera and the
issue was never resolved
Conclusions
A GPS synchronized clock was described The purpose of
the clock was to measure time synchronization errors in an
aerial surveillance system Using the clock a precise GPS
time could be extracted from the image The image time
was compared to the pose time to determine the time error
Any time errors will create projection errors With this in-
formation corrective action can be taken The clock de-
scribed in this paper was Version 2 All of the shortcomings
in Version 1 were corrected The clock is lightweight in-
tensely bright powered by AC or batteries and includes test
features and diagnostics A detailed analysis of the timing
error between the clock and a reference receiver showed
that the resolution of the clock was 1 ms while the accuracy
was better than 01 ms If the exposure time increased the
clock was still valid but the resolution was reduced
The camera integration time impacted the clock readings
If the camera integration was longer than 1 ms the least
significant bit would appear as on with a 50 duty cycle
This was tested and the clock was still valid but the resolu-
tion was reduced For best results the minimum integration
time that allows reading the LEDs should be used A num-
ber of case studies were used to illustrate the utility of the
clock These case studies illustrate the types of errors that
can be encountered and how corrective action can be taken
once the errors are discovered The clock presented here
was for visible light There was also a need for time verifi-
cation of infrared (IR) image data The clock could easily be
converted to cover shortwave IR images simply by using IR
LEDs This becomes more complex at longer wavelengths
A number of schemes are being considered for wavelengths
up to 8 microm Additional information about the clock and on-
going work is available from the author
References
Allied Vision (2016) Application note IEEE 1588
precision time protocol prosilica GT GC and manta
cameras Vancouver British Columbia Canada Allied
Vision
Arduino (2017) Arduino Mega 2650 Retrieved from
httpwwwarduinoorgproductsboardsarduino-mega-
2560
Bryant M Johnson P Kent B M Nowak M amp
Rogers S R (2008) Layered sensing Its definition
attributes and guiding principles for AFRL strategic
technology development Wright-Patterson Air Force
Base OH Sensors Directorate Air Force Research
Laboratory
Cohenour C Price R Rovito T amp van Graas F (2015)
Camera models for the Wright Patterson Air Force
Base (WPAFB) 2009 wide area motion imagery
(WAMI) data set IEEE Aerospace amp Electronic
Systems Magazine 30(6) 4-15
Cohenour C Price R Rovito T amp van Graas F (2015)
Corrected pose data for the Wright Patterson Air Force
Base (WPAFB) 2009 wide area motion imagery
(WAMI) data set SPIE Journal of Applied Remote
Sensing 9(1) 4-15
Dewar M amp Stevens B (2012) Ordering block designsmdash
Gray codes universal cycles and configuration New
York Springer
Di K amp Li R (2004) CAHVOR camera model and its
photogrammetric conversion for planetary applications
Journal of Geophysical Research 109(E04004) 1-9
Ersoy I Palaniappan K Seetharaman G S amp Rao R
M R (2012) Interactive target tracking for persistent
wide-area surveillance Interactive target tracking for
persistent wide-area surveillance Proceedings of SPIE
Conference on Geospatial InfoFusion II Bellingham
WA SPIE doi 10111712920815
IEEE (2008) IEEE standard for a precision clock
synchronization protocol for networked measurement
and control systems Retrieved from http
standardsieeeorg
Kaplan E D (1996) Understanding GPS Principles and
applications Boston Artech House
McCarthy D amp Seidelmann K (2009) Time From earth
rotation to atomic physics Weinheim Germany Wiley-
VCH
Miller I amp Freund J (1977) Probability and statistics for
engineers Englewood Cliffs NJ Prentice-Hall
NovAtel (2015) OEM6 family firmware reference manual
OM-20000129 rev 8 Calgary Alberta Canada
NovAtel
Texas Instruments (2016) SN74LS07 hex buffers and
drivers with open-collector high-voltage outputs
Dallas Texas Instruments
Time Service Dept (nd) Leap seconds Retrieved from
httptychousnonavymilleapsechtml
Tsai R Y (1987) A versatile camera calibration technique
for high-accuracy 3d machine vision metrology using
off-the shelf tv cameras and lenses IEEE Journal of
Robotics and Automation RA-3(4) 323-344
Wolf P R (1974) Elements of photogrammetry New
York McGraw-Hill
mdashmdashmdashmdashmdashmdashmdashmdashmdashmdashmdashmdashmdashmdashmdashmdashmdashmdashmdashmdashmdashmdashmdashmdashmdashmdashmdashmdashmdashmdashmdashmdashmdashmdashmdashmdashmdashmdashmdashmdashmdashmdashmdashmdashmdashmdashndashmdashmdashmdashmdash
Biography
CURTIS COHENOUR is an assistant professor in the
Ohio University Engineering Technology and Management
Department He received his BS degree from West Virginia
Institute of Technology in 1980 MS degree from Ohio Uni-
versity in 1988 and PhD in electrical engineering from
Ohio University in 2009 He is a registered professional
engineer in West Virginia and Ohio Dr Cohenour has
worked in industry as an electrical engineer in the areas of
control systems automation and power He joined Ohio
University in 2002 as a research engineer working for the
Ohio University Avionics Engineering Center He has
worked on projects covering a wide variety of avionics and
navigation systems such as the instrument landing system
microwave landing system distance measuring equipment
LAAS WAAS and GPS His recent work has included
research with the Air Force Research Laboratory in Dayton
Ohio aimed at understanding and correcting image geo-
registration errors from a number of airborne platforms Dr
Cohenour may be reached at cohenourohioedu
mdashmdashmdashmdashmdashmdashmdashmdashmdashmdashmdashmdashmdashmdashmdashmdashmdashmdashmdashmdashmdashmdashmdashmdashmdashmdashmdashmdashmdashmdashmdashmdashmdashmdashmdashmdashmdashmdashmdashmdashmdashmdashmdashmdashmdashmdashndashmdashmdashmdashmdash
A DIAGNOSTIC CLOCK FOR VERIFICATION OF IMAGE TIME SYNCHRONIZATION 45
ASSESSING THE EFFECTIVENESS OF AN AUTOMATIC
DOOR LOCK SYSTEM BY DISCHARGE DETECTION
TO LOWER CASUALTIES DURING AN ACADEMIC
ACTIVE SHOOTER INCIDENT mdashmdashmdashmdashmdashmdashmdashmdashmdashmdashmdashmdashmdashmdashmdashmdashmdashmdashmdashmdashmdashmdashmdashmdashmdashmdashmdashmdashmdashmdashmdashmdashmdashmdashmdashmdashmdashmdashmdashmdashmdashmdashmdashmdashmdashmdashndashmdashmdashmdashmdash
Jae Yong Lee Purdue University James Eric Dietz Purdue University
Abstract
The 2018 Stoneman Douglas High School (Parkland)
shooting emphasized the importance of testing active shoot-
er responses for both first-responder communities and the
general public Since the 1999 Columbine massacre the
preparedness for active shooter incidents (ASIs) included
aggressive police tactical responses to neutralize the shoot-
ing threat Currently the runhidefight response for un-
armed individuals has been implemented as part of the ac-
tive shooter response for both the public and private sectors
However despite the RHFrsquos nationwide implementation
there are few studies in the literature to support the effec-
tiveness of RHF Additionally modeling a scenario similar
to the Parkland shooting suggests that the application of
RHF without situational awareness of the shooterrsquos location
could cause higher casualty rates by an average of more
than 126 individuals
In this study the authors compared the casualty rates of
two models The first model consisted only of hide (shelter-
in-place) and run (evacuate) The second model applied the
first modelrsquos components with the automatic door lock sys-
tem which was triggered by discharge detection To ex-
clude human participation and to prevent physiological and
psychological impact agent-based modeling (ABM) was
used to recreate a one-story academic infrastructure with 26
lecture halls and three exits containing 600 unarmed indi-
viduals The flexibility of ABM allows multiple iterations
while manipulating various parameters The ABM approach
in active shooter research also eliminates human error and
logistical issues The outcome of this study evaluates the
effectiveness of an automated door lock system based on
firearm discharge detection with a campus-wide alert sys-
tem to conduct lockdown
Introduction
The term active shooter incident (ASI) may be a familiar
term for the general public Federal Bureau of Investigation
(2016) statistics suggest that the number of active shooter
incidents has risen from 74 (2000-2008) to 191 (2009-
2016) incidents per year Additionally 456 of the active
shooter incidents occur in areas of commerce and 244 in
educational institutions Finally 60 of ASIs were termi-
nated prior to the arrival of law enforcement The increasing
rate of active shooter incidents in the areas of commerce
and educational institutions with short duration challenges
the first responder and the civilian communities to mitigate
such incidents
Law enforcement communities have applied mitigation
tactics such as unified incident command system (FEMA
2017) hosting school resource officers (Scott amp Schwartz
2014) and the formation of contact teams (Scott amp
Schwartz 2014) to mitigate such incidents The most com-
mon ASI response for the civilian population in both private
and public sectors was ldquorunhidefightrdquo (RHF) (City of Hou-
ston 2012) The RHF response was created in 2012 by the
City of Houston under the Federal Emergency Management
Agencyrsquos grant Yet despite the nationwide application of
RHF there is a lack of literature supporting the effective-
ness of RHF to lower casualties during ASIs Additionally
RHF cannot be applied in areas where the unarmed individ-
uals are incapable of fighting the active shooter such as
kindergarten or elementary schools In this study the au-
thors examined the casualty rates of two models The first
model represented an academic infrastructure without any
preventative system The second model applied an automat-
ed door lock system to the first model which was initiated
by the active shootersrsquo first discharge A campus-wide lock-
down was automatically conducted among unarmed individ-
ual agents The door lock system only prevented entry to the
lecture hall which allowed individuals to evacuate the lec-
ture hall Only run and hide were implemented in both mod-
els since they assumed that the majority of unarmed indi-
vidual agents were either kindergarten or elementary school
students who were limited in their ability to fight the shoot-
er
Agent-Based Model
AnyLogic software consists of three major components
discrete event agent-based and system dynamic methods
mdashmdashmdashmdashmdashmdashmdashmdashmdashmdashmdashmdashmdashmdashmdashmdashmdashmdashmdashmdashmdashmdashmdashmdashmdashmdashmdashmdashmdashmdashmdashmdashmdashmdashmdashmdashmdashmdashmdashmdashmdashmdashmdashmdashmdashmdashndashmdashmdashmdashmdash
46 INTERNATIONAL JOURNAL OF ENGINEERING RESEARCH AND INNOVATION | V11 N1 SPRINGSUMMER 2019
mdashmdashmdashmdashmdashmdashmdashmdashmdashmdashmdashmdashmdashmdashmdashmdashmdashmdashmdashmdashmdashmdashmdashmdashmdashmdashmdashmdashmdashmdashmdashmdashmdashmdashmdashmdashmdashmdashmdashmdashmdashmdashmdashmdashmdashmdashndashmdashmdashmdashmdash
that could be used interchangeably For this study the agent
-based method was used predominantly to recreate active
shooter incidents within the educational environment The
model consists of pedestrian and process modeling libraries
which recreates the interaction between an active shooter
and the unarmed individual agents within the model
The benefits of ABM were its ability to measure emergent
phenomena and collect individual agentrsquos interaction with
other agents Additionally ABM can illustrate ldquobehavior
degree of rationality and ability to learn and
evolverdquo (Bonabeau 2002) which was a crucial component
in measuring the cause and effect of hypothesizing what
increased or decreased the casualty rate Finally using
ABM allows active shooter research to be conducted in a
safe environment by eliminating the participantsrsquo potential
to experience post-traumatic stress disorder or other anxie-
ties (DHS 2017) Both models were based on a general
floor plan for an academic institution which was available
in the public domain as a visual aid intended to support the
emergency evacuation plans The floor plan included class-
rooms and hallway corridors which were converted to an
image file and added to the AnyLogic software
Model Physical Infrastructure
The Wall Target Line Service with Lines and Polygonal
Area from the Space Markup section in the Pedestrian Li-
brary were used to model the physical infrastructure The
wall creates a physical barrier within the model which lim-
its the agentrsquos movement For example if a wall is encoun-
tered by an agent within the model the agent seeks alterna-
tive routes by moving away from the obstacle The service
with lines section can send an agent through the wall which
represents an agent passing through the doorway The po-
lygonal area represents lecture hall seats where the agents
remain in one location for the duration of the class Each
lecture hall consists of one attractor as a point of gathering
during the lockdown phase
Model Agents
There were two agents in this model an active shooter
and the unarmed individuals State Configuration ndash Line of
Sight (LOS) and State Configuration ndash Casualty Each agent
carries different states in order to add flexibility to what an
agent can and cannot do depending on the location For
example just because an active shooterrsquos discharge range is
set to 100 feet does not mean that the shooter is capable of
selecting targets through the wall of the lecture hall or
agents in a different hallway section To limit target selec-
tion of the shooter line of sight (LOS) was modeled by
placing agents into different states depending on the loca-
tion In Figure 1 the agentrsquos state under green LOS is col-
ored purple
Figure 1 The change of agentrsquos state by location
Once the agent enters the light blue LOS the agentrsquos state
and color change to cyan Additionally an agent could be
under both green and blue LOS if two areas are merging
Both agents operate under this concept in order to limit tar-
get selection probability based on the physical location
such as hallways or lecture halls The active shooter selects
the target by using a Function within the Agent Library
Each function is coded in Java which selects the shooter
target based on the LOS state followed by the discharge
range One target could be selected per search where the
rate of each search was set to one target within a 212-
second interval Anklam Kirby Sharevski and Dietz
(2015) used the victim interval ratio by the statistics from
the Patrol Response Challenges (Buster 2008) where there
was one victim every 15 seconds by averaging the 65 active
shooter incidents to the number of victims For this study
the shooter casualty interval was based on the Parkland
Shooting (Fausset Kovaleski amp Mazzei 2018) by as-
sessing total death count and the duration of the shooting
The Java function was divided into three sections The
first section was the target selection among the agentrsquos pop-
ulation For instance the shooter searches for one target
among the pool of unarmed individual agents The second
section of the function entails determining the state of the
potential target agent If an agentrsquos state was a casualty
then the function starts over to find a new target If the
agentrsquos state was not a casualty then the function deter-
mines whether the target was within the same LOS state as
mdashmdashmdashmdashmdashmdashmdashmdashmdashmdashmdashmdashmdashmdashmdashmdashmdashmdashmdashmdashmdashmdashmdashmdashmdashmdashmdashmdashmdashmdashmdashmdashmdashmdashmdashmdashmdashmdashmdashmdashmdashmdashmdashmdashmdashmdashndashmdashmdashmdashmdash
ASSESSING THE EFFECTIVENESS OF AN AUTOMATIC DOOR LOCK SYSTEM BY DISCHARGE DETECTION 47
TO LOWER CASUALTIES DURING AN ACADEMIC ACTIVE SHOOTER INCIDENT
mdashmdashmdashmdashmdashmdashmdashmdashmdashmdashmdashmdashmdashmdashmdashmdashmdashmdashmdashmdashmdashmdashmdashmdashmdashmdashmdashmdashmdashmdashmdashmdashmdashmdashmdashmdashmdashmdashmdashmdashmdashmdashmdashmdashmdashmdashndashmdashmdashmdashmdash
mdashmdashmdashmdashmdashmdashmdashmdashmdashmdashmdashmdashmdashmdashmdashmdashmdashmdashmdashmdashmdashmdashmdashmdashmdashmdashmdashmdashmdashmdashmdashmdashmdashmdashmdashmdashmdashmdashmdashmdashmdashmdashmdashmdashmdashmdashndashmdashmdashmdashmdash
48 INTERNATIONAL JOURNAL OF ENGINEERING RESEARCH AND INNOVATION | V11 N1 SPRINGSUMMER 2019
the shooter If the shooter and the unarmed individual were
in the same state then the function evaluates the discharge
range If the potential target does not qualify under either
state the function restarts The third section of the function
executes the act of firearm discharge to the targeted agent
The exchange of fire was modeled by sending a string mes-
sage to the targeted agent The probability of a failed mes-
sage delivery was zero since the execution would occur
immediately Once the message has been received then the
state of the target agent will change to casualty and the
speed of the agent will be set to zero and the color to red
The agentrsquos movement was conducted by the following
blocks from the pedestrian library PedSource PedGoTo
PedService and PedSink PedSource determines the agent
and the rate of entry from the agent to the model For this
model there were two PedSource blocks one for an active
shooter and the other for the unarmed individual agents
TargetLine was used as an entry point which was deter-
mined within the PedSource block Once the agent exits the
model by the PedSource block the agent enters the PedSer-
vice block which allows the agent to enter the lecture hall
The PedService block prohibits the agent from traveling
through the wall which represents a door Each lecture hall
consists of a polygonal area where the agent waits through-
out the model runtime Figure 2 shows how the agentrsquos state
was changed from green to either purple or yellow based on
their location
Figure 2 The change of an agentrsquos state by location
Agents Logic
All 600 unarmed individual (UI) agents enter the model
and move randomly toward the available lecture hall Once
an agent arrives in a lecture hall it will remain at the ran-
domly selected point until the shooting begins Prior to the
shooting all 600 UI agents are distributed within the lecture
halls no UI agents remained in the hallway
The active shooter enters the model without discharging
and continues to advance down the hallway until the in-
class population count reaches 600 Once all 600 UI agents
are in the lecture hall the shooter immediately begins to
discharge UI casualties will always occur in the lecture
hall The shooterrsquos discharging function is set to one casual-
ty per 212 seconds for UI agents that are in range If there
are zero potential targets within the range the 212-second
delays starts over Once the active shooter agent begins
shooting the UI agents will then evacuate to the nearest
exit The shooter will attempt to randomly enter a lecture
hall one after another while running UI agents in the hall-
way are considered as potential targets If the automatic
door lock system is in place the shooter will remain in the
hallway until the model is terminated while having the
same ability to discharge at the running UI agents
The automatic door lock system begins as soon as the
active shooter discharges the first shot The lock system
prevents the active shooter from entering the lecture halls
while still allowing any UI agents inside to evacuate via the
hallway The shooterrsquos discharge initiates the unarmed indi-
vidual agents to either hide (shelter-in-place) or run
(evacuate) from the shooter The hide probability parameter
determines what percentage of UI agents will hide while
the rest will run from the shooter Table 1 shows that if the
hide probability is set to 20 then the remaining 80 will
run toward the nearest exit after exiting the designated lec-
ture hall
Table 1 Hide and run probability parameter manipulation per
iteration
Model Runtime Properties Limitations
and Iterations by Parameter Manipulation
bull The duration of the model was limited to six minutes
which was equivalent to the Parkland Shooting event
(Fausset et al 2018)
bull The casualty rate was limited to one casualty per 212
seconds by the active shooter again based on the
Parkland Shooting event (Fausset et al 2018)
bull The target selection began once all 600 unarmed indi-
viduals entered the lecture halls which limited the
first casualty to occur only in the lecture hall
bull If there were no potential target within the first 212
seconds the shooter required an additional 212 sec-
onds to select another target
Iteration 1 2 3 4 5 6 7 8 9 10 11
Hide 0 1 2 3 4 5 6 7 8 9 1
Run 1 9 8 7 6 5 4 3 2 1 0
mdashmdashmdashmdashmdashmdashmdashmdashmdashmdashmdashmdashmdashmdashmdashmdashmdashmdashmdashmdashmdashmdashmdashmdashmdashmdashmdashmdashmdashmdashmdashmdashmdashmdashmdashmdashmdashmdashmdashmdashmdashmdashmdashmdashmdashmdashndashmdashmdashmdashmdash
bull The unarmed individuals who were hiding in the
lecture hall could not attempt to escape if the shooter
entered the lecture hall
To allow for position and time variation each hide pa-
rameter was run 100 times and measured the following out-
put data
bull Hide parameter (Double)
bull Run parameter (Double)
bull Number of unarmed individuals in the lecture hall
(Integer)
bull Number of unarmed individuals in the hallway
(Integer)
bull Number of unarmed individual casualties (Integer)
bull Number of unarmed individuals who successfully
evacuated (Integer)
bull Number of lecture hall casualties of unarmed individ-
uals (Integer)
Results
Figure 3 suggests a highest average total casualty rate of
943 of 600 (157) where 20 hid and 80 ran to the
nearest exit The lowest average total casualty rate was 423
of 600 (071) where all unarmed individual agents were
seeking shelter within the lecture halls The highest average
hallway casualty rate was 524 of 600 (087) with 80
hide probability where the lowest rate was 360 of 600
(06) with 0 hide probability The highest average lec-
ture hall casualty rate was 479 of 600 (079) with 10
hide probability with the lowest at 0 of 600 (0) with 100
hide probability
Figure 3 Unarmed individual casualty rate by hide (shelter-in-
place) probability without immediate automatic door lock system
Figure 4 shows a comparison of the casualty rate of un-
armed individuals to the automatic door lock system by the
hide (shelter-in-place) probability
Figure 4 Unarmed individual casualty rate by hide (shelter-in-
place) probability with immediate automatic door lock system
Figure 4 suggests the lowest average casualty rate of 115
(019) was reported when all unarmed individuals hide
from the shooter with the automatic door lock mechanism in
place The highest average casualty rate was 98 (163)
where all agents had to evacuate from the lecture hall re-
gardless of the automated lock mechanism The highest
average hallway casualty rate was 647 of 600 (108) with
90 hide probability where the lowest rate was 0 of 600
(0) with 0 hide probability The highest average lecture
hall casualty rate was 381 of 600 (064) with 30 hide
probability with the lowest at 115 of 600 (019) with
100 hide probability
The locations were made up of total hallway and lecture
hall where casualty probabilities were measured based on
two parameter manipulations The first parameter was the
hide probability ranging from 0 where zero unarmed
individuals (UI) evacuated the lecture hall to 100 where
all 600 evacuated to the nearest exit The second was a
Boolean parameter which determined whether the automat-
ic door lock system was in place or not The total casualty
probabilities were calculated by dividing the total number of
casualties by 600 The hallway and the lecture hall casualty
probabilities were calculated by dividing the casualty rates
by the total number of either run or hide casualties For ex-
ample hallway casualty probability was calculated by di-
viding the hallway casualty rate to the total number of evac-
uees Figure 5 compares the UI agentrsquos casualty probability
without the immediate door lock system based on the
agentrsquos location of casualty
Figure 5 illustrates the total hallway and lecture hall cas-
ualty probability based on the hide parameter without the
door lock system The highest total casualty probability was
157 when 20 of unarmed individuals hid and 80 ran
to the nearest exit The lowest total casualty probability was
071 when 100 evacuated to the nearest exit The lec-
mdashmdashmdashmdashmdashmdashmdashmdashmdashmdashmdashmdashmdashmdashmdashmdashmdashmdashmdashmdashmdashmdashmdashmdashmdashmdashmdashmdashmdashmdashmdashmdashmdashmdashmdashmdashmdashmdashmdashmdashmdashmdashmdashmdashmdashmdashndashmdashmdashmdashmdash
ASSESSING THE EFFECTIVENESS OF AN AUTOMATIC DOOR LOCK SYSTEM BY DISCHARGE DETECTION 49
TO LOWER CASUALTIES DURING AN ACADEMIC ACTIVE SHOOTER INCIDENT
mdashmdashmdashmdashmdashmdashmdashmdashmdashmdashmdashmdashmdashmdashmdashmdashmdashmdashmdashmdashmdashmdashmdashmdashmdashmdashmdashmdashmdashmdashmdashmdashmdashmdashmdashmdashmdashmdashmdashmdashmdashmdashmdashmdashmdashmdashndashmdashmdashmdashmdash
mdashmdashmdashmdashmdashmdashmdashmdashmdashmdashmdashmdashmdashmdashmdashmdashmdashmdashmdashmdashmdashmdashmdashmdashmdashmdashmdashmdashmdashmdashmdashmdashmdashmdashmdashmdashmdashmdashmdashmdashmdashmdashmdashmdashmdashmdashndashmdashmdashmdashmdash
50 INTERNATIONAL JOURNAL OF ENGINEERING RESEARCH AND INNOVATION | V11 N1 SPRINGSUMMER 2019
ture hall casualty probability was the highest at 735
when 10 of the unarmed individuals evacuated The low-
est lecture hall casualty probability was 06 when every-
one sought shelter The highest hallway casualty probability
was 353 when 90 hid upon the first discharge The
lowest hallway casualty probability was 0 when 100
hid from the shooter Figure 6 compares the UI agentrsquos cas-
ualty probability with the immediate door lock system
based on the agentrsquos location of casualty
Figure 5 Unarmed individual survival probability by hide (shelter-
in-place) probability without immediate automatic door lock sys-
tem
Figure 6 Unarmed individual survival probability by hide (shelter-
in-place) probability with immediate automatic door lock system
Figure 6 illustrates the total hallway and lecture hall
casualty probability based on the hide parameter with the
door lock system The highest total casualty probability was
158 during the 10 hide probability where the lowest
probability was 019 during the 100 hide probability
The highest lecture hall casualty probability was 5 during
the 10 hide probability where the lowest lecture hall
probability was 019 for the 100 hide probability The
highest hallway casualty probability was 536 during the
90 hide probability The lowest hallway casualty probabil-
ity was 0 for the 100 hide probability Table 2 compares
the total casualty probabilities for the model with and with-
out a door lock
Table 2 Total casualty probability with and without door lock per
iteration
The overall casualty probability decreased by 026 with
the highest casualty rate decrease of 051 with all agents
sheltering in place In contrast the casualty rate increased
by 005 for the 10 hide probability Table 3 compares
the hallway casualty probabilities for the model with and
without a door lock The overall casualty probability in-
creased by 059 with the highest casualty rate increasing
by 183 when 90 sought shelter There was no decrease
in casualty probability for hallway casualties Table 4 com-
pares the lecture hall casualty probabilities for the model
with and without a door lock The overall casualty probabil-
ity decreased by 101 with the highest casualty rate de-
crease of 235 when 10 sought shelter In contrast the
casualty rate increased by 001 when all agents evacuated
Probability Total Casualty
Probability
Survival Probability
Difference
Hide Run
Without
Door
Lock
With
Door Lock
0 100 139 100 -39
10 90 153 158 05
20 80 157 148 -09
30 70 142 141 -01
40 60 134 112 -21
50 50 129 98 -31
60 40 121 94 -27
70 30 113 84 -29
80 20 126 81 -44
90 10 118 75 -44
100 0 71 19 -51
Average
Casualty
Probability
127 101 -26
mdashmdashmdashmdashmdashmdashmdashmdashmdashmdashmdashmdashmdashmdashmdashmdashmdashmdashmdashmdashmdashmdashmdashmdashmdashmdashmdashmdashmdashmdashmdashmdashmdashmdashmdashmdashmdashmdashmdashmdashmdashmdashmdashmdashmdashmdashndashmdashmdashmdashmdash
Table 3 Hallway casualty probability with and without door lock
per iteration
Table 4 Lecture hall casualty probability with and without door
lock per iteration
Conclusions
Assuming locked doors are effective at separating poten-
tial victims from the shooter this study further demonstrat-
ed the value of agent-based models to design effective poli-
cies by testing the impact of automatic door locking tech-
nology on causality rates Using this model shelter-in-place
proved to be an effective strategy for reducing the impact of
an active shooter event with the greatest reduction shown
when all individuals sought to shelter in place The imple-
mentation of an automated door lock system triggered by
discharge detection did decrease the total casualty rate an
average of 026 over 100 simulated iterations The total
lecture hall casualty rate decreased an average of 101
while the total hallway casualty rate increased by 059
While the automatic door locking system did reduce causal-
ities individuals in the hallways also saw an increase in
causalities due to limits in protection from the shooter and
evacuation paths
References
Anklam C Kirby A Sharevski F amp Dietz J (2015)
Mitigating active shooter impact analysis for policy
options based on agentcomputer-based modeling Jour-
nal of Emergency Management 13(3) Retrieved from
httpswwwwmpllcorgojs-242indexphpjem
articleview176
Bonabeau E (2002) Agent-based modeling Methods and
techniques for simulating human systems Proceedings
of the National Academy of Sciences 99(suppl 3)
7280-7287
Buster C (2008) Patrol response challenge NCJRS Law
and Order 56(6) 62-68
City of Houston (2012) RunHideFightmdashReady Houston
Retrieved from httpreadyhoustonwpenginecom
suspicious-activityrun-hide-fight
Department of Homeland Security [DHS] (2017) Active
shooter recovery guide Retrieved from https
wwwdhsgovsitesdefaultfilespublicationsactive-
shooter-recovery-guide-08-08-2017-508pdf
Fausset R Kovaleski S amp Mazzei P (2018) On a day
like any other at a Florida school 6 minutes of death
and chaos The New Y ork Times Retrieved
from httpswwwnytimescom20180216us
stoneman-douglas-shootinghtml
Federal Bureau of Investigation (2016) Quick look 220
Active shooter incidents in the United States between
2000-2016 FBI Retrieved from httpswwwfbigov
aboutpartnershipsoffice-of-partner-engagementactive
-shooter-incidents-graphics
Probability Total Casualty
Probability
Survival Probability
Difference
Hide Run Without
Door Lock
With
Door Lock
0 100 79 102 23
10 90 89 120 31
20 80 96 131 35
30 70 87 111 23
40 60 88 129 40
50 50 101 151 50
60 40 122 180 58
70 30 125 211 86
80 20 192 308 116
90 10 353 536 183
100 0 0 0 0
Average
Casualty
Probability
121 180 59
Probability Total Casualty
Probability
Survival Probability
Difference
Hide Run Without
Door Lock
With
Door Lock
0 100 60 61 01
10 90 735 500 -235
20 80 402 218 -184
30 70 317 212 -106
40 60 203 88 -114
50 50 157 45 -111
60 40 120 37 -83
70 30 107 29 -78
80 20 109 25 -85
90 10 92 23 -69
100 0 71 19 -51
Average
Casualty
Probability
216 114 -101
mdashmdashmdashmdashmdashmdashmdashmdashmdashmdashmdashmdashmdashmdashmdashmdashmdashmdashmdashmdashmdashmdashmdashmdashmdashmdashmdashmdashmdashmdashmdashmdashmdashmdashmdashmdashmdashmdashmdashmdashmdashmdashmdashmdashmdashmdashndashmdashmdashmdashmdash
ASSESSING THE EFFECTIVENESS OF AN AUTOMATIC DOOR LOCK SYSTEM BY DISCHARGE DETECTION 51
TO LOWER CASUALTIES DURING AN ACADEMIC ACTIVE SHOOTER INCIDENT
mdashmdashmdashmdashmdashmdashmdashmdashmdashmdashmdashmdashmdashmdashmdashmdashmdashmdashmdashmdashmdashmdashmdashmdashmdashmdashmdashmdashmdashmdashmdashmdashmdashmdashmdashmdashmdashmdashmdashmdashmdashmdashmdashmdashmdashmdashndashmdashmdashmdashmdash
mdashmdashmdashmdashmdashmdashmdashmdashmdashmdashmdashmdashmdashmdashmdashmdashmdashmdashmdashmdashmdashmdashmdashmdashmdashmdashmdashmdashmdashmdashmdashmdashmdashmdashmdashmdashmdashmdashmdashmdashmdashmdashmdashmdashmdashmdashndashmdashmdashmdashmdash
52 INTERNATIONAL JOURNAL OF ENGINEERING RESEARCH AND INNOVATION | V11 N1 SPRINGSUMMER 2019
Federal Emergency Management Agency [FEMA] (2017)
Incident command system resources Retrieved from
httpswwwfemagovincident-command-system-
resources
Scott M amp Schwartz J (2014) The police response to
active shooter incidents Washington DC Police Ex-
ecutive Research Forum Retrieved from https
wwwpoliceforumorgassetsdocs
Critical_Issues_Seriesthe20police20response
20to20active20shooter20incidents202014pdf
Biographies
JAE YONG LEE is a graduate research assistant in
computer and information technology at Purdue University
He earned his BA in public relations and minor in computer
and information technology in 2017 from Purdue Universi-
ty His research interests include examining the effective-
ness of active shooter response and mitigation policies with
agent-based modeling utilizing AnyLogic Mr Lee may be
reached at jaeleepurdueedu
J ERIC DIETZ is a Professor of Computer and Infor -
mation Technology at Purdue University and the Director of
Purdue Homeland Security Institute He earned his BS and
MS degrees in chemical engineering in 1986 from Rose-
Hulman Institute of Technology and PhD in chemical engi-
neering from Purdue University He had served as Founding
Executive Director for the Indiana Department of Homeland
Security and retired Lieutenant Colonel from the US Army
Dr Dietz may be reached at jedietzpurdueedu
INSTRUCTIONS FOR AUTHORS
MANUSCRIPT FORMATTING REQUIREMENTS The INTERNATIONAL JOURNAL OF ENGINEERING
RESEARCH AND INNOVATION is an onlineprint publi-
cation designed for Engineering Engineering Technology
and Industrial Technology professionals All submissions to
this journal submission of manuscripts peer-reviews of
submitted documents requested editing changes notifica-
tion of acceptance or rejection and final publication of ac-
cepted manuscripts will be handled electronically The only
exception is the submission of separate high-quality image
files that are too large to send electronically
All manuscript submissions must be prepared in
Microsoft Word (doc or docx) and contain all figures im-
ages andor pictures embedded where you want them and
appropriately captioned Also included here is a summary of
the formatting instructions You should however review
the sample Word document on our website (httpijeriorg
formatting-guidelines) for details on how to correctly format
your manuscript The editorial staff reserves the right to edit
and reformat any submitted document in order to meet pub-
lication standards of the journal
The references included in the References section of
your manuscript must follow APA-formatting guidelines In
order to help you the sample Word document also includes
numerous examples of how to format a variety of scenarios
Keep in mind that an incorrectly formatted manuscript will
be returned to you a delay that may cause it (if accepted) to
be moved to a subsequent issue of the journal
1 Word Document Page Setup Two columns with frac14
spacing between columns top of page = frac34 bottom of
page = 1 (from the top of the footer to bottom of
page) left margin = frac34 right margin = frac34
2 Paper Title Centered at the top of the fir st page
with a 22-point Times New Roman (Bold) small-caps
font
3 Page Breaks Do not use page breaks
4 Figures Tables and Equations All figures tables
and equations must be placed immediately after the first
paragraph in which they are introduced And each must
be introduced For example ldquoFigure 1 shows the opera-
tion of supercapacitorsrdquo ldquoThe speed of light can be
determined using Equation 4rdquo
5 More on Tables and Figures Center table captions
above each table center figure captions below each
figure Use 9-point Times New Roman (TNR) font
Italicize the words for table and figure as well as their
respective numbers the remaining information in the
caption is not italicized and followed by a periodmdasheg
ldquoTable 1 Number of research universities in the staterdquo
or ldquoFigure 5 Cross-sectional aerial map of the forested
areardquo
6 Figures with Multiple Images If any given figure
includes multiple images do NOT group them they
must be placed individually and have individual minor
captions using ldquo(a)rdquo ldquo(b)rdquo etc Again use 9-point TNR
7 Equations Each equation must be numbered
placed in numerical order within the document and
introducedmdashas noted in item 4
8 Tables Graphs and Flowcharts All tables graphs
and flowcharts must be created directly in Word tables
must be enclosed on all sides The use of color andor
highlighting is acceptable and encouraged if it provides
clarity for the reader
9 Textboxes Do not use text boxes anywhere in the
document For example tablefigure captions must be
regular text and not attached in any way to their tables
or images
10 Body Fonts Use 10-point TNR for body text through-
out (18 paragraph indention) indent all new para-
graphs as per the images shown below do not use tabs
anywhere in the document 9-point TNR for author
namesaffiliations under the paper title 16-point TNR
for major section titles 14-point TNR for minor section
titles
11 Personal Pronouns Do not use personal pronouns
(eg ldquowerdquo ldquoourrdquo etc)
12 Section Numbering Do not use section number ing
of any kind
13 Headers and Footers Do not use either
mdashmdashmdashmdashmdashmdashmdashmdashmdashmdashmdashmdashmdashmdashmdashmdashmdashmdashmdashmdashmdashmdashmdashmdashmdashmdashmdashmdashmdashmdashmdashmdashmdashmdashmdashmdashmdashmdashmdashmdashmdashmdashmdashmdashmdashmdashndashmdashmdashmdashmdash
INSTRUCTIONS FOR AUTHORS MANUSCRIPT FORMATTING REQUIREMENTS 53
mdashmdashmdashmdashmdashmdashmdashmdashmdashmdashmdashmdashmdashmdashmdashmdashmdashmdashmdashmdashmdashmdashmdashmdashmdashmdashmdashmdashmdashmdashmdashmdashmdashmdashmdashmdashmdashmdashmdashmdashmdashmdashmdashmdashmdashmdashndashmdashmdashmdashmdash
mdashmdashmdashmdashmdashmdashmdashmdashmdashmdashmdashmdashmdashmdashmdashmdashmdashmdashmdashmdashmdashmdashmdashmdashmdashmdashmdashmdashmdashmdashmdashmdashmdashmdashmdashmdashmdashmdashmdashmdashmdashmdashmdashmdashmdashmdashndashmdashmdashmdashmdash
54 INTERNATIONAL JOURNAL OF ENGINEERING RESEARCH AND INNOVATION | V11 N1 SPRINGSUMMER 2019
14 References in the Abstract Do NOT include any
references in the Abstract
15 In-Text Referencing For the fir st occur rence of a
given reference list all authorsmdashlast names onlymdashup
to seven (7) if more than seven use ldquoet alrdquo after the
seventh author For a second citation of the same refer-
encemdashassuming that it has three or more authorsmdashadd
ldquoet alrdquo after the third author Again see the sample
Word document and the formatting guide for references
for specifics
16 More on In-Text References If you include a refer -
ence on any table figure or equation that was not cre-
ated or originally published by one or more authors on
your manuscript you may not republish it without the
expressed written consent of the publishing author(s)
The same holds true for name-brand products
17 End-of-Document References Section List all refer -
ences in alphabetical order using the last name of the
first authormdashlast name first followed by a comma and
the authorrsquos initials Do not use retrieval dates for web-
sites
18 Author Biographies Include biographies and cur -
rent email addresses for each author at the end of the
document
19 Page Limit Manuscr ipts should not be more than
15 pages (single-spaced 2-column format 10-point
TNR font)
20 Page Numbering Do not use page numbers
21 Publication Charges Manuscr ipts accepted for pub-
lication are subject to mandatory publication charges
22 Copyright Agreement A copyr ight transfer agree-
ment form must be signed by all authors on a given
manuscript and submitted by the corresponding author
before that manuscript will be published Two versions
of the form will be sent with your manuscriptrsquos ac-
ceptance email
Only one form is required Do not submit both forms
The form named ldquopaperrdquo must be hand-signed by each
author The other form ldquoelectronicrdquo does not require
hand signatures and may be filled out by the corre-
sponding author as long as heshe receives written per-
mission from all authors to have himher sign on their
behalf
23 Submissions All manuscr ipts and required files and
forms must be submitted electronically to Dr Philip D
Weinsier manuscript editor at philipwbgsuedu
24 Published Deadlines Manuscr ipts may be submit-
ted at any time during the year irrespective of pub-
lished deadlines and the editor will automatically have
your manuscript reviewed for the next-available issue
of the journal Published deadlines are intended as
ldquotargetrdquo dates for submitting new manuscripts as well
as revised documents Assuming that all other submis-
sion conditions have been met and that there is space
available in the associated issue your manuscript will
be published in that issue if the submission processmdash
including payment of publication feesmdashhas been com-
pleted by the posted deadline for that issue
Missing a deadline generally only means that your
manuscript may be held for a subsequent issue of the
journal However conditions exist under which a given
manuscript may be rejected Always check with the
editor to be sure Also if you do not complete the sub-
mission process (including all required revisions) with-
in 12 months of the original submission of your manu-
script your manuscript may be rejected or it may have
to begin the entire review process anew
INTERNATIONAL JOURNAL OF
MODERN ENGINEERING
THE LEADING JOURNAL OF ENGINEERING APPLIED SCIENCE AND TECHNOLOGY
Mark Rajai PhD
Editor-in-Chief California State University-Northridge College of Engineering and Computer Science Room JD 4510 Northridge CA 91330 Office (818) 677-5003 Email mrajaicsunedu
Contact us
wwwiajcorg wwwijmeus
wwwtiijorg
wwwijeriorg
Print ISSN 2157-8052
Online ISSN 1930-6628
TO JOIN THE REVIEW BOARD
bull The International Journal of Engineering Research and
Innovation (IJERI)
For more information visit wwwijeriorg
bull The Technology Interface International Journal (TIIJ)
For more information visit wwwtiijorg
OTHER IAJC JOURNALS
bull Manuscripts should be sent electronically to
the manuscript editor Dr Philip Weinsier
at philipwbgsuedu
For submission guidelines visit
wwwijmeussubmissions
IJME SUBMISSIONS
bull Contact the chair of the International
Review Board Dr Philip Weinsier at
philipwbgsuedu
For more information visit
wwwijmeusijme_editorialhtm
bull IJME was established in 2000 and is the first and
official flagship journal of the International
Association of Journal and Conferences (IAJC)
bull IJME is a high-quality independent journal steered by
a distinguished board of directors and supported by an
international review board representing many well-
known universities colleges and corporations in the
US and abroad
bull IJME has an impact factor of 300 placing it among
the top 100 engineering journals worldwide and is the
1 visited engineering journal website (according to
the National Science Digital Library)
ABOUT IJME
INDEXING ORGANIZATIONS
bull IJME is indexed by numerous agencies
For a complete listing please visit us at
wwwijmeus
SPRINGSUMMER 2009
VOLUME 1 NUMBER 1
IJERI Contact Information
General questions or inquiries about sponsorship of the journal should be directed to
Mark Rajai PhD
Founder and Editor-In-Chief
Office (818) 677-5003
Email editorijeriorg
Department of Manufacturing Systems Engineering amp Management
California State University-Northridge
18111 Nordhoff St
Room JD3317
Northridge CA 91330
The International Journal of Engineer-
ing Research amp Innovation (IJERI) is
the second official journal of the Inter-
national Association of Journals and
Conferences (IAJC) IJERI is a highly-
selective peer-reviewed print journal
which publishes top-level work from all
areas of engineering research innova-
tion and entrepreneurship
IJERI

INTERNATIONAL JOURNAL OF
ENGINEERING RESEARCH AND INNOVATION
CUTTING EDGE JOURNAL OF RESEARCH AND INNOVATION IN ENGINEERING
Mark Rajai PhD
Editor-in-Chief California State University-Northridge College of Engineering and Computer Science Room JD 4510 Northridge CA 91330 Office (818) 677-5003 Email mrajaicsunedu
Contact us
wwwiajcorgwwwijeriorg
wwwijmeus wwwtiijorg
Print ISSN 2152-4157
Online ISSN 2152-4165
bull Manuscripts should be sent electronically to
the manuscript editor Dr Philip Weinsier
at philipwbgsuedu
For submission guidelines visit
wwwijeriorgsubmissions
IJERI SUBMISSIONS
bull The International Journal of Modern Engineering (IJME)
For more information visit wwwijmeus
bull The Technology Interface International Journal (TIIJ)
For more information visit wwwtiijorg
OTHER IAJC JOURNALS
bull Contact the chair of the International
Review Board Dr Philip Weinsier at
philipwbgsuedu
For more information visit
wwwijeriorgeditorial
a TO JOIN THE REVIEW BOARD
bull IJERI is the second official journal of the International
Association of Journals and Conferences (IAJC)
bull IJERI is a high-quality independent journal steered by
a distinguished board of directors and supported by an
international review board representing many well-
known universities colleges and corporations in the
US and abroad
bull IJERI has an impact factor of 158 placing it among
an elite group of most-cited engineering journals
worldwide
ABOUT IJERI
INDEXING ORGANIZATIONS
bull IJERI is indexed by numerous agencies
For a complete listing please visit us at
wwwijeriorg
mdashmdashmdashmdashmdashmdashmdashmdashmdashmdashmdashmdashmdashmdashmdashmdashmdashmdashmdashmdashmdashmdashmdashmdashmdashmdashmdashmdashmdashmdashmdashmdashmdashmdashmdashmdashmdashmdashmdashmdashmdashmdashmdashmdashmdashmdashmdashmdashmdashmdash
mdashmdashmdashmdashmdashmdashmdashmdashmdashmdashmdashmdashmdashmdashmdashmdashmdashmdashmdashmdashmdashmdashmdashmdashmdashmdashmdashmdashmdashmdashmdashmdashmdashmdashmdashmdashmdashmdashmdashmdashmdashmdashmdashmdashmdashmdashndashmdashmdashmdashmdash
INTERNATIONAL JOURNAL OF ENGINEERING RESEARCH AND INNOVATION
INTERNATIONAL JOURNAL OF ENGINEERING
RESEARCH AND INNOVATION The INTERNATIONAL JOURNAL OF ENGINEERING RESEARCH AND
INNOVATION (IJERI) is an independent and not-for-profit publication which
aims to provide the engineering community with a resource and forum for scholar-
ly expression and reflection
IJERI is published twice annually (fall and spring issues) and includes peer-
reviewed research articles editorials and commentary that contribute to our un-
derstanding of the issues problems and research associated with engineering and
related fields The journal encourages the submission of manuscripts from private
public and academic sectors The views expressed are those of the authors and do
not necessarily reflect the opinions of the IJERI editors
EDITORIAL OFFICE
Mark Rajai PhD
Editor-in-Chief
Office (818) 677-2167
Email ijmeeditoriajcorg
Dept of Manufacturing Systems
Engineering amp Management
California State University-
Northridge
18111 Nordhoff Street
Northridge CA 91330-8332
THE INTERNATIONAL JOURNAL OF ENGINEERING
RESEARCH AND INNOVATION EDITORS
Editor-in-Chief
Mark Rajai
California State University-Northridge
Associate Editors
Paul Wilder
Vincennes University
Li Tan
Purdue University North Central
Production Editor
Philip Weinsier
Bowling Green State University-Firelands
Subscription Editor
Morteza Sadat-Hossieny
Northern Kentucky University
Web Administrator
Saeed Namyar
Advanced Information Systems
Manuscript Editor
Philip Weinsier
Bowling Green State University-Firelands
Copy Editors
Li Tan
Purdue University North Central
Ahmad Sarfaraz
California State University-Northridge
Technical Editors
Marilyn Dyrud
Oregon Institute of Technology
Publisher
Bowling Green State University Firelands
Editorrsquos Note Academic Active-Shooter Incidents 3
Philip Weinsier IJERI Manuscript Editor
Analyzing Response Communication Mitigation Methods through Simulation Modeling 5
Katherine E Reichart Purdue University Anna R Larson Purdue University
Kristal K Smith Purdue University J Eric Dietz Purdue University
Developing an Open Source Inexpensive Large-Scale Polar Configuration 3D Printer 13
Sourabh Prashant Deshpande University of Cincinnati Shrinivas Kulkarni Michigan Technological University
Sid Shah Michigan Technological University John Irwin Michigan Technological University
A Comparative Study of the Thermal Efficiency of Solar Vacuum-Tube versus Flat-Plate Collectors
for Water Heating Systems 23
SV Vishnu Samudrala Zimmer Biomet Ahmed ElSawy Tennessee Technological University
Mohan Rao Tennessee Technological University Stephen Idem Tennessee Technological University
Design and Development of a GUI for RF Communications 30
Ehsan Sheybani University of South Florida Giti Javidi University of South Florida
A Diagnostic Clock for Verification of Image Time Synchronization 37
Curtis Cohenour Ohio University
Assessing the Effectiveness of an Automatic Door Lock System by Discharge Detection to Lower
Casualties during an Academic Active Shooter Incident 46
Jae Yong Lee Purdue University James Eric Dietz Purdue University
Instructions for Authors Manuscript Formatting Requirements 53
mdashmdashmdashmdashmdashmdashmdashmdashmdashmdashmdashmdashmdashmdashmdashmdashmdashmdashmdashmdashmdashmdashmdashmdashmdashmdashmdashmdashmdashmdashmdashmdashmdashmdashmdashmdashmdashmdashmdashmdashmdashmdashmdashmdashmdashmdashndashmdashmdashmdashmdash
mdashmdashmdashmdashmdashmdashmdashmdashmdashmdashmdashmdashmdashmdashmdashmdashmdashmdashmdashmdashmdashmdashmdashmdashmdashmdashmdashmdashmdashmdashmdashmdashmdashmdashmdashmdashmdashmdashmdashmdashmdashmdashmdashmdashmdashmdashndashmdashmdashmdashmdash
INTERNATIONAL JOURNAL OF ENGINEERING RESEARCH AND INNOVATION | V11 N1 SPRINGSUMMER 2019
TABLE OF CONTENTS
Philip Weinsier IJERI Manuscript Editor
mdashmdashmdashmdashmdashmdashmdashmdashmdashmdashmdashmdashmdashmdashmdashmdashmdashmdashmdashmdashmdashmdashmdashmdashmdashmdashmdashmdashmdashmdashmdashmdashmdashmdashmdashmdashmdashmdashmdashmdashmdashmdashmdashmdashmdashmdashmdashmdashmdashmdashmdashndashmdashmdashmdashmdash
IN THIS ISSUE (P46)
ACADEMIC ACTIVE-SHOOTER INCIDENTS
So many of our children have experienced violent
deaths in our nationrsquos schools the one place we would
like to think where our children will be safe outside of
their homes Yet anyone listening to the news since the
inventions of radio and TV are hearing otherwise By
any measure and regardless of the sourcemdashthe National
Education Association (NEA) the American Federation
of Teachers (AFT) Everytown (for gun safety) K12ac-
ademics CNNmdashtoo many of our children have lost
their lives in school shootings Due to media attention
TV viewers can be forgiven if they perceive school
shootings as a relatively new phenomenonmdash15 events
in 2019 alone 39 between 2010 and 2018 and another
147 deaths between 2000 and 2010 But according to
these same sources there were another 98 incidents go-
ing back to 1764 In that first recorded event nine of the
11 children and the schoolmaster were shot and killed
Mass school shootingsmdashas if it should make a differ-
ence how many children are slaughtered even one
should be cause for national concern and federal ac-
tionmdashcomprise only 1 of school gun violence inci-
dents while logging 28 of the total number of deaths
But lest we think that all of these shootings were perpe-
trated by crazed current or former students (40) or
facultystaff or resource officers it should be noted that
44 are actually suicides and attempted suicides unin-
tentional shootings and legal interventions not sure
what that last category is At least in New York 79 of
active-shooter incidents in schools were perpetrated by
a school-aged student (and a current or recent graduate
of the school)
The next question that we all ask is where are these
children getting their guns As the vast majority of
these shooters are under 18 they are not buying the
guns themselves (at least not legally) Evidence suggests
that 78 of them get their weapons from their own
homes or those of friends and relatives So far all one
can say is that there is a problem a problem that has
myriad facets Given that government irrespective of
your opinion of the current administration is either in-
capable or simply not doing enough on its end to miti-
gate the problem society is trying to find its own solu-
tions Instead of getting guns out of the hands of poten-
tial shootersmdashone facet of the problem that our elected
officials will argue ad nauseam without effective re-
sultsmdashthere are many researchers working on scenarios
to keep students safe or at least as safe as possible
when an active-shooter situation arises Currently
runhidefight (RHF) is a national mantra for being pre-
pared for such events But according to the authors of
this featured article (see Assessing the Effectiveness of
an Automatic Door Lock System by Discharge Detec-
tion to Lower Casualties during an Academic Active
Shooter Incident on p46) modeling a scenario similar
to the Parkland shooting suggests that the application of
RHF without situational awareness of the shooterrsquos lo-
cation could cause higher casualty rates by an average
of more than 126 individuals Thus in their study the
authors compared the casualty rates of two models
The first model consisted only of hide (shelter-in-
place) and run (evacuate) The second model applied the
first modelrsquos components with an automatic door lock
system which was triggered by discharge detection To
exclude human participation and to prevent physiologi-
cal and psychological impact agent-based modeling
(ABM) was used to recreate a one-story academic infra-
structure with 26 lecture halls and three exits containing
600 unarmed individuals The flexibility of ABM allows
multiple iterations while manipulating various parame-
ters The ABM approach in active-shooter research also
eliminates human error and logistical issues The out-
come of this study evaluates the effectiveness of an au-
tomated door lock system based on firearm discharge
detection with a campus-wide alert system to conduct
lockdown
As frustrating and embarrassing as it has been for
well centuries now it is my sincere hope that our tech-
niques for increasing student safety will outpace the
ability of frustrated revengeful and deranged individu-
als to enter our schools and harm our children And by
harm I mean not only save the anguish on the part of
the parents in their childrenrsquos deaths but also the life-
long debilitating and mentally scarring effects on those
surviving such shootings
mdashmdashmdashmdashmdashmdashmdashmdashmdashmdashmdashmdashmdashmdashmdashmdashmdashmdashmdashmdashmdashmdashmdashmdashmdashmdashmdashmdashmdashmdashmdashmdashmdashmdashmdashmdashmdashmdashmdashmdashmdashmdashmdashmdashmdashmdashndashmdashmdashmdashmdash
EDITORrsquoS NOTE (IN THIS ISSUE) ACADEMIC ACTIVE-SHOOTER INCIDENTS 3
mdashmdashmdashmdashmdashmdashmdashmdashmdashmdashmdashmdashmdashmdashmdashmdashmdashmdashmdashmdashmdashmdashmdashmdashmdashmdashmdashmdashmdashmdashmdashmdashmdashmdashmdashmdashmdashmdashmdashmdashmdashmdashmdashmdashmdashmdashndashmdashmdashmdashmdash
mdashmdashmdashmdashmdashmdashmdashmdashmdashmdashmdashmdashmdashmdashmdashmdashmdashmdashmdashmdashmdashmdashmdashmdashmdashmdashmdashmdashmdashmdashmdashmdashmdashmdashmdashmdashmdashmdashmdashmdashmdashmdashmdashmdashmdashmdashndashmdashmdashmdashmdash
4 INTERNATIONAL JOURNAL OF ENGINEERING RESEARCH AND INNOVATION | V11 N1 SPRINGSUMMER 2019
State University of New York (NY) North Carolina AampT State University (NC)
Michigan Tech (MI)
Purdue University Northwest (IN) Zamfara AC Development (NIGERIA)
Virginia State University (VA)
Memphis University (TN) Guru Nanak Dev Engineering (INDIA)
Bowling Green State Univ Firelands (OH)
Minnesota State University (MN) Texas AampM University Kingsville (TX)
Illinois State University (IL)
Iowa State University (IA) Eastern Illinois University (IL)
Indiana State University (IN)
Ohio University (OH) Claflin University (SC)
North Carolina AampT State University (NC)
Alabama AampM University (AL) Ferris State University (MI)
Appalachian State University (NC)
Oregon Institute of Technology (OR) Elizabeth City State University (NC)
Tennessee Technological University (TN)
Millersville University (PA) University of Tennessee Chattanooga (TN)
Zagazig University EGYPT) Utah Valley University (UT)
Abu Dhabi University (UAE)
Purdue Polytechnic (IN) Penn State University (PA)
Safety Engineer in Sonelgaz (ALGERIA)
City University of New York (NY) Central Connecticut State University (CT)
University of Louisiana Lafayette (LA)
North Dakota State University (ND) North Carolina AampT University (NC)
Indiana University Purdue (IN)
Michigan Tech (MI) Eastern Illinois University (IL)
Bowling Green State University (OH)
Millersville University (PA) Purdue Polytechnic (IN)
North Dakota State University (ND)
Abu Dhabi University (UAE) Purdue University Calumet (IN)
Bowling Green State University (OH)
Southeast Missouri State University (MO) Bowling Green State University (OH)
Ohio University (OH)
Penn State University Berks (PA) Central Michigan University (MI)
Florida AampM University (FL)
Penn State University (PA) ARUP Corporation
University of Louisiana (LA)
University of Southern Indiana (IN) Eastern Illinois University (IL)
Cal State Poly Pomona (CA)
Excelsior College (NY) Jackson State University (MS)
Penn State Berks (PA)
California State University Fresno (CA) Michigan Tech (MI)
Mohammed Abdallah Paul Akangah
Nasser Alaraje
Ali Alavizadeh Lawal Anka
Jahangir Ansari
Kevin Berisso Pankaj Bhambri
Michelle Brodke
Shaobiao Cai Rajab Challoo
Isaac Chang
Shu-Hui (Susan) Chang Rigoberto Chinchilla
Phil Cochrane
Curtis Cohenour Emily Crawford
Dongyang (Sunny) Deng
ZT Deng Sagar Deshpande
David Domermuth
Marilyn Dyrud Mehran Elahi
Ahmed Elsawy
Cindy English Ignatius Fomunung
Ahmed Gawad Mohsen Hamidi
Mamoon Hammad
Gene Harding Bernd Haupt
Youcef Himri
Delowar Hossain Xiaobing Hou
Shelton Houston
Ying Huang Christian Bock-Hyeng
Pete Hylton
John Irwin Toqeer Israr
Sudershan Jetley
Alex Johnson Rex Kanu
Reza Karim
Manish Kewalramani Tae-Hoon Kim
Chris Kluse
Doug Koch Resmi Krishnankuttyrema
Zaki Kuruppalil
Shiyoung Lee Soo-Yen (Samson) Lee
Chao Li
Dale Litwhiler Mani Manivannan
GH Massiha
Thomas McDonald David Melton
Shokoufeh Mirzaei
Sam Mryyan Jessica Murphy
Rungun Nathan
Arun Nambiar Aurenice Oliveira
University of Central Missouri (MO) Purdue Fort Wayne (IN)
Community College of Rhode Island (RI)
Sardar Patel University (INDIA) Virginia State University (VA)
Broadcom Corporation
Warsaw University of Tech (POLAND) University of West Florida (FL)
California State University-Fullerton (CA)
Wireless Systems Engineer Brigham Young University (UT)
DeSales University (PA)
Baker College (MI) Michigan Technological University (MI)
Zagros Oil amp Gas Company (IRAN)
St Cloud State University (MN) Shahrood University of Technology (IRAN)
North Carolina AampT State University (NC)
Government Engineering College (INDIA) Wentworth Institute of Technology (MA)
Southern Illinois University (IL)
Ohio University (OH) Camarines Sur Polytechnic (PHILIPPINES)
Missouri University of Science amp Tech (MO)
University of Houston Downtown (TX) University of Central Missouri (MO)
University of South Florida Polytechnic (FL) Central Connecticut State University (CT)
Texas AampM University (TX)
Thammasat University (THAILAND) Central Connecticut State University (CT)
Purdue University (IN)
University of Pittsburgh Johnstown (PA) Purdue University Calumet (IN)
Sam Houston State University (TX)
Ohio University (OH) Jackson State University (MS)
Missouri Western State University (MO)
Troy Ollison Reynaldo Pablo
Basile Panoutsopoulos
Shahera Patel Thongchai Phairoh
Huyu Qu
Desire Rasolomampionona Michael Reynolds
Nina Robson
Marla Rogers Dale Rowe
Karen Ruggles
Anca Sala Alex Sergeyev
Mehdi Shabaninejad
Hiral Shah Mojtaba Shivaie
Musibau Shofoluwe
Amitkumar B Solanki Jiahui Song
Carl Spezia
Michelle Surerus Harold Terano
Sanjay Tewari
Vassilios Tzouanas Jeff Ulmer
Abraham Walton Haoyu Wang
Jyhwen Wang
Boonsap Witchayangkoon Shuju Wu
Baijian (Justin) Yang
Eunice Yang Xiaoli (Lucy) Yang
Faruk Yildiz
Yuqiu You Pao-Chiang Yuan
Jinwen Zhu
Editorial Review Board Members
ANALYZING RESPONSE COMMUNICATION MITIGATION
METHODS THROUGH SIMULATION MODELING mdashmdashmdashmdashmdashmdashmdashmdashmdashmdashmdashmdashmdashmdashmdashmdashmdashmdashmdashmdashmdashmdashmdashmdashmdashmdashmdashmdashmdashmdashmdashmdashmdashmdashmdashmdashmdashmdashmdashmdashmdashmdashmdashmdashmdashmdashndashmdashmdashmdashmdash
Katherine E Reichart Purdue University Anna R Larson Purdue University Kristal K Smith Purdue University
J Eric Dietz Purdue University
When modeling active shooter scenarios communicating
proper procedures saves lives Notifying authorities increas-
es response time which prevents fatal casualties The shoot-
er will engage the police instead In the 2015 Orlando night-
club shooting police were notified at 202 am from an off-
duty officer acting as a security guard (Ellis Fantz Karimi
amp McLoughlin 2016) This was four minutes after shooting
started However additional external communication did
not only come from the Orlando police department Rather
the nightclub itself used social media to communicate with
patrons People inside also provided personal and external
communication to the police or family members Active
shooters represent a scenario in which communication and
procedure must be set in place prior to the emergency to
accurately work In this way simulation modeling can pro-
vide ldquopracticerdquo in the distribution of responders areas of
weakness and effective communication Choosing a simu-
lation modeling source means selecting a system that pro-
vides multiple modeling scenarios AnyLogic Personal
Learning Edition (PLE) affords the creation of limited yet
diverse models Using agent-based logic modeling commu-
nication could be as realistic and individualized as needed
Venue Case Studies
Venues must adapt to different daily scenarios as crowds
change with the event Therefore getting an accurate evacu-
ation time is difficult mostly because publishing this data
has the potential to hurt a venuersquos security Based on evacu-
ation times in apartment buildings the average time it takes
to start evacuating (from a fire) is approximately
10 minutes assuming alert systems are in place (Proulx
1995) In combination with that time the average evacua-
tion took approximately 22 minutes to complete However
this study was done on apartment buildings as opposed to a
large event venue like a stadium Given the magnitude of
such evacuation times are more akin to typical exit proce-
dures However these times are not measured and may be
skewed as patrons are not forced to leave Therefore the
aforementioned study may be more useful to compare tim-
ing than data collected from an after-hours event This study
also took mobility constraints into consideration involving
those with special needs Ultimately the study does show
that communication effects evacuation rates The next step
was to compare this information to large event venues and
their communication methods
Abstract
Emergencies rely heavily on succinct and controlled an-
nouncements from a singular verified source However this
has been an ideal not reality Often veritable communica-
tion has occurred after events as official sources may not
have been available to comment or provide personal instruc-
tion to individuals Current communication simulation mod-
eling involves communication systems in commutation with
actual communication Systems are not the only way infor-
mation is spread In this study the authors analyzed formal
and informal response methods in an emergency at a large
event By comparing multiple methods in a systems dynam-
ic model the researchers estimated the relative value of four
communication sources in terms of impact and response
metrics The results influenced subsequent agent-based
models that reflected a real evacuation of messaging The
study resulted in increased understanding of evacuation
communication procedures as well as the simultaneous test-
ing of multiple forms of communication The models
proved that the most reliable and rapid communication has
the most impact on saving lives Additionally these proce-
dures gave insight into communication effectiveness as well
as the best combinations of messaging Thus these models
as estimates should offer insight into the current communi-
cation response procedures and their future applications
Introduction
Current communication simulation modeling should in-
volve communication systems in commutation with actual
communication Consider that an Amber alert and an online
network might be similar in communication structure but
not in actual practice Miscommunication in an online net-
work means losing all connection In an emergency false
and inconsistent messages occur According to the Depart-
ment of Homeland Security emergencies rely heavily on
succinct and controlled announcements from a singular veri-
fied source However this is an ideal as opposed to the real-
ity (DHS 2014) Communication will often be announced
after the event as official sources may not be available to
comment immediately or provide personal instruction to
individuals Worse the communication itself will stem from
various sources that may worsen the emergency An exam-
ple of multiple sources would be the difference between
formal and informal sources
mdashmdashmdashmdashmdashmdashmdashmdashmdashmdashmdashmdashmdashmdashmdashmdashmdashmdashmdashmdashmdashmdashmdashmdashmdashmdashmdashmdashmdashmdashmdashmdashmdashmdashmdashmdashmdashmdashmdashmdashmdashmdashmdashmdashmdashmdashmdashmdashmdashmdash
INTERNATIONAL JOURNAL OF ENGINEERING RESEARCH AND INNOVATION | V11 N1 SPRINGSUMMER 2019 5
mdashmdashmdashmdashmdashmdashmdashmdashmdashmdashmdashmdashmdashmdashmdashmdashmdashmdashmdashmdashmdashmdashmdashmdashmdashmdashmdashmdashmdashmdashmdashmdashmdashmdashmdashmdashmdashmdashmdashmdashmdashmdashmdashmdashmdashmdashndashmdashmdashmdashmdash
mdashmdashmdashmdashmdashmdashmdashmdashmdashmdashmdashmdashmdashmdashmdashmdashmdashmdashmdashmdashmdashmdashmdashmdashmdashmdashmdashmdashmdashmdashmdashmdashmdashmdashmdashmdashmdashmdashmdashmdashmdashmdashmdashmdashmdashmdashndashmdashmdashmdashmdash
6 INTERNATIONAL JOURNAL OF ENGINEERING RESEARCH AND INNOVATION | V11 N1 SPRINGSUMMER 2019
In a 2014 study of Ladd Pebbles Stadium in Mobile Ala-
bama focusing on stadium design researchers spoke to the
international standard of eight minutes for a stadium evacu-
ation to occur This study focused on the physical limita-
tions associated with evacuations (crowding collisions
social norms etc) However very little attention was paid
to communication factors that could affect timing in an
emergency Instead the study focused on evacuation flow
rate simulation and avoiding and assuming communication
dynamics (Aldana Fox Diehl amp Dimitoglou 2014) How-
ever case studies show how vital communication is to evac-
uation planning At ATampT Stadium staff members are giv-
en a rundown on their tasks of the day and what to expect in
terms of safety at the beginning of each shift These task
sheets include updates and reminders for the event and pro-
vide photos of what the passes and wristbands look like so
there are no copies (ATampT 2018) It also reminds them if
they see something to say something Each staff member is
also expected to get a formal safety briefing from their su-
pervisor prior to doors opening
However arenas are not the only example of a large event
venue University stadiums arenas and event centers are
typically less secure and at higher risk for an emergency
Surveying three universities and their plans offered a more
comprehensive list of evacuation procedures and methods
Additionally these case studies offered the opportunity to
see how they communicated information consistently to
both long-time and first-time visitors Though they also
showed methods related to staffing this was not an im-
portant factor for the current research project Townson
University has a public version of their arenarsquos emergency
response plan and they outline a list of important infor-
mation items for their event staff to know before their event
This list covers familiarizing staff and contractors on emer-
gency procedures fire procedures emergency exit policies
equipment and seating policies and other general rules
The Townson report also covers the procedures during an
emergency As soon as an incident occurs it is noted on the
PA and via a bullhorn in case of a fire alarm or PA equip-
ment failure the TUPD will designate a safe location out-
side management will direct patrons during evacuation and
will use the radio for communication and an operations
commander will be assigned These procedures are based on
the National Incident Management System (NIMS) the
National Response Framework (NRF) and the Incident
Command System (ICS) These provide guidelines for pre-
paredness and compliance Anyone involved in security
management should be fully aware especially when ensur-
ing the safety of over several hundred people (Towson
2018) From these case studies responses require necessary
preparation and practice Based on this information evacua-
tion times should be estimated at approximately 20 minutes
for an average venue with systems in place prior to the
event itself This time includes both the processing and ac-
tual physical evacuation time The communication methods
employed by these venues will be further explored in the
following section
Emergency Communication Methods
In 2008 the Department of Homeland Security designed a
planning guide for emergencies in stadiums The guide has
a section for a notification system during emergencies Dur-
ing emergencies understanding the different reactions that
people can have is important to consider Using the different
possibilities can be helpful in designing an efficient notifi-
cation system The employees also need to be trained on all
aspects of the system to be sure that communication will be
effective Using common language during emergencies al-
lows for everyone to understand The guide also advises
everyone to ensure that they have a plan for displaying in-
formation (screens jumbotrons etc) along with having
employees check areas without any displays (DHS 2008)
Thus communication response methods should relate to
two communication systems visual and audio Sight and
hearing are the primary ways that any person will begin to
understand a message
Stadiums typically have public announcement systems
that will take into consideration both visual and auditory
public announcement systems but do not capitalize on addi-
tional communication systems that may be available to their
audience According to Kenneth Burke the percentage rate
of text messages being opened is 99 Burkersquos article also
states that 95 of text messages are opened within three
minutes and on average they are read in under five seconds
(Bankers 2018) This statistic is particularly useful consid-
ering that many stadiums have fan text messaging that could
evolve into an emergency communication service For ex-
ample Bankers Life Fieldhouse a stadium in Indianapolis
Indiana offers several different fan information services
Among website information is the texting service that is
offered to fans Bankers Life Fieldhouse offers a texting
service that fans can use if they ever encounter anything
suspicious during events The service is anonymous so they
can inform building management without needing to give
any personal information Bankers Life Fieldhouse also
specifies that if the service is misused the number will be
blocked for a full 24 hours (2018)
According to Cutlip and Centerrsquos Effective Public Rela-
tions (2013) there are serval communication methods to
apply to audiences (Broom Sha Seshadrinathan Center amp
Cutlip 2013) Among the various communication models
mdashmdashmdashmdashmdashmdashmdashmdashmdashmdashmdashmdashmdashmdashmdashmdashmdashmdashmdashmdashmdashmdashmdashmdashmdashmdashmdashmdashmdashmdashmdashmdashmdashmdashmdashmdashmdashmdashmdashmdashmdashmdashmdashmdashmdashmdashndashmdashmdashmdashmdash
and relevant to communications in emergency management
the mass communication model is the most effective The
mass communications model has six elements 1) the send-
er 2) the message 3) the medium or channel 4) the receiv-
ers 5) relationship contexts and 6) the social environment
Therefore the sender is the source of the impact and can
influence how it is received (Broom et al 2013) Conse-
quently credibility intensifies information and could impact
how effective a message is A message is information that is
sent or given to someone
Furthermore from Cutlip and Center messages are cate-
gorized into ldquotext verbal multimedia print etcrdquo (Broom et
al 2013) Assumption suggests that emergency manage-
ment messages have to be clear and concise However in-
terpretation occurs when communicating with the masses
and must be considered as a potential obstacle when crafting
a message (Broom et al 2013) The medium or channel that
a message uses has equal importance to the message From
a 1971 body language study face-to-face communication
delivers effective communication information yet 70-90
of communication is through nonverbal cues like gestures
and facial expressions (Mehrabian 1971) Such direct com-
munication is valuable but using technology as a medium
for communication such as social media has resulted in
creating more ways to communicate during emergencies
(Broom et al 2013) These options should be explored
more fully in terms of emergency communications
Alertus Technologies is a unified mass notification com-
munication system Alertus is often used for large events
and companies for emergency situations Alertus utilizes a
combination of communication methods to maximize the
possibility of reaching all parties The different methods
include text messaging email public announcement sys-
tems digital signage and desktop computers A few compa-
nies that utilize Alertus Technologies include Disney
ESPN and Toronto Pan AM Sports Centre (Alertus Tech-
nologies 2018) This technology system appears to encom-
pass all communication systems However the full system
relies on the combination of systems Whether this combi-
nation is effective or not depends on how accurate or effec-
tive the communication is Alertus does what many arenas
are capable of but in a way that puts the control in a uni-
fied separate entity
Methodology
In developing a way to model response communication
the authors determined that a system dynamics model would
provide a new look at response communication Response
communication requires speed time and people Balancing
these three variables is essential to effective communica-
tion Some constants such as communication and evacua-
tion rate can be influenced by these variables Thus com-
munication is a system that can be made more effective and
accurate through modeling The systems dynamics model
being used was based on a Bass diffusion model Developed
in 1969 by Frank M Bass and John A Norton a Bass diffu-
sion model represents how a potential market is affected by
advertisers and word of mouth (1987) Advertising has the
potential to spread a concise clear and strong message with
little to no resources Thus this model is a great reference
for emergency communication
Regarding this specific project the Bass Diffusion model
was changed to reflect emergency communication This
method was chosen based on how well advertisement mir-
rors communication It necessitates and requires effective
understanding but also showcases errors that are corrected
based on an alternate system Bass diffusion takes commu-
nication by word of mouth into consideration and is a large
part of emergency communication If all emergency com-
munication systems were to fail word of mouth would still
be prevalent Thus word of mouth acts as a constant in this
current model of emergency response communication
However it has an obvious error rate regarding miscommu-
nication and timely understanding
Bass Diffusion Model
Figure 1 shows how initial method research was conduct-
ed in order to see how well a Bass Diffusion model could
adapt to emergency communication By replacing the popu-
lation to reflect the emergency at hand the communication
rate was no longer influenced by advertisement but by an
auditory public announcement (PA) system As mentioned
earlier word-of-mouth communication is still reflected and
influenced by contact rate and the evacuation message rate
(Norton amp Bass 1987) The model appeared to accurately
reflect evacuation message procedures including a delay
that reflects understanding or processing time
Regarding this study the error lies in uniformity of mes-
sage Different communication systems have different chal-
lenges The message to evacuate goes through several dif-
ferent paths thus some of the messages are delayed wheth-
er through human or technologically dictated circumstances
Developing a flowchart allowed the authors to show the
specific challenges associated with each system and how
they could apply to the model Figure 2 shows how the steps
associated with each system should result in understanding
This is where the Bass Diffusion model ends as understand-
ing implies that they have fully received the evacuation
message This does not account for the actual time that it
would take for a person to evacuate (a lengthier process)
mdashmdashmdashmdashmdashmdashmdashmdashmdashmdashmdashmdashmdashmdashmdashmdashmdashmdashmdashmdashmdashmdashmdashmdashmdashmdashmdashmdashmdashmdashmdashmdashmdashmdashmdashmdashmdashmdashmdashmdashmdashmdashmdashmdashmdashmdashndashmdashmdashmdashmdash
ANALYZING RESPONSE COMMUNICATION MITIGATION METHODS THROUGH SIMULATION MODELING 7
mdashmdashmdashmdashmdashmdashmdashmdashmdashmdashmdashmdashmdashmdashmdashmdashmdashmdashmdashmdashmdashmdashmdashmdashmdashmdashmdashmdashmdashmdashmdashmdashmdashmdashmdashmdashmdashmdashmdashmdashmdashmdashmdashmdashmdashmdashndashmdashmdashmdashmdash
mdashmdashmdashmdashmdashmdashmdashmdashmdashmdashmdashmdashmdashmdashmdashmdashmdashmdashmdashmdashmdashmdashmdashmdashmdashmdashmdashmdashmdashmdashmdashmdashmdashmdashmdashmdashmdashmdashmdashmdashmdashmdashmdashmdashmdashmdashndashmdashmdashmdashmdash
8 INTERNATIONAL JOURNAL OF ENGINEERING RESEARCH AND INNOVATION | V11 N1 SPRINGSUMMER 2019
an auditory PA system visual PA system texting notifica-
tion system and word of mouth Figure 3 shows these sys-
tems
Figure 3 Final bass diffusion model
For example limited research suggests that public an-
nouncement systems are 60 effective at distributing a
message (Alertus Technologies 2018) This comes from
public relations data as opposed to testing of several emer-
gency public announcement systems However this as-
sumes that the system is in perfect working order without
any limitations (noise miscommunication etc) Because
the model is highly flexible these circumstances can be
reflected by inputting different numbers into the effective-
ness variables Using averages obtained from studies of
similar systems effectiveness was a variable inputted at
different levels depending on which system was in use
Thus effectiveness for both public announcement systems
(auditory and visual) used the same initial effectiveness
rating of 60 while the texting system was given a 50
effectiveness rating but with a message rate of approximate-
ly 5 considering how often people would check their
phones in each emergency The five-second delay was im-
plemented in the program as well Text message systems
align closely with word of mouth as they are a technologi-
cal reflection of the same process but with higher numbers
Finally word-of-mouth communication had a contact rate
of approximately 11 as shown in prior Bass Diffusion
models Word of mouth is a communication system that
exists at all times visual and audible systems only boost this
system but it does require proximity in order to work In
this specific scenario people were in each proximity to the
event and the message However word of mouth will act as
a constant in this evacuation scenario The effectiveness
dictated by evacuation message rate was set to 50
Figure 1 Original bass diffusion model
Figure 2 Communication flowchart
The flowchart shows the four systems that could be mod-
eled in an evacuation communication scenario This is
meant to come from the viewpoint of evacuees not the first
responders that would arrive Therefore the communication
systems are all processes that the average person would
have available The four communication methods used were
mdashmdashmdashmdashmdashmdashmdashmdashmdashmdashmdashmdashmdashmdashmdashmdashmdashmdashmdashmdashmdashmdashmdashmdashmdashmdashmdashmdashmdashmdashmdashmdashmdashmdashmdashmdashmdashmdashmdashmdashmdashmdashmdashmdashmdashmdashndashmdashmdashmdashmdash
Pedestrian Traffic Model
Using an agent was necessary to show the second part of
the flowchart in which the message is spread through behav-
ior People are the distributors of messages and their behav-
ior should be considered Stadium evacuation simulation
has been used previously to measure crowd dynamics In
the aforementioned 2014 study of Ladd Pebbles Stadium
the researchers compared crowd simulation models The
chosen model was behavioral using agent-based modeling
as a means of crowd simulation This allows for a more ful-
ly formed approach to stadium emergency evacuation and
verifies that simulation can be used as a valid approach to
evacuation research (Aldana et al 2014)
Through AnyLogic 8rsquos pedestrian traffic library the mes-
sage spread can be shown in real time Figure 4 shows how
the message can be spread based on word-of-mouth data
Using a statechart one can base the message on a specific
variable as opposed to a parameter Therefore a statechart
was created to manipulate the message variable as opposed
to manipulating the parameters to reflect a variable The
statechart uses the same understanding and contact rate as
word-of-mouth communication This validates the Bass
Diffusion Model By using actual agents the modeling is
more successful than the systems dynamics model at dis-
playing contact information Additionally pedestrian mod-
eling will eventually show the full extent of evacuation as a
result of the communication systems not just the system
itself
Figure 4 Pedestrian model statechart
The physical structure of the pedestrian model is meant to
reflect stadium seating so that communication rate is as
close to realistic as possible Figure 5 shows that the model
uses two waiting areas with separate agents The agents all
begin as blue until the evacuation order is released Then
the message is sent Once one person has the message they
will turn red depending on contact and proximity Error is
included to account for misunderstanding due to chaos and
human error
Figure 5 Final pedestrian model
Ultimately the final pedestrian model simulates one nec-
essary communication method Additional methods will
require further modelling to validate and continue testing
This is something the researchers hope to pursue in the fu-
ture especially as new communication methods become
popular
Results
Using the results from the systems dynamics model the
researchers modeled the effectiveness of different commu-
nication systems Using word of mouth as a constant three
communication methods were compared against those ini-
tial values In the following charts (Figures 6-10) two lines
are shown The darker line is the level of potential evacuees
(the initial population) and the level of evacuees (the
amount of people that successfully received the message)
Acting as constant word of mouth effectively distributed
information in approximately 22 minutes As a reminder
this is not an evacuation time but the communication mes-
sage time As seen in Figure 6 the halfway point for the
communication rate is much further than any other system
mdashmdashmdashmdashmdashmdashmdashmdashmdashmdashmdashmdashmdashmdashmdashmdashmdashmdashmdashmdashmdashmdashmdashmdashmdashmdashmdashmdashmdashmdashmdashmdashmdashmdashmdashmdashmdashmdashmdashmdashmdashmdashmdashmdashmdashmdashndashmdashmdashmdashmdash
ANALYZING RESPONSE COMMUNICATION MITIGATION METHODS THROUGH SIMULATION MODELING 9
mdashmdashmdashmdashmdashmdashmdashmdashmdashmdashmdashmdashmdashmdashmdashmdashmdashmdashmdashmdashmdashmdashmdashmdashmdashmdashmdashmdashmdashmdashmdashmdashmdashmdashmdashmdashmdashmdashmdashmdashmdashmdashmdashmdashmdashmdashndashmdashmdashmdashmdash
mdashmdashmdashmdashmdashmdashmdashmdashmdashmdashmdashmdashmdashmdashmdashmdashmdashmdashmdashmdashmdashmdashmdashmdashmdashmdashmdashmdashmdashmdashmdashmdashmdashmdashmdashmdashmdashmdashmdashmdashmdashmdashmdashmdashmdashmdashndashmdashmdashmdashmdash
10 INTERNATIONAL JOURNAL OF ENGINEERING RESEARCH AND INNOVATION | V11 N1 SPRINGSUMMER 2019
Figure 6 Word-of-mouth communication only
Comparatively in Figure 7 a text system in combination
with word-of-mouth communication is only slightly better
taking approximately 20 minutes to spread an evacuation
message The system in question acted similarly if a single
message was sent and spread amongst a stadiumrsquos fan ser-
vice list This would give a large event area the greatest
chance at reaching patrons without using social media It
should be noted that this parameter will need to be studied
further to establish proper manipulation and realistic bound-
aries
Figure 7 Text system only
However the systems that were more successful at issu-
ing the message were the public announcement systems In
Figure 8 the audible public announcement system took ap-
proximately 10 minutes to communicate an evacuation mes-
sage As previously noted these conditions were almost
ideal for the public announcement system but also assumed
consistent communication being relayed at reasonable inter-
vals This system is necessary but also ignores some special
populations In Figure 9 the visual system was overwhelm-
ingly the best at successfully displaying an evacuation mes-
sage The system took approximately eight minutes to effec-
tively communicate an evacuation message This includes
the timing and understanding delay incorporated into the
data Additionally the authors included an example of all of
the combined communication methods in Figure 10 This
model took approximately nine minutes to complete show-
ing how multiple communication methods may negatively
affect a message spread when factoring in additional error
rates The all-methods communication scenario also reflects
an inundated communication system in which a consistent
error message breeds inaccuracies and response times
Figure 8 PA system only
Figure 9 VisPA system only
Figure 10 All communication methods
Ultimately the knowledge obtained from the resulting
information will help improve and test emergency commu-
nication methods This can be seen in the pedestrian model
in Figure 11 The pedestrian traffic model shows that con-
tact with the message was more realistic than a systems
model The model shows that contact rate does influence
how quickly a message spreads and how word of mouth is
the greatest influencer for that message In this project
word-of-mouth communication was shown to improve com-
munications and introduce error into any communication
mdashmdashmdashmdashmdashmdashmdashmdashmdashmdashmdashmdashmdashmdashmdashmdashmdashmdashmdashmdashmdashmdashmdashmdashmdashmdashmdashmdashmdashmdashmdashmdashmdashmdashmdashmdashmdashmdashmdashmdashmdashmdashmdashmdashmdashmdashndashmdashmdashmdashmdash
system Therefore it is possibly the greatest asset or hin-
drance to response communication The pedestrian model
helps validate that theory while also allowing further test-
ing to occur Though not yet in use this pedestrian traffic
model has applicability to other communication methods
and provides a more realistic understanding of how commu-
nication would occur in an actual emergency as opposed to
a hypothetical one The model above shows how contact
rate affects method spread as the blue dots change to red
when the message is effectively spread
Figure 11 Pedestrian traffic model
Discussion
Though all the communication systems are shown differ-
ently exploring communication contact rate as a key to ef-
fectiveness will need to be considered in subsequent trials
For example text messaging systems have the potential to
be the most effective evacuation communication method as
it can reach most people and is still accessible to those with
disabilities and those not in the main area of the stadium
where the visual and audible public announcement systems
are used However there is a possible issue in that the num-
ber of patrons on their phones could overload the cellular
signal and the text message does not go through undoing all
of the benefits Additionally audible public announcements
are the next most effective evacuation communication meth-
od This method is also capable of reaching all patrons not
only those in the main areas However the consideration of
those with special needs should occur as this method does
hinder the deaf or hard of hearing Also audible public an-
nouncements need to be used cautiously as aggressively
loud and commanding announcements could increase panic
and induce anxiety Testing will follow to see how valid this
system is to an actual evacuation Finally visual public an-
nouncement systems are the least effective of all three meth-
ods but the best in terms of understanding This method can
only reach patrons in the main areas and those who can
read observe and understand what is announced It does
not take blind patrons into consideration However if the
visual public announcement is flashed on and off it could
draw more attention to the message Additionally more
information could be given via visual public announcement
systems information which could be more easily updated
Conclusions
Though examining the results appears to suggest that the
visual public announcement system was the most effective
model this was only in regards to one factor It only reaches
a certain number of patrons at one time Therefore all meth-
ods of communication should use three reliable systems to
issue an evacuation message However the message would
need to be uniform and accurate for this model to work
While it is not feasible for all three methods to be consist-
ently running at the same time each situation would require
a specific combination of the three This question will re-
quire more consistent testing to deduce the correct order and
should be used in combination with the pedestrian model to
achieve the most realistic results As testing continues this
same question will apply to the pedestrian model and con-
tact rate Additionally incorporating social media as a com-
munication method will be considered moving forward
However this method has more complex intricacies with
obsolescence of equipment being a distinct possibility
Notably many of these systems can be altered to ensure
that they perform more effectively than their standards
These differences may mean that one system is more effec-
tive than another at a certain venue event or scenario
These alterations continue to affect word-of-mouth commu-
nication thus all three methods should be considered in
addition to this method Word-of-mouth communication
continues to be the communication at the base of each meth-
od deciding effectiveness and understanding of evacuation
The faster a message is understood the better the outcome
of an evacuation By assisting individual security the venue
is better prepared for an emergency The faster they re-
spond the more lives saved Therefore communicating
proper responses to patrons is the difference between life
and death
mdashmdashmdashmdashmdashmdashmdashmdashmdashmdashmdashmdashmdashmdashmdashmdashmdashmdashmdashmdashmdashmdashmdashmdashmdashmdashmdashmdashmdashmdashmdashmdashmdashmdashmdashmdashmdashmdashmdashmdashmdashmdashmdashmdashmdashmdashndashmdashmdashmdashmdash
ANALYZING RESPONSE COMMUNICATION MITIGATION METHODS THROUGH SIMULATION MODELING 11
mdashmdashmdashmdashmdashmdashmdashmdashmdashmdashmdashmdashmdashmdashmdashmdashmdashmdashmdashmdashmdashmdashmdashmdashmdashmdashmdashmdashmdashmdashmdashmdashmdashmdashmdashmdashmdashmdashmdashmdashmdashmdashmdashmdashmdashmdashndashmdashmdashmdashmdash
mdashmdashmdashmdashmdashmdashmdashmdashmdashmdashmdashmdashmdashmdashmdashmdashmdashmdashmdashmdashmdashmdashmdashmdashmdashmdashmdashmdashmdashmdashmdashmdashmdashmdashmdashmdashmdashmdashmdashmdashmdashmdashmdashmdashmdashmdashndashmdashmdashmdashmdash
12 INTERNATIONAL JOURNAL OF ENGINEERING RESEARCH AND INNOVATION | V11 N1 SPRINGSUMMER 2019
References
Aldana N Fox C Diehl E amp Dimitoglou G (2014) A
study of stadium exit design on evacuation perfor-
mance Proceedings of the 27th International Confer-
ence on Computer Applications in Industry and Engi-
neering Cary NC International Society for Computers
and Their Applications
Alertus Technologies (2018) Mobile notification Re-
trieved from httpswwwalertuscompersonal
ATampT Stadium operations manual (2018) Retrieved from
httpsattstadiumcomsitesdefaultfilesdc-content-
filesCity20of20Arlington20Policiespdf
Bankers Life Fieldhouse (2018) Fan guide Retrieved from
httpwwwbankerslifefieldhousecomarena-
informationfan-guide
Broom G M Sha B L Seshadrinathan S Center A H
amp Cutlip S M (2013) Cutlip and Centerrsquos effective
public relations (11th ed) Upper Saddle River NJ
Pearson
Burke K (2016) 73 texting statistics that answer all your
questions Retrieved from httpswwwtextrequestcom
blogtexting-statistics-answer-questions
Centers for Disease Control and Prevention [CDC] (2018)
Emergency preparedness and response Social media
Retrieved from httpsemergencycdcgovsocialmedia
indexasp
Department of Homeland Security [DHS] (2008) Evacua-
tion planning guide for stadiums Retrieved from
httpswwwdhsgovsitesdefaultfilespublications
evacuation-planning-guide-stadiums-508pdf
Department of Homeland Security [DHS] (2014) Com-
municating in an emergency Federal Emergency Man-
agement Agency Retrieved from https
trainingfemagovemiwebisis242bstudent
20manualsm_03pdf
Ellis R Fantz A Karimi F amp McLoughlin E C
(2016) Orlando shooting 49 killed shooter pledged
ISIS allegiance CNN Retrieved from https
wwwcnncom20160612usorlando-nightclub-
shootingindexhtml
Mehrabian A (1971) Silent messages Belmont CA
Wadsworth
Mileti D S amp Sorensen J H (1990) Communication of
emergency public warnings A social science perspec-
tive and state-of-the-art assessment Washington DC
FEMA Retrieved from httpsdoi1021726137387
Norton J A amp Bass F M (1987) A diffusion theory
model of adoption and substitution for successive gen-
erations of high-technology products Management
Science 33(9) 1-19
Proulx G (1995) Evacuation time and movement in apart-
ment buildings Fire Safety Journal 24(3) 229-246
Retrieved from httpsdoiorg1010160379-7112(95)
00023-M
Towson University (2018) Emergencies Retrieved from
httpswwwtowsonedupublicsafetyemergencies
Biographies
KATHERINE REICHART is a graduate student in
Homeland Security in the Computer Information Technolo-
gy program at Purdue University Her previous degree is in
professional writing also from Purdue University Addi-
tionally she is a member of the Purdue Homeland Security
Institute She has been involved in several research projects
in the institute Additionally she is an assistant editor on
several books in progress concerning those research topics
Her research will continue to focus on communication and
reporting methods of large event security Katherine
Reichart may be reached at kreicharpurdueedu
ANNA LARSON works for General Electr ic in De-
troit MI She earned her BS in Computer Information Tech-
nology from Purdue University and MS in Computer and
Information Technology 2018 from her alma mater Her
interests include disaster network communication and
cyberforensics Anna Larson may be reached at lar-
sonapurdueedu
KRISTAL SMITH works for Blue Horseshoe in Boul-
der CO She recently graduated from Purdue University
with her BS in Computer and Information Technology
While there she researched and participated in projects re-
garding emergency preparedness Kristal Smith may be
reached at smit2265purdueedu
J ERIC DIETZ PE graduated in 1984 with a BS and
again in 1986 with an MS in chemical engineering both
from the Rose-Hulman Institute of Technology He earned
his PhD in chemical engineering in 1994 from Purdue Uni-
versity where he is now a professor In 2004 he retired as a
Lieutenant Colonel from the US Army Thus his research
interests include optimization of emergency response
homeland security and defense energy security and engag-
ing veterans in higher education Dr Dietz may be reached
at jedietzpurdueedu
Abstract
Various 3D printer configurations such as Cartesian
printers operate similarly to a CNC machining center and
Delta printers that have a stationary build platform with the
use of three motors located on pillars controlling the end
effector location A less popular configuration is a Polar
system which utilizes a rotating table a Z translation con-
trolled by a linear actuator located beyond the edge of the
rotating table and a horizontal arm connected to the Z-axis
that translates the end effector along the center axis The
Polar 3D printer configuration being the simplest was cho-
sen in order to scale up to build and test a low-cost large-
scale 3D printer with a build envelope of 183m x 183m x
153m (6ft x 6ft x 5ft)
This open source hardware 3D printer (OSALS-Polar) can
be produced for approximately $5000 for materials assum-
ing that labor is provided by the user To 3D print a part
any CAD software is used to output a stereo lithography
(stl) file open source slicing software (Cura) to generate
the G-code file and open source software (Franklin) to op-
erate the 3D printer Testing the 3D printer requires calibra-
tion of the three axes to produce the desired positioning of
the Theta-axis rotation R-axis horizontal arm translation
and Z-axis vertical translation with the inputs into the
Franklin software Also the system is set to start at a zero
location according to distances set from the end-stop limit
switches The final testing of the OSALS-Polar produced
small extruded parts although the accuracy and scaling up
to larger parts not accomplished during this study Future
testing may encounter limitations in the size of prints due to
material cooling at various rates causing warpage Introduc-
tion
3D printing technology has become quite common and
increasingly applications for direct digital manufacturing
are being implemented RepRap (self-replicating machines)
3D printers (Sells Bailard Smith Bowyer amp Olliver 2010
Gibb 2014) are open source 3D printer designs available
for anyone to build According to Wittbrodt et al (2013)
the cost of an open source 3D printer used for printing
household components such as a pierogi mold or paper
towel holder can be recuperated within a year or two if a
reasonably fair number of household items are printed using
the 3D printer (Wittbrodt et al 2013 Wittbrodt 2014) The
3D printer build envelope (printer platform times the print-
ing height capability) can be a limitation of direct digital
manufacturing if the part exceeds this build envelope
Common desktop 3D printers have a build envelope of
203 mm (8 in) length x 203 mm (8 in) and width x 153
mm (6 in) height Larger-scale 3D printers ranging from
5 to 10 times the size of the common desktop 3D printers
are typically very expensive to produce
Methods of joining 3D-printed parts via acetone have
been successful in producing parts such as wind turbine
blades (Deshpande Rao Pradhan amp Irwin 2016) although
this method requires several manufacturing steps and can
decrease overall part accuracy The goal of the OSALS-
Polar is to manufacture larger 3D-printed parts (such as
wind turbine blades or propeller blades) that can be printed
in a single setup without needing to be joined together
Wind turbine blades can operate at potentially high RPMs
and any structural concerns lead directly to safety concerns
making it advantageous to 3D print as one continuous part
To overcome size restrictions of desktop 3D printers the
OSALS-Polar can cost under $5000 for materials assuming
the user provides the labor In this paper the authors de-
scribe the assembly and testing of the OSALS-Polar with a
build envelope of 183m x 183m x 153m (6ft x 6ft x 5ft)
The build instructions for this system are also described
here The open source software used to create the slice file
was Cura to operate OSALS-Polar the open source soft-
ware Franklin was used
Introduction
Currently there are many different 3D printer configura-
tions such as the X Y Z Cartesian coordinate 3D printers
that operate similar to a CNC machining center or the Del-
ta which has a stationary build platform with the extruder
operated by three vertical axis translations located on a tri-
angular base A less popular method for controlling the
movement of the axes is a Polar system Figure 1 shows a
benchmark 3D printer produced by Polar3D and its main
components This particular 3D printer has a build envelope
of 203m m (8 in) diameter x 153 mm (6 in) height The
Polar 3D system was used as a datum design to develop the
initial 91 OSALS-Polar CAD design and a set of manufac-
turing drawings The Polar 3D system utilizes a rotating
table (Theta-axis) with a horizontal arm (R-axis) that trans-
mdashmdashmdashmdashmdashmdashmdashmdashmdashmdashmdashmdashmdashmdashmdashmdashmdashmdashmdashmdashmdashmdashmdashmdashmdashmdashmdashmdashmdashmdashmdashmdashmdashmdashmdashmdashmdashmdashmdashmdashmdashmdashmdashmdashmdashmdashndashmdashmdashmdashmdash
Sourabh Prashant Deshpande University of Cincinnati Shrinivas Kulkarni Michigan Technological University
Sid Shah Michigan Technological University John Irwin Michigan Technological University
DEVELOPING AN OPEN SOURCE INEXPENSIVE
LARGE-SCALE POLAR CONFIGURATION 3D PRINTER
mdashmdashmdashmdashmdashmdashmdashmdashmdashmdashmdashmdashmdashmdashmdashmdashmdashmdashmdashmdashmdashmdashmdashmdashmdashmdashmdashmdashmdashmdashmdashmdashmdashmdashmdashmdashmdashmdashmdashmdashmdashmdashmdashmdashmdashmdashmdashmdashmdashmdash
INTERNATIONAL JOURNAL OF ENGINEERING RESEARCH AND INNOVATION | V11 N1 SPRINGSUMMER 2019 13
mdashmdashmdashmdashmdashmdashmdashmdashmdashmdashmdashmdashmdashmdashmdashmdashmdashmdashmdashmdashmdashmdashmdashmdashmdashmdashmdashmdashmdashmdashmdashmdashmdashmdashmdashmdashmdashmdashmdashmdashmdashmdashmdashmdashmdashmdashndashmdashmdashmdashmdash
mdashmdashmdashmdashmdashmdashmdashmdashmdashmdashmdashmdashmdashmdashmdashmdashmdashmdashmdashmdashmdashmdashmdashmdashmdashmdashmdashmdashmdashmdashmdashmdashmdashmdashmdashmdashmdashmdashmdashmdashmdashmdashmdashmdashmdashmdashndashmdashmdashmdashmdash
14 INTERNATIONAL JOURNAL OF ENGINEERING RESEARCH AND INNOVATION | V11 N1 SPRINGSUMMER 2019
lates the extruder along a single axis to and from the center
of the printing surface The vertical (Z-axis) translation in
this system is controlled by a linear power screw and guides
located beyond the edge of the rotating surface This Polar
style 3D printer was determined to be the simplest design
when compared to the Cartesian and Delta styles to up-
scale
Figure 1 Polar3D printer (About 2014) Reprinted with
permission
Review of Related 3D Printing Systems
Rapid developments in the field of 3D printing technolo-
gy have ranged in applications from prototyping to direct
digital manufacturing Berman (2012) compares the revolu-
tion of 3D printing technology with the digital books revo-
lution and foresees its use in several promising applications
such as medicine and construction Gebler Uiterkamp amp
Visser (2014) discussed 3D printing technology in terms of
sustainability and asserted that this technology will lower
resource demands energy use and carbon dioxide emis-
sions over the entire lifecycle According to Wohlers
(2013) use of additive manufacturing technology for direct
part production has increased by more than 25 in the last
few years
Significant efforts are underway to build a large-scale 3D
printing system to manufacture large-scale industrial com-
ponents Barnett and Gosselin (2013) designed a novel large
-scale 3D printer with a cable-suspended mechanism and a
full scaffolding solution However most of the research on
large-scale 3D printers is based on Cartesian and Delta sys-
tem configurations A typical Polar 3D printing system has
a higher build volume with fewer components when com-
pared with other types (Yusuf 2015) A true Polar 3D print-
er has a rotating build plate (Theta-axis) with the vertical
arm (Z-axis) and the extruder placed on the horizontal arm
(R-axis) Any point on a flat plane can be defined by know-
ing its angle theta pole vertical location and a measure of
radius from an axis through the given pole (Horn amp Haus-
man 2017)
A Cincinnati-based Polar 3D technology company uses
fused-filament fabrication technology for a Polar 3D printer
having 2032 mm (8 in) diameter 15875 mm (625 in)
height with connectivity features such as Wi-Fi Ethernet
and USB (About 2014) R-360 is an open source Polar 3D
printer with 210 mm (826 in) disc x 200 mm (787 in)
with a total printing volume of 6927000 mm3 (42271 in3)
It uses PLA or ABS as the printing material and has a maxi-
mum printing speed of 150 mms along with features such
as cloud slicing (Replicator 2013 Farcas 2016) Another
Polar 3D printer with 3048 mm (12 in) diameter and
150 mm (59 in) height has some major features which
include the use of four extruders and Decapede electronics
for driving 10 stepper motors (Anderson 2014) The
PiMaker 3D printer also uses the Polar system with
2794 mm (11 in) diameter and 2032 mm (8 in) height
with an overall volume of over 10650000 mm3 (650 in3)
(Steele 2016) 3D printers have also been made on modest
budgets such as a senior project by Hoy (2016) who devel-
oped a Polar 3D printer having 1778 mm (7 in) diameter
that uses PLA filament
Polar 3D Printer Design
The OSALS-Polar is designed manufactured and assem-
bled by configuring the Theta-axis Z-axis and R-axis re-
spectively Engineering requirements are mapped using
QFD methodology The material for the table surface verti-
cal and horizontal supports and the rotation drive system
are selected using the decision matrix method Accordingly
the major items selected are a tubular steel structure circu-
lar glass printing plate circular steel plate table extruded
aluminum horizontal arm and stepper motors for axis mo-
tion PFMEA is carried out to identify and reduce the poten-
tial failures in the system The circular glass printing plate
has the highest RPN value for which the use of glass edge
guards is recommended to avoid breakage andor injury
The main frame is made up of steel I-beams and steel
tubular sections welded together to manufacture the table
frame Then pivot tabs welded to both the bottom frame
and table frame provide assembly alignment and leveling
capabilities The steel table has a center shaft that is placed
in the table frame center bearing after proper lubrication of
all the parts Figure 2 shows the assembly after fixing the
table roller bearings center bearing and the casters to the
frame
Vertical Z-axis
Horizontal R-axis
Table Theta-axis
mdashmdashmdashmdashmdashmdashmdashmdashmdashmdashmdashmdashmdashmdashmdashmdashmdashmdashmdashmdashmdashmdashmdashmdashmdashmdashmdashmdashmdashmdashmdashmdashmdashmdashmdashmdashmdashmdashmdashmdashmdashmdashmdashmdashmdashmdashndashmdashmdashmdashmdash
Figure 2 Frame assembly
The main power transmission component for the Theta-
axis rotating table is a stepper motor turning a spur gear
driving an internal ring gear The internal ring gear is manu-
factured by machining 10 segments that together form the
15875 mm (625 in) pitch diameter internal ring gear The
pinion gear is mounted to a NEMA 34-stepper motor that
drives the ring gear Despite several challenges introduced
in the system such as improper mating of the ring gear sec-
tions providing larger clearance holes on the ring gear seg-
ment enabled smoother motion The use of flexible pads in
stepper motor mounting also helped to minimize the inaccu-
racies in the gear alignment (Pradhan Irwin Siddegowda
amp Harsha 2016) The internal gear drive mechanism shown
in Figure 3 facilitates improved rotary motion of the table
over the originally designed center worm-gear configuration
that had many backlash issues
Figure 3 Theta-axis drive mechanism
Figure 4 shows how the vertical Z-axis beam is bolted
securely to the main frame which supports the horizontal
arm R-axis and the extruder The Z-axis mounting bracket is
used to attach the R-axis motor accommodate the acme nut
and also fix the R-axis horizontal arm in place The acme
rod is coupled to the Z-axis motor shaft with a straight cou-
pling with no gearing or reduction Two guide rails are de-
signed for the travel of the Z-axis FEA was carried out on
the system after which support brackets were added from
the guide rails to the vertical Z-axis beam accordingly in
order to avoid the deflection of the extruder through its trav-
el
Figure 4 Vertical Z-axis
The R-axis carriage wheels are locked into grooves on the
R-axis horizontal arm while a timing belt drive system
shown in Figure 5 controls the translating motion Figure 6
shows how the extruder extruder motor and hot end are
integrated into the carriage assembly The extruder hot end
bracket and spool holder were manufactured using 3D
printing
Figure 5 Drive system R-axis
Polar 3D Printer Controls
An electrical box houses the circuitry and auxiliary elec-
tronic components Figure 7 shows how the unit is fixed to
the back side of the vertical arm of the OSALS-Polar
Main Frame
Table Frame
Ring Gear Segment
Motor and Pinion Gear
Z-axis Mounting Bracket
R-axis
Guide Rails
Z-axis Vertical Beam
Timing Belt Drive System
mdashmdashmdashmdashmdashmdashmdashmdashmdashmdashmdashmdashmdashmdashmdashmdashmdashmdashmdashmdashmdashmdashmdashmdashmdashmdashmdashmdashmdashmdashmdashmdashmdashmdashmdashmdashmdashmdashmdashmdashmdashmdashmdashmdashmdashmdashndashmdashmdashmdashmdash
DEVELOPING AN OPEN SOURCE INEXPENSIVE LARGE-SCALE POLAR CONFIGURATION 3D PRINTER 15
mdashmdashmdashmdashmdashmdashmdashmdashmdashmdashmdashmdashmdashmdashmdashmdashmdashmdashmdashmdashmdashmdashmdashmdashmdashmdashmdashmdashmdashmdashmdashmdashmdashmdashmdashmdashmdashmdashmdashmdashmdashmdashmdashmdashmdashmdashndashmdashmdashmdashmdash
mdashmdashmdashmdashmdashmdashmdashmdashmdashmdashmdashmdashmdashmdashmdashmdashmdashmdashmdashmdashmdashmdashmdashmdashmdashmdashmdashmdashmdashmdashmdashmdashmdashmdashmdashmdashmdashmdashmdashmdashmdashmdashmdashmdashmdashmdashndashmdashmdashmdashmdash
16 INTERNATIONAL JOURNAL OF ENGINEERING RESEARCH AND INNOVATION | V11 N1 SPRINGSUMMER 2019
Figure 6 Carriage assembly R-axis
Figure 7 Electrical box layout
The circuitry includes RAMPS 14 controller and a Bea-
glebone connected with a bridge board All of the electrical
components were integrated into the RAMPS 14 controller
Figure 8 shows the wiring diagram for the RAMPS 14 To
adhere to the ldquoaffordablerdquo goal of the OSALS-Polar stepper
motors were used rather than servo motors to facilitate the
movement of the three axes The motion of the axes is ena-
bled by three DQ542MA micro-step drivers Each stepper
driver is controlled by Franklin firmware through a Pololu
A4988 stepper driver carrier mounted on the RAMPS 14
board The steps per revolution and the input current for
each axis motor were set using the DIP switches on the mi-
cro-step drivers The DIP switches were set with 1 3 6 and
8 in the ldquoonrdquo position and 2 4 5 and 7 in the ldquooffrdquo posi-
tion Switches 1 2 and 3 were set to the on off and on
positions respectively to match the motor current
(amperes) of 191 at peak and 136 RMS Switch 4 was set
to the off position so that standstill current would be half of
the selected dynamic current The Micro step resolution was
set to 6400 by setting switches 5 6 7 and 8 to the off on
off and on positions respectively
The RAMPS 14 also controls the extruder assembly
which consists of an extruder motor a hot end to melt the
filament a cooling fan to control the outer temperature of
the hot end and a thermistor to indicate the hot end temper-
ature Figure 8 shows the wiring diagram for RAMPS 14 A
Pololu A4988 stepper driver carrier was also used to control
the extruder motor however for this motor no micro-step
driver was needed The stepper drivers get power from a
36V power supply Power for the extruder motor fan and
the hot end are provided through the RAMPS 14 Since no
heated bed is used in this printer a 12V power supply is
connected to the heated bed port to externally power the
RAMPS 14 and direct that power to the extruder motor hot
end and fan
Figure 8 Ramps 14 wiring diagram
Figure 9 shows how mechanical end stops on each axis
allow the printer to start from a reference point End stops
can be mounted on the maximum or minimum position of
an axis Since the zero for this printer is set at the center of
the rotating table the end stops are located at the maximum
position for the R-axis and Z-axis Thus the end stops are
connected to the pins corresponding to the maximum posi-
tion on the RAMPS 14 board
Carriage Assembly
Circuitry
Stepper Drivers
Power Supply
mdashmdashmdashmdashmdashmdashmdashmdashmdashmdashmdashmdashmdashmdashmdashmdashmdashmdashmdashmdashmdashmdashmdashmdashmdashmdashmdashmdashmdashmdashmdashmdashmdashmdashmdashmdashmdashmdashmdashmdashmdashmdashmdashmdashmdashmdashndashmdashmdashmdashmdash
Figure 9 End stop mounting
The RAMPS 14 circuit board is connected to a Beagle-
bone loaded with the Franklin firmware The OSALS-Polar
can be operated by connecting to the Beaglebone using an
Ethernet cable from any host computer Figure 10 shows
how the Franklin software is accessed through a Web ad-
dress in order to pull up a user interface The printer config-
uration setup is completed on this user interface The vari-
ous attributes of the Franklin firmware are then mapped
with the pins on RAMPS 14 using the pin assignments
shown in Table 1
Figure 11 shows the flow of signals from Beaglebone to
the axis motors and the extruder assembly This figure also
shows a schematic diagram of the various components con-
trolled by the Franklin firmware
Z-axis
R-axis
Theta-axis
Axis Motors Extruder Assembly
R Axis Theta Axis Z Axis
X_STEP_PIN 54 Y_STEP_PIN 60 Z_STEP_PIN 46 E_STEP_PIN 26
X_DIR_PIN 55 Y_DIR_PIN 61 Z_DIR_PIN 48 E_DIR_PIN 28
X_ENABLE_PIN 38 Y_ENABLE_PIN 56 Z_ENABLE_PIN 62 E_ENABLE_PIN 24
X_MIN_PIN 3 Y_MIN_PIN 14 Z_MIN_PIN 18 FAN_PIN 9
X_MAX_PIN 2 Y_MAX_PIN 15 Z_MAX_PIN 19 HEATER_PIN 10
THERMISTOR 13
Table 1 Pin mapping
Figure 10 Franklin software settings
mdashmdashmdashmdashmdashmdashmdashmdashmdashmdashmdashmdashmdashmdashmdashmdashmdashmdashmdashmdashmdashmdashmdashmdashmdashmdashmdashmdashmdashmdashmdashmdashmdashmdashmdashmdashmdashmdashmdashmdashmdashmdashmdashmdashmdashmdashndashmdashmdashmdashmdash
DEVELOPING AN OPEN SOURCE INEXPENSIVE LARGE-SCALE POLAR CONFIGURATION 3D PRINTER 17
mdashmdashmdashmdashmdashmdashmdashmdashmdashmdashmdashmdashmdashmdashmdashmdashmdashmdashmdashmdashmdashmdashmdashmdashmdashmdashmdashmdashmdashmdashmdashmdashmdashmdashmdashmdashmdashmdashmdashmdashmdashmdashmdashmdashmdashmdashndashmdashmdashmdashmdash
mdashmdashmdashmdashmdashmdashmdashmdashmdashmdashmdashmdashmdashmdashmdashmdashmdashmdashmdashmdashmdashmdashmdashmdashmdashmdashmdashmdashmdashmdashmdashmdashmdashmdashmdashmdashmdashmdashmdashmdashmdashmdashmdashmdashmdashmdashndashmdashmdashmdashmdash
18 INTERNATIONAL JOURNAL OF ENGINEERING RESEARCH AND INNOVATION | V11 N1 SPRINGSUMMER 2019
Figure 11 Electrical component diagram
OSALS-Polar Operation Methods
3D printing is carried out by using CAD to output a stereo
lithography (stl) file slicing software (Cura) to generate the
G-code file and Franklin to operate the OSALS-Polar Sie-
mens PLM NX CAD software can be used to insert the for-
mulas and expressions for the parametric modeling intent
(Irwin 2013) and to export it in an stl file format The stl
file is loaded in Cura and prepared for 3D printing Some
overhang parts shallower than 45ordm may require the use of
support material (France 2013) The machine type in Cura
is set to Custom FDM printer with PLA material The poly-
mer filament used can be either polylactic acid (PLA) or
acrylonitrile butadiene styrene (ABS) converting it into a
physical object by depositing it in thin sequential layers
PLA is used in this printer rather than ABS because of its
lower melting temperature and superior adhesion to the
glass substrate The layer height shell thickness fill densi-
ty print speed retraction distance and print temperature are
some of the parameters that are set and calibrated as per the
print material and output quality requirements The slicing
software converts this stl file into consecutive thin layers to
generate G-code (Cano 2015) The commonly used open
source slicing software includes Cura and Slic3r Repetier
The Polar 3D company provides cloud services where the
CAD model can be converted to slices online and then
downloaded to run the code
Franklin is a Web-based 3D control system to regulate the
machining process parameters with any internet-connected
device The main function of this software shown in Figure
12 is to drive the hardware systems by integrating with the
slicer software program (Wijnen Anzalone Haselhuhn
Sanders amp Pearce 2016)
Figure 12 Franklin software
The software aims to be more powerful and user-friendly
by having improved robustness system reliability (error
checking) and a powerful scripted interface to smoothly run
the G-code specifically for the large-scale 3D printing and
sophisticated scientificmedical designs The main commu-
nication interfaces for this software include
1 Web socket connection to the browser or script client
(JSON array)
2 Franklin Server and Franklin Python driver (JSON
array)
3 Franklin Python driver and Franklin C driver (binary
packet)
4 Franklin C driver and Franklin interface (physical
serial line)
Calibrating the printer is important in order to ensure the
accuracy of positioning of the nozzle and distance traveled
along the respective axes Calibration includes choosing the
right amount of current and micro-stepping for the three
axes It is also important to calibrate the absolute zero posi-
tion for the three axes The dip switches on the motor driv-
ers are used to set the amount of current for each motor and
were set to half current for this system Micro-stepping is
decided based on the torque requirements and the necessary
motion accuracy The motor stepper drivers were set to 800
pulses per revolution for the Z-axis and 6400 pulses per
revolution for the Theta- and R-axes Micro-steps are also
set using the dip switches on the stepper motor drivers The
number of revolutions are calculated to enter Franklin soft-
ware based on the 200-step-per-revolution motors Equation
1 was used to calculate the new steps for the R- and Z-axes
(Pearce 2014) For the Theta-axis the distances are re-
placed with the desired and actual angles which can be cali-
brated by the same method
Beaglebone-
Franklin Firmware
RAMPS 14
Stepper Motor
Driver
Extruder
Assembly
Thermistor
Extruder Motor
Hot End
Axes Motors
(R Theta and Z) Cooling Fan
Franklin Software
Franklin Firmware
Handling low-level interface
(Temp control GPIO pins
Stepper motors control) and
communicating with serial
interface
Franklin Server
Web interface by handling
multiple devices
Franklin C Driver
Handling
functions written
in C++
Franklin Python
Driver
mdashmdashmdashmdashmdashmdashmdashmdashmdashmdashmdashmdashmdashmdashmdashmdashmdashmdashmdashmdashmdashmdashmdashmdashmdashmdashmdashmdashmdashmdashmdashmdashmdashmdashmdashmdashmdashmdashmdashmdashmdashmdashmdashmdashmdashmdashndashmdashmdashmdashmdash
Steps in firmware x Desired distance
Actual distance traveled during testing (1)
The Z-axis travel was calculated as 254 mmrev by con-
verting the 0100-inch pitch for the 1rdquo-10-threads-per-inch
acme screw to metric units Finally the Theta-axis travel
has 500 teeth on the internal ring gear and 24 teeth on the
pinion thus from Equation 2 the table rotates 1728 de-
grees per motor revolution
(2)
Finally Table 2 shows that the Franklin software requires
an entry for stepsmm or stepsdegree for each motor based
on the motor stepper driver pulses per revolution The num-
ber of micro-step pulses per revolution are divided by the
travel per revolution for each axis as given by Equation 3
Franklin Coupling setting (stepsmm) =
Micro stepsAxis travel (mmrev or degreesrev) (3)
To finely tune the OSALS-Polar Equation 4 was used to
calculate a calibrated number of steps for the R- and Z-axes
(Pierce 2014) For the Theta-axis the distances were re-
placed with the desired and actual angles which can be cali-
brated by the same method
Calibrated Franklin Coupling setting (stepsmm) =
Original stepsmm in Franklin x Desired distance (4)
Actual distance traveled during testing
Absolute zero was calibrated by first marking the center
on the rotating table Reference positions are set by homing
the machine using the Franklin interface The limit switch
positions in Franklin are changed to specify the distance
between reference points and absolute zero For the R-axis
a fixed end stop was placed on the horizontal arm bracket
and the switch position calibrated to 820 mm in Franklin
Similarly for setting the Z-axis switch position can be cali-
brated by using a paper gage (01 mm thickness) on at least
four equiangular points of the circular base Currently the
Z-axis switch position was set to 96 mm For the Theta-axis
the reference point used was zero The movement accuracy
for the Z- and R-axes were tested by using dial indicators to
validate that the software could manually jog the axis the
desired distances For the theta axis one complete revolu-
tion is measured when the axis is jogged 360ordm When the
OSALS-Polar is successfully calibrated it is ready to create
a 3D-printed part
Results of 3D Printing
By manually jogging the Z- and R-axes in the Franklin
interface measurements taken with a 12-inch travel dial
indicator length gage indicate precision from zero to 1 mm
For the Theta-axis a 360ordm rotation varies within 1ordm indicat-
ed by an alignment mark on the table and stationary frame
Causes for variations in travel of the R- and Theta-axes are
due to the timing belt and gear as well as the ring gear and
pinion interfaces Adjusting the Theta-axis motor too tightly
against the internal ring gear will cause the gear teeth to
bind and stop rotating So the looser fit in the mating of the
gear teeth causes some backlash The R-axis belt having a
9525 mm pitch yields a travel of 17145 mm per motor
revolution so a finer pitch belt will improve the R-axis pre-
cision The Z-axis accuracy is due to the tight connection of
the motor shaft to the acme screw eliminating backlash and
slippage
Figure 13 shows various geometries for testing the
OSALS-Polar which include a cylinder and cuboid Initial
test results for the 50x50x5 mm-high part were unsuccessful
in achieving accurate and smooth surface results The print-
ing time was estimated at 15 minutes which was approxi-
mately the time for the trial test Figures 14 and 15 show the
actual printed part and the top surface which is angled low-
er towards the center of the printing surface This result was
consistent with all sample test prints and was likely caused
by the R-axis planar misalignment with the Theta-axis table
surface The R-axis arm deflected slightly downward as the
extruder mechanism reached the end of its travel at the cen-
ter of the table The deflection of the R-axis arm caused the
extruder nozzle to drag over the surface of the part as the
Theta-axis rotated and the R-axis translated thereby form-
ing a buildup of plastic on the leading edge of the printed
path
te e th r in g g e a rT h e ta -a x is tr a v e l (d e g re e s re v ) = 3 6 0
te e th p in io n
Axis Steps Number of teeth Pitch type Pitch
(inches) Pitch per revolution Micro-steps Actual Steps
r 200 18 Linear 0375 17145 mmrev 6400 3732 mm
theta 200 Pinion 24
Circular - 1728 degreesrev 6400 37037degree Ring Gear 500
z 200 - Acme 01 254 mmrev 800 31496mm
Table 2 Step values set in Franklin
mdashmdashmdashmdashmdashmdashmdashmdashmdashmdashmdashmdashmdashmdashmdashmdashmdashmdashmdashmdashmdashmdashmdashmdashmdashmdashmdashmdashmdashmdashmdashmdashmdashmdashmdashmdashmdashmdashmdashmdashmdashmdashmdashmdashmdashmdashndashmdashmdashmdashmdash
DEVELOPING AN OPEN SOURCE INEXPENSIVE LARGE-SCALE POLAR CONFIGURATION 3D PRINTER 19
mdashmdashmdashmdashmdashmdashmdashmdashmdashmdashmdashmdashmdashmdashmdashmdashmdashmdashmdashmdashmdashmdashmdashmdashmdashmdashmdashmdashmdashmdashmdashmdashmdashmdashmdashmdashmdashmdashmdashmdashmdashmdashmdashmdashmdashmdashndashmdashmdashmdashmdash
mdashmdashmdashmdashmdashmdashmdashmdashmdashmdashmdashmdashmdashmdashmdashmdashmdashmdashmdashmdashmdashmdashmdashmdashmdashmdashmdashmdashmdashmdashmdashmdashmdashmdashmdashmdashmdashmdashmdashmdashmdashmdashmdashmdashmdashmdashndashmdashmdashmdashmdash
20 INTERNATIONAL JOURNAL OF ENGINEERING RESEARCH AND INNOVATION | V11 N1 SPRINGSUMMER 2019
Figure 13 Cura file 50x50x5mm high
Figure 14 Initial test part 50x50x5mm high
Figure 15 Part accuracy
The results of the 50x50x5 mm-high part were difficult to
measure with precise accuracy due to the uneven surface
Unwanted movement of the horizontal arm was reduced by
adding additional screws to secure the vertical axis guide
rods to the mounting rails which improved the stability of
the arm The PLA material spool was removed from the
R-axis extruder assembly to decrease possible deflection of
the arm but this did not significantly improve print quality
The Theta- and R-axes motors need to move simultaneously
for the extruder tool to move in a straight line using conver-
sions performed in the Franklin C driver which sends the
Franklin Firmware a list of numbers of steps to move in
either the positive or negative direction The firmware takes
this list and sends the steps to the motors The reason for the
inaccuracies in the 3D-printed part can be attributed to the
Theta- and R-axes not operating simultaneously at the same
speed The Franklin coupling settings (stepsmm) in Delta-
style 3D printers using the Franklin Firmware have had all
motors for the extruder tool movement set to the same
stepmm value
Using a larger diameter nozzle will alleviate some inaccu-
racies due to the large scale of the OSALS-Polar and re-
duce overall printing time Proper retraction and travel
speed settings in the Cura software will minimize the string-
ing and oozing issues in the part Some of the other issues
that arose during testing included hot-end jamming though
only when the nozzle was too close to the table Adjusting
the Z-axis motor switch settings during the calibration pro-
cess will correct this problem
Conclusions
The advantages of the OSALS-Polar 3D printer include a
large print volume but with a large mechanical device
there are disadvantages in the scaling-up of inaccuracies in
planar and perpendicularity of components The OSALS-
Polar can successfully operate in the R- and Z-axes with
precision with 1 mm accuracy and in the Theta-axis within
1ordm The Franklin software efficiently controls the tempera-
ture of the hot end at the desired 210ordm C within a range of
plusmn2ordm The Franklin software can operate the extruder motor
to feed the 3-mm-diameter PLA material through the hot
end nozzle at the desired rate The G-code generated from
Cura for a cylinder and cuboid test are not producing an
accurate result at this time but all three axes are operating
automatically when the G-code is initiated
The OSALS-Polar is deemed a partial success at this
point due to having accomplished most of the projectrsquos
goals This printer was relatively inexpensive to constructmdash
under $5000 for materials It operates using open source
Franklin software that is continuously being improved The
mdashmdashmdashmdashmdashmdashmdashmdashmdashmdashmdashmdashmdashmdashmdashmdashmdashmdashmdashmdashmdashmdashmdashmdashmdashmdashmdashmdashmdashmdashmdashmdashmdashmdashmdashmdashmdashmdashmdashmdashmdashmdashmdashmdashmdashmdashndashmdashmdashmdashmdash
final testing of the system produced small extruded parts
although the accuracy and scaling up to larger-sized parts
was not accomplished Further work is planned in order to
determine if the inaccuracies in the printed parts are due to
the non-planar R-axis and Theta-axis table The level of the
R-axis arm and the printing surface can be adjusted with
metal shims New conversions may be necessary by the
Franklin C driver to take into account the differences in the
stepsmm Franklin coupling settings for the Theta- and
R-axes motors In the future testing of larger parts may
encounter limitations in the size of prints due to material
cooling at various rates and causing warpage
Acknowledgements
Appreciation for troubleshooting of the Franklin software
for Gerald Anzalone research engineer Michigan Techno-
logical University Also assistance in testing data collec-
tion and troubleshooting of the OSALS-Polar from MS in
Mechanical Engineering students Sachin Rana and Divy
Patel is much appreciated
References
About Polar 3D LLC (2014) Retrieved from https
aboutPolar3dcomprinter
Anderson T (2014) Theta printer A 3D printer with 4
extruders that can move independently and simultane-
ously Retrieved from httpshackadayioproject812-
theta-printer
Barnett E amp Gosselin C (2015) Large-scale 3D printing
with a cable-suspended robot Additive Manufacturing
7 27-44
Berman B (2012) 3-D printing The new industrial revolu-
tion Business Horizons 55(2) 155-162
Cano L M (2015) 3D printing A powerful new curricu-
lum tool for your school library a powerful new cur-
riculum tool for your school library Goleta CA ABC-
CLIO
Deshpande S Rao N Pradhan N amp Irwin J L (2016
November) Hybrid polymer additive manufacturing of
a Darrieus type vertical axis wind turbine design to
improve power generation efficiency Proceedings of
the ASME 2016 International Mechanical Engineering
Congress and Exposition New York ASME
France A K (2013) Make 3D printing The essential
guide to 3D printers Sebastapol CA Maker Media
Inc
Farcas K (2016) R 360 Retrieved from httprepraporg
wikiR_360
Gebler M Uiterkamp A J S amp Visser C (2014) A
global sustainability perspective on 3D printing tech-
nologies Energy Policy 74 158-167
Gibb A (2014) Building open source hardware DIY man-
ufacturing for hackers and makers Carmel IN Pear-
son Education
Horne R amp Hausman K K (2017) 3D printing for dum-
mies New York John Wiley amp Sons
Hoy B (2016) Design and implementation of a three di-
mensional printer using a cylindrical printing process
Retrieved from httpsdigitalcommonscalpolyeducgi
viewcontentcgireferer=httpssearchyahoocom
amphttpsredir=1amparticle=1370ampcontext=eesp
Irwin J (2013) Wind turbine blade CAD models used as
scaffolding technique to teach design engineers Engi-
neering Design Graphics Journal 77(2) 1949-1967
Pearce J M (2014) MOST RepRap build Retrieved from
httpwwwappropediaorg
MOST_RepRap_BuildCalibration
Pradhan N K Irwin J L Siddegowda B R amp Harsha
S (2016) Design and fabrication of the power trans-
mission system of a large scale 3D printer Proceedings
of the Association of Technology Management and
Applied Engineering Conference New York ATMAE
Replicator Warehouse R-360 The most simple and modu-
lar 3D printer (2013) Retrieved from https
wwwkickstartercomprojects2132002936r-360-the-
most-simple-and-modular-3d-printer
Sells E Bailard S Smith Z Bowyer A amp Olliver V
(2010) RepRap the replicating rapid prototyper Max-
imizing customizability by breeding the means of pro-
duction In F T Pillar amp M M Tseng (Eds) Hand-
book of research in mass customization and personali-
zation (pp 568-580) River Edge NJ World Scientific
Steele W (2013) PiMaker 3D printer Retrieved from
httpswwwthingiversecomthing128700
Wijnen B Anzalone G C Haselhuhn A S Sanders P
G amp Pearce J M (2016) Free and open source con-
trol software for 3-D motion and processing Journal of
Open Research Software 4(1) Retrieved from http
dxdoiorg105334jors78 Wittbrodt B T (2014) Development of practical applica-
tions for RepRap style 3-D printers in engineering
(Unpublished doctoral dissertation) Michigan Techno-
logical University Houghton MI
Wittbrodt B T Glover A G Laureto J Anzalone G
C Oppliger D Irwin J L amp Pearce J M (2013)
Life-cycle economic analysis of distributed manufactur-
ing with open source 3-D printers Mechatronics 23(6)
713-726
Wohlers T (2013) Wohlers report 2013 Additive manu-
facturing and 3D printing state of the industrymdashAnnual
worldwide progress report Fort Collins CO Wohlers
Associates
Yusuf B (2015) 3D printers explained Delta Cartesian
Polar Scara Retrieved from httpsall3dpcomknow-
your-fdm-3d-printers-cartesian-delta-Polar-and-scara
mdashmdashmdashmdashmdashmdashmdashmdashmdashmdashmdashmdashmdashmdashmdashmdashmdashmdashmdashmdashmdashmdashmdashmdashmdashmdashmdashmdashmdashmdashmdashmdashmdashmdashmdashmdashmdashmdashmdashmdashmdashmdashmdashmdashmdashmdashndashmdashmdashmdashmdash
DEVELOPING AN OPEN SOURCE INEXPENSIVE LARGE-SCALE POLAR CONFIGURATION 3D PRINTER 21
mdashmdashmdashmdashmdashmdashmdashmdashmdashmdashmdashmdashmdashmdashmdashmdashmdashmdashmdashmdashmdashmdashmdashmdashmdashmdashmdashmdashmdashmdashmdashmdashmdashmdashmdashmdashmdashmdashmdashmdashmdashmdashmdashmdashmdashmdashndashmdashmdashmdashmdash
mdashmdashmdashmdashmdashmdashmdashmdashmdashmdashmdashmdashmdashmdashmdashmdashmdashmdashmdashmdashmdashmdashmdashmdashmdashmdashmdashmdashmdashmdashmdashmdashmdashmdashmdashmdashmdashmdashmdashmdashmdashmdashmdashmdashmdashmdashndashmdashmdashmdashmdash
22 INTERNATIONAL JOURNAL OF ENGINEERING RESEARCH AND INNOVATION | V11 N1 SPRINGSUMMER 2019
Biographies
SOURABH PRASHANT DESHPANDE is a PhD stu-
dent in the Mechanical Engineering Program at the Univer-
sity of Cincinnati with a focus on additive manufacturing
Mr Deshpande may be reached at sourabhdmtuedu
SHRINIVAS KULKARNI is an MS student in the
Mechanical Engineering Program at Michigan Technologi-
cal University with a focus on additive manufacturing Mr
Kulkarni may be reached at skulkar2mtuedu
SID SHAH is an MS student in the Mechanical Engi-
neering Program at Michigan Technological University
with a focus on additive manufacturing Mr Shah may be
reached at ssshah1mtuedu
JOHN IRWIN is a professor of mechanical engineer -
ing technology at Michigan Technological University He
earned his EdD in Curriculum and Instruction in 2005 from
Wayne State University Dr Irwinrsquos research interests in-
clude STEM education CADCAM and CAE residential
wind turbine design and additive manufacturing methods
Dr Irwin may be reached at jlirwinmtuedu
-plate collector was enclosed by double-glazing that admit-
ted solar radiation and minimized convection heat transfer
losses to the environment The shell of the collector was
insulated to reduce conduction losses This system likewise
utilized a coiled copper heat exchanger coil to transfer heat
from the working fluid to an insulated storage tank The
water flow through the receiver was obtained by means of
an off-the-shelf circulation pump As described subsequent-
ly this system was then fully instrumented to measure the
working fluid flow rate and temperatures as well as the
receiver and cover plate temperature in an effort to esti-
mate thermal losses The goal of the present study was to
assess whether a solar water heating system constructed
using relatively inexpensive scavenged components could
exhibit thermal efficiency equivalent to that of a more ex-
pensive vacuum tube solar collector system that is available
for sale
It has been demonstrated (ASHRAE 2015) through the
use of STCs that the combination of effective convection
suppression and selective surface absorption yields im-
proved thermal efficiency at high temperatures Like the
FPC STCs collect both direct and diffuse radiation How-
ever their efficiency is higher at low incidence angles
which gives STC an advantage over FPC in day-long per-
formance Depending on the solar insolation level of the
locality the authors found that working fluid outlet temper-
atures of 80degC to 200degC can be achieved (Made-in-China
nd) Fundamental studies of STC thermal performance
have been reported by Duffie and Beckman (1991) Budi-
hardjo and Morrison (2009) Rittidech and Wannapakne
(2007) and Ma Lu Zhang and Liang (2010) Kim and Seo
(2007) and Shah and Furbo (2004) employed evacuated
tube collectors made from a two-layered glass tube with
circular fins and a U-tube absorber Measured collector
efficiencies were 558 and 60 respectively
The study reported by Tripanagnostopoulos Souliotis
and Nousia (2000) using a flat-plate collector model
achieved a minimum outlet temperature of 50C and had a
collector efficiency of 80 Zelzouli Guizani Sebai and
Kerkeni (2012) concluded that the number of FPCs that can
Abstract
The world runs on the energy generated from the com-
bustion of non-renewable energy sources such as fossil
fuels (coal petrol and diesel) causing an increase in atmos-
pheric pollution Due to recent scientific discoveries the
use of renewable energy sources is made possible economi-
cal and environmentally friendly Specifically solar energy
has the greatest potential of all the worldrsquos renewable ener-
gy sources To absorb the sunrsquos radiation and convert it to
heat solar collectors are needed This preliminary experi-
mental study focused on comparing the thermal perfor-
mance of a commercially marketed solar water heating sys-
tem that featured an evacuated-tube solar collector (STC) to
that of a system that utilized a flat-plate collector (FPC)
constructed using an air conditioning radiator as the collec-
tor The STC system generally exhibited a 14 higher effi-
ciency than the FPC system The FPC system was relatively
inefficient in the absence of direct sunlight whereas the
STC system remained effective even without direct solar
irradiation
Introduction
This investigation experimentally compared the thermal
performance of two solar water-heating systems One sys-
tem employed a commercially available heat pipe evacuated
-tube solar collector (STC) The system utilized a pump to
transfer the heated waterglycol mixture from the receiver
to an insulated storage tank The tank had a built-in copper
heat exchanger coil to transfer heat from the working fluid
to the potable water in the tank thereby preventing the two
fluids from mixing The complete closed-loop system in-
cluded an expansion tank and a control unit containing the
circulation pump pressure gauge tempering valve pressure
relief valve and flow meter The other system considered in
this study used a repurposed air conditioner radiator as a
flat-plate collector (FPC) It consisted of an array of serpen-
tine tubes through which water was circulated The pres-
ence of high-density corrugated fins attached to the tubes
increased the absorption of incident solar radiation The flat
mdashmdashmdashmdashmdashmdashmdashmdashmdashmdashmdashmdashmdashmdashmdashmdashmdashmdashmdashmdashmdashmdashmdashmdashmdashmdashmdashmdashmdashmdashmdashmdashmdashmdashmdashmdashmdashmdashmdashmdashmdashmdashmdashmdashmdashmdashndashmdashmdashmdashmdash
SV Vishnu Samudrala Zimmer Biomet Ahmed ElSawy Tennessee Technological University
Mohan Rao Tennessee Technological University Stephen Idem Tennessee Technological University
A COMPARATIVE STUDY OF THE THERMAL
EFFICIENCY OF SOLAR VACUUM-TUBE VERSUS
FLAT-PLATE COLLECTORS FOR WATER
HEATING SYSTEMS
mdashmdashmdashmdashmdashmdashmdashmdashmdashmdashmdashmdashmdashmdashmdashmdashmdashmdashmdashmdashmdashmdashmdashmdashmdashmdashmdashmdashmdashmdashmdashmdashmdashmdashmdashmdashmdashmdashmdashmdashmdashmdashmdashmdashmdashmdashmdashmdashmdashmdash
INTERNATIONAL JOURNAL OF ENGINEERING RESEARCH AND INNOVATION | V11 N1 SPRINGSUMMER 2019 23
mdashmdashmdashmdashmdashmdashmdashmdashmdashmdashmdashmdashmdashmdashmdashmdashmdashmdashmdashmdashmdashmdashmdashmdashmdashmdashmdashmdashmdashmdashmdashmdashmdashmdashmdashmdashmdashmdashmdashmdashmdashmdashmdashmdashmdashmdashndashmdashmdashmdashmdash
mdashmdashmdashmdashmdashmdashmdashmdashmdashmdashmdashmdashmdashmdashmdashmdashmdashmdashmdashmdashmdashmdashmdashmdashmdashmdashmdashmdashmdashmdashmdashmdashmdashmdashmdashmdashmdashmdashmdashmdashmdashmdashmdashmdashmdashmdashndashmdashmdashmdashmdash
24 INTERNATIONAL JOURNAL OF ENGINEERING RESEARCH AND INNOVATION | V11 N1 SPRINGSUMMER 2019
be connected in series is limited When collectors are con-
nected in series the outlet temperature of each collector
will increase when compared to parallel or series-parallel
connected collectors and this leads to an increase in ther-
mal losses due to increased temperature differences
Jouhari Touhmeh and Moukhayber (2015) demonstrated
that by combining both flat-plate and evacuated-tube collec-
tors the thermal performance of the compound collector
was improved Ben Slama (2012) conducted experiments
on an integrated flat-plateevacuated-tube collector and
found that the efficiency of double glazing was 42
whereas with single glazing the efficiency was 30
Shukla Sumathy Erickson and Goung (2013) summarized
the current state-of-the-art concerning system components
of solar water heaters such as the collector storage tank
and heat exchanger and likewise discussed various ap-
proaches to improving performance and cost effectiveness
of solar water heaters The FPC is usually permanently
fixed in position and does not require any tracking of the
sun The collectors should be placed directly towards the
equator facing due south in the northern hemisphere The
ideal tilt angle of the collector is equal to the latitude of the
location with angle variations of 10-15degC depending on
the application According to the test results of Duffie and
Beckman (1991) they are capable of producing tempera-
tures up to 100degC above the ambient temperature FPCs are
the most common type of collectors used in solar water
heating systems in Africa supplying hot water in hotels
hospitals and to wealthier households (Karaekezi amp Ranga
1997)
Experimental Setup
The STC utilized in this current study was a commercial-
ly available Duda Energy (model SC5815) solar collector
(Duda nd) It consisted of 15 parallel transparent glass
tubes supported on a frame and connected to a header pipe
In each instance the evacuated tube outer diameter was
58 mm (228 in) and the overall length was 180m
(709 in) The tubes were evenly spaced on the frame such
that the overall footprint of the STC was 2050 mm 1145
mm (807 in 467 in) complete details are provided in
Duda (nd) and Samudrala (2016) The STC was mounted
on the roof of a building with a pitch of approximately 28
and was oriented due south Reflective insulation was
placed beneath the STC to minimize losses and to enhance
the solar energy incident on the backside of the tube array
The flexible steel pipes leading tofrom the STC were
wrapped with standard 6-mm-thick (025 in) foam insula-
tion Each individual collector tube consisted of two con-
centric glass tubes The annulus between the tubes was
evacuated to minimize convection heat loss to the environ-
ment The tubes were constructed using borosilicate or soda
lime glass which is resistant to high temperatures and has a
high transmittance for solar irradiation A flat or curved
aluminum or copper fin was attached to a metal heat pipe
running through the inner tube The inner glass tube and fin
was covered with a selective coating that maximizes ab-
sorption of solar energy
The hollow copper heat pipe within the tube contained a
small volume of a low-pressure alcoholwater liquid as
well as some additional additives to prevent corrosion or
oxidation This partial vacuum enabled the liquid to vapor-
ize at a prescribed temperature which is lower than would
be possible at atmospheric pressure When solar radiation
was incident on the surface of the heat pipe the liquid in the
heat pipe was vaporized due to the absorption of heat
Therein the increased vapor pressure drove the hot vapor to
the top portion of the heat pipe which consisted of a ldquohot
bulbrdquo inserted through a copper well located within a con-
necting manifold A waterglycol mixture flowed through
the manifold and heat was transferred to the working fluid
as it flowed past the hot bulb condensers in the manifold
As the hot vapor in the heat pipe lost energy it cooled and
subsequently condensed Then it flowed back down the heat
pipe through a wickporous mesh by a combination of grav-
ity and capillary action This cyclic process of alternating
evaporation and condensation of the liquid within the sealed
heat pipe continued as long as radiant energy was incident
upon the vacuum tubes Per Tripanagnostopoulos et al
(2000) a depiction of the STC closed-loop solar water heat-
ing system is provided in Figure 1
Figure 1 STC solar water heating system Printed with
permission
mdashmdashmdashmdashmdashmdashmdashmdashmdashmdashmdashmdashmdashmdashmdashmdashmdashmdashmdashmdashmdashmdashmdashmdashmdashmdashmdashmdashmdashmdashmdashmdashmdashmdashmdashmdashmdashmdashmdashmdashmdashmdashmdashmdashmdashmdashndashmdashmdashmdashmdash
The working station supplied with the STC system in-
cluded an integrated flow meter with a digital display Like-
wise the working station contained a flow controller and
pressure relief valve The water storage tank used in con-
junction with the STC system consisted of two concentric
tanks one larger and one smaller The annular gap between
the tanks was filled with mineral wool to reduce heat loss
Copper-constantan thermocouples were mounted at the inlet
and outlet of the STC header to record the waterglycol
temperatures The ambient temperature and solar insolation
data were downloaded directly from a local weather station
Further details regarding this aspect of the current study are
available in the study by Samudrala (2016)
The FPC considered in this current study (Chittireddy
2017 Chittireddy ElSawy amp Idem 2018) was fully instru-
mented to measure such variables as water flow rate and
temperature rise solar insolation and receiver and cover
plate temperatures Figure 2 shows a photograph of the ap-
paratus Throughout the experiments the flat-plate receiver
was positioned to face directly south and was inclined at an
angle so that solar insolation was directed normally onto the
apparatus This orientation was maintained throughout the
duration of the experiments Major components of the FPC
solar collector system considered in this study were
1 The receiver plate (a repurposed air conditioner radi-
ator)
2 A water storage tank
3 The casing for the collector and insulation on the
bottom to reduce heat loss
4 Two layers of glazing cover
5 A linear actuator to control the inclination of the col-
lector
6 A water-circulating pump
Figure 2 FPC solar water heating system Printed with
permission
Other components of the FPC system included calibrated
temperature sensors a water mass flow-rate sensor and a
data acquisition system An air conditioner radiator was
selected as the receiver plate The radiator coil consisted of
a single continuous serpentine tube configured in three rows
by means of headers Each row of the radiator had 22
straight finned-tube sections that were parallel to one anoth-
er and were arranged in a single plane The thickness of the
fins was 025 mm and there were 591 continuous plate fins
per meter The cross-sectional area of the receiver plate was
073m 056m The material of the tubes was copper and
the fins were constructed from aluminum These fins were
coated with black paint to increase solar heat absorptivity
Two acrylic sheets were employed as glazing for the FPC
Plexiglas was used because it has a transmittance closely
equivalent to optical glass The total light transmittance of
Plexiglas is 92 and the emissivity is 086 (Chittireddy
et al 2018) Radiation losses from the glass cover were
reduced since it is transparent to the short-wave radiation
emitted by the sun and is nearly opaque to long-wave ther-
mal radiation emitted by the absorber plate
In this experiment double parallel glazing was used
Each glazing had a thickness of 6 mm The distance be-
tween the two cover plates was 19 mm and distance be-
tween the absorber plate and the lower cover plate was
36 mm Eleven copper-constantan thermocouples were used
to measure the temperature at prescribed locations on the
receiver and cover plates as well as the inlet and water tem-
peratures Three thermocouples were mounted to the upper
cover plate three were attached to the lower cover plate
and three thermocouples were affixed to the receiver plate
and the resulting values were averaged Two thermocouples
were used to measure the inlet and outlet temperatures of
the receiver plate by inserting them directly into the 13-mm
-diameter steel pipes leading tofrom the copper pipes in the
radiator Prior to installation in the solar water heater each
temperature sensor was calibrated using a reference immer-
sion thermometer
Water flow was measured using a calibrated flow sensor
The flow sensor required a voltage input of 5-18VDC
(supplied by the data acquisition system) It was capable of
measuring flow rates from 1 to 30 Lmin over a temperature
range of -25ordmC to +80ordmC The water flow sensor was in-
stalled in a 15m-long pipe which was between the outlet of
the collector and the storage tank A sufficient length of
pipe was employed upstream of the flow sensor to ensure
that the entering flow was fully developed The casing re-
ceiver plate and water storage tank used with the FPC were
mounted on a moving trolley The data acquisition system
was placed on another moving trolley Each time an experi-
ment was performed the experimental setup mounted on
mdashmdashmdashmdashmdashmdashmdashmdashmdashmdashmdashmdashmdashmdashmdashmdashmdashmdashmdashmdashmdashmdashmdashmdashmdashmdashmdashmdashmdashmdashmdashmdashmdashmdashmdashmdashmdashmdashmdashmdashmdashmdashmdashmdashmdashmdashndashmdashmdashmdashmdash
A COMPARATIVE STUDY OF THE THERMAL EFFICIENCY OF SOLAR VACUUM-TUBE VERSUS FLAT-PLATE COLLECTORS 25
FOR WATER HEATING SYSTEMS
Actuator
Insulated water tank
Solar collector
mdashmdashmdashmdashmdashmdashmdashmdashmdashmdashmdashmdashmdashmdashmdashmdashmdashmdashmdashmdashmdashmdashmdashmdashmdashmdashmdashmdashmdashmdashmdashmdashmdashmdashmdashmdashmdashmdashmdashmdashmdashmdashmdashmdashmdashmdashndashmdashmdashmdashmdash
mdashmdashmdashmdashmdashmdashmdashmdashmdashmdashmdashmdashmdashmdashmdashmdashmdashmdashmdashmdashmdashmdashmdashmdashmdashmdashmdashmdashmdashmdashmdashmdashmdashmdashmdashmdashmdashmdashmdashmdashmdashmdashmdashmdashmdashmdashndashmdashmdashmdashmdash
26 INTERNATIONAL JOURNAL OF ENGINEERING RESEARCH AND INNOVATION | V11 N1 SPRINGSUMMER 2019
the trolleys was moved out into an open area to receive so-
lar radiation In every instance the solar water heater was
manually positioned facing south during the acquisition of
performance data Once the setup was initially positioned
the setup was not further adjusted (ie solar tracking was
not employed while measurements were being performed)
The casing was placed on horizontal bars capable of mov-
ing vertically The horizontal bar was connected to a
12VDC linear actuator to raise the casing vertically and to
align the receiverrsquos placement so that it was perpendicular
to the solar irradiation at the start of the experiments The
storage tank was placed under the casing and a 12VDC cir-
culating pump was connected to circulate the heat transfer
fluid through the solar collector
The solar thermal systems utilized solar collectors located
remotely from the storage tank Both systems used a pump
to circulate a waterpropylene glycol mixture between the
storage tank and the collector in a continuous loop and back
again to the storage tank In each instance a copper heat
exchanger coil located in the insulated storage tank was
used to transfer heat acquired by the collectors from work-
ing fluid to the potable water present in the tank without
mixing the fluids together In general this is advantageous
since the storage tanks can be placed indoors reducing heat
loss in winter months In addition backup heating systems
may be installed in the storage tanks to supply enough heat
to meet the demands of the user in case of cloudy or rainy
weather Furthermore this permits placing the tank close to
where the water will be used thereby reducing the time
needed for hot water to flow from the tap
Data Acquisition and Reduction
A Raspberry Pi system was used to connect all of the
temperature sensors for data acquisition The Raspberry Pi
is a low-cost credit card-sized computer that plugs into a
computer monitor or TV and uses a standard keyboard and
mouse A simple Python code was used to configure the
temperature sensors The data were collected and exported
to a csv file for further analysis An open source computer
hardware and software system was used to acquire the data
from each of the experimental setups The performance of a
solar water heater was characterized by how efficiently it
could convert the energy of incident solar energy to a corre-
sponding increase in the temperature of a circulating hot
waterglycol mixture The thermal efficiency of each collec-
tor considered in the present study was calculated using
Equation 1
(1)
where
ṁ = Mass flow rate in kgsec
Cp = Specific heat capacity in Jkg-K
Ac = Collector area in m2
Gt = Global solar radiation on the collector in Wm2
To = Collector outlet temperature in K
Ti = Collector inlet temperature in K
In this instance ṁ refers to the measured waterglycol
mass flow rate through the system and To and Ti are the
temperatures recorded at the collator inlet and outlet re-
spectively The quantity Gt is the measured solar radiation
incident upon the collectors as measured by the local
weather station Likewise AC denotes the effective cross
section of each collector and CP indicates the average
working fluid specific heat
Results
The testing of the STC and FPC solar water heating sys-
tems was performed under different ambient seasonal tem-
peratures Various weather conditionsmdashcloudy rainy and
sunnymdashwere encountered throughout the test program The
measurements were conducted approximately five hours a
day and were initiated around noon when the sun was at its
highest elevation The data were acquired every 13 seconds
throughout the test cycle Figure 3 illustrates the perfor-
mance of the STC system on different days subject to dis-
parate ambient temperatures and levels of solar insolation
in terms of the measured outlet waterglycol temperatures
At noon (peak incident solar radiation) the collector effi-
ciency calculated by means of Equation 1 for cold weather
conditions was 698 At that time the global solar radia-
tion was found to be 812 Wattm2 The useful energy col-
lected was 1136 kJday By comparison measurements
conducted later in the season under warm conditions yield-
ed a calculated collector efficiency at noon of 815 when
the measured global solar irradiation was found to be
842 Wattm2 The energy collected in the STC system was
determined to be 1401 kJday Under similar conditions of
ambient temperature and incident radiation intensity STC
systems exhibited approximately 14 higher efficiency
than the FPC system
Figure 4 shows a comparison of the thermal performance
of the STC and the FPC solar water heating systems consid-
ered in this study on the same day Both systems were
charged with a similar waterglycol mixture In this in-
stance the initial ambient temperature was 71F At the
start of the experiments the measured waterglycol temper-
ature stored in the insulated tank in the STC apparatus was
79F whereas the corresponding initial waterglycol tem-
perature for the FPC system was 98F At the end of experi-
p o i
c
c t
m C T T η
A G
mdashmdashmdashmdashmdashmdashmdashmdashmdashmdashmdashmdashmdashmdashmdashmdashmdashmdashmdashmdashmdashmdashmdashmdashmdashmdashmdashmdashmdashmdashmdashmdashmdashmdashmdashmdashmdashmdashmdashmdashmdashmdashmdashmdashmdashmdashndashmdashmdashmdashmdash
ment the solar vacuum tube collector waterglycol tempera-
ture reached 147F This temperature was similar to that of
the flat-plate collector both systems yielded the same outlet
temperature over the duration of the experiments but the
STC temperature rose to its final value more quickly Since
the ambient temperature was warm the collectors per-
formed similarly
Figure 3 STC performance comparison in cold and warm
weather
Figure 4 Daily performance comparison of STC and FPC solar
water heating systems in warm weather
Figure 5 provides an additional comparison of the STC
and FPC solar water heating systems At the start of the
experiments the ambient temperature was 86F In this
case the initial waterglycol temperature for the STC sys-
tem was also 86F However at the start of the measure-
ments the working fluid temperature in the FPC system
was 80F Upon the completion of the tests the final water
glycol temperature recorded leaving the STC system was
134F and the equivalent temperature for the FPC was
130F In this instance the STC system yielded a higher
final temperature but for both systems the rate of tempera-
ture increase was almost identical The calculated collector
efficiency of the STC system at noon was determined to be
887 when the incident solar radiation was 904 Wm2
That corresponded to a useful daily energy collection for
the STC system of 1636 kJday
Figure 5 Daily performance comparison of STC and FPC solar
water heating systems in hot weather
Conclusions
This preliminary study compared the thermal perfor-
mance of a commercially marketed solar water heating sys-
tem that featured an evacuated-tube solar collector to that of
a system that utilized a flat-plate collector constructed using
an air conditioning radiator as the collector Although an
extensive side-by-side comparison of the thermal efficiency
of the two systems proved to be impractical the STC sys-
tem generally exhibited a 14 higher efficiency than the
FPC system It should be pointed out that the water heater
systems considered in this study employed different water
glycol mixture flow rates and had unequal cross sections
Likewise the same inclination angle of each collector was
not consistent and each system utilized different storage
tanks that were not equally insulated Collectively these
differences between the two solar heating systems make it
difficult to definitively compare the two approaches in
terms of thermal efficiency
While flat-plate collectors are widely used in solar water
heating applications they are inefficient in the absence of
direct sunlight By comparison STC systems are relatively
more effective even without direct solar irradiation The
simple flat-plate collector considered in this study was as-
sembled using readily available spare components It was
designed to work in sunny and warm climates However
the benefit of using the FPC system was reduced when
there were cloudy rainy or windy weather conditions So-
lar water heating systems that employ evacuated-tube col-
mdashmdashmdashmdashmdashmdashmdashmdashmdashmdashmdashmdashmdashmdashmdashmdashmdashmdashmdashmdashmdashmdashmdashmdashmdashmdashmdashmdashmdashmdashmdashmdashmdashmdashmdashmdashmdashmdashmdashmdashmdashmdashmdashmdashmdashmdashndashmdashmdashmdashmdash
A COMPARATIVE STUDY OF THE THERMAL EFFICIENCY OF SOLAR VACUUM-TUBE VERSUS FLAT-PLATE COLLECTORS 27
FOR WATER HEATING SYSTEMS
mdashmdashmdashmdashmdashmdashmdashmdashmdashmdashmdashmdashmdashmdashmdashmdashmdashmdashmdashmdashmdashmdashmdashmdashmdashmdashmdashmdashmdashmdashmdashmdashmdashmdashmdashmdashmdashmdashmdashmdashmdashmdashmdashmdashmdashmdashndashmdashmdashmdashmdash
mdashmdashmdashmdashmdashmdashmdashmdashmdashmdashmdashmdashmdashmdashmdashmdashmdashmdashmdashmdashmdashmdashmdashmdashmdashmdashmdashmdashmdashmdashmdashmdashmdashmdashmdashmdashmdashmdashmdashmdashmdashmdashmdashmdashmdashmdashndashmdashmdashmdashmdash
28 INTERNATIONAL JOURNAL OF ENGINEERING RESEARCH AND INNOVATION | V11 N1 SPRINGSUMMER 2019
lectors similar to those employed in the present study may
be more energy efficient than the flat-plate collectors due
to their unique construction Since the concentric coated-
glass tubes are vacuum-sealed heat loss associated with
convection heat transfer is reduced to a great extent Alt-
hough the STC system was deemed more thermally effi-
cient it was far more expensive than the FPC system How-
ever a detailed analysis of the relative initial and annual
operating costs of the two systems was beyond the scope of
the present study
References
ASHRAE (2015) Handbook HVAC applications Atlanta
ASHRAE
Ben Slama R (2012) Experimentation of a plane solar
integrated collector storage water heater Energy and
Power Engineering 4(2) 67-76
Budihardjo I amp Morrison G L (2009) Performance of
water-in-glass evacuated tube solar water heaters
Solar Energy 83(1) 49-56
Chittireddy V R (2017) A study of flat plate solar
collector with air conditioner radiator as absorber
plate (Masterrsquos thesis) Retrieved from ProQuest
Dissertations and Theses Database (UMI No
10246377)
Chittireddy V R ElSawy A amp Idem S (2018) Study of
a flat plate solar collector with an air conditioner
radiator as a heat absorber for a domestic water
heater Paper presented at the International Conference
on Renewable Energies and Power Quality doi https
doiorg1024084repqj16205
Duda diesel (nd) Retrieved from https
wwwdudadieselcom
Duffie J A amp Beckman W A (1991) Solar engineering
of thermal processes 2nd ed New York Wiley-
Interscience
Jouhari M Touhmeh S amp Moukhayber N (2015)
Manufacturing and thermal performance test of
(compound) solar collector in Damascus City Journal
of Biomedical Science and Engineering 8(6) 370-379
Karaekezi S amp Ranga T (1997) Renewable energy
technologies in Africa London Zed Book Ltd
Kim Y amp Seo T (2007) Thermal performances
comparisons of the glass solar vacuum tube solar
collectors with shapes of absorber tube Renewable
Energy 32(5) 772-795
Ma L Lu Z Zhang J amp Liang R (2010) Thermal
performance analysis of the glass Solar Vacuum tube
collector with U-tube Building and Environment 45
(9) 1959-1967
Made-in-China (nd) Retrieved from httpswwwmade-in
-chinacom
Rittidech S amp Wannapakne S (2007) Experimental
study of the performance of a solar collector by closed-
end oscillating heat pipe (CEoHP) Applied Thermal
Engineering 27 1978-1985
Samudrala S V Vishnu (2016) A comparative study on
the thermal efficiency of solar vacuum-tube vs flat-
plate collectors for water heating systems (Masterrsquos
thesis) Retrieved from ProQuest Dissertations and
Theses Database (UMI No 10243376)
Shah L J amp Furbo S (2004) Vertical evacuated tubular-
collectors utilizing solar radiation from all directions
Applied Energy 78(4) 371-395
Shukla R Sumathy K Erickson P amp Goung J (2013)
Recent advances in the solar water heating systems A
review Renewable and Sustainable Energy Reviews
19 173-190
Tripanagnostopoulos Y Souliotis M amp Nousia T
(2000) Solar collectors with colored absorbers Solar
Energy 68(4) 343-356
Zelzouli K Guizani A Sebai R amp Kerkeni C (2012)
Solar thermal systems performances versus flat plate
solar collectors connected in series Engineering 4(12)
881-893
Biographies
VENKAT VISHNU DEEPAK SAMUDRALA is a
manufacturing engineer at Zimmer Biomet and holds an
MS degree from Tennessee Technological University
(2016) in mechanical engineering He was born in Hydera-
bad India and holds a BS degree from SCSVMV Universi-
ty India (2010) in mechanical engineering While pursuing
his BS degree he developed a profound interest in energy
systems which inspired him to work on solar water heating
systems as his masterrsquos thesis Currently he lives in Mem-
phis Tennessee and is working on a continuous improve-
ment project focused on reducing product manufacturing
time Mr Samudrala may be reached at
ssamudral42studentstntechedu
AHMED ELSAWY joined Tennessee Technological
University as a professor and chairperson in the Department
of Manufacturing and Engineering Technology in July
1999 Prior to joining TTU he was a professor and graduate
program coordinator in the Department of Industrial Tech-
nology at the University of Northern Iowa the founding
director of the Manufacturing Engineering Program at St
Cloud State University in Minnesota and a full professor at
the Department of Mechanical Design and Production Engi-
neering at Cairo University His teaching and research inter-
ests include material processing metallurgy and manufac-
turing systems recycling and reuse of solid waste materials
renewable energy and sustainability Dr Elsawy advised
mdashmdashmdashmdashmdashmdashmdashmdashmdashmdashmdashmdashmdashmdashmdashmdashmdashmdashmdashmdashmdashmdashmdashmdashmdashmdashmdashmdashmdashmdashmdashmdashmdashmdashmdashmdashmdashmdashmdashmdashmdashmdashmdashmdashmdashmdashndashmdashmdashmdashmdash
several masterrsquos and doctoral students who hold academic
and industrial positions in the USA Germany and Taiwan
Dr Elsawy may be reached at aelsawytntechedu
MOHAN D RAO is a professor and chair of Mechan-
ical Engineering at Tennessee Technological University
Previously he was a professor of Mechanical Engineering
at Michigan Tech Dr Rao is a fellow of ASME and SAE
He has conducted research in different areas of automotive
body and powertrain dynamics acoustics and vibration
over a span of 30 years He has over 100 publications in
technical journals and conference proceedings He has ad-
vised 9 PhD and 35 MS students Dr Rao has received a
US Fulbright award National Science Foundation Research
Initiation award and was honored by the NASA Marshall
Space Flight Center for his work on the damping of the
Hubble Space Telescope truss system Dr Rao may be
reached at mraotntechedu
STEPHEN IDEM is a professor in the Depar tment of
Mechanical Engineering at Tennessee Tech University He
received his PhD in mechanical engineering from Purdue
University He has more than 30 years of experience in the
areas of scale model testing fluid flow measurement and
thermal modeling Currently he is engaged in projects to
measure airflow and pressure loss characteristics of residen-
tial HVAC duct systems He has created a numerical model
of downdraft evaporative cooling tower performance which
is being verified experimentally He has extensive experi-
ence performing flow and pressure measurements on scale
models of primary and secondary air supply ducts wind
boxes and exhaust stacks of coal-fired power plants to im-
prove their thermal performance He has developed an
online cleanliness factor model of the convection passes in
coal-fired power plants He has likewise created numerical
models of transient heat exchanger performance Dr Idem
may be reached at sidemtntechedu
mdashmdashmdashmdashmdashmdashmdashmdashmdashmdashmdashmdashmdashmdashmdashmdashmdashmdashmdashmdashmdashmdashmdashmdashmdashmdashmdashmdashmdashmdashmdashmdashmdashmdashmdashmdashmdashmdashmdashmdashmdashmdashmdashmdashmdashmdashndashmdashmdashmdashmdash
A COMPARATIVE STUDY OF THE THERMAL EFFICIENCY OF SOLAR VACUUM-TUBE VERSUS FLAT-PLATE COLLECTORS 29
FOR WATER HEATING SYSTEMS
ra 1992) dimension reduction and noise removal
(Sheybani 2011) and senior design (Garcia-Otero amp Shey-
bani 2011)
RF engineers specialize in creating various devices that
operate within the radio frequency spectrum Some of the
devices they work with include antennas radios WiFi and
mobile phones In this current study the RF engineer was in
the process of developing an antenna for a NASA project
called EcoSAR a radar tool designed to help scientists bet-
ter understand the carbon cycle by measuring biomass for-
est height density and extent This project was designed to
help him by creating a GUI that could import analyze and
export data
Technical Details
A GUI is a type of computer-human interface on a com-
puter It solves the blank screen problem that confronted
early computer users (Norman 1988) A computer-human
interface is a ldquomeans by which people and computers com-
municate with each otherrdquo (Interface 2019) GUI binds the
user of the computer system to the operation and potential
of the computer system More specifically a GUI is a speci-
fication for the look and feel of the computer sys-
tem (Bonsiepe 1989) GUIs usually have common charac-
teristics such as windows icons menus and pushbuttons
(WIMP) Collectively WIMPs are pictures that bring forth
a certain action or action space The user issues commands
via the GUI to computer applications GUIs usually have
three major components (Hayes amp Baran 1989) a window-
ing system an imaging model and an application program
interface (API) The windowing system builds the windows
menus and dialog boxes that appear on the screen The im-
aging model defines the fonts and graphics that appear on
the screen WIMPs are products of both the windowing sys-
tem and imaging model Finally the API is the means by
which the user specifies how and what windows and
graphics appear on the screen
The proposed GUI consists of the following platforms
data input selection menu scientific computation and re-
sults display The scientific computations include file type
conversion S-parameter polar-rectangular conversion
Smith chart and graphsplots The GUI was designed in
MATLAB and as a result MATLAB libraries were used
for parts of the design and development of the GUI
Abstract
In this paper the authors describe the requirements and
features necessary to develop a GUI for RF airborne space-
craft and satellite communications The proposed GUI is
responsive to the variety of devices and tools an RF engi-
neer would need to accomplish everyday tasks This in-
cludes but is not limited to Smith charts polar plots Bode
diagrams and different types of data files associated with
these graphs or charts The GUI was designed and devel-
oped in MATLAB with Adobe Photoshop used to create a
custom background The user interface was fully tested and
validated for functionality and ability to import plot and
export data for Smith charts polar plots and Bode dia-
grams The GUI also has a toolbar file browser with picture
display custom background and a static textbox that dis-
plays the plotted data
Introduction
Following are the details of the steps that were taken in
order to apply signal processing and data analytics algo-
rithms in the design of a graphical user interface (GUI) for
satellite and RF communications Users may follow these
steps with the specified set of hardware and software to get
the same configuration on the proper RF communications
and device design These projects were implemented under
the supervision of NASA scientists and faculty advisors in
dedicated NASA labs Using lessons learned in this study
and the authorsrsquo previous experience in data visualization
and signal processing research and training relevant labs
were designed to enhance the Computer Engineering pro-
gram at the Virginia State University (VSU) The classes
and labs covered a variety of topics including computer
simulations and networking (Javidi amp Sheybani 2008)
(Sheybani amp Javidi 2007) visualization and virtual labs
(Sheybani amp Javidi 2006) image processing (Sheybani
Garcia-Otero Adnani amp Javidi 2012) game design
(Ouyang Yang Franklin Michaelson Morge et al 2010)
STEM education (Javidi amp Sheybani 2008) (Javidi amp
Sheybani 2010) spike removal (Sheybani Mengshoel amp
Poll 2010) feature detection (Varde Rundensteiner Javidi
Sheybani amp Liang 2007) wireless communications (Hardy
Javidi Denton Campbell amp Sheybani 2007) (Badombena-
Wanta amp Sheybani 2010) network architecture (Sheybani
amp Sankar 2002) optical communications (Sheybani amp Aro-
mdashmdashmdashmdashmdashmdashmdashmdashmdashmdashmdashmdashmdashmdashmdashmdashmdashmdashmdashmdashmdashmdashmdashmdashmdashmdashmdashmdashmdashmdashmdashmdashmdashmdashmdashmdashmdashmdashmdashmdashmdashmdashmdashmdashmdashmdashndashmdashmdashmdashmdash Ehsan Sheybani University of South Florida Giti Javidi University of South Florida
DESIGN AND DEVELOPMENT OF A GUI
FOR RF COMMUNICATIONS
mdashmdashmdashmdashmdashmdashmdashmdashmdashmdashmdashmdashmdashmdashmdashmdashmdashmdashmdashmdashmdashmdashmdashmdashmdashmdashmdashmdashmdashmdashmdashmdashmdashmdashmdashmdashmdashmdashmdashmdashmdashmdashmdashmdashmdashmdashndashmdashmdashmdashmdash
30 INTERNATIONAL JOURNAL OF ENGINEERING RESEARCH AND INNOVATION | V11 N1 SPRINGSUMMER 2019
mdashmdashmdashmdashmdashmdashmdashmdashmdashmdashmdashmdashmdashmdashmdashmdashmdashmdashmdashmdashmdashmdashmdashmdashmdashmdashmdashmdashmdashmdashmdashmdashmdashmdashmdashmdashmdashmdashmdashmdashmdashmdashmdashmdashmdashmdashndashmdashmdashmdashmdash
The GUI is capable of importing three main data types
(CSV) (DAT) and (SNP) files CSV stands for a ldquocomma
separated valuerdquo This is a plain text file that separates each
form of data with a comma Figure 1 shows how CSV files
can be written in either Notepad or Excel and when used
properly they can import and export data from Excel to
MATLAB and vice versa
Figure 1 A CSV file written in Notepad
DAT files are primarily associated with ldquodatardquo They can
be used to store various types of data such as text graphics
attachments in emails and general binary code In most
instances it is best to open a DAT file with the program that
created it Users can also open a DAT file with an editor
such as Notepad to view the contents inside However it is
not guaranteed that all of the contents of the file will be
readable when using an editor to open it SNP files which
are also known as touchtone files have five different file
types (S1P) (S2P) (S3P) (S4P) and (SNP) The differ-
ences between these file types are the number of ports pre-
sent (see Table 1)
Table 1 The number of ports and S-parameters associated with
each file type
The ldquoSrdquo in S-parameters stands for scattering Figure 2
shows examples of how S-parameters come in matrices with
the number of rows and columns equal to the number of
ports These S-matrices allow users to describe complicated
networks as ldquoblack boxesrdquo (Zhou amp Chen 2008)
S-parameters are considered complex because both phase
and magnitude change the network However most micro-
wave and RF engineers are only concerned with the magni-
tude These engineers use S-parameters to refer to the RF
ldquovoltage out vs voltage inrdquo
Figure 2 S-parameter matrices
(S11) Refers to the reflection on port 1 as an inci-
dence of port 1
(S12) Refers to the reflection on port 1 as an inci-
dence of port 2
(S22) Refers to the reflection on port 2 as an inci-
dence of port 2
(S21) Refers to the reflection on port 2 as an inci-
dence of port 1
Since three-port measurements are extremely difficult to
obtain accurately the authors chose to focus only on one-
and two-port systems However the aforementioned meth-
odology would continue for all of the S-parameters present
These data formats are all associated with specific graphs
Figure 3 shows that the first graph the Bode diagram con-
sists of both phase and magnitude plots The magnitude plot
expresses the magnitude of the frequency response gain
either linearly or in decibels The phase plot expresses the
frequency response phase shift in either degrees or radians
(Zhou amp Chen 2008)
Figure 3 A Bode diagram
mdashmdashmdashmdashmdashmdashmdashmdashmdashmdashmdashmdashmdashmdashmdashmdashmdashmdashmdashmdashmdashmdashmdashmdashmdashmdashmdashmdashmdashmdashmdashmdashmdashmdashmdashmdashmdashmdashmdashmdashmdashmdashmdashmdashmdashmdashndashmdashmdashmdashmdash
DESIGN AND DEVELOPMENT OF A GUI FOR RF COMMUNICATIONS 31
File type Number of ports Number of
S-parameters saved
s1p 1 1
s2p 2 4
s3p 3 9
s4p 4 16
sNp N N2
1 1 o n e -p o r tS
1 1 1 2
2 1 2 2
tw o -p o r tS S
S S
1 1 1 2 1 3
2 1 2 2 2 3
3 1 3 2 3 3
th re e -p o r t
S S S
S S S
S S S
mdashmdashmdashmdashmdashmdashmdashmdashmdashmdashmdashmdashmdashmdashmdashmdashmdashmdashmdashmdashmdashmdashmdashmdashmdashmdashmdashmdashmdashmdashmdashmdashmdashmdashmdashmdashmdashmdashmdashmdashmdashmdashmdashmdashmdashmdashndashmdashmdashmdashmdash
mdashmdashmdashmdashmdashmdashmdashmdashmdashmdashmdashmdashmdashmdashmdashmdashmdashmdashmdashmdashmdashmdashmdashmdashmdashmdashmdashmdashmdashmdashmdashmdashmdashmdashmdashmdashmdashmdashmdashmdashmdashmdashmdashmdashmdashmdashndashmdashmdashmdashmdash
32 INTERNATIONAL JOURNAL OF ENGINEERING RESEARCH AND INNOVATION | V11 N1 SPRINGSUMMER 2019
Figure 4 shows the next graph a polar plot This is a two-
dimensional system that plots polar coordinates in a Carte-
sian plane and then draws the polar grid on the plane These
plots sometimes display the voltage reflection coefficient
This plays an important role in helping microwave engi-
neers with impendence matching Polar plots are also simi-
lar to X amp Y plots However instead of plotting data at
X versus Y they plot ldquoRrdquo (magnitude) at an angle between
0 and 360 degrees
Figure 4 A polar plot
Figure 5 shows the last graph a Smith chart The capabil-
ities of this chart are limitless and it is standard in micro-
wave engineering The Smith chart is a plot of complex
reflection overlaid with impendence andor admittance grids
referenced to a 1-ohm characteristic impendence Smith
charts help assist RF engineers in many ways but some of
the most notable tasks include impendence matching dis-
playing antenna impendence and visualizing the impend-
ence of a transmission line There are two types of Smith
charts the classic chart displays only positive real impend-
ences while the more modern chart displays imaginary im-
pendences from negative infinity to positive infinity (Gawa
2006)
Methods and Procedures
To create this GUI MATLAB was used to program
develop the GUI and Adobe Photoshop was used to create
the custom background The hardest part of the project was
writing the code to make the GUI accomplish various tasks
When complications were encountered the authors used
various problem-solving methods The ldquohelprdquo and ldquodocrdquo
functions in MATLAB and MATLAB online forums were
used extensively General steps to implementing this project
were as follows
1 Researching data types and graphs
2 Brainstorming what the end result should look like
3 Creating flow charts
4 Developing program code
5 Ensuring the GUI could accomplish the assigned
tasks
6 Creating a custom background
7 Adding extras (static text display toolbar file brows-
er etc)
8 Cleaning up code for efficiency
9 Finishing poster and final paper
Figure 5 A Smith chart
Results and Discussion
Figure 6 shows the completed GUI One attractive feature
is the backgroundlayout This custom background was cre-
ated in Photoshop and saved as a JPG and then placed on a
panel in MATLAB The background of the GUI needed a
visual appeal or style to it The panels helped increase the
overall intuitiveness of the design This was because it gave
everything its own special area as opposed to the thin and
basic borders MATLAB had to offer The input function
was placed in the toolbar of the GUI From there one can
select and import files located within the file directory The
GUI was programmed to automatically plot the Smith chart
polar plot and Bode diagram when certain data were im-
ported allowing the user to import any file type and still
plot it correctly In addition to these features the input al-
lows the user to import M-files as well Figure 7 shows how
to access the import feature using the path File Open
(Select Data) Open
mdashmdashmdashmdashmdashmdashmdashmdashmdashmdashmdashmdashmdashmdashmdashmdashmdashmdashmdashmdashmdashmdashmdashmdashmdashmdashmdashmdashmdashmdashmdashmdashmdashmdashmdashmdashmdashmdashmdashmdashmdashmdashmdashmdashmdashmdashndashmdashmdashmdashmdash
Figure 6 The completed GUI
Figure 7 GUI file menu
Another feature added to the GUI was the ability to graph
multiple plots By using this feature two sets of data could
be displayed on one plot simultaneously Figure 8 shows
how this can be highly effective in helping RF engineers
compare results
Figure 8 Multiple sets of data plotted on one Smith chart
An export button was also created that allows the user to
export data anywhere within the file directory However
instead of an ldquoopenrdquo button the user would see a ldquosaverdquo
option To access the import feature File Save (Name
amp Location) Save
The Bode diagram section is located in the large rectangu-
lar area of the GUI Here the user can select the number of
options and change how to view the imported data The first
option the user can manipulate is the Y-axis for the magni-
tude and phase plots Under the magnitude option the user
can choose from either linear or log (dB) and under the
phase option the user can choose degrees or radians The
second option to choose is the real and imaginary axis of the
Bode diagram Figure 9 shows how this option allows users
to select the axis most practical for their research
(a) The real axis
(b) The imaginary axis Figure 9 The axes
The interface has checkboxes to allow users to select
which color they would like their graph or specific
S-parameters to appear in This allows users to more easily
distinguish different sets of data In addition to adding color
checkboxes checkboxes to select between solid and dotted
lines were added This also helps users distinguish between
different sets of data To graph random data the ldquoBoderdquo
mdashmdashmdashmdashmdashmdashmdashmdashmdashmdashmdashmdashmdashmdashmdashmdashmdashmdashmdashmdashmdashmdashmdashmdashmdashmdashmdashmdashmdashmdashmdashmdashmdashmdashmdashmdashmdashmdashmdashmdashmdashmdashmdashmdashmdashmdashndashmdashmdashmdashmdash
DESIGN AND DEVELOPMENT OF A GUI FOR RF COMMUNICATIONS 33
mdashmdashmdashmdashmdashmdashmdashmdashmdashmdashmdashmdashmdashmdashmdashmdashmdashmdashmdashmdashmdashmdashmdashmdashmdashmdashmdashmdashmdashmdashmdashmdashmdashmdashmdashmdashmdashmdashmdashmdashmdashmdashmdashmdashmdashmdashndashmdashmdashmdashmdash
mdashmdashmdashmdashmdashmdashmdashmdashmdashmdashmdashmdashmdashmdashmdashmdashmdashmdashmdashmdashmdashmdashmdashmdashmdashmdashmdashmdashmdashmdashmdashmdashmdashmdashmdashmdashmdashmdashmdashmdashmdashmdashmdashmdashmdashmdashndashmdashmdashmdashmdash
34 INTERNATIONAL JOURNAL OF ENGINEERING RESEARCH AND INNOVATION | V11 N1 SPRINGSUMMER 2019
button was added and the ldquoenlargerdquo button was added right
beneath it to display a larger version of the Bode diagram in
a separate window This helps engineers get a closer look at
the data plot in case the view on the GUI is not large
enough The same approach was used for other types of
graphs The control panel is the long rectangular panel lo-
cated on the left side of the GUI Here the user can perform
a of actions such as view data or reset graphs When the
users click on the ldquofilerdquo button they are able to select any
image file within the file directory that can be added to the
list box below to be selected (see Figure 10)
Figure 10 The ldquo filerdquo button and image selector listbox
A ldquodata resultsrdquo static textbox was added to the control
panel This box is used to view the data of the image cur-
rently selected in the list box This allows the user to see the
data being plotted or selected Additionally Figures 11 and
12 show how users can view the data being plotted in Note-
pad by going to the toolbar and selecting the data A reset
button was added to the control panel to allow users to reset
the current graph back to a blank state This button does not
reset all the graphs at once so users can erase one graph at a
time The amplifier button located on the toolbar can be
used to generate a Smith chart After the button is selected
users are taken through a wizard-style setup to select what
type of Smith chart they would like to generate This feature
is extremely useful because it allows users to create differ-
ent types of Smith charts that may be hard to duplicate using
the Smith chart located on the GUI (see Figures 13 and 14)
Figure 11 The ldquodata resultsrdquo static textbox
Figure 12 Data displayed in Notepad after using the ldquodatardquo
function
(a) Step 1
(b) Step 2 Figure 13 The amplifier process
mdashmdashmdashmdashmdashmdashmdashmdashmdashmdashmdashmdashmdashmdashmdashmdashmdashmdashmdashmdashmdashmdashmdashmdashmdashmdashmdashmdashmdashmdashmdashmdashmdashmdashmdashmdashmdashmdashmdashmdashmdashmdashmdashmdashmdashmdashndashmdashmdashmdashmdash
Figure 14 Results of the amplifier generator
The angular average function was also added to the
toolbar Figure 15 shows how this function plots various
polar plots and saves them to the file directory A help menu
was also added to the toolbar Here users can access help
using the GUI through demos and help menus In addition
to finding help users can obtain contact information for the
help desk
Figure 15 The angular average of some random data
Conclusions and Future Work
This project was extremely successful The most prized
accomplishments throughout this entire experience was the
comprehensive set of features for manipulating and display-
ing data and the custom background that worked well with
all of the functions The plan for future work is to take the
code written in MATLAB create an iPhoneiPad-
compatible app that could do the same thing that this GUI
did and enable users to accomplish these tasks from an iPad
or iPhone
Acknowledgments
This research was funded by 2010 and 2011 NASA CI-
PAIR and NASA NSTI Research Grants and supported by
Goddard Space Flight Center and NASA Langley Research
Center We would like to thank the NASA team of collabo-
rators lead by Dr Deshpande and our colleagues at Virginia
State University for their time and thoughtful insights dur-
ing ad hoc research gatherings In addition the authors wish
to extend their gratification to the anonymous reviewers for
their time assistance and patience
References
Badombena-Wanta S amp Sheybani E O (2010) Mobile
communications for development Enabling strategic
and low-cost e-applications for rural and remote areas
Proceedings of Wireless Telecommunications Symposi-
um Piscataway NJ IEEE doi 101109
WTS20105479644
Bonsiepe G (1989) Interpretations of human user inter-
face Visible Language 24(3) 262-285
Hayes F amp Baran N (1989 July) A guide to GUIs Byte
4 250-257
Garcia-Otero S amp Sheybani E (2010) Engineering senior
design course (ldquonew and improvedrdquo) Proceedings of
ASEE Annual Conference Washington DC ASEE
Gawa A (2006) Smith chart Retrieved from http
amanogawacomarchivedocsG-tutorialpdf
Hardy M Javidi G Denton L Campbell Y amp Shey-
bani E (2007) Enhancing research capacity and devel-
oping wireless communications curriculum for students
in computer science and engineering Proceedings of
IEEESECon 2007 Piscataway NJ IEEE doi
101109SECON2007342995
Interface (2019) Business Dictionary Retrieved from
httpwwwbusinessdictionarycomdefinition
interfacehtml
Javidi G amp Sheybani E (2008) Content-based computer
simulation of a networking course An assessment
mdashmdashmdashmdashmdashmdashmdashmdashmdashmdashmdashmdashmdashmdashmdashmdashmdashmdashmdashmdashmdashmdashmdashmdashmdashmdashmdashmdashmdashmdashmdashmdashmdashmdashmdashmdashmdashmdashmdashmdashmdashmdashmdashmdashmdashmdashndashmdashmdashmdashmdash
DESIGN AND DEVELOPMENT OF A GUI FOR RF COMMUNICATIONS 35
mdashmdashmdashmdashmdashmdashmdashmdashmdashmdashmdashmdashmdashmdashmdashmdashmdashmdashmdashmdashmdashmdashmdashmdashmdashmdashmdashmdashmdashmdashmdashmdashmdashmdashmdashmdashmdashmdashmdashmdashmdashmdashmdashmdashmdashmdashndashmdashmdashmdashmdash
mdashmdashmdashmdashmdashmdashmdashmdashmdashmdashmdashmdashmdashmdashmdashmdashmdashmdashmdashmdashmdashmdashmdashmdashmdashmdashmdashmdashmdashmdashmdashmdashmdashmdashmdashmdashmdashmdashmdashmdashmdashmdashmdashmdashmdashmdashndashmdashmdashmdashmdash
36 INTERNATIONAL JOURNAL OF ENGINEERING RESEARCH AND INNOVATION | V11 N1 SPRINGSUMMER 2019
Journal of Computers 3(3) 64-72
Javidi G amp Sheybani E (2010) Making youth excited
about STEM education Journal of Computing Sciences
in Colleges 26(1) 140-147
Norman D (1988) The psychology of everyday things
New York Basic Books
Ouyang Y Yang S Franklin T Michaelson K Morge
S Sheybani EhellipNarayan S (2010) Games sims
and virtual worlds in K-20 STEM education
Proceedings of 21st International SITE Conference
Chesapeake VA Association for the Advancement of
Computing in Education
Sheybani E amp Arora K (1993) Measurement of temporal
coherence of underwater optical scattered field
Microwave and Optical Technology Letters 6(2) 151-
154
Sheybani E amp Sankar R (2002) Integrated network
architecture and signal processing for telemammography
Proceedings of IEEEICASSP Piscatawny NJ IEEE
Sheybani E amp Javidi G (2006) Visualization effects in
virtual engineering labs II Proceedings of IEEEFIE
Piscataway NJ IEEE
Sheybani E (2011) Dimensionality reduction and noise
removal in wireless sensor networks Proceedings of
2011 4th IFIP International Conference on New
Technologies Mobility and Security Piscataway NJ
IEEE doi 101109NTMS20115721151
Sheybani E amp Javidi G (2007) Development and
evaluation of an educational computer network
software Proceedings of IEEESECon 2007
Piscataway NJ IEEE doi 101109
SECON2007342904
Sheybani E O Mengshoel O J amp Poll S (2010)
Removing spikes while preserving data and noise using
wavelet filter banks Proceedings of IEEE Aerospace
Conference Piscataway NJ IEEE doi 101109
AERO20105446821
Sheybani E Garcia-Otero S Adnani F Javidi G amp
Deshpande M (2012) An algorithm for real-time blind
image quality comparison and assessment International
Journal of Electrical and Computer Engineering 2(1)
doi httpdxdoiorg1011591ijecev2i1112
Varde A Rundensteiner E Javidi G Sheybani E amp
Liang J (2007) Learning the relative importance of
features in image data Proceedings of IEEE ICDErsquos
DBRank-07 Piscataway NJ IEEE doi 101109
ICDEW20074400998
Zhou Y amp Chen Y (2008) Properties of mixed-mode S-
parameters Microwave and Optical Technology
Letters 50(11) 2869-2874
Biographies
EHSAN SHEYBANI earned his BS MS and PhD in
electrical engineering from UF FSU and USF respectively
His main research area is applications of communication
signal processing and data analysis He has been involved
in teaching practicing researching and consulting
applications of DSP in technology system analysis and
data sciences for the past 20 years He has a long list of
publications and research grants including projects with
NASA NSF NIH DoD DEd and industry partners
Currently he serves as a faculty member at the University
of South Florida Dr Sheybani may be reached at
sheybaniusfedu
GITI JAVIDI earned her BS from the University of
Central Oklahoma and MS and PhD from the University of
South Florida Her main research area is human computer
interaction data visualization and STEM education She
has been involved in teaching computer science and
conducting research in that area for the past 16 years Dr
Javidi has a long list of publications and research grants
including projects with NASA NSF MSIP and industry
partners Currently she serves as a faculty member at the
University of South Florida Dr Javidi may be reached at
javidiusfedu
A DIAGNOSTIC CLOCK FOR VERIFICATION
OF IMAGE TIME SYNCHRONIZATION mdashmdashmdashmdashmdashmdashmdashmdashmdashmdashmdashmdashmdashmdashmdashmdashmdashmdashmdashmdashmdashmdashmdashmdashmdashmdashmdashmdashmdashmdashmdashmdashmdashmdashmdashmdashmdashmdashmdashmdashmdashmdashmdashmdashmdashmdashndashmdashmdashmdashmdash
Curtis Cohenour Ohio University
Abstract
The GPS clock is a diagnostic tool for measuring time
synchronization errors in aerial surveillance systems Aerial
surveillance systems are used in many civilian and military
applications including law enforcement border security
military situational awareness and military forensics The
goal is to collect images and project them onto the local
terrain such that the images form a map A common exam-
ple is Google Earth Aerial platforms can include drones
fixed or rotary winged aircraft and lighter-than-air vehicles
An aerial surveillance system consists of an imaging system
and a navigation system The navigation system is used to
determine the camera position and attitude known as the
pose which contains the necessary information required for
the projection of the image onto the terrain The images and
pose come from two sources and must be synchronized
Any error in the synchronization will create a projection
error
One method of determining when an image has been cap-
tured is to take a picture of a clock The GPS-synchronized
clock creates a display of the GPS time that can be recorded
in an image By taking images of the clock using the sur-
veillance system each image will have a true time from the
image of the GPS clock and a time derived from the pose If
the synchronization is correct they will match Any differ-
ence between the clock time from the image and the time
from the pose is an error that must be corrected In this pa-
per the author describes the operation testing and accuracy
of the clock Tests were performed using an independent
GPS receiver and a precise time protocol (PTP) server The
resolution of the clock was 1 millisecond (ms) and the ac-
curacy was 01 ms Case studies describe how the clock is
used to discover and subsequently correct timing errors in a
surveillance system
Introduction
Aerial surveillance is used in many civilian and military
applications including law enforcement (Ersoy
Palaniappan Seetharaman amp Rao 2012) border security
and improved situational awareness (Bryant Johnson Kent
Nowak amp Rogers 2008) The goal is to collect images and
project them onto the local terrain such that the image forms
a map A common example is Google Earth (GE) where
for example the image of a road overlays a map of the road
Images are captured by a camera while the pose is most
often generated by an integrated global positioning system
(GPS)inertial measurement unit (IMU) Distortion in the
camera image and errors in the GPSIMU will result in er-
rors in the projection These errors have been studied in
detail and are well documented in the literature for camera
models (Cohenour Price Rovito and van Graas 2015) and
corrected pose data (Cohenour Price Rovito amp van Graas
2015) The assumption was made that the pose would be
synchronized with the image as the author was unable to
find research into projection errors caused by time synchro-
nization errors nor any device to measure these errors It
was also assumed to not always be true that an image is
synced with the pose as will be seen in the case studies
below In this paper the author describes a means of testing
this assumption
The pose by default includes an accurate time If the
image includes the time the two can be compared directly
The GPS clock provides a mechanism for including the time
in the image The clock was used as a diagnostic tool Data
were collected and analyzed and the results used to diag-
nose correct and ultimately verify the synchronization of
the image and the pose The details of the projection are
described in a number of papers for camera models
(Cohenour et al 2015) corrected pose date (Cohenour et
al 2015) and others (Wolf 1974 Tsai 1987 Di amp Li
2004) The projection is based on the camera pose (position
and attitude) that corresponds to the image The pose will
have random errors that generate random errors in projec-
tion For example errors in GE can range from a few centi-
meters to a few meters depending on the aerial survey used
In this current study the focus was on errors that occurred
because the pose data were not captured at the same time
the image was captured
The pose data typically come from an integrated GPS
IMU while the image data come from a camera or a bank of
cameras The pose and image data are placed in one-to-one
correspondence But what happens if there is an extra mes-
sage in the IMU buffer or the image buffer If this happens
then the images will be off by one or more frames GPS is a
four-dimensional positioning system it produces position in
three dimensions and time The position errors are typically
less than 10m (Kaplan 1996) A 10m error in time is
10m300e6ms = 33ns An aerial surveillance camera typi-
cally operates with an integration time of 1ms If an aircraft
is traveling at 85ms then the 1ms is 085 of aircraft travel
mdashmdashmdashmdashmdashmdashmdashmdashmdashmdashmdashmdashmdashmdashmdashmdashmdashmdashmdashmdashmdashmdashmdashmdashmdashmdashmdashmdashmdashmdashmdashmdashmdashmdashmdashmdashmdashmdashmdashmdashmdashmdashmdashmdashmdashmdashmdashmdashmdashmdash
INTERNATIONAL JOURNAL OF ENGINEERING RESEARCH AND INNOVATION | V11 N1 SPRINGSUMMER 2019 37
mdashmdashmdashmdashmdashmdashmdashmdashmdashmdashmdashmdashmdashmdashmdashmdashmdashmdashmdashmdashmdashmdashmdashmdashmdashmdashmdashmdashmdashmdashmdashmdashmdashmdashmdashmdashmdashmdashmdashmdashmdashmdashmdashmdashmdashmdashndashmdashmdashmdashmdash
mdashmdashmdashmdashmdashmdashmdashmdashmdashmdashmdashmdashmdashmdashmdashmdashmdashmdashmdashmdashmdashmdashmdashmdashmdashmdashmdashmdashmdashmdashmdashmdashmdashmdashmdashmdashmdashmdashmdashmdashmdashmdashmdashmdashmdashmdashndashmdashmdashmdashmdash
38 INTERNATIONAL JOURNAL OF ENGINEERING RESEARCH AND INNOVATION | V11 N1 SPRINGSUMMER 2019
The GPS time is available for free with an accuracy much
greater than that needed for image time registration This
provides an opportunity for verifying the synchronization of
the pose and the image If there is an accurate clock in the
image the clock time can be compared with the GPS time
in the pose If they match the synchronization is confirmed
If they do not match then hardware or software modifica-
tions are required
GPS Clock Version 1
The original clock Version 1 was not designed specifi-
cally for testing image synchronization and so was modified
for this purpose The clock displayed the minutes and sec-
onds with six gray code bits (Dewar amp Stevens 2012) and
milliseconds with 10 gray code bits Two additional indica-
tors were also displayed The first indicated a valid display
labeled ldquoGPS Okrdquo the second indicator changed state each
time the GPS receiver time sync pulse was received and was
labeled 1 pulse per second (1PPS) Gray code was used in
the clock because only one bit changes at a time If binary
were used the transition from 7 to 8 which in binary is
0111b to 1000b could be read as 0000b or 1111b which
would be 0 or 15 in decimal Version 1 of the clock had a
number of issues
1 Heavy about 35 pounds
2 Separate gray code displays for minutes seconds
and milliseconds
3 No diagnostics for the GPS receiver
4 No way to test the LEDs and drivers
5 Second update occurs 20ms after the 1PPS
6 LEDs are dim
7 Requires 120V alternating current (AC) power
8 Satellite tracking issues
While 35 pounds is not prohibitively heavy the clock was
awkward hard to carry and sometimes used in areas inac-
cessible to autos The clock did not operate on batteries
which could cause issues in remote locations The separate
gray code displays for minutes seconds and milliseconds
meant that multiple bits would sometimes change at the
same time If the change occurred while the exposure was
being made this would create errors since the second up-
date was 20ms late The milliseconds must be read first and
then the seconds adjusted With no receiver diagnostics
simple problems like a bad antenna cable could not be diag-
nosed There was no way to test for a bad LED or driver
The LEDs were not bright enough for use outdoors in the
sun or with a short 01ms integration time Finally receiver
tracking was optimized for survey work and would not track
satellites that were not clearly visible This led to trouble
getting a solution if the antenna did not have a clear view of
the sky
GPS Clock Version 2
Version 2 of the clock resolved all of the aforementioned
issues (see Figure 1) The clock was lightweight designed
for remote use included diagnostics and worked well in
direct sunlight There were test buttons for the LEDs a liq-
uid crystal display (LCD) and a diagnostic RS-232C port
Figure 1 The GPS clock version 2
The GPS clock version 2 used an Arduino Mega 2560 R3
as the computing platform The Arduino Mega (2017) had
four serial ports 54 digital inputoutput (IO) ports and mul-
tiple hardware and software interrupts The GPS receiver
was manufactured by ITEAD and used a RoyalTek REB-
4216 chip The receiver tracked reflected satellites operated
with a limited view of the sky and could often generate a
solution indoors The receiver was selected because it was
the only GPS Arduino shield (at the time of writing) with a
1PPS output All of the receiver outputs were echoed to an
RS-232 serial port for diagnostics
The LED outputs were buffered generating an intense
white light of 12000 mcd The LEDs could easily be seen
in bright sunshine A felt cover was provided to eliminate
reflections when operating in direct sun The LEDs IO pins
and buffers could be tested using two buttons ldquoall onrdquo and
ldquoall offrdquo The time display was 16 bits with 10 bits dedicat-
ed to the fraction All 16 bits were a single gray code word
This complicated manual decoding but ensured that no more
than one bit changed at a time The fraction was 10 bits
therefore the resolution was 2-12 11024th of a second or
09766 ms The resolution was approximately 1ms which
was adequate for an airborne imaging system that typically
has a minimum exposure time of 1 or 2ms
mdashmdashmdashmdashmdashmdashmdashmdashmdashmdashmdashmdashmdashmdashmdashmdashmdashmdashmdashmdashmdashmdashmdashmdashmdashmdashmdashmdashmdashmdashmdashmdashmdashmdashmdashmdashmdashmdashmdashmdashmdashmdashmdashmdashmdashmdashndashmdashmdashmdashmdash
GPS time was kept in seconds of the week starting with 0
at 00000 coordinated universal time (UTC) on Sunday
The six most significant bits of the LED display showed the
GPS time modulo 64 There are 86400 seconds in a day so
8640064 is 1350 with a remainder of zero This happy
coincidence ensured that there would be a continuous rollo-
ver over each day and each week The aerial surveillance
system was assumed to have a time error of less than
32 seconds This could be verified with a single frame of
data and a watch Assuming that the system met this re-
quirement the error would be at most a few seconds and a
modulo 64 second clock would be adequate
An LCD was provided on the clock The LCD displayed
the clock version validinvalid the number of satellite vehi-
cles (SVs) tracked the leap second and a graphic indicating
serial data received The number of SVs tracked was a key
piece of troubleshooting data as was the serial data graphic
The GPS receiver sent out six National Marine Electronics
Association (NMEA) messages The Arduino decoded two
of these messages to extract the time of day validinvalid
and the number of SVs All of the messages were echoed to
a serial port on the left side of the clock for user diagnostics
Finally the clock was lightweight only 35 pounds
8x12x3 with a carry handle and powered by six AA
batteries or an AC adapter The clock and accessories were
shipped in a small Pelican case
Hardware and Software
Figure 2 shows a hardware block diagram of the GPS
clock The ITEAD GPS receiver sends serial data to the
Arduino Mega via serial port 2 The baud rate is 9600 with
eight data bits one stop bit and no parity These data are
converted to RS-232 signal levels using a MAX-232-CPE
and outputted to a 9-pin d-shell serial port The 1PPS signal
is routed to the Arduino on pin 2 interrupt 0 The Arduino
processes the data and outputs to 18 LEDs which are con-
nected to three SN74LS07 hex buffers and drivers with
open-collector high-voltage outputs (Texas Instruments
2016) The LEDs are connected to the battery or AC adapter
and do not draw power through the Arduino voltage regula-
tor There are 16 LEDs for the time display one for the
1PPS and one for the valid indicator The Arduino drives a
backlit LCD display There is an analog contrast adjustment
for the LCD
There are four button inputs to the Arduino lamp test
buttons ldquoall onrdquo and ldquoall offrdquo and leap second ldquouprdquo and
ldquodownrdquo The lamp test buttons override the normal LED
outputs and verify the Arduino output the buffer and the
LED Not shown is the power A switched barrel jack dis-
connects the batteries when the AC adapter is connected
An on-off switch connects the power to the clock The clock
can operate for about two hours on six AA batteries An
SMA female connector is provided on the left side of the
clock for connection to an amplified 33V GPS antenna
Figure 3 shows a software block diagram for the clock
which is interrupt-driven The 1PPS event sets the seconds
of the day based on the input from the serial parser and ze-
ros out the 11024-second timer This starts the
11024-second counter at zero on the 1pps event From here
on the 11024-second clock increment will be referred to as
1 ms for brevity
Figure 2 GPS clock version 2 hardware block diagram
Figure 3 Software block diagram of the GPS clock
The ITEAD receiver generates six NMEA output messag-
es The serial parser reads and parses the recommended
minimum data (RMC) and global positioning system fixed
data (GGA) messages other messages are not parsed to
reduce processor load All messages are passed via hard-
ware to the diagnostic serial port The RMC message is
parsed to extract the UTC time and the valid flag The GGA
message provides the number of SVs in the solution The
seconds of the day (SOD) is computed based on the hour
minutes and seconds in the RMC message The RMC mes-
sage completes 750 ms into the seconds and is one second
old at the time of the next 1PPS The leap seconds are added
to the SOD to convert UTC SOD to GPS SOD The GPS
SOD is all that is needed for the clock because the seconds
in a day 86400 is an even multiple of 64 During the 1PPS
event if the time is valid the clock is reset to the (SOD
GPS + 1) modulo 64 the milliseconds is set to zero and the
millisecond timer timer 2 is set to zero
mdashmdashmdashmdashmdashmdashmdashmdashmdashmdashmdashmdashmdashmdashmdashmdashmdashmdashmdashmdashmdashmdashmdashmdashmdashmdashmdashmdashmdashmdashmdashmdashmdashmdashmdashmdashmdashmdashmdashmdashmdashmdashmdashmdashmdashmdashndashmdashmdashmdashmdash
A DIAGNOSTIC CLOCK FOR VERIFICATION OF IMAGE TIME SYNCHRONIZATION 39
mdashmdashmdashmdashmdashmdashmdashmdashmdashmdashmdashmdashmdashmdashmdashmdashmdashmdashmdashmdashmdashmdashmdashmdashmdashmdashmdashmdashmdashmdashmdashmdashmdashmdashmdashmdashmdashmdashmdashmdashmdashmdashmdashmdashmdashmdashndashmdashmdashmdashmdash
mdashmdashmdashmdashmdashmdashmdashmdashmdashmdashmdashmdashmdashmdashmdashmdashmdashmdashmdashmdashmdashmdashmdashmdashmdashmdashmdashmdashmdashmdashmdashmdashmdashmdashmdashmdashmdashmdashmdashmdashmdashmdashmdashmdashmdashmdashndashmdashmdashmdashmdash
40 INTERNATIONAL JOURNAL OF ENGINEERING RESEARCH AND INNOVATION | V11 N1 SPRINGSUMMER 2019
The 11024 event is tied to timer 2 The timer pre-scaler is
set to 64 The clock is 16 MHz so the timer counts at 250
KHz The counter should time out at 2500001024-1=
2431406 The timer is set to 243 and the remainder
01406 is accumulated until it is greater than 10 When this
happens one is subtracted from the accumulator and the
timer is set to 244 In this way the clock remains accurate
If this were not done then the last millisecond 1023 would
be over four milliseconds long This is further complicated
by the inaccuracy of the Arduino clocks The clock was
tested with three different Arduinos to investigate the varia-
bility in the oscillators The average number of microsec-
onds per 1PPS was 1e6 for a perfect oscillator The results
for the three units tested were 992592 1001216 and
1000002 The GPS 1PPS had an error of less than 1μs so
it could be used to calibrate the Arduino internal oscillator
To compensate for the oscillator errors the average value of
the microseconds per 1PPS was divided by four and used in
the above calculation instead of 250000
The REB 4216 receiver does not reveal the leap second
To convert from UTC to GPS the leap second is needed
The current leap second is 18 as of August 2017 and can
change twice per year during the first week epoch in Janu-
ary and the first week epoch in July The current leap sec-
ond is officially available on line at https
wwwnavcenuscggov but is more easily found by doing a
Google search for ldquoGPS leap secondsrdquo The conversion is
given by Equation 1[IS-GPS-200]
GPS = UTC + Leap seconds (1)
where GPS is the seconds of the week in GPS time UTC is
the seconds of the week in UTC and Leap seconds is the
integer number of leap seconds
The leap second was stored in a EEPROM and manipulat-
ed by two buttons ldquouprdquo and ldquodownrdquo When the leap second
was changed it was stored in the EEPROM During startup
the EEPROM was read to initialize the leap seconds The
LED test buttons were implemented in the 11024 event
During this event the seconds and milliseconds were com-
puted as well as the status of the valid and 1PPS LEDS The
seconds and milliseconds were converted to gray code If
neither LED test button was pushed the data were placed on
the Arduino IO ports If the ldquoall onrdquo button was pressed the
IO ports were set to on if ldquoall offrdquo was pressed then the IO
ports were set to off In this way the IO ports the buffers
and the LEDs were tested Data displayed on the LCD in-
cluded the GPS clock software revision on the top line and
key data on the second line The second line of the display
included ldquovalrdquoldquoinvrdquo to indicate the status of the clock the
number of satellites the number of leap seconds and a ro-
tating slash to indicate that the GPS messages were being
received
Verification
Accuracy of the GPS clock was verified in a number of
ways First the 1PPS signal was checked against a Novatel
survey receiver second a precise time protocol-enabled
camera (Kaplan 1996) was used and third a Novatel re-
ceiver was used Figure 4 shows a histogram of the error
collected from 31521 images
Figure 4 Histogram of clock errors (31521 measurements)
The first test conducted was to determine the accuracy of
the 1PPS interrupt A NovAtel PWRPAK-4-3151W PN
01016783 was connected to an AeroAntenna AT575-9W-
TNCF-000-05-26-NM amplified antenna The 1PPS was
connected to the Arduino interrupt 0 IO pin 2 The interrupt
routine was set up to toggle the 1PPS LED on the Arduino
The Arduino output was connected to the NovAtel Event1
input The NovAtel ldquoMarkTime OnNewrdquo log (Novatel
2015) was used to determine the interrupt delay This test
showed a delay of 11 micros which is the time required to pro-
cess the interrupt Figure 5 shows how the second and third
tests were set up Table 1 provides descriptions of the com-
ponents
The camera was powered using power over Ethernet
(POE) Communications and control of the camera was by
gigabyte Ethernet A PTP (IEEE 2008) time server was
connected to the camera to provide microsecond-level abso-
lute time to the camera In this configuration a console ap-
plication running on the laptop triggered and recorded 10
images about 08 seconds apart Each image was saved us-
ing the PTP time in microseconds The PTP time is Temps
Atomique International (TAI) seconds since January 1
-02 0 02 04 06 08 1 120
50
100
150
200
250
300
NOV Time Error (ms)
Co
un
t
mdashmdashmdashmdashmdashmdashmdashmdashmdashmdashmdashmdashmdashmdashmdashmdashmdashmdashmdashmdashmdashmdashmdashmdashmdashmdashmdashmdashmdashmdashmdashmdashmdashmdashmdashmdashmdashmdashmdashmdashmdashmdashmdashmdashmdashmdashndashmdashmdashmdashmdash
1970 (McCarthy amp Seidelmann 2009) TAI is always ahead
of GPS by 19 seconds (Time Service Dept nd) and can
be determined using Equation 2
GPS = PTP + 19s (2)
where PTP is seconds since January 1 1970
Figure 5 Test configuration for the clock
Table 1 Equipment used for clock testing
PTP time synchronization in the camera is known to be
within 2 μs (Allied Vision 2016) If the PTP time from the
camera is correct then this would be all that is required to
validate the clock readings to the millisecond To check the
camera PTP time the sync 1 output of the camera was tied
to the Event 1 input of the Novatel Using MATLAB the
console app was executed and the file namesPTP times
were extracted The Novatel logs were collected and the
time extracted Each image was read and the first 20 bytes
of the image were replaced with the GPS time from the No-
vatel receiver This was done 10 images at a time to ensure
that there were no buffering errors Later when processing
the images the PTP time was extracted from the file name
and the GPS time was extracted from the image
Other items in the test setup included a NetGear Ethernet
switch and Cat 5E Ethernet cables This set up was used for
all of the results in the following section Tests were con-
ducted with the lens aperture at max an exposure time of
01 ms and a gain of 35 dB This produced images having
an exposure much shorter than the resolution of the clock
Figure 6(a) shows that the LEDs and clock were clearly
visible Figure 6(a) also shows image one of 31521 images
used to verify the clock accuracy The images were pro-
cessed automatically using MATLAB First the location of
the LEDs was captured This was done by displaying image
one and clicking on each of the 18 LEDs The location of
the LEDs was saved and indicated by circles in Figure 6(a)
Once this was completed the LED locations could be used
for all images as long as the clock and camera were not
moved
(a) The first of 31521 images (b) Mask for bit G15
used for clock verification
Figure 6 The LEDs and clock are clearly visible
For each image the LEDs are read as follows a mask is
generated for each LED position with a value of one within
a radius of pixels Figure 6(b) shows the mask for LED
G15 The mask and the image are multiplied element by
element and the results are summed This gives a low value
for an LED that is off and a high value for an LED that is
on This is repeated for each of the 16 gray code LEDs the
1PPS and the valid LED A threshold value is chosen mid-
way between on and off to differentiate the two states In
this way the 16 gray code bits are extracted This is done
for each image The gray code values for each image are
converted to seconds using Equation 3 Note that the clock
reading is by definition modulo 64
(3)
where Gry is the clock reading in gray code gry2int()
converts in gray code to an integer and 1024 converts
clock increments to seconds Additional MATLAB scripts are available from the author (see contact information
included with this paper)
Item Description
Camera Allied Vision Manta G-319B
Novatel Novatel PWRPAK-4-3151W PN 01016783
PTP Server Time Machine TM2000A
Switch NetGear ProSAFE GS108
Antennas Generic Magnetic Base L1 Patch Antenna
g ry 2 in t(G ry ) =
1 0 2 4M o d G P S
mdashmdashmdashmdashmdashmdashmdashmdashmdashmdashmdashmdashmdashmdashmdashmdashmdashmdashmdashmdashmdashmdashmdashmdashmdashmdashmdashmdashmdashmdashmdashmdashmdashmdashmdashmdashmdashmdashmdashmdashmdashmdashmdashmdashmdashmdashndashmdashmdashmdashmdash
A DIAGNOSTIC CLOCK FOR VERIFICATION OF IMAGE TIME SYNCHRONIZATION 41
mdashmdashmdashmdashmdashmdashmdashmdashmdashmdashmdashmdashmdashmdashmdashmdashmdashmdashmdashmdashmdashmdashmdashmdashmdashmdashmdashmdashmdashmdashmdashmdashmdashmdashmdashmdashmdashmdashmdashmdashmdashmdashmdashmdashmdashmdashndashmdashmdashmdashmdash
mdashmdashmdashmdashmdashmdashmdashmdashmdashmdashmdashmdashmdashmdashmdashmdashmdashmdashmdashmdashmdashmdashmdashmdashmdashmdashmdashmdashmdashmdashmdashmdashmdashmdashmdashmdashmdashmdashmdashmdashmdashmdashmdashmdashmdashmdashndashmdashmdashmdashmdash
42 INTERNATIONAL JOURNAL OF ENGINEERING RESEARCH AND INNOVATION | V11 N1 SPRINGSUMMER 2019
The MATLAB code for this conversion is decGPS=gray2int(Gry)
ModGPS=decGPS1024
When in use it was assumed that the clock was correct so
the error was the time stampmdashthe GPS clock time in the
image The time stamp error can be computed using Equa-
tion 4
ModTimeStamp = mod(TimeStamp64)
Err = ModTimeStamp ‒ ModGPS (4)
if (Err lt -32) Err = Err + 64
where TimeStamp is the time stamp in GPS time mod(a b)
returns the remainder of ab and Err is the clock error
Note that the ldquoifrdquo statement compensates for events where
the ModGPS and the ModTimeStamps occur on opposite
sides of the 64 second boundary
Using the setup above the clock distribution was 05 ms
plusmn03 ms as seen in the histogram of Figure 4 The camera
was triggered asynchronously so that the errors should form
a uniform error distribution in Figure 4 Theoretically the
distribution of the error should be a uniform distribution
with a mean of 05 ms and standard deviation of 028 ms
(Miller amp Freund 1977) which is very close to the meas-
ured values of 05 for the mean and 03 for the standard de-
viation The clock resolution was 1 ms while the actual
accuracy is better than 01 ms To understand why examine
what happens to images taken at various times A through D
in Figure 7 The clock reads 0000 in the range 0000 to
0001 and 0001 in the range from 0001 to 0002 An im-
age taken at B will have a time stamp of 00011 but the
clock will read 0001 and the error is 01 ms The same
applies for C where the error is 09 ms The image taken at
A has a time stamp of 000047 and the clock reads 0000 so
the error is 047 ms All of the errors will map into the range
of 0 to 1 ms
Figure 7 Timeline showing various image capture times
Now consider the image at D This time stamp is 0001
but the clock could be in transition and read either 0000 or
0001 If the clock reads 0000 then the time error for D is
1 ms If the cock reads 0001 then the time error reads 0 So
the image at D could have an error of 0 or 1 ms The same
argument can be made for the image taken at E This is il-
lustrated in Figure 8 Note that most of the images occur
between B and C Since they are random in time they map
to a uniform distribution with an error between 0 and 1 ms
The points at D and E may map to 0 ms plusmn a few microsec-
onds or to 1 ms plusmn a few microseconds The result is the plot
in Figure 4 The camera integration time is 01 ms for the
data collected in Figure 4 This results in a few observations
in the range of 100 to 107 ms
Figure 8 Mapping of image times to error space
The GPS clock has an LED to indicate that the clock is
valid The clock may go to invalid if the GPS solution is
corrupt due to jamming an antenna failure poor visibility
of the sky or other reasons If this happens the valid LED
should turn off To test this the clock was allowed to sync
to GPS time Data recording was started and the GPS an-
tenna was disconnected After a period of time the antenna
connector was reconnected and the clock synced The data
were checked and the invalid state started almost immedi-
ately when the antenna was disconnected When the antenna
was reconnected the time recovered and the clock returned
to valid All measurements with the valid indicator on were
correct For accuracy the imaging system should be set for
a short integration time The recommended exposure time is
01 ms to extract maximum accuracy from the clock This
can usually be achieved by setting the integration time
01 ms and increasing the gain The clock does not have to
be visible as long as the LEDs can be seen in the image An
underexposed image will work because the LEDs are very
bright If a longer exposure time is used the results will be
smeared but the results are still meaningful Some systems
using webcams for example do not allow the user to con-
trol the exposure This is illustrated in the two tests that fol-
low
Two tests were performed using 1 ms and 2 ms integra-
tion times For a 1 ms exposure with 1661 images the
mean is 67 μs and the standard deviation is 06 ms or
00 plusmn 06 ms For a 2 ms exposure with 3701 images the
mean is -04ms with a standard deviation of 10 ms
mdashmdashmdashmdashmdashmdashmdashmdashmdashmdashmdashmdashmdashmdashmdashmdashmdashmdashmdashmdashmdashmdashmdashmdashmdashmdashmdashmdashmdashmdashmdashmdashmdashmdashmdashmdashmdashmdashmdashmdashmdashmdashmdashmdashmdashmdashndashmdashmdashmdashmdash
Case Studies
Version 1 of the clock was developed in 2009 and used to
troubleshoot fix and ultimately verify a number of sys-
tems Case studies are provided here to give the reader an
appreciation of how time sync errors can arise and how the
clock can be used to investigate and correct the any syn-
chronization errors Seven case studies are listed in Table 2
Some of these cases were investigated thoroughly and docu-
mented in publications in others the results were transmit-
ted and results were never communicated to the author
Table 2 Table of case studies using the clock
Case 1 The Novatel ldquoInsPva OnMarkrdquo log was used but
this log was not supported by Novatel There was an inter-
polation error that returned the positon and attitude at the
wrong time The correct log is the ldquoMark1Pva OnNewrdquo log
There is a -10 ms error in the ldquoInsPva OnMarkrdquo log that
reaches as high as 50 ms near the one-second boundary
This indicates that perhaps the Novatel has housekeeping
chores on the one-second boundary that create issues with
the unsupported log
Case 2 The system was switched to use the ldquoMark1Pva
OnNewrdquo log This created additional problems with yaw
errors from IMU Knowing the time tags were correct led to
an examination of the errors Based on this test it became
clear that the ldquoInsPva OnMarkrdquo log has errors that cannot be
explained Novatel was contacted and the user was advised
to do a firmware update This corrected the error
Case 3 A nadir (down looking) camera system mounted on
the Ohio University Avionics Center DC-3 was tested using
the clock The system had zero time errors and no modifi-
cations were required
Case 4 Two independent nadir camera systems were
mounted on the Ohio University Avionics Center DC-3
Both of these systems used Allied Vision PTP cameras
Both systems were tested using the clock and found to have
correct time tags
Case 5 A number of the Version 1 clock shortcomings were
revealed A 30 frames per second (FPS) with a long lens
was tested using Version 1 of the clock It was required to
position the clock outside in order for the camera to capture
the entire clock in the image The sun was so bright that the
LEDs could not be read Folding tables and sawhorses were
used to provide shade so that the clock could be read The
clock was placed in an area that was surrounded by build-
ings that obscured portions of the sky The GPS receiver
lost lock many times and slowed the data collection Once
usable data were obtained from the clock it was discovered
that the images were off by 1 to 3 frames The system hard-
ware included a divide-by-four circuit in the line between
the camera sync and the Novatel mark input The error oc-
curred because the divide-by-four counter was not reset and
not synced with the software The software system was re-
configured to reset the divide-by-four circuit when imaging
was started This resulted in synced images
Case 6 An imaging system similar to that described in
Cohenour et al (Camera 2015) and Conehour et al
(Corrected 2015) recorded at a rate of 3 frames per second
There was a time tag error of 016 The camera sync and the
Novatel mark input were driven by an external time source
The error was frac12 of the frame rate One possible source of
the error could be that the camera was triggered on the posi-
tive edge of the signal and the Novatel was triggered on the
negative edge Changing edge sensitivity of either the cam-
era or the Novatel is trivial The author did not receive any
feedback on the resolution of this issue This is a good ex-
ample of the utility of the clock an easily correctable prob-
lem but difficult to isolate without the clock
Case 7 A forward-looking camera system was installed on
the Ohio University Avionic Engineering Center Beechcraft
Barron The system included both IR and visible spectra
cameras A breadboard prototype of the Version 2 clock
was used to test the time tagging of the visible camera The
LEDs used on the clock are not suitable for IR
The cameras were triggered by a Novatel 1PPS signal
The software written for Microsoft Windows received No-
vatel position and attitude data as well as image data The
visible camera was tested and found to be off by 1 second
Software changes were made to correct this problem The
system was retested and shown to be correct Flight data
were recorded using the system When the images were
projected there were large time synchronization errors The
data for a turn were analyzed to determine if the images
matched the pose data The horizon was tracked in a number
of images to estimate the roll The estimated roll from the
Case Description
1 Incorrect Novatel Log
2 Novatel Log Error
3 DC 3 Camera System
4 DC 3 PTP System
5 Hi Rate Data Collection
6 12 frame error
7 Forward Looking EO and IR
mdashmdashmdashmdashmdashmdashmdashmdashmdashmdashmdashmdashmdashmdashmdashmdashmdashmdashmdashmdashmdashmdashmdashmdashmdashmdashmdashmdashmdashmdashmdashmdashmdashmdashmdashmdashmdashmdashmdashmdashmdashmdashmdashmdashmdashmdashndashmdashmdashmdashmdash
A DIAGNOSTIC CLOCK FOR VERIFICATION OF IMAGE TIME SYNCHRONIZATION 43
mdashmdashmdashmdashmdashmdashmdashmdashmdashmdashmdashmdashmdashmdashmdashmdashmdashmdashmdashmdashmdashmdashmdashmdashmdashmdashmdashmdashmdashmdashmdashmdashmdashmdashmdashmdashmdashmdashmdashmdashmdashmdashmdashmdashmdashmdashndashmdashmdashmdashmdash
mdashmdashmdashmdashmdashmdashmdashmdashmdashmdashmdashmdashmdashmdashmdashmdashmdashmdashmdashmdashmdashmdashmdashmdashmdashmdashmdashmdashmdashmdashmdashmdashmdashmdashmdashmdashmdashmdashmdashmdashmdashmdashmdashmdashmdashmdashndashmdashmdashmdashmdash
44 INTERNATIONAL JOURNAL OF ENGINEERING RESEARCH AND INNOVATION | V11 N1 SPRINGSUMMER 2019
images was correlated with the IMU roll The time error of
the images was determined to be 14 seconds This shows
how buffering or other issues can cause problems The pro-
ject was shelved due to a failure of the IR camera and the
issue was never resolved
Conclusions
A GPS synchronized clock was described The purpose of
the clock was to measure time synchronization errors in an
aerial surveillance system Using the clock a precise GPS
time could be extracted from the image The image time
was compared to the pose time to determine the time error
Any time errors will create projection errors With this in-
formation corrective action can be taken The clock de-
scribed in this paper was Version 2 All of the shortcomings
in Version 1 were corrected The clock is lightweight in-
tensely bright powered by AC or batteries and includes test
features and diagnostics A detailed analysis of the timing
error between the clock and a reference receiver showed
that the resolution of the clock was 1 ms while the accuracy
was better than 01 ms If the exposure time increased the
clock was still valid but the resolution was reduced
The camera integration time impacted the clock readings
If the camera integration was longer than 1 ms the least
significant bit would appear as on with a 50 duty cycle
This was tested and the clock was still valid but the resolu-
tion was reduced For best results the minimum integration
time that allows reading the LEDs should be used A num-
ber of case studies were used to illustrate the utility of the
clock These case studies illustrate the types of errors that
can be encountered and how corrective action can be taken
once the errors are discovered The clock presented here
was for visible light There was also a need for time verifi-
cation of infrared (IR) image data The clock could easily be
converted to cover shortwave IR images simply by using IR
LEDs This becomes more complex at longer wavelengths
A number of schemes are being considered for wavelengths
up to 8 microm Additional information about the clock and on-
going work is available from the author
References
Allied Vision (2016) Application note IEEE 1588
precision time protocol prosilica GT GC and manta
cameras Vancouver British Columbia Canada Allied
Vision
Arduino (2017) Arduino Mega 2650 Retrieved from
httpwwwarduinoorgproductsboardsarduino-mega-
2560
Bryant M Johnson P Kent B M Nowak M amp
Rogers S R (2008) Layered sensing Its definition
attributes and guiding principles for AFRL strategic
technology development Wright-Patterson Air Force
Base OH Sensors Directorate Air Force Research
Laboratory
Cohenour C Price R Rovito T amp van Graas F (2015)
Camera models for the Wright Patterson Air Force
Base (WPAFB) 2009 wide area motion imagery
(WAMI) data set IEEE Aerospace amp Electronic
Systems Magazine 30(6) 4-15
Cohenour C Price R Rovito T amp van Graas F (2015)
Corrected pose data for the Wright Patterson Air Force
Base (WPAFB) 2009 wide area motion imagery
(WAMI) data set SPIE Journal of Applied Remote
Sensing 9(1) 4-15
Dewar M amp Stevens B (2012) Ordering block designsmdash
Gray codes universal cycles and configuration New
York Springer
Di K amp Li R (2004) CAHVOR camera model and its
photogrammetric conversion for planetary applications
Journal of Geophysical Research 109(E04004) 1-9
Ersoy I Palaniappan K Seetharaman G S amp Rao R
M R (2012) Interactive target tracking for persistent
wide-area surveillance Interactive target tracking for
persistent wide-area surveillance Proceedings of SPIE
Conference on Geospatial InfoFusion II Bellingham
WA SPIE doi 10111712920815
IEEE (2008) IEEE standard for a precision clock
synchronization protocol for networked measurement
and control systems Retrieved from http
standardsieeeorg
Kaplan E D (1996) Understanding GPS Principles and
applications Boston Artech House
McCarthy D amp Seidelmann K (2009) Time From earth
rotation to atomic physics Weinheim Germany Wiley-
VCH
Miller I amp Freund J (1977) Probability and statistics for
engineers Englewood Cliffs NJ Prentice-Hall
NovAtel (2015) OEM6 family firmware reference manual
OM-20000129 rev 8 Calgary Alberta Canada
NovAtel
Texas Instruments (2016) SN74LS07 hex buffers and
drivers with open-collector high-voltage outputs
Dallas Texas Instruments
Time Service Dept (nd) Leap seconds Retrieved from
httptychousnonavymilleapsechtml
Tsai R Y (1987) A versatile camera calibration technique
for high-accuracy 3d machine vision metrology using
off-the shelf tv cameras and lenses IEEE Journal of
Robotics and Automation RA-3(4) 323-344
Wolf P R (1974) Elements of photogrammetry New
York McGraw-Hill
mdashmdashmdashmdashmdashmdashmdashmdashmdashmdashmdashmdashmdashmdashmdashmdashmdashmdashmdashmdashmdashmdashmdashmdashmdashmdashmdashmdashmdashmdashmdashmdashmdashmdashmdashmdashmdashmdashmdashmdashmdashmdashmdashmdashmdashmdashndashmdashmdashmdashmdash
Biography
CURTIS COHENOUR is an assistant professor in the
Ohio University Engineering Technology and Management
Department He received his BS degree from West Virginia
Institute of Technology in 1980 MS degree from Ohio Uni-
versity in 1988 and PhD in electrical engineering from
Ohio University in 2009 He is a registered professional
engineer in West Virginia and Ohio Dr Cohenour has
worked in industry as an electrical engineer in the areas of
control systems automation and power He joined Ohio
University in 2002 as a research engineer working for the
Ohio University Avionics Engineering Center He has
worked on projects covering a wide variety of avionics and
navigation systems such as the instrument landing system
microwave landing system distance measuring equipment
LAAS WAAS and GPS His recent work has included
research with the Air Force Research Laboratory in Dayton
Ohio aimed at understanding and correcting image geo-
registration errors from a number of airborne platforms Dr
Cohenour may be reached at cohenourohioedu
mdashmdashmdashmdashmdashmdashmdashmdashmdashmdashmdashmdashmdashmdashmdashmdashmdashmdashmdashmdashmdashmdashmdashmdashmdashmdashmdashmdashmdashmdashmdashmdashmdashmdashmdashmdashmdashmdashmdashmdashmdashmdashmdashmdashmdashmdashndashmdashmdashmdashmdash
A DIAGNOSTIC CLOCK FOR VERIFICATION OF IMAGE TIME SYNCHRONIZATION 45
ASSESSING THE EFFECTIVENESS OF AN AUTOMATIC
DOOR LOCK SYSTEM BY DISCHARGE DETECTION
TO LOWER CASUALTIES DURING AN ACADEMIC
ACTIVE SHOOTER INCIDENT mdashmdashmdashmdashmdashmdashmdashmdashmdashmdashmdashmdashmdashmdashmdashmdashmdashmdashmdashmdashmdashmdashmdashmdashmdashmdashmdashmdashmdashmdashmdashmdashmdashmdashmdashmdashmdashmdashmdashmdashmdashmdashmdashmdashmdashmdashndashmdashmdashmdashmdash
Jae Yong Lee Purdue University James Eric Dietz Purdue University
Abstract
The 2018 Stoneman Douglas High School (Parkland)
shooting emphasized the importance of testing active shoot-
er responses for both first-responder communities and the
general public Since the 1999 Columbine massacre the
preparedness for active shooter incidents (ASIs) included
aggressive police tactical responses to neutralize the shoot-
ing threat Currently the runhidefight response for un-
armed individuals has been implemented as part of the ac-
tive shooter response for both the public and private sectors
However despite the RHFrsquos nationwide implementation
there are few studies in the literature to support the effec-
tiveness of RHF Additionally modeling a scenario similar
to the Parkland shooting suggests that the application of
RHF without situational awareness of the shooterrsquos location
could cause higher casualty rates by an average of more
than 126 individuals
In this study the authors compared the casualty rates of
two models The first model consisted only of hide (shelter-
in-place) and run (evacuate) The second model applied the
first modelrsquos components with the automatic door lock sys-
tem which was triggered by discharge detection To ex-
clude human participation and to prevent physiological and
psychological impact agent-based modeling (ABM) was
used to recreate a one-story academic infrastructure with 26
lecture halls and three exits containing 600 unarmed indi-
viduals The flexibility of ABM allows multiple iterations
while manipulating various parameters The ABM approach
in active shooter research also eliminates human error and
logistical issues The outcome of this study evaluates the
effectiveness of an automated door lock system based on
firearm discharge detection with a campus-wide alert sys-
tem to conduct lockdown
Introduction
The term active shooter incident (ASI) may be a familiar
term for the general public Federal Bureau of Investigation
(2016) statistics suggest that the number of active shooter
incidents has risen from 74 (2000-2008) to 191 (2009-
2016) incidents per year Additionally 456 of the active
shooter incidents occur in areas of commerce and 244 in
educational institutions Finally 60 of ASIs were termi-
nated prior to the arrival of law enforcement The increasing
rate of active shooter incidents in the areas of commerce
and educational institutions with short duration challenges
the first responder and the civilian communities to mitigate
such incidents
Law enforcement communities have applied mitigation
tactics such as unified incident command system (FEMA
2017) hosting school resource officers (Scott amp Schwartz
2014) and the formation of contact teams (Scott amp
Schwartz 2014) to mitigate such incidents The most com-
mon ASI response for the civilian population in both private
and public sectors was ldquorunhidefightrdquo (RHF) (City of Hou-
ston 2012) The RHF response was created in 2012 by the
City of Houston under the Federal Emergency Management
Agencyrsquos grant Yet despite the nationwide application of
RHF there is a lack of literature supporting the effective-
ness of RHF to lower casualties during ASIs Additionally
RHF cannot be applied in areas where the unarmed individ-
uals are incapable of fighting the active shooter such as
kindergarten or elementary schools In this study the au-
thors examined the casualty rates of two models The first
model represented an academic infrastructure without any
preventative system The second model applied an automat-
ed door lock system to the first model which was initiated
by the active shootersrsquo first discharge A campus-wide lock-
down was automatically conducted among unarmed individ-
ual agents The door lock system only prevented entry to the
lecture hall which allowed individuals to evacuate the lec-
ture hall Only run and hide were implemented in both mod-
els since they assumed that the majority of unarmed indi-
vidual agents were either kindergarten or elementary school
students who were limited in their ability to fight the shoot-
er
Agent-Based Model
AnyLogic software consists of three major components
discrete event agent-based and system dynamic methods
mdashmdashmdashmdashmdashmdashmdashmdashmdashmdashmdashmdashmdashmdashmdashmdashmdashmdashmdashmdashmdashmdashmdashmdashmdashmdashmdashmdashmdashmdashmdashmdashmdashmdashmdashmdashmdashmdashmdashmdashmdashmdashmdashmdashmdashmdashndashmdashmdashmdashmdash
46 INTERNATIONAL JOURNAL OF ENGINEERING RESEARCH AND INNOVATION | V11 N1 SPRINGSUMMER 2019
mdashmdashmdashmdashmdashmdashmdashmdashmdashmdashmdashmdashmdashmdashmdashmdashmdashmdashmdashmdashmdashmdashmdashmdashmdashmdashmdashmdashmdashmdashmdashmdashmdashmdashmdashmdashmdashmdashmdashmdashmdashmdashmdashmdashmdashmdashndashmdashmdashmdashmdash
that could be used interchangeably For this study the agent
-based method was used predominantly to recreate active
shooter incidents within the educational environment The
model consists of pedestrian and process modeling libraries
which recreates the interaction between an active shooter
and the unarmed individual agents within the model
The benefits of ABM were its ability to measure emergent
phenomena and collect individual agentrsquos interaction with
other agents Additionally ABM can illustrate ldquobehavior
degree of rationality and ability to learn and
evolverdquo (Bonabeau 2002) which was a crucial component
in measuring the cause and effect of hypothesizing what
increased or decreased the casualty rate Finally using
ABM allows active shooter research to be conducted in a
safe environment by eliminating the participantsrsquo potential
to experience post-traumatic stress disorder or other anxie-
ties (DHS 2017) Both models were based on a general
floor plan for an academic institution which was available
in the public domain as a visual aid intended to support the
emergency evacuation plans The floor plan included class-
rooms and hallway corridors which were converted to an
image file and added to the AnyLogic software
Model Physical Infrastructure
The Wall Target Line Service with Lines and Polygonal
Area from the Space Markup section in the Pedestrian Li-
brary were used to model the physical infrastructure The
wall creates a physical barrier within the model which lim-
its the agentrsquos movement For example if a wall is encoun-
tered by an agent within the model the agent seeks alterna-
tive routes by moving away from the obstacle The service
with lines section can send an agent through the wall which
represents an agent passing through the doorway The po-
lygonal area represents lecture hall seats where the agents
remain in one location for the duration of the class Each
lecture hall consists of one attractor as a point of gathering
during the lockdown phase
Model Agents
There were two agents in this model an active shooter
and the unarmed individuals State Configuration ndash Line of
Sight (LOS) and State Configuration ndash Casualty Each agent
carries different states in order to add flexibility to what an
agent can and cannot do depending on the location For
example just because an active shooterrsquos discharge range is
set to 100 feet does not mean that the shooter is capable of
selecting targets through the wall of the lecture hall or
agents in a different hallway section To limit target selec-
tion of the shooter line of sight (LOS) was modeled by
placing agents into different states depending on the loca-
tion In Figure 1 the agentrsquos state under green LOS is col-
ored purple
Figure 1 The change of agentrsquos state by location
Once the agent enters the light blue LOS the agentrsquos state
and color change to cyan Additionally an agent could be
under both green and blue LOS if two areas are merging
Both agents operate under this concept in order to limit tar-
get selection probability based on the physical location
such as hallways or lecture halls The active shooter selects
the target by using a Function within the Agent Library
Each function is coded in Java which selects the shooter
target based on the LOS state followed by the discharge
range One target could be selected per search where the
rate of each search was set to one target within a 212-
second interval Anklam Kirby Sharevski and Dietz
(2015) used the victim interval ratio by the statistics from
the Patrol Response Challenges (Buster 2008) where there
was one victim every 15 seconds by averaging the 65 active
shooter incidents to the number of victims For this study
the shooter casualty interval was based on the Parkland
Shooting (Fausset Kovaleski amp Mazzei 2018) by as-
sessing total death count and the duration of the shooting
The Java function was divided into three sections The
first section was the target selection among the agentrsquos pop-
ulation For instance the shooter searches for one target
among the pool of unarmed individual agents The second
section of the function entails determining the state of the
potential target agent If an agentrsquos state was a casualty
then the function starts over to find a new target If the
agentrsquos state was not a casualty then the function deter-
mines whether the target was within the same LOS state as
mdashmdashmdashmdashmdashmdashmdashmdashmdashmdashmdashmdashmdashmdashmdashmdashmdashmdashmdashmdashmdashmdashmdashmdashmdashmdashmdashmdashmdashmdashmdashmdashmdashmdashmdashmdashmdashmdashmdashmdashmdashmdashmdashmdashmdashmdashndashmdashmdashmdashmdash
ASSESSING THE EFFECTIVENESS OF AN AUTOMATIC DOOR LOCK SYSTEM BY DISCHARGE DETECTION 47
TO LOWER CASUALTIES DURING AN ACADEMIC ACTIVE SHOOTER INCIDENT
mdashmdashmdashmdashmdashmdashmdashmdashmdashmdashmdashmdashmdashmdashmdashmdashmdashmdashmdashmdashmdashmdashmdashmdashmdashmdashmdashmdashmdashmdashmdashmdashmdashmdashmdashmdashmdashmdashmdashmdashmdashmdashmdashmdashmdashmdashndashmdashmdashmdashmdash
mdashmdashmdashmdashmdashmdashmdashmdashmdashmdashmdashmdashmdashmdashmdashmdashmdashmdashmdashmdashmdashmdashmdashmdashmdashmdashmdashmdashmdashmdashmdashmdashmdashmdashmdashmdashmdashmdashmdashmdashmdashmdashmdashmdashmdashmdashndashmdashmdashmdashmdash
48 INTERNATIONAL JOURNAL OF ENGINEERING RESEARCH AND INNOVATION | V11 N1 SPRINGSUMMER 2019
the shooter If the shooter and the unarmed individual were
in the same state then the function evaluates the discharge
range If the potential target does not qualify under either
state the function restarts The third section of the function
executes the act of firearm discharge to the targeted agent
The exchange of fire was modeled by sending a string mes-
sage to the targeted agent The probability of a failed mes-
sage delivery was zero since the execution would occur
immediately Once the message has been received then the
state of the target agent will change to casualty and the
speed of the agent will be set to zero and the color to red
The agentrsquos movement was conducted by the following
blocks from the pedestrian library PedSource PedGoTo
PedService and PedSink PedSource determines the agent
and the rate of entry from the agent to the model For this
model there were two PedSource blocks one for an active
shooter and the other for the unarmed individual agents
TargetLine was used as an entry point which was deter-
mined within the PedSource block Once the agent exits the
model by the PedSource block the agent enters the PedSer-
vice block which allows the agent to enter the lecture hall
The PedService block prohibits the agent from traveling
through the wall which represents a door Each lecture hall
consists of a polygonal area where the agent waits through-
out the model runtime Figure 2 shows how the agentrsquos state
was changed from green to either purple or yellow based on
their location
Figure 2 The change of an agentrsquos state by location
Agents Logic
All 600 unarmed individual (UI) agents enter the model
and move randomly toward the available lecture hall Once
an agent arrives in a lecture hall it will remain at the ran-
domly selected point until the shooting begins Prior to the
shooting all 600 UI agents are distributed within the lecture
halls no UI agents remained in the hallway
The active shooter enters the model without discharging
and continues to advance down the hallway until the in-
class population count reaches 600 Once all 600 UI agents
are in the lecture hall the shooter immediately begins to
discharge UI casualties will always occur in the lecture
hall The shooterrsquos discharging function is set to one casual-
ty per 212 seconds for UI agents that are in range If there
are zero potential targets within the range the 212-second
delays starts over Once the active shooter agent begins
shooting the UI agents will then evacuate to the nearest
exit The shooter will attempt to randomly enter a lecture
hall one after another while running UI agents in the hall-
way are considered as potential targets If the automatic
door lock system is in place the shooter will remain in the
hallway until the model is terminated while having the
same ability to discharge at the running UI agents
The automatic door lock system begins as soon as the
active shooter discharges the first shot The lock system
prevents the active shooter from entering the lecture halls
while still allowing any UI agents inside to evacuate via the
hallway The shooterrsquos discharge initiates the unarmed indi-
vidual agents to either hide (shelter-in-place) or run
(evacuate) from the shooter The hide probability parameter
determines what percentage of UI agents will hide while
the rest will run from the shooter Table 1 shows that if the
hide probability is set to 20 then the remaining 80 will
run toward the nearest exit after exiting the designated lec-
ture hall
Table 1 Hide and run probability parameter manipulation per
iteration
Model Runtime Properties Limitations
and Iterations by Parameter Manipulation
bull The duration of the model was limited to six minutes
which was equivalent to the Parkland Shooting event
(Fausset et al 2018)
bull The casualty rate was limited to one casualty per 212
seconds by the active shooter again based on the
Parkland Shooting event (Fausset et al 2018)
bull The target selection began once all 600 unarmed indi-
viduals entered the lecture halls which limited the
first casualty to occur only in the lecture hall
bull If there were no potential target within the first 212
seconds the shooter required an additional 212 sec-
onds to select another target
Iteration 1 2 3 4 5 6 7 8 9 10 11
Hide 0 1 2 3 4 5 6 7 8 9 1
Run 1 9 8 7 6 5 4 3 2 1 0
mdashmdashmdashmdashmdashmdashmdashmdashmdashmdashmdashmdashmdashmdashmdashmdashmdashmdashmdashmdashmdashmdashmdashmdashmdashmdashmdashmdashmdashmdashmdashmdashmdashmdashmdashmdashmdashmdashmdashmdashmdashmdashmdashmdashmdashmdashndashmdashmdashmdashmdash
bull The unarmed individuals who were hiding in the
lecture hall could not attempt to escape if the shooter
entered the lecture hall
To allow for position and time variation each hide pa-
rameter was run 100 times and measured the following out-
put data
bull Hide parameter (Double)
bull Run parameter (Double)
bull Number of unarmed individuals in the lecture hall
(Integer)
bull Number of unarmed individuals in the hallway
(Integer)
bull Number of unarmed individual casualties (Integer)
bull Number of unarmed individuals who successfully
evacuated (Integer)
bull Number of lecture hall casualties of unarmed individ-
uals (Integer)
Results
Figure 3 suggests a highest average total casualty rate of
943 of 600 (157) where 20 hid and 80 ran to the
nearest exit The lowest average total casualty rate was 423
of 600 (071) where all unarmed individual agents were
seeking shelter within the lecture halls The highest average
hallway casualty rate was 524 of 600 (087) with 80
hide probability where the lowest rate was 360 of 600
(06) with 0 hide probability The highest average lec-
ture hall casualty rate was 479 of 600 (079) with 10
hide probability with the lowest at 0 of 600 (0) with 100
hide probability
Figure 3 Unarmed individual casualty rate by hide (shelter-in-
place) probability without immediate automatic door lock system
Figure 4 shows a comparison of the casualty rate of un-
armed individuals to the automatic door lock system by the
hide (shelter-in-place) probability
Figure 4 Unarmed individual casualty rate by hide (shelter-in-
place) probability with immediate automatic door lock system
Figure 4 suggests the lowest average casualty rate of 115
(019) was reported when all unarmed individuals hide
from the shooter with the automatic door lock mechanism in
place The highest average casualty rate was 98 (163)
where all agents had to evacuate from the lecture hall re-
gardless of the automated lock mechanism The highest
average hallway casualty rate was 647 of 600 (108) with
90 hide probability where the lowest rate was 0 of 600
(0) with 0 hide probability The highest average lecture
hall casualty rate was 381 of 600 (064) with 30 hide
probability with the lowest at 115 of 600 (019) with
100 hide probability
The locations were made up of total hallway and lecture
hall where casualty probabilities were measured based on
two parameter manipulations The first parameter was the
hide probability ranging from 0 where zero unarmed
individuals (UI) evacuated the lecture hall to 100 where
all 600 evacuated to the nearest exit The second was a
Boolean parameter which determined whether the automat-
ic door lock system was in place or not The total casualty
probabilities were calculated by dividing the total number of
casualties by 600 The hallway and the lecture hall casualty
probabilities were calculated by dividing the casualty rates
by the total number of either run or hide casualties For ex-
ample hallway casualty probability was calculated by di-
viding the hallway casualty rate to the total number of evac-
uees Figure 5 compares the UI agentrsquos casualty probability
without the immediate door lock system based on the
agentrsquos location of casualty
Figure 5 illustrates the total hallway and lecture hall cas-
ualty probability based on the hide parameter without the
door lock system The highest total casualty probability was
157 when 20 of unarmed individuals hid and 80 ran
to the nearest exit The lowest total casualty probability was
071 when 100 evacuated to the nearest exit The lec-
mdashmdashmdashmdashmdashmdashmdashmdashmdashmdashmdashmdashmdashmdashmdashmdashmdashmdashmdashmdashmdashmdashmdashmdashmdashmdashmdashmdashmdashmdashmdashmdashmdashmdashmdashmdashmdashmdashmdashmdashmdashmdashmdashmdashmdashmdashndashmdashmdashmdashmdash
ASSESSING THE EFFECTIVENESS OF AN AUTOMATIC DOOR LOCK SYSTEM BY DISCHARGE DETECTION 49
TO LOWER CASUALTIES DURING AN ACADEMIC ACTIVE SHOOTER INCIDENT
mdashmdashmdashmdashmdashmdashmdashmdashmdashmdashmdashmdashmdashmdashmdashmdashmdashmdashmdashmdashmdashmdashmdashmdashmdashmdashmdashmdashmdashmdashmdashmdashmdashmdashmdashmdashmdashmdashmdashmdashmdashmdashmdashmdashmdashmdashndashmdashmdashmdashmdash
mdashmdashmdashmdashmdashmdashmdashmdashmdashmdashmdashmdashmdashmdashmdashmdashmdashmdashmdashmdashmdashmdashmdashmdashmdashmdashmdashmdashmdashmdashmdashmdashmdashmdashmdashmdashmdashmdashmdashmdashmdashmdashmdashmdashmdashmdashndashmdashmdashmdashmdash
50 INTERNATIONAL JOURNAL OF ENGINEERING RESEARCH AND INNOVATION | V11 N1 SPRINGSUMMER 2019
ture hall casualty probability was the highest at 735
when 10 of the unarmed individuals evacuated The low-
est lecture hall casualty probability was 06 when every-
one sought shelter The highest hallway casualty probability
was 353 when 90 hid upon the first discharge The
lowest hallway casualty probability was 0 when 100
hid from the shooter Figure 6 compares the UI agentrsquos cas-
ualty probability with the immediate door lock system
based on the agentrsquos location of casualty
Figure 5 Unarmed individual survival probability by hide (shelter-
in-place) probability without immediate automatic door lock sys-
tem
Figure 6 Unarmed individual survival probability by hide (shelter-
in-place) probability with immediate automatic door lock system
Figure 6 illustrates the total hallway and lecture hall
casualty probability based on the hide parameter with the
door lock system The highest total casualty probability was
158 during the 10 hide probability where the lowest
probability was 019 during the 100 hide probability
The highest lecture hall casualty probability was 5 during
the 10 hide probability where the lowest lecture hall
probability was 019 for the 100 hide probability The
highest hallway casualty probability was 536 during the
90 hide probability The lowest hallway casualty probabil-
ity was 0 for the 100 hide probability Table 2 compares
the total casualty probabilities for the model with and with-
out a door lock
Table 2 Total casualty probability with and without door lock per
iteration
The overall casualty probability decreased by 026 with
the highest casualty rate decrease of 051 with all agents
sheltering in place In contrast the casualty rate increased
by 005 for the 10 hide probability Table 3 compares
the hallway casualty probabilities for the model with and
without a door lock The overall casualty probability in-
creased by 059 with the highest casualty rate increasing
by 183 when 90 sought shelter There was no decrease
in casualty probability for hallway casualties Table 4 com-
pares the lecture hall casualty probabilities for the model
with and without a door lock The overall casualty probabil-
ity decreased by 101 with the highest casualty rate de-
crease of 235 when 10 sought shelter In contrast the
casualty rate increased by 001 when all agents evacuated
Probability Total Casualty
Probability
Survival Probability
Difference
Hide Run
Without
Door
Lock
With
Door Lock
0 100 139 100 -39
10 90 153 158 05
20 80 157 148 -09
30 70 142 141 -01
40 60 134 112 -21
50 50 129 98 -31
60 40 121 94 -27
70 30 113 84 -29
80 20 126 81 -44
90 10 118 75 -44
100 0 71 19 -51
Average
Casualty
Probability
127 101 -26
mdashmdashmdashmdashmdashmdashmdashmdashmdashmdashmdashmdashmdashmdashmdashmdashmdashmdashmdashmdashmdashmdashmdashmdashmdashmdashmdashmdashmdashmdashmdashmdashmdashmdashmdashmdashmdashmdashmdashmdashmdashmdashmdashmdashmdashmdashndashmdashmdashmdashmdash
Table 3 Hallway casualty probability with and without door lock
per iteration
Table 4 Lecture hall casualty probability with and without door
lock per iteration
Conclusions
Assuming locked doors are effective at separating poten-
tial victims from the shooter this study further demonstrat-
ed the value of agent-based models to design effective poli-
cies by testing the impact of automatic door locking tech-
nology on causality rates Using this model shelter-in-place
proved to be an effective strategy for reducing the impact of
an active shooter event with the greatest reduction shown
when all individuals sought to shelter in place The imple-
mentation of an automated door lock system triggered by
discharge detection did decrease the total casualty rate an
average of 026 over 100 simulated iterations The total
lecture hall casualty rate decreased an average of 101
while the total hallway casualty rate increased by 059
While the automatic door locking system did reduce causal-
ities individuals in the hallways also saw an increase in
causalities due to limits in protection from the shooter and
evacuation paths
References
Anklam C Kirby A Sharevski F amp Dietz J (2015)
Mitigating active shooter impact analysis for policy
options based on agentcomputer-based modeling Jour-
nal of Emergency Management 13(3) Retrieved from
httpswwwwmpllcorgojs-242indexphpjem
articleview176
Bonabeau E (2002) Agent-based modeling Methods and
techniques for simulating human systems Proceedings
of the National Academy of Sciences 99(suppl 3)
7280-7287
Buster C (2008) Patrol response challenge NCJRS Law
and Order 56(6) 62-68
City of Houston (2012) RunHideFightmdashReady Houston
Retrieved from httpreadyhoustonwpenginecom
suspicious-activityrun-hide-fight
Department of Homeland Security [DHS] (2017) Active
shooter recovery guide Retrieved from https
wwwdhsgovsitesdefaultfilespublicationsactive-
shooter-recovery-guide-08-08-2017-508pdf
Fausset R Kovaleski S amp Mazzei P (2018) On a day
like any other at a Florida school 6 minutes of death
and chaos The New Y ork Times Retrieved
from httpswwwnytimescom20180216us
stoneman-douglas-shootinghtml
Federal Bureau of Investigation (2016) Quick look 220
Active shooter incidents in the United States between
2000-2016 FBI Retrieved from httpswwwfbigov
aboutpartnershipsoffice-of-partner-engagementactive
-shooter-incidents-graphics
Probability Total Casualty
Probability
Survival Probability
Difference
Hide Run Without
Door Lock
With
Door Lock
0 100 79 102 23
10 90 89 120 31
20 80 96 131 35
30 70 87 111 23
40 60 88 129 40
50 50 101 151 50
60 40 122 180 58
70 30 125 211 86
80 20 192 308 116
90 10 353 536 183
100 0 0 0 0
Average
Casualty
Probability
121 180 59
Probability Total Casualty
Probability
Survival Probability
Difference
Hide Run Without
Door Lock
With
Door Lock
0 100 60 61 01
10 90 735 500 -235
20 80 402 218 -184
30 70 317 212 -106
40 60 203 88 -114
50 50 157 45 -111
60 40 120 37 -83
70 30 107 29 -78
80 20 109 25 -85
90 10 92 23 -69
100 0 71 19 -51
Average
Casualty
Probability
216 114 -101
mdashmdashmdashmdashmdashmdashmdashmdashmdashmdashmdashmdashmdashmdashmdashmdashmdashmdashmdashmdashmdashmdashmdashmdashmdashmdashmdashmdashmdashmdashmdashmdashmdashmdashmdashmdashmdashmdashmdashmdashmdashmdashmdashmdashmdashmdashndashmdashmdashmdashmdash
ASSESSING THE EFFECTIVENESS OF AN AUTOMATIC DOOR LOCK SYSTEM BY DISCHARGE DETECTION 51
TO LOWER CASUALTIES DURING AN ACADEMIC ACTIVE SHOOTER INCIDENT
mdashmdashmdashmdashmdashmdashmdashmdashmdashmdashmdashmdashmdashmdashmdashmdashmdashmdashmdashmdashmdashmdashmdashmdashmdashmdashmdashmdashmdashmdashmdashmdashmdashmdashmdashmdashmdashmdashmdashmdashmdashmdashmdashmdashmdashmdashndashmdashmdashmdashmdash
mdashmdashmdashmdashmdashmdashmdashmdashmdashmdashmdashmdashmdashmdashmdashmdashmdashmdashmdashmdashmdashmdashmdashmdashmdashmdashmdashmdashmdashmdashmdashmdashmdashmdashmdashmdashmdashmdashmdashmdashmdashmdashmdashmdashmdashmdashndashmdashmdashmdashmdash
52 INTERNATIONAL JOURNAL OF ENGINEERING RESEARCH AND INNOVATION | V11 N1 SPRINGSUMMER 2019
Federal Emergency Management Agency [FEMA] (2017)
Incident command system resources Retrieved from
httpswwwfemagovincident-command-system-
resources
Scott M amp Schwartz J (2014) The police response to
active shooter incidents Washington DC Police Ex-
ecutive Research Forum Retrieved from https
wwwpoliceforumorgassetsdocs
Critical_Issues_Seriesthe20police20response
20to20active20shooter20incidents202014pdf
Biographies
JAE YONG LEE is a graduate research assistant in
computer and information technology at Purdue University
He earned his BA in public relations and minor in computer
and information technology in 2017 from Purdue Universi-
ty His research interests include examining the effective-
ness of active shooter response and mitigation policies with
agent-based modeling utilizing AnyLogic Mr Lee may be
reached at jaeleepurdueedu
J ERIC DIETZ is a Professor of Computer and Infor -
mation Technology at Purdue University and the Director of
Purdue Homeland Security Institute He earned his BS and
MS degrees in chemical engineering in 1986 from Rose-
Hulman Institute of Technology and PhD in chemical engi-
neering from Purdue University He had served as Founding
Executive Director for the Indiana Department of Homeland
Security and retired Lieutenant Colonel from the US Army
Dr Dietz may be reached at jedietzpurdueedu
INSTRUCTIONS FOR AUTHORS
MANUSCRIPT FORMATTING REQUIREMENTS The INTERNATIONAL JOURNAL OF ENGINEERING
RESEARCH AND INNOVATION is an onlineprint publi-
cation designed for Engineering Engineering Technology
and Industrial Technology professionals All submissions to
this journal submission of manuscripts peer-reviews of
submitted documents requested editing changes notifica-
tion of acceptance or rejection and final publication of ac-
cepted manuscripts will be handled electronically The only
exception is the submission of separate high-quality image
files that are too large to send electronically
All manuscript submissions must be prepared in
Microsoft Word (doc or docx) and contain all figures im-
ages andor pictures embedded where you want them and
appropriately captioned Also included here is a summary of
the formatting instructions You should however review
the sample Word document on our website (httpijeriorg
formatting-guidelines) for details on how to correctly format
your manuscript The editorial staff reserves the right to edit
and reformat any submitted document in order to meet pub-
lication standards of the journal
The references included in the References section of
your manuscript must follow APA-formatting guidelines In
order to help you the sample Word document also includes
numerous examples of how to format a variety of scenarios
Keep in mind that an incorrectly formatted manuscript will
be returned to you a delay that may cause it (if accepted) to
be moved to a subsequent issue of the journal
1 Word Document Page Setup Two columns with frac14
spacing between columns top of page = frac34 bottom of
page = 1 (from the top of the footer to bottom of
page) left margin = frac34 right margin = frac34
2 Paper Title Centered at the top of the fir st page
with a 22-point Times New Roman (Bold) small-caps
font
3 Page Breaks Do not use page breaks
4 Figures Tables and Equations All figures tables
and equations must be placed immediately after the first
paragraph in which they are introduced And each must
be introduced For example ldquoFigure 1 shows the opera-
tion of supercapacitorsrdquo ldquoThe speed of light can be
determined using Equation 4rdquo
5 More on Tables and Figures Center table captions
above each table center figure captions below each
figure Use 9-point Times New Roman (TNR) font
Italicize the words for table and figure as well as their
respective numbers the remaining information in the
caption is not italicized and followed by a periodmdasheg
ldquoTable 1 Number of research universities in the staterdquo
or ldquoFigure 5 Cross-sectional aerial map of the forested
areardquo
6 Figures with Multiple Images If any given figure
includes multiple images do NOT group them they
must be placed individually and have individual minor
captions using ldquo(a)rdquo ldquo(b)rdquo etc Again use 9-point TNR
7 Equations Each equation must be numbered
placed in numerical order within the document and
introducedmdashas noted in item 4
8 Tables Graphs and Flowcharts All tables graphs
and flowcharts must be created directly in Word tables
must be enclosed on all sides The use of color andor
highlighting is acceptable and encouraged if it provides
clarity for the reader
9 Textboxes Do not use text boxes anywhere in the
document For example tablefigure captions must be
regular text and not attached in any way to their tables
or images
10 Body Fonts Use 10-point TNR for body text through-
out (18 paragraph indention) indent all new para-
graphs as per the images shown below do not use tabs
anywhere in the document 9-point TNR for author
namesaffiliations under the paper title 16-point TNR
for major section titles 14-point TNR for minor section
titles
11 Personal Pronouns Do not use personal pronouns
(eg ldquowerdquo ldquoourrdquo etc)
12 Section Numbering Do not use section number ing
of any kind
13 Headers and Footers Do not use either
mdashmdashmdashmdashmdashmdashmdashmdashmdashmdashmdashmdashmdashmdashmdashmdashmdashmdashmdashmdashmdashmdashmdashmdashmdashmdashmdashmdashmdashmdashmdashmdashmdashmdashmdashmdashmdashmdashmdashmdashmdashmdashmdashmdashmdashmdashndashmdashmdashmdashmdash
INSTRUCTIONS FOR AUTHORS MANUSCRIPT FORMATTING REQUIREMENTS 53
mdashmdashmdashmdashmdashmdashmdashmdashmdashmdashmdashmdashmdashmdashmdashmdashmdashmdashmdashmdashmdashmdashmdashmdashmdashmdashmdashmdashmdashmdashmdashmdashmdashmdashmdashmdashmdashmdashmdashmdashmdashmdashmdashmdashmdashmdashndashmdashmdashmdashmdash
mdashmdashmdashmdashmdashmdashmdashmdashmdashmdashmdashmdashmdashmdashmdashmdashmdashmdashmdashmdashmdashmdashmdashmdashmdashmdashmdashmdashmdashmdashmdashmdashmdashmdashmdashmdashmdashmdashmdashmdashmdashmdashmdashmdashmdashmdashndashmdashmdashmdashmdash
54 INTERNATIONAL JOURNAL OF ENGINEERING RESEARCH AND INNOVATION | V11 N1 SPRINGSUMMER 2019
14 References in the Abstract Do NOT include any
references in the Abstract
15 In-Text Referencing For the fir st occur rence of a
given reference list all authorsmdashlast names onlymdashup
to seven (7) if more than seven use ldquoet alrdquo after the
seventh author For a second citation of the same refer-
encemdashassuming that it has three or more authorsmdashadd
ldquoet alrdquo after the third author Again see the sample
Word document and the formatting guide for references
for specifics
16 More on In-Text References If you include a refer -
ence on any table figure or equation that was not cre-
ated or originally published by one or more authors on
your manuscript you may not republish it without the
expressed written consent of the publishing author(s)
The same holds true for name-brand products
17 End-of-Document References Section List all refer -
ences in alphabetical order using the last name of the
first authormdashlast name first followed by a comma and
the authorrsquos initials Do not use retrieval dates for web-
sites
18 Author Biographies Include biographies and cur -
rent email addresses for each author at the end of the
document
19 Page Limit Manuscr ipts should not be more than
15 pages (single-spaced 2-column format 10-point
TNR font)
20 Page Numbering Do not use page numbers
21 Publication Charges Manuscr ipts accepted for pub-
lication are subject to mandatory publication charges
22 Copyright Agreement A copyr ight transfer agree-
ment form must be signed by all authors on a given
manuscript and submitted by the corresponding author
before that manuscript will be published Two versions
of the form will be sent with your manuscriptrsquos ac-
ceptance email
Only one form is required Do not submit both forms
The form named ldquopaperrdquo must be hand-signed by each
author The other form ldquoelectronicrdquo does not require
hand signatures and may be filled out by the corre-
sponding author as long as heshe receives written per-
mission from all authors to have himher sign on their
behalf
23 Submissions All manuscr ipts and required files and
forms must be submitted electronically to Dr Philip D
Weinsier manuscript editor at philipwbgsuedu
24 Published Deadlines Manuscr ipts may be submit-
ted at any time during the year irrespective of pub-
lished deadlines and the editor will automatically have
your manuscript reviewed for the next-available issue
of the journal Published deadlines are intended as
ldquotargetrdquo dates for submitting new manuscripts as well
as revised documents Assuming that all other submis-
sion conditions have been met and that there is space
available in the associated issue your manuscript will
be published in that issue if the submission processmdash
including payment of publication feesmdashhas been com-
pleted by the posted deadline for that issue
Missing a deadline generally only means that your
manuscript may be held for a subsequent issue of the
journal However conditions exist under which a given
manuscript may be rejected Always check with the
editor to be sure Also if you do not complete the sub-
mission process (including all required revisions) with-
in 12 months of the original submission of your manu-
script your manuscript may be rejected or it may have
to begin the entire review process anew
INTERNATIONAL JOURNAL OF
MODERN ENGINEERING
THE LEADING JOURNAL OF ENGINEERING APPLIED SCIENCE AND TECHNOLOGY
Mark Rajai PhD
Editor-in-Chief California State University-Northridge College of Engineering and Computer Science Room JD 4510 Northridge CA 91330 Office (818) 677-5003 Email mrajaicsunedu
Contact us
wwwiajcorg wwwijmeus
wwwtiijorg
wwwijeriorg
Print ISSN 2157-8052
Online ISSN 1930-6628
TO JOIN THE REVIEW BOARD
bull The International Journal of Engineering Research and
Innovation (IJERI)
For more information visit wwwijeriorg
bull The Technology Interface International Journal (TIIJ)
For more information visit wwwtiijorg
OTHER IAJC JOURNALS
bull Manuscripts should be sent electronically to
the manuscript editor Dr Philip Weinsier
at philipwbgsuedu
For submission guidelines visit
wwwijmeussubmissions
IJME SUBMISSIONS
bull Contact the chair of the International
Review Board Dr Philip Weinsier at
philipwbgsuedu
For more information visit
wwwijmeusijme_editorialhtm
bull IJME was established in 2000 and is the first and
official flagship journal of the International
Association of Journal and Conferences (IAJC)
bull IJME is a high-quality independent journal steered by
a distinguished board of directors and supported by an
international review board representing many well-
known universities colleges and corporations in the
US and abroad
bull IJME has an impact factor of 300 placing it among
the top 100 engineering journals worldwide and is the
1 visited engineering journal website (according to
the National Science Digital Library)
ABOUT IJME
INDEXING ORGANIZATIONS
bull IJME is indexed by numerous agencies
For a complete listing please visit us at
wwwijmeus
SPRINGSUMMER 2009
VOLUME 1 NUMBER 1
IJERI Contact Information
General questions or inquiries about sponsorship of the journal should be directed to
Mark Rajai PhD
Founder and Editor-In-Chief
Office (818) 677-5003
Email editorijeriorg
Department of Manufacturing Systems Engineering amp Management
California State University-Northridge
18111 Nordhoff St
Room JD3317
Northridge CA 91330
The International Journal of Engineer-
ing Research amp Innovation (IJERI) is
the second official journal of the Inter-
national Association of Journals and
Conferences (IAJC) IJERI is a highly-
selective peer-reviewed print journal
which publishes top-level work from all
areas of engineering research innova-
tion and entrepreneurship
IJERI

mdashmdashmdashmdashmdashmdashmdashmdashmdashmdashmdashmdashmdashmdashmdashmdashmdashmdashmdashmdashmdashmdashmdashmdashmdashmdashmdashmdashmdashmdashmdashmdashmdashmdashmdashmdashmdashmdashmdashmdashmdashmdashmdashmdashmdashmdashmdashmdashmdashmdash
mdashmdashmdashmdashmdashmdashmdashmdashmdashmdashmdashmdashmdashmdashmdashmdashmdashmdashmdashmdashmdashmdashmdashmdashmdashmdashmdashmdashmdashmdashmdashmdashmdashmdashmdashmdashmdashmdashmdashmdashmdashmdashmdashmdashmdashmdashndashmdashmdashmdashmdash
INTERNATIONAL JOURNAL OF ENGINEERING RESEARCH AND INNOVATION
INTERNATIONAL JOURNAL OF ENGINEERING
RESEARCH AND INNOVATION The INTERNATIONAL JOURNAL OF ENGINEERING RESEARCH AND
INNOVATION (IJERI) is an independent and not-for-profit publication which
aims to provide the engineering community with a resource and forum for scholar-
ly expression and reflection
IJERI is published twice annually (fall and spring issues) and includes peer-
reviewed research articles editorials and commentary that contribute to our un-
derstanding of the issues problems and research associated with engineering and
related fields The journal encourages the submission of manuscripts from private
public and academic sectors The views expressed are those of the authors and do
not necessarily reflect the opinions of the IJERI editors
EDITORIAL OFFICE
Mark Rajai PhD
Editor-in-Chief
Office (818) 677-2167
Email ijmeeditoriajcorg
Dept of Manufacturing Systems
Engineering amp Management
California State University-
Northridge
18111 Nordhoff Street
Northridge CA 91330-8332
THE INTERNATIONAL JOURNAL OF ENGINEERING
RESEARCH AND INNOVATION EDITORS
Editor-in-Chief
Mark Rajai
California State University-Northridge
Associate Editors
Paul Wilder
Vincennes University
Li Tan
Purdue University North Central
Production Editor
Philip Weinsier
Bowling Green State University-Firelands
Subscription Editor
Morteza Sadat-Hossieny
Northern Kentucky University
Web Administrator
Saeed Namyar
Advanced Information Systems
Manuscript Editor
Philip Weinsier
Bowling Green State University-Firelands
Copy Editors
Li Tan
Purdue University North Central
Ahmad Sarfaraz
California State University-Northridge
Technical Editors
Marilyn Dyrud
Oregon Institute of Technology
Publisher
Bowling Green State University Firelands
Editorrsquos Note Academic Active-Shooter Incidents 3
Philip Weinsier IJERI Manuscript Editor
Analyzing Response Communication Mitigation Methods through Simulation Modeling 5
Katherine E Reichart Purdue University Anna R Larson Purdue University
Kristal K Smith Purdue University J Eric Dietz Purdue University
Developing an Open Source Inexpensive Large-Scale Polar Configuration 3D Printer 13
Sourabh Prashant Deshpande University of Cincinnati Shrinivas Kulkarni Michigan Technological University
Sid Shah Michigan Technological University John Irwin Michigan Technological University
A Comparative Study of the Thermal Efficiency of Solar Vacuum-Tube versus Flat-Plate Collectors
for Water Heating Systems 23
SV Vishnu Samudrala Zimmer Biomet Ahmed ElSawy Tennessee Technological University
Mohan Rao Tennessee Technological University Stephen Idem Tennessee Technological University
Design and Development of a GUI for RF Communications 30
Ehsan Sheybani University of South Florida Giti Javidi University of South Florida
A Diagnostic Clock for Verification of Image Time Synchronization 37
Curtis Cohenour Ohio University
Assessing the Effectiveness of an Automatic Door Lock System by Discharge Detection to Lower
Casualties during an Academic Active Shooter Incident 46
Jae Yong Lee Purdue University James Eric Dietz Purdue University
Instructions for Authors Manuscript Formatting Requirements 53
mdashmdashmdashmdashmdashmdashmdashmdashmdashmdashmdashmdashmdashmdashmdashmdashmdashmdashmdashmdashmdashmdashmdashmdashmdashmdashmdashmdashmdashmdashmdashmdashmdashmdashmdashmdashmdashmdashmdashmdashmdashmdashmdashmdashmdashmdashndashmdashmdashmdashmdash
mdashmdashmdashmdashmdashmdashmdashmdashmdashmdashmdashmdashmdashmdashmdashmdashmdashmdashmdashmdashmdashmdashmdashmdashmdashmdashmdashmdashmdashmdashmdashmdashmdashmdashmdashmdashmdashmdashmdashmdashmdashmdashmdashmdashmdashmdashndashmdashmdashmdashmdash
INTERNATIONAL JOURNAL OF ENGINEERING RESEARCH AND INNOVATION | V11 N1 SPRINGSUMMER 2019
TABLE OF CONTENTS
Philip Weinsier IJERI Manuscript Editor
mdashmdashmdashmdashmdashmdashmdashmdashmdashmdashmdashmdashmdashmdashmdashmdashmdashmdashmdashmdashmdashmdashmdashmdashmdashmdashmdashmdashmdashmdashmdashmdashmdashmdashmdashmdashmdashmdashmdashmdashmdashmdashmdashmdashmdashmdashmdashmdashmdashmdashmdashndashmdashmdashmdashmdash
IN THIS ISSUE (P46)
ACADEMIC ACTIVE-SHOOTER INCIDENTS
So many of our children have experienced violent
deaths in our nationrsquos schools the one place we would
like to think where our children will be safe outside of
their homes Yet anyone listening to the news since the
inventions of radio and TV are hearing otherwise By
any measure and regardless of the sourcemdashthe National
Education Association (NEA) the American Federation
of Teachers (AFT) Everytown (for gun safety) K12ac-
ademics CNNmdashtoo many of our children have lost
their lives in school shootings Due to media attention
TV viewers can be forgiven if they perceive school
shootings as a relatively new phenomenonmdash15 events
in 2019 alone 39 between 2010 and 2018 and another
147 deaths between 2000 and 2010 But according to
these same sources there were another 98 incidents go-
ing back to 1764 In that first recorded event nine of the
11 children and the schoolmaster were shot and killed
Mass school shootingsmdashas if it should make a differ-
ence how many children are slaughtered even one
should be cause for national concern and federal ac-
tionmdashcomprise only 1 of school gun violence inci-
dents while logging 28 of the total number of deaths
But lest we think that all of these shootings were perpe-
trated by crazed current or former students (40) or
facultystaff or resource officers it should be noted that
44 are actually suicides and attempted suicides unin-
tentional shootings and legal interventions not sure
what that last category is At least in New York 79 of
active-shooter incidents in schools were perpetrated by
a school-aged student (and a current or recent graduate
of the school)
The next question that we all ask is where are these
children getting their guns As the vast majority of
these shooters are under 18 they are not buying the
guns themselves (at least not legally) Evidence suggests
that 78 of them get their weapons from their own
homes or those of friends and relatives So far all one
can say is that there is a problem a problem that has
myriad facets Given that government irrespective of
your opinion of the current administration is either in-
capable or simply not doing enough on its end to miti-
gate the problem society is trying to find its own solu-
tions Instead of getting guns out of the hands of poten-
tial shootersmdashone facet of the problem that our elected
officials will argue ad nauseam without effective re-
sultsmdashthere are many researchers working on scenarios
to keep students safe or at least as safe as possible
when an active-shooter situation arises Currently
runhidefight (RHF) is a national mantra for being pre-
pared for such events But according to the authors of
this featured article (see Assessing the Effectiveness of
an Automatic Door Lock System by Discharge Detec-
tion to Lower Casualties during an Academic Active
Shooter Incident on p46) modeling a scenario similar
to the Parkland shooting suggests that the application of
RHF without situational awareness of the shooterrsquos lo-
cation could cause higher casualty rates by an average
of more than 126 individuals Thus in their study the
authors compared the casualty rates of two models
The first model consisted only of hide (shelter-in-
place) and run (evacuate) The second model applied the
first modelrsquos components with an automatic door lock
system which was triggered by discharge detection To
exclude human participation and to prevent physiologi-
cal and psychological impact agent-based modeling
(ABM) was used to recreate a one-story academic infra-
structure with 26 lecture halls and three exits containing
600 unarmed individuals The flexibility of ABM allows
multiple iterations while manipulating various parame-
ters The ABM approach in active-shooter research also
eliminates human error and logistical issues The out-
come of this study evaluates the effectiveness of an au-
tomated door lock system based on firearm discharge
detection with a campus-wide alert system to conduct
lockdown
As frustrating and embarrassing as it has been for
well centuries now it is my sincere hope that our tech-
niques for increasing student safety will outpace the
ability of frustrated revengeful and deranged individu-
als to enter our schools and harm our children And by
harm I mean not only save the anguish on the part of
the parents in their childrenrsquos deaths but also the life-
long debilitating and mentally scarring effects on those
surviving such shootings
mdashmdashmdashmdashmdashmdashmdashmdashmdashmdashmdashmdashmdashmdashmdashmdashmdashmdashmdashmdashmdashmdashmdashmdashmdashmdashmdashmdashmdashmdashmdashmdashmdashmdashmdashmdashmdashmdashmdashmdashmdashmdashmdashmdashmdashmdashndashmdashmdashmdashmdash
EDITORrsquoS NOTE (IN THIS ISSUE) ACADEMIC ACTIVE-SHOOTER INCIDENTS 3
mdashmdashmdashmdashmdashmdashmdashmdashmdashmdashmdashmdashmdashmdashmdashmdashmdashmdashmdashmdashmdashmdashmdashmdashmdashmdashmdashmdashmdashmdashmdashmdashmdashmdashmdashmdashmdashmdashmdashmdashmdashmdashmdashmdashmdashmdashndashmdashmdashmdashmdash
mdashmdashmdashmdashmdashmdashmdashmdashmdashmdashmdashmdashmdashmdashmdashmdashmdashmdashmdashmdashmdashmdashmdashmdashmdashmdashmdashmdashmdashmdashmdashmdashmdashmdashmdashmdashmdashmdashmdashmdashmdashmdashmdashmdashmdashmdashndashmdashmdashmdashmdash
4 INTERNATIONAL JOURNAL OF ENGINEERING RESEARCH AND INNOVATION | V11 N1 SPRINGSUMMER 2019
State University of New York (NY) North Carolina AampT State University (NC)
Michigan Tech (MI)
Purdue University Northwest (IN) Zamfara AC Development (NIGERIA)
Virginia State University (VA)
Memphis University (TN) Guru Nanak Dev Engineering (INDIA)
Bowling Green State Univ Firelands (OH)
Minnesota State University (MN) Texas AampM University Kingsville (TX)
Illinois State University (IL)
Iowa State University (IA) Eastern Illinois University (IL)
Indiana State University (IN)
Ohio University (OH) Claflin University (SC)
North Carolina AampT State University (NC)
Alabama AampM University (AL) Ferris State University (MI)
Appalachian State University (NC)
Oregon Institute of Technology (OR) Elizabeth City State University (NC)
Tennessee Technological University (TN)
Millersville University (PA) University of Tennessee Chattanooga (TN)
Zagazig University EGYPT) Utah Valley University (UT)
Abu Dhabi University (UAE)
Purdue Polytechnic (IN) Penn State University (PA)
Safety Engineer in Sonelgaz (ALGERIA)
City University of New York (NY) Central Connecticut State University (CT)
University of Louisiana Lafayette (LA)
North Dakota State University (ND) North Carolina AampT University (NC)
Indiana University Purdue (IN)
Michigan Tech (MI) Eastern Illinois University (IL)
Bowling Green State University (OH)
Millersville University (PA) Purdue Polytechnic (IN)
North Dakota State University (ND)
Abu Dhabi University (UAE) Purdue University Calumet (IN)
Bowling Green State University (OH)
Southeast Missouri State University (MO) Bowling Green State University (OH)
Ohio University (OH)
Penn State University Berks (PA) Central Michigan University (MI)
Florida AampM University (FL)
Penn State University (PA) ARUP Corporation
University of Louisiana (LA)
University of Southern Indiana (IN) Eastern Illinois University (IL)
Cal State Poly Pomona (CA)
Excelsior College (NY) Jackson State University (MS)
Penn State Berks (PA)
California State University Fresno (CA) Michigan Tech (MI)
Mohammed Abdallah Paul Akangah
Nasser Alaraje
Ali Alavizadeh Lawal Anka
Jahangir Ansari
Kevin Berisso Pankaj Bhambri
Michelle Brodke
Shaobiao Cai Rajab Challoo
Isaac Chang
Shu-Hui (Susan) Chang Rigoberto Chinchilla
Phil Cochrane
Curtis Cohenour Emily Crawford
Dongyang (Sunny) Deng
ZT Deng Sagar Deshpande
David Domermuth
Marilyn Dyrud Mehran Elahi
Ahmed Elsawy
Cindy English Ignatius Fomunung
Ahmed Gawad Mohsen Hamidi
Mamoon Hammad
Gene Harding Bernd Haupt
Youcef Himri
Delowar Hossain Xiaobing Hou
Shelton Houston
Ying Huang Christian Bock-Hyeng
Pete Hylton
John Irwin Toqeer Israr
Sudershan Jetley
Alex Johnson Rex Kanu
Reza Karim
Manish Kewalramani Tae-Hoon Kim
Chris Kluse
Doug Koch Resmi Krishnankuttyrema
Zaki Kuruppalil
Shiyoung Lee Soo-Yen (Samson) Lee
Chao Li
Dale Litwhiler Mani Manivannan
GH Massiha
Thomas McDonald David Melton
Shokoufeh Mirzaei
Sam Mryyan Jessica Murphy
Rungun Nathan
Arun Nambiar Aurenice Oliveira
University of Central Missouri (MO) Purdue Fort Wayne (IN)
Community College of Rhode Island (RI)
Sardar Patel University (INDIA) Virginia State University (VA)
Broadcom Corporation
Warsaw University of Tech (POLAND) University of West Florida (FL)
California State University-Fullerton (CA)
Wireless Systems Engineer Brigham Young University (UT)
DeSales University (PA)
Baker College (MI) Michigan Technological University (MI)
Zagros Oil amp Gas Company (IRAN)
St Cloud State University (MN) Shahrood University of Technology (IRAN)
North Carolina AampT State University (NC)
Government Engineering College (INDIA) Wentworth Institute of Technology (MA)
Southern Illinois University (IL)
Ohio University (OH) Camarines Sur Polytechnic (PHILIPPINES)
Missouri University of Science amp Tech (MO)
University of Houston Downtown (TX) University of Central Missouri (MO)
University of South Florida Polytechnic (FL) Central Connecticut State University (CT)
Texas AampM University (TX)
Thammasat University (THAILAND) Central Connecticut State University (CT)
Purdue University (IN)
University of Pittsburgh Johnstown (PA) Purdue University Calumet (IN)
Sam Houston State University (TX)
Ohio University (OH) Jackson State University (MS)
Missouri Western State University (MO)
Troy Ollison Reynaldo Pablo
Basile Panoutsopoulos
Shahera Patel Thongchai Phairoh
Huyu Qu
Desire Rasolomampionona Michael Reynolds
Nina Robson
Marla Rogers Dale Rowe
Karen Ruggles
Anca Sala Alex Sergeyev
Mehdi Shabaninejad
Hiral Shah Mojtaba Shivaie
Musibau Shofoluwe
Amitkumar B Solanki Jiahui Song
Carl Spezia
Michelle Surerus Harold Terano
Sanjay Tewari
Vassilios Tzouanas Jeff Ulmer
Abraham Walton Haoyu Wang
Jyhwen Wang
Boonsap Witchayangkoon Shuju Wu
Baijian (Justin) Yang
Eunice Yang Xiaoli (Lucy) Yang
Faruk Yildiz
Yuqiu You Pao-Chiang Yuan
Jinwen Zhu
Editorial Review Board Members
ANALYZING RESPONSE COMMUNICATION MITIGATION
METHODS THROUGH SIMULATION MODELING mdashmdashmdashmdashmdashmdashmdashmdashmdashmdashmdashmdashmdashmdashmdashmdashmdashmdashmdashmdashmdashmdashmdashmdashmdashmdashmdashmdashmdashmdashmdashmdashmdashmdashmdashmdashmdashmdashmdashmdashmdashmdashmdashmdashmdashmdashndashmdashmdashmdashmdash
Katherine E Reichart Purdue University Anna R Larson Purdue University Kristal K Smith Purdue University
J Eric Dietz Purdue University
When modeling active shooter scenarios communicating
proper procedures saves lives Notifying authorities increas-
es response time which prevents fatal casualties The shoot-
er will engage the police instead In the 2015 Orlando night-
club shooting police were notified at 202 am from an off-
duty officer acting as a security guard (Ellis Fantz Karimi
amp McLoughlin 2016) This was four minutes after shooting
started However additional external communication did
not only come from the Orlando police department Rather
the nightclub itself used social media to communicate with
patrons People inside also provided personal and external
communication to the police or family members Active
shooters represent a scenario in which communication and
procedure must be set in place prior to the emergency to
accurately work In this way simulation modeling can pro-
vide ldquopracticerdquo in the distribution of responders areas of
weakness and effective communication Choosing a simu-
lation modeling source means selecting a system that pro-
vides multiple modeling scenarios AnyLogic Personal
Learning Edition (PLE) affords the creation of limited yet
diverse models Using agent-based logic modeling commu-
nication could be as realistic and individualized as needed
Venue Case Studies
Venues must adapt to different daily scenarios as crowds
change with the event Therefore getting an accurate evacu-
ation time is difficult mostly because publishing this data
has the potential to hurt a venuersquos security Based on evacu-
ation times in apartment buildings the average time it takes
to start evacuating (from a fire) is approximately
10 minutes assuming alert systems are in place (Proulx
1995) In combination with that time the average evacua-
tion took approximately 22 minutes to complete However
this study was done on apartment buildings as opposed to a
large event venue like a stadium Given the magnitude of
such evacuation times are more akin to typical exit proce-
dures However these times are not measured and may be
skewed as patrons are not forced to leave Therefore the
aforementioned study may be more useful to compare tim-
ing than data collected from an after-hours event This study
also took mobility constraints into consideration involving
those with special needs Ultimately the study does show
that communication effects evacuation rates The next step
was to compare this information to large event venues and
their communication methods
Abstract
Emergencies rely heavily on succinct and controlled an-
nouncements from a singular verified source However this
has been an ideal not reality Often veritable communica-
tion has occurred after events as official sources may not
have been available to comment or provide personal instruc-
tion to individuals Current communication simulation mod-
eling involves communication systems in commutation with
actual communication Systems are not the only way infor-
mation is spread In this study the authors analyzed formal
and informal response methods in an emergency at a large
event By comparing multiple methods in a systems dynam-
ic model the researchers estimated the relative value of four
communication sources in terms of impact and response
metrics The results influenced subsequent agent-based
models that reflected a real evacuation of messaging The
study resulted in increased understanding of evacuation
communication procedures as well as the simultaneous test-
ing of multiple forms of communication The models
proved that the most reliable and rapid communication has
the most impact on saving lives Additionally these proce-
dures gave insight into communication effectiveness as well
as the best combinations of messaging Thus these models
as estimates should offer insight into the current communi-
cation response procedures and their future applications
Introduction
Current communication simulation modeling should in-
volve communication systems in commutation with actual
communication Consider that an Amber alert and an online
network might be similar in communication structure but
not in actual practice Miscommunication in an online net-
work means losing all connection In an emergency false
and inconsistent messages occur According to the Depart-
ment of Homeland Security emergencies rely heavily on
succinct and controlled announcements from a singular veri-
fied source However this is an ideal as opposed to the real-
ity (DHS 2014) Communication will often be announced
after the event as official sources may not be available to
comment immediately or provide personal instruction to
individuals Worse the communication itself will stem from
various sources that may worsen the emergency An exam-
ple of multiple sources would be the difference between
formal and informal sources
mdashmdashmdashmdashmdashmdashmdashmdashmdashmdashmdashmdashmdashmdashmdashmdashmdashmdashmdashmdashmdashmdashmdashmdashmdashmdashmdashmdashmdashmdashmdashmdashmdashmdashmdashmdashmdashmdashmdashmdashmdashmdashmdashmdashmdashmdashmdashmdashmdashmdash
INTERNATIONAL JOURNAL OF ENGINEERING RESEARCH AND INNOVATION | V11 N1 SPRINGSUMMER 2019 5
mdashmdashmdashmdashmdashmdashmdashmdashmdashmdashmdashmdashmdashmdashmdashmdashmdashmdashmdashmdashmdashmdashmdashmdashmdashmdashmdashmdashmdashmdashmdashmdashmdashmdashmdashmdashmdashmdashmdashmdashmdashmdashmdashmdashmdashmdashndashmdashmdashmdashmdash
mdashmdashmdashmdashmdashmdashmdashmdashmdashmdashmdashmdashmdashmdashmdashmdashmdashmdashmdashmdashmdashmdashmdashmdashmdashmdashmdashmdashmdashmdashmdashmdashmdashmdashmdashmdashmdashmdashmdashmdashmdashmdashmdashmdashmdashmdashndashmdashmdashmdashmdash
6 INTERNATIONAL JOURNAL OF ENGINEERING RESEARCH AND INNOVATION | V11 N1 SPRINGSUMMER 2019
In a 2014 study of Ladd Pebbles Stadium in Mobile Ala-
bama focusing on stadium design researchers spoke to the
international standard of eight minutes for a stadium evacu-
ation to occur This study focused on the physical limita-
tions associated with evacuations (crowding collisions
social norms etc) However very little attention was paid
to communication factors that could affect timing in an
emergency Instead the study focused on evacuation flow
rate simulation and avoiding and assuming communication
dynamics (Aldana Fox Diehl amp Dimitoglou 2014) How-
ever case studies show how vital communication is to evac-
uation planning At ATampT Stadium staff members are giv-
en a rundown on their tasks of the day and what to expect in
terms of safety at the beginning of each shift These task
sheets include updates and reminders for the event and pro-
vide photos of what the passes and wristbands look like so
there are no copies (ATampT 2018) It also reminds them if
they see something to say something Each staff member is
also expected to get a formal safety briefing from their su-
pervisor prior to doors opening
However arenas are not the only example of a large event
venue University stadiums arenas and event centers are
typically less secure and at higher risk for an emergency
Surveying three universities and their plans offered a more
comprehensive list of evacuation procedures and methods
Additionally these case studies offered the opportunity to
see how they communicated information consistently to
both long-time and first-time visitors Though they also
showed methods related to staffing this was not an im-
portant factor for the current research project Townson
University has a public version of their arenarsquos emergency
response plan and they outline a list of important infor-
mation items for their event staff to know before their event
This list covers familiarizing staff and contractors on emer-
gency procedures fire procedures emergency exit policies
equipment and seating policies and other general rules
The Townson report also covers the procedures during an
emergency As soon as an incident occurs it is noted on the
PA and via a bullhorn in case of a fire alarm or PA equip-
ment failure the TUPD will designate a safe location out-
side management will direct patrons during evacuation and
will use the radio for communication and an operations
commander will be assigned These procedures are based on
the National Incident Management System (NIMS) the
National Response Framework (NRF) and the Incident
Command System (ICS) These provide guidelines for pre-
paredness and compliance Anyone involved in security
management should be fully aware especially when ensur-
ing the safety of over several hundred people (Towson
2018) From these case studies responses require necessary
preparation and practice Based on this information evacua-
tion times should be estimated at approximately 20 minutes
for an average venue with systems in place prior to the
event itself This time includes both the processing and ac-
tual physical evacuation time The communication methods
employed by these venues will be further explored in the
following section
Emergency Communication Methods
In 2008 the Department of Homeland Security designed a
planning guide for emergencies in stadiums The guide has
a section for a notification system during emergencies Dur-
ing emergencies understanding the different reactions that
people can have is important to consider Using the different
possibilities can be helpful in designing an efficient notifi-
cation system The employees also need to be trained on all
aspects of the system to be sure that communication will be
effective Using common language during emergencies al-
lows for everyone to understand The guide also advises
everyone to ensure that they have a plan for displaying in-
formation (screens jumbotrons etc) along with having
employees check areas without any displays (DHS 2008)
Thus communication response methods should relate to
two communication systems visual and audio Sight and
hearing are the primary ways that any person will begin to
understand a message
Stadiums typically have public announcement systems
that will take into consideration both visual and auditory
public announcement systems but do not capitalize on addi-
tional communication systems that may be available to their
audience According to Kenneth Burke the percentage rate
of text messages being opened is 99 Burkersquos article also
states that 95 of text messages are opened within three
minutes and on average they are read in under five seconds
(Bankers 2018) This statistic is particularly useful consid-
ering that many stadiums have fan text messaging that could
evolve into an emergency communication service For ex-
ample Bankers Life Fieldhouse a stadium in Indianapolis
Indiana offers several different fan information services
Among website information is the texting service that is
offered to fans Bankers Life Fieldhouse offers a texting
service that fans can use if they ever encounter anything
suspicious during events The service is anonymous so they
can inform building management without needing to give
any personal information Bankers Life Fieldhouse also
specifies that if the service is misused the number will be
blocked for a full 24 hours (2018)
According to Cutlip and Centerrsquos Effective Public Rela-
tions (2013) there are serval communication methods to
apply to audiences (Broom Sha Seshadrinathan Center amp
Cutlip 2013) Among the various communication models
mdashmdashmdashmdashmdashmdashmdashmdashmdashmdashmdashmdashmdashmdashmdashmdashmdashmdashmdashmdashmdashmdashmdashmdashmdashmdashmdashmdashmdashmdashmdashmdashmdashmdashmdashmdashmdashmdashmdashmdashmdashmdashmdashmdashmdashmdashndashmdashmdashmdashmdash
and relevant to communications in emergency management
the mass communication model is the most effective The
mass communications model has six elements 1) the send-
er 2) the message 3) the medium or channel 4) the receiv-
ers 5) relationship contexts and 6) the social environment
Therefore the sender is the source of the impact and can
influence how it is received (Broom et al 2013) Conse-
quently credibility intensifies information and could impact
how effective a message is A message is information that is
sent or given to someone
Furthermore from Cutlip and Center messages are cate-
gorized into ldquotext verbal multimedia print etcrdquo (Broom et
al 2013) Assumption suggests that emergency manage-
ment messages have to be clear and concise However in-
terpretation occurs when communicating with the masses
and must be considered as a potential obstacle when crafting
a message (Broom et al 2013) The medium or channel that
a message uses has equal importance to the message From
a 1971 body language study face-to-face communication
delivers effective communication information yet 70-90
of communication is through nonverbal cues like gestures
and facial expressions (Mehrabian 1971) Such direct com-
munication is valuable but using technology as a medium
for communication such as social media has resulted in
creating more ways to communicate during emergencies
(Broom et al 2013) These options should be explored
more fully in terms of emergency communications
Alertus Technologies is a unified mass notification com-
munication system Alertus is often used for large events
and companies for emergency situations Alertus utilizes a
combination of communication methods to maximize the
possibility of reaching all parties The different methods
include text messaging email public announcement sys-
tems digital signage and desktop computers A few compa-
nies that utilize Alertus Technologies include Disney
ESPN and Toronto Pan AM Sports Centre (Alertus Tech-
nologies 2018) This technology system appears to encom-
pass all communication systems However the full system
relies on the combination of systems Whether this combi-
nation is effective or not depends on how accurate or effec-
tive the communication is Alertus does what many arenas
are capable of but in a way that puts the control in a uni-
fied separate entity
Methodology
In developing a way to model response communication
the authors determined that a system dynamics model would
provide a new look at response communication Response
communication requires speed time and people Balancing
these three variables is essential to effective communica-
tion Some constants such as communication and evacua-
tion rate can be influenced by these variables Thus com-
munication is a system that can be made more effective and
accurate through modeling The systems dynamics model
being used was based on a Bass diffusion model Developed
in 1969 by Frank M Bass and John A Norton a Bass diffu-
sion model represents how a potential market is affected by
advertisers and word of mouth (1987) Advertising has the
potential to spread a concise clear and strong message with
little to no resources Thus this model is a great reference
for emergency communication
Regarding this specific project the Bass Diffusion model
was changed to reflect emergency communication This
method was chosen based on how well advertisement mir-
rors communication It necessitates and requires effective
understanding but also showcases errors that are corrected
based on an alternate system Bass diffusion takes commu-
nication by word of mouth into consideration and is a large
part of emergency communication If all emergency com-
munication systems were to fail word of mouth would still
be prevalent Thus word of mouth acts as a constant in this
current model of emergency response communication
However it has an obvious error rate regarding miscommu-
nication and timely understanding
Bass Diffusion Model
Figure 1 shows how initial method research was conduct-
ed in order to see how well a Bass Diffusion model could
adapt to emergency communication By replacing the popu-
lation to reflect the emergency at hand the communication
rate was no longer influenced by advertisement but by an
auditory public announcement (PA) system As mentioned
earlier word-of-mouth communication is still reflected and
influenced by contact rate and the evacuation message rate
(Norton amp Bass 1987) The model appeared to accurately
reflect evacuation message procedures including a delay
that reflects understanding or processing time
Regarding this study the error lies in uniformity of mes-
sage Different communication systems have different chal-
lenges The message to evacuate goes through several dif-
ferent paths thus some of the messages are delayed wheth-
er through human or technologically dictated circumstances
Developing a flowchart allowed the authors to show the
specific challenges associated with each system and how
they could apply to the model Figure 2 shows how the steps
associated with each system should result in understanding
This is where the Bass Diffusion model ends as understand-
ing implies that they have fully received the evacuation
message This does not account for the actual time that it
would take for a person to evacuate (a lengthier process)
mdashmdashmdashmdashmdashmdashmdashmdashmdashmdashmdashmdashmdashmdashmdashmdashmdashmdashmdashmdashmdashmdashmdashmdashmdashmdashmdashmdashmdashmdashmdashmdashmdashmdashmdashmdashmdashmdashmdashmdashmdashmdashmdashmdashmdashmdashndashmdashmdashmdashmdash
ANALYZING RESPONSE COMMUNICATION MITIGATION METHODS THROUGH SIMULATION MODELING 7
mdashmdashmdashmdashmdashmdashmdashmdashmdashmdashmdashmdashmdashmdashmdashmdashmdashmdashmdashmdashmdashmdashmdashmdashmdashmdashmdashmdashmdashmdashmdashmdashmdashmdashmdashmdashmdashmdashmdashmdashmdashmdashmdashmdashmdashmdashndashmdashmdashmdashmdash
mdashmdashmdashmdashmdashmdashmdashmdashmdashmdashmdashmdashmdashmdashmdashmdashmdashmdashmdashmdashmdashmdashmdashmdashmdashmdashmdashmdashmdashmdashmdashmdashmdashmdashmdashmdashmdashmdashmdashmdashmdashmdashmdashmdashmdashmdashndashmdashmdashmdashmdash
8 INTERNATIONAL JOURNAL OF ENGINEERING RESEARCH AND INNOVATION | V11 N1 SPRINGSUMMER 2019
an auditory PA system visual PA system texting notifica-
tion system and word of mouth Figure 3 shows these sys-
tems
Figure 3 Final bass diffusion model
For example limited research suggests that public an-
nouncement systems are 60 effective at distributing a
message (Alertus Technologies 2018) This comes from
public relations data as opposed to testing of several emer-
gency public announcement systems However this as-
sumes that the system is in perfect working order without
any limitations (noise miscommunication etc) Because
the model is highly flexible these circumstances can be
reflected by inputting different numbers into the effective-
ness variables Using averages obtained from studies of
similar systems effectiveness was a variable inputted at
different levels depending on which system was in use
Thus effectiveness for both public announcement systems
(auditory and visual) used the same initial effectiveness
rating of 60 while the texting system was given a 50
effectiveness rating but with a message rate of approximate-
ly 5 considering how often people would check their
phones in each emergency The five-second delay was im-
plemented in the program as well Text message systems
align closely with word of mouth as they are a technologi-
cal reflection of the same process but with higher numbers
Finally word-of-mouth communication had a contact rate
of approximately 11 as shown in prior Bass Diffusion
models Word of mouth is a communication system that
exists at all times visual and audible systems only boost this
system but it does require proximity in order to work In
this specific scenario people were in each proximity to the
event and the message However word of mouth will act as
a constant in this evacuation scenario The effectiveness
dictated by evacuation message rate was set to 50
Figure 1 Original bass diffusion model
Figure 2 Communication flowchart
The flowchart shows the four systems that could be mod-
eled in an evacuation communication scenario This is
meant to come from the viewpoint of evacuees not the first
responders that would arrive Therefore the communication
systems are all processes that the average person would
have available The four communication methods used were
mdashmdashmdashmdashmdashmdashmdashmdashmdashmdashmdashmdashmdashmdashmdashmdashmdashmdashmdashmdashmdashmdashmdashmdashmdashmdashmdashmdashmdashmdashmdashmdashmdashmdashmdashmdashmdashmdashmdashmdashmdashmdashmdashmdashmdashmdashndashmdashmdashmdashmdash
Pedestrian Traffic Model
Using an agent was necessary to show the second part of
the flowchart in which the message is spread through behav-
ior People are the distributors of messages and their behav-
ior should be considered Stadium evacuation simulation
has been used previously to measure crowd dynamics In
the aforementioned 2014 study of Ladd Pebbles Stadium
the researchers compared crowd simulation models The
chosen model was behavioral using agent-based modeling
as a means of crowd simulation This allows for a more ful-
ly formed approach to stadium emergency evacuation and
verifies that simulation can be used as a valid approach to
evacuation research (Aldana et al 2014)
Through AnyLogic 8rsquos pedestrian traffic library the mes-
sage spread can be shown in real time Figure 4 shows how
the message can be spread based on word-of-mouth data
Using a statechart one can base the message on a specific
variable as opposed to a parameter Therefore a statechart
was created to manipulate the message variable as opposed
to manipulating the parameters to reflect a variable The
statechart uses the same understanding and contact rate as
word-of-mouth communication This validates the Bass
Diffusion Model By using actual agents the modeling is
more successful than the systems dynamics model at dis-
playing contact information Additionally pedestrian mod-
eling will eventually show the full extent of evacuation as a
result of the communication systems not just the system
itself
Figure 4 Pedestrian model statechart
The physical structure of the pedestrian model is meant to
reflect stadium seating so that communication rate is as
close to realistic as possible Figure 5 shows that the model
uses two waiting areas with separate agents The agents all
begin as blue until the evacuation order is released Then
the message is sent Once one person has the message they
will turn red depending on contact and proximity Error is
included to account for misunderstanding due to chaos and
human error
Figure 5 Final pedestrian model
Ultimately the final pedestrian model simulates one nec-
essary communication method Additional methods will
require further modelling to validate and continue testing
This is something the researchers hope to pursue in the fu-
ture especially as new communication methods become
popular
Results
Using the results from the systems dynamics model the
researchers modeled the effectiveness of different commu-
nication systems Using word of mouth as a constant three
communication methods were compared against those ini-
tial values In the following charts (Figures 6-10) two lines
are shown The darker line is the level of potential evacuees
(the initial population) and the level of evacuees (the
amount of people that successfully received the message)
Acting as constant word of mouth effectively distributed
information in approximately 22 minutes As a reminder
this is not an evacuation time but the communication mes-
sage time As seen in Figure 6 the halfway point for the
communication rate is much further than any other system
mdashmdashmdashmdashmdashmdashmdashmdashmdashmdashmdashmdashmdashmdashmdashmdashmdashmdashmdashmdashmdashmdashmdashmdashmdashmdashmdashmdashmdashmdashmdashmdashmdashmdashmdashmdashmdashmdashmdashmdashmdashmdashmdashmdashmdashmdashndashmdashmdashmdashmdash
ANALYZING RESPONSE COMMUNICATION MITIGATION METHODS THROUGH SIMULATION MODELING 9
mdashmdashmdashmdashmdashmdashmdashmdashmdashmdashmdashmdashmdashmdashmdashmdashmdashmdashmdashmdashmdashmdashmdashmdashmdashmdashmdashmdashmdashmdashmdashmdashmdashmdashmdashmdashmdashmdashmdashmdashmdashmdashmdashmdashmdashmdashndashmdashmdashmdashmdash
mdashmdashmdashmdashmdashmdashmdashmdashmdashmdashmdashmdashmdashmdashmdashmdashmdashmdashmdashmdashmdashmdashmdashmdashmdashmdashmdashmdashmdashmdashmdashmdashmdashmdashmdashmdashmdashmdashmdashmdashmdashmdashmdashmdashmdashmdashndashmdashmdashmdashmdash
10 INTERNATIONAL JOURNAL OF ENGINEERING RESEARCH AND INNOVATION | V11 N1 SPRINGSUMMER 2019
Figure 6 Word-of-mouth communication only
Comparatively in Figure 7 a text system in combination
with word-of-mouth communication is only slightly better
taking approximately 20 minutes to spread an evacuation
message The system in question acted similarly if a single
message was sent and spread amongst a stadiumrsquos fan ser-
vice list This would give a large event area the greatest
chance at reaching patrons without using social media It
should be noted that this parameter will need to be studied
further to establish proper manipulation and realistic bound-
aries
Figure 7 Text system only
However the systems that were more successful at issu-
ing the message were the public announcement systems In
Figure 8 the audible public announcement system took ap-
proximately 10 minutes to communicate an evacuation mes-
sage As previously noted these conditions were almost
ideal for the public announcement system but also assumed
consistent communication being relayed at reasonable inter-
vals This system is necessary but also ignores some special
populations In Figure 9 the visual system was overwhelm-
ingly the best at successfully displaying an evacuation mes-
sage The system took approximately eight minutes to effec-
tively communicate an evacuation message This includes
the timing and understanding delay incorporated into the
data Additionally the authors included an example of all of
the combined communication methods in Figure 10 This
model took approximately nine minutes to complete show-
ing how multiple communication methods may negatively
affect a message spread when factoring in additional error
rates The all-methods communication scenario also reflects
an inundated communication system in which a consistent
error message breeds inaccuracies and response times
Figure 8 PA system only
Figure 9 VisPA system only
Figure 10 All communication methods
Ultimately the knowledge obtained from the resulting
information will help improve and test emergency commu-
nication methods This can be seen in the pedestrian model
in Figure 11 The pedestrian traffic model shows that con-
tact with the message was more realistic than a systems
model The model shows that contact rate does influence
how quickly a message spreads and how word of mouth is
the greatest influencer for that message In this project
word-of-mouth communication was shown to improve com-
munications and introduce error into any communication
mdashmdashmdashmdashmdashmdashmdashmdashmdashmdashmdashmdashmdashmdashmdashmdashmdashmdashmdashmdashmdashmdashmdashmdashmdashmdashmdashmdashmdashmdashmdashmdashmdashmdashmdashmdashmdashmdashmdashmdashmdashmdashmdashmdashmdashmdashndashmdashmdashmdashmdash
system Therefore it is possibly the greatest asset or hin-
drance to response communication The pedestrian model
helps validate that theory while also allowing further test-
ing to occur Though not yet in use this pedestrian traffic
model has applicability to other communication methods
and provides a more realistic understanding of how commu-
nication would occur in an actual emergency as opposed to
a hypothetical one The model above shows how contact
rate affects method spread as the blue dots change to red
when the message is effectively spread
Figure 11 Pedestrian traffic model
Discussion
Though all the communication systems are shown differ-
ently exploring communication contact rate as a key to ef-
fectiveness will need to be considered in subsequent trials
For example text messaging systems have the potential to
be the most effective evacuation communication method as
it can reach most people and is still accessible to those with
disabilities and those not in the main area of the stadium
where the visual and audible public announcement systems
are used However there is a possible issue in that the num-
ber of patrons on their phones could overload the cellular
signal and the text message does not go through undoing all
of the benefits Additionally audible public announcements
are the next most effective evacuation communication meth-
od This method is also capable of reaching all patrons not
only those in the main areas However the consideration of
those with special needs should occur as this method does
hinder the deaf or hard of hearing Also audible public an-
nouncements need to be used cautiously as aggressively
loud and commanding announcements could increase panic
and induce anxiety Testing will follow to see how valid this
system is to an actual evacuation Finally visual public an-
nouncement systems are the least effective of all three meth-
ods but the best in terms of understanding This method can
only reach patrons in the main areas and those who can
read observe and understand what is announced It does
not take blind patrons into consideration However if the
visual public announcement is flashed on and off it could
draw more attention to the message Additionally more
information could be given via visual public announcement
systems information which could be more easily updated
Conclusions
Though examining the results appears to suggest that the
visual public announcement system was the most effective
model this was only in regards to one factor It only reaches
a certain number of patrons at one time Therefore all meth-
ods of communication should use three reliable systems to
issue an evacuation message However the message would
need to be uniform and accurate for this model to work
While it is not feasible for all three methods to be consist-
ently running at the same time each situation would require
a specific combination of the three This question will re-
quire more consistent testing to deduce the correct order and
should be used in combination with the pedestrian model to
achieve the most realistic results As testing continues this
same question will apply to the pedestrian model and con-
tact rate Additionally incorporating social media as a com-
munication method will be considered moving forward
However this method has more complex intricacies with
obsolescence of equipment being a distinct possibility
Notably many of these systems can be altered to ensure
that they perform more effectively than their standards
These differences may mean that one system is more effec-
tive than another at a certain venue event or scenario
These alterations continue to affect word-of-mouth commu-
nication thus all three methods should be considered in
addition to this method Word-of-mouth communication
continues to be the communication at the base of each meth-
od deciding effectiveness and understanding of evacuation
The faster a message is understood the better the outcome
of an evacuation By assisting individual security the venue
is better prepared for an emergency The faster they re-
spond the more lives saved Therefore communicating
proper responses to patrons is the difference between life
and death
mdashmdashmdashmdashmdashmdashmdashmdashmdashmdashmdashmdashmdashmdashmdashmdashmdashmdashmdashmdashmdashmdashmdashmdashmdashmdashmdashmdashmdashmdashmdashmdashmdashmdashmdashmdashmdashmdashmdashmdashmdashmdashmdashmdashmdashmdashndashmdashmdashmdashmdash
ANALYZING RESPONSE COMMUNICATION MITIGATION METHODS THROUGH SIMULATION MODELING 11
mdashmdashmdashmdashmdashmdashmdashmdashmdashmdashmdashmdashmdashmdashmdashmdashmdashmdashmdashmdashmdashmdashmdashmdashmdashmdashmdashmdashmdashmdashmdashmdashmdashmdashmdashmdashmdashmdashmdashmdashmdashmdashmdashmdashmdashmdashndashmdashmdashmdashmdash
mdashmdashmdashmdashmdashmdashmdashmdashmdashmdashmdashmdashmdashmdashmdashmdashmdashmdashmdashmdashmdashmdashmdashmdashmdashmdashmdashmdashmdashmdashmdashmdashmdashmdashmdashmdashmdashmdashmdashmdashmdashmdashmdashmdashmdashmdashndashmdashmdashmdashmdash
12 INTERNATIONAL JOURNAL OF ENGINEERING RESEARCH AND INNOVATION | V11 N1 SPRINGSUMMER 2019
References
Aldana N Fox C Diehl E amp Dimitoglou G (2014) A
study of stadium exit design on evacuation perfor-
mance Proceedings of the 27th International Confer-
ence on Computer Applications in Industry and Engi-
neering Cary NC International Society for Computers
and Their Applications
Alertus Technologies (2018) Mobile notification Re-
trieved from httpswwwalertuscompersonal
ATampT Stadium operations manual (2018) Retrieved from
httpsattstadiumcomsitesdefaultfilesdc-content-
filesCity20of20Arlington20Policiespdf
Bankers Life Fieldhouse (2018) Fan guide Retrieved from
httpwwwbankerslifefieldhousecomarena-
informationfan-guide
Broom G M Sha B L Seshadrinathan S Center A H
amp Cutlip S M (2013) Cutlip and Centerrsquos effective
public relations (11th ed) Upper Saddle River NJ
Pearson
Burke K (2016) 73 texting statistics that answer all your
questions Retrieved from httpswwwtextrequestcom
blogtexting-statistics-answer-questions
Centers for Disease Control and Prevention [CDC] (2018)
Emergency preparedness and response Social media
Retrieved from httpsemergencycdcgovsocialmedia
indexasp
Department of Homeland Security [DHS] (2008) Evacua-
tion planning guide for stadiums Retrieved from
httpswwwdhsgovsitesdefaultfilespublications
evacuation-planning-guide-stadiums-508pdf
Department of Homeland Security [DHS] (2014) Com-
municating in an emergency Federal Emergency Man-
agement Agency Retrieved from https
trainingfemagovemiwebisis242bstudent
20manualsm_03pdf
Ellis R Fantz A Karimi F amp McLoughlin E C
(2016) Orlando shooting 49 killed shooter pledged
ISIS allegiance CNN Retrieved from https
wwwcnncom20160612usorlando-nightclub-
shootingindexhtml
Mehrabian A (1971) Silent messages Belmont CA
Wadsworth
Mileti D S amp Sorensen J H (1990) Communication of
emergency public warnings A social science perspec-
tive and state-of-the-art assessment Washington DC
FEMA Retrieved from httpsdoi1021726137387
Norton J A amp Bass F M (1987) A diffusion theory
model of adoption and substitution for successive gen-
erations of high-technology products Management
Science 33(9) 1-19
Proulx G (1995) Evacuation time and movement in apart-
ment buildings Fire Safety Journal 24(3) 229-246
Retrieved from httpsdoiorg1010160379-7112(95)
00023-M
Towson University (2018) Emergencies Retrieved from
httpswwwtowsonedupublicsafetyemergencies
Biographies
KATHERINE REICHART is a graduate student in
Homeland Security in the Computer Information Technolo-
gy program at Purdue University Her previous degree is in
professional writing also from Purdue University Addi-
tionally she is a member of the Purdue Homeland Security
Institute She has been involved in several research projects
in the institute Additionally she is an assistant editor on
several books in progress concerning those research topics
Her research will continue to focus on communication and
reporting methods of large event security Katherine
Reichart may be reached at kreicharpurdueedu
ANNA LARSON works for General Electr ic in De-
troit MI She earned her BS in Computer Information Tech-
nology from Purdue University and MS in Computer and
Information Technology 2018 from her alma mater Her
interests include disaster network communication and
cyberforensics Anna Larson may be reached at lar-
sonapurdueedu
KRISTAL SMITH works for Blue Horseshoe in Boul-
der CO She recently graduated from Purdue University
with her BS in Computer and Information Technology
While there she researched and participated in projects re-
garding emergency preparedness Kristal Smith may be
reached at smit2265purdueedu
J ERIC DIETZ PE graduated in 1984 with a BS and
again in 1986 with an MS in chemical engineering both
from the Rose-Hulman Institute of Technology He earned
his PhD in chemical engineering in 1994 from Purdue Uni-
versity where he is now a professor In 2004 he retired as a
Lieutenant Colonel from the US Army Thus his research
interests include optimization of emergency response
homeland security and defense energy security and engag-
ing veterans in higher education Dr Dietz may be reached
at jedietzpurdueedu
Abstract
Various 3D printer configurations such as Cartesian
printers operate similarly to a CNC machining center and
Delta printers that have a stationary build platform with the
use of three motors located on pillars controlling the end
effector location A less popular configuration is a Polar
system which utilizes a rotating table a Z translation con-
trolled by a linear actuator located beyond the edge of the
rotating table and a horizontal arm connected to the Z-axis
that translates the end effector along the center axis The
Polar 3D printer configuration being the simplest was cho-
sen in order to scale up to build and test a low-cost large-
scale 3D printer with a build envelope of 183m x 183m x
153m (6ft x 6ft x 5ft)
This open source hardware 3D printer (OSALS-Polar) can
be produced for approximately $5000 for materials assum-
ing that labor is provided by the user To 3D print a part
any CAD software is used to output a stereo lithography
(stl) file open source slicing software (Cura) to generate
the G-code file and open source software (Franklin) to op-
erate the 3D printer Testing the 3D printer requires calibra-
tion of the three axes to produce the desired positioning of
the Theta-axis rotation R-axis horizontal arm translation
and Z-axis vertical translation with the inputs into the
Franklin software Also the system is set to start at a zero
location according to distances set from the end-stop limit
switches The final testing of the OSALS-Polar produced
small extruded parts although the accuracy and scaling up
to larger parts not accomplished during this study Future
testing may encounter limitations in the size of prints due to
material cooling at various rates causing warpage Introduc-
tion
3D printing technology has become quite common and
increasingly applications for direct digital manufacturing
are being implemented RepRap (self-replicating machines)
3D printers (Sells Bailard Smith Bowyer amp Olliver 2010
Gibb 2014) are open source 3D printer designs available
for anyone to build According to Wittbrodt et al (2013)
the cost of an open source 3D printer used for printing
household components such as a pierogi mold or paper
towel holder can be recuperated within a year or two if a
reasonably fair number of household items are printed using
the 3D printer (Wittbrodt et al 2013 Wittbrodt 2014) The
3D printer build envelope (printer platform times the print-
ing height capability) can be a limitation of direct digital
manufacturing if the part exceeds this build envelope
Common desktop 3D printers have a build envelope of
203 mm (8 in) length x 203 mm (8 in) and width x 153
mm (6 in) height Larger-scale 3D printers ranging from
5 to 10 times the size of the common desktop 3D printers
are typically very expensive to produce
Methods of joining 3D-printed parts via acetone have
been successful in producing parts such as wind turbine
blades (Deshpande Rao Pradhan amp Irwin 2016) although
this method requires several manufacturing steps and can
decrease overall part accuracy The goal of the OSALS-
Polar is to manufacture larger 3D-printed parts (such as
wind turbine blades or propeller blades) that can be printed
in a single setup without needing to be joined together
Wind turbine blades can operate at potentially high RPMs
and any structural concerns lead directly to safety concerns
making it advantageous to 3D print as one continuous part
To overcome size restrictions of desktop 3D printers the
OSALS-Polar can cost under $5000 for materials assuming
the user provides the labor In this paper the authors de-
scribe the assembly and testing of the OSALS-Polar with a
build envelope of 183m x 183m x 153m (6ft x 6ft x 5ft)
The build instructions for this system are also described
here The open source software used to create the slice file
was Cura to operate OSALS-Polar the open source soft-
ware Franklin was used
Introduction
Currently there are many different 3D printer configura-
tions such as the X Y Z Cartesian coordinate 3D printers
that operate similar to a CNC machining center or the Del-
ta which has a stationary build platform with the extruder
operated by three vertical axis translations located on a tri-
angular base A less popular method for controlling the
movement of the axes is a Polar system Figure 1 shows a
benchmark 3D printer produced by Polar3D and its main
components This particular 3D printer has a build envelope
of 203m m (8 in) diameter x 153 mm (6 in) height The
Polar 3D system was used as a datum design to develop the
initial 91 OSALS-Polar CAD design and a set of manufac-
turing drawings The Polar 3D system utilizes a rotating
table (Theta-axis) with a horizontal arm (R-axis) that trans-
mdashmdashmdashmdashmdashmdashmdashmdashmdashmdashmdashmdashmdashmdashmdashmdashmdashmdashmdashmdashmdashmdashmdashmdashmdashmdashmdashmdashmdashmdashmdashmdashmdashmdashmdashmdashmdashmdashmdashmdashmdashmdashmdashmdashmdashmdashndashmdashmdashmdashmdash
Sourabh Prashant Deshpande University of Cincinnati Shrinivas Kulkarni Michigan Technological University
Sid Shah Michigan Technological University John Irwin Michigan Technological University
DEVELOPING AN OPEN SOURCE INEXPENSIVE
LARGE-SCALE POLAR CONFIGURATION 3D PRINTER
mdashmdashmdashmdashmdashmdashmdashmdashmdashmdashmdashmdashmdashmdashmdashmdashmdashmdashmdashmdashmdashmdashmdashmdashmdashmdashmdashmdashmdashmdashmdashmdashmdashmdashmdashmdashmdashmdashmdashmdashmdashmdashmdashmdashmdashmdashmdashmdashmdashmdash
INTERNATIONAL JOURNAL OF ENGINEERING RESEARCH AND INNOVATION | V11 N1 SPRINGSUMMER 2019 13
mdashmdashmdashmdashmdashmdashmdashmdashmdashmdashmdashmdashmdashmdashmdashmdashmdashmdashmdashmdashmdashmdashmdashmdashmdashmdashmdashmdashmdashmdashmdashmdashmdashmdashmdashmdashmdashmdashmdashmdashmdashmdashmdashmdashmdashmdashndashmdashmdashmdashmdash
mdashmdashmdashmdashmdashmdashmdashmdashmdashmdashmdashmdashmdashmdashmdashmdashmdashmdashmdashmdashmdashmdashmdashmdashmdashmdashmdashmdashmdashmdashmdashmdashmdashmdashmdashmdashmdashmdashmdashmdashmdashmdashmdashmdashmdashmdashndashmdashmdashmdashmdash
14 INTERNATIONAL JOURNAL OF ENGINEERING RESEARCH AND INNOVATION | V11 N1 SPRINGSUMMER 2019
lates the extruder along a single axis to and from the center
of the printing surface The vertical (Z-axis) translation in
this system is controlled by a linear power screw and guides
located beyond the edge of the rotating surface This Polar
style 3D printer was determined to be the simplest design
when compared to the Cartesian and Delta styles to up-
scale
Figure 1 Polar3D printer (About 2014) Reprinted with
permission
Review of Related 3D Printing Systems
Rapid developments in the field of 3D printing technolo-
gy have ranged in applications from prototyping to direct
digital manufacturing Berman (2012) compares the revolu-
tion of 3D printing technology with the digital books revo-
lution and foresees its use in several promising applications
such as medicine and construction Gebler Uiterkamp amp
Visser (2014) discussed 3D printing technology in terms of
sustainability and asserted that this technology will lower
resource demands energy use and carbon dioxide emis-
sions over the entire lifecycle According to Wohlers
(2013) use of additive manufacturing technology for direct
part production has increased by more than 25 in the last
few years
Significant efforts are underway to build a large-scale 3D
printing system to manufacture large-scale industrial com-
ponents Barnett and Gosselin (2013) designed a novel large
-scale 3D printer with a cable-suspended mechanism and a
full scaffolding solution However most of the research on
large-scale 3D printers is based on Cartesian and Delta sys-
tem configurations A typical Polar 3D printing system has
a higher build volume with fewer components when com-
pared with other types (Yusuf 2015) A true Polar 3D print-
er has a rotating build plate (Theta-axis) with the vertical
arm (Z-axis) and the extruder placed on the horizontal arm
(R-axis) Any point on a flat plane can be defined by know-
ing its angle theta pole vertical location and a measure of
radius from an axis through the given pole (Horn amp Haus-
man 2017)
A Cincinnati-based Polar 3D technology company uses
fused-filament fabrication technology for a Polar 3D printer
having 2032 mm (8 in) diameter 15875 mm (625 in)
height with connectivity features such as Wi-Fi Ethernet
and USB (About 2014) R-360 is an open source Polar 3D
printer with 210 mm (826 in) disc x 200 mm (787 in)
with a total printing volume of 6927000 mm3 (42271 in3)
It uses PLA or ABS as the printing material and has a maxi-
mum printing speed of 150 mms along with features such
as cloud slicing (Replicator 2013 Farcas 2016) Another
Polar 3D printer with 3048 mm (12 in) diameter and
150 mm (59 in) height has some major features which
include the use of four extruders and Decapede electronics
for driving 10 stepper motors (Anderson 2014) The
PiMaker 3D printer also uses the Polar system with
2794 mm (11 in) diameter and 2032 mm (8 in) height
with an overall volume of over 10650000 mm3 (650 in3)
(Steele 2016) 3D printers have also been made on modest
budgets such as a senior project by Hoy (2016) who devel-
oped a Polar 3D printer having 1778 mm (7 in) diameter
that uses PLA filament
Polar 3D Printer Design
The OSALS-Polar is designed manufactured and assem-
bled by configuring the Theta-axis Z-axis and R-axis re-
spectively Engineering requirements are mapped using
QFD methodology The material for the table surface verti-
cal and horizontal supports and the rotation drive system
are selected using the decision matrix method Accordingly
the major items selected are a tubular steel structure circu-
lar glass printing plate circular steel plate table extruded
aluminum horizontal arm and stepper motors for axis mo-
tion PFMEA is carried out to identify and reduce the poten-
tial failures in the system The circular glass printing plate
has the highest RPN value for which the use of glass edge
guards is recommended to avoid breakage andor injury
The main frame is made up of steel I-beams and steel
tubular sections welded together to manufacture the table
frame Then pivot tabs welded to both the bottom frame
and table frame provide assembly alignment and leveling
capabilities The steel table has a center shaft that is placed
in the table frame center bearing after proper lubrication of
all the parts Figure 2 shows the assembly after fixing the
table roller bearings center bearing and the casters to the
frame
Vertical Z-axis
Horizontal R-axis
Table Theta-axis
mdashmdashmdashmdashmdashmdashmdashmdashmdashmdashmdashmdashmdashmdashmdashmdashmdashmdashmdashmdashmdashmdashmdashmdashmdashmdashmdashmdashmdashmdashmdashmdashmdashmdashmdashmdashmdashmdashmdashmdashmdashmdashmdashmdashmdashmdashndashmdashmdashmdashmdash
Figure 2 Frame assembly
The main power transmission component for the Theta-
axis rotating table is a stepper motor turning a spur gear
driving an internal ring gear The internal ring gear is manu-
factured by machining 10 segments that together form the
15875 mm (625 in) pitch diameter internal ring gear The
pinion gear is mounted to a NEMA 34-stepper motor that
drives the ring gear Despite several challenges introduced
in the system such as improper mating of the ring gear sec-
tions providing larger clearance holes on the ring gear seg-
ment enabled smoother motion The use of flexible pads in
stepper motor mounting also helped to minimize the inaccu-
racies in the gear alignment (Pradhan Irwin Siddegowda
amp Harsha 2016) The internal gear drive mechanism shown
in Figure 3 facilitates improved rotary motion of the table
over the originally designed center worm-gear configuration
that had many backlash issues
Figure 3 Theta-axis drive mechanism
Figure 4 shows how the vertical Z-axis beam is bolted
securely to the main frame which supports the horizontal
arm R-axis and the extruder The Z-axis mounting bracket is
used to attach the R-axis motor accommodate the acme nut
and also fix the R-axis horizontal arm in place The acme
rod is coupled to the Z-axis motor shaft with a straight cou-
pling with no gearing or reduction Two guide rails are de-
signed for the travel of the Z-axis FEA was carried out on
the system after which support brackets were added from
the guide rails to the vertical Z-axis beam accordingly in
order to avoid the deflection of the extruder through its trav-
el
Figure 4 Vertical Z-axis
The R-axis carriage wheels are locked into grooves on the
R-axis horizontal arm while a timing belt drive system
shown in Figure 5 controls the translating motion Figure 6
shows how the extruder extruder motor and hot end are
integrated into the carriage assembly The extruder hot end
bracket and spool holder were manufactured using 3D
printing
Figure 5 Drive system R-axis
Polar 3D Printer Controls
An electrical box houses the circuitry and auxiliary elec-
tronic components Figure 7 shows how the unit is fixed to
the back side of the vertical arm of the OSALS-Polar
Main Frame
Table Frame
Ring Gear Segment
Motor and Pinion Gear
Z-axis Mounting Bracket
R-axis
Guide Rails
Z-axis Vertical Beam
Timing Belt Drive System
mdashmdashmdashmdashmdashmdashmdashmdashmdashmdashmdashmdashmdashmdashmdashmdashmdashmdashmdashmdashmdashmdashmdashmdashmdashmdashmdashmdashmdashmdashmdashmdashmdashmdashmdashmdashmdashmdashmdashmdashmdashmdashmdashmdashmdashmdashndashmdashmdashmdashmdash
DEVELOPING AN OPEN SOURCE INEXPENSIVE LARGE-SCALE POLAR CONFIGURATION 3D PRINTER 15
mdashmdashmdashmdashmdashmdashmdashmdashmdashmdashmdashmdashmdashmdashmdashmdashmdashmdashmdashmdashmdashmdashmdashmdashmdashmdashmdashmdashmdashmdashmdashmdashmdashmdashmdashmdashmdashmdashmdashmdashmdashmdashmdashmdashmdashmdashndashmdashmdashmdashmdash
mdashmdashmdashmdashmdashmdashmdashmdashmdashmdashmdashmdashmdashmdashmdashmdashmdashmdashmdashmdashmdashmdashmdashmdashmdashmdashmdashmdashmdashmdashmdashmdashmdashmdashmdashmdashmdashmdashmdashmdashmdashmdashmdashmdashmdashmdashndashmdashmdashmdashmdash
16 INTERNATIONAL JOURNAL OF ENGINEERING RESEARCH AND INNOVATION | V11 N1 SPRINGSUMMER 2019
Figure 6 Carriage assembly R-axis
Figure 7 Electrical box layout
The circuitry includes RAMPS 14 controller and a Bea-
glebone connected with a bridge board All of the electrical
components were integrated into the RAMPS 14 controller
Figure 8 shows the wiring diagram for the RAMPS 14 To
adhere to the ldquoaffordablerdquo goal of the OSALS-Polar stepper
motors were used rather than servo motors to facilitate the
movement of the three axes The motion of the axes is ena-
bled by three DQ542MA micro-step drivers Each stepper
driver is controlled by Franklin firmware through a Pololu
A4988 stepper driver carrier mounted on the RAMPS 14
board The steps per revolution and the input current for
each axis motor were set using the DIP switches on the mi-
cro-step drivers The DIP switches were set with 1 3 6 and
8 in the ldquoonrdquo position and 2 4 5 and 7 in the ldquooffrdquo posi-
tion Switches 1 2 and 3 were set to the on off and on
positions respectively to match the motor current
(amperes) of 191 at peak and 136 RMS Switch 4 was set
to the off position so that standstill current would be half of
the selected dynamic current The Micro step resolution was
set to 6400 by setting switches 5 6 7 and 8 to the off on
off and on positions respectively
The RAMPS 14 also controls the extruder assembly
which consists of an extruder motor a hot end to melt the
filament a cooling fan to control the outer temperature of
the hot end and a thermistor to indicate the hot end temper-
ature Figure 8 shows the wiring diagram for RAMPS 14 A
Pololu A4988 stepper driver carrier was also used to control
the extruder motor however for this motor no micro-step
driver was needed The stepper drivers get power from a
36V power supply Power for the extruder motor fan and
the hot end are provided through the RAMPS 14 Since no
heated bed is used in this printer a 12V power supply is
connected to the heated bed port to externally power the
RAMPS 14 and direct that power to the extruder motor hot
end and fan
Figure 8 Ramps 14 wiring diagram
Figure 9 shows how mechanical end stops on each axis
allow the printer to start from a reference point End stops
can be mounted on the maximum or minimum position of
an axis Since the zero for this printer is set at the center of
the rotating table the end stops are located at the maximum
position for the R-axis and Z-axis Thus the end stops are
connected to the pins corresponding to the maximum posi-
tion on the RAMPS 14 board
Carriage Assembly
Circuitry
Stepper Drivers
Power Supply
mdashmdashmdashmdashmdashmdashmdashmdashmdashmdashmdashmdashmdashmdashmdashmdashmdashmdashmdashmdashmdashmdashmdashmdashmdashmdashmdashmdashmdashmdashmdashmdashmdashmdashmdashmdashmdashmdashmdashmdashmdashmdashmdashmdashmdashmdashndashmdashmdashmdashmdash
Figure 9 End stop mounting
The RAMPS 14 circuit board is connected to a Beagle-
bone loaded with the Franklin firmware The OSALS-Polar
can be operated by connecting to the Beaglebone using an
Ethernet cable from any host computer Figure 10 shows
how the Franklin software is accessed through a Web ad-
dress in order to pull up a user interface The printer config-
uration setup is completed on this user interface The vari-
ous attributes of the Franklin firmware are then mapped
with the pins on RAMPS 14 using the pin assignments
shown in Table 1
Figure 11 shows the flow of signals from Beaglebone to
the axis motors and the extruder assembly This figure also
shows a schematic diagram of the various components con-
trolled by the Franklin firmware
Z-axis
R-axis
Theta-axis
Axis Motors Extruder Assembly
R Axis Theta Axis Z Axis
X_STEP_PIN 54 Y_STEP_PIN 60 Z_STEP_PIN 46 E_STEP_PIN 26
X_DIR_PIN 55 Y_DIR_PIN 61 Z_DIR_PIN 48 E_DIR_PIN 28
X_ENABLE_PIN 38 Y_ENABLE_PIN 56 Z_ENABLE_PIN 62 E_ENABLE_PIN 24
X_MIN_PIN 3 Y_MIN_PIN 14 Z_MIN_PIN 18 FAN_PIN 9
X_MAX_PIN 2 Y_MAX_PIN 15 Z_MAX_PIN 19 HEATER_PIN 10
THERMISTOR 13
Table 1 Pin mapping
Figure 10 Franklin software settings
mdashmdashmdashmdashmdashmdashmdashmdashmdashmdashmdashmdashmdashmdashmdashmdashmdashmdashmdashmdashmdashmdashmdashmdashmdashmdashmdashmdashmdashmdashmdashmdashmdashmdashmdashmdashmdashmdashmdashmdashmdashmdashmdashmdashmdashmdashndashmdashmdashmdashmdash
DEVELOPING AN OPEN SOURCE INEXPENSIVE LARGE-SCALE POLAR CONFIGURATION 3D PRINTER 17
mdashmdashmdashmdashmdashmdashmdashmdashmdashmdashmdashmdashmdashmdashmdashmdashmdashmdashmdashmdashmdashmdashmdashmdashmdashmdashmdashmdashmdashmdashmdashmdashmdashmdashmdashmdashmdashmdashmdashmdashmdashmdashmdashmdashmdashmdashndashmdashmdashmdashmdash
mdashmdashmdashmdashmdashmdashmdashmdashmdashmdashmdashmdashmdashmdashmdashmdashmdashmdashmdashmdashmdashmdashmdashmdashmdashmdashmdashmdashmdashmdashmdashmdashmdashmdashmdashmdashmdashmdashmdashmdashmdashmdashmdashmdashmdashmdashndashmdashmdashmdashmdash
18 INTERNATIONAL JOURNAL OF ENGINEERING RESEARCH AND INNOVATION | V11 N1 SPRINGSUMMER 2019
Figure 11 Electrical component diagram
OSALS-Polar Operation Methods
3D printing is carried out by using CAD to output a stereo
lithography (stl) file slicing software (Cura) to generate the
G-code file and Franklin to operate the OSALS-Polar Sie-
mens PLM NX CAD software can be used to insert the for-
mulas and expressions for the parametric modeling intent
(Irwin 2013) and to export it in an stl file format The stl
file is loaded in Cura and prepared for 3D printing Some
overhang parts shallower than 45ordm may require the use of
support material (France 2013) The machine type in Cura
is set to Custom FDM printer with PLA material The poly-
mer filament used can be either polylactic acid (PLA) or
acrylonitrile butadiene styrene (ABS) converting it into a
physical object by depositing it in thin sequential layers
PLA is used in this printer rather than ABS because of its
lower melting temperature and superior adhesion to the
glass substrate The layer height shell thickness fill densi-
ty print speed retraction distance and print temperature are
some of the parameters that are set and calibrated as per the
print material and output quality requirements The slicing
software converts this stl file into consecutive thin layers to
generate G-code (Cano 2015) The commonly used open
source slicing software includes Cura and Slic3r Repetier
The Polar 3D company provides cloud services where the
CAD model can be converted to slices online and then
downloaded to run the code
Franklin is a Web-based 3D control system to regulate the
machining process parameters with any internet-connected
device The main function of this software shown in Figure
12 is to drive the hardware systems by integrating with the
slicer software program (Wijnen Anzalone Haselhuhn
Sanders amp Pearce 2016)
Figure 12 Franklin software
The software aims to be more powerful and user-friendly
by having improved robustness system reliability (error
checking) and a powerful scripted interface to smoothly run
the G-code specifically for the large-scale 3D printing and
sophisticated scientificmedical designs The main commu-
nication interfaces for this software include
1 Web socket connection to the browser or script client
(JSON array)
2 Franklin Server and Franklin Python driver (JSON
array)
3 Franklin Python driver and Franklin C driver (binary
packet)
4 Franklin C driver and Franklin interface (physical
serial line)
Calibrating the printer is important in order to ensure the
accuracy of positioning of the nozzle and distance traveled
along the respective axes Calibration includes choosing the
right amount of current and micro-stepping for the three
axes It is also important to calibrate the absolute zero posi-
tion for the three axes The dip switches on the motor driv-
ers are used to set the amount of current for each motor and
were set to half current for this system Micro-stepping is
decided based on the torque requirements and the necessary
motion accuracy The motor stepper drivers were set to 800
pulses per revolution for the Z-axis and 6400 pulses per
revolution for the Theta- and R-axes Micro-steps are also
set using the dip switches on the stepper motor drivers The
number of revolutions are calculated to enter Franklin soft-
ware based on the 200-step-per-revolution motors Equation
1 was used to calculate the new steps for the R- and Z-axes
(Pearce 2014) For the Theta-axis the distances are re-
placed with the desired and actual angles which can be cali-
brated by the same method
Beaglebone-
Franklin Firmware
RAMPS 14
Stepper Motor
Driver
Extruder
Assembly
Thermistor
Extruder Motor
Hot End
Axes Motors
(R Theta and Z) Cooling Fan
Franklin Software
Franklin Firmware
Handling low-level interface
(Temp control GPIO pins
Stepper motors control) and
communicating with serial
interface
Franklin Server
Web interface by handling
multiple devices
Franklin C Driver
Handling
functions written
in C++
Franklin Python
Driver
mdashmdashmdashmdashmdashmdashmdashmdashmdashmdashmdashmdashmdashmdashmdashmdashmdashmdashmdashmdashmdashmdashmdashmdashmdashmdashmdashmdashmdashmdashmdashmdashmdashmdashmdashmdashmdashmdashmdashmdashmdashmdashmdashmdashmdashmdashndashmdashmdashmdashmdash
Steps in firmware x Desired distance
Actual distance traveled during testing (1)
The Z-axis travel was calculated as 254 mmrev by con-
verting the 0100-inch pitch for the 1rdquo-10-threads-per-inch
acme screw to metric units Finally the Theta-axis travel
has 500 teeth on the internal ring gear and 24 teeth on the
pinion thus from Equation 2 the table rotates 1728 de-
grees per motor revolution
(2)
Finally Table 2 shows that the Franklin software requires
an entry for stepsmm or stepsdegree for each motor based
on the motor stepper driver pulses per revolution The num-
ber of micro-step pulses per revolution are divided by the
travel per revolution for each axis as given by Equation 3
Franklin Coupling setting (stepsmm) =
Micro stepsAxis travel (mmrev or degreesrev) (3)
To finely tune the OSALS-Polar Equation 4 was used to
calculate a calibrated number of steps for the R- and Z-axes
(Pierce 2014) For the Theta-axis the distances were re-
placed with the desired and actual angles which can be cali-
brated by the same method
Calibrated Franklin Coupling setting (stepsmm) =
Original stepsmm in Franklin x Desired distance (4)
Actual distance traveled during testing
Absolute zero was calibrated by first marking the center
on the rotating table Reference positions are set by homing
the machine using the Franklin interface The limit switch
positions in Franklin are changed to specify the distance
between reference points and absolute zero For the R-axis
a fixed end stop was placed on the horizontal arm bracket
and the switch position calibrated to 820 mm in Franklin
Similarly for setting the Z-axis switch position can be cali-
brated by using a paper gage (01 mm thickness) on at least
four equiangular points of the circular base Currently the
Z-axis switch position was set to 96 mm For the Theta-axis
the reference point used was zero The movement accuracy
for the Z- and R-axes were tested by using dial indicators to
validate that the software could manually jog the axis the
desired distances For the theta axis one complete revolu-
tion is measured when the axis is jogged 360ordm When the
OSALS-Polar is successfully calibrated it is ready to create
a 3D-printed part
Results of 3D Printing
By manually jogging the Z- and R-axes in the Franklin
interface measurements taken with a 12-inch travel dial
indicator length gage indicate precision from zero to 1 mm
For the Theta-axis a 360ordm rotation varies within 1ordm indicat-
ed by an alignment mark on the table and stationary frame
Causes for variations in travel of the R- and Theta-axes are
due to the timing belt and gear as well as the ring gear and
pinion interfaces Adjusting the Theta-axis motor too tightly
against the internal ring gear will cause the gear teeth to
bind and stop rotating So the looser fit in the mating of the
gear teeth causes some backlash The R-axis belt having a
9525 mm pitch yields a travel of 17145 mm per motor
revolution so a finer pitch belt will improve the R-axis pre-
cision The Z-axis accuracy is due to the tight connection of
the motor shaft to the acme screw eliminating backlash and
slippage
Figure 13 shows various geometries for testing the
OSALS-Polar which include a cylinder and cuboid Initial
test results for the 50x50x5 mm-high part were unsuccessful
in achieving accurate and smooth surface results The print-
ing time was estimated at 15 minutes which was approxi-
mately the time for the trial test Figures 14 and 15 show the
actual printed part and the top surface which is angled low-
er towards the center of the printing surface This result was
consistent with all sample test prints and was likely caused
by the R-axis planar misalignment with the Theta-axis table
surface The R-axis arm deflected slightly downward as the
extruder mechanism reached the end of its travel at the cen-
ter of the table The deflection of the R-axis arm caused the
extruder nozzle to drag over the surface of the part as the
Theta-axis rotated and the R-axis translated thereby form-
ing a buildup of plastic on the leading edge of the printed
path
te e th r in g g e a rT h e ta -a x is tr a v e l (d e g re e s re v ) = 3 6 0
te e th p in io n
Axis Steps Number of teeth Pitch type Pitch
(inches) Pitch per revolution Micro-steps Actual Steps
r 200 18 Linear 0375 17145 mmrev 6400 3732 mm
theta 200 Pinion 24
Circular - 1728 degreesrev 6400 37037degree Ring Gear 500
z 200 - Acme 01 254 mmrev 800 31496mm
Table 2 Step values set in Franklin
mdashmdashmdashmdashmdashmdashmdashmdashmdashmdashmdashmdashmdashmdashmdashmdashmdashmdashmdashmdashmdashmdashmdashmdashmdashmdashmdashmdashmdashmdashmdashmdashmdashmdashmdashmdashmdashmdashmdashmdashmdashmdashmdashmdashmdashmdashndashmdashmdashmdashmdash
DEVELOPING AN OPEN SOURCE INEXPENSIVE LARGE-SCALE POLAR CONFIGURATION 3D PRINTER 19
mdashmdashmdashmdashmdashmdashmdashmdashmdashmdashmdashmdashmdashmdashmdashmdashmdashmdashmdashmdashmdashmdashmdashmdashmdashmdashmdashmdashmdashmdashmdashmdashmdashmdashmdashmdashmdashmdashmdashmdashmdashmdashmdashmdashmdashmdashndashmdashmdashmdashmdash
mdashmdashmdashmdashmdashmdashmdashmdashmdashmdashmdashmdashmdashmdashmdashmdashmdashmdashmdashmdashmdashmdashmdashmdashmdashmdashmdashmdashmdashmdashmdashmdashmdashmdashmdashmdashmdashmdashmdashmdashmdashmdashmdashmdashmdashmdashndashmdashmdashmdashmdash
20 INTERNATIONAL JOURNAL OF ENGINEERING RESEARCH AND INNOVATION | V11 N1 SPRINGSUMMER 2019
Figure 13 Cura file 50x50x5mm high
Figure 14 Initial test part 50x50x5mm high
Figure 15 Part accuracy
The results of the 50x50x5 mm-high part were difficult to
measure with precise accuracy due to the uneven surface
Unwanted movement of the horizontal arm was reduced by
adding additional screws to secure the vertical axis guide
rods to the mounting rails which improved the stability of
the arm The PLA material spool was removed from the
R-axis extruder assembly to decrease possible deflection of
the arm but this did not significantly improve print quality
The Theta- and R-axes motors need to move simultaneously
for the extruder tool to move in a straight line using conver-
sions performed in the Franklin C driver which sends the
Franklin Firmware a list of numbers of steps to move in
either the positive or negative direction The firmware takes
this list and sends the steps to the motors The reason for the
inaccuracies in the 3D-printed part can be attributed to the
Theta- and R-axes not operating simultaneously at the same
speed The Franklin coupling settings (stepsmm) in Delta-
style 3D printers using the Franklin Firmware have had all
motors for the extruder tool movement set to the same
stepmm value
Using a larger diameter nozzle will alleviate some inaccu-
racies due to the large scale of the OSALS-Polar and re-
duce overall printing time Proper retraction and travel
speed settings in the Cura software will minimize the string-
ing and oozing issues in the part Some of the other issues
that arose during testing included hot-end jamming though
only when the nozzle was too close to the table Adjusting
the Z-axis motor switch settings during the calibration pro-
cess will correct this problem
Conclusions
The advantages of the OSALS-Polar 3D printer include a
large print volume but with a large mechanical device
there are disadvantages in the scaling-up of inaccuracies in
planar and perpendicularity of components The OSALS-
Polar can successfully operate in the R- and Z-axes with
precision with 1 mm accuracy and in the Theta-axis within
1ordm The Franklin software efficiently controls the tempera-
ture of the hot end at the desired 210ordm C within a range of
plusmn2ordm The Franklin software can operate the extruder motor
to feed the 3-mm-diameter PLA material through the hot
end nozzle at the desired rate The G-code generated from
Cura for a cylinder and cuboid test are not producing an
accurate result at this time but all three axes are operating
automatically when the G-code is initiated
The OSALS-Polar is deemed a partial success at this
point due to having accomplished most of the projectrsquos
goals This printer was relatively inexpensive to constructmdash
under $5000 for materials It operates using open source
Franklin software that is continuously being improved The
mdashmdashmdashmdashmdashmdashmdashmdashmdashmdashmdashmdashmdashmdashmdashmdashmdashmdashmdashmdashmdashmdashmdashmdashmdashmdashmdashmdashmdashmdashmdashmdashmdashmdashmdashmdashmdashmdashmdashmdashmdashmdashmdashmdashmdashmdashndashmdashmdashmdashmdash
final testing of the system produced small extruded parts
although the accuracy and scaling up to larger-sized parts
was not accomplished Further work is planned in order to
determine if the inaccuracies in the printed parts are due to
the non-planar R-axis and Theta-axis table The level of the
R-axis arm and the printing surface can be adjusted with
metal shims New conversions may be necessary by the
Franklin C driver to take into account the differences in the
stepsmm Franklin coupling settings for the Theta- and
R-axes motors In the future testing of larger parts may
encounter limitations in the size of prints due to material
cooling at various rates and causing warpage
Acknowledgements
Appreciation for troubleshooting of the Franklin software
for Gerald Anzalone research engineer Michigan Techno-
logical University Also assistance in testing data collec-
tion and troubleshooting of the OSALS-Polar from MS in
Mechanical Engineering students Sachin Rana and Divy
Patel is much appreciated
References
About Polar 3D LLC (2014) Retrieved from https
aboutPolar3dcomprinter
Anderson T (2014) Theta printer A 3D printer with 4
extruders that can move independently and simultane-
ously Retrieved from httpshackadayioproject812-
theta-printer
Barnett E amp Gosselin C (2015) Large-scale 3D printing
with a cable-suspended robot Additive Manufacturing
7 27-44
Berman B (2012) 3-D printing The new industrial revolu-
tion Business Horizons 55(2) 155-162
Cano L M (2015) 3D printing A powerful new curricu-
lum tool for your school library a powerful new cur-
riculum tool for your school library Goleta CA ABC-
CLIO
Deshpande S Rao N Pradhan N amp Irwin J L (2016
November) Hybrid polymer additive manufacturing of
a Darrieus type vertical axis wind turbine design to
improve power generation efficiency Proceedings of
the ASME 2016 International Mechanical Engineering
Congress and Exposition New York ASME
France A K (2013) Make 3D printing The essential
guide to 3D printers Sebastapol CA Maker Media
Inc
Farcas K (2016) R 360 Retrieved from httprepraporg
wikiR_360
Gebler M Uiterkamp A J S amp Visser C (2014) A
global sustainability perspective on 3D printing tech-
nologies Energy Policy 74 158-167
Gibb A (2014) Building open source hardware DIY man-
ufacturing for hackers and makers Carmel IN Pear-
son Education
Horne R amp Hausman K K (2017) 3D printing for dum-
mies New York John Wiley amp Sons
Hoy B (2016) Design and implementation of a three di-
mensional printer using a cylindrical printing process
Retrieved from httpsdigitalcommonscalpolyeducgi
viewcontentcgireferer=httpssearchyahoocom
amphttpsredir=1amparticle=1370ampcontext=eesp
Irwin J (2013) Wind turbine blade CAD models used as
scaffolding technique to teach design engineers Engi-
neering Design Graphics Journal 77(2) 1949-1967
Pearce J M (2014) MOST RepRap build Retrieved from
httpwwwappropediaorg
MOST_RepRap_BuildCalibration
Pradhan N K Irwin J L Siddegowda B R amp Harsha
S (2016) Design and fabrication of the power trans-
mission system of a large scale 3D printer Proceedings
of the Association of Technology Management and
Applied Engineering Conference New York ATMAE
Replicator Warehouse R-360 The most simple and modu-
lar 3D printer (2013) Retrieved from https
wwwkickstartercomprojects2132002936r-360-the-
most-simple-and-modular-3d-printer
Sells E Bailard S Smith Z Bowyer A amp Olliver V
(2010) RepRap the replicating rapid prototyper Max-
imizing customizability by breeding the means of pro-
duction In F T Pillar amp M M Tseng (Eds) Hand-
book of research in mass customization and personali-
zation (pp 568-580) River Edge NJ World Scientific
Steele W (2013) PiMaker 3D printer Retrieved from
httpswwwthingiversecomthing128700
Wijnen B Anzalone G C Haselhuhn A S Sanders P
G amp Pearce J M (2016) Free and open source con-
trol software for 3-D motion and processing Journal of
Open Research Software 4(1) Retrieved from http
dxdoiorg105334jors78 Wittbrodt B T (2014) Development of practical applica-
tions for RepRap style 3-D printers in engineering
(Unpublished doctoral dissertation) Michigan Techno-
logical University Houghton MI
Wittbrodt B T Glover A G Laureto J Anzalone G
C Oppliger D Irwin J L amp Pearce J M (2013)
Life-cycle economic analysis of distributed manufactur-
ing with open source 3-D printers Mechatronics 23(6)
713-726
Wohlers T (2013) Wohlers report 2013 Additive manu-
facturing and 3D printing state of the industrymdashAnnual
worldwide progress report Fort Collins CO Wohlers
Associates
Yusuf B (2015) 3D printers explained Delta Cartesian
Polar Scara Retrieved from httpsall3dpcomknow-
your-fdm-3d-printers-cartesian-delta-Polar-and-scara
mdashmdashmdashmdashmdashmdashmdashmdashmdashmdashmdashmdashmdashmdashmdashmdashmdashmdashmdashmdashmdashmdashmdashmdashmdashmdashmdashmdashmdashmdashmdashmdashmdashmdashmdashmdashmdashmdashmdashmdashmdashmdashmdashmdashmdashmdashndashmdashmdashmdashmdash
DEVELOPING AN OPEN SOURCE INEXPENSIVE LARGE-SCALE POLAR CONFIGURATION 3D PRINTER 21
mdashmdashmdashmdashmdashmdashmdashmdashmdashmdashmdashmdashmdashmdashmdashmdashmdashmdashmdashmdashmdashmdashmdashmdashmdashmdashmdashmdashmdashmdashmdashmdashmdashmdashmdashmdashmdashmdashmdashmdashmdashmdashmdashmdashmdashmdashndashmdashmdashmdashmdash
mdashmdashmdashmdashmdashmdashmdashmdashmdashmdashmdashmdashmdashmdashmdashmdashmdashmdashmdashmdashmdashmdashmdashmdashmdashmdashmdashmdashmdashmdashmdashmdashmdashmdashmdashmdashmdashmdashmdashmdashmdashmdashmdashmdashmdashmdashndashmdashmdashmdashmdash
22 INTERNATIONAL JOURNAL OF ENGINEERING RESEARCH AND INNOVATION | V11 N1 SPRINGSUMMER 2019
Biographies
SOURABH PRASHANT DESHPANDE is a PhD stu-
dent in the Mechanical Engineering Program at the Univer-
sity of Cincinnati with a focus on additive manufacturing
Mr Deshpande may be reached at sourabhdmtuedu
SHRINIVAS KULKARNI is an MS student in the
Mechanical Engineering Program at Michigan Technologi-
cal University with a focus on additive manufacturing Mr
Kulkarni may be reached at skulkar2mtuedu
SID SHAH is an MS student in the Mechanical Engi-
neering Program at Michigan Technological University
with a focus on additive manufacturing Mr Shah may be
reached at ssshah1mtuedu
JOHN IRWIN is a professor of mechanical engineer -
ing technology at Michigan Technological University He
earned his EdD in Curriculum and Instruction in 2005 from
Wayne State University Dr Irwinrsquos research interests in-
clude STEM education CADCAM and CAE residential
wind turbine design and additive manufacturing methods
Dr Irwin may be reached at jlirwinmtuedu
-plate collector was enclosed by double-glazing that admit-
ted solar radiation and minimized convection heat transfer
losses to the environment The shell of the collector was
insulated to reduce conduction losses This system likewise
utilized a coiled copper heat exchanger coil to transfer heat
from the working fluid to an insulated storage tank The
water flow through the receiver was obtained by means of
an off-the-shelf circulation pump As described subsequent-
ly this system was then fully instrumented to measure the
working fluid flow rate and temperatures as well as the
receiver and cover plate temperature in an effort to esti-
mate thermal losses The goal of the present study was to
assess whether a solar water heating system constructed
using relatively inexpensive scavenged components could
exhibit thermal efficiency equivalent to that of a more ex-
pensive vacuum tube solar collector system that is available
for sale
It has been demonstrated (ASHRAE 2015) through the
use of STCs that the combination of effective convection
suppression and selective surface absorption yields im-
proved thermal efficiency at high temperatures Like the
FPC STCs collect both direct and diffuse radiation How-
ever their efficiency is higher at low incidence angles
which gives STC an advantage over FPC in day-long per-
formance Depending on the solar insolation level of the
locality the authors found that working fluid outlet temper-
atures of 80degC to 200degC can be achieved (Made-in-China
nd) Fundamental studies of STC thermal performance
have been reported by Duffie and Beckman (1991) Budi-
hardjo and Morrison (2009) Rittidech and Wannapakne
(2007) and Ma Lu Zhang and Liang (2010) Kim and Seo
(2007) and Shah and Furbo (2004) employed evacuated
tube collectors made from a two-layered glass tube with
circular fins and a U-tube absorber Measured collector
efficiencies were 558 and 60 respectively
The study reported by Tripanagnostopoulos Souliotis
and Nousia (2000) using a flat-plate collector model
achieved a minimum outlet temperature of 50C and had a
collector efficiency of 80 Zelzouli Guizani Sebai and
Kerkeni (2012) concluded that the number of FPCs that can
Abstract
The world runs on the energy generated from the com-
bustion of non-renewable energy sources such as fossil
fuels (coal petrol and diesel) causing an increase in atmos-
pheric pollution Due to recent scientific discoveries the
use of renewable energy sources is made possible economi-
cal and environmentally friendly Specifically solar energy
has the greatest potential of all the worldrsquos renewable ener-
gy sources To absorb the sunrsquos radiation and convert it to
heat solar collectors are needed This preliminary experi-
mental study focused on comparing the thermal perfor-
mance of a commercially marketed solar water heating sys-
tem that featured an evacuated-tube solar collector (STC) to
that of a system that utilized a flat-plate collector (FPC)
constructed using an air conditioning radiator as the collec-
tor The STC system generally exhibited a 14 higher effi-
ciency than the FPC system The FPC system was relatively
inefficient in the absence of direct sunlight whereas the
STC system remained effective even without direct solar
irradiation
Introduction
This investigation experimentally compared the thermal
performance of two solar water-heating systems One sys-
tem employed a commercially available heat pipe evacuated
-tube solar collector (STC) The system utilized a pump to
transfer the heated waterglycol mixture from the receiver
to an insulated storage tank The tank had a built-in copper
heat exchanger coil to transfer heat from the working fluid
to the potable water in the tank thereby preventing the two
fluids from mixing The complete closed-loop system in-
cluded an expansion tank and a control unit containing the
circulation pump pressure gauge tempering valve pressure
relief valve and flow meter The other system considered in
this study used a repurposed air conditioner radiator as a
flat-plate collector (FPC) It consisted of an array of serpen-
tine tubes through which water was circulated The pres-
ence of high-density corrugated fins attached to the tubes
increased the absorption of incident solar radiation The flat
mdashmdashmdashmdashmdashmdashmdashmdashmdashmdashmdashmdashmdashmdashmdashmdashmdashmdashmdashmdashmdashmdashmdashmdashmdashmdashmdashmdashmdashmdashmdashmdashmdashmdashmdashmdashmdashmdashmdashmdashmdashmdashmdashmdashmdashmdashndashmdashmdashmdashmdash
SV Vishnu Samudrala Zimmer Biomet Ahmed ElSawy Tennessee Technological University
Mohan Rao Tennessee Technological University Stephen Idem Tennessee Technological University
A COMPARATIVE STUDY OF THE THERMAL
EFFICIENCY OF SOLAR VACUUM-TUBE VERSUS
FLAT-PLATE COLLECTORS FOR WATER
HEATING SYSTEMS
mdashmdashmdashmdashmdashmdashmdashmdashmdashmdashmdashmdashmdashmdashmdashmdashmdashmdashmdashmdashmdashmdashmdashmdashmdashmdashmdashmdashmdashmdashmdashmdashmdashmdashmdashmdashmdashmdashmdashmdashmdashmdashmdashmdashmdashmdashmdashmdashmdashmdash
INTERNATIONAL JOURNAL OF ENGINEERING RESEARCH AND INNOVATION | V11 N1 SPRINGSUMMER 2019 23
mdashmdashmdashmdashmdashmdashmdashmdashmdashmdashmdashmdashmdashmdashmdashmdashmdashmdashmdashmdashmdashmdashmdashmdashmdashmdashmdashmdashmdashmdashmdashmdashmdashmdashmdashmdashmdashmdashmdashmdashmdashmdashmdashmdashmdashmdashndashmdashmdashmdashmdash
mdashmdashmdashmdashmdashmdashmdashmdashmdashmdashmdashmdashmdashmdashmdashmdashmdashmdashmdashmdashmdashmdashmdashmdashmdashmdashmdashmdashmdashmdashmdashmdashmdashmdashmdashmdashmdashmdashmdashmdashmdashmdashmdashmdashmdashmdashndashmdashmdashmdashmdash
24 INTERNATIONAL JOURNAL OF ENGINEERING RESEARCH AND INNOVATION | V11 N1 SPRINGSUMMER 2019
be connected in series is limited When collectors are con-
nected in series the outlet temperature of each collector
will increase when compared to parallel or series-parallel
connected collectors and this leads to an increase in ther-
mal losses due to increased temperature differences
Jouhari Touhmeh and Moukhayber (2015) demonstrated
that by combining both flat-plate and evacuated-tube collec-
tors the thermal performance of the compound collector
was improved Ben Slama (2012) conducted experiments
on an integrated flat-plateevacuated-tube collector and
found that the efficiency of double glazing was 42
whereas with single glazing the efficiency was 30
Shukla Sumathy Erickson and Goung (2013) summarized
the current state-of-the-art concerning system components
of solar water heaters such as the collector storage tank
and heat exchanger and likewise discussed various ap-
proaches to improving performance and cost effectiveness
of solar water heaters The FPC is usually permanently
fixed in position and does not require any tracking of the
sun The collectors should be placed directly towards the
equator facing due south in the northern hemisphere The
ideal tilt angle of the collector is equal to the latitude of the
location with angle variations of 10-15degC depending on
the application According to the test results of Duffie and
Beckman (1991) they are capable of producing tempera-
tures up to 100degC above the ambient temperature FPCs are
the most common type of collectors used in solar water
heating systems in Africa supplying hot water in hotels
hospitals and to wealthier households (Karaekezi amp Ranga
1997)
Experimental Setup
The STC utilized in this current study was a commercial-
ly available Duda Energy (model SC5815) solar collector
(Duda nd) It consisted of 15 parallel transparent glass
tubes supported on a frame and connected to a header pipe
In each instance the evacuated tube outer diameter was
58 mm (228 in) and the overall length was 180m
(709 in) The tubes were evenly spaced on the frame such
that the overall footprint of the STC was 2050 mm 1145
mm (807 in 467 in) complete details are provided in
Duda (nd) and Samudrala (2016) The STC was mounted
on the roof of a building with a pitch of approximately 28
and was oriented due south Reflective insulation was
placed beneath the STC to minimize losses and to enhance
the solar energy incident on the backside of the tube array
The flexible steel pipes leading tofrom the STC were
wrapped with standard 6-mm-thick (025 in) foam insula-
tion Each individual collector tube consisted of two con-
centric glass tubes The annulus between the tubes was
evacuated to minimize convection heat loss to the environ-
ment The tubes were constructed using borosilicate or soda
lime glass which is resistant to high temperatures and has a
high transmittance for solar irradiation A flat or curved
aluminum or copper fin was attached to a metal heat pipe
running through the inner tube The inner glass tube and fin
was covered with a selective coating that maximizes ab-
sorption of solar energy
The hollow copper heat pipe within the tube contained a
small volume of a low-pressure alcoholwater liquid as
well as some additional additives to prevent corrosion or
oxidation This partial vacuum enabled the liquid to vapor-
ize at a prescribed temperature which is lower than would
be possible at atmospheric pressure When solar radiation
was incident on the surface of the heat pipe the liquid in the
heat pipe was vaporized due to the absorption of heat
Therein the increased vapor pressure drove the hot vapor to
the top portion of the heat pipe which consisted of a ldquohot
bulbrdquo inserted through a copper well located within a con-
necting manifold A waterglycol mixture flowed through
the manifold and heat was transferred to the working fluid
as it flowed past the hot bulb condensers in the manifold
As the hot vapor in the heat pipe lost energy it cooled and
subsequently condensed Then it flowed back down the heat
pipe through a wickporous mesh by a combination of grav-
ity and capillary action This cyclic process of alternating
evaporation and condensation of the liquid within the sealed
heat pipe continued as long as radiant energy was incident
upon the vacuum tubes Per Tripanagnostopoulos et al
(2000) a depiction of the STC closed-loop solar water heat-
ing system is provided in Figure 1
Figure 1 STC solar water heating system Printed with
permission
mdashmdashmdashmdashmdashmdashmdashmdashmdashmdashmdashmdashmdashmdashmdashmdashmdashmdashmdashmdashmdashmdashmdashmdashmdashmdashmdashmdashmdashmdashmdashmdashmdashmdashmdashmdashmdashmdashmdashmdashmdashmdashmdashmdashmdashmdashndashmdashmdashmdashmdash
The working station supplied with the STC system in-
cluded an integrated flow meter with a digital display Like-
wise the working station contained a flow controller and
pressure relief valve The water storage tank used in con-
junction with the STC system consisted of two concentric
tanks one larger and one smaller The annular gap between
the tanks was filled with mineral wool to reduce heat loss
Copper-constantan thermocouples were mounted at the inlet
and outlet of the STC header to record the waterglycol
temperatures The ambient temperature and solar insolation
data were downloaded directly from a local weather station
Further details regarding this aspect of the current study are
available in the study by Samudrala (2016)
The FPC considered in this current study (Chittireddy
2017 Chittireddy ElSawy amp Idem 2018) was fully instru-
mented to measure such variables as water flow rate and
temperature rise solar insolation and receiver and cover
plate temperatures Figure 2 shows a photograph of the ap-
paratus Throughout the experiments the flat-plate receiver
was positioned to face directly south and was inclined at an
angle so that solar insolation was directed normally onto the
apparatus This orientation was maintained throughout the
duration of the experiments Major components of the FPC
solar collector system considered in this study were
1 The receiver plate (a repurposed air conditioner radi-
ator)
2 A water storage tank
3 The casing for the collector and insulation on the
bottom to reduce heat loss
4 Two layers of glazing cover
5 A linear actuator to control the inclination of the col-
lector
6 A water-circulating pump
Figure 2 FPC solar water heating system Printed with
permission
Other components of the FPC system included calibrated
temperature sensors a water mass flow-rate sensor and a
data acquisition system An air conditioner radiator was
selected as the receiver plate The radiator coil consisted of
a single continuous serpentine tube configured in three rows
by means of headers Each row of the radiator had 22
straight finned-tube sections that were parallel to one anoth-
er and were arranged in a single plane The thickness of the
fins was 025 mm and there were 591 continuous plate fins
per meter The cross-sectional area of the receiver plate was
073m 056m The material of the tubes was copper and
the fins were constructed from aluminum These fins were
coated with black paint to increase solar heat absorptivity
Two acrylic sheets were employed as glazing for the FPC
Plexiglas was used because it has a transmittance closely
equivalent to optical glass The total light transmittance of
Plexiglas is 92 and the emissivity is 086 (Chittireddy
et al 2018) Radiation losses from the glass cover were
reduced since it is transparent to the short-wave radiation
emitted by the sun and is nearly opaque to long-wave ther-
mal radiation emitted by the absorber plate
In this experiment double parallel glazing was used
Each glazing had a thickness of 6 mm The distance be-
tween the two cover plates was 19 mm and distance be-
tween the absorber plate and the lower cover plate was
36 mm Eleven copper-constantan thermocouples were used
to measure the temperature at prescribed locations on the
receiver and cover plates as well as the inlet and water tem-
peratures Three thermocouples were mounted to the upper
cover plate three were attached to the lower cover plate
and three thermocouples were affixed to the receiver plate
and the resulting values were averaged Two thermocouples
were used to measure the inlet and outlet temperatures of
the receiver plate by inserting them directly into the 13-mm
-diameter steel pipes leading tofrom the copper pipes in the
radiator Prior to installation in the solar water heater each
temperature sensor was calibrated using a reference immer-
sion thermometer
Water flow was measured using a calibrated flow sensor
The flow sensor required a voltage input of 5-18VDC
(supplied by the data acquisition system) It was capable of
measuring flow rates from 1 to 30 Lmin over a temperature
range of -25ordmC to +80ordmC The water flow sensor was in-
stalled in a 15m-long pipe which was between the outlet of
the collector and the storage tank A sufficient length of
pipe was employed upstream of the flow sensor to ensure
that the entering flow was fully developed The casing re-
ceiver plate and water storage tank used with the FPC were
mounted on a moving trolley The data acquisition system
was placed on another moving trolley Each time an experi-
ment was performed the experimental setup mounted on
mdashmdashmdashmdashmdashmdashmdashmdashmdashmdashmdashmdashmdashmdashmdashmdashmdashmdashmdashmdashmdashmdashmdashmdashmdashmdashmdashmdashmdashmdashmdashmdashmdashmdashmdashmdashmdashmdashmdashmdashmdashmdashmdashmdashmdashmdashndashmdashmdashmdashmdash
A COMPARATIVE STUDY OF THE THERMAL EFFICIENCY OF SOLAR VACUUM-TUBE VERSUS FLAT-PLATE COLLECTORS 25
FOR WATER HEATING SYSTEMS
Actuator
Insulated water tank
Solar collector
mdashmdashmdashmdashmdashmdashmdashmdashmdashmdashmdashmdashmdashmdashmdashmdashmdashmdashmdashmdashmdashmdashmdashmdashmdashmdashmdashmdashmdashmdashmdashmdashmdashmdashmdashmdashmdashmdashmdashmdashmdashmdashmdashmdashmdashmdashndashmdashmdashmdashmdash
mdashmdashmdashmdashmdashmdashmdashmdashmdashmdashmdashmdashmdashmdashmdashmdashmdashmdashmdashmdashmdashmdashmdashmdashmdashmdashmdashmdashmdashmdashmdashmdashmdashmdashmdashmdashmdashmdashmdashmdashmdashmdashmdashmdashmdashmdashndashmdashmdashmdashmdash
26 INTERNATIONAL JOURNAL OF ENGINEERING RESEARCH AND INNOVATION | V11 N1 SPRINGSUMMER 2019
the trolleys was moved out into an open area to receive so-
lar radiation In every instance the solar water heater was
manually positioned facing south during the acquisition of
performance data Once the setup was initially positioned
the setup was not further adjusted (ie solar tracking was
not employed while measurements were being performed)
The casing was placed on horizontal bars capable of mov-
ing vertically The horizontal bar was connected to a
12VDC linear actuator to raise the casing vertically and to
align the receiverrsquos placement so that it was perpendicular
to the solar irradiation at the start of the experiments The
storage tank was placed under the casing and a 12VDC cir-
culating pump was connected to circulate the heat transfer
fluid through the solar collector
The solar thermal systems utilized solar collectors located
remotely from the storage tank Both systems used a pump
to circulate a waterpropylene glycol mixture between the
storage tank and the collector in a continuous loop and back
again to the storage tank In each instance a copper heat
exchanger coil located in the insulated storage tank was
used to transfer heat acquired by the collectors from work-
ing fluid to the potable water present in the tank without
mixing the fluids together In general this is advantageous
since the storage tanks can be placed indoors reducing heat
loss in winter months In addition backup heating systems
may be installed in the storage tanks to supply enough heat
to meet the demands of the user in case of cloudy or rainy
weather Furthermore this permits placing the tank close to
where the water will be used thereby reducing the time
needed for hot water to flow from the tap
Data Acquisition and Reduction
A Raspberry Pi system was used to connect all of the
temperature sensors for data acquisition The Raspberry Pi
is a low-cost credit card-sized computer that plugs into a
computer monitor or TV and uses a standard keyboard and
mouse A simple Python code was used to configure the
temperature sensors The data were collected and exported
to a csv file for further analysis An open source computer
hardware and software system was used to acquire the data
from each of the experimental setups The performance of a
solar water heater was characterized by how efficiently it
could convert the energy of incident solar energy to a corre-
sponding increase in the temperature of a circulating hot
waterglycol mixture The thermal efficiency of each collec-
tor considered in the present study was calculated using
Equation 1
(1)
where
ṁ = Mass flow rate in kgsec
Cp = Specific heat capacity in Jkg-K
Ac = Collector area in m2
Gt = Global solar radiation on the collector in Wm2
To = Collector outlet temperature in K
Ti = Collector inlet temperature in K
In this instance ṁ refers to the measured waterglycol
mass flow rate through the system and To and Ti are the
temperatures recorded at the collator inlet and outlet re-
spectively The quantity Gt is the measured solar radiation
incident upon the collectors as measured by the local
weather station Likewise AC denotes the effective cross
section of each collector and CP indicates the average
working fluid specific heat
Results
The testing of the STC and FPC solar water heating sys-
tems was performed under different ambient seasonal tem-
peratures Various weather conditionsmdashcloudy rainy and
sunnymdashwere encountered throughout the test program The
measurements were conducted approximately five hours a
day and were initiated around noon when the sun was at its
highest elevation The data were acquired every 13 seconds
throughout the test cycle Figure 3 illustrates the perfor-
mance of the STC system on different days subject to dis-
parate ambient temperatures and levels of solar insolation
in terms of the measured outlet waterglycol temperatures
At noon (peak incident solar radiation) the collector effi-
ciency calculated by means of Equation 1 for cold weather
conditions was 698 At that time the global solar radia-
tion was found to be 812 Wattm2 The useful energy col-
lected was 1136 kJday By comparison measurements
conducted later in the season under warm conditions yield-
ed a calculated collector efficiency at noon of 815 when
the measured global solar irradiation was found to be
842 Wattm2 The energy collected in the STC system was
determined to be 1401 kJday Under similar conditions of
ambient temperature and incident radiation intensity STC
systems exhibited approximately 14 higher efficiency
than the FPC system
Figure 4 shows a comparison of the thermal performance
of the STC and the FPC solar water heating systems consid-
ered in this study on the same day Both systems were
charged with a similar waterglycol mixture In this in-
stance the initial ambient temperature was 71F At the
start of the experiments the measured waterglycol temper-
ature stored in the insulated tank in the STC apparatus was
79F whereas the corresponding initial waterglycol tem-
perature for the FPC system was 98F At the end of experi-
p o i
c
c t
m C T T η
A G
mdashmdashmdashmdashmdashmdashmdashmdashmdashmdashmdashmdashmdashmdashmdashmdashmdashmdashmdashmdashmdashmdashmdashmdashmdashmdashmdashmdashmdashmdashmdashmdashmdashmdashmdashmdashmdashmdashmdashmdashmdashmdashmdashmdashmdashmdashndashmdashmdashmdashmdash
ment the solar vacuum tube collector waterglycol tempera-
ture reached 147F This temperature was similar to that of
the flat-plate collector both systems yielded the same outlet
temperature over the duration of the experiments but the
STC temperature rose to its final value more quickly Since
the ambient temperature was warm the collectors per-
formed similarly
Figure 3 STC performance comparison in cold and warm
weather
Figure 4 Daily performance comparison of STC and FPC solar
water heating systems in warm weather
Figure 5 provides an additional comparison of the STC
and FPC solar water heating systems At the start of the
experiments the ambient temperature was 86F In this
case the initial waterglycol temperature for the STC sys-
tem was also 86F However at the start of the measure-
ments the working fluid temperature in the FPC system
was 80F Upon the completion of the tests the final water
glycol temperature recorded leaving the STC system was
134F and the equivalent temperature for the FPC was
130F In this instance the STC system yielded a higher
final temperature but for both systems the rate of tempera-
ture increase was almost identical The calculated collector
efficiency of the STC system at noon was determined to be
887 when the incident solar radiation was 904 Wm2
That corresponded to a useful daily energy collection for
the STC system of 1636 kJday
Figure 5 Daily performance comparison of STC and FPC solar
water heating systems in hot weather
Conclusions
This preliminary study compared the thermal perfor-
mance of a commercially marketed solar water heating sys-
tem that featured an evacuated-tube solar collector to that of
a system that utilized a flat-plate collector constructed using
an air conditioning radiator as the collector Although an
extensive side-by-side comparison of the thermal efficiency
of the two systems proved to be impractical the STC sys-
tem generally exhibited a 14 higher efficiency than the
FPC system It should be pointed out that the water heater
systems considered in this study employed different water
glycol mixture flow rates and had unequal cross sections
Likewise the same inclination angle of each collector was
not consistent and each system utilized different storage
tanks that were not equally insulated Collectively these
differences between the two solar heating systems make it
difficult to definitively compare the two approaches in
terms of thermal efficiency
While flat-plate collectors are widely used in solar water
heating applications they are inefficient in the absence of
direct sunlight By comparison STC systems are relatively
more effective even without direct solar irradiation The
simple flat-plate collector considered in this study was as-
sembled using readily available spare components It was
designed to work in sunny and warm climates However
the benefit of using the FPC system was reduced when
there were cloudy rainy or windy weather conditions So-
lar water heating systems that employ evacuated-tube col-
mdashmdashmdashmdashmdashmdashmdashmdashmdashmdashmdashmdashmdashmdashmdashmdashmdashmdashmdashmdashmdashmdashmdashmdashmdashmdashmdashmdashmdashmdashmdashmdashmdashmdashmdashmdashmdashmdashmdashmdashmdashmdashmdashmdashmdashmdashndashmdashmdashmdashmdash
A COMPARATIVE STUDY OF THE THERMAL EFFICIENCY OF SOLAR VACUUM-TUBE VERSUS FLAT-PLATE COLLECTORS 27
FOR WATER HEATING SYSTEMS
mdashmdashmdashmdashmdashmdashmdashmdashmdashmdashmdashmdashmdashmdashmdashmdashmdashmdashmdashmdashmdashmdashmdashmdashmdashmdashmdashmdashmdashmdashmdashmdashmdashmdashmdashmdashmdashmdashmdashmdashmdashmdashmdashmdashmdashmdashndashmdashmdashmdashmdash
mdashmdashmdashmdashmdashmdashmdashmdashmdashmdashmdashmdashmdashmdashmdashmdashmdashmdashmdashmdashmdashmdashmdashmdashmdashmdashmdashmdashmdashmdashmdashmdashmdashmdashmdashmdashmdashmdashmdashmdashmdashmdashmdashmdashmdashmdashndashmdashmdashmdashmdash
28 INTERNATIONAL JOURNAL OF ENGINEERING RESEARCH AND INNOVATION | V11 N1 SPRINGSUMMER 2019
lectors similar to those employed in the present study may
be more energy efficient than the flat-plate collectors due
to their unique construction Since the concentric coated-
glass tubes are vacuum-sealed heat loss associated with
convection heat transfer is reduced to a great extent Alt-
hough the STC system was deemed more thermally effi-
cient it was far more expensive than the FPC system How-
ever a detailed analysis of the relative initial and annual
operating costs of the two systems was beyond the scope of
the present study
References
ASHRAE (2015) Handbook HVAC applications Atlanta
ASHRAE
Ben Slama R (2012) Experimentation of a plane solar
integrated collector storage water heater Energy and
Power Engineering 4(2) 67-76
Budihardjo I amp Morrison G L (2009) Performance of
water-in-glass evacuated tube solar water heaters
Solar Energy 83(1) 49-56
Chittireddy V R (2017) A study of flat plate solar
collector with air conditioner radiator as absorber
plate (Masterrsquos thesis) Retrieved from ProQuest
Dissertations and Theses Database (UMI No
10246377)
Chittireddy V R ElSawy A amp Idem S (2018) Study of
a flat plate solar collector with an air conditioner
radiator as a heat absorber for a domestic water
heater Paper presented at the International Conference
on Renewable Energies and Power Quality doi https
doiorg1024084repqj16205
Duda diesel (nd) Retrieved from https
wwwdudadieselcom
Duffie J A amp Beckman W A (1991) Solar engineering
of thermal processes 2nd ed New York Wiley-
Interscience
Jouhari M Touhmeh S amp Moukhayber N (2015)
Manufacturing and thermal performance test of
(compound) solar collector in Damascus City Journal
of Biomedical Science and Engineering 8(6) 370-379
Karaekezi S amp Ranga T (1997) Renewable energy
technologies in Africa London Zed Book Ltd
Kim Y amp Seo T (2007) Thermal performances
comparisons of the glass solar vacuum tube solar
collectors with shapes of absorber tube Renewable
Energy 32(5) 772-795
Ma L Lu Z Zhang J amp Liang R (2010) Thermal
performance analysis of the glass Solar Vacuum tube
collector with U-tube Building and Environment 45
(9) 1959-1967
Made-in-China (nd) Retrieved from httpswwwmade-in
-chinacom
Rittidech S amp Wannapakne S (2007) Experimental
study of the performance of a solar collector by closed-
end oscillating heat pipe (CEoHP) Applied Thermal
Engineering 27 1978-1985
Samudrala S V Vishnu (2016) A comparative study on
the thermal efficiency of solar vacuum-tube vs flat-
plate collectors for water heating systems (Masterrsquos
thesis) Retrieved from ProQuest Dissertations and
Theses Database (UMI No 10243376)
Shah L J amp Furbo S (2004) Vertical evacuated tubular-
collectors utilizing solar radiation from all directions
Applied Energy 78(4) 371-395
Shukla R Sumathy K Erickson P amp Goung J (2013)
Recent advances in the solar water heating systems A
review Renewable and Sustainable Energy Reviews
19 173-190
Tripanagnostopoulos Y Souliotis M amp Nousia T
(2000) Solar collectors with colored absorbers Solar
Energy 68(4) 343-356
Zelzouli K Guizani A Sebai R amp Kerkeni C (2012)
Solar thermal systems performances versus flat plate
solar collectors connected in series Engineering 4(12)
881-893
Biographies
VENKAT VISHNU DEEPAK SAMUDRALA is a
manufacturing engineer at Zimmer Biomet and holds an
MS degree from Tennessee Technological University
(2016) in mechanical engineering He was born in Hydera-
bad India and holds a BS degree from SCSVMV Universi-
ty India (2010) in mechanical engineering While pursuing
his BS degree he developed a profound interest in energy
systems which inspired him to work on solar water heating
systems as his masterrsquos thesis Currently he lives in Mem-
phis Tennessee and is working on a continuous improve-
ment project focused on reducing product manufacturing
time Mr Samudrala may be reached at
ssamudral42studentstntechedu
AHMED ELSAWY joined Tennessee Technological
University as a professor and chairperson in the Department
of Manufacturing and Engineering Technology in July
1999 Prior to joining TTU he was a professor and graduate
program coordinator in the Department of Industrial Tech-
nology at the University of Northern Iowa the founding
director of the Manufacturing Engineering Program at St
Cloud State University in Minnesota and a full professor at
the Department of Mechanical Design and Production Engi-
neering at Cairo University His teaching and research inter-
ests include material processing metallurgy and manufac-
turing systems recycling and reuse of solid waste materials
renewable energy and sustainability Dr Elsawy advised
mdashmdashmdashmdashmdashmdashmdashmdashmdashmdashmdashmdashmdashmdashmdashmdashmdashmdashmdashmdashmdashmdashmdashmdashmdashmdashmdashmdashmdashmdashmdashmdashmdashmdashmdashmdashmdashmdashmdashmdashmdashmdashmdashmdashmdashmdashndashmdashmdashmdashmdash
several masterrsquos and doctoral students who hold academic
and industrial positions in the USA Germany and Taiwan
Dr Elsawy may be reached at aelsawytntechedu
MOHAN D RAO is a professor and chair of Mechan-
ical Engineering at Tennessee Technological University
Previously he was a professor of Mechanical Engineering
at Michigan Tech Dr Rao is a fellow of ASME and SAE
He has conducted research in different areas of automotive
body and powertrain dynamics acoustics and vibration
over a span of 30 years He has over 100 publications in
technical journals and conference proceedings He has ad-
vised 9 PhD and 35 MS students Dr Rao has received a
US Fulbright award National Science Foundation Research
Initiation award and was honored by the NASA Marshall
Space Flight Center for his work on the damping of the
Hubble Space Telescope truss system Dr Rao may be
reached at mraotntechedu
STEPHEN IDEM is a professor in the Depar tment of
Mechanical Engineering at Tennessee Tech University He
received his PhD in mechanical engineering from Purdue
University He has more than 30 years of experience in the
areas of scale model testing fluid flow measurement and
thermal modeling Currently he is engaged in projects to
measure airflow and pressure loss characteristics of residen-
tial HVAC duct systems He has created a numerical model
of downdraft evaporative cooling tower performance which
is being verified experimentally He has extensive experi-
ence performing flow and pressure measurements on scale
models of primary and secondary air supply ducts wind
boxes and exhaust stacks of coal-fired power plants to im-
prove their thermal performance He has developed an
online cleanliness factor model of the convection passes in
coal-fired power plants He has likewise created numerical
models of transient heat exchanger performance Dr Idem
may be reached at sidemtntechedu
mdashmdashmdashmdashmdashmdashmdashmdashmdashmdashmdashmdashmdashmdashmdashmdashmdashmdashmdashmdashmdashmdashmdashmdashmdashmdashmdashmdashmdashmdashmdashmdashmdashmdashmdashmdashmdashmdashmdashmdashmdashmdashmdashmdashmdashmdashndashmdashmdashmdashmdash
A COMPARATIVE STUDY OF THE THERMAL EFFICIENCY OF SOLAR VACUUM-TUBE VERSUS FLAT-PLATE COLLECTORS 29
FOR WATER HEATING SYSTEMS
ra 1992) dimension reduction and noise removal
(Sheybani 2011) and senior design (Garcia-Otero amp Shey-
bani 2011)
RF engineers specialize in creating various devices that
operate within the radio frequency spectrum Some of the
devices they work with include antennas radios WiFi and
mobile phones In this current study the RF engineer was in
the process of developing an antenna for a NASA project
called EcoSAR a radar tool designed to help scientists bet-
ter understand the carbon cycle by measuring biomass for-
est height density and extent This project was designed to
help him by creating a GUI that could import analyze and
export data
Technical Details
A GUI is a type of computer-human interface on a com-
puter It solves the blank screen problem that confronted
early computer users (Norman 1988) A computer-human
interface is a ldquomeans by which people and computers com-
municate with each otherrdquo (Interface 2019) GUI binds the
user of the computer system to the operation and potential
of the computer system More specifically a GUI is a speci-
fication for the look and feel of the computer sys-
tem (Bonsiepe 1989) GUIs usually have common charac-
teristics such as windows icons menus and pushbuttons
(WIMP) Collectively WIMPs are pictures that bring forth
a certain action or action space The user issues commands
via the GUI to computer applications GUIs usually have
three major components (Hayes amp Baran 1989) a window-
ing system an imaging model and an application program
interface (API) The windowing system builds the windows
menus and dialog boxes that appear on the screen The im-
aging model defines the fonts and graphics that appear on
the screen WIMPs are products of both the windowing sys-
tem and imaging model Finally the API is the means by
which the user specifies how and what windows and
graphics appear on the screen
The proposed GUI consists of the following platforms
data input selection menu scientific computation and re-
sults display The scientific computations include file type
conversion S-parameter polar-rectangular conversion
Smith chart and graphsplots The GUI was designed in
MATLAB and as a result MATLAB libraries were used
for parts of the design and development of the GUI
Abstract
In this paper the authors describe the requirements and
features necessary to develop a GUI for RF airborne space-
craft and satellite communications The proposed GUI is
responsive to the variety of devices and tools an RF engi-
neer would need to accomplish everyday tasks This in-
cludes but is not limited to Smith charts polar plots Bode
diagrams and different types of data files associated with
these graphs or charts The GUI was designed and devel-
oped in MATLAB with Adobe Photoshop used to create a
custom background The user interface was fully tested and
validated for functionality and ability to import plot and
export data for Smith charts polar plots and Bode dia-
grams The GUI also has a toolbar file browser with picture
display custom background and a static textbox that dis-
plays the plotted data
Introduction
Following are the details of the steps that were taken in
order to apply signal processing and data analytics algo-
rithms in the design of a graphical user interface (GUI) for
satellite and RF communications Users may follow these
steps with the specified set of hardware and software to get
the same configuration on the proper RF communications
and device design These projects were implemented under
the supervision of NASA scientists and faculty advisors in
dedicated NASA labs Using lessons learned in this study
and the authorsrsquo previous experience in data visualization
and signal processing research and training relevant labs
were designed to enhance the Computer Engineering pro-
gram at the Virginia State University (VSU) The classes
and labs covered a variety of topics including computer
simulations and networking (Javidi amp Sheybani 2008)
(Sheybani amp Javidi 2007) visualization and virtual labs
(Sheybani amp Javidi 2006) image processing (Sheybani
Garcia-Otero Adnani amp Javidi 2012) game design
(Ouyang Yang Franklin Michaelson Morge et al 2010)
STEM education (Javidi amp Sheybani 2008) (Javidi amp
Sheybani 2010) spike removal (Sheybani Mengshoel amp
Poll 2010) feature detection (Varde Rundensteiner Javidi
Sheybani amp Liang 2007) wireless communications (Hardy
Javidi Denton Campbell amp Sheybani 2007) (Badombena-
Wanta amp Sheybani 2010) network architecture (Sheybani
amp Sankar 2002) optical communications (Sheybani amp Aro-
mdashmdashmdashmdashmdashmdashmdashmdashmdashmdashmdashmdashmdashmdashmdashmdashmdashmdashmdashmdashmdashmdashmdashmdashmdashmdashmdashmdashmdashmdashmdashmdashmdashmdashmdashmdashmdashmdashmdashmdashmdashmdashmdashmdashmdashmdashndashmdashmdashmdashmdash Ehsan Sheybani University of South Florida Giti Javidi University of South Florida
DESIGN AND DEVELOPMENT OF A GUI
FOR RF COMMUNICATIONS
mdashmdashmdashmdashmdashmdashmdashmdashmdashmdashmdashmdashmdashmdashmdashmdashmdashmdashmdashmdashmdashmdashmdashmdashmdashmdashmdashmdashmdashmdashmdashmdashmdashmdashmdashmdashmdashmdashmdashmdashmdashmdashmdashmdashmdashmdashndashmdashmdashmdashmdash
30 INTERNATIONAL JOURNAL OF ENGINEERING RESEARCH AND INNOVATION | V11 N1 SPRINGSUMMER 2019
mdashmdashmdashmdashmdashmdashmdashmdashmdashmdashmdashmdashmdashmdashmdashmdashmdashmdashmdashmdashmdashmdashmdashmdashmdashmdashmdashmdashmdashmdashmdashmdashmdashmdashmdashmdashmdashmdashmdashmdashmdashmdashmdashmdashmdashmdashndashmdashmdashmdashmdash
The GUI is capable of importing three main data types
(CSV) (DAT) and (SNP) files CSV stands for a ldquocomma
separated valuerdquo This is a plain text file that separates each
form of data with a comma Figure 1 shows how CSV files
can be written in either Notepad or Excel and when used
properly they can import and export data from Excel to
MATLAB and vice versa
Figure 1 A CSV file written in Notepad
DAT files are primarily associated with ldquodatardquo They can
be used to store various types of data such as text graphics
attachments in emails and general binary code In most
instances it is best to open a DAT file with the program that
created it Users can also open a DAT file with an editor
such as Notepad to view the contents inside However it is
not guaranteed that all of the contents of the file will be
readable when using an editor to open it SNP files which
are also known as touchtone files have five different file
types (S1P) (S2P) (S3P) (S4P) and (SNP) The differ-
ences between these file types are the number of ports pre-
sent (see Table 1)
Table 1 The number of ports and S-parameters associated with
each file type
The ldquoSrdquo in S-parameters stands for scattering Figure 2
shows examples of how S-parameters come in matrices with
the number of rows and columns equal to the number of
ports These S-matrices allow users to describe complicated
networks as ldquoblack boxesrdquo (Zhou amp Chen 2008)
S-parameters are considered complex because both phase
and magnitude change the network However most micro-
wave and RF engineers are only concerned with the magni-
tude These engineers use S-parameters to refer to the RF
ldquovoltage out vs voltage inrdquo
Figure 2 S-parameter matrices
(S11) Refers to the reflection on port 1 as an inci-
dence of port 1
(S12) Refers to the reflection on port 1 as an inci-
dence of port 2
(S22) Refers to the reflection on port 2 as an inci-
dence of port 2
(S21) Refers to the reflection on port 2 as an inci-
dence of port 1
Since three-port measurements are extremely difficult to
obtain accurately the authors chose to focus only on one-
and two-port systems However the aforementioned meth-
odology would continue for all of the S-parameters present
These data formats are all associated with specific graphs
Figure 3 shows that the first graph the Bode diagram con-
sists of both phase and magnitude plots The magnitude plot
expresses the magnitude of the frequency response gain
either linearly or in decibels The phase plot expresses the
frequency response phase shift in either degrees or radians
(Zhou amp Chen 2008)
Figure 3 A Bode diagram
mdashmdashmdashmdashmdashmdashmdashmdashmdashmdashmdashmdashmdashmdashmdashmdashmdashmdashmdashmdashmdashmdashmdashmdashmdashmdashmdashmdashmdashmdashmdashmdashmdashmdashmdashmdashmdashmdashmdashmdashmdashmdashmdashmdashmdashmdashndashmdashmdashmdashmdash
DESIGN AND DEVELOPMENT OF A GUI FOR RF COMMUNICATIONS 31
File type Number of ports Number of
S-parameters saved
s1p 1 1
s2p 2 4
s3p 3 9
s4p 4 16
sNp N N2
1 1 o n e -p o r tS
1 1 1 2
2 1 2 2
tw o -p o r tS S
S S
1 1 1 2 1 3
2 1 2 2 2 3
3 1 3 2 3 3
th re e -p o r t
S S S
S S S
S S S
mdashmdashmdashmdashmdashmdashmdashmdashmdashmdashmdashmdashmdashmdashmdashmdashmdashmdashmdashmdashmdashmdashmdashmdashmdashmdashmdashmdashmdashmdashmdashmdashmdashmdashmdashmdashmdashmdashmdashmdashmdashmdashmdashmdashmdashmdashndashmdashmdashmdashmdash
mdashmdashmdashmdashmdashmdashmdashmdashmdashmdashmdashmdashmdashmdashmdashmdashmdashmdashmdashmdashmdashmdashmdashmdashmdashmdashmdashmdashmdashmdashmdashmdashmdashmdashmdashmdashmdashmdashmdashmdashmdashmdashmdashmdashmdashmdashndashmdashmdashmdashmdash
32 INTERNATIONAL JOURNAL OF ENGINEERING RESEARCH AND INNOVATION | V11 N1 SPRINGSUMMER 2019
Figure 4 shows the next graph a polar plot This is a two-
dimensional system that plots polar coordinates in a Carte-
sian plane and then draws the polar grid on the plane These
plots sometimes display the voltage reflection coefficient
This plays an important role in helping microwave engi-
neers with impendence matching Polar plots are also simi-
lar to X amp Y plots However instead of plotting data at
X versus Y they plot ldquoRrdquo (magnitude) at an angle between
0 and 360 degrees
Figure 4 A polar plot
Figure 5 shows the last graph a Smith chart The capabil-
ities of this chart are limitless and it is standard in micro-
wave engineering The Smith chart is a plot of complex
reflection overlaid with impendence andor admittance grids
referenced to a 1-ohm characteristic impendence Smith
charts help assist RF engineers in many ways but some of
the most notable tasks include impendence matching dis-
playing antenna impendence and visualizing the impend-
ence of a transmission line There are two types of Smith
charts the classic chart displays only positive real impend-
ences while the more modern chart displays imaginary im-
pendences from negative infinity to positive infinity (Gawa
2006)
Methods and Procedures
To create this GUI MATLAB was used to program
develop the GUI and Adobe Photoshop was used to create
the custom background The hardest part of the project was
writing the code to make the GUI accomplish various tasks
When complications were encountered the authors used
various problem-solving methods The ldquohelprdquo and ldquodocrdquo
functions in MATLAB and MATLAB online forums were
used extensively General steps to implementing this project
were as follows
1 Researching data types and graphs
2 Brainstorming what the end result should look like
3 Creating flow charts
4 Developing program code
5 Ensuring the GUI could accomplish the assigned
tasks
6 Creating a custom background
7 Adding extras (static text display toolbar file brows-
er etc)
8 Cleaning up code for efficiency
9 Finishing poster and final paper
Figure 5 A Smith chart
Results and Discussion
Figure 6 shows the completed GUI One attractive feature
is the backgroundlayout This custom background was cre-
ated in Photoshop and saved as a JPG and then placed on a
panel in MATLAB The background of the GUI needed a
visual appeal or style to it The panels helped increase the
overall intuitiveness of the design This was because it gave
everything its own special area as opposed to the thin and
basic borders MATLAB had to offer The input function
was placed in the toolbar of the GUI From there one can
select and import files located within the file directory The
GUI was programmed to automatically plot the Smith chart
polar plot and Bode diagram when certain data were im-
ported allowing the user to import any file type and still
plot it correctly In addition to these features the input al-
lows the user to import M-files as well Figure 7 shows how
to access the import feature using the path File Open
(Select Data) Open
mdashmdashmdashmdashmdashmdashmdashmdashmdashmdashmdashmdashmdashmdashmdashmdashmdashmdashmdashmdashmdashmdashmdashmdashmdashmdashmdashmdashmdashmdashmdashmdashmdashmdashmdashmdashmdashmdashmdashmdashmdashmdashmdashmdashmdashmdashndashmdashmdashmdashmdash
Figure 6 The completed GUI
Figure 7 GUI file menu
Another feature added to the GUI was the ability to graph
multiple plots By using this feature two sets of data could
be displayed on one plot simultaneously Figure 8 shows
how this can be highly effective in helping RF engineers
compare results
Figure 8 Multiple sets of data plotted on one Smith chart
An export button was also created that allows the user to
export data anywhere within the file directory However
instead of an ldquoopenrdquo button the user would see a ldquosaverdquo
option To access the import feature File Save (Name
amp Location) Save
The Bode diagram section is located in the large rectangu-
lar area of the GUI Here the user can select the number of
options and change how to view the imported data The first
option the user can manipulate is the Y-axis for the magni-
tude and phase plots Under the magnitude option the user
can choose from either linear or log (dB) and under the
phase option the user can choose degrees or radians The
second option to choose is the real and imaginary axis of the
Bode diagram Figure 9 shows how this option allows users
to select the axis most practical for their research
(a) The real axis
(b) The imaginary axis Figure 9 The axes
The interface has checkboxes to allow users to select
which color they would like their graph or specific
S-parameters to appear in This allows users to more easily
distinguish different sets of data In addition to adding color
checkboxes checkboxes to select between solid and dotted
lines were added This also helps users distinguish between
different sets of data To graph random data the ldquoBoderdquo
mdashmdashmdashmdashmdashmdashmdashmdashmdashmdashmdashmdashmdashmdashmdashmdashmdashmdashmdashmdashmdashmdashmdashmdashmdashmdashmdashmdashmdashmdashmdashmdashmdashmdashmdashmdashmdashmdashmdashmdashmdashmdashmdashmdashmdashmdashndashmdashmdashmdashmdash
DESIGN AND DEVELOPMENT OF A GUI FOR RF COMMUNICATIONS 33
mdashmdashmdashmdashmdashmdashmdashmdashmdashmdashmdashmdashmdashmdashmdashmdashmdashmdashmdashmdashmdashmdashmdashmdashmdashmdashmdashmdashmdashmdashmdashmdashmdashmdashmdashmdashmdashmdashmdashmdashmdashmdashmdashmdashmdashmdashndashmdashmdashmdashmdash
mdashmdashmdashmdashmdashmdashmdashmdashmdashmdashmdashmdashmdashmdashmdashmdashmdashmdashmdashmdashmdashmdashmdashmdashmdashmdashmdashmdashmdashmdashmdashmdashmdashmdashmdashmdashmdashmdashmdashmdashmdashmdashmdashmdashmdashmdashndashmdashmdashmdashmdash
34 INTERNATIONAL JOURNAL OF ENGINEERING RESEARCH AND INNOVATION | V11 N1 SPRINGSUMMER 2019
button was added and the ldquoenlargerdquo button was added right
beneath it to display a larger version of the Bode diagram in
a separate window This helps engineers get a closer look at
the data plot in case the view on the GUI is not large
enough The same approach was used for other types of
graphs The control panel is the long rectangular panel lo-
cated on the left side of the GUI Here the user can perform
a of actions such as view data or reset graphs When the
users click on the ldquofilerdquo button they are able to select any
image file within the file directory that can be added to the
list box below to be selected (see Figure 10)
Figure 10 The ldquo filerdquo button and image selector listbox
A ldquodata resultsrdquo static textbox was added to the control
panel This box is used to view the data of the image cur-
rently selected in the list box This allows the user to see the
data being plotted or selected Additionally Figures 11 and
12 show how users can view the data being plotted in Note-
pad by going to the toolbar and selecting the data A reset
button was added to the control panel to allow users to reset
the current graph back to a blank state This button does not
reset all the graphs at once so users can erase one graph at a
time The amplifier button located on the toolbar can be
used to generate a Smith chart After the button is selected
users are taken through a wizard-style setup to select what
type of Smith chart they would like to generate This feature
is extremely useful because it allows users to create differ-
ent types of Smith charts that may be hard to duplicate using
the Smith chart located on the GUI (see Figures 13 and 14)
Figure 11 The ldquodata resultsrdquo static textbox
Figure 12 Data displayed in Notepad after using the ldquodatardquo
function
(a) Step 1
(b) Step 2 Figure 13 The amplifier process
mdashmdashmdashmdashmdashmdashmdashmdashmdashmdashmdashmdashmdashmdashmdashmdashmdashmdashmdashmdashmdashmdashmdashmdashmdashmdashmdashmdashmdashmdashmdashmdashmdashmdashmdashmdashmdashmdashmdashmdashmdashmdashmdashmdashmdashmdashndashmdashmdashmdashmdash
Figure 14 Results of the amplifier generator
The angular average function was also added to the
toolbar Figure 15 shows how this function plots various
polar plots and saves them to the file directory A help menu
was also added to the toolbar Here users can access help
using the GUI through demos and help menus In addition
to finding help users can obtain contact information for the
help desk
Figure 15 The angular average of some random data
Conclusions and Future Work
This project was extremely successful The most prized
accomplishments throughout this entire experience was the
comprehensive set of features for manipulating and display-
ing data and the custom background that worked well with
all of the functions The plan for future work is to take the
code written in MATLAB create an iPhoneiPad-
compatible app that could do the same thing that this GUI
did and enable users to accomplish these tasks from an iPad
or iPhone
Acknowledgments
This research was funded by 2010 and 2011 NASA CI-
PAIR and NASA NSTI Research Grants and supported by
Goddard Space Flight Center and NASA Langley Research
Center We would like to thank the NASA team of collabo-
rators lead by Dr Deshpande and our colleagues at Virginia
State University for their time and thoughtful insights dur-
ing ad hoc research gatherings In addition the authors wish
to extend their gratification to the anonymous reviewers for
their time assistance and patience
References
Badombena-Wanta S amp Sheybani E O (2010) Mobile
communications for development Enabling strategic
and low-cost e-applications for rural and remote areas
Proceedings of Wireless Telecommunications Symposi-
um Piscataway NJ IEEE doi 101109
WTS20105479644
Bonsiepe G (1989) Interpretations of human user inter-
face Visible Language 24(3) 262-285
Hayes F amp Baran N (1989 July) A guide to GUIs Byte
4 250-257
Garcia-Otero S amp Sheybani E (2010) Engineering senior
design course (ldquonew and improvedrdquo) Proceedings of
ASEE Annual Conference Washington DC ASEE
Gawa A (2006) Smith chart Retrieved from http
amanogawacomarchivedocsG-tutorialpdf
Hardy M Javidi G Denton L Campbell Y amp Shey-
bani E (2007) Enhancing research capacity and devel-
oping wireless communications curriculum for students
in computer science and engineering Proceedings of
IEEESECon 2007 Piscataway NJ IEEE doi
101109SECON2007342995
Interface (2019) Business Dictionary Retrieved from
httpwwwbusinessdictionarycomdefinition
interfacehtml
Javidi G amp Sheybani E (2008) Content-based computer
simulation of a networking course An assessment
mdashmdashmdashmdashmdashmdashmdashmdashmdashmdashmdashmdashmdashmdashmdashmdashmdashmdashmdashmdashmdashmdashmdashmdashmdashmdashmdashmdashmdashmdashmdashmdashmdashmdashmdashmdashmdashmdashmdashmdashmdashmdashmdashmdashmdashmdashndashmdashmdashmdashmdash
DESIGN AND DEVELOPMENT OF A GUI FOR RF COMMUNICATIONS 35
mdashmdashmdashmdashmdashmdashmdashmdashmdashmdashmdashmdashmdashmdashmdashmdashmdashmdashmdashmdashmdashmdashmdashmdashmdashmdashmdashmdashmdashmdashmdashmdashmdashmdashmdashmdashmdashmdashmdashmdashmdashmdashmdashmdashmdashmdashndashmdashmdashmdashmdash
mdashmdashmdashmdashmdashmdashmdashmdashmdashmdashmdashmdashmdashmdashmdashmdashmdashmdashmdashmdashmdashmdashmdashmdashmdashmdashmdashmdashmdashmdashmdashmdashmdashmdashmdashmdashmdashmdashmdashmdashmdashmdashmdashmdashmdashmdashndashmdashmdashmdashmdash
36 INTERNATIONAL JOURNAL OF ENGINEERING RESEARCH AND INNOVATION | V11 N1 SPRINGSUMMER 2019
Journal of Computers 3(3) 64-72
Javidi G amp Sheybani E (2010) Making youth excited
about STEM education Journal of Computing Sciences
in Colleges 26(1) 140-147
Norman D (1988) The psychology of everyday things
New York Basic Books
Ouyang Y Yang S Franklin T Michaelson K Morge
S Sheybani EhellipNarayan S (2010) Games sims
and virtual worlds in K-20 STEM education
Proceedings of 21st International SITE Conference
Chesapeake VA Association for the Advancement of
Computing in Education
Sheybani E amp Arora K (1993) Measurement of temporal
coherence of underwater optical scattered field
Microwave and Optical Technology Letters 6(2) 151-
154
Sheybani E amp Sankar R (2002) Integrated network
architecture and signal processing for telemammography
Proceedings of IEEEICASSP Piscatawny NJ IEEE
Sheybani E amp Javidi G (2006) Visualization effects in
virtual engineering labs II Proceedings of IEEEFIE
Piscataway NJ IEEE
Sheybani E (2011) Dimensionality reduction and noise
removal in wireless sensor networks Proceedings of
2011 4th IFIP International Conference on New
Technologies Mobility and Security Piscataway NJ
IEEE doi 101109NTMS20115721151
Sheybani E amp Javidi G (2007) Development and
evaluation of an educational computer network
software Proceedings of IEEESECon 2007
Piscataway NJ IEEE doi 101109
SECON2007342904
Sheybani E O Mengshoel O J amp Poll S (2010)
Removing spikes while preserving data and noise using
wavelet filter banks Proceedings of IEEE Aerospace
Conference Piscataway NJ IEEE doi 101109
AERO20105446821
Sheybani E Garcia-Otero S Adnani F Javidi G amp
Deshpande M (2012) An algorithm for real-time blind
image quality comparison and assessment International
Journal of Electrical and Computer Engineering 2(1)
doi httpdxdoiorg1011591ijecev2i1112
Varde A Rundensteiner E Javidi G Sheybani E amp
Liang J (2007) Learning the relative importance of
features in image data Proceedings of IEEE ICDErsquos
DBRank-07 Piscataway NJ IEEE doi 101109
ICDEW20074400998
Zhou Y amp Chen Y (2008) Properties of mixed-mode S-
parameters Microwave and Optical Technology
Letters 50(11) 2869-2874
Biographies
EHSAN SHEYBANI earned his BS MS and PhD in
electrical engineering from UF FSU and USF respectively
His main research area is applications of communication
signal processing and data analysis He has been involved
in teaching practicing researching and consulting
applications of DSP in technology system analysis and
data sciences for the past 20 years He has a long list of
publications and research grants including projects with
NASA NSF NIH DoD DEd and industry partners
Currently he serves as a faculty member at the University
of South Florida Dr Sheybani may be reached at
sheybaniusfedu
GITI JAVIDI earned her BS from the University of
Central Oklahoma and MS and PhD from the University of
South Florida Her main research area is human computer
interaction data visualization and STEM education She
has been involved in teaching computer science and
conducting research in that area for the past 16 years Dr
Javidi has a long list of publications and research grants
including projects with NASA NSF MSIP and industry
partners Currently she serves as a faculty member at the
University of South Florida Dr Javidi may be reached at
javidiusfedu
A DIAGNOSTIC CLOCK FOR VERIFICATION
OF IMAGE TIME SYNCHRONIZATION mdashmdashmdashmdashmdashmdashmdashmdashmdashmdashmdashmdashmdashmdashmdashmdashmdashmdashmdashmdashmdashmdashmdashmdashmdashmdashmdashmdashmdashmdashmdashmdashmdashmdashmdashmdashmdashmdashmdashmdashmdashmdashmdashmdashmdashmdashndashmdashmdashmdashmdash
Curtis Cohenour Ohio University
Abstract
The GPS clock is a diagnostic tool for measuring time
synchronization errors in aerial surveillance systems Aerial
surveillance systems are used in many civilian and military
applications including law enforcement border security
military situational awareness and military forensics The
goal is to collect images and project them onto the local
terrain such that the images form a map A common exam-
ple is Google Earth Aerial platforms can include drones
fixed or rotary winged aircraft and lighter-than-air vehicles
An aerial surveillance system consists of an imaging system
and a navigation system The navigation system is used to
determine the camera position and attitude known as the
pose which contains the necessary information required for
the projection of the image onto the terrain The images and
pose come from two sources and must be synchronized
Any error in the synchronization will create a projection
error
One method of determining when an image has been cap-
tured is to take a picture of a clock The GPS-synchronized
clock creates a display of the GPS time that can be recorded
in an image By taking images of the clock using the sur-
veillance system each image will have a true time from the
image of the GPS clock and a time derived from the pose If
the synchronization is correct they will match Any differ-
ence between the clock time from the image and the time
from the pose is an error that must be corrected In this pa-
per the author describes the operation testing and accuracy
of the clock Tests were performed using an independent
GPS receiver and a precise time protocol (PTP) server The
resolution of the clock was 1 millisecond (ms) and the ac-
curacy was 01 ms Case studies describe how the clock is
used to discover and subsequently correct timing errors in a
surveillance system
Introduction
Aerial surveillance is used in many civilian and military
applications including law enforcement (Ersoy
Palaniappan Seetharaman amp Rao 2012) border security
and improved situational awareness (Bryant Johnson Kent
Nowak amp Rogers 2008) The goal is to collect images and
project them onto the local terrain such that the image forms
a map A common example is Google Earth (GE) where
for example the image of a road overlays a map of the road
Images are captured by a camera while the pose is most
often generated by an integrated global positioning system
(GPS)inertial measurement unit (IMU) Distortion in the
camera image and errors in the GPSIMU will result in er-
rors in the projection These errors have been studied in
detail and are well documented in the literature for camera
models (Cohenour Price Rovito and van Graas 2015) and
corrected pose data (Cohenour Price Rovito amp van Graas
2015) The assumption was made that the pose would be
synchronized with the image as the author was unable to
find research into projection errors caused by time synchro-
nization errors nor any device to measure these errors It
was also assumed to not always be true that an image is
synced with the pose as will be seen in the case studies
below In this paper the author describes a means of testing
this assumption
The pose by default includes an accurate time If the
image includes the time the two can be compared directly
The GPS clock provides a mechanism for including the time
in the image The clock was used as a diagnostic tool Data
were collected and analyzed and the results used to diag-
nose correct and ultimately verify the synchronization of
the image and the pose The details of the projection are
described in a number of papers for camera models
(Cohenour et al 2015) corrected pose date (Cohenour et
al 2015) and others (Wolf 1974 Tsai 1987 Di amp Li
2004) The projection is based on the camera pose (position
and attitude) that corresponds to the image The pose will
have random errors that generate random errors in projec-
tion For example errors in GE can range from a few centi-
meters to a few meters depending on the aerial survey used
In this current study the focus was on errors that occurred
because the pose data were not captured at the same time
the image was captured
The pose data typically come from an integrated GPS
IMU while the image data come from a camera or a bank of
cameras The pose and image data are placed in one-to-one
correspondence But what happens if there is an extra mes-
sage in the IMU buffer or the image buffer If this happens
then the images will be off by one or more frames GPS is a
four-dimensional positioning system it produces position in
three dimensions and time The position errors are typically
less than 10m (Kaplan 1996) A 10m error in time is
10m300e6ms = 33ns An aerial surveillance camera typi-
cally operates with an integration time of 1ms If an aircraft
is traveling at 85ms then the 1ms is 085 of aircraft travel
mdashmdashmdashmdashmdashmdashmdashmdashmdashmdashmdashmdashmdashmdashmdashmdashmdashmdashmdashmdashmdashmdashmdashmdashmdashmdashmdashmdashmdashmdashmdashmdashmdashmdashmdashmdashmdashmdashmdashmdashmdashmdashmdashmdashmdashmdashmdashmdashmdashmdash
INTERNATIONAL JOURNAL OF ENGINEERING RESEARCH AND INNOVATION | V11 N1 SPRINGSUMMER 2019 37
mdashmdashmdashmdashmdashmdashmdashmdashmdashmdashmdashmdashmdashmdashmdashmdashmdashmdashmdashmdashmdashmdashmdashmdashmdashmdashmdashmdashmdashmdashmdashmdashmdashmdashmdashmdashmdashmdashmdashmdashmdashmdashmdashmdashmdashmdashndashmdashmdashmdashmdash
mdashmdashmdashmdashmdashmdashmdashmdashmdashmdashmdashmdashmdashmdashmdashmdashmdashmdashmdashmdashmdashmdashmdashmdashmdashmdashmdashmdashmdashmdashmdashmdashmdashmdashmdashmdashmdashmdashmdashmdashmdashmdashmdashmdashmdashmdashndashmdashmdashmdashmdash
38 INTERNATIONAL JOURNAL OF ENGINEERING RESEARCH AND INNOVATION | V11 N1 SPRINGSUMMER 2019
The GPS time is available for free with an accuracy much
greater than that needed for image time registration This
provides an opportunity for verifying the synchronization of
the pose and the image If there is an accurate clock in the
image the clock time can be compared with the GPS time
in the pose If they match the synchronization is confirmed
If they do not match then hardware or software modifica-
tions are required
GPS Clock Version 1
The original clock Version 1 was not designed specifi-
cally for testing image synchronization and so was modified
for this purpose The clock displayed the minutes and sec-
onds with six gray code bits (Dewar amp Stevens 2012) and
milliseconds with 10 gray code bits Two additional indica-
tors were also displayed The first indicated a valid display
labeled ldquoGPS Okrdquo the second indicator changed state each
time the GPS receiver time sync pulse was received and was
labeled 1 pulse per second (1PPS) Gray code was used in
the clock because only one bit changes at a time If binary
were used the transition from 7 to 8 which in binary is
0111b to 1000b could be read as 0000b or 1111b which
would be 0 or 15 in decimal Version 1 of the clock had a
number of issues
1 Heavy about 35 pounds
2 Separate gray code displays for minutes seconds
and milliseconds
3 No diagnostics for the GPS receiver
4 No way to test the LEDs and drivers
5 Second update occurs 20ms after the 1PPS
6 LEDs are dim
7 Requires 120V alternating current (AC) power
8 Satellite tracking issues
While 35 pounds is not prohibitively heavy the clock was
awkward hard to carry and sometimes used in areas inac-
cessible to autos The clock did not operate on batteries
which could cause issues in remote locations The separate
gray code displays for minutes seconds and milliseconds
meant that multiple bits would sometimes change at the
same time If the change occurred while the exposure was
being made this would create errors since the second up-
date was 20ms late The milliseconds must be read first and
then the seconds adjusted With no receiver diagnostics
simple problems like a bad antenna cable could not be diag-
nosed There was no way to test for a bad LED or driver
The LEDs were not bright enough for use outdoors in the
sun or with a short 01ms integration time Finally receiver
tracking was optimized for survey work and would not track
satellites that were not clearly visible This led to trouble
getting a solution if the antenna did not have a clear view of
the sky
GPS Clock Version 2
Version 2 of the clock resolved all of the aforementioned
issues (see Figure 1) The clock was lightweight designed
for remote use included diagnostics and worked well in
direct sunlight There were test buttons for the LEDs a liq-
uid crystal display (LCD) and a diagnostic RS-232C port
Figure 1 The GPS clock version 2
The GPS clock version 2 used an Arduino Mega 2560 R3
as the computing platform The Arduino Mega (2017) had
four serial ports 54 digital inputoutput (IO) ports and mul-
tiple hardware and software interrupts The GPS receiver
was manufactured by ITEAD and used a RoyalTek REB-
4216 chip The receiver tracked reflected satellites operated
with a limited view of the sky and could often generate a
solution indoors The receiver was selected because it was
the only GPS Arduino shield (at the time of writing) with a
1PPS output All of the receiver outputs were echoed to an
RS-232 serial port for diagnostics
The LED outputs were buffered generating an intense
white light of 12000 mcd The LEDs could easily be seen
in bright sunshine A felt cover was provided to eliminate
reflections when operating in direct sun The LEDs IO pins
and buffers could be tested using two buttons ldquoall onrdquo and
ldquoall offrdquo The time display was 16 bits with 10 bits dedicat-
ed to the fraction All 16 bits were a single gray code word
This complicated manual decoding but ensured that no more
than one bit changed at a time The fraction was 10 bits
therefore the resolution was 2-12 11024th of a second or
09766 ms The resolution was approximately 1ms which
was adequate for an airborne imaging system that typically
has a minimum exposure time of 1 or 2ms
mdashmdashmdashmdashmdashmdashmdashmdashmdashmdashmdashmdashmdashmdashmdashmdashmdashmdashmdashmdashmdashmdashmdashmdashmdashmdashmdashmdashmdashmdashmdashmdashmdashmdashmdashmdashmdashmdashmdashmdashmdashmdashmdashmdashmdashmdashndashmdashmdashmdashmdash
GPS time was kept in seconds of the week starting with 0
at 00000 coordinated universal time (UTC) on Sunday
The six most significant bits of the LED display showed the
GPS time modulo 64 There are 86400 seconds in a day so
8640064 is 1350 with a remainder of zero This happy
coincidence ensured that there would be a continuous rollo-
ver over each day and each week The aerial surveillance
system was assumed to have a time error of less than
32 seconds This could be verified with a single frame of
data and a watch Assuming that the system met this re-
quirement the error would be at most a few seconds and a
modulo 64 second clock would be adequate
An LCD was provided on the clock The LCD displayed
the clock version validinvalid the number of satellite vehi-
cles (SVs) tracked the leap second and a graphic indicating
serial data received The number of SVs tracked was a key
piece of troubleshooting data as was the serial data graphic
The GPS receiver sent out six National Marine Electronics
Association (NMEA) messages The Arduino decoded two
of these messages to extract the time of day validinvalid
and the number of SVs All of the messages were echoed to
a serial port on the left side of the clock for user diagnostics
Finally the clock was lightweight only 35 pounds
8x12x3 with a carry handle and powered by six AA
batteries or an AC adapter The clock and accessories were
shipped in a small Pelican case
Hardware and Software
Figure 2 shows a hardware block diagram of the GPS
clock The ITEAD GPS receiver sends serial data to the
Arduino Mega via serial port 2 The baud rate is 9600 with
eight data bits one stop bit and no parity These data are
converted to RS-232 signal levels using a MAX-232-CPE
and outputted to a 9-pin d-shell serial port The 1PPS signal
is routed to the Arduino on pin 2 interrupt 0 The Arduino
processes the data and outputs to 18 LEDs which are con-
nected to three SN74LS07 hex buffers and drivers with
open-collector high-voltage outputs (Texas Instruments
2016) The LEDs are connected to the battery or AC adapter
and do not draw power through the Arduino voltage regula-
tor There are 16 LEDs for the time display one for the
1PPS and one for the valid indicator The Arduino drives a
backlit LCD display There is an analog contrast adjustment
for the LCD
There are four button inputs to the Arduino lamp test
buttons ldquoall onrdquo and ldquoall offrdquo and leap second ldquouprdquo and
ldquodownrdquo The lamp test buttons override the normal LED
outputs and verify the Arduino output the buffer and the
LED Not shown is the power A switched barrel jack dis-
connects the batteries when the AC adapter is connected
An on-off switch connects the power to the clock The clock
can operate for about two hours on six AA batteries An
SMA female connector is provided on the left side of the
clock for connection to an amplified 33V GPS antenna
Figure 3 shows a software block diagram for the clock
which is interrupt-driven The 1PPS event sets the seconds
of the day based on the input from the serial parser and ze-
ros out the 11024-second timer This starts the
11024-second counter at zero on the 1pps event From here
on the 11024-second clock increment will be referred to as
1 ms for brevity
Figure 2 GPS clock version 2 hardware block diagram
Figure 3 Software block diagram of the GPS clock
The ITEAD receiver generates six NMEA output messag-
es The serial parser reads and parses the recommended
minimum data (RMC) and global positioning system fixed
data (GGA) messages other messages are not parsed to
reduce processor load All messages are passed via hard-
ware to the diagnostic serial port The RMC message is
parsed to extract the UTC time and the valid flag The GGA
message provides the number of SVs in the solution The
seconds of the day (SOD) is computed based on the hour
minutes and seconds in the RMC message The RMC mes-
sage completes 750 ms into the seconds and is one second
old at the time of the next 1PPS The leap seconds are added
to the SOD to convert UTC SOD to GPS SOD The GPS
SOD is all that is needed for the clock because the seconds
in a day 86400 is an even multiple of 64 During the 1PPS
event if the time is valid the clock is reset to the (SOD
GPS + 1) modulo 64 the milliseconds is set to zero and the
millisecond timer timer 2 is set to zero
mdashmdashmdashmdashmdashmdashmdashmdashmdashmdashmdashmdashmdashmdashmdashmdashmdashmdashmdashmdashmdashmdashmdashmdashmdashmdashmdashmdashmdashmdashmdashmdashmdashmdashmdashmdashmdashmdashmdashmdashmdashmdashmdashmdashmdashmdashndashmdashmdashmdashmdash
A DIAGNOSTIC CLOCK FOR VERIFICATION OF IMAGE TIME SYNCHRONIZATION 39
mdashmdashmdashmdashmdashmdashmdashmdashmdashmdashmdashmdashmdashmdashmdashmdashmdashmdashmdashmdashmdashmdashmdashmdashmdashmdashmdashmdashmdashmdashmdashmdashmdashmdashmdashmdashmdashmdashmdashmdashmdashmdashmdashmdashmdashmdashndashmdashmdashmdashmdash
mdashmdashmdashmdashmdashmdashmdashmdashmdashmdashmdashmdashmdashmdashmdashmdashmdashmdashmdashmdashmdashmdashmdashmdashmdashmdashmdashmdashmdashmdashmdashmdashmdashmdashmdashmdashmdashmdashmdashmdashmdashmdashmdashmdashmdashmdashndashmdashmdashmdashmdash
40 INTERNATIONAL JOURNAL OF ENGINEERING RESEARCH AND INNOVATION | V11 N1 SPRINGSUMMER 2019
The 11024 event is tied to timer 2 The timer pre-scaler is
set to 64 The clock is 16 MHz so the timer counts at 250
KHz The counter should time out at 2500001024-1=
2431406 The timer is set to 243 and the remainder
01406 is accumulated until it is greater than 10 When this
happens one is subtracted from the accumulator and the
timer is set to 244 In this way the clock remains accurate
If this were not done then the last millisecond 1023 would
be over four milliseconds long This is further complicated
by the inaccuracy of the Arduino clocks The clock was
tested with three different Arduinos to investigate the varia-
bility in the oscillators The average number of microsec-
onds per 1PPS was 1e6 for a perfect oscillator The results
for the three units tested were 992592 1001216 and
1000002 The GPS 1PPS had an error of less than 1μs so
it could be used to calibrate the Arduino internal oscillator
To compensate for the oscillator errors the average value of
the microseconds per 1PPS was divided by four and used in
the above calculation instead of 250000
The REB 4216 receiver does not reveal the leap second
To convert from UTC to GPS the leap second is needed
The current leap second is 18 as of August 2017 and can
change twice per year during the first week epoch in Janu-
ary and the first week epoch in July The current leap sec-
ond is officially available on line at https
wwwnavcenuscggov but is more easily found by doing a
Google search for ldquoGPS leap secondsrdquo The conversion is
given by Equation 1[IS-GPS-200]
GPS = UTC + Leap seconds (1)
where GPS is the seconds of the week in GPS time UTC is
the seconds of the week in UTC and Leap seconds is the
integer number of leap seconds
The leap second was stored in a EEPROM and manipulat-
ed by two buttons ldquouprdquo and ldquodownrdquo When the leap second
was changed it was stored in the EEPROM During startup
the EEPROM was read to initialize the leap seconds The
LED test buttons were implemented in the 11024 event
During this event the seconds and milliseconds were com-
puted as well as the status of the valid and 1PPS LEDS The
seconds and milliseconds were converted to gray code If
neither LED test button was pushed the data were placed on
the Arduino IO ports If the ldquoall onrdquo button was pressed the
IO ports were set to on if ldquoall offrdquo was pressed then the IO
ports were set to off In this way the IO ports the buffers
and the LEDs were tested Data displayed on the LCD in-
cluded the GPS clock software revision on the top line and
key data on the second line The second line of the display
included ldquovalrdquoldquoinvrdquo to indicate the status of the clock the
number of satellites the number of leap seconds and a ro-
tating slash to indicate that the GPS messages were being
received
Verification
Accuracy of the GPS clock was verified in a number of
ways First the 1PPS signal was checked against a Novatel
survey receiver second a precise time protocol-enabled
camera (Kaplan 1996) was used and third a Novatel re-
ceiver was used Figure 4 shows a histogram of the error
collected from 31521 images
Figure 4 Histogram of clock errors (31521 measurements)
The first test conducted was to determine the accuracy of
the 1PPS interrupt A NovAtel PWRPAK-4-3151W PN
01016783 was connected to an AeroAntenna AT575-9W-
TNCF-000-05-26-NM amplified antenna The 1PPS was
connected to the Arduino interrupt 0 IO pin 2 The interrupt
routine was set up to toggle the 1PPS LED on the Arduino
The Arduino output was connected to the NovAtel Event1
input The NovAtel ldquoMarkTime OnNewrdquo log (Novatel
2015) was used to determine the interrupt delay This test
showed a delay of 11 micros which is the time required to pro-
cess the interrupt Figure 5 shows how the second and third
tests were set up Table 1 provides descriptions of the com-
ponents
The camera was powered using power over Ethernet
(POE) Communications and control of the camera was by
gigabyte Ethernet A PTP (IEEE 2008) time server was
connected to the camera to provide microsecond-level abso-
lute time to the camera In this configuration a console ap-
plication running on the laptop triggered and recorded 10
images about 08 seconds apart Each image was saved us-
ing the PTP time in microseconds The PTP time is Temps
Atomique International (TAI) seconds since January 1
-02 0 02 04 06 08 1 120
50
100
150
200
250
300
NOV Time Error (ms)
Co
un
t
mdashmdashmdashmdashmdashmdashmdashmdashmdashmdashmdashmdashmdashmdashmdashmdashmdashmdashmdashmdashmdashmdashmdashmdashmdashmdashmdashmdashmdashmdashmdashmdashmdashmdashmdashmdashmdashmdashmdashmdashmdashmdashmdashmdashmdashmdashndashmdashmdashmdashmdash
1970 (McCarthy amp Seidelmann 2009) TAI is always ahead
of GPS by 19 seconds (Time Service Dept nd) and can
be determined using Equation 2
GPS = PTP + 19s (2)
where PTP is seconds since January 1 1970
Figure 5 Test configuration for the clock
Table 1 Equipment used for clock testing
PTP time synchronization in the camera is known to be
within 2 μs (Allied Vision 2016) If the PTP time from the
camera is correct then this would be all that is required to
validate the clock readings to the millisecond To check the
camera PTP time the sync 1 output of the camera was tied
to the Event 1 input of the Novatel Using MATLAB the
console app was executed and the file namesPTP times
were extracted The Novatel logs were collected and the
time extracted Each image was read and the first 20 bytes
of the image were replaced with the GPS time from the No-
vatel receiver This was done 10 images at a time to ensure
that there were no buffering errors Later when processing
the images the PTP time was extracted from the file name
and the GPS time was extracted from the image
Other items in the test setup included a NetGear Ethernet
switch and Cat 5E Ethernet cables This set up was used for
all of the results in the following section Tests were con-
ducted with the lens aperture at max an exposure time of
01 ms and a gain of 35 dB This produced images having
an exposure much shorter than the resolution of the clock
Figure 6(a) shows that the LEDs and clock were clearly
visible Figure 6(a) also shows image one of 31521 images
used to verify the clock accuracy The images were pro-
cessed automatically using MATLAB First the location of
the LEDs was captured This was done by displaying image
one and clicking on each of the 18 LEDs The location of
the LEDs was saved and indicated by circles in Figure 6(a)
Once this was completed the LED locations could be used
for all images as long as the clock and camera were not
moved
(a) The first of 31521 images (b) Mask for bit G15
used for clock verification
Figure 6 The LEDs and clock are clearly visible
For each image the LEDs are read as follows a mask is
generated for each LED position with a value of one within
a radius of pixels Figure 6(b) shows the mask for LED
G15 The mask and the image are multiplied element by
element and the results are summed This gives a low value
for an LED that is off and a high value for an LED that is
on This is repeated for each of the 16 gray code LEDs the
1PPS and the valid LED A threshold value is chosen mid-
way between on and off to differentiate the two states In
this way the 16 gray code bits are extracted This is done
for each image The gray code values for each image are
converted to seconds using Equation 3 Note that the clock
reading is by definition modulo 64
(3)
where Gry is the clock reading in gray code gry2int()
converts in gray code to an integer and 1024 converts
clock increments to seconds Additional MATLAB scripts are available from the author (see contact information
included with this paper)
Item Description
Camera Allied Vision Manta G-319B
Novatel Novatel PWRPAK-4-3151W PN 01016783
PTP Server Time Machine TM2000A
Switch NetGear ProSAFE GS108
Antennas Generic Magnetic Base L1 Patch Antenna
g ry 2 in t(G ry ) =
1 0 2 4M o d G P S
mdashmdashmdashmdashmdashmdashmdashmdashmdashmdashmdashmdashmdashmdashmdashmdashmdashmdashmdashmdashmdashmdashmdashmdashmdashmdashmdashmdashmdashmdashmdashmdashmdashmdashmdashmdashmdashmdashmdashmdashmdashmdashmdashmdashmdashmdashndashmdashmdashmdashmdash
A DIAGNOSTIC CLOCK FOR VERIFICATION OF IMAGE TIME SYNCHRONIZATION 41
mdashmdashmdashmdashmdashmdashmdashmdashmdashmdashmdashmdashmdashmdashmdashmdashmdashmdashmdashmdashmdashmdashmdashmdashmdashmdashmdashmdashmdashmdashmdashmdashmdashmdashmdashmdashmdashmdashmdashmdashmdashmdashmdashmdashmdashmdashndashmdashmdashmdashmdash
mdashmdashmdashmdashmdashmdashmdashmdashmdashmdashmdashmdashmdashmdashmdashmdashmdashmdashmdashmdashmdashmdashmdashmdashmdashmdashmdashmdashmdashmdashmdashmdashmdashmdashmdashmdashmdashmdashmdashmdashmdashmdashmdashmdashmdashmdashndashmdashmdashmdashmdash
42 INTERNATIONAL JOURNAL OF ENGINEERING RESEARCH AND INNOVATION | V11 N1 SPRINGSUMMER 2019
The MATLAB code for this conversion is decGPS=gray2int(Gry)
ModGPS=decGPS1024
When in use it was assumed that the clock was correct so
the error was the time stampmdashthe GPS clock time in the
image The time stamp error can be computed using Equa-
tion 4
ModTimeStamp = mod(TimeStamp64)
Err = ModTimeStamp ‒ ModGPS (4)
if (Err lt -32) Err = Err + 64
where TimeStamp is the time stamp in GPS time mod(a b)
returns the remainder of ab and Err is the clock error
Note that the ldquoifrdquo statement compensates for events where
the ModGPS and the ModTimeStamps occur on opposite
sides of the 64 second boundary
Using the setup above the clock distribution was 05 ms
plusmn03 ms as seen in the histogram of Figure 4 The camera
was triggered asynchronously so that the errors should form
a uniform error distribution in Figure 4 Theoretically the
distribution of the error should be a uniform distribution
with a mean of 05 ms and standard deviation of 028 ms
(Miller amp Freund 1977) which is very close to the meas-
ured values of 05 for the mean and 03 for the standard de-
viation The clock resolution was 1 ms while the actual
accuracy is better than 01 ms To understand why examine
what happens to images taken at various times A through D
in Figure 7 The clock reads 0000 in the range 0000 to
0001 and 0001 in the range from 0001 to 0002 An im-
age taken at B will have a time stamp of 00011 but the
clock will read 0001 and the error is 01 ms The same
applies for C where the error is 09 ms The image taken at
A has a time stamp of 000047 and the clock reads 0000 so
the error is 047 ms All of the errors will map into the range
of 0 to 1 ms
Figure 7 Timeline showing various image capture times
Now consider the image at D This time stamp is 0001
but the clock could be in transition and read either 0000 or
0001 If the clock reads 0000 then the time error for D is
1 ms If the cock reads 0001 then the time error reads 0 So
the image at D could have an error of 0 or 1 ms The same
argument can be made for the image taken at E This is il-
lustrated in Figure 8 Note that most of the images occur
between B and C Since they are random in time they map
to a uniform distribution with an error between 0 and 1 ms
The points at D and E may map to 0 ms plusmn a few microsec-
onds or to 1 ms plusmn a few microseconds The result is the plot
in Figure 4 The camera integration time is 01 ms for the
data collected in Figure 4 This results in a few observations
in the range of 100 to 107 ms
Figure 8 Mapping of image times to error space
The GPS clock has an LED to indicate that the clock is
valid The clock may go to invalid if the GPS solution is
corrupt due to jamming an antenna failure poor visibility
of the sky or other reasons If this happens the valid LED
should turn off To test this the clock was allowed to sync
to GPS time Data recording was started and the GPS an-
tenna was disconnected After a period of time the antenna
connector was reconnected and the clock synced The data
were checked and the invalid state started almost immedi-
ately when the antenna was disconnected When the antenna
was reconnected the time recovered and the clock returned
to valid All measurements with the valid indicator on were
correct For accuracy the imaging system should be set for
a short integration time The recommended exposure time is
01 ms to extract maximum accuracy from the clock This
can usually be achieved by setting the integration time
01 ms and increasing the gain The clock does not have to
be visible as long as the LEDs can be seen in the image An
underexposed image will work because the LEDs are very
bright If a longer exposure time is used the results will be
smeared but the results are still meaningful Some systems
using webcams for example do not allow the user to con-
trol the exposure This is illustrated in the two tests that fol-
low
Two tests were performed using 1 ms and 2 ms integra-
tion times For a 1 ms exposure with 1661 images the
mean is 67 μs and the standard deviation is 06 ms or
00 plusmn 06 ms For a 2 ms exposure with 3701 images the
mean is -04ms with a standard deviation of 10 ms
mdashmdashmdashmdashmdashmdashmdashmdashmdashmdashmdashmdashmdashmdashmdashmdashmdashmdashmdashmdashmdashmdashmdashmdashmdashmdashmdashmdashmdashmdashmdashmdashmdashmdashmdashmdashmdashmdashmdashmdashmdashmdashmdashmdashmdashmdashndashmdashmdashmdashmdash
Case Studies
Version 1 of the clock was developed in 2009 and used to
troubleshoot fix and ultimately verify a number of sys-
tems Case studies are provided here to give the reader an
appreciation of how time sync errors can arise and how the
clock can be used to investigate and correct the any syn-
chronization errors Seven case studies are listed in Table 2
Some of these cases were investigated thoroughly and docu-
mented in publications in others the results were transmit-
ted and results were never communicated to the author
Table 2 Table of case studies using the clock
Case 1 The Novatel ldquoInsPva OnMarkrdquo log was used but
this log was not supported by Novatel There was an inter-
polation error that returned the positon and attitude at the
wrong time The correct log is the ldquoMark1Pva OnNewrdquo log
There is a -10 ms error in the ldquoInsPva OnMarkrdquo log that
reaches as high as 50 ms near the one-second boundary
This indicates that perhaps the Novatel has housekeeping
chores on the one-second boundary that create issues with
the unsupported log
Case 2 The system was switched to use the ldquoMark1Pva
OnNewrdquo log This created additional problems with yaw
errors from IMU Knowing the time tags were correct led to
an examination of the errors Based on this test it became
clear that the ldquoInsPva OnMarkrdquo log has errors that cannot be
explained Novatel was contacted and the user was advised
to do a firmware update This corrected the error
Case 3 A nadir (down looking) camera system mounted on
the Ohio University Avionics Center DC-3 was tested using
the clock The system had zero time errors and no modifi-
cations were required
Case 4 Two independent nadir camera systems were
mounted on the Ohio University Avionics Center DC-3
Both of these systems used Allied Vision PTP cameras
Both systems were tested using the clock and found to have
correct time tags
Case 5 A number of the Version 1 clock shortcomings were
revealed A 30 frames per second (FPS) with a long lens
was tested using Version 1 of the clock It was required to
position the clock outside in order for the camera to capture
the entire clock in the image The sun was so bright that the
LEDs could not be read Folding tables and sawhorses were
used to provide shade so that the clock could be read The
clock was placed in an area that was surrounded by build-
ings that obscured portions of the sky The GPS receiver
lost lock many times and slowed the data collection Once
usable data were obtained from the clock it was discovered
that the images were off by 1 to 3 frames The system hard-
ware included a divide-by-four circuit in the line between
the camera sync and the Novatel mark input The error oc-
curred because the divide-by-four counter was not reset and
not synced with the software The software system was re-
configured to reset the divide-by-four circuit when imaging
was started This resulted in synced images
Case 6 An imaging system similar to that described in
Cohenour et al (Camera 2015) and Conehour et al
(Corrected 2015) recorded at a rate of 3 frames per second
There was a time tag error of 016 The camera sync and the
Novatel mark input were driven by an external time source
The error was frac12 of the frame rate One possible source of
the error could be that the camera was triggered on the posi-
tive edge of the signal and the Novatel was triggered on the
negative edge Changing edge sensitivity of either the cam-
era or the Novatel is trivial The author did not receive any
feedback on the resolution of this issue This is a good ex-
ample of the utility of the clock an easily correctable prob-
lem but difficult to isolate without the clock
Case 7 A forward-looking camera system was installed on
the Ohio University Avionic Engineering Center Beechcraft
Barron The system included both IR and visible spectra
cameras A breadboard prototype of the Version 2 clock
was used to test the time tagging of the visible camera The
LEDs used on the clock are not suitable for IR
The cameras were triggered by a Novatel 1PPS signal
The software written for Microsoft Windows received No-
vatel position and attitude data as well as image data The
visible camera was tested and found to be off by 1 second
Software changes were made to correct this problem The
system was retested and shown to be correct Flight data
were recorded using the system When the images were
projected there were large time synchronization errors The
data for a turn were analyzed to determine if the images
matched the pose data The horizon was tracked in a number
of images to estimate the roll The estimated roll from the
Case Description
1 Incorrect Novatel Log
2 Novatel Log Error
3 DC 3 Camera System
4 DC 3 PTP System
5 Hi Rate Data Collection
6 12 frame error
7 Forward Looking EO and IR
mdashmdashmdashmdashmdashmdashmdashmdashmdashmdashmdashmdashmdashmdashmdashmdashmdashmdashmdashmdashmdashmdashmdashmdashmdashmdashmdashmdashmdashmdashmdashmdashmdashmdashmdashmdashmdashmdashmdashmdashmdashmdashmdashmdashmdashmdashndashmdashmdashmdashmdash
A DIAGNOSTIC CLOCK FOR VERIFICATION OF IMAGE TIME SYNCHRONIZATION 43
mdashmdashmdashmdashmdashmdashmdashmdashmdashmdashmdashmdashmdashmdashmdashmdashmdashmdashmdashmdashmdashmdashmdashmdashmdashmdashmdashmdashmdashmdashmdashmdashmdashmdashmdashmdashmdashmdashmdashmdashmdashmdashmdashmdashmdashmdashndashmdashmdashmdashmdash
mdashmdashmdashmdashmdashmdashmdashmdashmdashmdashmdashmdashmdashmdashmdashmdashmdashmdashmdashmdashmdashmdashmdashmdashmdashmdashmdashmdashmdashmdashmdashmdashmdashmdashmdashmdashmdashmdashmdashmdashmdashmdashmdashmdashmdashmdashndashmdashmdashmdashmdash
44 INTERNATIONAL JOURNAL OF ENGINEERING RESEARCH AND INNOVATION | V11 N1 SPRINGSUMMER 2019
images was correlated with the IMU roll The time error of
the images was determined to be 14 seconds This shows
how buffering or other issues can cause problems The pro-
ject was shelved due to a failure of the IR camera and the
issue was never resolved
Conclusions
A GPS synchronized clock was described The purpose of
the clock was to measure time synchronization errors in an
aerial surveillance system Using the clock a precise GPS
time could be extracted from the image The image time
was compared to the pose time to determine the time error
Any time errors will create projection errors With this in-
formation corrective action can be taken The clock de-
scribed in this paper was Version 2 All of the shortcomings
in Version 1 were corrected The clock is lightweight in-
tensely bright powered by AC or batteries and includes test
features and diagnostics A detailed analysis of the timing
error between the clock and a reference receiver showed
that the resolution of the clock was 1 ms while the accuracy
was better than 01 ms If the exposure time increased the
clock was still valid but the resolution was reduced
The camera integration time impacted the clock readings
If the camera integration was longer than 1 ms the least
significant bit would appear as on with a 50 duty cycle
This was tested and the clock was still valid but the resolu-
tion was reduced For best results the minimum integration
time that allows reading the LEDs should be used A num-
ber of case studies were used to illustrate the utility of the
clock These case studies illustrate the types of errors that
can be encountered and how corrective action can be taken
once the errors are discovered The clock presented here
was for visible light There was also a need for time verifi-
cation of infrared (IR) image data The clock could easily be
converted to cover shortwave IR images simply by using IR
LEDs This becomes more complex at longer wavelengths
A number of schemes are being considered for wavelengths
up to 8 microm Additional information about the clock and on-
going work is available from the author
References
Allied Vision (2016) Application note IEEE 1588
precision time protocol prosilica GT GC and manta
cameras Vancouver British Columbia Canada Allied
Vision
Arduino (2017) Arduino Mega 2650 Retrieved from
httpwwwarduinoorgproductsboardsarduino-mega-
2560
Bryant M Johnson P Kent B M Nowak M amp
Rogers S R (2008) Layered sensing Its definition
attributes and guiding principles for AFRL strategic
technology development Wright-Patterson Air Force
Base OH Sensors Directorate Air Force Research
Laboratory
Cohenour C Price R Rovito T amp van Graas F (2015)
Camera models for the Wright Patterson Air Force
Base (WPAFB) 2009 wide area motion imagery
(WAMI) data set IEEE Aerospace amp Electronic
Systems Magazine 30(6) 4-15
Cohenour C Price R Rovito T amp van Graas F (2015)
Corrected pose data for the Wright Patterson Air Force
Base (WPAFB) 2009 wide area motion imagery
(WAMI) data set SPIE Journal of Applied Remote
Sensing 9(1) 4-15
Dewar M amp Stevens B (2012) Ordering block designsmdash
Gray codes universal cycles and configuration New
York Springer
Di K amp Li R (2004) CAHVOR camera model and its
photogrammetric conversion for planetary applications
Journal of Geophysical Research 109(E04004) 1-9
Ersoy I Palaniappan K Seetharaman G S amp Rao R
M R (2012) Interactive target tracking for persistent
wide-area surveillance Interactive target tracking for
persistent wide-area surveillance Proceedings of SPIE
Conference on Geospatial InfoFusion II Bellingham
WA SPIE doi 10111712920815
IEEE (2008) IEEE standard for a precision clock
synchronization protocol for networked measurement
and control systems Retrieved from http
standardsieeeorg
Kaplan E D (1996) Understanding GPS Principles and
applications Boston Artech House
McCarthy D amp Seidelmann K (2009) Time From earth
rotation to atomic physics Weinheim Germany Wiley-
VCH
Miller I amp Freund J (1977) Probability and statistics for
engineers Englewood Cliffs NJ Prentice-Hall
NovAtel (2015) OEM6 family firmware reference manual
OM-20000129 rev 8 Calgary Alberta Canada
NovAtel
Texas Instruments (2016) SN74LS07 hex buffers and
drivers with open-collector high-voltage outputs
Dallas Texas Instruments
Time Service Dept (nd) Leap seconds Retrieved from
httptychousnonavymilleapsechtml
Tsai R Y (1987) A versatile camera calibration technique
for high-accuracy 3d machine vision metrology using
off-the shelf tv cameras and lenses IEEE Journal of
Robotics and Automation RA-3(4) 323-344
Wolf P R (1974) Elements of photogrammetry New
York McGraw-Hill
mdashmdashmdashmdashmdashmdashmdashmdashmdashmdashmdashmdashmdashmdashmdashmdashmdashmdashmdashmdashmdashmdashmdashmdashmdashmdashmdashmdashmdashmdashmdashmdashmdashmdashmdashmdashmdashmdashmdashmdashmdashmdashmdashmdashmdashmdashndashmdashmdashmdashmdash
Biography
CURTIS COHENOUR is an assistant professor in the
Ohio University Engineering Technology and Management
Department He received his BS degree from West Virginia
Institute of Technology in 1980 MS degree from Ohio Uni-
versity in 1988 and PhD in electrical engineering from
Ohio University in 2009 He is a registered professional
engineer in West Virginia and Ohio Dr Cohenour has
worked in industry as an electrical engineer in the areas of
control systems automation and power He joined Ohio
University in 2002 as a research engineer working for the
Ohio University Avionics Engineering Center He has
worked on projects covering a wide variety of avionics and
navigation systems such as the instrument landing system
microwave landing system distance measuring equipment
LAAS WAAS and GPS His recent work has included
research with the Air Force Research Laboratory in Dayton
Ohio aimed at understanding and correcting image geo-
registration errors from a number of airborne platforms Dr
Cohenour may be reached at cohenourohioedu
mdashmdashmdashmdashmdashmdashmdashmdashmdashmdashmdashmdashmdashmdashmdashmdashmdashmdashmdashmdashmdashmdashmdashmdashmdashmdashmdashmdashmdashmdashmdashmdashmdashmdashmdashmdashmdashmdashmdashmdashmdashmdashmdashmdashmdashmdashndashmdashmdashmdashmdash
A DIAGNOSTIC CLOCK FOR VERIFICATION OF IMAGE TIME SYNCHRONIZATION 45
ASSESSING THE EFFECTIVENESS OF AN AUTOMATIC
DOOR LOCK SYSTEM BY DISCHARGE DETECTION
TO LOWER CASUALTIES DURING AN ACADEMIC
ACTIVE SHOOTER INCIDENT mdashmdashmdashmdashmdashmdashmdashmdashmdashmdashmdashmdashmdashmdashmdashmdashmdashmdashmdashmdashmdashmdashmdashmdashmdashmdashmdashmdashmdashmdashmdashmdashmdashmdashmdashmdashmdashmdashmdashmdashmdashmdashmdashmdashmdashmdashndashmdashmdashmdashmdash
Jae Yong Lee Purdue University James Eric Dietz Purdue University
Abstract
The 2018 Stoneman Douglas High School (Parkland)
shooting emphasized the importance of testing active shoot-
er responses for both first-responder communities and the
general public Since the 1999 Columbine massacre the
preparedness for active shooter incidents (ASIs) included
aggressive police tactical responses to neutralize the shoot-
ing threat Currently the runhidefight response for un-
armed individuals has been implemented as part of the ac-
tive shooter response for both the public and private sectors
However despite the RHFrsquos nationwide implementation
there are few studies in the literature to support the effec-
tiveness of RHF Additionally modeling a scenario similar
to the Parkland shooting suggests that the application of
RHF without situational awareness of the shooterrsquos location
could cause higher casualty rates by an average of more
than 126 individuals
In this study the authors compared the casualty rates of
two models The first model consisted only of hide (shelter-
in-place) and run (evacuate) The second model applied the
first modelrsquos components with the automatic door lock sys-
tem which was triggered by discharge detection To ex-
clude human participation and to prevent physiological and
psychological impact agent-based modeling (ABM) was
used to recreate a one-story academic infrastructure with 26
lecture halls and three exits containing 600 unarmed indi-
viduals The flexibility of ABM allows multiple iterations
while manipulating various parameters The ABM approach
in active shooter research also eliminates human error and
logistical issues The outcome of this study evaluates the
effectiveness of an automated door lock system based on
firearm discharge detection with a campus-wide alert sys-
tem to conduct lockdown
Introduction
The term active shooter incident (ASI) may be a familiar
term for the general public Federal Bureau of Investigation
(2016) statistics suggest that the number of active shooter
incidents has risen from 74 (2000-2008) to 191 (2009-
2016) incidents per year Additionally 456 of the active
shooter incidents occur in areas of commerce and 244 in
educational institutions Finally 60 of ASIs were termi-
nated prior to the arrival of law enforcement The increasing
rate of active shooter incidents in the areas of commerce
and educational institutions with short duration challenges
the first responder and the civilian communities to mitigate
such incidents
Law enforcement communities have applied mitigation
tactics such as unified incident command system (FEMA
2017) hosting school resource officers (Scott amp Schwartz
2014) and the formation of contact teams (Scott amp
Schwartz 2014) to mitigate such incidents The most com-
mon ASI response for the civilian population in both private
and public sectors was ldquorunhidefightrdquo (RHF) (City of Hou-
ston 2012) The RHF response was created in 2012 by the
City of Houston under the Federal Emergency Management
Agencyrsquos grant Yet despite the nationwide application of
RHF there is a lack of literature supporting the effective-
ness of RHF to lower casualties during ASIs Additionally
RHF cannot be applied in areas where the unarmed individ-
uals are incapable of fighting the active shooter such as
kindergarten or elementary schools In this study the au-
thors examined the casualty rates of two models The first
model represented an academic infrastructure without any
preventative system The second model applied an automat-
ed door lock system to the first model which was initiated
by the active shootersrsquo first discharge A campus-wide lock-
down was automatically conducted among unarmed individ-
ual agents The door lock system only prevented entry to the
lecture hall which allowed individuals to evacuate the lec-
ture hall Only run and hide were implemented in both mod-
els since they assumed that the majority of unarmed indi-
vidual agents were either kindergarten or elementary school
students who were limited in their ability to fight the shoot-
er
Agent-Based Model
AnyLogic software consists of three major components
discrete event agent-based and system dynamic methods
mdashmdashmdashmdashmdashmdashmdashmdashmdashmdashmdashmdashmdashmdashmdashmdashmdashmdashmdashmdashmdashmdashmdashmdashmdashmdashmdashmdashmdashmdashmdashmdashmdashmdashmdashmdashmdashmdashmdashmdashmdashmdashmdashmdashmdashmdashndashmdashmdashmdashmdash
46 INTERNATIONAL JOURNAL OF ENGINEERING RESEARCH AND INNOVATION | V11 N1 SPRINGSUMMER 2019
mdashmdashmdashmdashmdashmdashmdashmdashmdashmdashmdashmdashmdashmdashmdashmdashmdashmdashmdashmdashmdashmdashmdashmdashmdashmdashmdashmdashmdashmdashmdashmdashmdashmdashmdashmdashmdashmdashmdashmdashmdashmdashmdashmdashmdashmdashndashmdashmdashmdashmdash
that could be used interchangeably For this study the agent
-based method was used predominantly to recreate active
shooter incidents within the educational environment The
model consists of pedestrian and process modeling libraries
which recreates the interaction between an active shooter
and the unarmed individual agents within the model
The benefits of ABM were its ability to measure emergent
phenomena and collect individual agentrsquos interaction with
other agents Additionally ABM can illustrate ldquobehavior
degree of rationality and ability to learn and
evolverdquo (Bonabeau 2002) which was a crucial component
in measuring the cause and effect of hypothesizing what
increased or decreased the casualty rate Finally using
ABM allows active shooter research to be conducted in a
safe environment by eliminating the participantsrsquo potential
to experience post-traumatic stress disorder or other anxie-
ties (DHS 2017) Both models were based on a general
floor plan for an academic institution which was available
in the public domain as a visual aid intended to support the
emergency evacuation plans The floor plan included class-
rooms and hallway corridors which were converted to an
image file and added to the AnyLogic software
Model Physical Infrastructure
The Wall Target Line Service with Lines and Polygonal
Area from the Space Markup section in the Pedestrian Li-
brary were used to model the physical infrastructure The
wall creates a physical barrier within the model which lim-
its the agentrsquos movement For example if a wall is encoun-
tered by an agent within the model the agent seeks alterna-
tive routes by moving away from the obstacle The service
with lines section can send an agent through the wall which
represents an agent passing through the doorway The po-
lygonal area represents lecture hall seats where the agents
remain in one location for the duration of the class Each
lecture hall consists of one attractor as a point of gathering
during the lockdown phase
Model Agents
There were two agents in this model an active shooter
and the unarmed individuals State Configuration ndash Line of
Sight (LOS) and State Configuration ndash Casualty Each agent
carries different states in order to add flexibility to what an
agent can and cannot do depending on the location For
example just because an active shooterrsquos discharge range is
set to 100 feet does not mean that the shooter is capable of
selecting targets through the wall of the lecture hall or
agents in a different hallway section To limit target selec-
tion of the shooter line of sight (LOS) was modeled by
placing agents into different states depending on the loca-
tion In Figure 1 the agentrsquos state under green LOS is col-
ored purple
Figure 1 The change of agentrsquos state by location
Once the agent enters the light blue LOS the agentrsquos state
and color change to cyan Additionally an agent could be
under both green and blue LOS if two areas are merging
Both agents operate under this concept in order to limit tar-
get selection probability based on the physical location
such as hallways or lecture halls The active shooter selects
the target by using a Function within the Agent Library
Each function is coded in Java which selects the shooter
target based on the LOS state followed by the discharge
range One target could be selected per search where the
rate of each search was set to one target within a 212-
second interval Anklam Kirby Sharevski and Dietz
(2015) used the victim interval ratio by the statistics from
the Patrol Response Challenges (Buster 2008) where there
was one victim every 15 seconds by averaging the 65 active
shooter incidents to the number of victims For this study
the shooter casualty interval was based on the Parkland
Shooting (Fausset Kovaleski amp Mazzei 2018) by as-
sessing total death count and the duration of the shooting
The Java function was divided into three sections The
first section was the target selection among the agentrsquos pop-
ulation For instance the shooter searches for one target
among the pool of unarmed individual agents The second
section of the function entails determining the state of the
potential target agent If an agentrsquos state was a casualty
then the function starts over to find a new target If the
agentrsquos state was not a casualty then the function deter-
mines whether the target was within the same LOS state as
mdashmdashmdashmdashmdashmdashmdashmdashmdashmdashmdashmdashmdashmdashmdashmdashmdashmdashmdashmdashmdashmdashmdashmdashmdashmdashmdashmdashmdashmdashmdashmdashmdashmdashmdashmdashmdashmdashmdashmdashmdashmdashmdashmdashmdashmdashndashmdashmdashmdashmdash
ASSESSING THE EFFECTIVENESS OF AN AUTOMATIC DOOR LOCK SYSTEM BY DISCHARGE DETECTION 47
TO LOWER CASUALTIES DURING AN ACADEMIC ACTIVE SHOOTER INCIDENT
mdashmdashmdashmdashmdashmdashmdashmdashmdashmdashmdashmdashmdashmdashmdashmdashmdashmdashmdashmdashmdashmdashmdashmdashmdashmdashmdashmdashmdashmdashmdashmdashmdashmdashmdashmdashmdashmdashmdashmdashmdashmdashmdashmdashmdashmdashndashmdashmdashmdashmdash
mdashmdashmdashmdashmdashmdashmdashmdashmdashmdashmdashmdashmdashmdashmdashmdashmdashmdashmdashmdashmdashmdashmdashmdashmdashmdashmdashmdashmdashmdashmdashmdashmdashmdashmdashmdashmdashmdashmdashmdashmdashmdashmdashmdashmdashmdashndashmdashmdashmdashmdash
48 INTERNATIONAL JOURNAL OF ENGINEERING RESEARCH AND INNOVATION | V11 N1 SPRINGSUMMER 2019
the shooter If the shooter and the unarmed individual were
in the same state then the function evaluates the discharge
range If the potential target does not qualify under either
state the function restarts The third section of the function
executes the act of firearm discharge to the targeted agent
The exchange of fire was modeled by sending a string mes-
sage to the targeted agent The probability of a failed mes-
sage delivery was zero since the execution would occur
immediately Once the message has been received then the
state of the target agent will change to casualty and the
speed of the agent will be set to zero and the color to red
The agentrsquos movement was conducted by the following
blocks from the pedestrian library PedSource PedGoTo
PedService and PedSink PedSource determines the agent
and the rate of entry from the agent to the model For this
model there were two PedSource blocks one for an active
shooter and the other for the unarmed individual agents
TargetLine was used as an entry point which was deter-
mined within the PedSource block Once the agent exits the
model by the PedSource block the agent enters the PedSer-
vice block which allows the agent to enter the lecture hall
The PedService block prohibits the agent from traveling
through the wall which represents a door Each lecture hall
consists of a polygonal area where the agent waits through-
out the model runtime Figure 2 shows how the agentrsquos state
was changed from green to either purple or yellow based on
their location
Figure 2 The change of an agentrsquos state by location
Agents Logic
All 600 unarmed individual (UI) agents enter the model
and move randomly toward the available lecture hall Once
an agent arrives in a lecture hall it will remain at the ran-
domly selected point until the shooting begins Prior to the
shooting all 600 UI agents are distributed within the lecture
halls no UI agents remained in the hallway
The active shooter enters the model without discharging
and continues to advance down the hallway until the in-
class population count reaches 600 Once all 600 UI agents
are in the lecture hall the shooter immediately begins to
discharge UI casualties will always occur in the lecture
hall The shooterrsquos discharging function is set to one casual-
ty per 212 seconds for UI agents that are in range If there
are zero potential targets within the range the 212-second
delays starts over Once the active shooter agent begins
shooting the UI agents will then evacuate to the nearest
exit The shooter will attempt to randomly enter a lecture
hall one after another while running UI agents in the hall-
way are considered as potential targets If the automatic
door lock system is in place the shooter will remain in the
hallway until the model is terminated while having the
same ability to discharge at the running UI agents
The automatic door lock system begins as soon as the
active shooter discharges the first shot The lock system
prevents the active shooter from entering the lecture halls
while still allowing any UI agents inside to evacuate via the
hallway The shooterrsquos discharge initiates the unarmed indi-
vidual agents to either hide (shelter-in-place) or run
(evacuate) from the shooter The hide probability parameter
determines what percentage of UI agents will hide while
the rest will run from the shooter Table 1 shows that if the
hide probability is set to 20 then the remaining 80 will
run toward the nearest exit after exiting the designated lec-
ture hall
Table 1 Hide and run probability parameter manipulation per
iteration
Model Runtime Properties Limitations
and Iterations by Parameter Manipulation
bull The duration of the model was limited to six minutes
which was equivalent to the Parkland Shooting event
(Fausset et al 2018)
bull The casualty rate was limited to one casualty per 212
seconds by the active shooter again based on the
Parkland Shooting event (Fausset et al 2018)
bull The target selection began once all 600 unarmed indi-
viduals entered the lecture halls which limited the
first casualty to occur only in the lecture hall
bull If there were no potential target within the first 212
seconds the shooter required an additional 212 sec-
onds to select another target
Iteration 1 2 3 4 5 6 7 8 9 10 11
Hide 0 1 2 3 4 5 6 7 8 9 1
Run 1 9 8 7 6 5 4 3 2 1 0
mdashmdashmdashmdashmdashmdashmdashmdashmdashmdashmdashmdashmdashmdashmdashmdashmdashmdashmdashmdashmdashmdashmdashmdashmdashmdashmdashmdashmdashmdashmdashmdashmdashmdashmdashmdashmdashmdashmdashmdashmdashmdashmdashmdashmdashmdashndashmdashmdashmdashmdash
bull The unarmed individuals who were hiding in the
lecture hall could not attempt to escape if the shooter
entered the lecture hall
To allow for position and time variation each hide pa-
rameter was run 100 times and measured the following out-
put data
bull Hide parameter (Double)
bull Run parameter (Double)
bull Number of unarmed individuals in the lecture hall
(Integer)
bull Number of unarmed individuals in the hallway
(Integer)
bull Number of unarmed individual casualties (Integer)
bull Number of unarmed individuals who successfully
evacuated (Integer)
bull Number of lecture hall casualties of unarmed individ-
uals (Integer)
Results
Figure 3 suggests a highest average total casualty rate of
943 of 600 (157) where 20 hid and 80 ran to the
nearest exit The lowest average total casualty rate was 423
of 600 (071) where all unarmed individual agents were
seeking shelter within the lecture halls The highest average
hallway casualty rate was 524 of 600 (087) with 80
hide probability where the lowest rate was 360 of 600
(06) with 0 hide probability The highest average lec-
ture hall casualty rate was 479 of 600 (079) with 10
hide probability with the lowest at 0 of 600 (0) with 100
hide probability
Figure 3 Unarmed individual casualty rate by hide (shelter-in-
place) probability without immediate automatic door lock system
Figure 4 shows a comparison of the casualty rate of un-
armed individuals to the automatic door lock system by the
hide (shelter-in-place) probability
Figure 4 Unarmed individual casualty rate by hide (shelter-in-
place) probability with immediate automatic door lock system
Figure 4 suggests the lowest average casualty rate of 115
(019) was reported when all unarmed individuals hide
from the shooter with the automatic door lock mechanism in
place The highest average casualty rate was 98 (163)
where all agents had to evacuate from the lecture hall re-
gardless of the automated lock mechanism The highest
average hallway casualty rate was 647 of 600 (108) with
90 hide probability where the lowest rate was 0 of 600
(0) with 0 hide probability The highest average lecture
hall casualty rate was 381 of 600 (064) with 30 hide
probability with the lowest at 115 of 600 (019) with
100 hide probability
The locations were made up of total hallway and lecture
hall where casualty probabilities were measured based on
two parameter manipulations The first parameter was the
hide probability ranging from 0 where zero unarmed
individuals (UI) evacuated the lecture hall to 100 where
all 600 evacuated to the nearest exit The second was a
Boolean parameter which determined whether the automat-
ic door lock system was in place or not The total casualty
probabilities were calculated by dividing the total number of
casualties by 600 The hallway and the lecture hall casualty
probabilities were calculated by dividing the casualty rates
by the total number of either run or hide casualties For ex-
ample hallway casualty probability was calculated by di-
viding the hallway casualty rate to the total number of evac-
uees Figure 5 compares the UI agentrsquos casualty probability
without the immediate door lock system based on the
agentrsquos location of casualty
Figure 5 illustrates the total hallway and lecture hall cas-
ualty probability based on the hide parameter without the
door lock system The highest total casualty probability was
157 when 20 of unarmed individuals hid and 80 ran
to the nearest exit The lowest total casualty probability was
071 when 100 evacuated to the nearest exit The lec-
mdashmdashmdashmdashmdashmdashmdashmdashmdashmdashmdashmdashmdashmdashmdashmdashmdashmdashmdashmdashmdashmdashmdashmdashmdashmdashmdashmdashmdashmdashmdashmdashmdashmdashmdashmdashmdashmdashmdashmdashmdashmdashmdashmdashmdashmdashndashmdashmdashmdashmdash
ASSESSING THE EFFECTIVENESS OF AN AUTOMATIC DOOR LOCK SYSTEM BY DISCHARGE DETECTION 49
TO LOWER CASUALTIES DURING AN ACADEMIC ACTIVE SHOOTER INCIDENT
mdashmdashmdashmdashmdashmdashmdashmdashmdashmdashmdashmdashmdashmdashmdashmdashmdashmdashmdashmdashmdashmdashmdashmdashmdashmdashmdashmdashmdashmdashmdashmdashmdashmdashmdashmdashmdashmdashmdashmdashmdashmdashmdashmdashmdashmdashndashmdashmdashmdashmdash
mdashmdashmdashmdashmdashmdashmdashmdashmdashmdashmdashmdashmdashmdashmdashmdashmdashmdashmdashmdashmdashmdashmdashmdashmdashmdashmdashmdashmdashmdashmdashmdashmdashmdashmdashmdashmdashmdashmdashmdashmdashmdashmdashmdashmdashmdashndashmdashmdashmdashmdash
50 INTERNATIONAL JOURNAL OF ENGINEERING RESEARCH AND INNOVATION | V11 N1 SPRINGSUMMER 2019
ture hall casualty probability was the highest at 735
when 10 of the unarmed individuals evacuated The low-
est lecture hall casualty probability was 06 when every-
one sought shelter The highest hallway casualty probability
was 353 when 90 hid upon the first discharge The
lowest hallway casualty probability was 0 when 100
hid from the shooter Figure 6 compares the UI agentrsquos cas-
ualty probability with the immediate door lock system
based on the agentrsquos location of casualty
Figure 5 Unarmed individual survival probability by hide (shelter-
in-place) probability without immediate automatic door lock sys-
tem
Figure 6 Unarmed individual survival probability by hide (shelter-
in-place) probability with immediate automatic door lock system
Figure 6 illustrates the total hallway and lecture hall
casualty probability based on the hide parameter with the
door lock system The highest total casualty probability was
158 during the 10 hide probability where the lowest
probability was 019 during the 100 hide probability
The highest lecture hall casualty probability was 5 during
the 10 hide probability where the lowest lecture hall
probability was 019 for the 100 hide probability The
highest hallway casualty probability was 536 during the
90 hide probability The lowest hallway casualty probabil-
ity was 0 for the 100 hide probability Table 2 compares
the total casualty probabilities for the model with and with-
out a door lock
Table 2 Total casualty probability with and without door lock per
iteration
The overall casualty probability decreased by 026 with
the highest casualty rate decrease of 051 with all agents
sheltering in place In contrast the casualty rate increased
by 005 for the 10 hide probability Table 3 compares
the hallway casualty probabilities for the model with and
without a door lock The overall casualty probability in-
creased by 059 with the highest casualty rate increasing
by 183 when 90 sought shelter There was no decrease
in casualty probability for hallway casualties Table 4 com-
pares the lecture hall casualty probabilities for the model
with and without a door lock The overall casualty probabil-
ity decreased by 101 with the highest casualty rate de-
crease of 235 when 10 sought shelter In contrast the
casualty rate increased by 001 when all agents evacuated
Probability Total Casualty
Probability
Survival Probability
Difference
Hide Run
Without
Door
Lock
With
Door Lock
0 100 139 100 -39
10 90 153 158 05
20 80 157 148 -09
30 70 142 141 -01
40 60 134 112 -21
50 50 129 98 -31
60 40 121 94 -27
70 30 113 84 -29
80 20 126 81 -44
90 10 118 75 -44
100 0 71 19 -51
Average
Casualty
Probability
127 101 -26
mdashmdashmdashmdashmdashmdashmdashmdashmdashmdashmdashmdashmdashmdashmdashmdashmdashmdashmdashmdashmdashmdashmdashmdashmdashmdashmdashmdashmdashmdashmdashmdashmdashmdashmdashmdashmdashmdashmdashmdashmdashmdashmdashmdashmdashmdashndashmdashmdashmdashmdash
Table 3 Hallway casualty probability with and without door lock
per iteration
Table 4 Lecture hall casualty probability with and without door
lock per iteration
Conclusions
Assuming locked doors are effective at separating poten-
tial victims from the shooter this study further demonstrat-
ed the value of agent-based models to design effective poli-
cies by testing the impact of automatic door locking tech-
nology on causality rates Using this model shelter-in-place
proved to be an effective strategy for reducing the impact of
an active shooter event with the greatest reduction shown
when all individuals sought to shelter in place The imple-
mentation of an automated door lock system triggered by
discharge detection did decrease the total casualty rate an
average of 026 over 100 simulated iterations The total
lecture hall casualty rate decreased an average of 101
while the total hallway casualty rate increased by 059
While the automatic door locking system did reduce causal-
ities individuals in the hallways also saw an increase in
causalities due to limits in protection from the shooter and
evacuation paths
References
Anklam C Kirby A Sharevski F amp Dietz J (2015)
Mitigating active shooter impact analysis for policy
options based on agentcomputer-based modeling Jour-
nal of Emergency Management 13(3) Retrieved from
httpswwwwmpllcorgojs-242indexphpjem
articleview176
Bonabeau E (2002) Agent-based modeling Methods and
techniques for simulating human systems Proceedings
of the National Academy of Sciences 99(suppl 3)
7280-7287
Buster C (2008) Patrol response challenge NCJRS Law
and Order 56(6) 62-68
City of Houston (2012) RunHideFightmdashReady Houston
Retrieved from httpreadyhoustonwpenginecom
suspicious-activityrun-hide-fight
Department of Homeland Security [DHS] (2017) Active
shooter recovery guide Retrieved from https
wwwdhsgovsitesdefaultfilespublicationsactive-
shooter-recovery-guide-08-08-2017-508pdf
Fausset R Kovaleski S amp Mazzei P (2018) On a day
like any other at a Florida school 6 minutes of death
and chaos The New Y ork Times Retrieved
from httpswwwnytimescom20180216us
stoneman-douglas-shootinghtml
Federal Bureau of Investigation (2016) Quick look 220
Active shooter incidents in the United States between
2000-2016 FBI Retrieved from httpswwwfbigov
aboutpartnershipsoffice-of-partner-engagementactive
-shooter-incidents-graphics
Probability Total Casualty
Probability
Survival Probability
Difference
Hide Run Without
Door Lock
With
Door Lock
0 100 79 102 23
10 90 89 120 31
20 80 96 131 35
30 70 87 111 23
40 60 88 129 40
50 50 101 151 50
60 40 122 180 58
70 30 125 211 86
80 20 192 308 116
90 10 353 536 183
100 0 0 0 0
Average
Casualty
Probability
121 180 59
Probability Total Casualty
Probability
Survival Probability
Difference
Hide Run Without
Door Lock
With
Door Lock
0 100 60 61 01
10 90 735 500 -235
20 80 402 218 -184
30 70 317 212 -106
40 60 203 88 -114
50 50 157 45 -111
60 40 120 37 -83
70 30 107 29 -78
80 20 109 25 -85
90 10 92 23 -69
100 0 71 19 -51
Average
Casualty
Probability
216 114 -101
mdashmdashmdashmdashmdashmdashmdashmdashmdashmdashmdashmdashmdashmdashmdashmdashmdashmdashmdashmdashmdashmdashmdashmdashmdashmdashmdashmdashmdashmdashmdashmdashmdashmdashmdashmdashmdashmdashmdashmdashmdashmdashmdashmdashmdashmdashndashmdashmdashmdashmdash
ASSESSING THE EFFECTIVENESS OF AN AUTOMATIC DOOR LOCK SYSTEM BY DISCHARGE DETECTION 51
TO LOWER CASUALTIES DURING AN ACADEMIC ACTIVE SHOOTER INCIDENT
mdashmdashmdashmdashmdashmdashmdashmdashmdashmdashmdashmdashmdashmdashmdashmdashmdashmdashmdashmdashmdashmdashmdashmdashmdashmdashmdashmdashmdashmdashmdashmdashmdashmdashmdashmdashmdashmdashmdashmdashmdashmdashmdashmdashmdashmdashndashmdashmdashmdashmdash
mdashmdashmdashmdashmdashmdashmdashmdashmdashmdashmdashmdashmdashmdashmdashmdashmdashmdashmdashmdashmdashmdashmdashmdashmdashmdashmdashmdashmdashmdashmdashmdashmdashmdashmdashmdashmdashmdashmdashmdashmdashmdashmdashmdashmdashmdashndashmdashmdashmdashmdash
52 INTERNATIONAL JOURNAL OF ENGINEERING RESEARCH AND INNOVATION | V11 N1 SPRINGSUMMER 2019
Federal Emergency Management Agency [FEMA] (2017)
Incident command system resources Retrieved from
httpswwwfemagovincident-command-system-
resources
Scott M amp Schwartz J (2014) The police response to
active shooter incidents Washington DC Police Ex-
ecutive Research Forum Retrieved from https
wwwpoliceforumorgassetsdocs
Critical_Issues_Seriesthe20police20response
20to20active20shooter20incidents202014pdf
Biographies
JAE YONG LEE is a graduate research assistant in
computer and information technology at Purdue University
He earned his BA in public relations and minor in computer
and information technology in 2017 from Purdue Universi-
ty His research interests include examining the effective-
ness of active shooter response and mitigation policies with
agent-based modeling utilizing AnyLogic Mr Lee may be
reached at jaeleepurdueedu
J ERIC DIETZ is a Professor of Computer and Infor -
mation Technology at Purdue University and the Director of
Purdue Homeland Security Institute He earned his BS and
MS degrees in chemical engineering in 1986 from Rose-
Hulman Institute of Technology and PhD in chemical engi-
neering from Purdue University He had served as Founding
Executive Director for the Indiana Department of Homeland
Security and retired Lieutenant Colonel from the US Army
Dr Dietz may be reached at jedietzpurdueedu
INSTRUCTIONS FOR AUTHORS
MANUSCRIPT FORMATTING REQUIREMENTS The INTERNATIONAL JOURNAL OF ENGINEERING
RESEARCH AND INNOVATION is an onlineprint publi-
cation designed for Engineering Engineering Technology
and Industrial Technology professionals All submissions to
this journal submission of manuscripts peer-reviews of
submitted documents requested editing changes notifica-
tion of acceptance or rejection and final publication of ac-
cepted manuscripts will be handled electronically The only
exception is the submission of separate high-quality image
files that are too large to send electronically
All manuscript submissions must be prepared in
Microsoft Word (doc or docx) and contain all figures im-
ages andor pictures embedded where you want them and
appropriately captioned Also included here is a summary of
the formatting instructions You should however review
the sample Word document on our website (httpijeriorg
formatting-guidelines) for details on how to correctly format
your manuscript The editorial staff reserves the right to edit
and reformat any submitted document in order to meet pub-
lication standards of the journal
The references included in the References section of
your manuscript must follow APA-formatting guidelines In
order to help you the sample Word document also includes
numerous examples of how to format a variety of scenarios
Keep in mind that an incorrectly formatted manuscript will
be returned to you a delay that may cause it (if accepted) to
be moved to a subsequent issue of the journal
1 Word Document Page Setup Two columns with frac14
spacing between columns top of page = frac34 bottom of
page = 1 (from the top of the footer to bottom of
page) left margin = frac34 right margin = frac34
2 Paper Title Centered at the top of the fir st page
with a 22-point Times New Roman (Bold) small-caps
font
3 Page Breaks Do not use page breaks
4 Figures Tables and Equations All figures tables
and equations must be placed immediately after the first
paragraph in which they are introduced And each must
be introduced For example ldquoFigure 1 shows the opera-
tion of supercapacitorsrdquo ldquoThe speed of light can be
determined using Equation 4rdquo
5 More on Tables and Figures Center table captions
above each table center figure captions below each
figure Use 9-point Times New Roman (TNR) font
Italicize the words for table and figure as well as their
respective numbers the remaining information in the
caption is not italicized and followed by a periodmdasheg
ldquoTable 1 Number of research universities in the staterdquo
or ldquoFigure 5 Cross-sectional aerial map of the forested
areardquo
6 Figures with Multiple Images If any given figure
includes multiple images do NOT group them they
must be placed individually and have individual minor
captions using ldquo(a)rdquo ldquo(b)rdquo etc Again use 9-point TNR
7 Equations Each equation must be numbered
placed in numerical order within the document and
introducedmdashas noted in item 4
8 Tables Graphs and Flowcharts All tables graphs
and flowcharts must be created directly in Word tables
must be enclosed on all sides The use of color andor
highlighting is acceptable and encouraged if it provides
clarity for the reader
9 Textboxes Do not use text boxes anywhere in the
document For example tablefigure captions must be
regular text and not attached in any way to their tables
or images
10 Body Fonts Use 10-point TNR for body text through-
out (18 paragraph indention) indent all new para-
graphs as per the images shown below do not use tabs
anywhere in the document 9-point TNR for author
namesaffiliations under the paper title 16-point TNR
for major section titles 14-point TNR for minor section
titles
11 Personal Pronouns Do not use personal pronouns
(eg ldquowerdquo ldquoourrdquo etc)
12 Section Numbering Do not use section number ing
of any kind
13 Headers and Footers Do not use either
mdashmdashmdashmdashmdashmdashmdashmdashmdashmdashmdashmdashmdashmdashmdashmdashmdashmdashmdashmdashmdashmdashmdashmdashmdashmdashmdashmdashmdashmdashmdashmdashmdashmdashmdashmdashmdashmdashmdashmdashmdashmdashmdashmdashmdashmdashndashmdashmdashmdashmdash
INSTRUCTIONS FOR AUTHORS MANUSCRIPT FORMATTING REQUIREMENTS 53
mdashmdashmdashmdashmdashmdashmdashmdashmdashmdashmdashmdashmdashmdashmdashmdashmdashmdashmdashmdashmdashmdashmdashmdashmdashmdashmdashmdashmdashmdashmdashmdashmdashmdashmdashmdashmdashmdashmdashmdashmdashmdashmdashmdashmdashmdashndashmdashmdashmdashmdash
mdashmdashmdashmdashmdashmdashmdashmdashmdashmdashmdashmdashmdashmdashmdashmdashmdashmdashmdashmdashmdashmdashmdashmdashmdashmdashmdashmdashmdashmdashmdashmdashmdashmdashmdashmdashmdashmdashmdashmdashmdashmdashmdashmdashmdashmdashndashmdashmdashmdashmdash
54 INTERNATIONAL JOURNAL OF ENGINEERING RESEARCH AND INNOVATION | V11 N1 SPRINGSUMMER 2019
14 References in the Abstract Do NOT include any
references in the Abstract
15 In-Text Referencing For the fir st occur rence of a
given reference list all authorsmdashlast names onlymdashup
to seven (7) if more than seven use ldquoet alrdquo after the
seventh author For a second citation of the same refer-
encemdashassuming that it has three or more authorsmdashadd
ldquoet alrdquo after the third author Again see the sample
Word document and the formatting guide for references
for specifics
16 More on In-Text References If you include a refer -
ence on any table figure or equation that was not cre-
ated or originally published by one or more authors on
your manuscript you may not republish it without the
expressed written consent of the publishing author(s)
The same holds true for name-brand products
17 End-of-Document References Section List all refer -
ences in alphabetical order using the last name of the
first authormdashlast name first followed by a comma and
the authorrsquos initials Do not use retrieval dates for web-
sites
18 Author Biographies Include biographies and cur -
rent email addresses for each author at the end of the
document
19 Page Limit Manuscr ipts should not be more than
15 pages (single-spaced 2-column format 10-point
TNR font)
20 Page Numbering Do not use page numbers
21 Publication Charges Manuscr ipts accepted for pub-
lication are subject to mandatory publication charges
22 Copyright Agreement A copyr ight transfer agree-
ment form must be signed by all authors on a given
manuscript and submitted by the corresponding author
before that manuscript will be published Two versions
of the form will be sent with your manuscriptrsquos ac-
ceptance email
Only one form is required Do not submit both forms
The form named ldquopaperrdquo must be hand-signed by each
author The other form ldquoelectronicrdquo does not require
hand signatures and may be filled out by the corre-
sponding author as long as heshe receives written per-
mission from all authors to have himher sign on their
behalf
23 Submissions All manuscr ipts and required files and
forms must be submitted electronically to Dr Philip D
Weinsier manuscript editor at philipwbgsuedu
24 Published Deadlines Manuscr ipts may be submit-
ted at any time during the year irrespective of pub-
lished deadlines and the editor will automatically have
your manuscript reviewed for the next-available issue
of the journal Published deadlines are intended as
ldquotargetrdquo dates for submitting new manuscripts as well
as revised documents Assuming that all other submis-
sion conditions have been met and that there is space
available in the associated issue your manuscript will
be published in that issue if the submission processmdash
including payment of publication feesmdashhas been com-
pleted by the posted deadline for that issue
Missing a deadline generally only means that your
manuscript may be held for a subsequent issue of the
journal However conditions exist under which a given
manuscript may be rejected Always check with the
editor to be sure Also if you do not complete the sub-
mission process (including all required revisions) with-
in 12 months of the original submission of your manu-
script your manuscript may be rejected or it may have
to begin the entire review process anew
INTERNATIONAL JOURNAL OF
MODERN ENGINEERING
THE LEADING JOURNAL OF ENGINEERING APPLIED SCIENCE AND TECHNOLOGY
Mark Rajai PhD
Editor-in-Chief California State University-Northridge College of Engineering and Computer Science Room JD 4510 Northridge CA 91330 Office (818) 677-5003 Email mrajaicsunedu
Contact us
wwwiajcorg wwwijmeus
wwwtiijorg
wwwijeriorg
Print ISSN 2157-8052
Online ISSN 1930-6628
TO JOIN THE REVIEW BOARD
bull The International Journal of Engineering Research and
Innovation (IJERI)
For more information visit wwwijeriorg
bull The Technology Interface International Journal (TIIJ)
For more information visit wwwtiijorg
OTHER IAJC JOURNALS
bull Manuscripts should be sent electronically to
the manuscript editor Dr Philip Weinsier
at philipwbgsuedu
For submission guidelines visit
wwwijmeussubmissions
IJME SUBMISSIONS
bull Contact the chair of the International
Review Board Dr Philip Weinsier at
philipwbgsuedu
For more information visit
wwwijmeusijme_editorialhtm
bull IJME was established in 2000 and is the first and
official flagship journal of the International
Association of Journal and Conferences (IAJC)
bull IJME is a high-quality independent journal steered by
a distinguished board of directors and supported by an
international review board representing many well-
known universities colleges and corporations in the
US and abroad
bull IJME has an impact factor of 300 placing it among
the top 100 engineering journals worldwide and is the
1 visited engineering journal website (according to
the National Science Digital Library)
ABOUT IJME
INDEXING ORGANIZATIONS
bull IJME is indexed by numerous agencies
For a complete listing please visit us at
wwwijmeus
SPRINGSUMMER 2009
VOLUME 1 NUMBER 1
IJERI Contact Information
General questions or inquiries about sponsorship of the journal should be directed to
Mark Rajai PhD
Founder and Editor-In-Chief
Office (818) 677-5003
Email editorijeriorg
Department of Manufacturing Systems Engineering amp Management
California State University-Northridge
18111 Nordhoff St
Room JD3317
Northridge CA 91330
The International Journal of Engineer-
ing Research amp Innovation (IJERI) is
the second official journal of the Inter-
national Association of Journals and
Conferences (IAJC) IJERI is a highly-
selective peer-reviewed print journal
which publishes top-level work from all
areas of engineering research innova-
tion and entrepreneurship
IJERI

mdashmdashmdashmdashmdashmdashmdashmdashmdashmdashmdashmdashmdashmdashmdashmdashmdashmdashmdashmdashmdashmdashmdashmdashmdashmdashmdashmdashmdashmdashmdashmdashmdashmdashmdashmdashmdashmdashmdashmdashmdashmdashmdashmdashmdashmdashndashmdashmdashmdashmdash
mdashmdashmdashmdashmdashmdashmdashmdashmdashmdashmdashmdashmdashmdashmdashmdashmdashmdashmdashmdashmdashmdashmdashmdashmdashmdashmdashmdashmdashmdashmdashmdashmdashmdashmdashmdashmdashmdashmdashmdashmdashmdashmdashmdashmdashmdashndashmdashmdashmdashmdash
4 INTERNATIONAL JOURNAL OF ENGINEERING RESEARCH AND INNOVATION | V11 N1 SPRINGSUMMER 2019
State University of New York (NY) North Carolina AampT State University (NC)
Michigan Tech (MI)
Purdue University Northwest (IN) Zamfara AC Development (NIGERIA)
Virginia State University (VA)
Memphis University (TN) Guru Nanak Dev Engineering (INDIA)
Bowling Green State Univ Firelands (OH)
Minnesota State University (MN) Texas AampM University Kingsville (TX)
Illinois State University (IL)
Iowa State University (IA) Eastern Illinois University (IL)
Indiana State University (IN)
Ohio University (OH) Claflin University (SC)
North Carolina AampT State University (NC)
Alabama AampM University (AL) Ferris State University (MI)
Appalachian State University (NC)
Oregon Institute of Technology (OR) Elizabeth City State University (NC)
Tennessee Technological University (TN)
Millersville University (PA) University of Tennessee Chattanooga (TN)
Zagazig University EGYPT) Utah Valley University (UT)
Abu Dhabi University (UAE)
Purdue Polytechnic (IN) Penn State University (PA)
Safety Engineer in Sonelgaz (ALGERIA)
City University of New York (NY) Central Connecticut State University (CT)
University of Louisiana Lafayette (LA)
North Dakota State University (ND) North Carolina AampT University (NC)
Indiana University Purdue (IN)
Michigan Tech (MI) Eastern Illinois University (IL)
Bowling Green State University (OH)
Millersville University (PA) Purdue Polytechnic (IN)
North Dakota State University (ND)
Abu Dhabi University (UAE) Purdue University Calumet (IN)
Bowling Green State University (OH)
Southeast Missouri State University (MO) Bowling Green State University (OH)
Ohio University (OH)
Penn State University Berks (PA) Central Michigan University (MI)
Florida AampM University (FL)
Penn State University (PA) ARUP Corporation
University of Louisiana (LA)
University of Southern Indiana (IN) Eastern Illinois University (IL)
Cal State Poly Pomona (CA)
Excelsior College (NY) Jackson State University (MS)
Penn State Berks (PA)
California State University Fresno (CA) Michigan Tech (MI)
Mohammed Abdallah Paul Akangah
Nasser Alaraje
Ali Alavizadeh Lawal Anka
Jahangir Ansari
Kevin Berisso Pankaj Bhambri
Michelle Brodke
Shaobiao Cai Rajab Challoo
Isaac Chang
Shu-Hui (Susan) Chang Rigoberto Chinchilla
Phil Cochrane
Curtis Cohenour Emily Crawford
Dongyang (Sunny) Deng
ZT Deng Sagar Deshpande
David Domermuth
Marilyn Dyrud Mehran Elahi
Ahmed Elsawy
Cindy English Ignatius Fomunung
Ahmed Gawad Mohsen Hamidi
Mamoon Hammad
Gene Harding Bernd Haupt
Youcef Himri
Delowar Hossain Xiaobing Hou
Shelton Houston
Ying Huang Christian Bock-Hyeng
Pete Hylton
John Irwin Toqeer Israr
Sudershan Jetley
Alex Johnson Rex Kanu
Reza Karim
Manish Kewalramani Tae-Hoon Kim
Chris Kluse
Doug Koch Resmi Krishnankuttyrema
Zaki Kuruppalil
Shiyoung Lee Soo-Yen (Samson) Lee
Chao Li
Dale Litwhiler Mani Manivannan
GH Massiha
Thomas McDonald David Melton
Shokoufeh Mirzaei
Sam Mryyan Jessica Murphy
Rungun Nathan
Arun Nambiar Aurenice Oliveira
University of Central Missouri (MO) Purdue Fort Wayne (IN)
Community College of Rhode Island (RI)
Sardar Patel University (INDIA) Virginia State University (VA)
Broadcom Corporation
Warsaw University of Tech (POLAND) University of West Florida (FL)
California State University-Fullerton (CA)
Wireless Systems Engineer Brigham Young University (UT)
DeSales University (PA)
Baker College (MI) Michigan Technological University (MI)
Zagros Oil amp Gas Company (IRAN)
St Cloud State University (MN) Shahrood University of Technology (IRAN)
North Carolina AampT State University (NC)
Government Engineering College (INDIA) Wentworth Institute of Technology (MA)
Southern Illinois University (IL)
Ohio University (OH) Camarines Sur Polytechnic (PHILIPPINES)
Missouri University of Science amp Tech (MO)
University of Houston Downtown (TX) University of Central Missouri (MO)
University of South Florida Polytechnic (FL) Central Connecticut State University (CT)
Texas AampM University (TX)
Thammasat University (THAILAND) Central Connecticut State University (CT)
Purdue University (IN)
University of Pittsburgh Johnstown (PA) Purdue University Calumet (IN)
Sam Houston State University (TX)
Ohio University (OH) Jackson State University (MS)
Missouri Western State University (MO)
Troy Ollison Reynaldo Pablo
Basile Panoutsopoulos
Shahera Patel Thongchai Phairoh
Huyu Qu
Desire Rasolomampionona Michael Reynolds
Nina Robson
Marla Rogers Dale Rowe
Karen Ruggles
Anca Sala Alex Sergeyev
Mehdi Shabaninejad
Hiral Shah Mojtaba Shivaie
Musibau Shofoluwe
Amitkumar B Solanki Jiahui Song
Carl Spezia
Michelle Surerus Harold Terano
Sanjay Tewari
Vassilios Tzouanas Jeff Ulmer
Abraham Walton Haoyu Wang
Jyhwen Wang
Boonsap Witchayangkoon Shuju Wu
Baijian (Justin) Yang
Eunice Yang Xiaoli (Lucy) Yang
Faruk Yildiz
Yuqiu You Pao-Chiang Yuan
Jinwen Zhu
Editorial Review Board Members
ANALYZING RESPONSE COMMUNICATION MITIGATION
METHODS THROUGH SIMULATION MODELING mdashmdashmdashmdashmdashmdashmdashmdashmdashmdashmdashmdashmdashmdashmdashmdashmdashmdashmdashmdashmdashmdashmdashmdashmdashmdashmdashmdashmdashmdashmdashmdashmdashmdashmdashmdashmdashmdashmdashmdashmdashmdashmdashmdashmdashmdashndashmdashmdashmdashmdash
Katherine E Reichart Purdue University Anna R Larson Purdue University Kristal K Smith Purdue University
J Eric Dietz Purdue University
When modeling active shooter scenarios communicating
proper procedures saves lives Notifying authorities increas-
es response time which prevents fatal casualties The shoot-
er will engage the police instead In the 2015 Orlando night-
club shooting police were notified at 202 am from an off-
duty officer acting as a security guard (Ellis Fantz Karimi
amp McLoughlin 2016) This was four minutes after shooting
started However additional external communication did
not only come from the Orlando police department Rather
the nightclub itself used social media to communicate with
patrons People inside also provided personal and external
communication to the police or family members Active
shooters represent a scenario in which communication and
procedure must be set in place prior to the emergency to
accurately work In this way simulation modeling can pro-
vide ldquopracticerdquo in the distribution of responders areas of
weakness and effective communication Choosing a simu-
lation modeling source means selecting a system that pro-
vides multiple modeling scenarios AnyLogic Personal
Learning Edition (PLE) affords the creation of limited yet
diverse models Using agent-based logic modeling commu-
nication could be as realistic and individualized as needed
Venue Case Studies
Venues must adapt to different daily scenarios as crowds
change with the event Therefore getting an accurate evacu-
ation time is difficult mostly because publishing this data
has the potential to hurt a venuersquos security Based on evacu-
ation times in apartment buildings the average time it takes
to start evacuating (from a fire) is approximately
10 minutes assuming alert systems are in place (Proulx
1995) In combination with that time the average evacua-
tion took approximately 22 minutes to complete However
this study was done on apartment buildings as opposed to a
large event venue like a stadium Given the magnitude of
such evacuation times are more akin to typical exit proce-
dures However these times are not measured and may be
skewed as patrons are not forced to leave Therefore the
aforementioned study may be more useful to compare tim-
ing than data collected from an after-hours event This study
also took mobility constraints into consideration involving
those with special needs Ultimately the study does show
that communication effects evacuation rates The next step
was to compare this information to large event venues and
their communication methods
Abstract
Emergencies rely heavily on succinct and controlled an-
nouncements from a singular verified source However this
has been an ideal not reality Often veritable communica-
tion has occurred after events as official sources may not
have been available to comment or provide personal instruc-
tion to individuals Current communication simulation mod-
eling involves communication systems in commutation with
actual communication Systems are not the only way infor-
mation is spread In this study the authors analyzed formal
and informal response methods in an emergency at a large
event By comparing multiple methods in a systems dynam-
ic model the researchers estimated the relative value of four
communication sources in terms of impact and response
metrics The results influenced subsequent agent-based
models that reflected a real evacuation of messaging The
study resulted in increased understanding of evacuation
communication procedures as well as the simultaneous test-
ing of multiple forms of communication The models
proved that the most reliable and rapid communication has
the most impact on saving lives Additionally these proce-
dures gave insight into communication effectiveness as well
as the best combinations of messaging Thus these models
as estimates should offer insight into the current communi-
cation response procedures and their future applications
Introduction
Current communication simulation modeling should in-
volve communication systems in commutation with actual
communication Consider that an Amber alert and an online
network might be similar in communication structure but
not in actual practice Miscommunication in an online net-
work means losing all connection In an emergency false
and inconsistent messages occur According to the Depart-
ment of Homeland Security emergencies rely heavily on
succinct and controlled announcements from a singular veri-
fied source However this is an ideal as opposed to the real-
ity (DHS 2014) Communication will often be announced
after the event as official sources may not be available to
comment immediately or provide personal instruction to
individuals Worse the communication itself will stem from
various sources that may worsen the emergency An exam-
ple of multiple sources would be the difference between
formal and informal sources
mdashmdashmdashmdashmdashmdashmdashmdashmdashmdashmdashmdashmdashmdashmdashmdashmdashmdashmdashmdashmdashmdashmdashmdashmdashmdashmdashmdashmdashmdashmdashmdashmdashmdashmdashmdashmdashmdashmdashmdashmdashmdashmdashmdashmdashmdashmdashmdashmdashmdash
INTERNATIONAL JOURNAL OF ENGINEERING RESEARCH AND INNOVATION | V11 N1 SPRINGSUMMER 2019 5
mdashmdashmdashmdashmdashmdashmdashmdashmdashmdashmdashmdashmdashmdashmdashmdashmdashmdashmdashmdashmdashmdashmdashmdashmdashmdashmdashmdashmdashmdashmdashmdashmdashmdashmdashmdashmdashmdashmdashmdashmdashmdashmdashmdashmdashmdashndashmdashmdashmdashmdash
mdashmdashmdashmdashmdashmdashmdashmdashmdashmdashmdashmdashmdashmdashmdashmdashmdashmdashmdashmdashmdashmdashmdashmdashmdashmdashmdashmdashmdashmdashmdashmdashmdashmdashmdashmdashmdashmdashmdashmdashmdashmdashmdashmdashmdashmdashndashmdashmdashmdashmdash
6 INTERNATIONAL JOURNAL OF ENGINEERING RESEARCH AND INNOVATION | V11 N1 SPRINGSUMMER 2019
In a 2014 study of Ladd Pebbles Stadium in Mobile Ala-
bama focusing on stadium design researchers spoke to the
international standard of eight minutes for a stadium evacu-
ation to occur This study focused on the physical limita-
tions associated with evacuations (crowding collisions
social norms etc) However very little attention was paid
to communication factors that could affect timing in an
emergency Instead the study focused on evacuation flow
rate simulation and avoiding and assuming communication
dynamics (Aldana Fox Diehl amp Dimitoglou 2014) How-
ever case studies show how vital communication is to evac-
uation planning At ATampT Stadium staff members are giv-
en a rundown on their tasks of the day and what to expect in
terms of safety at the beginning of each shift These task
sheets include updates and reminders for the event and pro-
vide photos of what the passes and wristbands look like so
there are no copies (ATampT 2018) It also reminds them if
they see something to say something Each staff member is
also expected to get a formal safety briefing from their su-
pervisor prior to doors opening
However arenas are not the only example of a large event
venue University stadiums arenas and event centers are
typically less secure and at higher risk for an emergency
Surveying three universities and their plans offered a more
comprehensive list of evacuation procedures and methods
Additionally these case studies offered the opportunity to
see how they communicated information consistently to
both long-time and first-time visitors Though they also
showed methods related to staffing this was not an im-
portant factor for the current research project Townson
University has a public version of their arenarsquos emergency
response plan and they outline a list of important infor-
mation items for their event staff to know before their event
This list covers familiarizing staff and contractors on emer-
gency procedures fire procedures emergency exit policies
equipment and seating policies and other general rules
The Townson report also covers the procedures during an
emergency As soon as an incident occurs it is noted on the
PA and via a bullhorn in case of a fire alarm or PA equip-
ment failure the TUPD will designate a safe location out-
side management will direct patrons during evacuation and
will use the radio for communication and an operations
commander will be assigned These procedures are based on
the National Incident Management System (NIMS) the
National Response Framework (NRF) and the Incident
Command System (ICS) These provide guidelines for pre-
paredness and compliance Anyone involved in security
management should be fully aware especially when ensur-
ing the safety of over several hundred people (Towson
2018) From these case studies responses require necessary
preparation and practice Based on this information evacua-
tion times should be estimated at approximately 20 minutes
for an average venue with systems in place prior to the
event itself This time includes both the processing and ac-
tual physical evacuation time The communication methods
employed by these venues will be further explored in the
following section
Emergency Communication Methods
In 2008 the Department of Homeland Security designed a
planning guide for emergencies in stadiums The guide has
a section for a notification system during emergencies Dur-
ing emergencies understanding the different reactions that
people can have is important to consider Using the different
possibilities can be helpful in designing an efficient notifi-
cation system The employees also need to be trained on all
aspects of the system to be sure that communication will be
effective Using common language during emergencies al-
lows for everyone to understand The guide also advises
everyone to ensure that they have a plan for displaying in-
formation (screens jumbotrons etc) along with having
employees check areas without any displays (DHS 2008)
Thus communication response methods should relate to
two communication systems visual and audio Sight and
hearing are the primary ways that any person will begin to
understand a message
Stadiums typically have public announcement systems
that will take into consideration both visual and auditory
public announcement systems but do not capitalize on addi-
tional communication systems that may be available to their
audience According to Kenneth Burke the percentage rate
of text messages being opened is 99 Burkersquos article also
states that 95 of text messages are opened within three
minutes and on average they are read in under five seconds
(Bankers 2018) This statistic is particularly useful consid-
ering that many stadiums have fan text messaging that could
evolve into an emergency communication service For ex-
ample Bankers Life Fieldhouse a stadium in Indianapolis
Indiana offers several different fan information services
Among website information is the texting service that is
offered to fans Bankers Life Fieldhouse offers a texting
service that fans can use if they ever encounter anything
suspicious during events The service is anonymous so they
can inform building management without needing to give
any personal information Bankers Life Fieldhouse also
specifies that if the service is misused the number will be
blocked for a full 24 hours (2018)
According to Cutlip and Centerrsquos Effective Public Rela-
tions (2013) there are serval communication methods to
apply to audiences (Broom Sha Seshadrinathan Center amp
Cutlip 2013) Among the various communication models
mdashmdashmdashmdashmdashmdashmdashmdashmdashmdashmdashmdashmdashmdashmdashmdashmdashmdashmdashmdashmdashmdashmdashmdashmdashmdashmdashmdashmdashmdashmdashmdashmdashmdashmdashmdashmdashmdashmdashmdashmdashmdashmdashmdashmdashmdashndashmdashmdashmdashmdash
and relevant to communications in emergency management
the mass communication model is the most effective The
mass communications model has six elements 1) the send-
er 2) the message 3) the medium or channel 4) the receiv-
ers 5) relationship contexts and 6) the social environment
Therefore the sender is the source of the impact and can
influence how it is received (Broom et al 2013) Conse-
quently credibility intensifies information and could impact
how effective a message is A message is information that is
sent or given to someone
Furthermore from Cutlip and Center messages are cate-
gorized into ldquotext verbal multimedia print etcrdquo (Broom et
al 2013) Assumption suggests that emergency manage-
ment messages have to be clear and concise However in-
terpretation occurs when communicating with the masses
and must be considered as a potential obstacle when crafting
a message (Broom et al 2013) The medium or channel that
a message uses has equal importance to the message From
a 1971 body language study face-to-face communication
delivers effective communication information yet 70-90
of communication is through nonverbal cues like gestures
and facial expressions (Mehrabian 1971) Such direct com-
munication is valuable but using technology as a medium
for communication such as social media has resulted in
creating more ways to communicate during emergencies
(Broom et al 2013) These options should be explored
more fully in terms of emergency communications
Alertus Technologies is a unified mass notification com-
munication system Alertus is often used for large events
and companies for emergency situations Alertus utilizes a
combination of communication methods to maximize the
possibility of reaching all parties The different methods
include text messaging email public announcement sys-
tems digital signage and desktop computers A few compa-
nies that utilize Alertus Technologies include Disney
ESPN and Toronto Pan AM Sports Centre (Alertus Tech-
nologies 2018) This technology system appears to encom-
pass all communication systems However the full system
relies on the combination of systems Whether this combi-
nation is effective or not depends on how accurate or effec-
tive the communication is Alertus does what many arenas
are capable of but in a way that puts the control in a uni-
fied separate entity
Methodology
In developing a way to model response communication
the authors determined that a system dynamics model would
provide a new look at response communication Response
communication requires speed time and people Balancing
these three variables is essential to effective communica-
tion Some constants such as communication and evacua-
tion rate can be influenced by these variables Thus com-
munication is a system that can be made more effective and
accurate through modeling The systems dynamics model
being used was based on a Bass diffusion model Developed
in 1969 by Frank M Bass and John A Norton a Bass diffu-
sion model represents how a potential market is affected by
advertisers and word of mouth (1987) Advertising has the
potential to spread a concise clear and strong message with
little to no resources Thus this model is a great reference
for emergency communication
Regarding this specific project the Bass Diffusion model
was changed to reflect emergency communication This
method was chosen based on how well advertisement mir-
rors communication It necessitates and requires effective
understanding but also showcases errors that are corrected
based on an alternate system Bass diffusion takes commu-
nication by word of mouth into consideration and is a large
part of emergency communication If all emergency com-
munication systems were to fail word of mouth would still
be prevalent Thus word of mouth acts as a constant in this
current model of emergency response communication
However it has an obvious error rate regarding miscommu-
nication and timely understanding
Bass Diffusion Model
Figure 1 shows how initial method research was conduct-
ed in order to see how well a Bass Diffusion model could
adapt to emergency communication By replacing the popu-
lation to reflect the emergency at hand the communication
rate was no longer influenced by advertisement but by an
auditory public announcement (PA) system As mentioned
earlier word-of-mouth communication is still reflected and
influenced by contact rate and the evacuation message rate
(Norton amp Bass 1987) The model appeared to accurately
reflect evacuation message procedures including a delay
that reflects understanding or processing time
Regarding this study the error lies in uniformity of mes-
sage Different communication systems have different chal-
lenges The message to evacuate goes through several dif-
ferent paths thus some of the messages are delayed wheth-
er through human or technologically dictated circumstances
Developing a flowchart allowed the authors to show the
specific challenges associated with each system and how
they could apply to the model Figure 2 shows how the steps
associated with each system should result in understanding
This is where the Bass Diffusion model ends as understand-
ing implies that they have fully received the evacuation
message This does not account for the actual time that it
would take for a person to evacuate (a lengthier process)
mdashmdashmdashmdashmdashmdashmdashmdashmdashmdashmdashmdashmdashmdashmdashmdashmdashmdashmdashmdashmdashmdashmdashmdashmdashmdashmdashmdashmdashmdashmdashmdashmdashmdashmdashmdashmdashmdashmdashmdashmdashmdashmdashmdashmdashmdashndashmdashmdashmdashmdash
ANALYZING RESPONSE COMMUNICATION MITIGATION METHODS THROUGH SIMULATION MODELING 7
mdashmdashmdashmdashmdashmdashmdashmdashmdashmdashmdashmdashmdashmdashmdashmdashmdashmdashmdashmdashmdashmdashmdashmdashmdashmdashmdashmdashmdashmdashmdashmdashmdashmdashmdashmdashmdashmdashmdashmdashmdashmdashmdashmdashmdashmdashndashmdashmdashmdashmdash
mdashmdashmdashmdashmdashmdashmdashmdashmdashmdashmdashmdashmdashmdashmdashmdashmdashmdashmdashmdashmdashmdashmdashmdashmdashmdashmdashmdashmdashmdashmdashmdashmdashmdashmdashmdashmdashmdashmdashmdashmdashmdashmdashmdashmdashmdashndashmdashmdashmdashmdash
8 INTERNATIONAL JOURNAL OF ENGINEERING RESEARCH AND INNOVATION | V11 N1 SPRINGSUMMER 2019
an auditory PA system visual PA system texting notifica-
tion system and word of mouth Figure 3 shows these sys-
tems
Figure 3 Final bass diffusion model
For example limited research suggests that public an-
nouncement systems are 60 effective at distributing a
message (Alertus Technologies 2018) This comes from
public relations data as opposed to testing of several emer-
gency public announcement systems However this as-
sumes that the system is in perfect working order without
any limitations (noise miscommunication etc) Because
the model is highly flexible these circumstances can be
reflected by inputting different numbers into the effective-
ness variables Using averages obtained from studies of
similar systems effectiveness was a variable inputted at
different levels depending on which system was in use
Thus effectiveness for both public announcement systems
(auditory and visual) used the same initial effectiveness
rating of 60 while the texting system was given a 50
effectiveness rating but with a message rate of approximate-
ly 5 considering how often people would check their
phones in each emergency The five-second delay was im-
plemented in the program as well Text message systems
align closely with word of mouth as they are a technologi-
cal reflection of the same process but with higher numbers
Finally word-of-mouth communication had a contact rate
of approximately 11 as shown in prior Bass Diffusion
models Word of mouth is a communication system that
exists at all times visual and audible systems only boost this
system but it does require proximity in order to work In
this specific scenario people were in each proximity to the
event and the message However word of mouth will act as
a constant in this evacuation scenario The effectiveness
dictated by evacuation message rate was set to 50
Figure 1 Original bass diffusion model
Figure 2 Communication flowchart
The flowchart shows the four systems that could be mod-
eled in an evacuation communication scenario This is
meant to come from the viewpoint of evacuees not the first
responders that would arrive Therefore the communication
systems are all processes that the average person would
have available The four communication methods used were
mdashmdashmdashmdashmdashmdashmdashmdashmdashmdashmdashmdashmdashmdashmdashmdashmdashmdashmdashmdashmdashmdashmdashmdashmdashmdashmdashmdashmdashmdashmdashmdashmdashmdashmdashmdashmdashmdashmdashmdashmdashmdashmdashmdashmdashmdashndashmdashmdashmdashmdash
Pedestrian Traffic Model
Using an agent was necessary to show the second part of
the flowchart in which the message is spread through behav-
ior People are the distributors of messages and their behav-
ior should be considered Stadium evacuation simulation
has been used previously to measure crowd dynamics In
the aforementioned 2014 study of Ladd Pebbles Stadium
the researchers compared crowd simulation models The
chosen model was behavioral using agent-based modeling
as a means of crowd simulation This allows for a more ful-
ly formed approach to stadium emergency evacuation and
verifies that simulation can be used as a valid approach to
evacuation research (Aldana et al 2014)
Through AnyLogic 8rsquos pedestrian traffic library the mes-
sage spread can be shown in real time Figure 4 shows how
the message can be spread based on word-of-mouth data
Using a statechart one can base the message on a specific
variable as opposed to a parameter Therefore a statechart
was created to manipulate the message variable as opposed
to manipulating the parameters to reflect a variable The
statechart uses the same understanding and contact rate as
word-of-mouth communication This validates the Bass
Diffusion Model By using actual agents the modeling is
more successful than the systems dynamics model at dis-
playing contact information Additionally pedestrian mod-
eling will eventually show the full extent of evacuation as a
result of the communication systems not just the system
itself
Figure 4 Pedestrian model statechart
The physical structure of the pedestrian model is meant to
reflect stadium seating so that communication rate is as
close to realistic as possible Figure 5 shows that the model
uses two waiting areas with separate agents The agents all
begin as blue until the evacuation order is released Then
the message is sent Once one person has the message they
will turn red depending on contact and proximity Error is
included to account for misunderstanding due to chaos and
human error
Figure 5 Final pedestrian model
Ultimately the final pedestrian model simulates one nec-
essary communication method Additional methods will
require further modelling to validate and continue testing
This is something the researchers hope to pursue in the fu-
ture especially as new communication methods become
popular
Results
Using the results from the systems dynamics model the
researchers modeled the effectiveness of different commu-
nication systems Using word of mouth as a constant three
communication methods were compared against those ini-
tial values In the following charts (Figures 6-10) two lines
are shown The darker line is the level of potential evacuees
(the initial population) and the level of evacuees (the
amount of people that successfully received the message)
Acting as constant word of mouth effectively distributed
information in approximately 22 minutes As a reminder
this is not an evacuation time but the communication mes-
sage time As seen in Figure 6 the halfway point for the
communication rate is much further than any other system
mdashmdashmdashmdashmdashmdashmdashmdashmdashmdashmdashmdashmdashmdashmdashmdashmdashmdashmdashmdashmdashmdashmdashmdashmdashmdashmdashmdashmdashmdashmdashmdashmdashmdashmdashmdashmdashmdashmdashmdashmdashmdashmdashmdashmdashmdashndashmdashmdashmdashmdash
ANALYZING RESPONSE COMMUNICATION MITIGATION METHODS THROUGH SIMULATION MODELING 9
mdashmdashmdashmdashmdashmdashmdashmdashmdashmdashmdashmdashmdashmdashmdashmdashmdashmdashmdashmdashmdashmdashmdashmdashmdashmdashmdashmdashmdashmdashmdashmdashmdashmdashmdashmdashmdashmdashmdashmdashmdashmdashmdashmdashmdashmdashndashmdashmdashmdashmdash
mdashmdashmdashmdashmdashmdashmdashmdashmdashmdashmdashmdashmdashmdashmdashmdashmdashmdashmdashmdashmdashmdashmdashmdashmdashmdashmdashmdashmdashmdashmdashmdashmdashmdashmdashmdashmdashmdashmdashmdashmdashmdashmdashmdashmdashmdashndashmdashmdashmdashmdash
10 INTERNATIONAL JOURNAL OF ENGINEERING RESEARCH AND INNOVATION | V11 N1 SPRINGSUMMER 2019
Figure 6 Word-of-mouth communication only
Comparatively in Figure 7 a text system in combination
with word-of-mouth communication is only slightly better
taking approximately 20 minutes to spread an evacuation
message The system in question acted similarly if a single
message was sent and spread amongst a stadiumrsquos fan ser-
vice list This would give a large event area the greatest
chance at reaching patrons without using social media It
should be noted that this parameter will need to be studied
further to establish proper manipulation and realistic bound-
aries
Figure 7 Text system only
However the systems that were more successful at issu-
ing the message were the public announcement systems In
Figure 8 the audible public announcement system took ap-
proximately 10 minutes to communicate an evacuation mes-
sage As previously noted these conditions were almost
ideal for the public announcement system but also assumed
consistent communication being relayed at reasonable inter-
vals This system is necessary but also ignores some special
populations In Figure 9 the visual system was overwhelm-
ingly the best at successfully displaying an evacuation mes-
sage The system took approximately eight minutes to effec-
tively communicate an evacuation message This includes
the timing and understanding delay incorporated into the
data Additionally the authors included an example of all of
the combined communication methods in Figure 10 This
model took approximately nine minutes to complete show-
ing how multiple communication methods may negatively
affect a message spread when factoring in additional error
rates The all-methods communication scenario also reflects
an inundated communication system in which a consistent
error message breeds inaccuracies and response times
Figure 8 PA system only
Figure 9 VisPA system only
Figure 10 All communication methods
Ultimately the knowledge obtained from the resulting
information will help improve and test emergency commu-
nication methods This can be seen in the pedestrian model
in Figure 11 The pedestrian traffic model shows that con-
tact with the message was more realistic than a systems
model The model shows that contact rate does influence
how quickly a message spreads and how word of mouth is
the greatest influencer for that message In this project
word-of-mouth communication was shown to improve com-
munications and introduce error into any communication
mdashmdashmdashmdashmdashmdashmdashmdashmdashmdashmdashmdashmdashmdashmdashmdashmdashmdashmdashmdashmdashmdashmdashmdashmdashmdashmdashmdashmdashmdashmdashmdashmdashmdashmdashmdashmdashmdashmdashmdashmdashmdashmdashmdashmdashmdashndashmdashmdashmdashmdash
system Therefore it is possibly the greatest asset or hin-
drance to response communication The pedestrian model
helps validate that theory while also allowing further test-
ing to occur Though not yet in use this pedestrian traffic
model has applicability to other communication methods
and provides a more realistic understanding of how commu-
nication would occur in an actual emergency as opposed to
a hypothetical one The model above shows how contact
rate affects method spread as the blue dots change to red
when the message is effectively spread
Figure 11 Pedestrian traffic model
Discussion
Though all the communication systems are shown differ-
ently exploring communication contact rate as a key to ef-
fectiveness will need to be considered in subsequent trials
For example text messaging systems have the potential to
be the most effective evacuation communication method as
it can reach most people and is still accessible to those with
disabilities and those not in the main area of the stadium
where the visual and audible public announcement systems
are used However there is a possible issue in that the num-
ber of patrons on their phones could overload the cellular
signal and the text message does not go through undoing all
of the benefits Additionally audible public announcements
are the next most effective evacuation communication meth-
od This method is also capable of reaching all patrons not
only those in the main areas However the consideration of
those with special needs should occur as this method does
hinder the deaf or hard of hearing Also audible public an-
nouncements need to be used cautiously as aggressively
loud and commanding announcements could increase panic
and induce anxiety Testing will follow to see how valid this
system is to an actual evacuation Finally visual public an-
nouncement systems are the least effective of all three meth-
ods but the best in terms of understanding This method can
only reach patrons in the main areas and those who can
read observe and understand what is announced It does
not take blind patrons into consideration However if the
visual public announcement is flashed on and off it could
draw more attention to the message Additionally more
information could be given via visual public announcement
systems information which could be more easily updated
Conclusions
Though examining the results appears to suggest that the
visual public announcement system was the most effective
model this was only in regards to one factor It only reaches
a certain number of patrons at one time Therefore all meth-
ods of communication should use three reliable systems to
issue an evacuation message However the message would
need to be uniform and accurate for this model to work
While it is not feasible for all three methods to be consist-
ently running at the same time each situation would require
a specific combination of the three This question will re-
quire more consistent testing to deduce the correct order and
should be used in combination with the pedestrian model to
achieve the most realistic results As testing continues this
same question will apply to the pedestrian model and con-
tact rate Additionally incorporating social media as a com-
munication method will be considered moving forward
However this method has more complex intricacies with
obsolescence of equipment being a distinct possibility
Notably many of these systems can be altered to ensure
that they perform more effectively than their standards
These differences may mean that one system is more effec-
tive than another at a certain venue event or scenario
These alterations continue to affect word-of-mouth commu-
nication thus all three methods should be considered in
addition to this method Word-of-mouth communication
continues to be the communication at the base of each meth-
od deciding effectiveness and understanding of evacuation
The faster a message is understood the better the outcome
of an evacuation By assisting individual security the venue
is better prepared for an emergency The faster they re-
spond the more lives saved Therefore communicating
proper responses to patrons is the difference between life
and death
mdashmdashmdashmdashmdashmdashmdashmdashmdashmdashmdashmdashmdashmdashmdashmdashmdashmdashmdashmdashmdashmdashmdashmdashmdashmdashmdashmdashmdashmdashmdashmdashmdashmdashmdashmdashmdashmdashmdashmdashmdashmdashmdashmdashmdashmdashndashmdashmdashmdashmdash
ANALYZING RESPONSE COMMUNICATION MITIGATION METHODS THROUGH SIMULATION MODELING 11
mdashmdashmdashmdashmdashmdashmdashmdashmdashmdashmdashmdashmdashmdashmdashmdashmdashmdashmdashmdashmdashmdashmdashmdashmdashmdashmdashmdashmdashmdashmdashmdashmdashmdashmdashmdashmdashmdashmdashmdashmdashmdashmdashmdashmdashmdashndashmdashmdashmdashmdash
mdashmdashmdashmdashmdashmdashmdashmdashmdashmdashmdashmdashmdashmdashmdashmdashmdashmdashmdashmdashmdashmdashmdashmdashmdashmdashmdashmdashmdashmdashmdashmdashmdashmdashmdashmdashmdashmdashmdashmdashmdashmdashmdashmdashmdashmdashndashmdashmdashmdashmdash
12 INTERNATIONAL JOURNAL OF ENGINEERING RESEARCH AND INNOVATION | V11 N1 SPRINGSUMMER 2019
References
Aldana N Fox C Diehl E amp Dimitoglou G (2014) A
study of stadium exit design on evacuation perfor-
mance Proceedings of the 27th International Confer-
ence on Computer Applications in Industry and Engi-
neering Cary NC International Society for Computers
and Their Applications
Alertus Technologies (2018) Mobile notification Re-
trieved from httpswwwalertuscompersonal
ATampT Stadium operations manual (2018) Retrieved from
httpsattstadiumcomsitesdefaultfilesdc-content-
filesCity20of20Arlington20Policiespdf
Bankers Life Fieldhouse (2018) Fan guide Retrieved from
httpwwwbankerslifefieldhousecomarena-
informationfan-guide
Broom G M Sha B L Seshadrinathan S Center A H
amp Cutlip S M (2013) Cutlip and Centerrsquos effective
public relations (11th ed) Upper Saddle River NJ
Pearson
Burke K (2016) 73 texting statistics that answer all your
questions Retrieved from httpswwwtextrequestcom
blogtexting-statistics-answer-questions
Centers for Disease Control and Prevention [CDC] (2018)
Emergency preparedness and response Social media
Retrieved from httpsemergencycdcgovsocialmedia
indexasp
Department of Homeland Security [DHS] (2008) Evacua-
tion planning guide for stadiums Retrieved from
httpswwwdhsgovsitesdefaultfilespublications
evacuation-planning-guide-stadiums-508pdf
Department of Homeland Security [DHS] (2014) Com-
municating in an emergency Federal Emergency Man-
agement Agency Retrieved from https
trainingfemagovemiwebisis242bstudent
20manualsm_03pdf
Ellis R Fantz A Karimi F amp McLoughlin E C
(2016) Orlando shooting 49 killed shooter pledged
ISIS allegiance CNN Retrieved from https
wwwcnncom20160612usorlando-nightclub-
shootingindexhtml
Mehrabian A (1971) Silent messages Belmont CA
Wadsworth
Mileti D S amp Sorensen J H (1990) Communication of
emergency public warnings A social science perspec-
tive and state-of-the-art assessment Washington DC
FEMA Retrieved from httpsdoi1021726137387
Norton J A amp Bass F M (1987) A diffusion theory
model of adoption and substitution for successive gen-
erations of high-technology products Management
Science 33(9) 1-19
Proulx G (1995) Evacuation time and movement in apart-
ment buildings Fire Safety Journal 24(3) 229-246
Retrieved from httpsdoiorg1010160379-7112(95)
00023-M
Towson University (2018) Emergencies Retrieved from
httpswwwtowsonedupublicsafetyemergencies
Biographies
KATHERINE REICHART is a graduate student in
Homeland Security in the Computer Information Technolo-
gy program at Purdue University Her previous degree is in
professional writing also from Purdue University Addi-
tionally she is a member of the Purdue Homeland Security
Institute She has been involved in several research projects
in the institute Additionally she is an assistant editor on
several books in progress concerning those research topics
Her research will continue to focus on communication and
reporting methods of large event security Katherine
Reichart may be reached at kreicharpurdueedu
ANNA LARSON works for General Electr ic in De-
troit MI She earned her BS in Computer Information Tech-
nology from Purdue University and MS in Computer and
Information Technology 2018 from her alma mater Her
interests include disaster network communication and
cyberforensics Anna Larson may be reached at lar-
sonapurdueedu
KRISTAL SMITH works for Blue Horseshoe in Boul-
der CO She recently graduated from Purdue University
with her BS in Computer and Information Technology
While there she researched and participated in projects re-
garding emergency preparedness Kristal Smith may be
reached at smit2265purdueedu
J ERIC DIETZ PE graduated in 1984 with a BS and
again in 1986 with an MS in chemical engineering both
from the Rose-Hulman Institute of Technology He earned
his PhD in chemical engineering in 1994 from Purdue Uni-
versity where he is now a professor In 2004 he retired as a
Lieutenant Colonel from the US Army Thus his research
interests include optimization of emergency response
homeland security and defense energy security and engag-
ing veterans in higher education Dr Dietz may be reached
at jedietzpurdueedu
Abstract
Various 3D printer configurations such as Cartesian
printers operate similarly to a CNC machining center and
Delta printers that have a stationary build platform with the
use of three motors located on pillars controlling the end
effector location A less popular configuration is a Polar
system which utilizes a rotating table a Z translation con-
trolled by a linear actuator located beyond the edge of the
rotating table and a horizontal arm connected to the Z-axis
that translates the end effector along the center axis The
Polar 3D printer configuration being the simplest was cho-
sen in order to scale up to build and test a low-cost large-
scale 3D printer with a build envelope of 183m x 183m x
153m (6ft x 6ft x 5ft)
This open source hardware 3D printer (OSALS-Polar) can
be produced for approximately $5000 for materials assum-
ing that labor is provided by the user To 3D print a part
any CAD software is used to output a stereo lithography
(stl) file open source slicing software (Cura) to generate
the G-code file and open source software (Franklin) to op-
erate the 3D printer Testing the 3D printer requires calibra-
tion of the three axes to produce the desired positioning of
the Theta-axis rotation R-axis horizontal arm translation
and Z-axis vertical translation with the inputs into the
Franklin software Also the system is set to start at a zero
location according to distances set from the end-stop limit
switches The final testing of the OSALS-Polar produced
small extruded parts although the accuracy and scaling up
to larger parts not accomplished during this study Future
testing may encounter limitations in the size of prints due to
material cooling at various rates causing warpage Introduc-
tion
3D printing technology has become quite common and
increasingly applications for direct digital manufacturing
are being implemented RepRap (self-replicating machines)
3D printers (Sells Bailard Smith Bowyer amp Olliver 2010
Gibb 2014) are open source 3D printer designs available
for anyone to build According to Wittbrodt et al (2013)
the cost of an open source 3D printer used for printing
household components such as a pierogi mold or paper
towel holder can be recuperated within a year or two if a
reasonably fair number of household items are printed using
the 3D printer (Wittbrodt et al 2013 Wittbrodt 2014) The
3D printer build envelope (printer platform times the print-
ing height capability) can be a limitation of direct digital
manufacturing if the part exceeds this build envelope
Common desktop 3D printers have a build envelope of
203 mm (8 in) length x 203 mm (8 in) and width x 153
mm (6 in) height Larger-scale 3D printers ranging from
5 to 10 times the size of the common desktop 3D printers
are typically very expensive to produce
Methods of joining 3D-printed parts via acetone have
been successful in producing parts such as wind turbine
blades (Deshpande Rao Pradhan amp Irwin 2016) although
this method requires several manufacturing steps and can
decrease overall part accuracy The goal of the OSALS-
Polar is to manufacture larger 3D-printed parts (such as
wind turbine blades or propeller blades) that can be printed
in a single setup without needing to be joined together
Wind turbine blades can operate at potentially high RPMs
and any structural concerns lead directly to safety concerns
making it advantageous to 3D print as one continuous part
To overcome size restrictions of desktop 3D printers the
OSALS-Polar can cost under $5000 for materials assuming
the user provides the labor In this paper the authors de-
scribe the assembly and testing of the OSALS-Polar with a
build envelope of 183m x 183m x 153m (6ft x 6ft x 5ft)
The build instructions for this system are also described
here The open source software used to create the slice file
was Cura to operate OSALS-Polar the open source soft-
ware Franklin was used
Introduction
Currently there are many different 3D printer configura-
tions such as the X Y Z Cartesian coordinate 3D printers
that operate similar to a CNC machining center or the Del-
ta which has a stationary build platform with the extruder
operated by three vertical axis translations located on a tri-
angular base A less popular method for controlling the
movement of the axes is a Polar system Figure 1 shows a
benchmark 3D printer produced by Polar3D and its main
components This particular 3D printer has a build envelope
of 203m m (8 in) diameter x 153 mm (6 in) height The
Polar 3D system was used as a datum design to develop the
initial 91 OSALS-Polar CAD design and a set of manufac-
turing drawings The Polar 3D system utilizes a rotating
table (Theta-axis) with a horizontal arm (R-axis) that trans-
mdashmdashmdashmdashmdashmdashmdashmdashmdashmdashmdashmdashmdashmdashmdashmdashmdashmdashmdashmdashmdashmdashmdashmdashmdashmdashmdashmdashmdashmdashmdashmdashmdashmdashmdashmdashmdashmdashmdashmdashmdashmdashmdashmdashmdashmdashndashmdashmdashmdashmdash
Sourabh Prashant Deshpande University of Cincinnati Shrinivas Kulkarni Michigan Technological University
Sid Shah Michigan Technological University John Irwin Michigan Technological University
DEVELOPING AN OPEN SOURCE INEXPENSIVE
LARGE-SCALE POLAR CONFIGURATION 3D PRINTER
mdashmdashmdashmdashmdashmdashmdashmdashmdashmdashmdashmdashmdashmdashmdashmdashmdashmdashmdashmdashmdashmdashmdashmdashmdashmdashmdashmdashmdashmdashmdashmdashmdashmdashmdashmdashmdashmdashmdashmdashmdashmdashmdashmdashmdashmdashmdashmdashmdashmdash
INTERNATIONAL JOURNAL OF ENGINEERING RESEARCH AND INNOVATION | V11 N1 SPRINGSUMMER 2019 13
mdashmdashmdashmdashmdashmdashmdashmdashmdashmdashmdashmdashmdashmdashmdashmdashmdashmdashmdashmdashmdashmdashmdashmdashmdashmdashmdashmdashmdashmdashmdashmdashmdashmdashmdashmdashmdashmdashmdashmdashmdashmdashmdashmdashmdashmdashndashmdashmdashmdashmdash
mdashmdashmdashmdashmdashmdashmdashmdashmdashmdashmdashmdashmdashmdashmdashmdashmdashmdashmdashmdashmdashmdashmdashmdashmdashmdashmdashmdashmdashmdashmdashmdashmdashmdashmdashmdashmdashmdashmdashmdashmdashmdashmdashmdashmdashmdashndashmdashmdashmdashmdash
14 INTERNATIONAL JOURNAL OF ENGINEERING RESEARCH AND INNOVATION | V11 N1 SPRINGSUMMER 2019
lates the extruder along a single axis to and from the center
of the printing surface The vertical (Z-axis) translation in
this system is controlled by a linear power screw and guides
located beyond the edge of the rotating surface This Polar
style 3D printer was determined to be the simplest design
when compared to the Cartesian and Delta styles to up-
scale
Figure 1 Polar3D printer (About 2014) Reprinted with
permission
Review of Related 3D Printing Systems
Rapid developments in the field of 3D printing technolo-
gy have ranged in applications from prototyping to direct
digital manufacturing Berman (2012) compares the revolu-
tion of 3D printing technology with the digital books revo-
lution and foresees its use in several promising applications
such as medicine and construction Gebler Uiterkamp amp
Visser (2014) discussed 3D printing technology in terms of
sustainability and asserted that this technology will lower
resource demands energy use and carbon dioxide emis-
sions over the entire lifecycle According to Wohlers
(2013) use of additive manufacturing technology for direct
part production has increased by more than 25 in the last
few years
Significant efforts are underway to build a large-scale 3D
printing system to manufacture large-scale industrial com-
ponents Barnett and Gosselin (2013) designed a novel large
-scale 3D printer with a cable-suspended mechanism and a
full scaffolding solution However most of the research on
large-scale 3D printers is based on Cartesian and Delta sys-
tem configurations A typical Polar 3D printing system has
a higher build volume with fewer components when com-
pared with other types (Yusuf 2015) A true Polar 3D print-
er has a rotating build plate (Theta-axis) with the vertical
arm (Z-axis) and the extruder placed on the horizontal arm
(R-axis) Any point on a flat plane can be defined by know-
ing its angle theta pole vertical location and a measure of
radius from an axis through the given pole (Horn amp Haus-
man 2017)
A Cincinnati-based Polar 3D technology company uses
fused-filament fabrication technology for a Polar 3D printer
having 2032 mm (8 in) diameter 15875 mm (625 in)
height with connectivity features such as Wi-Fi Ethernet
and USB (About 2014) R-360 is an open source Polar 3D
printer with 210 mm (826 in) disc x 200 mm (787 in)
with a total printing volume of 6927000 mm3 (42271 in3)
It uses PLA or ABS as the printing material and has a maxi-
mum printing speed of 150 mms along with features such
as cloud slicing (Replicator 2013 Farcas 2016) Another
Polar 3D printer with 3048 mm (12 in) diameter and
150 mm (59 in) height has some major features which
include the use of four extruders and Decapede electronics
for driving 10 stepper motors (Anderson 2014) The
PiMaker 3D printer also uses the Polar system with
2794 mm (11 in) diameter and 2032 mm (8 in) height
with an overall volume of over 10650000 mm3 (650 in3)
(Steele 2016) 3D printers have also been made on modest
budgets such as a senior project by Hoy (2016) who devel-
oped a Polar 3D printer having 1778 mm (7 in) diameter
that uses PLA filament
Polar 3D Printer Design
The OSALS-Polar is designed manufactured and assem-
bled by configuring the Theta-axis Z-axis and R-axis re-
spectively Engineering requirements are mapped using
QFD methodology The material for the table surface verti-
cal and horizontal supports and the rotation drive system
are selected using the decision matrix method Accordingly
the major items selected are a tubular steel structure circu-
lar glass printing plate circular steel plate table extruded
aluminum horizontal arm and stepper motors for axis mo-
tion PFMEA is carried out to identify and reduce the poten-
tial failures in the system The circular glass printing plate
has the highest RPN value for which the use of glass edge
guards is recommended to avoid breakage andor injury
The main frame is made up of steel I-beams and steel
tubular sections welded together to manufacture the table
frame Then pivot tabs welded to both the bottom frame
and table frame provide assembly alignment and leveling
capabilities The steel table has a center shaft that is placed
in the table frame center bearing after proper lubrication of
all the parts Figure 2 shows the assembly after fixing the
table roller bearings center bearing and the casters to the
frame
Vertical Z-axis
Horizontal R-axis
Table Theta-axis
mdashmdashmdashmdashmdashmdashmdashmdashmdashmdashmdashmdashmdashmdashmdashmdashmdashmdashmdashmdashmdashmdashmdashmdashmdashmdashmdashmdashmdashmdashmdashmdashmdashmdashmdashmdashmdashmdashmdashmdashmdashmdashmdashmdashmdashmdashndashmdashmdashmdashmdash
Figure 2 Frame assembly
The main power transmission component for the Theta-
axis rotating table is a stepper motor turning a spur gear
driving an internal ring gear The internal ring gear is manu-
factured by machining 10 segments that together form the
15875 mm (625 in) pitch diameter internal ring gear The
pinion gear is mounted to a NEMA 34-stepper motor that
drives the ring gear Despite several challenges introduced
in the system such as improper mating of the ring gear sec-
tions providing larger clearance holes on the ring gear seg-
ment enabled smoother motion The use of flexible pads in
stepper motor mounting also helped to minimize the inaccu-
racies in the gear alignment (Pradhan Irwin Siddegowda
amp Harsha 2016) The internal gear drive mechanism shown
in Figure 3 facilitates improved rotary motion of the table
over the originally designed center worm-gear configuration
that had many backlash issues
Figure 3 Theta-axis drive mechanism
Figure 4 shows how the vertical Z-axis beam is bolted
securely to the main frame which supports the horizontal
arm R-axis and the extruder The Z-axis mounting bracket is
used to attach the R-axis motor accommodate the acme nut
and also fix the R-axis horizontal arm in place The acme
rod is coupled to the Z-axis motor shaft with a straight cou-
pling with no gearing or reduction Two guide rails are de-
signed for the travel of the Z-axis FEA was carried out on
the system after which support brackets were added from
the guide rails to the vertical Z-axis beam accordingly in
order to avoid the deflection of the extruder through its trav-
el
Figure 4 Vertical Z-axis
The R-axis carriage wheels are locked into grooves on the
R-axis horizontal arm while a timing belt drive system
shown in Figure 5 controls the translating motion Figure 6
shows how the extruder extruder motor and hot end are
integrated into the carriage assembly The extruder hot end
bracket and spool holder were manufactured using 3D
printing
Figure 5 Drive system R-axis
Polar 3D Printer Controls
An electrical box houses the circuitry and auxiliary elec-
tronic components Figure 7 shows how the unit is fixed to
the back side of the vertical arm of the OSALS-Polar
Main Frame
Table Frame
Ring Gear Segment
Motor and Pinion Gear
Z-axis Mounting Bracket
R-axis
Guide Rails
Z-axis Vertical Beam
Timing Belt Drive System
mdashmdashmdashmdashmdashmdashmdashmdashmdashmdashmdashmdashmdashmdashmdashmdashmdashmdashmdashmdashmdashmdashmdashmdashmdashmdashmdashmdashmdashmdashmdashmdashmdashmdashmdashmdashmdashmdashmdashmdashmdashmdashmdashmdashmdashmdashndashmdashmdashmdashmdash
DEVELOPING AN OPEN SOURCE INEXPENSIVE LARGE-SCALE POLAR CONFIGURATION 3D PRINTER 15
mdashmdashmdashmdashmdashmdashmdashmdashmdashmdashmdashmdashmdashmdashmdashmdashmdashmdashmdashmdashmdashmdashmdashmdashmdashmdashmdashmdashmdashmdashmdashmdashmdashmdashmdashmdashmdashmdashmdashmdashmdashmdashmdashmdashmdashmdashndashmdashmdashmdashmdash
mdashmdashmdashmdashmdashmdashmdashmdashmdashmdashmdashmdashmdashmdashmdashmdashmdashmdashmdashmdashmdashmdashmdashmdashmdashmdashmdashmdashmdashmdashmdashmdashmdashmdashmdashmdashmdashmdashmdashmdashmdashmdashmdashmdashmdashmdashndashmdashmdashmdashmdash
16 INTERNATIONAL JOURNAL OF ENGINEERING RESEARCH AND INNOVATION | V11 N1 SPRINGSUMMER 2019
Figure 6 Carriage assembly R-axis
Figure 7 Electrical box layout
The circuitry includes RAMPS 14 controller and a Bea-
glebone connected with a bridge board All of the electrical
components were integrated into the RAMPS 14 controller
Figure 8 shows the wiring diagram for the RAMPS 14 To
adhere to the ldquoaffordablerdquo goal of the OSALS-Polar stepper
motors were used rather than servo motors to facilitate the
movement of the three axes The motion of the axes is ena-
bled by three DQ542MA micro-step drivers Each stepper
driver is controlled by Franklin firmware through a Pololu
A4988 stepper driver carrier mounted on the RAMPS 14
board The steps per revolution and the input current for
each axis motor were set using the DIP switches on the mi-
cro-step drivers The DIP switches were set with 1 3 6 and
8 in the ldquoonrdquo position and 2 4 5 and 7 in the ldquooffrdquo posi-
tion Switches 1 2 and 3 were set to the on off and on
positions respectively to match the motor current
(amperes) of 191 at peak and 136 RMS Switch 4 was set
to the off position so that standstill current would be half of
the selected dynamic current The Micro step resolution was
set to 6400 by setting switches 5 6 7 and 8 to the off on
off and on positions respectively
The RAMPS 14 also controls the extruder assembly
which consists of an extruder motor a hot end to melt the
filament a cooling fan to control the outer temperature of
the hot end and a thermistor to indicate the hot end temper-
ature Figure 8 shows the wiring diagram for RAMPS 14 A
Pololu A4988 stepper driver carrier was also used to control
the extruder motor however for this motor no micro-step
driver was needed The stepper drivers get power from a
36V power supply Power for the extruder motor fan and
the hot end are provided through the RAMPS 14 Since no
heated bed is used in this printer a 12V power supply is
connected to the heated bed port to externally power the
RAMPS 14 and direct that power to the extruder motor hot
end and fan
Figure 8 Ramps 14 wiring diagram
Figure 9 shows how mechanical end stops on each axis
allow the printer to start from a reference point End stops
can be mounted on the maximum or minimum position of
an axis Since the zero for this printer is set at the center of
the rotating table the end stops are located at the maximum
position for the R-axis and Z-axis Thus the end stops are
connected to the pins corresponding to the maximum posi-
tion on the RAMPS 14 board
Carriage Assembly
Circuitry
Stepper Drivers
Power Supply
mdashmdashmdashmdashmdashmdashmdashmdashmdashmdashmdashmdashmdashmdashmdashmdashmdashmdashmdashmdashmdashmdashmdashmdashmdashmdashmdashmdashmdashmdashmdashmdashmdashmdashmdashmdashmdashmdashmdashmdashmdashmdashmdashmdashmdashmdashndashmdashmdashmdashmdash
Figure 9 End stop mounting
The RAMPS 14 circuit board is connected to a Beagle-
bone loaded with the Franklin firmware The OSALS-Polar
can be operated by connecting to the Beaglebone using an
Ethernet cable from any host computer Figure 10 shows
how the Franklin software is accessed through a Web ad-
dress in order to pull up a user interface The printer config-
uration setup is completed on this user interface The vari-
ous attributes of the Franklin firmware are then mapped
with the pins on RAMPS 14 using the pin assignments
shown in Table 1
Figure 11 shows the flow of signals from Beaglebone to
the axis motors and the extruder assembly This figure also
shows a schematic diagram of the various components con-
trolled by the Franklin firmware
Z-axis
R-axis
Theta-axis
Axis Motors Extruder Assembly
R Axis Theta Axis Z Axis
X_STEP_PIN 54 Y_STEP_PIN 60 Z_STEP_PIN 46 E_STEP_PIN 26
X_DIR_PIN 55 Y_DIR_PIN 61 Z_DIR_PIN 48 E_DIR_PIN 28
X_ENABLE_PIN 38 Y_ENABLE_PIN 56 Z_ENABLE_PIN 62 E_ENABLE_PIN 24
X_MIN_PIN 3 Y_MIN_PIN 14 Z_MIN_PIN 18 FAN_PIN 9
X_MAX_PIN 2 Y_MAX_PIN 15 Z_MAX_PIN 19 HEATER_PIN 10
THERMISTOR 13
Table 1 Pin mapping
Figure 10 Franklin software settings
mdashmdashmdashmdashmdashmdashmdashmdashmdashmdashmdashmdashmdashmdashmdashmdashmdashmdashmdashmdashmdashmdashmdashmdashmdashmdashmdashmdashmdashmdashmdashmdashmdashmdashmdashmdashmdashmdashmdashmdashmdashmdashmdashmdashmdashmdashndashmdashmdashmdashmdash
DEVELOPING AN OPEN SOURCE INEXPENSIVE LARGE-SCALE POLAR CONFIGURATION 3D PRINTER 17
mdashmdashmdashmdashmdashmdashmdashmdashmdashmdashmdashmdashmdashmdashmdashmdashmdashmdashmdashmdashmdashmdashmdashmdashmdashmdashmdashmdashmdashmdashmdashmdashmdashmdashmdashmdashmdashmdashmdashmdashmdashmdashmdashmdashmdashmdashndashmdashmdashmdashmdash
mdashmdashmdashmdashmdashmdashmdashmdashmdashmdashmdashmdashmdashmdashmdashmdashmdashmdashmdashmdashmdashmdashmdashmdashmdashmdashmdashmdashmdashmdashmdashmdashmdashmdashmdashmdashmdashmdashmdashmdashmdashmdashmdashmdashmdashmdashndashmdashmdashmdashmdash
18 INTERNATIONAL JOURNAL OF ENGINEERING RESEARCH AND INNOVATION | V11 N1 SPRINGSUMMER 2019
Figure 11 Electrical component diagram
OSALS-Polar Operation Methods
3D printing is carried out by using CAD to output a stereo
lithography (stl) file slicing software (Cura) to generate the
G-code file and Franklin to operate the OSALS-Polar Sie-
mens PLM NX CAD software can be used to insert the for-
mulas and expressions for the parametric modeling intent
(Irwin 2013) and to export it in an stl file format The stl
file is loaded in Cura and prepared for 3D printing Some
overhang parts shallower than 45ordm may require the use of
support material (France 2013) The machine type in Cura
is set to Custom FDM printer with PLA material The poly-
mer filament used can be either polylactic acid (PLA) or
acrylonitrile butadiene styrene (ABS) converting it into a
physical object by depositing it in thin sequential layers
PLA is used in this printer rather than ABS because of its
lower melting temperature and superior adhesion to the
glass substrate The layer height shell thickness fill densi-
ty print speed retraction distance and print temperature are
some of the parameters that are set and calibrated as per the
print material and output quality requirements The slicing
software converts this stl file into consecutive thin layers to
generate G-code (Cano 2015) The commonly used open
source slicing software includes Cura and Slic3r Repetier
The Polar 3D company provides cloud services where the
CAD model can be converted to slices online and then
downloaded to run the code
Franklin is a Web-based 3D control system to regulate the
machining process parameters with any internet-connected
device The main function of this software shown in Figure
12 is to drive the hardware systems by integrating with the
slicer software program (Wijnen Anzalone Haselhuhn
Sanders amp Pearce 2016)
Figure 12 Franklin software
The software aims to be more powerful and user-friendly
by having improved robustness system reliability (error
checking) and a powerful scripted interface to smoothly run
the G-code specifically for the large-scale 3D printing and
sophisticated scientificmedical designs The main commu-
nication interfaces for this software include
1 Web socket connection to the browser or script client
(JSON array)
2 Franklin Server and Franklin Python driver (JSON
array)
3 Franklin Python driver and Franklin C driver (binary
packet)
4 Franklin C driver and Franklin interface (physical
serial line)
Calibrating the printer is important in order to ensure the
accuracy of positioning of the nozzle and distance traveled
along the respective axes Calibration includes choosing the
right amount of current and micro-stepping for the three
axes It is also important to calibrate the absolute zero posi-
tion for the three axes The dip switches on the motor driv-
ers are used to set the amount of current for each motor and
were set to half current for this system Micro-stepping is
decided based on the torque requirements and the necessary
motion accuracy The motor stepper drivers were set to 800
pulses per revolution for the Z-axis and 6400 pulses per
revolution for the Theta- and R-axes Micro-steps are also
set using the dip switches on the stepper motor drivers The
number of revolutions are calculated to enter Franklin soft-
ware based on the 200-step-per-revolution motors Equation
1 was used to calculate the new steps for the R- and Z-axes
(Pearce 2014) For the Theta-axis the distances are re-
placed with the desired and actual angles which can be cali-
brated by the same method
Beaglebone-
Franklin Firmware
RAMPS 14
Stepper Motor
Driver
Extruder
Assembly
Thermistor
Extruder Motor
Hot End
Axes Motors
(R Theta and Z) Cooling Fan
Franklin Software
Franklin Firmware
Handling low-level interface
(Temp control GPIO pins
Stepper motors control) and
communicating with serial
interface
Franklin Server
Web interface by handling
multiple devices
Franklin C Driver
Handling
functions written
in C++
Franklin Python
Driver
mdashmdashmdashmdashmdashmdashmdashmdashmdashmdashmdashmdashmdashmdashmdashmdashmdashmdashmdashmdashmdashmdashmdashmdashmdashmdashmdashmdashmdashmdashmdashmdashmdashmdashmdashmdashmdashmdashmdashmdashmdashmdashmdashmdashmdashmdashndashmdashmdashmdashmdash
Steps in firmware x Desired distance
Actual distance traveled during testing (1)
The Z-axis travel was calculated as 254 mmrev by con-
verting the 0100-inch pitch for the 1rdquo-10-threads-per-inch
acme screw to metric units Finally the Theta-axis travel
has 500 teeth on the internal ring gear and 24 teeth on the
pinion thus from Equation 2 the table rotates 1728 de-
grees per motor revolution
(2)
Finally Table 2 shows that the Franklin software requires
an entry for stepsmm or stepsdegree for each motor based
on the motor stepper driver pulses per revolution The num-
ber of micro-step pulses per revolution are divided by the
travel per revolution for each axis as given by Equation 3
Franklin Coupling setting (stepsmm) =
Micro stepsAxis travel (mmrev or degreesrev) (3)
To finely tune the OSALS-Polar Equation 4 was used to
calculate a calibrated number of steps for the R- and Z-axes
(Pierce 2014) For the Theta-axis the distances were re-
placed with the desired and actual angles which can be cali-
brated by the same method
Calibrated Franklin Coupling setting (stepsmm) =
Original stepsmm in Franklin x Desired distance (4)
Actual distance traveled during testing
Absolute zero was calibrated by first marking the center
on the rotating table Reference positions are set by homing
the machine using the Franklin interface The limit switch
positions in Franklin are changed to specify the distance
between reference points and absolute zero For the R-axis
a fixed end stop was placed on the horizontal arm bracket
and the switch position calibrated to 820 mm in Franklin
Similarly for setting the Z-axis switch position can be cali-
brated by using a paper gage (01 mm thickness) on at least
four equiangular points of the circular base Currently the
Z-axis switch position was set to 96 mm For the Theta-axis
the reference point used was zero The movement accuracy
for the Z- and R-axes were tested by using dial indicators to
validate that the software could manually jog the axis the
desired distances For the theta axis one complete revolu-
tion is measured when the axis is jogged 360ordm When the
OSALS-Polar is successfully calibrated it is ready to create
a 3D-printed part
Results of 3D Printing
By manually jogging the Z- and R-axes in the Franklin
interface measurements taken with a 12-inch travel dial
indicator length gage indicate precision from zero to 1 mm
For the Theta-axis a 360ordm rotation varies within 1ordm indicat-
ed by an alignment mark on the table and stationary frame
Causes for variations in travel of the R- and Theta-axes are
due to the timing belt and gear as well as the ring gear and
pinion interfaces Adjusting the Theta-axis motor too tightly
against the internal ring gear will cause the gear teeth to
bind and stop rotating So the looser fit in the mating of the
gear teeth causes some backlash The R-axis belt having a
9525 mm pitch yields a travel of 17145 mm per motor
revolution so a finer pitch belt will improve the R-axis pre-
cision The Z-axis accuracy is due to the tight connection of
the motor shaft to the acme screw eliminating backlash and
slippage
Figure 13 shows various geometries for testing the
OSALS-Polar which include a cylinder and cuboid Initial
test results for the 50x50x5 mm-high part were unsuccessful
in achieving accurate and smooth surface results The print-
ing time was estimated at 15 minutes which was approxi-
mately the time for the trial test Figures 14 and 15 show the
actual printed part and the top surface which is angled low-
er towards the center of the printing surface This result was
consistent with all sample test prints and was likely caused
by the R-axis planar misalignment with the Theta-axis table
surface The R-axis arm deflected slightly downward as the
extruder mechanism reached the end of its travel at the cen-
ter of the table The deflection of the R-axis arm caused the
extruder nozzle to drag over the surface of the part as the
Theta-axis rotated and the R-axis translated thereby form-
ing a buildup of plastic on the leading edge of the printed
path
te e th r in g g e a rT h e ta -a x is tr a v e l (d e g re e s re v ) = 3 6 0
te e th p in io n
Axis Steps Number of teeth Pitch type Pitch
(inches) Pitch per revolution Micro-steps Actual Steps
r 200 18 Linear 0375 17145 mmrev 6400 3732 mm
theta 200 Pinion 24
Circular - 1728 degreesrev 6400 37037degree Ring Gear 500
z 200 - Acme 01 254 mmrev 800 31496mm
Table 2 Step values set in Franklin
mdashmdashmdashmdashmdashmdashmdashmdashmdashmdashmdashmdashmdashmdashmdashmdashmdashmdashmdashmdashmdashmdashmdashmdashmdashmdashmdashmdashmdashmdashmdashmdashmdashmdashmdashmdashmdashmdashmdashmdashmdashmdashmdashmdashmdashmdashndashmdashmdashmdashmdash
DEVELOPING AN OPEN SOURCE INEXPENSIVE LARGE-SCALE POLAR CONFIGURATION 3D PRINTER 19
mdashmdashmdashmdashmdashmdashmdashmdashmdashmdashmdashmdashmdashmdashmdashmdashmdashmdashmdashmdashmdashmdashmdashmdashmdashmdashmdashmdashmdashmdashmdashmdashmdashmdashmdashmdashmdashmdashmdashmdashmdashmdashmdashmdashmdashmdashndashmdashmdashmdashmdash
mdashmdashmdashmdashmdashmdashmdashmdashmdashmdashmdashmdashmdashmdashmdashmdashmdashmdashmdashmdashmdashmdashmdashmdashmdashmdashmdashmdashmdashmdashmdashmdashmdashmdashmdashmdashmdashmdashmdashmdashmdashmdashmdashmdashmdashmdashndashmdashmdashmdashmdash
20 INTERNATIONAL JOURNAL OF ENGINEERING RESEARCH AND INNOVATION | V11 N1 SPRINGSUMMER 2019
Figure 13 Cura file 50x50x5mm high
Figure 14 Initial test part 50x50x5mm high
Figure 15 Part accuracy
The results of the 50x50x5 mm-high part were difficult to
measure with precise accuracy due to the uneven surface
Unwanted movement of the horizontal arm was reduced by
adding additional screws to secure the vertical axis guide
rods to the mounting rails which improved the stability of
the arm The PLA material spool was removed from the
R-axis extruder assembly to decrease possible deflection of
the arm but this did not significantly improve print quality
The Theta- and R-axes motors need to move simultaneously
for the extruder tool to move in a straight line using conver-
sions performed in the Franklin C driver which sends the
Franklin Firmware a list of numbers of steps to move in
either the positive or negative direction The firmware takes
this list and sends the steps to the motors The reason for the
inaccuracies in the 3D-printed part can be attributed to the
Theta- and R-axes not operating simultaneously at the same
speed The Franklin coupling settings (stepsmm) in Delta-
style 3D printers using the Franklin Firmware have had all
motors for the extruder tool movement set to the same
stepmm value
Using a larger diameter nozzle will alleviate some inaccu-
racies due to the large scale of the OSALS-Polar and re-
duce overall printing time Proper retraction and travel
speed settings in the Cura software will minimize the string-
ing and oozing issues in the part Some of the other issues
that arose during testing included hot-end jamming though
only when the nozzle was too close to the table Adjusting
the Z-axis motor switch settings during the calibration pro-
cess will correct this problem
Conclusions
The advantages of the OSALS-Polar 3D printer include a
large print volume but with a large mechanical device
there are disadvantages in the scaling-up of inaccuracies in
planar and perpendicularity of components The OSALS-
Polar can successfully operate in the R- and Z-axes with
precision with 1 mm accuracy and in the Theta-axis within
1ordm The Franklin software efficiently controls the tempera-
ture of the hot end at the desired 210ordm C within a range of
plusmn2ordm The Franklin software can operate the extruder motor
to feed the 3-mm-diameter PLA material through the hot
end nozzle at the desired rate The G-code generated from
Cura for a cylinder and cuboid test are not producing an
accurate result at this time but all three axes are operating
automatically when the G-code is initiated
The OSALS-Polar is deemed a partial success at this
point due to having accomplished most of the projectrsquos
goals This printer was relatively inexpensive to constructmdash
under $5000 for materials It operates using open source
Franklin software that is continuously being improved The
mdashmdashmdashmdashmdashmdashmdashmdashmdashmdashmdashmdashmdashmdashmdashmdashmdashmdashmdashmdashmdashmdashmdashmdashmdashmdashmdashmdashmdashmdashmdashmdashmdashmdashmdashmdashmdashmdashmdashmdashmdashmdashmdashmdashmdashmdashndashmdashmdashmdashmdash
final testing of the system produced small extruded parts
although the accuracy and scaling up to larger-sized parts
was not accomplished Further work is planned in order to
determine if the inaccuracies in the printed parts are due to
the non-planar R-axis and Theta-axis table The level of the
R-axis arm and the printing surface can be adjusted with
metal shims New conversions may be necessary by the
Franklin C driver to take into account the differences in the
stepsmm Franklin coupling settings for the Theta- and
R-axes motors In the future testing of larger parts may
encounter limitations in the size of prints due to material
cooling at various rates and causing warpage
Acknowledgements
Appreciation for troubleshooting of the Franklin software
for Gerald Anzalone research engineer Michigan Techno-
logical University Also assistance in testing data collec-
tion and troubleshooting of the OSALS-Polar from MS in
Mechanical Engineering students Sachin Rana and Divy
Patel is much appreciated
References
About Polar 3D LLC (2014) Retrieved from https
aboutPolar3dcomprinter
Anderson T (2014) Theta printer A 3D printer with 4
extruders that can move independently and simultane-
ously Retrieved from httpshackadayioproject812-
theta-printer
Barnett E amp Gosselin C (2015) Large-scale 3D printing
with a cable-suspended robot Additive Manufacturing
7 27-44
Berman B (2012) 3-D printing The new industrial revolu-
tion Business Horizons 55(2) 155-162
Cano L M (2015) 3D printing A powerful new curricu-
lum tool for your school library a powerful new cur-
riculum tool for your school library Goleta CA ABC-
CLIO
Deshpande S Rao N Pradhan N amp Irwin J L (2016
November) Hybrid polymer additive manufacturing of
a Darrieus type vertical axis wind turbine design to
improve power generation efficiency Proceedings of
the ASME 2016 International Mechanical Engineering
Congress and Exposition New York ASME
France A K (2013) Make 3D printing The essential
guide to 3D printers Sebastapol CA Maker Media
Inc
Farcas K (2016) R 360 Retrieved from httprepraporg
wikiR_360
Gebler M Uiterkamp A J S amp Visser C (2014) A
global sustainability perspective on 3D printing tech-
nologies Energy Policy 74 158-167
Gibb A (2014) Building open source hardware DIY man-
ufacturing for hackers and makers Carmel IN Pear-
son Education
Horne R amp Hausman K K (2017) 3D printing for dum-
mies New York John Wiley amp Sons
Hoy B (2016) Design and implementation of a three di-
mensional printer using a cylindrical printing process
Retrieved from httpsdigitalcommonscalpolyeducgi
viewcontentcgireferer=httpssearchyahoocom
amphttpsredir=1amparticle=1370ampcontext=eesp
Irwin J (2013) Wind turbine blade CAD models used as
scaffolding technique to teach design engineers Engi-
neering Design Graphics Journal 77(2) 1949-1967
Pearce J M (2014) MOST RepRap build Retrieved from
httpwwwappropediaorg
MOST_RepRap_BuildCalibration
Pradhan N K Irwin J L Siddegowda B R amp Harsha
S (2016) Design and fabrication of the power trans-
mission system of a large scale 3D printer Proceedings
of the Association of Technology Management and
Applied Engineering Conference New York ATMAE
Replicator Warehouse R-360 The most simple and modu-
lar 3D printer (2013) Retrieved from https
wwwkickstartercomprojects2132002936r-360-the-
most-simple-and-modular-3d-printer
Sells E Bailard S Smith Z Bowyer A amp Olliver V
(2010) RepRap the replicating rapid prototyper Max-
imizing customizability by breeding the means of pro-
duction In F T Pillar amp M M Tseng (Eds) Hand-
book of research in mass customization and personali-
zation (pp 568-580) River Edge NJ World Scientific
Steele W (2013) PiMaker 3D printer Retrieved from
httpswwwthingiversecomthing128700
Wijnen B Anzalone G C Haselhuhn A S Sanders P
G amp Pearce J M (2016) Free and open source con-
trol software for 3-D motion and processing Journal of
Open Research Software 4(1) Retrieved from http
dxdoiorg105334jors78 Wittbrodt B T (2014) Development of practical applica-
tions for RepRap style 3-D printers in engineering
(Unpublished doctoral dissertation) Michigan Techno-
logical University Houghton MI
Wittbrodt B T Glover A G Laureto J Anzalone G
C Oppliger D Irwin J L amp Pearce J M (2013)
Life-cycle economic analysis of distributed manufactur-
ing with open source 3-D printers Mechatronics 23(6)
713-726
Wohlers T (2013) Wohlers report 2013 Additive manu-
facturing and 3D printing state of the industrymdashAnnual
worldwide progress report Fort Collins CO Wohlers
Associates
Yusuf B (2015) 3D printers explained Delta Cartesian
Polar Scara Retrieved from httpsall3dpcomknow-
your-fdm-3d-printers-cartesian-delta-Polar-and-scara
mdashmdashmdashmdashmdashmdashmdashmdashmdashmdashmdashmdashmdashmdashmdashmdashmdashmdashmdashmdashmdashmdashmdashmdashmdashmdashmdashmdashmdashmdashmdashmdashmdashmdashmdashmdashmdashmdashmdashmdashmdashmdashmdashmdashmdashmdashndashmdashmdashmdashmdash
DEVELOPING AN OPEN SOURCE INEXPENSIVE LARGE-SCALE POLAR CONFIGURATION 3D PRINTER 21
mdashmdashmdashmdashmdashmdashmdashmdashmdashmdashmdashmdashmdashmdashmdashmdashmdashmdashmdashmdashmdashmdashmdashmdashmdashmdashmdashmdashmdashmdashmdashmdashmdashmdashmdashmdashmdashmdashmdashmdashmdashmdashmdashmdashmdashmdashndashmdashmdashmdashmdash
mdashmdashmdashmdashmdashmdashmdashmdashmdashmdashmdashmdashmdashmdashmdashmdashmdashmdashmdashmdashmdashmdashmdashmdashmdashmdashmdashmdashmdashmdashmdashmdashmdashmdashmdashmdashmdashmdashmdashmdashmdashmdashmdashmdashmdashmdashndashmdashmdashmdashmdash
22 INTERNATIONAL JOURNAL OF ENGINEERING RESEARCH AND INNOVATION | V11 N1 SPRINGSUMMER 2019
Biographies
SOURABH PRASHANT DESHPANDE is a PhD stu-
dent in the Mechanical Engineering Program at the Univer-
sity of Cincinnati with a focus on additive manufacturing
Mr Deshpande may be reached at sourabhdmtuedu
SHRINIVAS KULKARNI is an MS student in the
Mechanical Engineering Program at Michigan Technologi-
cal University with a focus on additive manufacturing Mr
Kulkarni may be reached at skulkar2mtuedu
SID SHAH is an MS student in the Mechanical Engi-
neering Program at Michigan Technological University
with a focus on additive manufacturing Mr Shah may be
reached at ssshah1mtuedu
JOHN IRWIN is a professor of mechanical engineer -
ing technology at Michigan Technological University He
earned his EdD in Curriculum and Instruction in 2005 from
Wayne State University Dr Irwinrsquos research interests in-
clude STEM education CADCAM and CAE residential
wind turbine design and additive manufacturing methods
Dr Irwin may be reached at jlirwinmtuedu
-plate collector was enclosed by double-glazing that admit-
ted solar radiation and minimized convection heat transfer
losses to the environment The shell of the collector was
insulated to reduce conduction losses This system likewise
utilized a coiled copper heat exchanger coil to transfer heat
from the working fluid to an insulated storage tank The
water flow through the receiver was obtained by means of
an off-the-shelf circulation pump As described subsequent-
ly this system was then fully instrumented to measure the
working fluid flow rate and temperatures as well as the
receiver and cover plate temperature in an effort to esti-
mate thermal losses The goal of the present study was to
assess whether a solar water heating system constructed
using relatively inexpensive scavenged components could
exhibit thermal efficiency equivalent to that of a more ex-
pensive vacuum tube solar collector system that is available
for sale
It has been demonstrated (ASHRAE 2015) through the
use of STCs that the combination of effective convection
suppression and selective surface absorption yields im-
proved thermal efficiency at high temperatures Like the
FPC STCs collect both direct and diffuse radiation How-
ever their efficiency is higher at low incidence angles
which gives STC an advantage over FPC in day-long per-
formance Depending on the solar insolation level of the
locality the authors found that working fluid outlet temper-
atures of 80degC to 200degC can be achieved (Made-in-China
nd) Fundamental studies of STC thermal performance
have been reported by Duffie and Beckman (1991) Budi-
hardjo and Morrison (2009) Rittidech and Wannapakne
(2007) and Ma Lu Zhang and Liang (2010) Kim and Seo
(2007) and Shah and Furbo (2004) employed evacuated
tube collectors made from a two-layered glass tube with
circular fins and a U-tube absorber Measured collector
efficiencies were 558 and 60 respectively
The study reported by Tripanagnostopoulos Souliotis
and Nousia (2000) using a flat-plate collector model
achieved a minimum outlet temperature of 50C and had a
collector efficiency of 80 Zelzouli Guizani Sebai and
Kerkeni (2012) concluded that the number of FPCs that can
Abstract
The world runs on the energy generated from the com-
bustion of non-renewable energy sources such as fossil
fuels (coal petrol and diesel) causing an increase in atmos-
pheric pollution Due to recent scientific discoveries the
use of renewable energy sources is made possible economi-
cal and environmentally friendly Specifically solar energy
has the greatest potential of all the worldrsquos renewable ener-
gy sources To absorb the sunrsquos radiation and convert it to
heat solar collectors are needed This preliminary experi-
mental study focused on comparing the thermal perfor-
mance of a commercially marketed solar water heating sys-
tem that featured an evacuated-tube solar collector (STC) to
that of a system that utilized a flat-plate collector (FPC)
constructed using an air conditioning radiator as the collec-
tor The STC system generally exhibited a 14 higher effi-
ciency than the FPC system The FPC system was relatively
inefficient in the absence of direct sunlight whereas the
STC system remained effective even without direct solar
irradiation
Introduction
This investigation experimentally compared the thermal
performance of two solar water-heating systems One sys-
tem employed a commercially available heat pipe evacuated
-tube solar collector (STC) The system utilized a pump to
transfer the heated waterglycol mixture from the receiver
to an insulated storage tank The tank had a built-in copper
heat exchanger coil to transfer heat from the working fluid
to the potable water in the tank thereby preventing the two
fluids from mixing The complete closed-loop system in-
cluded an expansion tank and a control unit containing the
circulation pump pressure gauge tempering valve pressure
relief valve and flow meter The other system considered in
this study used a repurposed air conditioner radiator as a
flat-plate collector (FPC) It consisted of an array of serpen-
tine tubes through which water was circulated The pres-
ence of high-density corrugated fins attached to the tubes
increased the absorption of incident solar radiation The flat
mdashmdashmdashmdashmdashmdashmdashmdashmdashmdashmdashmdashmdashmdashmdashmdashmdashmdashmdashmdashmdashmdashmdashmdashmdashmdashmdashmdashmdashmdashmdashmdashmdashmdashmdashmdashmdashmdashmdashmdashmdashmdashmdashmdashmdashmdashndashmdashmdashmdashmdash
SV Vishnu Samudrala Zimmer Biomet Ahmed ElSawy Tennessee Technological University
Mohan Rao Tennessee Technological University Stephen Idem Tennessee Technological University
A COMPARATIVE STUDY OF THE THERMAL
EFFICIENCY OF SOLAR VACUUM-TUBE VERSUS
FLAT-PLATE COLLECTORS FOR WATER
HEATING SYSTEMS
mdashmdashmdashmdashmdashmdashmdashmdashmdashmdashmdashmdashmdashmdashmdashmdashmdashmdashmdashmdashmdashmdashmdashmdashmdashmdashmdashmdashmdashmdashmdashmdashmdashmdashmdashmdashmdashmdashmdashmdashmdashmdashmdashmdashmdashmdashmdashmdashmdashmdash
INTERNATIONAL JOURNAL OF ENGINEERING RESEARCH AND INNOVATION | V11 N1 SPRINGSUMMER 2019 23
mdashmdashmdashmdashmdashmdashmdashmdashmdashmdashmdashmdashmdashmdashmdashmdashmdashmdashmdashmdashmdashmdashmdashmdashmdashmdashmdashmdashmdashmdashmdashmdashmdashmdashmdashmdashmdashmdashmdashmdashmdashmdashmdashmdashmdashmdashndashmdashmdashmdashmdash
mdashmdashmdashmdashmdashmdashmdashmdashmdashmdashmdashmdashmdashmdashmdashmdashmdashmdashmdashmdashmdashmdashmdashmdashmdashmdashmdashmdashmdashmdashmdashmdashmdashmdashmdashmdashmdashmdashmdashmdashmdashmdashmdashmdashmdashmdashndashmdashmdashmdashmdash
24 INTERNATIONAL JOURNAL OF ENGINEERING RESEARCH AND INNOVATION | V11 N1 SPRINGSUMMER 2019
be connected in series is limited When collectors are con-
nected in series the outlet temperature of each collector
will increase when compared to parallel or series-parallel
connected collectors and this leads to an increase in ther-
mal losses due to increased temperature differences
Jouhari Touhmeh and Moukhayber (2015) demonstrated
that by combining both flat-plate and evacuated-tube collec-
tors the thermal performance of the compound collector
was improved Ben Slama (2012) conducted experiments
on an integrated flat-plateevacuated-tube collector and
found that the efficiency of double glazing was 42
whereas with single glazing the efficiency was 30
Shukla Sumathy Erickson and Goung (2013) summarized
the current state-of-the-art concerning system components
of solar water heaters such as the collector storage tank
and heat exchanger and likewise discussed various ap-
proaches to improving performance and cost effectiveness
of solar water heaters The FPC is usually permanently
fixed in position and does not require any tracking of the
sun The collectors should be placed directly towards the
equator facing due south in the northern hemisphere The
ideal tilt angle of the collector is equal to the latitude of the
location with angle variations of 10-15degC depending on
the application According to the test results of Duffie and
Beckman (1991) they are capable of producing tempera-
tures up to 100degC above the ambient temperature FPCs are
the most common type of collectors used in solar water
heating systems in Africa supplying hot water in hotels
hospitals and to wealthier households (Karaekezi amp Ranga
1997)
Experimental Setup
The STC utilized in this current study was a commercial-
ly available Duda Energy (model SC5815) solar collector
(Duda nd) It consisted of 15 parallel transparent glass
tubes supported on a frame and connected to a header pipe
In each instance the evacuated tube outer diameter was
58 mm (228 in) and the overall length was 180m
(709 in) The tubes were evenly spaced on the frame such
that the overall footprint of the STC was 2050 mm 1145
mm (807 in 467 in) complete details are provided in
Duda (nd) and Samudrala (2016) The STC was mounted
on the roof of a building with a pitch of approximately 28
and was oriented due south Reflective insulation was
placed beneath the STC to minimize losses and to enhance
the solar energy incident on the backside of the tube array
The flexible steel pipes leading tofrom the STC were
wrapped with standard 6-mm-thick (025 in) foam insula-
tion Each individual collector tube consisted of two con-
centric glass tubes The annulus between the tubes was
evacuated to minimize convection heat loss to the environ-
ment The tubes were constructed using borosilicate or soda
lime glass which is resistant to high temperatures and has a
high transmittance for solar irradiation A flat or curved
aluminum or copper fin was attached to a metal heat pipe
running through the inner tube The inner glass tube and fin
was covered with a selective coating that maximizes ab-
sorption of solar energy
The hollow copper heat pipe within the tube contained a
small volume of a low-pressure alcoholwater liquid as
well as some additional additives to prevent corrosion or
oxidation This partial vacuum enabled the liquid to vapor-
ize at a prescribed temperature which is lower than would
be possible at atmospheric pressure When solar radiation
was incident on the surface of the heat pipe the liquid in the
heat pipe was vaporized due to the absorption of heat
Therein the increased vapor pressure drove the hot vapor to
the top portion of the heat pipe which consisted of a ldquohot
bulbrdquo inserted through a copper well located within a con-
necting manifold A waterglycol mixture flowed through
the manifold and heat was transferred to the working fluid
as it flowed past the hot bulb condensers in the manifold
As the hot vapor in the heat pipe lost energy it cooled and
subsequently condensed Then it flowed back down the heat
pipe through a wickporous mesh by a combination of grav-
ity and capillary action This cyclic process of alternating
evaporation and condensation of the liquid within the sealed
heat pipe continued as long as radiant energy was incident
upon the vacuum tubes Per Tripanagnostopoulos et al
(2000) a depiction of the STC closed-loop solar water heat-
ing system is provided in Figure 1
Figure 1 STC solar water heating system Printed with
permission
mdashmdashmdashmdashmdashmdashmdashmdashmdashmdashmdashmdashmdashmdashmdashmdashmdashmdashmdashmdashmdashmdashmdashmdashmdashmdashmdashmdashmdashmdashmdashmdashmdashmdashmdashmdashmdashmdashmdashmdashmdashmdashmdashmdashmdashmdashndashmdashmdashmdashmdash
The working station supplied with the STC system in-
cluded an integrated flow meter with a digital display Like-
wise the working station contained a flow controller and
pressure relief valve The water storage tank used in con-
junction with the STC system consisted of two concentric
tanks one larger and one smaller The annular gap between
the tanks was filled with mineral wool to reduce heat loss
Copper-constantan thermocouples were mounted at the inlet
and outlet of the STC header to record the waterglycol
temperatures The ambient temperature and solar insolation
data were downloaded directly from a local weather station
Further details regarding this aspect of the current study are
available in the study by Samudrala (2016)
The FPC considered in this current study (Chittireddy
2017 Chittireddy ElSawy amp Idem 2018) was fully instru-
mented to measure such variables as water flow rate and
temperature rise solar insolation and receiver and cover
plate temperatures Figure 2 shows a photograph of the ap-
paratus Throughout the experiments the flat-plate receiver
was positioned to face directly south and was inclined at an
angle so that solar insolation was directed normally onto the
apparatus This orientation was maintained throughout the
duration of the experiments Major components of the FPC
solar collector system considered in this study were
1 The receiver plate (a repurposed air conditioner radi-
ator)
2 A water storage tank
3 The casing for the collector and insulation on the
bottom to reduce heat loss
4 Two layers of glazing cover
5 A linear actuator to control the inclination of the col-
lector
6 A water-circulating pump
Figure 2 FPC solar water heating system Printed with
permission
Other components of the FPC system included calibrated
temperature sensors a water mass flow-rate sensor and a
data acquisition system An air conditioner radiator was
selected as the receiver plate The radiator coil consisted of
a single continuous serpentine tube configured in three rows
by means of headers Each row of the radiator had 22
straight finned-tube sections that were parallel to one anoth-
er and were arranged in a single plane The thickness of the
fins was 025 mm and there were 591 continuous plate fins
per meter The cross-sectional area of the receiver plate was
073m 056m The material of the tubes was copper and
the fins were constructed from aluminum These fins were
coated with black paint to increase solar heat absorptivity
Two acrylic sheets were employed as glazing for the FPC
Plexiglas was used because it has a transmittance closely
equivalent to optical glass The total light transmittance of
Plexiglas is 92 and the emissivity is 086 (Chittireddy
et al 2018) Radiation losses from the glass cover were
reduced since it is transparent to the short-wave radiation
emitted by the sun and is nearly opaque to long-wave ther-
mal radiation emitted by the absorber plate
In this experiment double parallel glazing was used
Each glazing had a thickness of 6 mm The distance be-
tween the two cover plates was 19 mm and distance be-
tween the absorber plate and the lower cover plate was
36 mm Eleven copper-constantan thermocouples were used
to measure the temperature at prescribed locations on the
receiver and cover plates as well as the inlet and water tem-
peratures Three thermocouples were mounted to the upper
cover plate three were attached to the lower cover plate
and three thermocouples were affixed to the receiver plate
and the resulting values were averaged Two thermocouples
were used to measure the inlet and outlet temperatures of
the receiver plate by inserting them directly into the 13-mm
-diameter steel pipes leading tofrom the copper pipes in the
radiator Prior to installation in the solar water heater each
temperature sensor was calibrated using a reference immer-
sion thermometer
Water flow was measured using a calibrated flow sensor
The flow sensor required a voltage input of 5-18VDC
(supplied by the data acquisition system) It was capable of
measuring flow rates from 1 to 30 Lmin over a temperature
range of -25ordmC to +80ordmC The water flow sensor was in-
stalled in a 15m-long pipe which was between the outlet of
the collector and the storage tank A sufficient length of
pipe was employed upstream of the flow sensor to ensure
that the entering flow was fully developed The casing re-
ceiver plate and water storage tank used with the FPC were
mounted on a moving trolley The data acquisition system
was placed on another moving trolley Each time an experi-
ment was performed the experimental setup mounted on
mdashmdashmdashmdashmdashmdashmdashmdashmdashmdashmdashmdashmdashmdashmdashmdashmdashmdashmdashmdashmdashmdashmdashmdashmdashmdashmdashmdashmdashmdashmdashmdashmdashmdashmdashmdashmdashmdashmdashmdashmdashmdashmdashmdashmdashmdashndashmdashmdashmdashmdash
A COMPARATIVE STUDY OF THE THERMAL EFFICIENCY OF SOLAR VACUUM-TUBE VERSUS FLAT-PLATE COLLECTORS 25
FOR WATER HEATING SYSTEMS
Actuator
Insulated water tank
Solar collector
mdashmdashmdashmdashmdashmdashmdashmdashmdashmdashmdashmdashmdashmdashmdashmdashmdashmdashmdashmdashmdashmdashmdashmdashmdashmdashmdashmdashmdashmdashmdashmdashmdashmdashmdashmdashmdashmdashmdashmdashmdashmdashmdashmdashmdashmdashndashmdashmdashmdashmdash
mdashmdashmdashmdashmdashmdashmdashmdashmdashmdashmdashmdashmdashmdashmdashmdashmdashmdashmdashmdashmdashmdashmdashmdashmdashmdashmdashmdashmdashmdashmdashmdashmdashmdashmdashmdashmdashmdashmdashmdashmdashmdashmdashmdashmdashmdashndashmdashmdashmdashmdash
26 INTERNATIONAL JOURNAL OF ENGINEERING RESEARCH AND INNOVATION | V11 N1 SPRINGSUMMER 2019
the trolleys was moved out into an open area to receive so-
lar radiation In every instance the solar water heater was
manually positioned facing south during the acquisition of
performance data Once the setup was initially positioned
the setup was not further adjusted (ie solar tracking was
not employed while measurements were being performed)
The casing was placed on horizontal bars capable of mov-
ing vertically The horizontal bar was connected to a
12VDC linear actuator to raise the casing vertically and to
align the receiverrsquos placement so that it was perpendicular
to the solar irradiation at the start of the experiments The
storage tank was placed under the casing and a 12VDC cir-
culating pump was connected to circulate the heat transfer
fluid through the solar collector
The solar thermal systems utilized solar collectors located
remotely from the storage tank Both systems used a pump
to circulate a waterpropylene glycol mixture between the
storage tank and the collector in a continuous loop and back
again to the storage tank In each instance a copper heat
exchanger coil located in the insulated storage tank was
used to transfer heat acquired by the collectors from work-
ing fluid to the potable water present in the tank without
mixing the fluids together In general this is advantageous
since the storage tanks can be placed indoors reducing heat
loss in winter months In addition backup heating systems
may be installed in the storage tanks to supply enough heat
to meet the demands of the user in case of cloudy or rainy
weather Furthermore this permits placing the tank close to
where the water will be used thereby reducing the time
needed for hot water to flow from the tap
Data Acquisition and Reduction
A Raspberry Pi system was used to connect all of the
temperature sensors for data acquisition The Raspberry Pi
is a low-cost credit card-sized computer that plugs into a
computer monitor or TV and uses a standard keyboard and
mouse A simple Python code was used to configure the
temperature sensors The data were collected and exported
to a csv file for further analysis An open source computer
hardware and software system was used to acquire the data
from each of the experimental setups The performance of a
solar water heater was characterized by how efficiently it
could convert the energy of incident solar energy to a corre-
sponding increase in the temperature of a circulating hot
waterglycol mixture The thermal efficiency of each collec-
tor considered in the present study was calculated using
Equation 1
(1)
where
ṁ = Mass flow rate in kgsec
Cp = Specific heat capacity in Jkg-K
Ac = Collector area in m2
Gt = Global solar radiation on the collector in Wm2
To = Collector outlet temperature in K
Ti = Collector inlet temperature in K
In this instance ṁ refers to the measured waterglycol
mass flow rate through the system and To and Ti are the
temperatures recorded at the collator inlet and outlet re-
spectively The quantity Gt is the measured solar radiation
incident upon the collectors as measured by the local
weather station Likewise AC denotes the effective cross
section of each collector and CP indicates the average
working fluid specific heat
Results
The testing of the STC and FPC solar water heating sys-
tems was performed under different ambient seasonal tem-
peratures Various weather conditionsmdashcloudy rainy and
sunnymdashwere encountered throughout the test program The
measurements were conducted approximately five hours a
day and were initiated around noon when the sun was at its
highest elevation The data were acquired every 13 seconds
throughout the test cycle Figure 3 illustrates the perfor-
mance of the STC system on different days subject to dis-
parate ambient temperatures and levels of solar insolation
in terms of the measured outlet waterglycol temperatures
At noon (peak incident solar radiation) the collector effi-
ciency calculated by means of Equation 1 for cold weather
conditions was 698 At that time the global solar radia-
tion was found to be 812 Wattm2 The useful energy col-
lected was 1136 kJday By comparison measurements
conducted later in the season under warm conditions yield-
ed a calculated collector efficiency at noon of 815 when
the measured global solar irradiation was found to be
842 Wattm2 The energy collected in the STC system was
determined to be 1401 kJday Under similar conditions of
ambient temperature and incident radiation intensity STC
systems exhibited approximately 14 higher efficiency
than the FPC system
Figure 4 shows a comparison of the thermal performance
of the STC and the FPC solar water heating systems consid-
ered in this study on the same day Both systems were
charged with a similar waterglycol mixture In this in-
stance the initial ambient temperature was 71F At the
start of the experiments the measured waterglycol temper-
ature stored in the insulated tank in the STC apparatus was
79F whereas the corresponding initial waterglycol tem-
perature for the FPC system was 98F At the end of experi-
p o i
c
c t
m C T T η
A G
mdashmdashmdashmdashmdashmdashmdashmdashmdashmdashmdashmdashmdashmdashmdashmdashmdashmdashmdashmdashmdashmdashmdashmdashmdashmdashmdashmdashmdashmdashmdashmdashmdashmdashmdashmdashmdashmdashmdashmdashmdashmdashmdashmdashmdashmdashndashmdashmdashmdashmdash
ment the solar vacuum tube collector waterglycol tempera-
ture reached 147F This temperature was similar to that of
the flat-plate collector both systems yielded the same outlet
temperature over the duration of the experiments but the
STC temperature rose to its final value more quickly Since
the ambient temperature was warm the collectors per-
formed similarly
Figure 3 STC performance comparison in cold and warm
weather
Figure 4 Daily performance comparison of STC and FPC solar
water heating systems in warm weather
Figure 5 provides an additional comparison of the STC
and FPC solar water heating systems At the start of the
experiments the ambient temperature was 86F In this
case the initial waterglycol temperature for the STC sys-
tem was also 86F However at the start of the measure-
ments the working fluid temperature in the FPC system
was 80F Upon the completion of the tests the final water
glycol temperature recorded leaving the STC system was
134F and the equivalent temperature for the FPC was
130F In this instance the STC system yielded a higher
final temperature but for both systems the rate of tempera-
ture increase was almost identical The calculated collector
efficiency of the STC system at noon was determined to be
887 when the incident solar radiation was 904 Wm2
That corresponded to a useful daily energy collection for
the STC system of 1636 kJday
Figure 5 Daily performance comparison of STC and FPC solar
water heating systems in hot weather
Conclusions
This preliminary study compared the thermal perfor-
mance of a commercially marketed solar water heating sys-
tem that featured an evacuated-tube solar collector to that of
a system that utilized a flat-plate collector constructed using
an air conditioning radiator as the collector Although an
extensive side-by-side comparison of the thermal efficiency
of the two systems proved to be impractical the STC sys-
tem generally exhibited a 14 higher efficiency than the
FPC system It should be pointed out that the water heater
systems considered in this study employed different water
glycol mixture flow rates and had unequal cross sections
Likewise the same inclination angle of each collector was
not consistent and each system utilized different storage
tanks that were not equally insulated Collectively these
differences between the two solar heating systems make it
difficult to definitively compare the two approaches in
terms of thermal efficiency
While flat-plate collectors are widely used in solar water
heating applications they are inefficient in the absence of
direct sunlight By comparison STC systems are relatively
more effective even without direct solar irradiation The
simple flat-plate collector considered in this study was as-
sembled using readily available spare components It was
designed to work in sunny and warm climates However
the benefit of using the FPC system was reduced when
there were cloudy rainy or windy weather conditions So-
lar water heating systems that employ evacuated-tube col-
mdashmdashmdashmdashmdashmdashmdashmdashmdashmdashmdashmdashmdashmdashmdashmdashmdashmdashmdashmdashmdashmdashmdashmdashmdashmdashmdashmdashmdashmdashmdashmdashmdashmdashmdashmdashmdashmdashmdashmdashmdashmdashmdashmdashmdashmdashndashmdashmdashmdashmdash
A COMPARATIVE STUDY OF THE THERMAL EFFICIENCY OF SOLAR VACUUM-TUBE VERSUS FLAT-PLATE COLLECTORS 27
FOR WATER HEATING SYSTEMS
mdashmdashmdashmdashmdashmdashmdashmdashmdashmdashmdashmdashmdashmdashmdashmdashmdashmdashmdashmdashmdashmdashmdashmdashmdashmdashmdashmdashmdashmdashmdashmdashmdashmdashmdashmdashmdashmdashmdashmdashmdashmdashmdashmdashmdashmdashndashmdashmdashmdashmdash
mdashmdashmdashmdashmdashmdashmdashmdashmdashmdashmdashmdashmdashmdashmdashmdashmdashmdashmdashmdashmdashmdashmdashmdashmdashmdashmdashmdashmdashmdashmdashmdashmdashmdashmdashmdashmdashmdashmdashmdashmdashmdashmdashmdashmdashmdashndashmdashmdashmdashmdash
28 INTERNATIONAL JOURNAL OF ENGINEERING RESEARCH AND INNOVATION | V11 N1 SPRINGSUMMER 2019
lectors similar to those employed in the present study may
be more energy efficient than the flat-plate collectors due
to their unique construction Since the concentric coated-
glass tubes are vacuum-sealed heat loss associated with
convection heat transfer is reduced to a great extent Alt-
hough the STC system was deemed more thermally effi-
cient it was far more expensive than the FPC system How-
ever a detailed analysis of the relative initial and annual
operating costs of the two systems was beyond the scope of
the present study
References
ASHRAE (2015) Handbook HVAC applications Atlanta
ASHRAE
Ben Slama R (2012) Experimentation of a plane solar
integrated collector storage water heater Energy and
Power Engineering 4(2) 67-76
Budihardjo I amp Morrison G L (2009) Performance of
water-in-glass evacuated tube solar water heaters
Solar Energy 83(1) 49-56
Chittireddy V R (2017) A study of flat plate solar
collector with air conditioner radiator as absorber
plate (Masterrsquos thesis) Retrieved from ProQuest
Dissertations and Theses Database (UMI No
10246377)
Chittireddy V R ElSawy A amp Idem S (2018) Study of
a flat plate solar collector with an air conditioner
radiator as a heat absorber for a domestic water
heater Paper presented at the International Conference
on Renewable Energies and Power Quality doi https
doiorg1024084repqj16205
Duda diesel (nd) Retrieved from https
wwwdudadieselcom
Duffie J A amp Beckman W A (1991) Solar engineering
of thermal processes 2nd ed New York Wiley-
Interscience
Jouhari M Touhmeh S amp Moukhayber N (2015)
Manufacturing and thermal performance test of
(compound) solar collector in Damascus City Journal
of Biomedical Science and Engineering 8(6) 370-379
Karaekezi S amp Ranga T (1997) Renewable energy
technologies in Africa London Zed Book Ltd
Kim Y amp Seo T (2007) Thermal performances
comparisons of the glass solar vacuum tube solar
collectors with shapes of absorber tube Renewable
Energy 32(5) 772-795
Ma L Lu Z Zhang J amp Liang R (2010) Thermal
performance analysis of the glass Solar Vacuum tube
collector with U-tube Building and Environment 45
(9) 1959-1967
Made-in-China (nd) Retrieved from httpswwwmade-in
-chinacom
Rittidech S amp Wannapakne S (2007) Experimental
study of the performance of a solar collector by closed-
end oscillating heat pipe (CEoHP) Applied Thermal
Engineering 27 1978-1985
Samudrala S V Vishnu (2016) A comparative study on
the thermal efficiency of solar vacuum-tube vs flat-
plate collectors for water heating systems (Masterrsquos
thesis) Retrieved from ProQuest Dissertations and
Theses Database (UMI No 10243376)
Shah L J amp Furbo S (2004) Vertical evacuated tubular-
collectors utilizing solar radiation from all directions
Applied Energy 78(4) 371-395
Shukla R Sumathy K Erickson P amp Goung J (2013)
Recent advances in the solar water heating systems A
review Renewable and Sustainable Energy Reviews
19 173-190
Tripanagnostopoulos Y Souliotis M amp Nousia T
(2000) Solar collectors with colored absorbers Solar
Energy 68(4) 343-356
Zelzouli K Guizani A Sebai R amp Kerkeni C (2012)
Solar thermal systems performances versus flat plate
solar collectors connected in series Engineering 4(12)
881-893
Biographies
VENKAT VISHNU DEEPAK SAMUDRALA is a
manufacturing engineer at Zimmer Biomet and holds an
MS degree from Tennessee Technological University
(2016) in mechanical engineering He was born in Hydera-
bad India and holds a BS degree from SCSVMV Universi-
ty India (2010) in mechanical engineering While pursuing
his BS degree he developed a profound interest in energy
systems which inspired him to work on solar water heating
systems as his masterrsquos thesis Currently he lives in Mem-
phis Tennessee and is working on a continuous improve-
ment project focused on reducing product manufacturing
time Mr Samudrala may be reached at
ssamudral42studentstntechedu
AHMED ELSAWY joined Tennessee Technological
University as a professor and chairperson in the Department
of Manufacturing and Engineering Technology in July
1999 Prior to joining TTU he was a professor and graduate
program coordinator in the Department of Industrial Tech-
nology at the University of Northern Iowa the founding
director of the Manufacturing Engineering Program at St
Cloud State University in Minnesota and a full professor at
the Department of Mechanical Design and Production Engi-
neering at Cairo University His teaching and research inter-
ests include material processing metallurgy and manufac-
turing systems recycling and reuse of solid waste materials
renewable energy and sustainability Dr Elsawy advised
mdashmdashmdashmdashmdashmdashmdashmdashmdashmdashmdashmdashmdashmdashmdashmdashmdashmdashmdashmdashmdashmdashmdashmdashmdashmdashmdashmdashmdashmdashmdashmdashmdashmdashmdashmdashmdashmdashmdashmdashmdashmdashmdashmdashmdashmdashndashmdashmdashmdashmdash
several masterrsquos and doctoral students who hold academic
and industrial positions in the USA Germany and Taiwan
Dr Elsawy may be reached at aelsawytntechedu
MOHAN D RAO is a professor and chair of Mechan-
ical Engineering at Tennessee Technological University
Previously he was a professor of Mechanical Engineering
at Michigan Tech Dr Rao is a fellow of ASME and SAE
He has conducted research in different areas of automotive
body and powertrain dynamics acoustics and vibration
over a span of 30 years He has over 100 publications in
technical journals and conference proceedings He has ad-
vised 9 PhD and 35 MS students Dr Rao has received a
US Fulbright award National Science Foundation Research
Initiation award and was honored by the NASA Marshall
Space Flight Center for his work on the damping of the
Hubble Space Telescope truss system Dr Rao may be
reached at mraotntechedu
STEPHEN IDEM is a professor in the Depar tment of
Mechanical Engineering at Tennessee Tech University He
received his PhD in mechanical engineering from Purdue
University He has more than 30 years of experience in the
areas of scale model testing fluid flow measurement and
thermal modeling Currently he is engaged in projects to
measure airflow and pressure loss characteristics of residen-
tial HVAC duct systems He has created a numerical model
of downdraft evaporative cooling tower performance which
is being verified experimentally He has extensive experi-
ence performing flow and pressure measurements on scale
models of primary and secondary air supply ducts wind
boxes and exhaust stacks of coal-fired power plants to im-
prove their thermal performance He has developed an
online cleanliness factor model of the convection passes in
coal-fired power plants He has likewise created numerical
models of transient heat exchanger performance Dr Idem
may be reached at sidemtntechedu
mdashmdashmdashmdashmdashmdashmdashmdashmdashmdashmdashmdashmdashmdashmdashmdashmdashmdashmdashmdashmdashmdashmdashmdashmdashmdashmdashmdashmdashmdashmdashmdashmdashmdashmdashmdashmdashmdashmdashmdashmdashmdashmdashmdashmdashmdashndashmdashmdashmdashmdash
A COMPARATIVE STUDY OF THE THERMAL EFFICIENCY OF SOLAR VACUUM-TUBE VERSUS FLAT-PLATE COLLECTORS 29
FOR WATER HEATING SYSTEMS
ra 1992) dimension reduction and noise removal
(Sheybani 2011) and senior design (Garcia-Otero amp Shey-
bani 2011)
RF engineers specialize in creating various devices that
operate within the radio frequency spectrum Some of the
devices they work with include antennas radios WiFi and
mobile phones In this current study the RF engineer was in
the process of developing an antenna for a NASA project
called EcoSAR a radar tool designed to help scientists bet-
ter understand the carbon cycle by measuring biomass for-
est height density and extent This project was designed to
help him by creating a GUI that could import analyze and
export data
Technical Details
A GUI is a type of computer-human interface on a com-
puter It solves the blank screen problem that confronted
early computer users (Norman 1988) A computer-human
interface is a ldquomeans by which people and computers com-
municate with each otherrdquo (Interface 2019) GUI binds the
user of the computer system to the operation and potential
of the computer system More specifically a GUI is a speci-
fication for the look and feel of the computer sys-
tem (Bonsiepe 1989) GUIs usually have common charac-
teristics such as windows icons menus and pushbuttons
(WIMP) Collectively WIMPs are pictures that bring forth
a certain action or action space The user issues commands
via the GUI to computer applications GUIs usually have
three major components (Hayes amp Baran 1989) a window-
ing system an imaging model and an application program
interface (API) The windowing system builds the windows
menus and dialog boxes that appear on the screen The im-
aging model defines the fonts and graphics that appear on
the screen WIMPs are products of both the windowing sys-
tem and imaging model Finally the API is the means by
which the user specifies how and what windows and
graphics appear on the screen
The proposed GUI consists of the following platforms
data input selection menu scientific computation and re-
sults display The scientific computations include file type
conversion S-parameter polar-rectangular conversion
Smith chart and graphsplots The GUI was designed in
MATLAB and as a result MATLAB libraries were used
for parts of the design and development of the GUI
Abstract
In this paper the authors describe the requirements and
features necessary to develop a GUI for RF airborne space-
craft and satellite communications The proposed GUI is
responsive to the variety of devices and tools an RF engi-
neer would need to accomplish everyday tasks This in-
cludes but is not limited to Smith charts polar plots Bode
diagrams and different types of data files associated with
these graphs or charts The GUI was designed and devel-
oped in MATLAB with Adobe Photoshop used to create a
custom background The user interface was fully tested and
validated for functionality and ability to import plot and
export data for Smith charts polar plots and Bode dia-
grams The GUI also has a toolbar file browser with picture
display custom background and a static textbox that dis-
plays the plotted data
Introduction
Following are the details of the steps that were taken in
order to apply signal processing and data analytics algo-
rithms in the design of a graphical user interface (GUI) for
satellite and RF communications Users may follow these
steps with the specified set of hardware and software to get
the same configuration on the proper RF communications
and device design These projects were implemented under
the supervision of NASA scientists and faculty advisors in
dedicated NASA labs Using lessons learned in this study
and the authorsrsquo previous experience in data visualization
and signal processing research and training relevant labs
were designed to enhance the Computer Engineering pro-
gram at the Virginia State University (VSU) The classes
and labs covered a variety of topics including computer
simulations and networking (Javidi amp Sheybani 2008)
(Sheybani amp Javidi 2007) visualization and virtual labs
(Sheybani amp Javidi 2006) image processing (Sheybani
Garcia-Otero Adnani amp Javidi 2012) game design
(Ouyang Yang Franklin Michaelson Morge et al 2010)
STEM education (Javidi amp Sheybani 2008) (Javidi amp
Sheybani 2010) spike removal (Sheybani Mengshoel amp
Poll 2010) feature detection (Varde Rundensteiner Javidi
Sheybani amp Liang 2007) wireless communications (Hardy
Javidi Denton Campbell amp Sheybani 2007) (Badombena-
Wanta amp Sheybani 2010) network architecture (Sheybani
amp Sankar 2002) optical communications (Sheybani amp Aro-
mdashmdashmdashmdashmdashmdashmdashmdashmdashmdashmdashmdashmdashmdashmdashmdashmdashmdashmdashmdashmdashmdashmdashmdashmdashmdashmdashmdashmdashmdashmdashmdashmdashmdashmdashmdashmdashmdashmdashmdashmdashmdashmdashmdashmdashmdashndashmdashmdashmdashmdash Ehsan Sheybani University of South Florida Giti Javidi University of South Florida
DESIGN AND DEVELOPMENT OF A GUI
FOR RF COMMUNICATIONS
mdashmdashmdashmdashmdashmdashmdashmdashmdashmdashmdashmdashmdashmdashmdashmdashmdashmdashmdashmdashmdashmdashmdashmdashmdashmdashmdashmdashmdashmdashmdashmdashmdashmdashmdashmdashmdashmdashmdashmdashmdashmdashmdashmdashmdashmdashndashmdashmdashmdashmdash
30 INTERNATIONAL JOURNAL OF ENGINEERING RESEARCH AND INNOVATION | V11 N1 SPRINGSUMMER 2019
mdashmdashmdashmdashmdashmdashmdashmdashmdashmdashmdashmdashmdashmdashmdashmdashmdashmdashmdashmdashmdashmdashmdashmdashmdashmdashmdashmdashmdashmdashmdashmdashmdashmdashmdashmdashmdashmdashmdashmdashmdashmdashmdashmdashmdashmdashndashmdashmdashmdashmdash
The GUI is capable of importing three main data types
(CSV) (DAT) and (SNP) files CSV stands for a ldquocomma
separated valuerdquo This is a plain text file that separates each
form of data with a comma Figure 1 shows how CSV files
can be written in either Notepad or Excel and when used
properly they can import and export data from Excel to
MATLAB and vice versa
Figure 1 A CSV file written in Notepad
DAT files are primarily associated with ldquodatardquo They can
be used to store various types of data such as text graphics
attachments in emails and general binary code In most
instances it is best to open a DAT file with the program that
created it Users can also open a DAT file with an editor
such as Notepad to view the contents inside However it is
not guaranteed that all of the contents of the file will be
readable when using an editor to open it SNP files which
are also known as touchtone files have five different file
types (S1P) (S2P) (S3P) (S4P) and (SNP) The differ-
ences between these file types are the number of ports pre-
sent (see Table 1)
Table 1 The number of ports and S-parameters associated with
each file type
The ldquoSrdquo in S-parameters stands for scattering Figure 2
shows examples of how S-parameters come in matrices with
the number of rows and columns equal to the number of
ports These S-matrices allow users to describe complicated
networks as ldquoblack boxesrdquo (Zhou amp Chen 2008)
S-parameters are considered complex because both phase
and magnitude change the network However most micro-
wave and RF engineers are only concerned with the magni-
tude These engineers use S-parameters to refer to the RF
ldquovoltage out vs voltage inrdquo
Figure 2 S-parameter matrices
(S11) Refers to the reflection on port 1 as an inci-
dence of port 1
(S12) Refers to the reflection on port 1 as an inci-
dence of port 2
(S22) Refers to the reflection on port 2 as an inci-
dence of port 2
(S21) Refers to the reflection on port 2 as an inci-
dence of port 1
Since three-port measurements are extremely difficult to
obtain accurately the authors chose to focus only on one-
and two-port systems However the aforementioned meth-
odology would continue for all of the S-parameters present
These data formats are all associated with specific graphs
Figure 3 shows that the first graph the Bode diagram con-
sists of both phase and magnitude plots The magnitude plot
expresses the magnitude of the frequency response gain
either linearly or in decibels The phase plot expresses the
frequency response phase shift in either degrees or radians
(Zhou amp Chen 2008)
Figure 3 A Bode diagram
mdashmdashmdashmdashmdashmdashmdashmdashmdashmdashmdashmdashmdashmdashmdashmdashmdashmdashmdashmdashmdashmdashmdashmdashmdashmdashmdashmdashmdashmdashmdashmdashmdashmdashmdashmdashmdashmdashmdashmdashmdashmdashmdashmdashmdashmdashndashmdashmdashmdashmdash
DESIGN AND DEVELOPMENT OF A GUI FOR RF COMMUNICATIONS 31
File type Number of ports Number of
S-parameters saved
s1p 1 1
s2p 2 4
s3p 3 9
s4p 4 16
sNp N N2
1 1 o n e -p o r tS
1 1 1 2
2 1 2 2
tw o -p o r tS S
S S
1 1 1 2 1 3
2 1 2 2 2 3
3 1 3 2 3 3
th re e -p o r t
S S S
S S S
S S S
mdashmdashmdashmdashmdashmdashmdashmdashmdashmdashmdashmdashmdashmdashmdashmdashmdashmdashmdashmdashmdashmdashmdashmdashmdashmdashmdashmdashmdashmdashmdashmdashmdashmdashmdashmdashmdashmdashmdashmdashmdashmdashmdashmdashmdashmdashndashmdashmdashmdashmdash
mdashmdashmdashmdashmdashmdashmdashmdashmdashmdashmdashmdashmdashmdashmdashmdashmdashmdashmdashmdashmdashmdashmdashmdashmdashmdashmdashmdashmdashmdashmdashmdashmdashmdashmdashmdashmdashmdashmdashmdashmdashmdashmdashmdashmdashmdashndashmdashmdashmdashmdash
32 INTERNATIONAL JOURNAL OF ENGINEERING RESEARCH AND INNOVATION | V11 N1 SPRINGSUMMER 2019
Figure 4 shows the next graph a polar plot This is a two-
dimensional system that plots polar coordinates in a Carte-
sian plane and then draws the polar grid on the plane These
plots sometimes display the voltage reflection coefficient
This plays an important role in helping microwave engi-
neers with impendence matching Polar plots are also simi-
lar to X amp Y plots However instead of plotting data at
X versus Y they plot ldquoRrdquo (magnitude) at an angle between
0 and 360 degrees
Figure 4 A polar plot
Figure 5 shows the last graph a Smith chart The capabil-
ities of this chart are limitless and it is standard in micro-
wave engineering The Smith chart is a plot of complex
reflection overlaid with impendence andor admittance grids
referenced to a 1-ohm characteristic impendence Smith
charts help assist RF engineers in many ways but some of
the most notable tasks include impendence matching dis-
playing antenna impendence and visualizing the impend-
ence of a transmission line There are two types of Smith
charts the classic chart displays only positive real impend-
ences while the more modern chart displays imaginary im-
pendences from negative infinity to positive infinity (Gawa
2006)
Methods and Procedures
To create this GUI MATLAB was used to program
develop the GUI and Adobe Photoshop was used to create
the custom background The hardest part of the project was
writing the code to make the GUI accomplish various tasks
When complications were encountered the authors used
various problem-solving methods The ldquohelprdquo and ldquodocrdquo
functions in MATLAB and MATLAB online forums were
used extensively General steps to implementing this project
were as follows
1 Researching data types and graphs
2 Brainstorming what the end result should look like
3 Creating flow charts
4 Developing program code
5 Ensuring the GUI could accomplish the assigned
tasks
6 Creating a custom background
7 Adding extras (static text display toolbar file brows-
er etc)
8 Cleaning up code for efficiency
9 Finishing poster and final paper
Figure 5 A Smith chart
Results and Discussion
Figure 6 shows the completed GUI One attractive feature
is the backgroundlayout This custom background was cre-
ated in Photoshop and saved as a JPG and then placed on a
panel in MATLAB The background of the GUI needed a
visual appeal or style to it The panels helped increase the
overall intuitiveness of the design This was because it gave
everything its own special area as opposed to the thin and
basic borders MATLAB had to offer The input function
was placed in the toolbar of the GUI From there one can
select and import files located within the file directory The
GUI was programmed to automatically plot the Smith chart
polar plot and Bode diagram when certain data were im-
ported allowing the user to import any file type and still
plot it correctly In addition to these features the input al-
lows the user to import M-files as well Figure 7 shows how
to access the import feature using the path File Open
(Select Data) Open
mdashmdashmdashmdashmdashmdashmdashmdashmdashmdashmdashmdashmdashmdashmdashmdashmdashmdashmdashmdashmdashmdashmdashmdashmdashmdashmdashmdashmdashmdashmdashmdashmdashmdashmdashmdashmdashmdashmdashmdashmdashmdashmdashmdashmdashmdashndashmdashmdashmdashmdash
Figure 6 The completed GUI
Figure 7 GUI file menu
Another feature added to the GUI was the ability to graph
multiple plots By using this feature two sets of data could
be displayed on one plot simultaneously Figure 8 shows
how this can be highly effective in helping RF engineers
compare results
Figure 8 Multiple sets of data plotted on one Smith chart
An export button was also created that allows the user to
export data anywhere within the file directory However
instead of an ldquoopenrdquo button the user would see a ldquosaverdquo
option To access the import feature File Save (Name
amp Location) Save
The Bode diagram section is located in the large rectangu-
lar area of the GUI Here the user can select the number of
options and change how to view the imported data The first
option the user can manipulate is the Y-axis for the magni-
tude and phase plots Under the magnitude option the user
can choose from either linear or log (dB) and under the
phase option the user can choose degrees or radians The
second option to choose is the real and imaginary axis of the
Bode diagram Figure 9 shows how this option allows users
to select the axis most practical for their research
(a) The real axis
(b) The imaginary axis Figure 9 The axes
The interface has checkboxes to allow users to select
which color they would like their graph or specific
S-parameters to appear in This allows users to more easily
distinguish different sets of data In addition to adding color
checkboxes checkboxes to select between solid and dotted
lines were added This also helps users distinguish between
different sets of data To graph random data the ldquoBoderdquo
mdashmdashmdashmdashmdashmdashmdashmdashmdashmdashmdashmdashmdashmdashmdashmdashmdashmdashmdashmdashmdashmdashmdashmdashmdashmdashmdashmdashmdashmdashmdashmdashmdashmdashmdashmdashmdashmdashmdashmdashmdashmdashmdashmdashmdashmdashndashmdashmdashmdashmdash
DESIGN AND DEVELOPMENT OF A GUI FOR RF COMMUNICATIONS 33
mdashmdashmdashmdashmdashmdashmdashmdashmdashmdashmdashmdashmdashmdashmdashmdashmdashmdashmdashmdashmdashmdashmdashmdashmdashmdashmdashmdashmdashmdashmdashmdashmdashmdashmdashmdashmdashmdashmdashmdashmdashmdashmdashmdashmdashmdashndashmdashmdashmdashmdash
mdashmdashmdashmdashmdashmdashmdashmdashmdashmdashmdashmdashmdashmdashmdashmdashmdashmdashmdashmdashmdashmdashmdashmdashmdashmdashmdashmdashmdashmdashmdashmdashmdashmdashmdashmdashmdashmdashmdashmdashmdashmdashmdashmdashmdashmdashndashmdashmdashmdashmdash
34 INTERNATIONAL JOURNAL OF ENGINEERING RESEARCH AND INNOVATION | V11 N1 SPRINGSUMMER 2019
button was added and the ldquoenlargerdquo button was added right
beneath it to display a larger version of the Bode diagram in
a separate window This helps engineers get a closer look at
the data plot in case the view on the GUI is not large
enough The same approach was used for other types of
graphs The control panel is the long rectangular panel lo-
cated on the left side of the GUI Here the user can perform
a of actions such as view data or reset graphs When the
users click on the ldquofilerdquo button they are able to select any
image file within the file directory that can be added to the
list box below to be selected (see Figure 10)
Figure 10 The ldquo filerdquo button and image selector listbox
A ldquodata resultsrdquo static textbox was added to the control
panel This box is used to view the data of the image cur-
rently selected in the list box This allows the user to see the
data being plotted or selected Additionally Figures 11 and
12 show how users can view the data being plotted in Note-
pad by going to the toolbar and selecting the data A reset
button was added to the control panel to allow users to reset
the current graph back to a blank state This button does not
reset all the graphs at once so users can erase one graph at a
time The amplifier button located on the toolbar can be
used to generate a Smith chart After the button is selected
users are taken through a wizard-style setup to select what
type of Smith chart they would like to generate This feature
is extremely useful because it allows users to create differ-
ent types of Smith charts that may be hard to duplicate using
the Smith chart located on the GUI (see Figures 13 and 14)
Figure 11 The ldquodata resultsrdquo static textbox
Figure 12 Data displayed in Notepad after using the ldquodatardquo
function
(a) Step 1
(b) Step 2 Figure 13 The amplifier process
mdashmdashmdashmdashmdashmdashmdashmdashmdashmdashmdashmdashmdashmdashmdashmdashmdashmdashmdashmdashmdashmdashmdashmdashmdashmdashmdashmdashmdashmdashmdashmdashmdashmdashmdashmdashmdashmdashmdashmdashmdashmdashmdashmdashmdashmdashndashmdashmdashmdashmdash
Figure 14 Results of the amplifier generator
The angular average function was also added to the
toolbar Figure 15 shows how this function plots various
polar plots and saves them to the file directory A help menu
was also added to the toolbar Here users can access help
using the GUI through demos and help menus In addition
to finding help users can obtain contact information for the
help desk
Figure 15 The angular average of some random data
Conclusions and Future Work
This project was extremely successful The most prized
accomplishments throughout this entire experience was the
comprehensive set of features for manipulating and display-
ing data and the custom background that worked well with
all of the functions The plan for future work is to take the
code written in MATLAB create an iPhoneiPad-
compatible app that could do the same thing that this GUI
did and enable users to accomplish these tasks from an iPad
or iPhone
Acknowledgments
This research was funded by 2010 and 2011 NASA CI-
PAIR and NASA NSTI Research Grants and supported by
Goddard Space Flight Center and NASA Langley Research
Center We would like to thank the NASA team of collabo-
rators lead by Dr Deshpande and our colleagues at Virginia
State University for their time and thoughtful insights dur-
ing ad hoc research gatherings In addition the authors wish
to extend their gratification to the anonymous reviewers for
their time assistance and patience
References
Badombena-Wanta S amp Sheybani E O (2010) Mobile
communications for development Enabling strategic
and low-cost e-applications for rural and remote areas
Proceedings of Wireless Telecommunications Symposi-
um Piscataway NJ IEEE doi 101109
WTS20105479644
Bonsiepe G (1989) Interpretations of human user inter-
face Visible Language 24(3) 262-285
Hayes F amp Baran N (1989 July) A guide to GUIs Byte
4 250-257
Garcia-Otero S amp Sheybani E (2010) Engineering senior
design course (ldquonew and improvedrdquo) Proceedings of
ASEE Annual Conference Washington DC ASEE
Gawa A (2006) Smith chart Retrieved from http
amanogawacomarchivedocsG-tutorialpdf
Hardy M Javidi G Denton L Campbell Y amp Shey-
bani E (2007) Enhancing research capacity and devel-
oping wireless communications curriculum for students
in computer science and engineering Proceedings of
IEEESECon 2007 Piscataway NJ IEEE doi
101109SECON2007342995
Interface (2019) Business Dictionary Retrieved from
httpwwwbusinessdictionarycomdefinition
interfacehtml
Javidi G amp Sheybani E (2008) Content-based computer
simulation of a networking course An assessment
mdashmdashmdashmdashmdashmdashmdashmdashmdashmdashmdashmdashmdashmdashmdashmdashmdashmdashmdashmdashmdashmdashmdashmdashmdashmdashmdashmdashmdashmdashmdashmdashmdashmdashmdashmdashmdashmdashmdashmdashmdashmdashmdashmdashmdashmdashndashmdashmdashmdashmdash
DESIGN AND DEVELOPMENT OF A GUI FOR RF COMMUNICATIONS 35
mdashmdashmdashmdashmdashmdashmdashmdashmdashmdashmdashmdashmdashmdashmdashmdashmdashmdashmdashmdashmdashmdashmdashmdashmdashmdashmdashmdashmdashmdashmdashmdashmdashmdashmdashmdashmdashmdashmdashmdashmdashmdashmdashmdashmdashmdashndashmdashmdashmdashmdash
mdashmdashmdashmdashmdashmdashmdashmdashmdashmdashmdashmdashmdashmdashmdashmdashmdashmdashmdashmdashmdashmdashmdashmdashmdashmdashmdashmdashmdashmdashmdashmdashmdashmdashmdashmdashmdashmdashmdashmdashmdashmdashmdashmdashmdashmdashndashmdashmdashmdashmdash
36 INTERNATIONAL JOURNAL OF ENGINEERING RESEARCH AND INNOVATION | V11 N1 SPRINGSUMMER 2019
Journal of Computers 3(3) 64-72
Javidi G amp Sheybani E (2010) Making youth excited
about STEM education Journal of Computing Sciences
in Colleges 26(1) 140-147
Norman D (1988) The psychology of everyday things
New York Basic Books
Ouyang Y Yang S Franklin T Michaelson K Morge
S Sheybani EhellipNarayan S (2010) Games sims
and virtual worlds in K-20 STEM education
Proceedings of 21st International SITE Conference
Chesapeake VA Association for the Advancement of
Computing in Education
Sheybani E amp Arora K (1993) Measurement of temporal
coherence of underwater optical scattered field
Microwave and Optical Technology Letters 6(2) 151-
154
Sheybani E amp Sankar R (2002) Integrated network
architecture and signal processing for telemammography
Proceedings of IEEEICASSP Piscatawny NJ IEEE
Sheybani E amp Javidi G (2006) Visualization effects in
virtual engineering labs II Proceedings of IEEEFIE
Piscataway NJ IEEE
Sheybani E (2011) Dimensionality reduction and noise
removal in wireless sensor networks Proceedings of
2011 4th IFIP International Conference on New
Technologies Mobility and Security Piscataway NJ
IEEE doi 101109NTMS20115721151
Sheybani E amp Javidi G (2007) Development and
evaluation of an educational computer network
software Proceedings of IEEESECon 2007
Piscataway NJ IEEE doi 101109
SECON2007342904
Sheybani E O Mengshoel O J amp Poll S (2010)
Removing spikes while preserving data and noise using
wavelet filter banks Proceedings of IEEE Aerospace
Conference Piscataway NJ IEEE doi 101109
AERO20105446821
Sheybani E Garcia-Otero S Adnani F Javidi G amp
Deshpande M (2012) An algorithm for real-time blind
image quality comparison and assessment International
Journal of Electrical and Computer Engineering 2(1)
doi httpdxdoiorg1011591ijecev2i1112
Varde A Rundensteiner E Javidi G Sheybani E amp
Liang J (2007) Learning the relative importance of
features in image data Proceedings of IEEE ICDErsquos
DBRank-07 Piscataway NJ IEEE doi 101109
ICDEW20074400998
Zhou Y amp Chen Y (2008) Properties of mixed-mode S-
parameters Microwave and Optical Technology
Letters 50(11) 2869-2874
Biographies
EHSAN SHEYBANI earned his BS MS and PhD in
electrical engineering from UF FSU and USF respectively
His main research area is applications of communication
signal processing and data analysis He has been involved
in teaching practicing researching and consulting
applications of DSP in technology system analysis and
data sciences for the past 20 years He has a long list of
publications and research grants including projects with
NASA NSF NIH DoD DEd and industry partners
Currently he serves as a faculty member at the University
of South Florida Dr Sheybani may be reached at
sheybaniusfedu
GITI JAVIDI earned her BS from the University of
Central Oklahoma and MS and PhD from the University of
South Florida Her main research area is human computer
interaction data visualization and STEM education She
has been involved in teaching computer science and
conducting research in that area for the past 16 years Dr
Javidi has a long list of publications and research grants
including projects with NASA NSF MSIP and industry
partners Currently she serves as a faculty member at the
University of South Florida Dr Javidi may be reached at
javidiusfedu
A DIAGNOSTIC CLOCK FOR VERIFICATION
OF IMAGE TIME SYNCHRONIZATION mdashmdashmdashmdashmdashmdashmdashmdashmdashmdashmdashmdashmdashmdashmdashmdashmdashmdashmdashmdashmdashmdashmdashmdashmdashmdashmdashmdashmdashmdashmdashmdashmdashmdashmdashmdashmdashmdashmdashmdashmdashmdashmdashmdashmdashmdashndashmdashmdashmdashmdash
Curtis Cohenour Ohio University
Abstract
The GPS clock is a diagnostic tool for measuring time
synchronization errors in aerial surveillance systems Aerial
surveillance systems are used in many civilian and military
applications including law enforcement border security
military situational awareness and military forensics The
goal is to collect images and project them onto the local
terrain such that the images form a map A common exam-
ple is Google Earth Aerial platforms can include drones
fixed or rotary winged aircraft and lighter-than-air vehicles
An aerial surveillance system consists of an imaging system
and a navigation system The navigation system is used to
determine the camera position and attitude known as the
pose which contains the necessary information required for
the projection of the image onto the terrain The images and
pose come from two sources and must be synchronized
Any error in the synchronization will create a projection
error
One method of determining when an image has been cap-
tured is to take a picture of a clock The GPS-synchronized
clock creates a display of the GPS time that can be recorded
in an image By taking images of the clock using the sur-
veillance system each image will have a true time from the
image of the GPS clock and a time derived from the pose If
the synchronization is correct they will match Any differ-
ence between the clock time from the image and the time
from the pose is an error that must be corrected In this pa-
per the author describes the operation testing and accuracy
of the clock Tests were performed using an independent
GPS receiver and a precise time protocol (PTP) server The
resolution of the clock was 1 millisecond (ms) and the ac-
curacy was 01 ms Case studies describe how the clock is
used to discover and subsequently correct timing errors in a
surveillance system
Introduction
Aerial surveillance is used in many civilian and military
applications including law enforcement (Ersoy
Palaniappan Seetharaman amp Rao 2012) border security
and improved situational awareness (Bryant Johnson Kent
Nowak amp Rogers 2008) The goal is to collect images and
project them onto the local terrain such that the image forms
a map A common example is Google Earth (GE) where
for example the image of a road overlays a map of the road
Images are captured by a camera while the pose is most
often generated by an integrated global positioning system
(GPS)inertial measurement unit (IMU) Distortion in the
camera image and errors in the GPSIMU will result in er-
rors in the projection These errors have been studied in
detail and are well documented in the literature for camera
models (Cohenour Price Rovito and van Graas 2015) and
corrected pose data (Cohenour Price Rovito amp van Graas
2015) The assumption was made that the pose would be
synchronized with the image as the author was unable to
find research into projection errors caused by time synchro-
nization errors nor any device to measure these errors It
was also assumed to not always be true that an image is
synced with the pose as will be seen in the case studies
below In this paper the author describes a means of testing
this assumption
The pose by default includes an accurate time If the
image includes the time the two can be compared directly
The GPS clock provides a mechanism for including the time
in the image The clock was used as a diagnostic tool Data
were collected and analyzed and the results used to diag-
nose correct and ultimately verify the synchronization of
the image and the pose The details of the projection are
described in a number of papers for camera models
(Cohenour et al 2015) corrected pose date (Cohenour et
al 2015) and others (Wolf 1974 Tsai 1987 Di amp Li
2004) The projection is based on the camera pose (position
and attitude) that corresponds to the image The pose will
have random errors that generate random errors in projec-
tion For example errors in GE can range from a few centi-
meters to a few meters depending on the aerial survey used
In this current study the focus was on errors that occurred
because the pose data were not captured at the same time
the image was captured
The pose data typically come from an integrated GPS
IMU while the image data come from a camera or a bank of
cameras The pose and image data are placed in one-to-one
correspondence But what happens if there is an extra mes-
sage in the IMU buffer or the image buffer If this happens
then the images will be off by one or more frames GPS is a
four-dimensional positioning system it produces position in
three dimensions and time The position errors are typically
less than 10m (Kaplan 1996) A 10m error in time is
10m300e6ms = 33ns An aerial surveillance camera typi-
cally operates with an integration time of 1ms If an aircraft
is traveling at 85ms then the 1ms is 085 of aircraft travel
mdashmdashmdashmdashmdashmdashmdashmdashmdashmdashmdashmdashmdashmdashmdashmdashmdashmdashmdashmdashmdashmdashmdashmdashmdashmdashmdashmdashmdashmdashmdashmdashmdashmdashmdashmdashmdashmdashmdashmdashmdashmdashmdashmdashmdashmdashmdashmdashmdashmdash
INTERNATIONAL JOURNAL OF ENGINEERING RESEARCH AND INNOVATION | V11 N1 SPRINGSUMMER 2019 37
mdashmdashmdashmdashmdashmdashmdashmdashmdashmdashmdashmdashmdashmdashmdashmdashmdashmdashmdashmdashmdashmdashmdashmdashmdashmdashmdashmdashmdashmdashmdashmdashmdashmdashmdashmdashmdashmdashmdashmdashmdashmdashmdashmdashmdashmdashndashmdashmdashmdashmdash
mdashmdashmdashmdashmdashmdashmdashmdashmdashmdashmdashmdashmdashmdashmdashmdashmdashmdashmdashmdashmdashmdashmdashmdashmdashmdashmdashmdashmdashmdashmdashmdashmdashmdashmdashmdashmdashmdashmdashmdashmdashmdashmdashmdashmdashmdashndashmdashmdashmdashmdash
38 INTERNATIONAL JOURNAL OF ENGINEERING RESEARCH AND INNOVATION | V11 N1 SPRINGSUMMER 2019
The GPS time is available for free with an accuracy much
greater than that needed for image time registration This
provides an opportunity for verifying the synchronization of
the pose and the image If there is an accurate clock in the
image the clock time can be compared with the GPS time
in the pose If they match the synchronization is confirmed
If they do not match then hardware or software modifica-
tions are required
GPS Clock Version 1
The original clock Version 1 was not designed specifi-
cally for testing image synchronization and so was modified
for this purpose The clock displayed the minutes and sec-
onds with six gray code bits (Dewar amp Stevens 2012) and
milliseconds with 10 gray code bits Two additional indica-
tors were also displayed The first indicated a valid display
labeled ldquoGPS Okrdquo the second indicator changed state each
time the GPS receiver time sync pulse was received and was
labeled 1 pulse per second (1PPS) Gray code was used in
the clock because only one bit changes at a time If binary
were used the transition from 7 to 8 which in binary is
0111b to 1000b could be read as 0000b or 1111b which
would be 0 or 15 in decimal Version 1 of the clock had a
number of issues
1 Heavy about 35 pounds
2 Separate gray code displays for minutes seconds
and milliseconds
3 No diagnostics for the GPS receiver
4 No way to test the LEDs and drivers
5 Second update occurs 20ms after the 1PPS
6 LEDs are dim
7 Requires 120V alternating current (AC) power
8 Satellite tracking issues
While 35 pounds is not prohibitively heavy the clock was
awkward hard to carry and sometimes used in areas inac-
cessible to autos The clock did not operate on batteries
which could cause issues in remote locations The separate
gray code displays for minutes seconds and milliseconds
meant that multiple bits would sometimes change at the
same time If the change occurred while the exposure was
being made this would create errors since the second up-
date was 20ms late The milliseconds must be read first and
then the seconds adjusted With no receiver diagnostics
simple problems like a bad antenna cable could not be diag-
nosed There was no way to test for a bad LED or driver
The LEDs were not bright enough for use outdoors in the
sun or with a short 01ms integration time Finally receiver
tracking was optimized for survey work and would not track
satellites that were not clearly visible This led to trouble
getting a solution if the antenna did not have a clear view of
the sky
GPS Clock Version 2
Version 2 of the clock resolved all of the aforementioned
issues (see Figure 1) The clock was lightweight designed
for remote use included diagnostics and worked well in
direct sunlight There were test buttons for the LEDs a liq-
uid crystal display (LCD) and a diagnostic RS-232C port
Figure 1 The GPS clock version 2
The GPS clock version 2 used an Arduino Mega 2560 R3
as the computing platform The Arduino Mega (2017) had
four serial ports 54 digital inputoutput (IO) ports and mul-
tiple hardware and software interrupts The GPS receiver
was manufactured by ITEAD and used a RoyalTek REB-
4216 chip The receiver tracked reflected satellites operated
with a limited view of the sky and could often generate a
solution indoors The receiver was selected because it was
the only GPS Arduino shield (at the time of writing) with a
1PPS output All of the receiver outputs were echoed to an
RS-232 serial port for diagnostics
The LED outputs were buffered generating an intense
white light of 12000 mcd The LEDs could easily be seen
in bright sunshine A felt cover was provided to eliminate
reflections when operating in direct sun The LEDs IO pins
and buffers could be tested using two buttons ldquoall onrdquo and
ldquoall offrdquo The time display was 16 bits with 10 bits dedicat-
ed to the fraction All 16 bits were a single gray code word
This complicated manual decoding but ensured that no more
than one bit changed at a time The fraction was 10 bits
therefore the resolution was 2-12 11024th of a second or
09766 ms The resolution was approximately 1ms which
was adequate for an airborne imaging system that typically
has a minimum exposure time of 1 or 2ms
mdashmdashmdashmdashmdashmdashmdashmdashmdashmdashmdashmdashmdashmdashmdashmdashmdashmdashmdashmdashmdashmdashmdashmdashmdashmdashmdashmdashmdashmdashmdashmdashmdashmdashmdashmdashmdashmdashmdashmdashmdashmdashmdashmdashmdashmdashndashmdashmdashmdashmdash
GPS time was kept in seconds of the week starting with 0
at 00000 coordinated universal time (UTC) on Sunday
The six most significant bits of the LED display showed the
GPS time modulo 64 There are 86400 seconds in a day so
8640064 is 1350 with a remainder of zero This happy
coincidence ensured that there would be a continuous rollo-
ver over each day and each week The aerial surveillance
system was assumed to have a time error of less than
32 seconds This could be verified with a single frame of
data and a watch Assuming that the system met this re-
quirement the error would be at most a few seconds and a
modulo 64 second clock would be adequate
An LCD was provided on the clock The LCD displayed
the clock version validinvalid the number of satellite vehi-
cles (SVs) tracked the leap second and a graphic indicating
serial data received The number of SVs tracked was a key
piece of troubleshooting data as was the serial data graphic
The GPS receiver sent out six National Marine Electronics
Association (NMEA) messages The Arduino decoded two
of these messages to extract the time of day validinvalid
and the number of SVs All of the messages were echoed to
a serial port on the left side of the clock for user diagnostics
Finally the clock was lightweight only 35 pounds
8x12x3 with a carry handle and powered by six AA
batteries or an AC adapter The clock and accessories were
shipped in a small Pelican case
Hardware and Software
Figure 2 shows a hardware block diagram of the GPS
clock The ITEAD GPS receiver sends serial data to the
Arduino Mega via serial port 2 The baud rate is 9600 with
eight data bits one stop bit and no parity These data are
converted to RS-232 signal levels using a MAX-232-CPE
and outputted to a 9-pin d-shell serial port The 1PPS signal
is routed to the Arduino on pin 2 interrupt 0 The Arduino
processes the data and outputs to 18 LEDs which are con-
nected to three SN74LS07 hex buffers and drivers with
open-collector high-voltage outputs (Texas Instruments
2016) The LEDs are connected to the battery or AC adapter
and do not draw power through the Arduino voltage regula-
tor There are 16 LEDs for the time display one for the
1PPS and one for the valid indicator The Arduino drives a
backlit LCD display There is an analog contrast adjustment
for the LCD
There are four button inputs to the Arduino lamp test
buttons ldquoall onrdquo and ldquoall offrdquo and leap second ldquouprdquo and
ldquodownrdquo The lamp test buttons override the normal LED
outputs and verify the Arduino output the buffer and the
LED Not shown is the power A switched barrel jack dis-
connects the batteries when the AC adapter is connected
An on-off switch connects the power to the clock The clock
can operate for about two hours on six AA batteries An
SMA female connector is provided on the left side of the
clock for connection to an amplified 33V GPS antenna
Figure 3 shows a software block diagram for the clock
which is interrupt-driven The 1PPS event sets the seconds
of the day based on the input from the serial parser and ze-
ros out the 11024-second timer This starts the
11024-second counter at zero on the 1pps event From here
on the 11024-second clock increment will be referred to as
1 ms for brevity
Figure 2 GPS clock version 2 hardware block diagram
Figure 3 Software block diagram of the GPS clock
The ITEAD receiver generates six NMEA output messag-
es The serial parser reads and parses the recommended
minimum data (RMC) and global positioning system fixed
data (GGA) messages other messages are not parsed to
reduce processor load All messages are passed via hard-
ware to the diagnostic serial port The RMC message is
parsed to extract the UTC time and the valid flag The GGA
message provides the number of SVs in the solution The
seconds of the day (SOD) is computed based on the hour
minutes and seconds in the RMC message The RMC mes-
sage completes 750 ms into the seconds and is one second
old at the time of the next 1PPS The leap seconds are added
to the SOD to convert UTC SOD to GPS SOD The GPS
SOD is all that is needed for the clock because the seconds
in a day 86400 is an even multiple of 64 During the 1PPS
event if the time is valid the clock is reset to the (SOD
GPS + 1) modulo 64 the milliseconds is set to zero and the
millisecond timer timer 2 is set to zero
mdashmdashmdashmdashmdashmdashmdashmdashmdashmdashmdashmdashmdashmdashmdashmdashmdashmdashmdashmdashmdashmdashmdashmdashmdashmdashmdashmdashmdashmdashmdashmdashmdashmdashmdashmdashmdashmdashmdashmdashmdashmdashmdashmdashmdashmdashndashmdashmdashmdashmdash
A DIAGNOSTIC CLOCK FOR VERIFICATION OF IMAGE TIME SYNCHRONIZATION 39
mdashmdashmdashmdashmdashmdashmdashmdashmdashmdashmdashmdashmdashmdashmdashmdashmdashmdashmdashmdashmdashmdashmdashmdashmdashmdashmdashmdashmdashmdashmdashmdashmdashmdashmdashmdashmdashmdashmdashmdashmdashmdashmdashmdashmdashmdashndashmdashmdashmdashmdash
mdashmdashmdashmdashmdashmdashmdashmdashmdashmdashmdashmdashmdashmdashmdashmdashmdashmdashmdashmdashmdashmdashmdashmdashmdashmdashmdashmdashmdashmdashmdashmdashmdashmdashmdashmdashmdashmdashmdashmdashmdashmdashmdashmdashmdashmdashndashmdashmdashmdashmdash
40 INTERNATIONAL JOURNAL OF ENGINEERING RESEARCH AND INNOVATION | V11 N1 SPRINGSUMMER 2019
The 11024 event is tied to timer 2 The timer pre-scaler is
set to 64 The clock is 16 MHz so the timer counts at 250
KHz The counter should time out at 2500001024-1=
2431406 The timer is set to 243 and the remainder
01406 is accumulated until it is greater than 10 When this
happens one is subtracted from the accumulator and the
timer is set to 244 In this way the clock remains accurate
If this were not done then the last millisecond 1023 would
be over four milliseconds long This is further complicated
by the inaccuracy of the Arduino clocks The clock was
tested with three different Arduinos to investigate the varia-
bility in the oscillators The average number of microsec-
onds per 1PPS was 1e6 for a perfect oscillator The results
for the three units tested were 992592 1001216 and
1000002 The GPS 1PPS had an error of less than 1μs so
it could be used to calibrate the Arduino internal oscillator
To compensate for the oscillator errors the average value of
the microseconds per 1PPS was divided by four and used in
the above calculation instead of 250000
The REB 4216 receiver does not reveal the leap second
To convert from UTC to GPS the leap second is needed
The current leap second is 18 as of August 2017 and can
change twice per year during the first week epoch in Janu-
ary and the first week epoch in July The current leap sec-
ond is officially available on line at https
wwwnavcenuscggov but is more easily found by doing a
Google search for ldquoGPS leap secondsrdquo The conversion is
given by Equation 1[IS-GPS-200]
GPS = UTC + Leap seconds (1)
where GPS is the seconds of the week in GPS time UTC is
the seconds of the week in UTC and Leap seconds is the
integer number of leap seconds
The leap second was stored in a EEPROM and manipulat-
ed by two buttons ldquouprdquo and ldquodownrdquo When the leap second
was changed it was stored in the EEPROM During startup
the EEPROM was read to initialize the leap seconds The
LED test buttons were implemented in the 11024 event
During this event the seconds and milliseconds were com-
puted as well as the status of the valid and 1PPS LEDS The
seconds and milliseconds were converted to gray code If
neither LED test button was pushed the data were placed on
the Arduino IO ports If the ldquoall onrdquo button was pressed the
IO ports were set to on if ldquoall offrdquo was pressed then the IO
ports were set to off In this way the IO ports the buffers
and the LEDs were tested Data displayed on the LCD in-
cluded the GPS clock software revision on the top line and
key data on the second line The second line of the display
included ldquovalrdquoldquoinvrdquo to indicate the status of the clock the
number of satellites the number of leap seconds and a ro-
tating slash to indicate that the GPS messages were being
received
Verification
Accuracy of the GPS clock was verified in a number of
ways First the 1PPS signal was checked against a Novatel
survey receiver second a precise time protocol-enabled
camera (Kaplan 1996) was used and third a Novatel re-
ceiver was used Figure 4 shows a histogram of the error
collected from 31521 images
Figure 4 Histogram of clock errors (31521 measurements)
The first test conducted was to determine the accuracy of
the 1PPS interrupt A NovAtel PWRPAK-4-3151W PN
01016783 was connected to an AeroAntenna AT575-9W-
TNCF-000-05-26-NM amplified antenna The 1PPS was
connected to the Arduino interrupt 0 IO pin 2 The interrupt
routine was set up to toggle the 1PPS LED on the Arduino
The Arduino output was connected to the NovAtel Event1
input The NovAtel ldquoMarkTime OnNewrdquo log (Novatel
2015) was used to determine the interrupt delay This test
showed a delay of 11 micros which is the time required to pro-
cess the interrupt Figure 5 shows how the second and third
tests were set up Table 1 provides descriptions of the com-
ponents
The camera was powered using power over Ethernet
(POE) Communications and control of the camera was by
gigabyte Ethernet A PTP (IEEE 2008) time server was
connected to the camera to provide microsecond-level abso-
lute time to the camera In this configuration a console ap-
plication running on the laptop triggered and recorded 10
images about 08 seconds apart Each image was saved us-
ing the PTP time in microseconds The PTP time is Temps
Atomique International (TAI) seconds since January 1
-02 0 02 04 06 08 1 120
50
100
150
200
250
300
NOV Time Error (ms)
Co
un
t
mdashmdashmdashmdashmdashmdashmdashmdashmdashmdashmdashmdashmdashmdashmdashmdashmdashmdashmdashmdashmdashmdashmdashmdashmdashmdashmdashmdashmdashmdashmdashmdashmdashmdashmdashmdashmdashmdashmdashmdashmdashmdashmdashmdashmdashmdashndashmdashmdashmdashmdash
1970 (McCarthy amp Seidelmann 2009) TAI is always ahead
of GPS by 19 seconds (Time Service Dept nd) and can
be determined using Equation 2
GPS = PTP + 19s (2)
where PTP is seconds since January 1 1970
Figure 5 Test configuration for the clock
Table 1 Equipment used for clock testing
PTP time synchronization in the camera is known to be
within 2 μs (Allied Vision 2016) If the PTP time from the
camera is correct then this would be all that is required to
validate the clock readings to the millisecond To check the
camera PTP time the sync 1 output of the camera was tied
to the Event 1 input of the Novatel Using MATLAB the
console app was executed and the file namesPTP times
were extracted The Novatel logs were collected and the
time extracted Each image was read and the first 20 bytes
of the image were replaced with the GPS time from the No-
vatel receiver This was done 10 images at a time to ensure
that there were no buffering errors Later when processing
the images the PTP time was extracted from the file name
and the GPS time was extracted from the image
Other items in the test setup included a NetGear Ethernet
switch and Cat 5E Ethernet cables This set up was used for
all of the results in the following section Tests were con-
ducted with the lens aperture at max an exposure time of
01 ms and a gain of 35 dB This produced images having
an exposure much shorter than the resolution of the clock
Figure 6(a) shows that the LEDs and clock were clearly
visible Figure 6(a) also shows image one of 31521 images
used to verify the clock accuracy The images were pro-
cessed automatically using MATLAB First the location of
the LEDs was captured This was done by displaying image
one and clicking on each of the 18 LEDs The location of
the LEDs was saved and indicated by circles in Figure 6(a)
Once this was completed the LED locations could be used
for all images as long as the clock and camera were not
moved
(a) The first of 31521 images (b) Mask for bit G15
used for clock verification
Figure 6 The LEDs and clock are clearly visible
For each image the LEDs are read as follows a mask is
generated for each LED position with a value of one within
a radius of pixels Figure 6(b) shows the mask for LED
G15 The mask and the image are multiplied element by
element and the results are summed This gives a low value
for an LED that is off and a high value for an LED that is
on This is repeated for each of the 16 gray code LEDs the
1PPS and the valid LED A threshold value is chosen mid-
way between on and off to differentiate the two states In
this way the 16 gray code bits are extracted This is done
for each image The gray code values for each image are
converted to seconds using Equation 3 Note that the clock
reading is by definition modulo 64
(3)
where Gry is the clock reading in gray code gry2int()
converts in gray code to an integer and 1024 converts
clock increments to seconds Additional MATLAB scripts are available from the author (see contact information
included with this paper)
Item Description
Camera Allied Vision Manta G-319B
Novatel Novatel PWRPAK-4-3151W PN 01016783
PTP Server Time Machine TM2000A
Switch NetGear ProSAFE GS108
Antennas Generic Magnetic Base L1 Patch Antenna
g ry 2 in t(G ry ) =
1 0 2 4M o d G P S
mdashmdashmdashmdashmdashmdashmdashmdashmdashmdashmdashmdashmdashmdashmdashmdashmdashmdashmdashmdashmdashmdashmdashmdashmdashmdashmdashmdashmdashmdashmdashmdashmdashmdashmdashmdashmdashmdashmdashmdashmdashmdashmdashmdashmdashmdashndashmdashmdashmdashmdash
A DIAGNOSTIC CLOCK FOR VERIFICATION OF IMAGE TIME SYNCHRONIZATION 41
mdashmdashmdashmdashmdashmdashmdashmdashmdashmdashmdashmdashmdashmdashmdashmdashmdashmdashmdashmdashmdashmdashmdashmdashmdashmdashmdashmdashmdashmdashmdashmdashmdashmdashmdashmdashmdashmdashmdashmdashmdashmdashmdashmdashmdashmdashndashmdashmdashmdashmdash
mdashmdashmdashmdashmdashmdashmdashmdashmdashmdashmdashmdashmdashmdashmdashmdashmdashmdashmdashmdashmdashmdashmdashmdashmdashmdashmdashmdashmdashmdashmdashmdashmdashmdashmdashmdashmdashmdashmdashmdashmdashmdashmdashmdashmdashmdashndashmdashmdashmdashmdash
42 INTERNATIONAL JOURNAL OF ENGINEERING RESEARCH AND INNOVATION | V11 N1 SPRINGSUMMER 2019
The MATLAB code for this conversion is decGPS=gray2int(Gry)
ModGPS=decGPS1024
When in use it was assumed that the clock was correct so
the error was the time stampmdashthe GPS clock time in the
image The time stamp error can be computed using Equa-
tion 4
ModTimeStamp = mod(TimeStamp64)
Err = ModTimeStamp ‒ ModGPS (4)
if (Err lt -32) Err = Err + 64
where TimeStamp is the time stamp in GPS time mod(a b)
returns the remainder of ab and Err is the clock error
Note that the ldquoifrdquo statement compensates for events where
the ModGPS and the ModTimeStamps occur on opposite
sides of the 64 second boundary
Using the setup above the clock distribution was 05 ms
plusmn03 ms as seen in the histogram of Figure 4 The camera
was triggered asynchronously so that the errors should form
a uniform error distribution in Figure 4 Theoretically the
distribution of the error should be a uniform distribution
with a mean of 05 ms and standard deviation of 028 ms
(Miller amp Freund 1977) which is very close to the meas-
ured values of 05 for the mean and 03 for the standard de-
viation The clock resolution was 1 ms while the actual
accuracy is better than 01 ms To understand why examine
what happens to images taken at various times A through D
in Figure 7 The clock reads 0000 in the range 0000 to
0001 and 0001 in the range from 0001 to 0002 An im-
age taken at B will have a time stamp of 00011 but the
clock will read 0001 and the error is 01 ms The same
applies for C where the error is 09 ms The image taken at
A has a time stamp of 000047 and the clock reads 0000 so
the error is 047 ms All of the errors will map into the range
of 0 to 1 ms
Figure 7 Timeline showing various image capture times
Now consider the image at D This time stamp is 0001
but the clock could be in transition and read either 0000 or
0001 If the clock reads 0000 then the time error for D is
1 ms If the cock reads 0001 then the time error reads 0 So
the image at D could have an error of 0 or 1 ms The same
argument can be made for the image taken at E This is il-
lustrated in Figure 8 Note that most of the images occur
between B and C Since they are random in time they map
to a uniform distribution with an error between 0 and 1 ms
The points at D and E may map to 0 ms plusmn a few microsec-
onds or to 1 ms plusmn a few microseconds The result is the plot
in Figure 4 The camera integration time is 01 ms for the
data collected in Figure 4 This results in a few observations
in the range of 100 to 107 ms
Figure 8 Mapping of image times to error space
The GPS clock has an LED to indicate that the clock is
valid The clock may go to invalid if the GPS solution is
corrupt due to jamming an antenna failure poor visibility
of the sky or other reasons If this happens the valid LED
should turn off To test this the clock was allowed to sync
to GPS time Data recording was started and the GPS an-
tenna was disconnected After a period of time the antenna
connector was reconnected and the clock synced The data
were checked and the invalid state started almost immedi-
ately when the antenna was disconnected When the antenna
was reconnected the time recovered and the clock returned
to valid All measurements with the valid indicator on were
correct For accuracy the imaging system should be set for
a short integration time The recommended exposure time is
01 ms to extract maximum accuracy from the clock This
can usually be achieved by setting the integration time
01 ms and increasing the gain The clock does not have to
be visible as long as the LEDs can be seen in the image An
underexposed image will work because the LEDs are very
bright If a longer exposure time is used the results will be
smeared but the results are still meaningful Some systems
using webcams for example do not allow the user to con-
trol the exposure This is illustrated in the two tests that fol-
low
Two tests were performed using 1 ms and 2 ms integra-
tion times For a 1 ms exposure with 1661 images the
mean is 67 μs and the standard deviation is 06 ms or
00 plusmn 06 ms For a 2 ms exposure with 3701 images the
mean is -04ms with a standard deviation of 10 ms
mdashmdashmdashmdashmdashmdashmdashmdashmdashmdashmdashmdashmdashmdashmdashmdashmdashmdashmdashmdashmdashmdashmdashmdashmdashmdashmdashmdashmdashmdashmdashmdashmdashmdashmdashmdashmdashmdashmdashmdashmdashmdashmdashmdashmdashmdashndashmdashmdashmdashmdash
Case Studies
Version 1 of the clock was developed in 2009 and used to
troubleshoot fix and ultimately verify a number of sys-
tems Case studies are provided here to give the reader an
appreciation of how time sync errors can arise and how the
clock can be used to investigate and correct the any syn-
chronization errors Seven case studies are listed in Table 2
Some of these cases were investigated thoroughly and docu-
mented in publications in others the results were transmit-
ted and results were never communicated to the author
Table 2 Table of case studies using the clock
Case 1 The Novatel ldquoInsPva OnMarkrdquo log was used but
this log was not supported by Novatel There was an inter-
polation error that returned the positon and attitude at the
wrong time The correct log is the ldquoMark1Pva OnNewrdquo log
There is a -10 ms error in the ldquoInsPva OnMarkrdquo log that
reaches as high as 50 ms near the one-second boundary
This indicates that perhaps the Novatel has housekeeping
chores on the one-second boundary that create issues with
the unsupported log
Case 2 The system was switched to use the ldquoMark1Pva
OnNewrdquo log This created additional problems with yaw
errors from IMU Knowing the time tags were correct led to
an examination of the errors Based on this test it became
clear that the ldquoInsPva OnMarkrdquo log has errors that cannot be
explained Novatel was contacted and the user was advised
to do a firmware update This corrected the error
Case 3 A nadir (down looking) camera system mounted on
the Ohio University Avionics Center DC-3 was tested using
the clock The system had zero time errors and no modifi-
cations were required
Case 4 Two independent nadir camera systems were
mounted on the Ohio University Avionics Center DC-3
Both of these systems used Allied Vision PTP cameras
Both systems were tested using the clock and found to have
correct time tags
Case 5 A number of the Version 1 clock shortcomings were
revealed A 30 frames per second (FPS) with a long lens
was tested using Version 1 of the clock It was required to
position the clock outside in order for the camera to capture
the entire clock in the image The sun was so bright that the
LEDs could not be read Folding tables and sawhorses were
used to provide shade so that the clock could be read The
clock was placed in an area that was surrounded by build-
ings that obscured portions of the sky The GPS receiver
lost lock many times and slowed the data collection Once
usable data were obtained from the clock it was discovered
that the images were off by 1 to 3 frames The system hard-
ware included a divide-by-four circuit in the line between
the camera sync and the Novatel mark input The error oc-
curred because the divide-by-four counter was not reset and
not synced with the software The software system was re-
configured to reset the divide-by-four circuit when imaging
was started This resulted in synced images
Case 6 An imaging system similar to that described in
Cohenour et al (Camera 2015) and Conehour et al
(Corrected 2015) recorded at a rate of 3 frames per second
There was a time tag error of 016 The camera sync and the
Novatel mark input were driven by an external time source
The error was frac12 of the frame rate One possible source of
the error could be that the camera was triggered on the posi-
tive edge of the signal and the Novatel was triggered on the
negative edge Changing edge sensitivity of either the cam-
era or the Novatel is trivial The author did not receive any
feedback on the resolution of this issue This is a good ex-
ample of the utility of the clock an easily correctable prob-
lem but difficult to isolate without the clock
Case 7 A forward-looking camera system was installed on
the Ohio University Avionic Engineering Center Beechcraft
Barron The system included both IR and visible spectra
cameras A breadboard prototype of the Version 2 clock
was used to test the time tagging of the visible camera The
LEDs used on the clock are not suitable for IR
The cameras were triggered by a Novatel 1PPS signal
The software written for Microsoft Windows received No-
vatel position and attitude data as well as image data The
visible camera was tested and found to be off by 1 second
Software changes were made to correct this problem The
system was retested and shown to be correct Flight data
were recorded using the system When the images were
projected there were large time synchronization errors The
data for a turn were analyzed to determine if the images
matched the pose data The horizon was tracked in a number
of images to estimate the roll The estimated roll from the
Case Description
1 Incorrect Novatel Log
2 Novatel Log Error
3 DC 3 Camera System
4 DC 3 PTP System
5 Hi Rate Data Collection
6 12 frame error
7 Forward Looking EO and IR
mdashmdashmdashmdashmdashmdashmdashmdashmdashmdashmdashmdashmdashmdashmdashmdashmdashmdashmdashmdashmdashmdashmdashmdashmdashmdashmdashmdashmdashmdashmdashmdashmdashmdashmdashmdashmdashmdashmdashmdashmdashmdashmdashmdashmdashmdashndashmdashmdashmdashmdash
A DIAGNOSTIC CLOCK FOR VERIFICATION OF IMAGE TIME SYNCHRONIZATION 43
mdashmdashmdashmdashmdashmdashmdashmdashmdashmdashmdashmdashmdashmdashmdashmdashmdashmdashmdashmdashmdashmdashmdashmdashmdashmdashmdashmdashmdashmdashmdashmdashmdashmdashmdashmdashmdashmdashmdashmdashmdashmdashmdashmdashmdashmdashndashmdashmdashmdashmdash
mdashmdashmdashmdashmdashmdashmdashmdashmdashmdashmdashmdashmdashmdashmdashmdashmdashmdashmdashmdashmdashmdashmdashmdashmdashmdashmdashmdashmdashmdashmdashmdashmdashmdashmdashmdashmdashmdashmdashmdashmdashmdashmdashmdashmdashmdashndashmdashmdashmdashmdash
44 INTERNATIONAL JOURNAL OF ENGINEERING RESEARCH AND INNOVATION | V11 N1 SPRINGSUMMER 2019
images was correlated with the IMU roll The time error of
the images was determined to be 14 seconds This shows
how buffering or other issues can cause problems The pro-
ject was shelved due to a failure of the IR camera and the
issue was never resolved
Conclusions
A GPS synchronized clock was described The purpose of
the clock was to measure time synchronization errors in an
aerial surveillance system Using the clock a precise GPS
time could be extracted from the image The image time
was compared to the pose time to determine the time error
Any time errors will create projection errors With this in-
formation corrective action can be taken The clock de-
scribed in this paper was Version 2 All of the shortcomings
in Version 1 were corrected The clock is lightweight in-
tensely bright powered by AC or batteries and includes test
features and diagnostics A detailed analysis of the timing
error between the clock and a reference receiver showed
that the resolution of the clock was 1 ms while the accuracy
was better than 01 ms If the exposure time increased the
clock was still valid but the resolution was reduced
The camera integration time impacted the clock readings
If the camera integration was longer than 1 ms the least
significant bit would appear as on with a 50 duty cycle
This was tested and the clock was still valid but the resolu-
tion was reduced For best results the minimum integration
time that allows reading the LEDs should be used A num-
ber of case studies were used to illustrate the utility of the
clock These case studies illustrate the types of errors that
can be encountered and how corrective action can be taken
once the errors are discovered The clock presented here
was for visible light There was also a need for time verifi-
cation of infrared (IR) image data The clock could easily be
converted to cover shortwave IR images simply by using IR
LEDs This becomes more complex at longer wavelengths
A number of schemes are being considered for wavelengths
up to 8 microm Additional information about the clock and on-
going work is available from the author
References
Allied Vision (2016) Application note IEEE 1588
precision time protocol prosilica GT GC and manta
cameras Vancouver British Columbia Canada Allied
Vision
Arduino (2017) Arduino Mega 2650 Retrieved from
httpwwwarduinoorgproductsboardsarduino-mega-
2560
Bryant M Johnson P Kent B M Nowak M amp
Rogers S R (2008) Layered sensing Its definition
attributes and guiding principles for AFRL strategic
technology development Wright-Patterson Air Force
Base OH Sensors Directorate Air Force Research
Laboratory
Cohenour C Price R Rovito T amp van Graas F (2015)
Camera models for the Wright Patterson Air Force
Base (WPAFB) 2009 wide area motion imagery
(WAMI) data set IEEE Aerospace amp Electronic
Systems Magazine 30(6) 4-15
Cohenour C Price R Rovito T amp van Graas F (2015)
Corrected pose data for the Wright Patterson Air Force
Base (WPAFB) 2009 wide area motion imagery
(WAMI) data set SPIE Journal of Applied Remote
Sensing 9(1) 4-15
Dewar M amp Stevens B (2012) Ordering block designsmdash
Gray codes universal cycles and configuration New
York Springer
Di K amp Li R (2004) CAHVOR camera model and its
photogrammetric conversion for planetary applications
Journal of Geophysical Research 109(E04004) 1-9
Ersoy I Palaniappan K Seetharaman G S amp Rao R
M R (2012) Interactive target tracking for persistent
wide-area surveillance Interactive target tracking for
persistent wide-area surveillance Proceedings of SPIE
Conference on Geospatial InfoFusion II Bellingham
WA SPIE doi 10111712920815
IEEE (2008) IEEE standard for a precision clock
synchronization protocol for networked measurement
and control systems Retrieved from http
standardsieeeorg
Kaplan E D (1996) Understanding GPS Principles and
applications Boston Artech House
McCarthy D amp Seidelmann K (2009) Time From earth
rotation to atomic physics Weinheim Germany Wiley-
VCH
Miller I amp Freund J (1977) Probability and statistics for
engineers Englewood Cliffs NJ Prentice-Hall
NovAtel (2015) OEM6 family firmware reference manual
OM-20000129 rev 8 Calgary Alberta Canada
NovAtel
Texas Instruments (2016) SN74LS07 hex buffers and
drivers with open-collector high-voltage outputs
Dallas Texas Instruments
Time Service Dept (nd) Leap seconds Retrieved from
httptychousnonavymilleapsechtml
Tsai R Y (1987) A versatile camera calibration technique
for high-accuracy 3d machine vision metrology using
off-the shelf tv cameras and lenses IEEE Journal of
Robotics and Automation RA-3(4) 323-344
Wolf P R (1974) Elements of photogrammetry New
York McGraw-Hill
mdashmdashmdashmdashmdashmdashmdashmdashmdashmdashmdashmdashmdashmdashmdashmdashmdashmdashmdashmdashmdashmdashmdashmdashmdashmdashmdashmdashmdashmdashmdashmdashmdashmdashmdashmdashmdashmdashmdashmdashmdashmdashmdashmdashmdashmdashndashmdashmdashmdashmdash
Biography
CURTIS COHENOUR is an assistant professor in the
Ohio University Engineering Technology and Management
Department He received his BS degree from West Virginia
Institute of Technology in 1980 MS degree from Ohio Uni-
versity in 1988 and PhD in electrical engineering from
Ohio University in 2009 He is a registered professional
engineer in West Virginia and Ohio Dr Cohenour has
worked in industry as an electrical engineer in the areas of
control systems automation and power He joined Ohio
University in 2002 as a research engineer working for the
Ohio University Avionics Engineering Center He has
worked on projects covering a wide variety of avionics and
navigation systems such as the instrument landing system
microwave landing system distance measuring equipment
LAAS WAAS and GPS His recent work has included
research with the Air Force Research Laboratory in Dayton
Ohio aimed at understanding and correcting image geo-
registration errors from a number of airborne platforms Dr
Cohenour may be reached at cohenourohioedu
mdashmdashmdashmdashmdashmdashmdashmdashmdashmdashmdashmdashmdashmdashmdashmdashmdashmdashmdashmdashmdashmdashmdashmdashmdashmdashmdashmdashmdashmdashmdashmdashmdashmdashmdashmdashmdashmdashmdashmdashmdashmdashmdashmdashmdashmdashndashmdashmdashmdashmdash
A DIAGNOSTIC CLOCK FOR VERIFICATION OF IMAGE TIME SYNCHRONIZATION 45
ASSESSING THE EFFECTIVENESS OF AN AUTOMATIC
DOOR LOCK SYSTEM BY DISCHARGE DETECTION
TO LOWER CASUALTIES DURING AN ACADEMIC
ACTIVE SHOOTER INCIDENT mdashmdashmdashmdashmdashmdashmdashmdashmdashmdashmdashmdashmdashmdashmdashmdashmdashmdashmdashmdashmdashmdashmdashmdashmdashmdashmdashmdashmdashmdashmdashmdashmdashmdashmdashmdashmdashmdashmdashmdashmdashmdashmdashmdashmdashmdashndashmdashmdashmdashmdash
Jae Yong Lee Purdue University James Eric Dietz Purdue University
Abstract
The 2018 Stoneman Douglas High School (Parkland)
shooting emphasized the importance of testing active shoot-
er responses for both first-responder communities and the
general public Since the 1999 Columbine massacre the
preparedness for active shooter incidents (ASIs) included
aggressive police tactical responses to neutralize the shoot-
ing threat Currently the runhidefight response for un-
armed individuals has been implemented as part of the ac-
tive shooter response for both the public and private sectors
However despite the RHFrsquos nationwide implementation
there are few studies in the literature to support the effec-
tiveness of RHF Additionally modeling a scenario similar
to the Parkland shooting suggests that the application of
RHF without situational awareness of the shooterrsquos location
could cause higher casualty rates by an average of more
than 126 individuals
In this study the authors compared the casualty rates of
two models The first model consisted only of hide (shelter-
in-place) and run (evacuate) The second model applied the
first modelrsquos components with the automatic door lock sys-
tem which was triggered by discharge detection To ex-
clude human participation and to prevent physiological and
psychological impact agent-based modeling (ABM) was
used to recreate a one-story academic infrastructure with 26
lecture halls and three exits containing 600 unarmed indi-
viduals The flexibility of ABM allows multiple iterations
while manipulating various parameters The ABM approach
in active shooter research also eliminates human error and
logistical issues The outcome of this study evaluates the
effectiveness of an automated door lock system based on
firearm discharge detection with a campus-wide alert sys-
tem to conduct lockdown
Introduction
The term active shooter incident (ASI) may be a familiar
term for the general public Federal Bureau of Investigation
(2016) statistics suggest that the number of active shooter
incidents has risen from 74 (2000-2008) to 191 (2009-
2016) incidents per year Additionally 456 of the active
shooter incidents occur in areas of commerce and 244 in
educational institutions Finally 60 of ASIs were termi-
nated prior to the arrival of law enforcement The increasing
rate of active shooter incidents in the areas of commerce
and educational institutions with short duration challenges
the first responder and the civilian communities to mitigate
such incidents
Law enforcement communities have applied mitigation
tactics such as unified incident command system (FEMA
2017) hosting school resource officers (Scott amp Schwartz
2014) and the formation of contact teams (Scott amp
Schwartz 2014) to mitigate such incidents The most com-
mon ASI response for the civilian population in both private
and public sectors was ldquorunhidefightrdquo (RHF) (City of Hou-
ston 2012) The RHF response was created in 2012 by the
City of Houston under the Federal Emergency Management
Agencyrsquos grant Yet despite the nationwide application of
RHF there is a lack of literature supporting the effective-
ness of RHF to lower casualties during ASIs Additionally
RHF cannot be applied in areas where the unarmed individ-
uals are incapable of fighting the active shooter such as
kindergarten or elementary schools In this study the au-
thors examined the casualty rates of two models The first
model represented an academic infrastructure without any
preventative system The second model applied an automat-
ed door lock system to the first model which was initiated
by the active shootersrsquo first discharge A campus-wide lock-
down was automatically conducted among unarmed individ-
ual agents The door lock system only prevented entry to the
lecture hall which allowed individuals to evacuate the lec-
ture hall Only run and hide were implemented in both mod-
els since they assumed that the majority of unarmed indi-
vidual agents were either kindergarten or elementary school
students who were limited in their ability to fight the shoot-
er
Agent-Based Model
AnyLogic software consists of three major components
discrete event agent-based and system dynamic methods
mdashmdashmdashmdashmdashmdashmdashmdashmdashmdashmdashmdashmdashmdashmdashmdashmdashmdashmdashmdashmdashmdashmdashmdashmdashmdashmdashmdashmdashmdashmdashmdashmdashmdashmdashmdashmdashmdashmdashmdashmdashmdashmdashmdashmdashmdashndashmdashmdashmdashmdash
46 INTERNATIONAL JOURNAL OF ENGINEERING RESEARCH AND INNOVATION | V11 N1 SPRINGSUMMER 2019
mdashmdashmdashmdashmdashmdashmdashmdashmdashmdashmdashmdashmdashmdashmdashmdashmdashmdashmdashmdashmdashmdashmdashmdashmdashmdashmdashmdashmdashmdashmdashmdashmdashmdashmdashmdashmdashmdashmdashmdashmdashmdashmdashmdashmdashmdashndashmdashmdashmdashmdash
that could be used interchangeably For this study the agent
-based method was used predominantly to recreate active
shooter incidents within the educational environment The
model consists of pedestrian and process modeling libraries
which recreates the interaction between an active shooter
and the unarmed individual agents within the model
The benefits of ABM were its ability to measure emergent
phenomena and collect individual agentrsquos interaction with
other agents Additionally ABM can illustrate ldquobehavior
degree of rationality and ability to learn and
evolverdquo (Bonabeau 2002) which was a crucial component
in measuring the cause and effect of hypothesizing what
increased or decreased the casualty rate Finally using
ABM allows active shooter research to be conducted in a
safe environment by eliminating the participantsrsquo potential
to experience post-traumatic stress disorder or other anxie-
ties (DHS 2017) Both models were based on a general
floor plan for an academic institution which was available
in the public domain as a visual aid intended to support the
emergency evacuation plans The floor plan included class-
rooms and hallway corridors which were converted to an
image file and added to the AnyLogic software
Model Physical Infrastructure
The Wall Target Line Service with Lines and Polygonal
Area from the Space Markup section in the Pedestrian Li-
brary were used to model the physical infrastructure The
wall creates a physical barrier within the model which lim-
its the agentrsquos movement For example if a wall is encoun-
tered by an agent within the model the agent seeks alterna-
tive routes by moving away from the obstacle The service
with lines section can send an agent through the wall which
represents an agent passing through the doorway The po-
lygonal area represents lecture hall seats where the agents
remain in one location for the duration of the class Each
lecture hall consists of one attractor as a point of gathering
during the lockdown phase
Model Agents
There were two agents in this model an active shooter
and the unarmed individuals State Configuration ndash Line of
Sight (LOS) and State Configuration ndash Casualty Each agent
carries different states in order to add flexibility to what an
agent can and cannot do depending on the location For
example just because an active shooterrsquos discharge range is
set to 100 feet does not mean that the shooter is capable of
selecting targets through the wall of the lecture hall or
agents in a different hallway section To limit target selec-
tion of the shooter line of sight (LOS) was modeled by
placing agents into different states depending on the loca-
tion In Figure 1 the agentrsquos state under green LOS is col-
ored purple
Figure 1 The change of agentrsquos state by location
Once the agent enters the light blue LOS the agentrsquos state
and color change to cyan Additionally an agent could be
under both green and blue LOS if two areas are merging
Both agents operate under this concept in order to limit tar-
get selection probability based on the physical location
such as hallways or lecture halls The active shooter selects
the target by using a Function within the Agent Library
Each function is coded in Java which selects the shooter
target based on the LOS state followed by the discharge
range One target could be selected per search where the
rate of each search was set to one target within a 212-
second interval Anklam Kirby Sharevski and Dietz
(2015) used the victim interval ratio by the statistics from
the Patrol Response Challenges (Buster 2008) where there
was one victim every 15 seconds by averaging the 65 active
shooter incidents to the number of victims For this study
the shooter casualty interval was based on the Parkland
Shooting (Fausset Kovaleski amp Mazzei 2018) by as-
sessing total death count and the duration of the shooting
The Java function was divided into three sections The
first section was the target selection among the agentrsquos pop-
ulation For instance the shooter searches for one target
among the pool of unarmed individual agents The second
section of the function entails determining the state of the
potential target agent If an agentrsquos state was a casualty
then the function starts over to find a new target If the
agentrsquos state was not a casualty then the function deter-
mines whether the target was within the same LOS state as
mdashmdashmdashmdashmdashmdashmdashmdashmdashmdashmdashmdashmdashmdashmdashmdashmdashmdashmdashmdashmdashmdashmdashmdashmdashmdashmdashmdashmdashmdashmdashmdashmdashmdashmdashmdashmdashmdashmdashmdashmdashmdashmdashmdashmdashmdashndashmdashmdashmdashmdash
ASSESSING THE EFFECTIVENESS OF AN AUTOMATIC DOOR LOCK SYSTEM BY DISCHARGE DETECTION 47
TO LOWER CASUALTIES DURING AN ACADEMIC ACTIVE SHOOTER INCIDENT
mdashmdashmdashmdashmdashmdashmdashmdashmdashmdashmdashmdashmdashmdashmdashmdashmdashmdashmdashmdashmdashmdashmdashmdashmdashmdashmdashmdashmdashmdashmdashmdashmdashmdashmdashmdashmdashmdashmdashmdashmdashmdashmdashmdashmdashmdashndashmdashmdashmdashmdash
mdashmdashmdashmdashmdashmdashmdashmdashmdashmdashmdashmdashmdashmdashmdashmdashmdashmdashmdashmdashmdashmdashmdashmdashmdashmdashmdashmdashmdashmdashmdashmdashmdashmdashmdashmdashmdashmdashmdashmdashmdashmdashmdashmdashmdashmdashndashmdashmdashmdashmdash
48 INTERNATIONAL JOURNAL OF ENGINEERING RESEARCH AND INNOVATION | V11 N1 SPRINGSUMMER 2019
the shooter If the shooter and the unarmed individual were
in the same state then the function evaluates the discharge
range If the potential target does not qualify under either
state the function restarts The third section of the function
executes the act of firearm discharge to the targeted agent
The exchange of fire was modeled by sending a string mes-
sage to the targeted agent The probability of a failed mes-
sage delivery was zero since the execution would occur
immediately Once the message has been received then the
state of the target agent will change to casualty and the
speed of the agent will be set to zero and the color to red
The agentrsquos movement was conducted by the following
blocks from the pedestrian library PedSource PedGoTo
PedService and PedSink PedSource determines the agent
and the rate of entry from the agent to the model For this
model there were two PedSource blocks one for an active
shooter and the other for the unarmed individual agents
TargetLine was used as an entry point which was deter-
mined within the PedSource block Once the agent exits the
model by the PedSource block the agent enters the PedSer-
vice block which allows the agent to enter the lecture hall
The PedService block prohibits the agent from traveling
through the wall which represents a door Each lecture hall
consists of a polygonal area where the agent waits through-
out the model runtime Figure 2 shows how the agentrsquos state
was changed from green to either purple or yellow based on
their location
Figure 2 The change of an agentrsquos state by location
Agents Logic
All 600 unarmed individual (UI) agents enter the model
and move randomly toward the available lecture hall Once
an agent arrives in a lecture hall it will remain at the ran-
domly selected point until the shooting begins Prior to the
shooting all 600 UI agents are distributed within the lecture
halls no UI agents remained in the hallway
The active shooter enters the model without discharging
and continues to advance down the hallway until the in-
class population count reaches 600 Once all 600 UI agents
are in the lecture hall the shooter immediately begins to
discharge UI casualties will always occur in the lecture
hall The shooterrsquos discharging function is set to one casual-
ty per 212 seconds for UI agents that are in range If there
are zero potential targets within the range the 212-second
delays starts over Once the active shooter agent begins
shooting the UI agents will then evacuate to the nearest
exit The shooter will attempt to randomly enter a lecture
hall one after another while running UI agents in the hall-
way are considered as potential targets If the automatic
door lock system is in place the shooter will remain in the
hallway until the model is terminated while having the
same ability to discharge at the running UI agents
The automatic door lock system begins as soon as the
active shooter discharges the first shot The lock system
prevents the active shooter from entering the lecture halls
while still allowing any UI agents inside to evacuate via the
hallway The shooterrsquos discharge initiates the unarmed indi-
vidual agents to either hide (shelter-in-place) or run
(evacuate) from the shooter The hide probability parameter
determines what percentage of UI agents will hide while
the rest will run from the shooter Table 1 shows that if the
hide probability is set to 20 then the remaining 80 will
run toward the nearest exit after exiting the designated lec-
ture hall
Table 1 Hide and run probability parameter manipulation per
iteration
Model Runtime Properties Limitations
and Iterations by Parameter Manipulation
bull The duration of the model was limited to six minutes
which was equivalent to the Parkland Shooting event
(Fausset et al 2018)
bull The casualty rate was limited to one casualty per 212
seconds by the active shooter again based on the
Parkland Shooting event (Fausset et al 2018)
bull The target selection began once all 600 unarmed indi-
viduals entered the lecture halls which limited the
first casualty to occur only in the lecture hall
bull If there were no potential target within the first 212
seconds the shooter required an additional 212 sec-
onds to select another target
Iteration 1 2 3 4 5 6 7 8 9 10 11
Hide 0 1 2 3 4 5 6 7 8 9 1
Run 1 9 8 7 6 5 4 3 2 1 0
mdashmdashmdashmdashmdashmdashmdashmdashmdashmdashmdashmdashmdashmdashmdashmdashmdashmdashmdashmdashmdashmdashmdashmdashmdashmdashmdashmdashmdashmdashmdashmdashmdashmdashmdashmdashmdashmdashmdashmdashmdashmdashmdashmdashmdashmdashndashmdashmdashmdashmdash
bull The unarmed individuals who were hiding in the
lecture hall could not attempt to escape if the shooter
entered the lecture hall
To allow for position and time variation each hide pa-
rameter was run 100 times and measured the following out-
put data
bull Hide parameter (Double)
bull Run parameter (Double)
bull Number of unarmed individuals in the lecture hall
(Integer)
bull Number of unarmed individuals in the hallway
(Integer)
bull Number of unarmed individual casualties (Integer)
bull Number of unarmed individuals who successfully
evacuated (Integer)
bull Number of lecture hall casualties of unarmed individ-
uals (Integer)
Results
Figure 3 suggests a highest average total casualty rate of
943 of 600 (157) where 20 hid and 80 ran to the
nearest exit The lowest average total casualty rate was 423
of 600 (071) where all unarmed individual agents were
seeking shelter within the lecture halls The highest average
hallway casualty rate was 524 of 600 (087) with 80
hide probability where the lowest rate was 360 of 600
(06) with 0 hide probability The highest average lec-
ture hall casualty rate was 479 of 600 (079) with 10
hide probability with the lowest at 0 of 600 (0) with 100
hide probability
Figure 3 Unarmed individual casualty rate by hide (shelter-in-
place) probability without immediate automatic door lock system
Figure 4 shows a comparison of the casualty rate of un-
armed individuals to the automatic door lock system by the
hide (shelter-in-place) probability
Figure 4 Unarmed individual casualty rate by hide (shelter-in-
place) probability with immediate automatic door lock system
Figure 4 suggests the lowest average casualty rate of 115
(019) was reported when all unarmed individuals hide
from the shooter with the automatic door lock mechanism in
place The highest average casualty rate was 98 (163)
where all agents had to evacuate from the lecture hall re-
gardless of the automated lock mechanism The highest
average hallway casualty rate was 647 of 600 (108) with
90 hide probability where the lowest rate was 0 of 600
(0) with 0 hide probability The highest average lecture
hall casualty rate was 381 of 600 (064) with 30 hide
probability with the lowest at 115 of 600 (019) with
100 hide probability
The locations were made up of total hallway and lecture
hall where casualty probabilities were measured based on
two parameter manipulations The first parameter was the
hide probability ranging from 0 where zero unarmed
individuals (UI) evacuated the lecture hall to 100 where
all 600 evacuated to the nearest exit The second was a
Boolean parameter which determined whether the automat-
ic door lock system was in place or not The total casualty
probabilities were calculated by dividing the total number of
casualties by 600 The hallway and the lecture hall casualty
probabilities were calculated by dividing the casualty rates
by the total number of either run or hide casualties For ex-
ample hallway casualty probability was calculated by di-
viding the hallway casualty rate to the total number of evac-
uees Figure 5 compares the UI agentrsquos casualty probability
without the immediate door lock system based on the
agentrsquos location of casualty
Figure 5 illustrates the total hallway and lecture hall cas-
ualty probability based on the hide parameter without the
door lock system The highest total casualty probability was
157 when 20 of unarmed individuals hid and 80 ran
to the nearest exit The lowest total casualty probability was
071 when 100 evacuated to the nearest exit The lec-
mdashmdashmdashmdashmdashmdashmdashmdashmdashmdashmdashmdashmdashmdashmdashmdashmdashmdashmdashmdashmdashmdashmdashmdashmdashmdashmdashmdashmdashmdashmdashmdashmdashmdashmdashmdashmdashmdashmdashmdashmdashmdashmdashmdashmdashmdashndashmdashmdashmdashmdash
ASSESSING THE EFFECTIVENESS OF AN AUTOMATIC DOOR LOCK SYSTEM BY DISCHARGE DETECTION 49
TO LOWER CASUALTIES DURING AN ACADEMIC ACTIVE SHOOTER INCIDENT
mdashmdashmdashmdashmdashmdashmdashmdashmdashmdashmdashmdashmdashmdashmdashmdashmdashmdashmdashmdashmdashmdashmdashmdashmdashmdashmdashmdashmdashmdashmdashmdashmdashmdashmdashmdashmdashmdashmdashmdashmdashmdashmdashmdashmdashmdashndashmdashmdashmdashmdash
mdashmdashmdashmdashmdashmdashmdashmdashmdashmdashmdashmdashmdashmdashmdashmdashmdashmdashmdashmdashmdashmdashmdashmdashmdashmdashmdashmdashmdashmdashmdashmdashmdashmdashmdashmdashmdashmdashmdashmdashmdashmdashmdashmdashmdashmdashndashmdashmdashmdashmdash
50 INTERNATIONAL JOURNAL OF ENGINEERING RESEARCH AND INNOVATION | V11 N1 SPRINGSUMMER 2019
ture hall casualty probability was the highest at 735
when 10 of the unarmed individuals evacuated The low-
est lecture hall casualty probability was 06 when every-
one sought shelter The highest hallway casualty probability
was 353 when 90 hid upon the first discharge The
lowest hallway casualty probability was 0 when 100
hid from the shooter Figure 6 compares the UI agentrsquos cas-
ualty probability with the immediate door lock system
based on the agentrsquos location of casualty
Figure 5 Unarmed individual survival probability by hide (shelter-
in-place) probability without immediate automatic door lock sys-
tem
Figure 6 Unarmed individual survival probability by hide (shelter-
in-place) probability with immediate automatic door lock system
Figure 6 illustrates the total hallway and lecture hall
casualty probability based on the hide parameter with the
door lock system The highest total casualty probability was
158 during the 10 hide probability where the lowest
probability was 019 during the 100 hide probability
The highest lecture hall casualty probability was 5 during
the 10 hide probability where the lowest lecture hall
probability was 019 for the 100 hide probability The
highest hallway casualty probability was 536 during the
90 hide probability The lowest hallway casualty probabil-
ity was 0 for the 100 hide probability Table 2 compares
the total casualty probabilities for the model with and with-
out a door lock
Table 2 Total casualty probability with and without door lock per
iteration
The overall casualty probability decreased by 026 with
the highest casualty rate decrease of 051 with all agents
sheltering in place In contrast the casualty rate increased
by 005 for the 10 hide probability Table 3 compares
the hallway casualty probabilities for the model with and
without a door lock The overall casualty probability in-
creased by 059 with the highest casualty rate increasing
by 183 when 90 sought shelter There was no decrease
in casualty probability for hallway casualties Table 4 com-
pares the lecture hall casualty probabilities for the model
with and without a door lock The overall casualty probabil-
ity decreased by 101 with the highest casualty rate de-
crease of 235 when 10 sought shelter In contrast the
casualty rate increased by 001 when all agents evacuated
Probability Total Casualty
Probability
Survival Probability
Difference
Hide Run
Without
Door
Lock
With
Door Lock
0 100 139 100 -39
10 90 153 158 05
20 80 157 148 -09
30 70 142 141 -01
40 60 134 112 -21
50 50 129 98 -31
60 40 121 94 -27
70 30 113 84 -29
80 20 126 81 -44
90 10 118 75 -44
100 0 71 19 -51
Average
Casualty
Probability
127 101 -26
mdashmdashmdashmdashmdashmdashmdashmdashmdashmdashmdashmdashmdashmdashmdashmdashmdashmdashmdashmdashmdashmdashmdashmdashmdashmdashmdashmdashmdashmdashmdashmdashmdashmdashmdashmdashmdashmdashmdashmdashmdashmdashmdashmdashmdashmdashndashmdashmdashmdashmdash
Table 3 Hallway casualty probability with and without door lock
per iteration
Table 4 Lecture hall casualty probability with and without door
lock per iteration
Conclusions
Assuming locked doors are effective at separating poten-
tial victims from the shooter this study further demonstrat-
ed the value of agent-based models to design effective poli-
cies by testing the impact of automatic door locking tech-
nology on causality rates Using this model shelter-in-place
proved to be an effective strategy for reducing the impact of
an active shooter event with the greatest reduction shown
when all individuals sought to shelter in place The imple-
mentation of an automated door lock system triggered by
discharge detection did decrease the total casualty rate an
average of 026 over 100 simulated iterations The total
lecture hall casualty rate decreased an average of 101
while the total hallway casualty rate increased by 059
While the automatic door locking system did reduce causal-
ities individuals in the hallways also saw an increase in
causalities due to limits in protection from the shooter and
evacuation paths
References
Anklam C Kirby A Sharevski F amp Dietz J (2015)
Mitigating active shooter impact analysis for policy
options based on agentcomputer-based modeling Jour-
nal of Emergency Management 13(3) Retrieved from
httpswwwwmpllcorgojs-242indexphpjem
articleview176
Bonabeau E (2002) Agent-based modeling Methods and
techniques for simulating human systems Proceedings
of the National Academy of Sciences 99(suppl 3)
7280-7287
Buster C (2008) Patrol response challenge NCJRS Law
and Order 56(6) 62-68
City of Houston (2012) RunHideFightmdashReady Houston
Retrieved from httpreadyhoustonwpenginecom
suspicious-activityrun-hide-fight
Department of Homeland Security [DHS] (2017) Active
shooter recovery guide Retrieved from https
wwwdhsgovsitesdefaultfilespublicationsactive-
shooter-recovery-guide-08-08-2017-508pdf
Fausset R Kovaleski S amp Mazzei P (2018) On a day
like any other at a Florida school 6 minutes of death
and chaos The New Y ork Times Retrieved
from httpswwwnytimescom20180216us
stoneman-douglas-shootinghtml
Federal Bureau of Investigation (2016) Quick look 220
Active shooter incidents in the United States between
2000-2016 FBI Retrieved from httpswwwfbigov
aboutpartnershipsoffice-of-partner-engagementactive
-shooter-incidents-graphics
Probability Total Casualty
Probability
Survival Probability
Difference
Hide Run Without
Door Lock
With
Door Lock
0 100 79 102 23
10 90 89 120 31
20 80 96 131 35
30 70 87 111 23
40 60 88 129 40
50 50 101 151 50
60 40 122 180 58
70 30 125 211 86
80 20 192 308 116
90 10 353 536 183
100 0 0 0 0
Average
Casualty
Probability
121 180 59
Probability Total Casualty
Probability
Survival Probability
Difference
Hide Run Without
Door Lock
With
Door Lock
0 100 60 61 01
10 90 735 500 -235
20 80 402 218 -184
30 70 317 212 -106
40 60 203 88 -114
50 50 157 45 -111
60 40 120 37 -83
70 30 107 29 -78
80 20 109 25 -85
90 10 92 23 -69
100 0 71 19 -51
Average
Casualty
Probability
216 114 -101
mdashmdashmdashmdashmdashmdashmdashmdashmdashmdashmdashmdashmdashmdashmdashmdashmdashmdashmdashmdashmdashmdashmdashmdashmdashmdashmdashmdashmdashmdashmdashmdashmdashmdashmdashmdashmdashmdashmdashmdashmdashmdashmdashmdashmdashmdashndashmdashmdashmdashmdash
ASSESSING THE EFFECTIVENESS OF AN AUTOMATIC DOOR LOCK SYSTEM BY DISCHARGE DETECTION 51
TO LOWER CASUALTIES DURING AN ACADEMIC ACTIVE SHOOTER INCIDENT
mdashmdashmdashmdashmdashmdashmdashmdashmdashmdashmdashmdashmdashmdashmdashmdashmdashmdashmdashmdashmdashmdashmdashmdashmdashmdashmdashmdashmdashmdashmdashmdashmdashmdashmdashmdashmdashmdashmdashmdashmdashmdashmdashmdashmdashmdashndashmdashmdashmdashmdash
mdashmdashmdashmdashmdashmdashmdashmdashmdashmdashmdashmdashmdashmdashmdashmdashmdashmdashmdashmdashmdashmdashmdashmdashmdashmdashmdashmdashmdashmdashmdashmdashmdashmdashmdashmdashmdashmdashmdashmdashmdashmdashmdashmdashmdashmdashndashmdashmdashmdashmdash
52 INTERNATIONAL JOURNAL OF ENGINEERING RESEARCH AND INNOVATION | V11 N1 SPRINGSUMMER 2019
Federal Emergency Management Agency [FEMA] (2017)
Incident command system resources Retrieved from
httpswwwfemagovincident-command-system-
resources
Scott M amp Schwartz J (2014) The police response to
active shooter incidents Washington DC Police Ex-
ecutive Research Forum Retrieved from https
wwwpoliceforumorgassetsdocs
Critical_Issues_Seriesthe20police20response
20to20active20shooter20incidents202014pdf
Biographies
JAE YONG LEE is a graduate research assistant in
computer and information technology at Purdue University
He earned his BA in public relations and minor in computer
and information technology in 2017 from Purdue Universi-
ty His research interests include examining the effective-
ness of active shooter response and mitigation policies with
agent-based modeling utilizing AnyLogic Mr Lee may be
reached at jaeleepurdueedu
J ERIC DIETZ is a Professor of Computer and Infor -
mation Technology at Purdue University and the Director of
Purdue Homeland Security Institute He earned his BS and
MS degrees in chemical engineering in 1986 from Rose-
Hulman Institute of Technology and PhD in chemical engi-
neering from Purdue University He had served as Founding
Executive Director for the Indiana Department of Homeland
Security and retired Lieutenant Colonel from the US Army
Dr Dietz may be reached at jedietzpurdueedu
INSTRUCTIONS FOR AUTHORS
MANUSCRIPT FORMATTING REQUIREMENTS The INTERNATIONAL JOURNAL OF ENGINEERING
RESEARCH AND INNOVATION is an onlineprint publi-
cation designed for Engineering Engineering Technology
and Industrial Technology professionals All submissions to
this journal submission of manuscripts peer-reviews of
submitted documents requested editing changes notifica-
tion of acceptance or rejection and final publication of ac-
cepted manuscripts will be handled electronically The only
exception is the submission of separate high-quality image
files that are too large to send electronically
All manuscript submissions must be prepared in
Microsoft Word (doc or docx) and contain all figures im-
ages andor pictures embedded where you want them and
appropriately captioned Also included here is a summary of
the formatting instructions You should however review
the sample Word document on our website (httpijeriorg
formatting-guidelines) for details on how to correctly format
your manuscript The editorial staff reserves the right to edit
and reformat any submitted document in order to meet pub-
lication standards of the journal
The references included in the References section of
your manuscript must follow APA-formatting guidelines In
order to help you the sample Word document also includes
numerous examples of how to format a variety of scenarios
Keep in mind that an incorrectly formatted manuscript will
be returned to you a delay that may cause it (if accepted) to
be moved to a subsequent issue of the journal
1 Word Document Page Setup Two columns with frac14
spacing between columns top of page = frac34 bottom of
page = 1 (from the top of the footer to bottom of
page) left margin = frac34 right margin = frac34
2 Paper Title Centered at the top of the fir st page
with a 22-point Times New Roman (Bold) small-caps
font
3 Page Breaks Do not use page breaks
4 Figures Tables and Equations All figures tables
and equations must be placed immediately after the first
paragraph in which they are introduced And each must
be introduced For example ldquoFigure 1 shows the opera-
tion of supercapacitorsrdquo ldquoThe speed of light can be
determined using Equation 4rdquo
5 More on Tables and Figures Center table captions
above each table center figure captions below each
figure Use 9-point Times New Roman (TNR) font
Italicize the words for table and figure as well as their
respective numbers the remaining information in the
caption is not italicized and followed by a periodmdasheg
ldquoTable 1 Number of research universities in the staterdquo
or ldquoFigure 5 Cross-sectional aerial map of the forested
areardquo
6 Figures with Multiple Images If any given figure
includes multiple images do NOT group them they
must be placed individually and have individual minor
captions using ldquo(a)rdquo ldquo(b)rdquo etc Again use 9-point TNR
7 Equations Each equation must be numbered
placed in numerical order within the document and
introducedmdashas noted in item 4
8 Tables Graphs and Flowcharts All tables graphs
and flowcharts must be created directly in Word tables
must be enclosed on all sides The use of color andor
highlighting is acceptable and encouraged if it provides
clarity for the reader
9 Textboxes Do not use text boxes anywhere in the
document For example tablefigure captions must be
regular text and not attached in any way to their tables
or images
10 Body Fonts Use 10-point TNR for body text through-
out (18 paragraph indention) indent all new para-
graphs as per the images shown below do not use tabs
anywhere in the document 9-point TNR for author
namesaffiliations under the paper title 16-point TNR
for major section titles 14-point TNR for minor section
titles
11 Personal Pronouns Do not use personal pronouns
(eg ldquowerdquo ldquoourrdquo etc)
12 Section Numbering Do not use section number ing
of any kind
13 Headers and Footers Do not use either
mdashmdashmdashmdashmdashmdashmdashmdashmdashmdashmdashmdashmdashmdashmdashmdashmdashmdashmdashmdashmdashmdashmdashmdashmdashmdashmdashmdashmdashmdashmdashmdashmdashmdashmdashmdashmdashmdashmdashmdashmdashmdashmdashmdashmdashmdashndashmdashmdashmdashmdash
INSTRUCTIONS FOR AUTHORS MANUSCRIPT FORMATTING REQUIREMENTS 53
mdashmdashmdashmdashmdashmdashmdashmdashmdashmdashmdashmdashmdashmdashmdashmdashmdashmdashmdashmdashmdashmdashmdashmdashmdashmdashmdashmdashmdashmdashmdashmdashmdashmdashmdashmdashmdashmdashmdashmdashmdashmdashmdashmdashmdashmdashndashmdashmdashmdashmdash
mdashmdashmdashmdashmdashmdashmdashmdashmdashmdashmdashmdashmdashmdashmdashmdashmdashmdashmdashmdashmdashmdashmdashmdashmdashmdashmdashmdashmdashmdashmdashmdashmdashmdashmdashmdashmdashmdashmdashmdashmdashmdashmdashmdashmdashmdashndashmdashmdashmdashmdash
54 INTERNATIONAL JOURNAL OF ENGINEERING RESEARCH AND INNOVATION | V11 N1 SPRINGSUMMER 2019
14 References in the Abstract Do NOT include any
references in the Abstract
15 In-Text Referencing For the fir st occur rence of a
given reference list all authorsmdashlast names onlymdashup
to seven (7) if more than seven use ldquoet alrdquo after the
seventh author For a second citation of the same refer-
encemdashassuming that it has three or more authorsmdashadd
ldquoet alrdquo after the third author Again see the sample
Word document and the formatting guide for references
for specifics
16 More on In-Text References If you include a refer -
ence on any table figure or equation that was not cre-
ated or originally published by one or more authors on
your manuscript you may not republish it without the
expressed written consent of the publishing author(s)
The same holds true for name-brand products
17 End-of-Document References Section List all refer -
ences in alphabetical order using the last name of the
first authormdashlast name first followed by a comma and
the authorrsquos initials Do not use retrieval dates for web-
sites
18 Author Biographies Include biographies and cur -
rent email addresses for each author at the end of the
document
19 Page Limit Manuscr ipts should not be more than
15 pages (single-spaced 2-column format 10-point
TNR font)
20 Page Numbering Do not use page numbers
21 Publication Charges Manuscr ipts accepted for pub-
lication are subject to mandatory publication charges
22 Copyright Agreement A copyr ight transfer agree-
ment form must be signed by all authors on a given
manuscript and submitted by the corresponding author
before that manuscript will be published Two versions
of the form will be sent with your manuscriptrsquos ac-
ceptance email
Only one form is required Do not submit both forms
The form named ldquopaperrdquo must be hand-signed by each
author The other form ldquoelectronicrdquo does not require
hand signatures and may be filled out by the corre-
sponding author as long as heshe receives written per-
mission from all authors to have himher sign on their
behalf
23 Submissions All manuscr ipts and required files and
forms must be submitted electronically to Dr Philip D
Weinsier manuscript editor at philipwbgsuedu
24 Published Deadlines Manuscr ipts may be submit-
ted at any time during the year irrespective of pub-
lished deadlines and the editor will automatically have
your manuscript reviewed for the next-available issue
of the journal Published deadlines are intended as
ldquotargetrdquo dates for submitting new manuscripts as well
as revised documents Assuming that all other submis-
sion conditions have been met and that there is space
available in the associated issue your manuscript will
be published in that issue if the submission processmdash
including payment of publication feesmdashhas been com-
pleted by the posted deadline for that issue
Missing a deadline generally only means that your
manuscript may be held for a subsequent issue of the
journal However conditions exist under which a given
manuscript may be rejected Always check with the
editor to be sure Also if you do not complete the sub-
mission process (including all required revisions) with-
in 12 months of the original submission of your manu-
script your manuscript may be rejected or it may have
to begin the entire review process anew
INTERNATIONAL JOURNAL OF
MODERN ENGINEERING
THE LEADING JOURNAL OF ENGINEERING APPLIED SCIENCE AND TECHNOLOGY
Mark Rajai PhD
Editor-in-Chief California State University-Northridge College of Engineering and Computer Science Room JD 4510 Northridge CA 91330 Office (818) 677-5003 Email mrajaicsunedu
Contact us
wwwiajcorg wwwijmeus
wwwtiijorg
wwwijeriorg
Print ISSN 2157-8052
Online ISSN 1930-6628
TO JOIN THE REVIEW BOARD
bull The International Journal of Engineering Research and
Innovation (IJERI)
For more information visit wwwijeriorg
bull The Technology Interface International Journal (TIIJ)
For more information visit wwwtiijorg
OTHER IAJC JOURNALS
bull Manuscripts should be sent electronically to
the manuscript editor Dr Philip Weinsier
at philipwbgsuedu
For submission guidelines visit
wwwijmeussubmissions
IJME SUBMISSIONS
bull Contact the chair of the International
Review Board Dr Philip Weinsier at
philipwbgsuedu
For more information visit
wwwijmeusijme_editorialhtm
bull IJME was established in 2000 and is the first and
official flagship journal of the International
Association of Journal and Conferences (IAJC)
bull IJME is a high-quality independent journal steered by
a distinguished board of directors and supported by an
international review board representing many well-
known universities colleges and corporations in the
US and abroad
bull IJME has an impact factor of 300 placing it among
the top 100 engineering journals worldwide and is the
1 visited engineering journal website (according to
the National Science Digital Library)
ABOUT IJME
INDEXING ORGANIZATIONS
bull IJME is indexed by numerous agencies
For a complete listing please visit us at
wwwijmeus
SPRINGSUMMER 2009
VOLUME 1 NUMBER 1
IJERI Contact Information
General questions or inquiries about sponsorship of the journal should be directed to
Mark Rajai PhD
Founder and Editor-In-Chief
Office (818) 677-5003
Email editorijeriorg
Department of Manufacturing Systems Engineering amp Management
California State University-Northridge
18111 Nordhoff St
Room JD3317
Northridge CA 91330
The International Journal of Engineer-
ing Research amp Innovation (IJERI) is
the second official journal of the Inter-
national Association of Journals and
Conferences (IAJC) IJERI is a highly-
selective peer-reviewed print journal
which publishes top-level work from all
areas of engineering research innova-
tion and entrepreneurship
IJERI

mdashmdashmdashmdashmdashmdashmdashmdashmdashmdashmdashmdashmdashmdashmdashmdashmdashmdashmdashmdashmdashmdashmdashmdashmdashmdashmdashmdashmdashmdashmdashmdashmdashmdashmdashmdashmdashmdashmdashmdashmdashmdashmdashmdashmdashmdashndashmdashmdashmdashmdash
mdashmdashmdashmdashmdashmdashmdashmdashmdashmdashmdashmdashmdashmdashmdashmdashmdashmdashmdashmdashmdashmdashmdashmdashmdashmdashmdashmdashmdashmdashmdashmdashmdashmdashmdashmdashmdashmdashmdashmdashmdashmdashmdashmdashmdashmdashndashmdashmdashmdashmdash
6 INTERNATIONAL JOURNAL OF ENGINEERING RESEARCH AND INNOVATION | V11 N1 SPRINGSUMMER 2019
In a 2014 study of Ladd Pebbles Stadium in Mobile Ala-
bama focusing on stadium design researchers spoke to the
international standard of eight minutes for a stadium evacu-
ation to occur This study focused on the physical limita-
tions associated with evacuations (crowding collisions
social norms etc) However very little attention was paid
to communication factors that could affect timing in an
emergency Instead the study focused on evacuation flow
rate simulation and avoiding and assuming communication
dynamics (Aldana Fox Diehl amp Dimitoglou 2014) How-
ever case studies show how vital communication is to evac-
uation planning At ATampT Stadium staff members are giv-
en a rundown on their tasks of the day and what to expect in
terms of safety at the beginning of each shift These task
sheets include updates and reminders for the event and pro-
vide photos of what the passes and wristbands look like so
there are no copies (ATampT 2018) It also reminds them if
they see something to say something Each staff member is
also expected to get a formal safety briefing from their su-
pervisor prior to doors opening
However arenas are not the only example of a large event
venue University stadiums arenas and event centers are
typically less secure and at higher risk for an emergency
Surveying three universities and their plans offered a more
comprehensive list of evacuation procedures and methods
Additionally these case studies offered the opportunity to
see how they communicated information consistently to
both long-time and first-time visitors Though they also
showed methods related to staffing this was not an im-
portant factor for the current research project Townson
University has a public version of their arenarsquos emergency
response plan and they outline a list of important infor-
mation items for their event staff to know before their event
This list covers familiarizing staff and contractors on emer-
gency procedures fire procedures emergency exit policies
equipment and seating policies and other general rules
The Townson report also covers the procedures during an
emergency As soon as an incident occurs it is noted on the
PA and via a bullhorn in case of a fire alarm or PA equip-
ment failure the TUPD will designate a safe location out-
side management will direct patrons during evacuation and
will use the radio for communication and an operations
commander will be assigned These procedures are based on
the National Incident Management System (NIMS) the
National Response Framework (NRF) and the Incident
Command System (ICS) These provide guidelines for pre-
paredness and compliance Anyone involved in security
management should be fully aware especially when ensur-
ing the safety of over several hundred people (Towson
2018) From these case studies responses require necessary
preparation and practice Based on this information evacua-
tion times should be estimated at approximately 20 minutes
for an average venue with systems in place prior to the
event itself This time includes both the processing and ac-
tual physical evacuation time The communication methods
employed by these venues will be further explored in the
following section
Emergency Communication Methods
In 2008 the Department of Homeland Security designed a
planning guide for emergencies in stadiums The guide has
a section for a notification system during emergencies Dur-
ing emergencies understanding the different reactions that
people can have is important to consider Using the different
possibilities can be helpful in designing an efficient notifi-
cation system The employees also need to be trained on all
aspects of the system to be sure that communication will be
effective Using common language during emergencies al-
lows for everyone to understand The guide also advises
everyone to ensure that they have a plan for displaying in-
formation (screens jumbotrons etc) along with having
employees check areas without any displays (DHS 2008)
Thus communication response methods should relate to
two communication systems visual and audio Sight and
hearing are the primary ways that any person will begin to
understand a message
Stadiums typically have public announcement systems
that will take into consideration both visual and auditory
public announcement systems but do not capitalize on addi-
tional communication systems that may be available to their
audience According to Kenneth Burke the percentage rate
of text messages being opened is 99 Burkersquos article also
states that 95 of text messages are opened within three
minutes and on average they are read in under five seconds
(Bankers 2018) This statistic is particularly useful consid-
ering that many stadiums have fan text messaging that could
evolve into an emergency communication service For ex-
ample Bankers Life Fieldhouse a stadium in Indianapolis
Indiana offers several different fan information services
Among website information is the texting service that is
offered to fans Bankers Life Fieldhouse offers a texting
service that fans can use if they ever encounter anything
suspicious during events The service is anonymous so they
can inform building management without needing to give
any personal information Bankers Life Fieldhouse also
specifies that if the service is misused the number will be
blocked for a full 24 hours (2018)
According to Cutlip and Centerrsquos Effective Public Rela-
tions (2013) there are serval communication methods to
apply to audiences (Broom Sha Seshadrinathan Center amp
Cutlip 2013) Among the various communication models
mdashmdashmdashmdashmdashmdashmdashmdashmdashmdashmdashmdashmdashmdashmdashmdashmdashmdashmdashmdashmdashmdashmdashmdashmdashmdashmdashmdashmdashmdashmdashmdashmdashmdashmdashmdashmdashmdashmdashmdashmdashmdashmdashmdashmdashmdashndashmdashmdashmdashmdash
and relevant to communications in emergency management
the mass communication model is the most effective The
mass communications model has six elements 1) the send-
er 2) the message 3) the medium or channel 4) the receiv-
ers 5) relationship contexts and 6) the social environment
Therefore the sender is the source of the impact and can
influence how it is received (Broom et al 2013) Conse-
quently credibility intensifies information and could impact
how effective a message is A message is information that is
sent or given to someone
Furthermore from Cutlip and Center messages are cate-
gorized into ldquotext verbal multimedia print etcrdquo (Broom et
al 2013) Assumption suggests that emergency manage-
ment messages have to be clear and concise However in-
terpretation occurs when communicating with the masses
and must be considered as a potential obstacle when crafting
a message (Broom et al 2013) The medium or channel that
a message uses has equal importance to the message From
a 1971 body language study face-to-face communication
delivers effective communication information yet 70-90
of communication is through nonverbal cues like gestures
and facial expressions (Mehrabian 1971) Such direct com-
munication is valuable but using technology as a medium
for communication such as social media has resulted in
creating more ways to communicate during emergencies
(Broom et al 2013) These options should be explored
more fully in terms of emergency communications
Alertus Technologies is a unified mass notification com-
munication system Alertus is often used for large events
and companies for emergency situations Alertus utilizes a
combination of communication methods to maximize the
possibility of reaching all parties The different methods
include text messaging email public announcement sys-
tems digital signage and desktop computers A few compa-
nies that utilize Alertus Technologies include Disney
ESPN and Toronto Pan AM Sports Centre (Alertus Tech-
nologies 2018) This technology system appears to encom-
pass all communication systems However the full system
relies on the combination of systems Whether this combi-
nation is effective or not depends on how accurate or effec-
tive the communication is Alertus does what many arenas
are capable of but in a way that puts the control in a uni-
fied separate entity
Methodology
In developing a way to model response communication
the authors determined that a system dynamics model would
provide a new look at response communication Response
communication requires speed time and people Balancing
these three variables is essential to effective communica-
tion Some constants such as communication and evacua-
tion rate can be influenced by these variables Thus com-
munication is a system that can be made more effective and
accurate through modeling The systems dynamics model
being used was based on a Bass diffusion model Developed
in 1969 by Frank M Bass and John A Norton a Bass diffu-
sion model represents how a potential market is affected by
advertisers and word of mouth (1987) Advertising has the
potential to spread a concise clear and strong message with
little to no resources Thus this model is a great reference
for emergency communication
Regarding this specific project the Bass Diffusion model
was changed to reflect emergency communication This
method was chosen based on how well advertisement mir-
rors communication It necessitates and requires effective
understanding but also showcases errors that are corrected
based on an alternate system Bass diffusion takes commu-
nication by word of mouth into consideration and is a large
part of emergency communication If all emergency com-
munication systems were to fail word of mouth would still
be prevalent Thus word of mouth acts as a constant in this
current model of emergency response communication
However it has an obvious error rate regarding miscommu-
nication and timely understanding
Bass Diffusion Model
Figure 1 shows how initial method research was conduct-
ed in order to see how well a Bass Diffusion model could
adapt to emergency communication By replacing the popu-
lation to reflect the emergency at hand the communication
rate was no longer influenced by advertisement but by an
auditory public announcement (PA) system As mentioned
earlier word-of-mouth communication is still reflected and
influenced by contact rate and the evacuation message rate
(Norton amp Bass 1987) The model appeared to accurately
reflect evacuation message procedures including a delay
that reflects understanding or processing time
Regarding this study the error lies in uniformity of mes-
sage Different communication systems have different chal-
lenges The message to evacuate goes through several dif-
ferent paths thus some of the messages are delayed wheth-
er through human or technologically dictated circumstances
Developing a flowchart allowed the authors to show the
specific challenges associated with each system and how
they could apply to the model Figure 2 shows how the steps
associated with each system should result in understanding
This is where the Bass Diffusion model ends as understand-
ing implies that they have fully received the evacuation
message This does not account for the actual time that it
would take for a person to evacuate (a lengthier process)
mdashmdashmdashmdashmdashmdashmdashmdashmdashmdashmdashmdashmdashmdashmdashmdashmdashmdashmdashmdashmdashmdashmdashmdashmdashmdashmdashmdashmdashmdashmdashmdashmdashmdashmdashmdashmdashmdashmdashmdashmdashmdashmdashmdashmdashmdashndashmdashmdashmdashmdash
ANALYZING RESPONSE COMMUNICATION MITIGATION METHODS THROUGH SIMULATION MODELING 7
mdashmdashmdashmdashmdashmdashmdashmdashmdashmdashmdashmdashmdashmdashmdashmdashmdashmdashmdashmdashmdashmdashmdashmdashmdashmdashmdashmdashmdashmdashmdashmdashmdashmdashmdashmdashmdashmdashmdashmdashmdashmdashmdashmdashmdashmdashndashmdashmdashmdashmdash
mdashmdashmdashmdashmdashmdashmdashmdashmdashmdashmdashmdashmdashmdashmdashmdashmdashmdashmdashmdashmdashmdashmdashmdashmdashmdashmdashmdashmdashmdashmdashmdashmdashmdashmdashmdashmdashmdashmdashmdashmdashmdashmdashmdashmdashmdashndashmdashmdashmdashmdash
8 INTERNATIONAL JOURNAL OF ENGINEERING RESEARCH AND INNOVATION | V11 N1 SPRINGSUMMER 2019
an auditory PA system visual PA system texting notifica-
tion system and word of mouth Figure 3 shows these sys-
tems
Figure 3 Final bass diffusion model
For example limited research suggests that public an-
nouncement systems are 60 effective at distributing a
message (Alertus Technologies 2018) This comes from
public relations data as opposed to testing of several emer-
gency public announcement systems However this as-
sumes that the system is in perfect working order without
any limitations (noise miscommunication etc) Because
the model is highly flexible these circumstances can be
reflected by inputting different numbers into the effective-
ness variables Using averages obtained from studies of
similar systems effectiveness was a variable inputted at
different levels depending on which system was in use
Thus effectiveness for both public announcement systems
(auditory and visual) used the same initial effectiveness
rating of 60 while the texting system was given a 50
effectiveness rating but with a message rate of approximate-
ly 5 considering how often people would check their
phones in each emergency The five-second delay was im-
plemented in the program as well Text message systems
align closely with word of mouth as they are a technologi-
cal reflection of the same process but with higher numbers
Finally word-of-mouth communication had a contact rate
of approximately 11 as shown in prior Bass Diffusion
models Word of mouth is a communication system that
exists at all times visual and audible systems only boost this
system but it does require proximity in order to work In
this specific scenario people were in each proximity to the
event and the message However word of mouth will act as
a constant in this evacuation scenario The effectiveness
dictated by evacuation message rate was set to 50
Figure 1 Original bass diffusion model
Figure 2 Communication flowchart
The flowchart shows the four systems that could be mod-
eled in an evacuation communication scenario This is
meant to come from the viewpoint of evacuees not the first
responders that would arrive Therefore the communication
systems are all processes that the average person would
have available The four communication methods used were
mdashmdashmdashmdashmdashmdashmdashmdashmdashmdashmdashmdashmdashmdashmdashmdashmdashmdashmdashmdashmdashmdashmdashmdashmdashmdashmdashmdashmdashmdashmdashmdashmdashmdashmdashmdashmdashmdashmdashmdashmdashmdashmdashmdashmdashmdashndashmdashmdashmdashmdash
Pedestrian Traffic Model
Using an agent was necessary to show the second part of
the flowchart in which the message is spread through behav-
ior People are the distributors of messages and their behav-
ior should be considered Stadium evacuation simulation
has been used previously to measure crowd dynamics In
the aforementioned 2014 study of Ladd Pebbles Stadium
the researchers compared crowd simulation models The
chosen model was behavioral using agent-based modeling
as a means of crowd simulation This allows for a more ful-
ly formed approach to stadium emergency evacuation and
verifies that simulation can be used as a valid approach to
evacuation research (Aldana et al 2014)
Through AnyLogic 8rsquos pedestrian traffic library the mes-
sage spread can be shown in real time Figure 4 shows how
the message can be spread based on word-of-mouth data
Using a statechart one can base the message on a specific
variable as opposed to a parameter Therefore a statechart
was created to manipulate the message variable as opposed
to manipulating the parameters to reflect a variable The
statechart uses the same understanding and contact rate as
word-of-mouth communication This validates the Bass
Diffusion Model By using actual agents the modeling is
more successful than the systems dynamics model at dis-
playing contact information Additionally pedestrian mod-
eling will eventually show the full extent of evacuation as a
result of the communication systems not just the system
itself
Figure 4 Pedestrian model statechart
The physical structure of the pedestrian model is meant to
reflect stadium seating so that communication rate is as
close to realistic as possible Figure 5 shows that the model
uses two waiting areas with separate agents The agents all
begin as blue until the evacuation order is released Then
the message is sent Once one person has the message they
will turn red depending on contact and proximity Error is
included to account for misunderstanding due to chaos and
human error
Figure 5 Final pedestrian model
Ultimately the final pedestrian model simulates one nec-
essary communication method Additional methods will
require further modelling to validate and continue testing
This is something the researchers hope to pursue in the fu-
ture especially as new communication methods become
popular
Results
Using the results from the systems dynamics model the
researchers modeled the effectiveness of different commu-
nication systems Using word of mouth as a constant three
communication methods were compared against those ini-
tial values In the following charts (Figures 6-10) two lines
are shown The darker line is the level of potential evacuees
(the initial population) and the level of evacuees (the
amount of people that successfully received the message)
Acting as constant word of mouth effectively distributed
information in approximately 22 minutes As a reminder
this is not an evacuation time but the communication mes-
sage time As seen in Figure 6 the halfway point for the
communication rate is much further than any other system
mdashmdashmdashmdashmdashmdashmdashmdashmdashmdashmdashmdashmdashmdashmdashmdashmdashmdashmdashmdashmdashmdashmdashmdashmdashmdashmdashmdashmdashmdashmdashmdashmdashmdashmdashmdashmdashmdashmdashmdashmdashmdashmdashmdashmdashmdashndashmdashmdashmdashmdash
ANALYZING RESPONSE COMMUNICATION MITIGATION METHODS THROUGH SIMULATION MODELING 9
mdashmdashmdashmdashmdashmdashmdashmdashmdashmdashmdashmdashmdashmdashmdashmdashmdashmdashmdashmdashmdashmdashmdashmdashmdashmdashmdashmdashmdashmdashmdashmdashmdashmdashmdashmdashmdashmdashmdashmdashmdashmdashmdashmdashmdashmdashndashmdashmdashmdashmdash
mdashmdashmdashmdashmdashmdashmdashmdashmdashmdashmdashmdashmdashmdashmdashmdashmdashmdashmdashmdashmdashmdashmdashmdashmdashmdashmdashmdashmdashmdashmdashmdashmdashmdashmdashmdashmdashmdashmdashmdashmdashmdashmdashmdashmdashmdashndashmdashmdashmdashmdash
10 INTERNATIONAL JOURNAL OF ENGINEERING RESEARCH AND INNOVATION | V11 N1 SPRINGSUMMER 2019
Figure 6 Word-of-mouth communication only
Comparatively in Figure 7 a text system in combination
with word-of-mouth communication is only slightly better
taking approximately 20 minutes to spread an evacuation
message The system in question acted similarly if a single
message was sent and spread amongst a stadiumrsquos fan ser-
vice list This would give a large event area the greatest
chance at reaching patrons without using social media It
should be noted that this parameter will need to be studied
further to establish proper manipulation and realistic bound-
aries
Figure 7 Text system only
However the systems that were more successful at issu-
ing the message were the public announcement systems In
Figure 8 the audible public announcement system took ap-
proximately 10 minutes to communicate an evacuation mes-
sage As previously noted these conditions were almost
ideal for the public announcement system but also assumed
consistent communication being relayed at reasonable inter-
vals This system is necessary but also ignores some special
populations In Figure 9 the visual system was overwhelm-
ingly the best at successfully displaying an evacuation mes-
sage The system took approximately eight minutes to effec-
tively communicate an evacuation message This includes
the timing and understanding delay incorporated into the
data Additionally the authors included an example of all of
the combined communication methods in Figure 10 This
model took approximately nine minutes to complete show-
ing how multiple communication methods may negatively
affect a message spread when factoring in additional error
rates The all-methods communication scenario also reflects
an inundated communication system in which a consistent
error message breeds inaccuracies and response times
Figure 8 PA system only
Figure 9 VisPA system only
Figure 10 All communication methods
Ultimately the knowledge obtained from the resulting
information will help improve and test emergency commu-
nication methods This can be seen in the pedestrian model
in Figure 11 The pedestrian traffic model shows that con-
tact with the message was more realistic than a systems
model The model shows that contact rate does influence
how quickly a message spreads and how word of mouth is
the greatest influencer for that message In this project
word-of-mouth communication was shown to improve com-
munications and introduce error into any communication
mdashmdashmdashmdashmdashmdashmdashmdashmdashmdashmdashmdashmdashmdashmdashmdashmdashmdashmdashmdashmdashmdashmdashmdashmdashmdashmdashmdashmdashmdashmdashmdashmdashmdashmdashmdashmdashmdashmdashmdashmdashmdashmdashmdashmdashmdashndashmdashmdashmdashmdash
system Therefore it is possibly the greatest asset or hin-
drance to response communication The pedestrian model
helps validate that theory while also allowing further test-
ing to occur Though not yet in use this pedestrian traffic
model has applicability to other communication methods
and provides a more realistic understanding of how commu-
nication would occur in an actual emergency as opposed to
a hypothetical one The model above shows how contact
rate affects method spread as the blue dots change to red
when the message is effectively spread
Figure 11 Pedestrian traffic model
Discussion
Though all the communication systems are shown differ-
ently exploring communication contact rate as a key to ef-
fectiveness will need to be considered in subsequent trials
For example text messaging systems have the potential to
be the most effective evacuation communication method as
it can reach most people and is still accessible to those with
disabilities and those not in the main area of the stadium
where the visual and audible public announcement systems
are used However there is a possible issue in that the num-
ber of patrons on their phones could overload the cellular
signal and the text message does not go through undoing all
of the benefits Additionally audible public announcements
are the next most effective evacuation communication meth-
od This method is also capable of reaching all patrons not
only those in the main areas However the consideration of
those with special needs should occur as this method does
hinder the deaf or hard of hearing Also audible public an-
nouncements need to be used cautiously as aggressively
loud and commanding announcements could increase panic
and induce anxiety Testing will follow to see how valid this
system is to an actual evacuation Finally visual public an-
nouncement systems are the least effective of all three meth-
ods but the best in terms of understanding This method can
only reach patrons in the main areas and those who can
read observe and understand what is announced It does
not take blind patrons into consideration However if the
visual public announcement is flashed on and off it could
draw more attention to the message Additionally more
information could be given via visual public announcement
systems information which could be more easily updated
Conclusions
Though examining the results appears to suggest that the
visual public announcement system was the most effective
model this was only in regards to one factor It only reaches
a certain number of patrons at one time Therefore all meth-
ods of communication should use three reliable systems to
issue an evacuation message However the message would
need to be uniform and accurate for this model to work
While it is not feasible for all three methods to be consist-
ently running at the same time each situation would require
a specific combination of the three This question will re-
quire more consistent testing to deduce the correct order and
should be used in combination with the pedestrian model to
achieve the most realistic results As testing continues this
same question will apply to the pedestrian model and con-
tact rate Additionally incorporating social media as a com-
munication method will be considered moving forward
However this method has more complex intricacies with
obsolescence of equipment being a distinct possibility
Notably many of these systems can be altered to ensure
that they perform more effectively than their standards
These differences may mean that one system is more effec-
tive than another at a certain venue event or scenario
These alterations continue to affect word-of-mouth commu-
nication thus all three methods should be considered in
addition to this method Word-of-mouth communication
continues to be the communication at the base of each meth-
od deciding effectiveness and understanding of evacuation
The faster a message is understood the better the outcome
of an evacuation By assisting individual security the venue
is better prepared for an emergency The faster they re-
spond the more lives saved Therefore communicating
proper responses to patrons is the difference between life
and death
mdashmdashmdashmdashmdashmdashmdashmdashmdashmdashmdashmdashmdashmdashmdashmdashmdashmdashmdashmdashmdashmdashmdashmdashmdashmdashmdashmdashmdashmdashmdashmdashmdashmdashmdashmdashmdashmdashmdashmdashmdashmdashmdashmdashmdashmdashndashmdashmdashmdashmdash
ANALYZING RESPONSE COMMUNICATION MITIGATION METHODS THROUGH SIMULATION MODELING 11
mdashmdashmdashmdashmdashmdashmdashmdashmdashmdashmdashmdashmdashmdashmdashmdashmdashmdashmdashmdashmdashmdashmdashmdashmdashmdashmdashmdashmdashmdashmdashmdashmdashmdashmdashmdashmdashmdashmdashmdashmdashmdashmdashmdashmdashmdashndashmdashmdashmdashmdash
mdashmdashmdashmdashmdashmdashmdashmdashmdashmdashmdashmdashmdashmdashmdashmdashmdashmdashmdashmdashmdashmdashmdashmdashmdashmdashmdashmdashmdashmdashmdashmdashmdashmdashmdashmdashmdashmdashmdashmdashmdashmdashmdashmdashmdashmdashndashmdashmdashmdashmdash
12 INTERNATIONAL JOURNAL OF ENGINEERING RESEARCH AND INNOVATION | V11 N1 SPRINGSUMMER 2019
References
Aldana N Fox C Diehl E amp Dimitoglou G (2014) A
study of stadium exit design on evacuation perfor-
mance Proceedings of the 27th International Confer-
ence on Computer Applications in Industry and Engi-
neering Cary NC International Society for Computers
and Their Applications
Alertus Technologies (2018) Mobile notification Re-
trieved from httpswwwalertuscompersonal
ATampT Stadium operations manual (2018) Retrieved from
httpsattstadiumcomsitesdefaultfilesdc-content-
filesCity20of20Arlington20Policiespdf
Bankers Life Fieldhouse (2018) Fan guide Retrieved from
httpwwwbankerslifefieldhousecomarena-
informationfan-guide
Broom G M Sha B L Seshadrinathan S Center A H
amp Cutlip S M (2013) Cutlip and Centerrsquos effective
public relations (11th ed) Upper Saddle River NJ
Pearson
Burke K (2016) 73 texting statistics that answer all your
questions Retrieved from httpswwwtextrequestcom
blogtexting-statistics-answer-questions
Centers for Disease Control and Prevention [CDC] (2018)
Emergency preparedness and response Social media
Retrieved from httpsemergencycdcgovsocialmedia
indexasp
Department of Homeland Security [DHS] (2008) Evacua-
tion planning guide for stadiums Retrieved from
httpswwwdhsgovsitesdefaultfilespublications
evacuation-planning-guide-stadiums-508pdf
Department of Homeland Security [DHS] (2014) Com-
municating in an emergency Federal Emergency Man-
agement Agency Retrieved from https
trainingfemagovemiwebisis242bstudent
20manualsm_03pdf
Ellis R Fantz A Karimi F amp McLoughlin E C
(2016) Orlando shooting 49 killed shooter pledged
ISIS allegiance CNN Retrieved from https
wwwcnncom20160612usorlando-nightclub-
shootingindexhtml
Mehrabian A (1971) Silent messages Belmont CA
Wadsworth
Mileti D S amp Sorensen J H (1990) Communication of
emergency public warnings A social science perspec-
tive and state-of-the-art assessment Washington DC
FEMA Retrieved from httpsdoi1021726137387
Norton J A amp Bass F M (1987) A diffusion theory
model of adoption and substitution for successive gen-
erations of high-technology products Management
Science 33(9) 1-19
Proulx G (1995) Evacuation time and movement in apart-
ment buildings Fire Safety Journal 24(3) 229-246
Retrieved from httpsdoiorg1010160379-7112(95)
00023-M
Towson University (2018) Emergencies Retrieved from
httpswwwtowsonedupublicsafetyemergencies
Biographies
KATHERINE REICHART is a graduate student in
Homeland Security in the Computer Information Technolo-
gy program at Purdue University Her previous degree is in
professional writing also from Purdue University Addi-
tionally she is a member of the Purdue Homeland Security
Institute She has been involved in several research projects
in the institute Additionally she is an assistant editor on
several books in progress concerning those research topics
Her research will continue to focus on communication and
reporting methods of large event security Katherine
Reichart may be reached at kreicharpurdueedu
ANNA LARSON works for General Electr ic in De-
troit MI She earned her BS in Computer Information Tech-
nology from Purdue University and MS in Computer and
Information Technology 2018 from her alma mater Her
interests include disaster network communication and
cyberforensics Anna Larson may be reached at lar-
sonapurdueedu
KRISTAL SMITH works for Blue Horseshoe in Boul-
der CO She recently graduated from Purdue University
with her BS in Computer and Information Technology
While there she researched and participated in projects re-
garding emergency preparedness Kristal Smith may be
reached at smit2265purdueedu
J ERIC DIETZ PE graduated in 1984 with a BS and
again in 1986 with an MS in chemical engineering both
from the Rose-Hulman Institute of Technology He earned
his PhD in chemical engineering in 1994 from Purdue Uni-
versity where he is now a professor In 2004 he retired as a
Lieutenant Colonel from the US Army Thus his research
interests include optimization of emergency response
homeland security and defense energy security and engag-
ing veterans in higher education Dr Dietz may be reached
at jedietzpurdueedu
Abstract
Various 3D printer configurations such as Cartesian
printers operate similarly to a CNC machining center and
Delta printers that have a stationary build platform with the
use of three motors located on pillars controlling the end
effector location A less popular configuration is a Polar
system which utilizes a rotating table a Z translation con-
trolled by a linear actuator located beyond the edge of the
rotating table and a horizontal arm connected to the Z-axis
that translates the end effector along the center axis The
Polar 3D printer configuration being the simplest was cho-
sen in order to scale up to build and test a low-cost large-
scale 3D printer with a build envelope of 183m x 183m x
153m (6ft x 6ft x 5ft)
This open source hardware 3D printer (OSALS-Polar) can
be produced for approximately $5000 for materials assum-
ing that labor is provided by the user To 3D print a part
any CAD software is used to output a stereo lithography
(stl) file open source slicing software (Cura) to generate
the G-code file and open source software (Franklin) to op-
erate the 3D printer Testing the 3D printer requires calibra-
tion of the three axes to produce the desired positioning of
the Theta-axis rotation R-axis horizontal arm translation
and Z-axis vertical translation with the inputs into the
Franklin software Also the system is set to start at a zero
location according to distances set from the end-stop limit
switches The final testing of the OSALS-Polar produced
small extruded parts although the accuracy and scaling up
to larger parts not accomplished during this study Future
testing may encounter limitations in the size of prints due to
material cooling at various rates causing warpage Introduc-
tion
3D printing technology has become quite common and
increasingly applications for direct digital manufacturing
are being implemented RepRap (self-replicating machines)
3D printers (Sells Bailard Smith Bowyer amp Olliver 2010
Gibb 2014) are open source 3D printer designs available
for anyone to build According to Wittbrodt et al (2013)
the cost of an open source 3D printer used for printing
household components such as a pierogi mold or paper
towel holder can be recuperated within a year or two if a
reasonably fair number of household items are printed using
the 3D printer (Wittbrodt et al 2013 Wittbrodt 2014) The
3D printer build envelope (printer platform times the print-
ing height capability) can be a limitation of direct digital
manufacturing if the part exceeds this build envelope
Common desktop 3D printers have a build envelope of
203 mm (8 in) length x 203 mm (8 in) and width x 153
mm (6 in) height Larger-scale 3D printers ranging from
5 to 10 times the size of the common desktop 3D printers
are typically very expensive to produce
Methods of joining 3D-printed parts via acetone have
been successful in producing parts such as wind turbine
blades (Deshpande Rao Pradhan amp Irwin 2016) although
this method requires several manufacturing steps and can
decrease overall part accuracy The goal of the OSALS-
Polar is to manufacture larger 3D-printed parts (such as
wind turbine blades or propeller blades) that can be printed
in a single setup without needing to be joined together
Wind turbine blades can operate at potentially high RPMs
and any structural concerns lead directly to safety concerns
making it advantageous to 3D print as one continuous part
To overcome size restrictions of desktop 3D printers the
OSALS-Polar can cost under $5000 for materials assuming
the user provides the labor In this paper the authors de-
scribe the assembly and testing of the OSALS-Polar with a
build envelope of 183m x 183m x 153m (6ft x 6ft x 5ft)
The build instructions for this system are also described
here The open source software used to create the slice file
was Cura to operate OSALS-Polar the open source soft-
ware Franklin was used
Introduction
Currently there are many different 3D printer configura-
tions such as the X Y Z Cartesian coordinate 3D printers
that operate similar to a CNC machining center or the Del-
ta which has a stationary build platform with the extruder
operated by three vertical axis translations located on a tri-
angular base A less popular method for controlling the
movement of the axes is a Polar system Figure 1 shows a
benchmark 3D printer produced by Polar3D and its main
components This particular 3D printer has a build envelope
of 203m m (8 in) diameter x 153 mm (6 in) height The
Polar 3D system was used as a datum design to develop the
initial 91 OSALS-Polar CAD design and a set of manufac-
turing drawings The Polar 3D system utilizes a rotating
table (Theta-axis) with a horizontal arm (R-axis) that trans-
mdashmdashmdashmdashmdashmdashmdashmdashmdashmdashmdashmdashmdashmdashmdashmdashmdashmdashmdashmdashmdashmdashmdashmdashmdashmdashmdashmdashmdashmdashmdashmdashmdashmdashmdashmdashmdashmdashmdashmdashmdashmdashmdashmdashmdashmdashndashmdashmdashmdashmdash
Sourabh Prashant Deshpande University of Cincinnati Shrinivas Kulkarni Michigan Technological University
Sid Shah Michigan Technological University John Irwin Michigan Technological University
DEVELOPING AN OPEN SOURCE INEXPENSIVE
LARGE-SCALE POLAR CONFIGURATION 3D PRINTER
mdashmdashmdashmdashmdashmdashmdashmdashmdashmdashmdashmdashmdashmdashmdashmdashmdashmdashmdashmdashmdashmdashmdashmdashmdashmdashmdashmdashmdashmdashmdashmdashmdashmdashmdashmdashmdashmdashmdashmdashmdashmdashmdashmdashmdashmdashmdashmdashmdashmdash
INTERNATIONAL JOURNAL OF ENGINEERING RESEARCH AND INNOVATION | V11 N1 SPRINGSUMMER 2019 13
mdashmdashmdashmdashmdashmdashmdashmdashmdashmdashmdashmdashmdashmdashmdashmdashmdashmdashmdashmdashmdashmdashmdashmdashmdashmdashmdashmdashmdashmdashmdashmdashmdashmdashmdashmdashmdashmdashmdashmdashmdashmdashmdashmdashmdashmdashndashmdashmdashmdashmdash
mdashmdashmdashmdashmdashmdashmdashmdashmdashmdashmdashmdashmdashmdashmdashmdashmdashmdashmdashmdashmdashmdashmdashmdashmdashmdashmdashmdashmdashmdashmdashmdashmdashmdashmdashmdashmdashmdashmdashmdashmdashmdashmdashmdashmdashmdashndashmdashmdashmdashmdash
14 INTERNATIONAL JOURNAL OF ENGINEERING RESEARCH AND INNOVATION | V11 N1 SPRINGSUMMER 2019
lates the extruder along a single axis to and from the center
of the printing surface The vertical (Z-axis) translation in
this system is controlled by a linear power screw and guides
located beyond the edge of the rotating surface This Polar
style 3D printer was determined to be the simplest design
when compared to the Cartesian and Delta styles to up-
scale
Figure 1 Polar3D printer (About 2014) Reprinted with
permission
Review of Related 3D Printing Systems
Rapid developments in the field of 3D printing technolo-
gy have ranged in applications from prototyping to direct
digital manufacturing Berman (2012) compares the revolu-
tion of 3D printing technology with the digital books revo-
lution and foresees its use in several promising applications
such as medicine and construction Gebler Uiterkamp amp
Visser (2014) discussed 3D printing technology in terms of
sustainability and asserted that this technology will lower
resource demands energy use and carbon dioxide emis-
sions over the entire lifecycle According to Wohlers
(2013) use of additive manufacturing technology for direct
part production has increased by more than 25 in the last
few years
Significant efforts are underway to build a large-scale 3D
printing system to manufacture large-scale industrial com-
ponents Barnett and Gosselin (2013) designed a novel large
-scale 3D printer with a cable-suspended mechanism and a
full scaffolding solution However most of the research on
large-scale 3D printers is based on Cartesian and Delta sys-
tem configurations A typical Polar 3D printing system has
a higher build volume with fewer components when com-
pared with other types (Yusuf 2015) A true Polar 3D print-
er has a rotating build plate (Theta-axis) with the vertical
arm (Z-axis) and the extruder placed on the horizontal arm
(R-axis) Any point on a flat plane can be defined by know-
ing its angle theta pole vertical location and a measure of
radius from an axis through the given pole (Horn amp Haus-
man 2017)
A Cincinnati-based Polar 3D technology company uses
fused-filament fabrication technology for a Polar 3D printer
having 2032 mm (8 in) diameter 15875 mm (625 in)
height with connectivity features such as Wi-Fi Ethernet
and USB (About 2014) R-360 is an open source Polar 3D
printer with 210 mm (826 in) disc x 200 mm (787 in)
with a total printing volume of 6927000 mm3 (42271 in3)
It uses PLA or ABS as the printing material and has a maxi-
mum printing speed of 150 mms along with features such
as cloud slicing (Replicator 2013 Farcas 2016) Another
Polar 3D printer with 3048 mm (12 in) diameter and
150 mm (59 in) height has some major features which
include the use of four extruders and Decapede electronics
for driving 10 stepper motors (Anderson 2014) The
PiMaker 3D printer also uses the Polar system with
2794 mm (11 in) diameter and 2032 mm (8 in) height
with an overall volume of over 10650000 mm3 (650 in3)
(Steele 2016) 3D printers have also been made on modest
budgets such as a senior project by Hoy (2016) who devel-
oped a Polar 3D printer having 1778 mm (7 in) diameter
that uses PLA filament
Polar 3D Printer Design
The OSALS-Polar is designed manufactured and assem-
bled by configuring the Theta-axis Z-axis and R-axis re-
spectively Engineering requirements are mapped using
QFD methodology The material for the table surface verti-
cal and horizontal supports and the rotation drive system
are selected using the decision matrix method Accordingly
the major items selected are a tubular steel structure circu-
lar glass printing plate circular steel plate table extruded
aluminum horizontal arm and stepper motors for axis mo-
tion PFMEA is carried out to identify and reduce the poten-
tial failures in the system The circular glass printing plate
has the highest RPN value for which the use of glass edge
guards is recommended to avoid breakage andor injury
The main frame is made up of steel I-beams and steel
tubular sections welded together to manufacture the table
frame Then pivot tabs welded to both the bottom frame
and table frame provide assembly alignment and leveling
capabilities The steel table has a center shaft that is placed
in the table frame center bearing after proper lubrication of
all the parts Figure 2 shows the assembly after fixing the
table roller bearings center bearing and the casters to the
frame
Vertical Z-axis
Horizontal R-axis
Table Theta-axis
mdashmdashmdashmdashmdashmdashmdashmdashmdashmdashmdashmdashmdashmdashmdashmdashmdashmdashmdashmdashmdashmdashmdashmdashmdashmdashmdashmdashmdashmdashmdashmdashmdashmdashmdashmdashmdashmdashmdashmdashmdashmdashmdashmdashmdashmdashndashmdashmdashmdashmdash
Figure 2 Frame assembly
The main power transmission component for the Theta-
axis rotating table is a stepper motor turning a spur gear
driving an internal ring gear The internal ring gear is manu-
factured by machining 10 segments that together form the
15875 mm (625 in) pitch diameter internal ring gear The
pinion gear is mounted to a NEMA 34-stepper motor that
drives the ring gear Despite several challenges introduced
in the system such as improper mating of the ring gear sec-
tions providing larger clearance holes on the ring gear seg-
ment enabled smoother motion The use of flexible pads in
stepper motor mounting also helped to minimize the inaccu-
racies in the gear alignment (Pradhan Irwin Siddegowda
amp Harsha 2016) The internal gear drive mechanism shown
in Figure 3 facilitates improved rotary motion of the table
over the originally designed center worm-gear configuration
that had many backlash issues
Figure 3 Theta-axis drive mechanism
Figure 4 shows how the vertical Z-axis beam is bolted
securely to the main frame which supports the horizontal
arm R-axis and the extruder The Z-axis mounting bracket is
used to attach the R-axis motor accommodate the acme nut
and also fix the R-axis horizontal arm in place The acme
rod is coupled to the Z-axis motor shaft with a straight cou-
pling with no gearing or reduction Two guide rails are de-
signed for the travel of the Z-axis FEA was carried out on
the system after which support brackets were added from
the guide rails to the vertical Z-axis beam accordingly in
order to avoid the deflection of the extruder through its trav-
el
Figure 4 Vertical Z-axis
The R-axis carriage wheels are locked into grooves on the
R-axis horizontal arm while a timing belt drive system
shown in Figure 5 controls the translating motion Figure 6
shows how the extruder extruder motor and hot end are
integrated into the carriage assembly The extruder hot end
bracket and spool holder were manufactured using 3D
printing
Figure 5 Drive system R-axis
Polar 3D Printer Controls
An electrical box houses the circuitry and auxiliary elec-
tronic components Figure 7 shows how the unit is fixed to
the back side of the vertical arm of the OSALS-Polar
Main Frame
Table Frame
Ring Gear Segment
Motor and Pinion Gear
Z-axis Mounting Bracket
R-axis
Guide Rails
Z-axis Vertical Beam
Timing Belt Drive System
mdashmdashmdashmdashmdashmdashmdashmdashmdashmdashmdashmdashmdashmdashmdashmdashmdashmdashmdashmdashmdashmdashmdashmdashmdashmdashmdashmdashmdashmdashmdashmdashmdashmdashmdashmdashmdashmdashmdashmdashmdashmdashmdashmdashmdashmdashndashmdashmdashmdashmdash
DEVELOPING AN OPEN SOURCE INEXPENSIVE LARGE-SCALE POLAR CONFIGURATION 3D PRINTER 15
mdashmdashmdashmdashmdashmdashmdashmdashmdashmdashmdashmdashmdashmdashmdashmdashmdashmdashmdashmdashmdashmdashmdashmdashmdashmdashmdashmdashmdashmdashmdashmdashmdashmdashmdashmdashmdashmdashmdashmdashmdashmdashmdashmdashmdashmdashndashmdashmdashmdashmdash
mdashmdashmdashmdashmdashmdashmdashmdashmdashmdashmdashmdashmdashmdashmdashmdashmdashmdashmdashmdashmdashmdashmdashmdashmdashmdashmdashmdashmdashmdashmdashmdashmdashmdashmdashmdashmdashmdashmdashmdashmdashmdashmdashmdashmdashmdashndashmdashmdashmdashmdash
16 INTERNATIONAL JOURNAL OF ENGINEERING RESEARCH AND INNOVATION | V11 N1 SPRINGSUMMER 2019
Figure 6 Carriage assembly R-axis
Figure 7 Electrical box layout
The circuitry includes RAMPS 14 controller and a Bea-
glebone connected with a bridge board All of the electrical
components were integrated into the RAMPS 14 controller
Figure 8 shows the wiring diagram for the RAMPS 14 To
adhere to the ldquoaffordablerdquo goal of the OSALS-Polar stepper
motors were used rather than servo motors to facilitate the
movement of the three axes The motion of the axes is ena-
bled by three DQ542MA micro-step drivers Each stepper
driver is controlled by Franklin firmware through a Pololu
A4988 stepper driver carrier mounted on the RAMPS 14
board The steps per revolution and the input current for
each axis motor were set using the DIP switches on the mi-
cro-step drivers The DIP switches were set with 1 3 6 and
8 in the ldquoonrdquo position and 2 4 5 and 7 in the ldquooffrdquo posi-
tion Switches 1 2 and 3 were set to the on off and on
positions respectively to match the motor current
(amperes) of 191 at peak and 136 RMS Switch 4 was set
to the off position so that standstill current would be half of
the selected dynamic current The Micro step resolution was
set to 6400 by setting switches 5 6 7 and 8 to the off on
off and on positions respectively
The RAMPS 14 also controls the extruder assembly
which consists of an extruder motor a hot end to melt the
filament a cooling fan to control the outer temperature of
the hot end and a thermistor to indicate the hot end temper-
ature Figure 8 shows the wiring diagram for RAMPS 14 A
Pololu A4988 stepper driver carrier was also used to control
the extruder motor however for this motor no micro-step
driver was needed The stepper drivers get power from a
36V power supply Power for the extruder motor fan and
the hot end are provided through the RAMPS 14 Since no
heated bed is used in this printer a 12V power supply is
connected to the heated bed port to externally power the
RAMPS 14 and direct that power to the extruder motor hot
end and fan
Figure 8 Ramps 14 wiring diagram
Figure 9 shows how mechanical end stops on each axis
allow the printer to start from a reference point End stops
can be mounted on the maximum or minimum position of
an axis Since the zero for this printer is set at the center of
the rotating table the end stops are located at the maximum
position for the R-axis and Z-axis Thus the end stops are
connected to the pins corresponding to the maximum posi-
tion on the RAMPS 14 board
Carriage Assembly
Circuitry
Stepper Drivers
Power Supply
mdashmdashmdashmdashmdashmdashmdashmdashmdashmdashmdashmdashmdashmdashmdashmdashmdashmdashmdashmdashmdashmdashmdashmdashmdashmdashmdashmdashmdashmdashmdashmdashmdashmdashmdashmdashmdashmdashmdashmdashmdashmdashmdashmdashmdashmdashndashmdashmdashmdashmdash
Figure 9 End stop mounting
The RAMPS 14 circuit board is connected to a Beagle-
bone loaded with the Franklin firmware The OSALS-Polar
can be operated by connecting to the Beaglebone using an
Ethernet cable from any host computer Figure 10 shows
how the Franklin software is accessed through a Web ad-
dress in order to pull up a user interface The printer config-
uration setup is completed on this user interface The vari-
ous attributes of the Franklin firmware are then mapped
with the pins on RAMPS 14 using the pin assignments
shown in Table 1
Figure 11 shows the flow of signals from Beaglebone to
the axis motors and the extruder assembly This figure also
shows a schematic diagram of the various components con-
trolled by the Franklin firmware
Z-axis
R-axis
Theta-axis
Axis Motors Extruder Assembly
R Axis Theta Axis Z Axis
X_STEP_PIN 54 Y_STEP_PIN 60 Z_STEP_PIN 46 E_STEP_PIN 26
X_DIR_PIN 55 Y_DIR_PIN 61 Z_DIR_PIN 48 E_DIR_PIN 28
X_ENABLE_PIN 38 Y_ENABLE_PIN 56 Z_ENABLE_PIN 62 E_ENABLE_PIN 24
X_MIN_PIN 3 Y_MIN_PIN 14 Z_MIN_PIN 18 FAN_PIN 9
X_MAX_PIN 2 Y_MAX_PIN 15 Z_MAX_PIN 19 HEATER_PIN 10
THERMISTOR 13
Table 1 Pin mapping
Figure 10 Franklin software settings
mdashmdashmdashmdashmdashmdashmdashmdashmdashmdashmdashmdashmdashmdashmdashmdashmdashmdashmdashmdashmdashmdashmdashmdashmdashmdashmdashmdashmdashmdashmdashmdashmdashmdashmdashmdashmdashmdashmdashmdashmdashmdashmdashmdashmdashmdashndashmdashmdashmdashmdash
DEVELOPING AN OPEN SOURCE INEXPENSIVE LARGE-SCALE POLAR CONFIGURATION 3D PRINTER 17
mdashmdashmdashmdashmdashmdashmdashmdashmdashmdashmdashmdashmdashmdashmdashmdashmdashmdashmdashmdashmdashmdashmdashmdashmdashmdashmdashmdashmdashmdashmdashmdashmdashmdashmdashmdashmdashmdashmdashmdashmdashmdashmdashmdashmdashmdashndashmdashmdashmdashmdash
mdashmdashmdashmdashmdashmdashmdashmdashmdashmdashmdashmdashmdashmdashmdashmdashmdashmdashmdashmdashmdashmdashmdashmdashmdashmdashmdashmdashmdashmdashmdashmdashmdashmdashmdashmdashmdashmdashmdashmdashmdashmdashmdashmdashmdashmdashndashmdashmdashmdashmdash
18 INTERNATIONAL JOURNAL OF ENGINEERING RESEARCH AND INNOVATION | V11 N1 SPRINGSUMMER 2019
Figure 11 Electrical component diagram
OSALS-Polar Operation Methods
3D printing is carried out by using CAD to output a stereo
lithography (stl) file slicing software (Cura) to generate the
G-code file and Franklin to operate the OSALS-Polar Sie-
mens PLM NX CAD software can be used to insert the for-
mulas and expressions for the parametric modeling intent
(Irwin 2013) and to export it in an stl file format The stl
file is loaded in Cura and prepared for 3D printing Some
overhang parts shallower than 45ordm may require the use of
support material (France 2013) The machine type in Cura
is set to Custom FDM printer with PLA material The poly-
mer filament used can be either polylactic acid (PLA) or
acrylonitrile butadiene styrene (ABS) converting it into a
physical object by depositing it in thin sequential layers
PLA is used in this printer rather than ABS because of its
lower melting temperature and superior adhesion to the
glass substrate The layer height shell thickness fill densi-
ty print speed retraction distance and print temperature are
some of the parameters that are set and calibrated as per the
print material and output quality requirements The slicing
software converts this stl file into consecutive thin layers to
generate G-code (Cano 2015) The commonly used open
source slicing software includes Cura and Slic3r Repetier
The Polar 3D company provides cloud services where the
CAD model can be converted to slices online and then
downloaded to run the code
Franklin is a Web-based 3D control system to regulate the
machining process parameters with any internet-connected
device The main function of this software shown in Figure
12 is to drive the hardware systems by integrating with the
slicer software program (Wijnen Anzalone Haselhuhn
Sanders amp Pearce 2016)
Figure 12 Franklin software
The software aims to be more powerful and user-friendly
by having improved robustness system reliability (error
checking) and a powerful scripted interface to smoothly run
the G-code specifically for the large-scale 3D printing and
sophisticated scientificmedical designs The main commu-
nication interfaces for this software include
1 Web socket connection to the browser or script client
(JSON array)
2 Franklin Server and Franklin Python driver (JSON
array)
3 Franklin Python driver and Franklin C driver (binary
packet)
4 Franklin C driver and Franklin interface (physical
serial line)
Calibrating the printer is important in order to ensure the
accuracy of positioning of the nozzle and distance traveled
along the respective axes Calibration includes choosing the
right amount of current and micro-stepping for the three
axes It is also important to calibrate the absolute zero posi-
tion for the three axes The dip switches on the motor driv-
ers are used to set the amount of current for each motor and
were set to half current for this system Micro-stepping is
decided based on the torque requirements and the necessary
motion accuracy The motor stepper drivers were set to 800
pulses per revolution for the Z-axis and 6400 pulses per
revolution for the Theta- and R-axes Micro-steps are also
set using the dip switches on the stepper motor drivers The
number of revolutions are calculated to enter Franklin soft-
ware based on the 200-step-per-revolution motors Equation
1 was used to calculate the new steps for the R- and Z-axes
(Pearce 2014) For the Theta-axis the distances are re-
placed with the desired and actual angles which can be cali-
brated by the same method
Beaglebone-
Franklin Firmware
RAMPS 14
Stepper Motor
Driver
Extruder
Assembly
Thermistor
Extruder Motor
Hot End
Axes Motors
(R Theta and Z) Cooling Fan
Franklin Software
Franklin Firmware
Handling low-level interface
(Temp control GPIO pins
Stepper motors control) and
communicating with serial
interface
Franklin Server
Web interface by handling
multiple devices
Franklin C Driver
Handling
functions written
in C++
Franklin Python
Driver
mdashmdashmdashmdashmdashmdashmdashmdashmdashmdashmdashmdashmdashmdashmdashmdashmdashmdashmdashmdashmdashmdashmdashmdashmdashmdashmdashmdashmdashmdashmdashmdashmdashmdashmdashmdashmdashmdashmdashmdashmdashmdashmdashmdashmdashmdashndashmdashmdashmdashmdash
Steps in firmware x Desired distance
Actual distance traveled during testing (1)
The Z-axis travel was calculated as 254 mmrev by con-
verting the 0100-inch pitch for the 1rdquo-10-threads-per-inch
acme screw to metric units Finally the Theta-axis travel
has 500 teeth on the internal ring gear and 24 teeth on the
pinion thus from Equation 2 the table rotates 1728 de-
grees per motor revolution
(2)
Finally Table 2 shows that the Franklin software requires
an entry for stepsmm or stepsdegree for each motor based
on the motor stepper driver pulses per revolution The num-
ber of micro-step pulses per revolution are divided by the
travel per revolution for each axis as given by Equation 3
Franklin Coupling setting (stepsmm) =
Micro stepsAxis travel (mmrev or degreesrev) (3)
To finely tune the OSALS-Polar Equation 4 was used to
calculate a calibrated number of steps for the R- and Z-axes
(Pierce 2014) For the Theta-axis the distances were re-
placed with the desired and actual angles which can be cali-
brated by the same method
Calibrated Franklin Coupling setting (stepsmm) =
Original stepsmm in Franklin x Desired distance (4)
Actual distance traveled during testing
Absolute zero was calibrated by first marking the center
on the rotating table Reference positions are set by homing
the machine using the Franklin interface The limit switch
positions in Franklin are changed to specify the distance
between reference points and absolute zero For the R-axis
a fixed end stop was placed on the horizontal arm bracket
and the switch position calibrated to 820 mm in Franklin
Similarly for setting the Z-axis switch position can be cali-
brated by using a paper gage (01 mm thickness) on at least
four equiangular points of the circular base Currently the
Z-axis switch position was set to 96 mm For the Theta-axis
the reference point used was zero The movement accuracy
for the Z- and R-axes were tested by using dial indicators to
validate that the software could manually jog the axis the
desired distances For the theta axis one complete revolu-
tion is measured when the axis is jogged 360ordm When the
OSALS-Polar is successfully calibrated it is ready to create
a 3D-printed part
Results of 3D Printing
By manually jogging the Z- and R-axes in the Franklin
interface measurements taken with a 12-inch travel dial
indicator length gage indicate precision from zero to 1 mm
For the Theta-axis a 360ordm rotation varies within 1ordm indicat-
ed by an alignment mark on the table and stationary frame
Causes for variations in travel of the R- and Theta-axes are
due to the timing belt and gear as well as the ring gear and
pinion interfaces Adjusting the Theta-axis motor too tightly
against the internal ring gear will cause the gear teeth to
bind and stop rotating So the looser fit in the mating of the
gear teeth causes some backlash The R-axis belt having a
9525 mm pitch yields a travel of 17145 mm per motor
revolution so a finer pitch belt will improve the R-axis pre-
cision The Z-axis accuracy is due to the tight connection of
the motor shaft to the acme screw eliminating backlash and
slippage
Figure 13 shows various geometries for testing the
OSALS-Polar which include a cylinder and cuboid Initial
test results for the 50x50x5 mm-high part were unsuccessful
in achieving accurate and smooth surface results The print-
ing time was estimated at 15 minutes which was approxi-
mately the time for the trial test Figures 14 and 15 show the
actual printed part and the top surface which is angled low-
er towards the center of the printing surface This result was
consistent with all sample test prints and was likely caused
by the R-axis planar misalignment with the Theta-axis table
surface The R-axis arm deflected slightly downward as the
extruder mechanism reached the end of its travel at the cen-
ter of the table The deflection of the R-axis arm caused the
extruder nozzle to drag over the surface of the part as the
Theta-axis rotated and the R-axis translated thereby form-
ing a buildup of plastic on the leading edge of the printed
path
te e th r in g g e a rT h e ta -a x is tr a v e l (d e g re e s re v ) = 3 6 0
te e th p in io n
Axis Steps Number of teeth Pitch type Pitch
(inches) Pitch per revolution Micro-steps Actual Steps
r 200 18 Linear 0375 17145 mmrev 6400 3732 mm
theta 200 Pinion 24
Circular - 1728 degreesrev 6400 37037degree Ring Gear 500
z 200 - Acme 01 254 mmrev 800 31496mm
Table 2 Step values set in Franklin
mdashmdashmdashmdashmdashmdashmdashmdashmdashmdashmdashmdashmdashmdashmdashmdashmdashmdashmdashmdashmdashmdashmdashmdashmdashmdashmdashmdashmdashmdashmdashmdashmdashmdashmdashmdashmdashmdashmdashmdashmdashmdashmdashmdashmdashmdashndashmdashmdashmdashmdash
DEVELOPING AN OPEN SOURCE INEXPENSIVE LARGE-SCALE POLAR CONFIGURATION 3D PRINTER 19
mdashmdashmdashmdashmdashmdashmdashmdashmdashmdashmdashmdashmdashmdashmdashmdashmdashmdashmdashmdashmdashmdashmdashmdashmdashmdashmdashmdashmdashmdashmdashmdashmdashmdashmdashmdashmdashmdashmdashmdashmdashmdashmdashmdashmdashmdashndashmdashmdashmdashmdash
mdashmdashmdashmdashmdashmdashmdashmdashmdashmdashmdashmdashmdashmdashmdashmdashmdashmdashmdashmdashmdashmdashmdashmdashmdashmdashmdashmdashmdashmdashmdashmdashmdashmdashmdashmdashmdashmdashmdashmdashmdashmdashmdashmdashmdashmdashndashmdashmdashmdashmdash
20 INTERNATIONAL JOURNAL OF ENGINEERING RESEARCH AND INNOVATION | V11 N1 SPRINGSUMMER 2019
Figure 13 Cura file 50x50x5mm high
Figure 14 Initial test part 50x50x5mm high
Figure 15 Part accuracy
The results of the 50x50x5 mm-high part were difficult to
measure with precise accuracy due to the uneven surface
Unwanted movement of the horizontal arm was reduced by
adding additional screws to secure the vertical axis guide
rods to the mounting rails which improved the stability of
the arm The PLA material spool was removed from the
R-axis extruder assembly to decrease possible deflection of
the arm but this did not significantly improve print quality
The Theta- and R-axes motors need to move simultaneously
for the extruder tool to move in a straight line using conver-
sions performed in the Franklin C driver which sends the
Franklin Firmware a list of numbers of steps to move in
either the positive or negative direction The firmware takes
this list and sends the steps to the motors The reason for the
inaccuracies in the 3D-printed part can be attributed to the
Theta- and R-axes not operating simultaneously at the same
speed The Franklin coupling settings (stepsmm) in Delta-
style 3D printers using the Franklin Firmware have had all
motors for the extruder tool movement set to the same
stepmm value
Using a larger diameter nozzle will alleviate some inaccu-
racies due to the large scale of the OSALS-Polar and re-
duce overall printing time Proper retraction and travel
speed settings in the Cura software will minimize the string-
ing and oozing issues in the part Some of the other issues
that arose during testing included hot-end jamming though
only when the nozzle was too close to the table Adjusting
the Z-axis motor switch settings during the calibration pro-
cess will correct this problem
Conclusions
The advantages of the OSALS-Polar 3D printer include a
large print volume but with a large mechanical device
there are disadvantages in the scaling-up of inaccuracies in
planar and perpendicularity of components The OSALS-
Polar can successfully operate in the R- and Z-axes with
precision with 1 mm accuracy and in the Theta-axis within
1ordm The Franklin software efficiently controls the tempera-
ture of the hot end at the desired 210ordm C within a range of
plusmn2ordm The Franklin software can operate the extruder motor
to feed the 3-mm-diameter PLA material through the hot
end nozzle at the desired rate The G-code generated from
Cura for a cylinder and cuboid test are not producing an
accurate result at this time but all three axes are operating
automatically when the G-code is initiated
The OSALS-Polar is deemed a partial success at this
point due to having accomplished most of the projectrsquos
goals This printer was relatively inexpensive to constructmdash
under $5000 for materials It operates using open source
Franklin software that is continuously being improved The
mdashmdashmdashmdashmdashmdashmdashmdashmdashmdashmdashmdashmdashmdashmdashmdashmdashmdashmdashmdashmdashmdashmdashmdashmdashmdashmdashmdashmdashmdashmdashmdashmdashmdashmdashmdashmdashmdashmdashmdashmdashmdashmdashmdashmdashmdashndashmdashmdashmdashmdash
final testing of the system produced small extruded parts
although the accuracy and scaling up to larger-sized parts
was not accomplished Further work is planned in order to
determine if the inaccuracies in the printed parts are due to
the non-planar R-axis and Theta-axis table The level of the
R-axis arm and the printing surface can be adjusted with
metal shims New conversions may be necessary by the
Franklin C driver to take into account the differences in the
stepsmm Franklin coupling settings for the Theta- and
R-axes motors In the future testing of larger parts may
encounter limitations in the size of prints due to material
cooling at various rates and causing warpage
Acknowledgements
Appreciation for troubleshooting of the Franklin software
for Gerald Anzalone research engineer Michigan Techno-
logical University Also assistance in testing data collec-
tion and troubleshooting of the OSALS-Polar from MS in
Mechanical Engineering students Sachin Rana and Divy
Patel is much appreciated
References
About Polar 3D LLC (2014) Retrieved from https
aboutPolar3dcomprinter
Anderson T (2014) Theta printer A 3D printer with 4
extruders that can move independently and simultane-
ously Retrieved from httpshackadayioproject812-
theta-printer
Barnett E amp Gosselin C (2015) Large-scale 3D printing
with a cable-suspended robot Additive Manufacturing
7 27-44
Berman B (2012) 3-D printing The new industrial revolu-
tion Business Horizons 55(2) 155-162
Cano L M (2015) 3D printing A powerful new curricu-
lum tool for your school library a powerful new cur-
riculum tool for your school library Goleta CA ABC-
CLIO
Deshpande S Rao N Pradhan N amp Irwin J L (2016
November) Hybrid polymer additive manufacturing of
a Darrieus type vertical axis wind turbine design to
improve power generation efficiency Proceedings of
the ASME 2016 International Mechanical Engineering
Congress and Exposition New York ASME
France A K (2013) Make 3D printing The essential
guide to 3D printers Sebastapol CA Maker Media
Inc
Farcas K (2016) R 360 Retrieved from httprepraporg
wikiR_360
Gebler M Uiterkamp A J S amp Visser C (2014) A
global sustainability perspective on 3D printing tech-
nologies Energy Policy 74 158-167
Gibb A (2014) Building open source hardware DIY man-
ufacturing for hackers and makers Carmel IN Pear-
son Education
Horne R amp Hausman K K (2017) 3D printing for dum-
mies New York John Wiley amp Sons
Hoy B (2016) Design and implementation of a three di-
mensional printer using a cylindrical printing process
Retrieved from httpsdigitalcommonscalpolyeducgi
viewcontentcgireferer=httpssearchyahoocom
amphttpsredir=1amparticle=1370ampcontext=eesp
Irwin J (2013) Wind turbine blade CAD models used as
scaffolding technique to teach design engineers Engi-
neering Design Graphics Journal 77(2) 1949-1967
Pearce J M (2014) MOST RepRap build Retrieved from
httpwwwappropediaorg
MOST_RepRap_BuildCalibration
Pradhan N K Irwin J L Siddegowda B R amp Harsha
S (2016) Design and fabrication of the power trans-
mission system of a large scale 3D printer Proceedings
of the Association of Technology Management and
Applied Engineering Conference New York ATMAE
Replicator Warehouse R-360 The most simple and modu-
lar 3D printer (2013) Retrieved from https
wwwkickstartercomprojects2132002936r-360-the-
most-simple-and-modular-3d-printer
Sells E Bailard S Smith Z Bowyer A amp Olliver V
(2010) RepRap the replicating rapid prototyper Max-
imizing customizability by breeding the means of pro-
duction In F T Pillar amp M M Tseng (Eds) Hand-
book of research in mass customization and personali-
zation (pp 568-580) River Edge NJ World Scientific
Steele W (2013) PiMaker 3D printer Retrieved from
httpswwwthingiversecomthing128700
Wijnen B Anzalone G C Haselhuhn A S Sanders P
G amp Pearce J M (2016) Free and open source con-
trol software for 3-D motion and processing Journal of
Open Research Software 4(1) Retrieved from http
dxdoiorg105334jors78 Wittbrodt B T (2014) Development of practical applica-
tions for RepRap style 3-D printers in engineering
(Unpublished doctoral dissertation) Michigan Techno-
logical University Houghton MI
Wittbrodt B T Glover A G Laureto J Anzalone G
C Oppliger D Irwin J L amp Pearce J M (2013)
Life-cycle economic analysis of distributed manufactur-
ing with open source 3-D printers Mechatronics 23(6)
713-726
Wohlers T (2013) Wohlers report 2013 Additive manu-
facturing and 3D printing state of the industrymdashAnnual
worldwide progress report Fort Collins CO Wohlers
Associates
Yusuf B (2015) 3D printers explained Delta Cartesian
Polar Scara Retrieved from httpsall3dpcomknow-
your-fdm-3d-printers-cartesian-delta-Polar-and-scara
mdashmdashmdashmdashmdashmdashmdashmdashmdashmdashmdashmdashmdashmdashmdashmdashmdashmdashmdashmdashmdashmdashmdashmdashmdashmdashmdashmdashmdashmdashmdashmdashmdashmdashmdashmdashmdashmdashmdashmdashmdashmdashmdashmdashmdashmdashndashmdashmdashmdashmdash
DEVELOPING AN OPEN SOURCE INEXPENSIVE LARGE-SCALE POLAR CONFIGURATION 3D PRINTER 21
mdashmdashmdashmdashmdashmdashmdashmdashmdashmdashmdashmdashmdashmdashmdashmdashmdashmdashmdashmdashmdashmdashmdashmdashmdashmdashmdashmdashmdashmdashmdashmdashmdashmdashmdashmdashmdashmdashmdashmdashmdashmdashmdashmdashmdashmdashndashmdashmdashmdashmdash
mdashmdashmdashmdashmdashmdashmdashmdashmdashmdashmdashmdashmdashmdashmdashmdashmdashmdashmdashmdashmdashmdashmdashmdashmdashmdashmdashmdashmdashmdashmdashmdashmdashmdashmdashmdashmdashmdashmdashmdashmdashmdashmdashmdashmdashmdashndashmdashmdashmdashmdash
22 INTERNATIONAL JOURNAL OF ENGINEERING RESEARCH AND INNOVATION | V11 N1 SPRINGSUMMER 2019
Biographies
SOURABH PRASHANT DESHPANDE is a PhD stu-
dent in the Mechanical Engineering Program at the Univer-
sity of Cincinnati with a focus on additive manufacturing
Mr Deshpande may be reached at sourabhdmtuedu
SHRINIVAS KULKARNI is an MS student in the
Mechanical Engineering Program at Michigan Technologi-
cal University with a focus on additive manufacturing Mr
Kulkarni may be reached at skulkar2mtuedu
SID SHAH is an MS student in the Mechanical Engi-
neering Program at Michigan Technological University
with a focus on additive manufacturing Mr Shah may be
reached at ssshah1mtuedu
JOHN IRWIN is a professor of mechanical engineer -
ing technology at Michigan Technological University He
earned his EdD in Curriculum and Instruction in 2005 from
Wayne State University Dr Irwinrsquos research interests in-
clude STEM education CADCAM and CAE residential
wind turbine design and additive manufacturing methods
Dr Irwin may be reached at jlirwinmtuedu
-plate collector was enclosed by double-glazing that admit-
ted solar radiation and minimized convection heat transfer
losses to the environment The shell of the collector was
insulated to reduce conduction losses This system likewise
utilized a coiled copper heat exchanger coil to transfer heat
from the working fluid to an insulated storage tank The
water flow through the receiver was obtained by means of
an off-the-shelf circulation pump As described subsequent-
ly this system was then fully instrumented to measure the
working fluid flow rate and temperatures as well as the
receiver and cover plate temperature in an effort to esti-
mate thermal losses The goal of the present study was to
assess whether a solar water heating system constructed
using relatively inexpensive scavenged components could
exhibit thermal efficiency equivalent to that of a more ex-
pensive vacuum tube solar collector system that is available
for sale
It has been demonstrated (ASHRAE 2015) through the
use of STCs that the combination of effective convection
suppression and selective surface absorption yields im-
proved thermal efficiency at high temperatures Like the
FPC STCs collect both direct and diffuse radiation How-
ever their efficiency is higher at low incidence angles
which gives STC an advantage over FPC in day-long per-
formance Depending on the solar insolation level of the
locality the authors found that working fluid outlet temper-
atures of 80degC to 200degC can be achieved (Made-in-China
nd) Fundamental studies of STC thermal performance
have been reported by Duffie and Beckman (1991) Budi-
hardjo and Morrison (2009) Rittidech and Wannapakne
(2007) and Ma Lu Zhang and Liang (2010) Kim and Seo
(2007) and Shah and Furbo (2004) employed evacuated
tube collectors made from a two-layered glass tube with
circular fins and a U-tube absorber Measured collector
efficiencies were 558 and 60 respectively
The study reported by Tripanagnostopoulos Souliotis
and Nousia (2000) using a flat-plate collector model
achieved a minimum outlet temperature of 50C and had a
collector efficiency of 80 Zelzouli Guizani Sebai and
Kerkeni (2012) concluded that the number of FPCs that can
Abstract
The world runs on the energy generated from the com-
bustion of non-renewable energy sources such as fossil
fuels (coal petrol and diesel) causing an increase in atmos-
pheric pollution Due to recent scientific discoveries the
use of renewable energy sources is made possible economi-
cal and environmentally friendly Specifically solar energy
has the greatest potential of all the worldrsquos renewable ener-
gy sources To absorb the sunrsquos radiation and convert it to
heat solar collectors are needed This preliminary experi-
mental study focused on comparing the thermal perfor-
mance of a commercially marketed solar water heating sys-
tem that featured an evacuated-tube solar collector (STC) to
that of a system that utilized a flat-plate collector (FPC)
constructed using an air conditioning radiator as the collec-
tor The STC system generally exhibited a 14 higher effi-
ciency than the FPC system The FPC system was relatively
inefficient in the absence of direct sunlight whereas the
STC system remained effective even without direct solar
irradiation
Introduction
This investigation experimentally compared the thermal
performance of two solar water-heating systems One sys-
tem employed a commercially available heat pipe evacuated
-tube solar collector (STC) The system utilized a pump to
transfer the heated waterglycol mixture from the receiver
to an insulated storage tank The tank had a built-in copper
heat exchanger coil to transfer heat from the working fluid
to the potable water in the tank thereby preventing the two
fluids from mixing The complete closed-loop system in-
cluded an expansion tank and a control unit containing the
circulation pump pressure gauge tempering valve pressure
relief valve and flow meter The other system considered in
this study used a repurposed air conditioner radiator as a
flat-plate collector (FPC) It consisted of an array of serpen-
tine tubes through which water was circulated The pres-
ence of high-density corrugated fins attached to the tubes
increased the absorption of incident solar radiation The flat
mdashmdashmdashmdashmdashmdashmdashmdashmdashmdashmdashmdashmdashmdashmdashmdashmdashmdashmdashmdashmdashmdashmdashmdashmdashmdashmdashmdashmdashmdashmdashmdashmdashmdashmdashmdashmdashmdashmdashmdashmdashmdashmdashmdashmdashmdashndashmdashmdashmdashmdash
SV Vishnu Samudrala Zimmer Biomet Ahmed ElSawy Tennessee Technological University
Mohan Rao Tennessee Technological University Stephen Idem Tennessee Technological University
A COMPARATIVE STUDY OF THE THERMAL
EFFICIENCY OF SOLAR VACUUM-TUBE VERSUS
FLAT-PLATE COLLECTORS FOR WATER
HEATING SYSTEMS
mdashmdashmdashmdashmdashmdashmdashmdashmdashmdashmdashmdashmdashmdashmdashmdashmdashmdashmdashmdashmdashmdashmdashmdashmdashmdashmdashmdashmdashmdashmdashmdashmdashmdashmdashmdashmdashmdashmdashmdashmdashmdashmdashmdashmdashmdashmdashmdashmdashmdash
INTERNATIONAL JOURNAL OF ENGINEERING RESEARCH AND INNOVATION | V11 N1 SPRINGSUMMER 2019 23
mdashmdashmdashmdashmdashmdashmdashmdashmdashmdashmdashmdashmdashmdashmdashmdashmdashmdashmdashmdashmdashmdashmdashmdashmdashmdashmdashmdashmdashmdashmdashmdashmdashmdashmdashmdashmdashmdashmdashmdashmdashmdashmdashmdashmdashmdashndashmdashmdashmdashmdash
mdashmdashmdashmdashmdashmdashmdashmdashmdashmdashmdashmdashmdashmdashmdashmdashmdashmdashmdashmdashmdashmdashmdashmdashmdashmdashmdashmdashmdashmdashmdashmdashmdashmdashmdashmdashmdashmdashmdashmdashmdashmdashmdashmdashmdashmdashndashmdashmdashmdashmdash
24 INTERNATIONAL JOURNAL OF ENGINEERING RESEARCH AND INNOVATION | V11 N1 SPRINGSUMMER 2019
be connected in series is limited When collectors are con-
nected in series the outlet temperature of each collector
will increase when compared to parallel or series-parallel
connected collectors and this leads to an increase in ther-
mal losses due to increased temperature differences
Jouhari Touhmeh and Moukhayber (2015) demonstrated
that by combining both flat-plate and evacuated-tube collec-
tors the thermal performance of the compound collector
was improved Ben Slama (2012) conducted experiments
on an integrated flat-plateevacuated-tube collector and
found that the efficiency of double glazing was 42
whereas with single glazing the efficiency was 30
Shukla Sumathy Erickson and Goung (2013) summarized
the current state-of-the-art concerning system components
of solar water heaters such as the collector storage tank
and heat exchanger and likewise discussed various ap-
proaches to improving performance and cost effectiveness
of solar water heaters The FPC is usually permanently
fixed in position and does not require any tracking of the
sun The collectors should be placed directly towards the
equator facing due south in the northern hemisphere The
ideal tilt angle of the collector is equal to the latitude of the
location with angle variations of 10-15degC depending on
the application According to the test results of Duffie and
Beckman (1991) they are capable of producing tempera-
tures up to 100degC above the ambient temperature FPCs are
the most common type of collectors used in solar water
heating systems in Africa supplying hot water in hotels
hospitals and to wealthier households (Karaekezi amp Ranga
1997)
Experimental Setup
The STC utilized in this current study was a commercial-
ly available Duda Energy (model SC5815) solar collector
(Duda nd) It consisted of 15 parallel transparent glass
tubes supported on a frame and connected to a header pipe
In each instance the evacuated tube outer diameter was
58 mm (228 in) and the overall length was 180m
(709 in) The tubes were evenly spaced on the frame such
that the overall footprint of the STC was 2050 mm 1145
mm (807 in 467 in) complete details are provided in
Duda (nd) and Samudrala (2016) The STC was mounted
on the roof of a building with a pitch of approximately 28
and was oriented due south Reflective insulation was
placed beneath the STC to minimize losses and to enhance
the solar energy incident on the backside of the tube array
The flexible steel pipes leading tofrom the STC were
wrapped with standard 6-mm-thick (025 in) foam insula-
tion Each individual collector tube consisted of two con-
centric glass tubes The annulus between the tubes was
evacuated to minimize convection heat loss to the environ-
ment The tubes were constructed using borosilicate or soda
lime glass which is resistant to high temperatures and has a
high transmittance for solar irradiation A flat or curved
aluminum or copper fin was attached to a metal heat pipe
running through the inner tube The inner glass tube and fin
was covered with a selective coating that maximizes ab-
sorption of solar energy
The hollow copper heat pipe within the tube contained a
small volume of a low-pressure alcoholwater liquid as
well as some additional additives to prevent corrosion or
oxidation This partial vacuum enabled the liquid to vapor-
ize at a prescribed temperature which is lower than would
be possible at atmospheric pressure When solar radiation
was incident on the surface of the heat pipe the liquid in the
heat pipe was vaporized due to the absorption of heat
Therein the increased vapor pressure drove the hot vapor to
the top portion of the heat pipe which consisted of a ldquohot
bulbrdquo inserted through a copper well located within a con-
necting manifold A waterglycol mixture flowed through
the manifold and heat was transferred to the working fluid
as it flowed past the hot bulb condensers in the manifold
As the hot vapor in the heat pipe lost energy it cooled and
subsequently condensed Then it flowed back down the heat
pipe through a wickporous mesh by a combination of grav-
ity and capillary action This cyclic process of alternating
evaporation and condensation of the liquid within the sealed
heat pipe continued as long as radiant energy was incident
upon the vacuum tubes Per Tripanagnostopoulos et al
(2000) a depiction of the STC closed-loop solar water heat-
ing system is provided in Figure 1
Figure 1 STC solar water heating system Printed with
permission
mdashmdashmdashmdashmdashmdashmdashmdashmdashmdashmdashmdashmdashmdashmdashmdashmdashmdashmdashmdashmdashmdashmdashmdashmdashmdashmdashmdashmdashmdashmdashmdashmdashmdashmdashmdashmdashmdashmdashmdashmdashmdashmdashmdashmdashmdashndashmdashmdashmdashmdash
The working station supplied with the STC system in-
cluded an integrated flow meter with a digital display Like-
wise the working station contained a flow controller and
pressure relief valve The water storage tank used in con-
junction with the STC system consisted of two concentric
tanks one larger and one smaller The annular gap between
the tanks was filled with mineral wool to reduce heat loss
Copper-constantan thermocouples were mounted at the inlet
and outlet of the STC header to record the waterglycol
temperatures The ambient temperature and solar insolation
data were downloaded directly from a local weather station
Further details regarding this aspect of the current study are
available in the study by Samudrala (2016)
The FPC considered in this current study (Chittireddy
2017 Chittireddy ElSawy amp Idem 2018) was fully instru-
mented to measure such variables as water flow rate and
temperature rise solar insolation and receiver and cover
plate temperatures Figure 2 shows a photograph of the ap-
paratus Throughout the experiments the flat-plate receiver
was positioned to face directly south and was inclined at an
angle so that solar insolation was directed normally onto the
apparatus This orientation was maintained throughout the
duration of the experiments Major components of the FPC
solar collector system considered in this study were
1 The receiver plate (a repurposed air conditioner radi-
ator)
2 A water storage tank
3 The casing for the collector and insulation on the
bottom to reduce heat loss
4 Two layers of glazing cover
5 A linear actuator to control the inclination of the col-
lector
6 A water-circulating pump
Figure 2 FPC solar water heating system Printed with
permission
Other components of the FPC system included calibrated
temperature sensors a water mass flow-rate sensor and a
data acquisition system An air conditioner radiator was
selected as the receiver plate The radiator coil consisted of
a single continuous serpentine tube configured in three rows
by means of headers Each row of the radiator had 22
straight finned-tube sections that were parallel to one anoth-
er and were arranged in a single plane The thickness of the
fins was 025 mm and there were 591 continuous plate fins
per meter The cross-sectional area of the receiver plate was
073m 056m The material of the tubes was copper and
the fins were constructed from aluminum These fins were
coated with black paint to increase solar heat absorptivity
Two acrylic sheets were employed as glazing for the FPC
Plexiglas was used because it has a transmittance closely
equivalent to optical glass The total light transmittance of
Plexiglas is 92 and the emissivity is 086 (Chittireddy
et al 2018) Radiation losses from the glass cover were
reduced since it is transparent to the short-wave radiation
emitted by the sun and is nearly opaque to long-wave ther-
mal radiation emitted by the absorber plate
In this experiment double parallel glazing was used
Each glazing had a thickness of 6 mm The distance be-
tween the two cover plates was 19 mm and distance be-
tween the absorber plate and the lower cover plate was
36 mm Eleven copper-constantan thermocouples were used
to measure the temperature at prescribed locations on the
receiver and cover plates as well as the inlet and water tem-
peratures Three thermocouples were mounted to the upper
cover plate three were attached to the lower cover plate
and three thermocouples were affixed to the receiver plate
and the resulting values were averaged Two thermocouples
were used to measure the inlet and outlet temperatures of
the receiver plate by inserting them directly into the 13-mm
-diameter steel pipes leading tofrom the copper pipes in the
radiator Prior to installation in the solar water heater each
temperature sensor was calibrated using a reference immer-
sion thermometer
Water flow was measured using a calibrated flow sensor
The flow sensor required a voltage input of 5-18VDC
(supplied by the data acquisition system) It was capable of
measuring flow rates from 1 to 30 Lmin over a temperature
range of -25ordmC to +80ordmC The water flow sensor was in-
stalled in a 15m-long pipe which was between the outlet of
the collector and the storage tank A sufficient length of
pipe was employed upstream of the flow sensor to ensure
that the entering flow was fully developed The casing re-
ceiver plate and water storage tank used with the FPC were
mounted on a moving trolley The data acquisition system
was placed on another moving trolley Each time an experi-
ment was performed the experimental setup mounted on
mdashmdashmdashmdashmdashmdashmdashmdashmdashmdashmdashmdashmdashmdashmdashmdashmdashmdashmdashmdashmdashmdashmdashmdashmdashmdashmdashmdashmdashmdashmdashmdashmdashmdashmdashmdashmdashmdashmdashmdashmdashmdashmdashmdashmdashmdashndashmdashmdashmdashmdash
A COMPARATIVE STUDY OF THE THERMAL EFFICIENCY OF SOLAR VACUUM-TUBE VERSUS FLAT-PLATE COLLECTORS 25
FOR WATER HEATING SYSTEMS
Actuator
Insulated water tank
Solar collector
mdashmdashmdashmdashmdashmdashmdashmdashmdashmdashmdashmdashmdashmdashmdashmdashmdashmdashmdashmdashmdashmdashmdashmdashmdashmdashmdashmdashmdashmdashmdashmdashmdashmdashmdashmdashmdashmdashmdashmdashmdashmdashmdashmdashmdashmdashndashmdashmdashmdashmdash
mdashmdashmdashmdashmdashmdashmdashmdashmdashmdashmdashmdashmdashmdashmdashmdashmdashmdashmdashmdashmdashmdashmdashmdashmdashmdashmdashmdashmdashmdashmdashmdashmdashmdashmdashmdashmdashmdashmdashmdashmdashmdashmdashmdashmdashmdashndashmdashmdashmdashmdash
26 INTERNATIONAL JOURNAL OF ENGINEERING RESEARCH AND INNOVATION | V11 N1 SPRINGSUMMER 2019
the trolleys was moved out into an open area to receive so-
lar radiation In every instance the solar water heater was
manually positioned facing south during the acquisition of
performance data Once the setup was initially positioned
the setup was not further adjusted (ie solar tracking was
not employed while measurements were being performed)
The casing was placed on horizontal bars capable of mov-
ing vertically The horizontal bar was connected to a
12VDC linear actuator to raise the casing vertically and to
align the receiverrsquos placement so that it was perpendicular
to the solar irradiation at the start of the experiments The
storage tank was placed under the casing and a 12VDC cir-
culating pump was connected to circulate the heat transfer
fluid through the solar collector
The solar thermal systems utilized solar collectors located
remotely from the storage tank Both systems used a pump
to circulate a waterpropylene glycol mixture between the
storage tank and the collector in a continuous loop and back
again to the storage tank In each instance a copper heat
exchanger coil located in the insulated storage tank was
used to transfer heat acquired by the collectors from work-
ing fluid to the potable water present in the tank without
mixing the fluids together In general this is advantageous
since the storage tanks can be placed indoors reducing heat
loss in winter months In addition backup heating systems
may be installed in the storage tanks to supply enough heat
to meet the demands of the user in case of cloudy or rainy
weather Furthermore this permits placing the tank close to
where the water will be used thereby reducing the time
needed for hot water to flow from the tap
Data Acquisition and Reduction
A Raspberry Pi system was used to connect all of the
temperature sensors for data acquisition The Raspberry Pi
is a low-cost credit card-sized computer that plugs into a
computer monitor or TV and uses a standard keyboard and
mouse A simple Python code was used to configure the
temperature sensors The data were collected and exported
to a csv file for further analysis An open source computer
hardware and software system was used to acquire the data
from each of the experimental setups The performance of a
solar water heater was characterized by how efficiently it
could convert the energy of incident solar energy to a corre-
sponding increase in the temperature of a circulating hot
waterglycol mixture The thermal efficiency of each collec-
tor considered in the present study was calculated using
Equation 1
(1)
where
ṁ = Mass flow rate in kgsec
Cp = Specific heat capacity in Jkg-K
Ac = Collector area in m2
Gt = Global solar radiation on the collector in Wm2
To = Collector outlet temperature in K
Ti = Collector inlet temperature in K
In this instance ṁ refers to the measured waterglycol
mass flow rate through the system and To and Ti are the
temperatures recorded at the collator inlet and outlet re-
spectively The quantity Gt is the measured solar radiation
incident upon the collectors as measured by the local
weather station Likewise AC denotes the effective cross
section of each collector and CP indicates the average
working fluid specific heat
Results
The testing of the STC and FPC solar water heating sys-
tems was performed under different ambient seasonal tem-
peratures Various weather conditionsmdashcloudy rainy and
sunnymdashwere encountered throughout the test program The
measurements were conducted approximately five hours a
day and were initiated around noon when the sun was at its
highest elevation The data were acquired every 13 seconds
throughout the test cycle Figure 3 illustrates the perfor-
mance of the STC system on different days subject to dis-
parate ambient temperatures and levels of solar insolation
in terms of the measured outlet waterglycol temperatures
At noon (peak incident solar radiation) the collector effi-
ciency calculated by means of Equation 1 for cold weather
conditions was 698 At that time the global solar radia-
tion was found to be 812 Wattm2 The useful energy col-
lected was 1136 kJday By comparison measurements
conducted later in the season under warm conditions yield-
ed a calculated collector efficiency at noon of 815 when
the measured global solar irradiation was found to be
842 Wattm2 The energy collected in the STC system was
determined to be 1401 kJday Under similar conditions of
ambient temperature and incident radiation intensity STC
systems exhibited approximately 14 higher efficiency
than the FPC system
Figure 4 shows a comparison of the thermal performance
of the STC and the FPC solar water heating systems consid-
ered in this study on the same day Both systems were
charged with a similar waterglycol mixture In this in-
stance the initial ambient temperature was 71F At the
start of the experiments the measured waterglycol temper-
ature stored in the insulated tank in the STC apparatus was
79F whereas the corresponding initial waterglycol tem-
perature for the FPC system was 98F At the end of experi-
p o i
c
c t
m C T T η
A G
mdashmdashmdashmdashmdashmdashmdashmdashmdashmdashmdashmdashmdashmdashmdashmdashmdashmdashmdashmdashmdashmdashmdashmdashmdashmdashmdashmdashmdashmdashmdashmdashmdashmdashmdashmdashmdashmdashmdashmdashmdashmdashmdashmdashmdashmdashndashmdashmdashmdashmdash
ment the solar vacuum tube collector waterglycol tempera-
ture reached 147F This temperature was similar to that of
the flat-plate collector both systems yielded the same outlet
temperature over the duration of the experiments but the
STC temperature rose to its final value more quickly Since
the ambient temperature was warm the collectors per-
formed similarly
Figure 3 STC performance comparison in cold and warm
weather
Figure 4 Daily performance comparison of STC and FPC solar
water heating systems in warm weather
Figure 5 provides an additional comparison of the STC
and FPC solar water heating systems At the start of the
experiments the ambient temperature was 86F In this
case the initial waterglycol temperature for the STC sys-
tem was also 86F However at the start of the measure-
ments the working fluid temperature in the FPC system
was 80F Upon the completion of the tests the final water
glycol temperature recorded leaving the STC system was
134F and the equivalent temperature for the FPC was
130F In this instance the STC system yielded a higher
final temperature but for both systems the rate of tempera-
ture increase was almost identical The calculated collector
efficiency of the STC system at noon was determined to be
887 when the incident solar radiation was 904 Wm2
That corresponded to a useful daily energy collection for
the STC system of 1636 kJday
Figure 5 Daily performance comparison of STC and FPC solar
water heating systems in hot weather
Conclusions
This preliminary study compared the thermal perfor-
mance of a commercially marketed solar water heating sys-
tem that featured an evacuated-tube solar collector to that of
a system that utilized a flat-plate collector constructed using
an air conditioning radiator as the collector Although an
extensive side-by-side comparison of the thermal efficiency
of the two systems proved to be impractical the STC sys-
tem generally exhibited a 14 higher efficiency than the
FPC system It should be pointed out that the water heater
systems considered in this study employed different water
glycol mixture flow rates and had unequal cross sections
Likewise the same inclination angle of each collector was
not consistent and each system utilized different storage
tanks that were not equally insulated Collectively these
differences between the two solar heating systems make it
difficult to definitively compare the two approaches in
terms of thermal efficiency
While flat-plate collectors are widely used in solar water
heating applications they are inefficient in the absence of
direct sunlight By comparison STC systems are relatively
more effective even without direct solar irradiation The
simple flat-plate collector considered in this study was as-
sembled using readily available spare components It was
designed to work in sunny and warm climates However
the benefit of using the FPC system was reduced when
there were cloudy rainy or windy weather conditions So-
lar water heating systems that employ evacuated-tube col-
mdashmdashmdashmdashmdashmdashmdashmdashmdashmdashmdashmdashmdashmdashmdashmdashmdashmdashmdashmdashmdashmdashmdashmdashmdashmdashmdashmdashmdashmdashmdashmdashmdashmdashmdashmdashmdashmdashmdashmdashmdashmdashmdashmdashmdashmdashndashmdashmdashmdashmdash
A COMPARATIVE STUDY OF THE THERMAL EFFICIENCY OF SOLAR VACUUM-TUBE VERSUS FLAT-PLATE COLLECTORS 27
FOR WATER HEATING SYSTEMS
mdashmdashmdashmdashmdashmdashmdashmdashmdashmdashmdashmdashmdashmdashmdashmdashmdashmdashmdashmdashmdashmdashmdashmdashmdashmdashmdashmdashmdashmdashmdashmdashmdashmdashmdashmdashmdashmdashmdashmdashmdashmdashmdashmdashmdashmdashndashmdashmdashmdashmdash
mdashmdashmdashmdashmdashmdashmdashmdashmdashmdashmdashmdashmdashmdashmdashmdashmdashmdashmdashmdashmdashmdashmdashmdashmdashmdashmdashmdashmdashmdashmdashmdashmdashmdashmdashmdashmdashmdashmdashmdashmdashmdashmdashmdashmdashmdashndashmdashmdashmdashmdash
28 INTERNATIONAL JOURNAL OF ENGINEERING RESEARCH AND INNOVATION | V11 N1 SPRINGSUMMER 2019
lectors similar to those employed in the present study may
be more energy efficient than the flat-plate collectors due
to their unique construction Since the concentric coated-
glass tubes are vacuum-sealed heat loss associated with
convection heat transfer is reduced to a great extent Alt-
hough the STC system was deemed more thermally effi-
cient it was far more expensive than the FPC system How-
ever a detailed analysis of the relative initial and annual
operating costs of the two systems was beyond the scope of
the present study
References
ASHRAE (2015) Handbook HVAC applications Atlanta
ASHRAE
Ben Slama R (2012) Experimentation of a plane solar
integrated collector storage water heater Energy and
Power Engineering 4(2) 67-76
Budihardjo I amp Morrison G L (2009) Performance of
water-in-glass evacuated tube solar water heaters
Solar Energy 83(1) 49-56
Chittireddy V R (2017) A study of flat plate solar
collector with air conditioner radiator as absorber
plate (Masterrsquos thesis) Retrieved from ProQuest
Dissertations and Theses Database (UMI No
10246377)
Chittireddy V R ElSawy A amp Idem S (2018) Study of
a flat plate solar collector with an air conditioner
radiator as a heat absorber for a domestic water
heater Paper presented at the International Conference
on Renewable Energies and Power Quality doi https
doiorg1024084repqj16205
Duda diesel (nd) Retrieved from https
wwwdudadieselcom
Duffie J A amp Beckman W A (1991) Solar engineering
of thermal processes 2nd ed New York Wiley-
Interscience
Jouhari M Touhmeh S amp Moukhayber N (2015)
Manufacturing and thermal performance test of
(compound) solar collector in Damascus City Journal
of Biomedical Science and Engineering 8(6) 370-379
Karaekezi S amp Ranga T (1997) Renewable energy
technologies in Africa London Zed Book Ltd
Kim Y amp Seo T (2007) Thermal performances
comparisons of the glass solar vacuum tube solar
collectors with shapes of absorber tube Renewable
Energy 32(5) 772-795
Ma L Lu Z Zhang J amp Liang R (2010) Thermal
performance analysis of the glass Solar Vacuum tube
collector with U-tube Building and Environment 45
(9) 1959-1967
Made-in-China (nd) Retrieved from httpswwwmade-in
-chinacom
Rittidech S amp Wannapakne S (2007) Experimental
study of the performance of a solar collector by closed-
end oscillating heat pipe (CEoHP) Applied Thermal
Engineering 27 1978-1985
Samudrala S V Vishnu (2016) A comparative study on
the thermal efficiency of solar vacuum-tube vs flat-
plate collectors for water heating systems (Masterrsquos
thesis) Retrieved from ProQuest Dissertations and
Theses Database (UMI No 10243376)
Shah L J amp Furbo S (2004) Vertical evacuated tubular-
collectors utilizing solar radiation from all directions
Applied Energy 78(4) 371-395
Shukla R Sumathy K Erickson P amp Goung J (2013)
Recent advances in the solar water heating systems A
review Renewable and Sustainable Energy Reviews
19 173-190
Tripanagnostopoulos Y Souliotis M amp Nousia T
(2000) Solar collectors with colored absorbers Solar
Energy 68(4) 343-356
Zelzouli K Guizani A Sebai R amp Kerkeni C (2012)
Solar thermal systems performances versus flat plate
solar collectors connected in series Engineering 4(12)
881-893
Biographies
VENKAT VISHNU DEEPAK SAMUDRALA is a
manufacturing engineer at Zimmer Biomet and holds an
MS degree from Tennessee Technological University
(2016) in mechanical engineering He was born in Hydera-
bad India and holds a BS degree from SCSVMV Universi-
ty India (2010) in mechanical engineering While pursuing
his BS degree he developed a profound interest in energy
systems which inspired him to work on solar water heating
systems as his masterrsquos thesis Currently he lives in Mem-
phis Tennessee and is working on a continuous improve-
ment project focused on reducing product manufacturing
time Mr Samudrala may be reached at
ssamudral42studentstntechedu
AHMED ELSAWY joined Tennessee Technological
University as a professor and chairperson in the Department
of Manufacturing and Engineering Technology in July
1999 Prior to joining TTU he was a professor and graduate
program coordinator in the Department of Industrial Tech-
nology at the University of Northern Iowa the founding
director of the Manufacturing Engineering Program at St
Cloud State University in Minnesota and a full professor at
the Department of Mechanical Design and Production Engi-
neering at Cairo University His teaching and research inter-
ests include material processing metallurgy and manufac-
turing systems recycling and reuse of solid waste materials
renewable energy and sustainability Dr Elsawy advised
mdashmdashmdashmdashmdashmdashmdashmdashmdashmdashmdashmdashmdashmdashmdashmdashmdashmdashmdashmdashmdashmdashmdashmdashmdashmdashmdashmdashmdashmdashmdashmdashmdashmdashmdashmdashmdashmdashmdashmdashmdashmdashmdashmdashmdashmdashndashmdashmdashmdashmdash
several masterrsquos and doctoral students who hold academic
and industrial positions in the USA Germany and Taiwan
Dr Elsawy may be reached at aelsawytntechedu
MOHAN D RAO is a professor and chair of Mechan-
ical Engineering at Tennessee Technological University
Previously he was a professor of Mechanical Engineering
at Michigan Tech Dr Rao is a fellow of ASME and SAE
He has conducted research in different areas of automotive
body and powertrain dynamics acoustics and vibration
over a span of 30 years He has over 100 publications in
technical journals and conference proceedings He has ad-
vised 9 PhD and 35 MS students Dr Rao has received a
US Fulbright award National Science Foundation Research
Initiation award and was honored by the NASA Marshall
Space Flight Center for his work on the damping of the
Hubble Space Telescope truss system Dr Rao may be
reached at mraotntechedu
STEPHEN IDEM is a professor in the Depar tment of
Mechanical Engineering at Tennessee Tech University He
received his PhD in mechanical engineering from Purdue
University He has more than 30 years of experience in the
areas of scale model testing fluid flow measurement and
thermal modeling Currently he is engaged in projects to
measure airflow and pressure loss characteristics of residen-
tial HVAC duct systems He has created a numerical model
of downdraft evaporative cooling tower performance which
is being verified experimentally He has extensive experi-
ence performing flow and pressure measurements on scale
models of primary and secondary air supply ducts wind
boxes and exhaust stacks of coal-fired power plants to im-
prove their thermal performance He has developed an
online cleanliness factor model of the convection passes in
coal-fired power plants He has likewise created numerical
models of transient heat exchanger performance Dr Idem
may be reached at sidemtntechedu
mdashmdashmdashmdashmdashmdashmdashmdashmdashmdashmdashmdashmdashmdashmdashmdashmdashmdashmdashmdashmdashmdashmdashmdashmdashmdashmdashmdashmdashmdashmdashmdashmdashmdashmdashmdashmdashmdashmdashmdashmdashmdashmdashmdashmdashmdashndashmdashmdashmdashmdash
A COMPARATIVE STUDY OF THE THERMAL EFFICIENCY OF SOLAR VACUUM-TUBE VERSUS FLAT-PLATE COLLECTORS 29
FOR WATER HEATING SYSTEMS
ra 1992) dimension reduction and noise removal
(Sheybani 2011) and senior design (Garcia-Otero amp Shey-
bani 2011)
RF engineers specialize in creating various devices that
operate within the radio frequency spectrum Some of the
devices they work with include antennas radios WiFi and
mobile phones In this current study the RF engineer was in
the process of developing an antenna for a NASA project
called EcoSAR a radar tool designed to help scientists bet-
ter understand the carbon cycle by measuring biomass for-
est height density and extent This project was designed to
help him by creating a GUI that could import analyze and
export data
Technical Details
A GUI is a type of computer-human interface on a com-
puter It solves the blank screen problem that confronted
early computer users (Norman 1988) A computer-human
interface is a ldquomeans by which people and computers com-
municate with each otherrdquo (Interface 2019) GUI binds the
user of the computer system to the operation and potential
of the computer system More specifically a GUI is a speci-
fication for the look and feel of the computer sys-
tem (Bonsiepe 1989) GUIs usually have common charac-
teristics such as windows icons menus and pushbuttons
(WIMP) Collectively WIMPs are pictures that bring forth
a certain action or action space The user issues commands
via the GUI to computer applications GUIs usually have
three major components (Hayes amp Baran 1989) a window-
ing system an imaging model and an application program
interface (API) The windowing system builds the windows
menus and dialog boxes that appear on the screen The im-
aging model defines the fonts and graphics that appear on
the screen WIMPs are products of both the windowing sys-
tem and imaging model Finally the API is the means by
which the user specifies how and what windows and
graphics appear on the screen
The proposed GUI consists of the following platforms
data input selection menu scientific computation and re-
sults display The scientific computations include file type
conversion S-parameter polar-rectangular conversion
Smith chart and graphsplots The GUI was designed in
MATLAB and as a result MATLAB libraries were used
for parts of the design and development of the GUI
Abstract
In this paper the authors describe the requirements and
features necessary to develop a GUI for RF airborne space-
craft and satellite communications The proposed GUI is
responsive to the variety of devices and tools an RF engi-
neer would need to accomplish everyday tasks This in-
cludes but is not limited to Smith charts polar plots Bode
diagrams and different types of data files associated with
these graphs or charts The GUI was designed and devel-
oped in MATLAB with Adobe Photoshop used to create a
custom background The user interface was fully tested and
validated for functionality and ability to import plot and
export data for Smith charts polar plots and Bode dia-
grams The GUI also has a toolbar file browser with picture
display custom background and a static textbox that dis-
plays the plotted data
Introduction
Following are the details of the steps that were taken in
order to apply signal processing and data analytics algo-
rithms in the design of a graphical user interface (GUI) for
satellite and RF communications Users may follow these
steps with the specified set of hardware and software to get
the same configuration on the proper RF communications
and device design These projects were implemented under
the supervision of NASA scientists and faculty advisors in
dedicated NASA labs Using lessons learned in this study
and the authorsrsquo previous experience in data visualization
and signal processing research and training relevant labs
were designed to enhance the Computer Engineering pro-
gram at the Virginia State University (VSU) The classes
and labs covered a variety of topics including computer
simulations and networking (Javidi amp Sheybani 2008)
(Sheybani amp Javidi 2007) visualization and virtual labs
(Sheybani amp Javidi 2006) image processing (Sheybani
Garcia-Otero Adnani amp Javidi 2012) game design
(Ouyang Yang Franklin Michaelson Morge et al 2010)
STEM education (Javidi amp Sheybani 2008) (Javidi amp
Sheybani 2010) spike removal (Sheybani Mengshoel amp
Poll 2010) feature detection (Varde Rundensteiner Javidi
Sheybani amp Liang 2007) wireless communications (Hardy
Javidi Denton Campbell amp Sheybani 2007) (Badombena-
Wanta amp Sheybani 2010) network architecture (Sheybani
amp Sankar 2002) optical communications (Sheybani amp Aro-
mdashmdashmdashmdashmdashmdashmdashmdashmdashmdashmdashmdashmdashmdashmdashmdashmdashmdashmdashmdashmdashmdashmdashmdashmdashmdashmdashmdashmdashmdashmdashmdashmdashmdashmdashmdashmdashmdashmdashmdashmdashmdashmdashmdashmdashmdashndashmdashmdashmdashmdash Ehsan Sheybani University of South Florida Giti Javidi University of South Florida
DESIGN AND DEVELOPMENT OF A GUI
FOR RF COMMUNICATIONS
mdashmdashmdashmdashmdashmdashmdashmdashmdashmdashmdashmdashmdashmdashmdashmdashmdashmdashmdashmdashmdashmdashmdashmdashmdashmdashmdashmdashmdashmdashmdashmdashmdashmdashmdashmdashmdashmdashmdashmdashmdashmdashmdashmdashmdashmdashndashmdashmdashmdashmdash
30 INTERNATIONAL JOURNAL OF ENGINEERING RESEARCH AND INNOVATION | V11 N1 SPRINGSUMMER 2019
mdashmdashmdashmdashmdashmdashmdashmdashmdashmdashmdashmdashmdashmdashmdashmdashmdashmdashmdashmdashmdashmdashmdashmdashmdashmdashmdashmdashmdashmdashmdashmdashmdashmdashmdashmdashmdashmdashmdashmdashmdashmdashmdashmdashmdashmdashndashmdashmdashmdashmdash
The GUI is capable of importing three main data types
(CSV) (DAT) and (SNP) files CSV stands for a ldquocomma
separated valuerdquo This is a plain text file that separates each
form of data with a comma Figure 1 shows how CSV files
can be written in either Notepad or Excel and when used
properly they can import and export data from Excel to
MATLAB and vice versa
Figure 1 A CSV file written in Notepad
DAT files are primarily associated with ldquodatardquo They can
be used to store various types of data such as text graphics
attachments in emails and general binary code In most
instances it is best to open a DAT file with the program that
created it Users can also open a DAT file with an editor
such as Notepad to view the contents inside However it is
not guaranteed that all of the contents of the file will be
readable when using an editor to open it SNP files which
are also known as touchtone files have five different file
types (S1P) (S2P) (S3P) (S4P) and (SNP) The differ-
ences between these file types are the number of ports pre-
sent (see Table 1)
Table 1 The number of ports and S-parameters associated with
each file type
The ldquoSrdquo in S-parameters stands for scattering Figure 2
shows examples of how S-parameters come in matrices with
the number of rows and columns equal to the number of
ports These S-matrices allow users to describe complicated
networks as ldquoblack boxesrdquo (Zhou amp Chen 2008)
S-parameters are considered complex because both phase
and magnitude change the network However most micro-
wave and RF engineers are only concerned with the magni-
tude These engineers use S-parameters to refer to the RF
ldquovoltage out vs voltage inrdquo
Figure 2 S-parameter matrices
(S11) Refers to the reflection on port 1 as an inci-
dence of port 1
(S12) Refers to the reflection on port 1 as an inci-
dence of port 2
(S22) Refers to the reflection on port 2 as an inci-
dence of port 2
(S21) Refers to the reflection on port 2 as an inci-
dence of port 1
Since three-port measurements are extremely difficult to
obtain accurately the authors chose to focus only on one-
and two-port systems However the aforementioned meth-
odology would continue for all of the S-parameters present
These data formats are all associated with specific graphs
Figure 3 shows that the first graph the Bode diagram con-
sists of both phase and magnitude plots The magnitude plot
expresses the magnitude of the frequency response gain
either linearly or in decibels The phase plot expresses the
frequency response phase shift in either degrees or radians
(Zhou amp Chen 2008)
Figure 3 A Bode diagram
mdashmdashmdashmdashmdashmdashmdashmdashmdashmdashmdashmdashmdashmdashmdashmdashmdashmdashmdashmdashmdashmdashmdashmdashmdashmdashmdashmdashmdashmdashmdashmdashmdashmdashmdashmdashmdashmdashmdashmdashmdashmdashmdashmdashmdashmdashndashmdashmdashmdashmdash
DESIGN AND DEVELOPMENT OF A GUI FOR RF COMMUNICATIONS 31
File type Number of ports Number of
S-parameters saved
s1p 1 1
s2p 2 4
s3p 3 9
s4p 4 16
sNp N N2
1 1 o n e -p o r tS
1 1 1 2
2 1 2 2
tw o -p o r tS S
S S
1 1 1 2 1 3
2 1 2 2 2 3
3 1 3 2 3 3
th re e -p o r t
S S S
S S S
S S S
mdashmdashmdashmdashmdashmdashmdashmdashmdashmdashmdashmdashmdashmdashmdashmdashmdashmdashmdashmdashmdashmdashmdashmdashmdashmdashmdashmdashmdashmdashmdashmdashmdashmdashmdashmdashmdashmdashmdashmdashmdashmdashmdashmdashmdashmdashndashmdashmdashmdashmdash
mdashmdashmdashmdashmdashmdashmdashmdashmdashmdashmdashmdashmdashmdashmdashmdashmdashmdashmdashmdashmdashmdashmdashmdashmdashmdashmdashmdashmdashmdashmdashmdashmdashmdashmdashmdashmdashmdashmdashmdashmdashmdashmdashmdashmdashmdashndashmdashmdashmdashmdash
32 INTERNATIONAL JOURNAL OF ENGINEERING RESEARCH AND INNOVATION | V11 N1 SPRINGSUMMER 2019
Figure 4 shows the next graph a polar plot This is a two-
dimensional system that plots polar coordinates in a Carte-
sian plane and then draws the polar grid on the plane These
plots sometimes display the voltage reflection coefficient
This plays an important role in helping microwave engi-
neers with impendence matching Polar plots are also simi-
lar to X amp Y plots However instead of plotting data at
X versus Y they plot ldquoRrdquo (magnitude) at an angle between
0 and 360 degrees
Figure 4 A polar plot
Figure 5 shows the last graph a Smith chart The capabil-
ities of this chart are limitless and it is standard in micro-
wave engineering The Smith chart is a plot of complex
reflection overlaid with impendence andor admittance grids
referenced to a 1-ohm characteristic impendence Smith
charts help assist RF engineers in many ways but some of
the most notable tasks include impendence matching dis-
playing antenna impendence and visualizing the impend-
ence of a transmission line There are two types of Smith
charts the classic chart displays only positive real impend-
ences while the more modern chart displays imaginary im-
pendences from negative infinity to positive infinity (Gawa
2006)
Methods and Procedures
To create this GUI MATLAB was used to program
develop the GUI and Adobe Photoshop was used to create
the custom background The hardest part of the project was
writing the code to make the GUI accomplish various tasks
When complications were encountered the authors used
various problem-solving methods The ldquohelprdquo and ldquodocrdquo
functions in MATLAB and MATLAB online forums were
used extensively General steps to implementing this project
were as follows
1 Researching data types and graphs
2 Brainstorming what the end result should look like
3 Creating flow charts
4 Developing program code
5 Ensuring the GUI could accomplish the assigned
tasks
6 Creating a custom background
7 Adding extras (static text display toolbar file brows-
er etc)
8 Cleaning up code for efficiency
9 Finishing poster and final paper
Figure 5 A Smith chart
Results and Discussion
Figure 6 shows the completed GUI One attractive feature
is the backgroundlayout This custom background was cre-
ated in Photoshop and saved as a JPG and then placed on a
panel in MATLAB The background of the GUI needed a
visual appeal or style to it The panels helped increase the
overall intuitiveness of the design This was because it gave
everything its own special area as opposed to the thin and
basic borders MATLAB had to offer The input function
was placed in the toolbar of the GUI From there one can
select and import files located within the file directory The
GUI was programmed to automatically plot the Smith chart
polar plot and Bode diagram when certain data were im-
ported allowing the user to import any file type and still
plot it correctly In addition to these features the input al-
lows the user to import M-files as well Figure 7 shows how
to access the import feature using the path File Open
(Select Data) Open
mdashmdashmdashmdashmdashmdashmdashmdashmdashmdashmdashmdashmdashmdashmdashmdashmdashmdashmdashmdashmdashmdashmdashmdashmdashmdashmdashmdashmdashmdashmdashmdashmdashmdashmdashmdashmdashmdashmdashmdashmdashmdashmdashmdashmdashmdashndashmdashmdashmdashmdash
Figure 6 The completed GUI
Figure 7 GUI file menu
Another feature added to the GUI was the ability to graph
multiple plots By using this feature two sets of data could
be displayed on one plot simultaneously Figure 8 shows
how this can be highly effective in helping RF engineers
compare results
Figure 8 Multiple sets of data plotted on one Smith chart
An export button was also created that allows the user to
export data anywhere within the file directory However
instead of an ldquoopenrdquo button the user would see a ldquosaverdquo
option To access the import feature File Save (Name
amp Location) Save
The Bode diagram section is located in the large rectangu-
lar area of the GUI Here the user can select the number of
options and change how to view the imported data The first
option the user can manipulate is the Y-axis for the magni-
tude and phase plots Under the magnitude option the user
can choose from either linear or log (dB) and under the
phase option the user can choose degrees or radians The
second option to choose is the real and imaginary axis of the
Bode diagram Figure 9 shows how this option allows users
to select the axis most practical for their research
(a) The real axis
(b) The imaginary axis Figure 9 The axes
The interface has checkboxes to allow users to select
which color they would like their graph or specific
S-parameters to appear in This allows users to more easily
distinguish different sets of data In addition to adding color
checkboxes checkboxes to select between solid and dotted
lines were added This also helps users distinguish between
different sets of data To graph random data the ldquoBoderdquo
mdashmdashmdashmdashmdashmdashmdashmdashmdashmdashmdashmdashmdashmdashmdashmdashmdashmdashmdashmdashmdashmdashmdashmdashmdashmdashmdashmdashmdashmdashmdashmdashmdashmdashmdashmdashmdashmdashmdashmdashmdashmdashmdashmdashmdashmdashndashmdashmdashmdashmdash
DESIGN AND DEVELOPMENT OF A GUI FOR RF COMMUNICATIONS 33
mdashmdashmdashmdashmdashmdashmdashmdashmdashmdashmdashmdashmdashmdashmdashmdashmdashmdashmdashmdashmdashmdashmdashmdashmdashmdashmdashmdashmdashmdashmdashmdashmdashmdashmdashmdashmdashmdashmdashmdashmdashmdashmdashmdashmdashmdashndashmdashmdashmdashmdash
mdashmdashmdashmdashmdashmdashmdashmdashmdashmdashmdashmdashmdashmdashmdashmdashmdashmdashmdashmdashmdashmdashmdashmdashmdashmdashmdashmdashmdashmdashmdashmdashmdashmdashmdashmdashmdashmdashmdashmdashmdashmdashmdashmdashmdashmdashndashmdashmdashmdashmdash
34 INTERNATIONAL JOURNAL OF ENGINEERING RESEARCH AND INNOVATION | V11 N1 SPRINGSUMMER 2019
button was added and the ldquoenlargerdquo button was added right
beneath it to display a larger version of the Bode diagram in
a separate window This helps engineers get a closer look at
the data plot in case the view on the GUI is not large
enough The same approach was used for other types of
graphs The control panel is the long rectangular panel lo-
cated on the left side of the GUI Here the user can perform
a of actions such as view data or reset graphs When the
users click on the ldquofilerdquo button they are able to select any
image file within the file directory that can be added to the
list box below to be selected (see Figure 10)
Figure 10 The ldquo filerdquo button and image selector listbox
A ldquodata resultsrdquo static textbox was added to the control
panel This box is used to view the data of the image cur-
rently selected in the list box This allows the user to see the
data being plotted or selected Additionally Figures 11 and
12 show how users can view the data being plotted in Note-
pad by going to the toolbar and selecting the data A reset
button was added to the control panel to allow users to reset
the current graph back to a blank state This button does not
reset all the graphs at once so users can erase one graph at a
time The amplifier button located on the toolbar can be
used to generate a Smith chart After the button is selected
users are taken through a wizard-style setup to select what
type of Smith chart they would like to generate This feature
is extremely useful because it allows users to create differ-
ent types of Smith charts that may be hard to duplicate using
the Smith chart located on the GUI (see Figures 13 and 14)
Figure 11 The ldquodata resultsrdquo static textbox
Figure 12 Data displayed in Notepad after using the ldquodatardquo
function
(a) Step 1
(b) Step 2 Figure 13 The amplifier process
mdashmdashmdashmdashmdashmdashmdashmdashmdashmdashmdashmdashmdashmdashmdashmdashmdashmdashmdashmdashmdashmdashmdashmdashmdashmdashmdashmdashmdashmdashmdashmdashmdashmdashmdashmdashmdashmdashmdashmdashmdashmdashmdashmdashmdashmdashndashmdashmdashmdashmdash
Figure 14 Results of the amplifier generator
The angular average function was also added to the
toolbar Figure 15 shows how this function plots various
polar plots and saves them to the file directory A help menu
was also added to the toolbar Here users can access help
using the GUI through demos and help menus In addition
to finding help users can obtain contact information for the
help desk
Figure 15 The angular average of some random data
Conclusions and Future Work
This project was extremely successful The most prized
accomplishments throughout this entire experience was the
comprehensive set of features for manipulating and display-
ing data and the custom background that worked well with
all of the functions The plan for future work is to take the
code written in MATLAB create an iPhoneiPad-
compatible app that could do the same thing that this GUI
did and enable users to accomplish these tasks from an iPad
or iPhone
Acknowledgments
This research was funded by 2010 and 2011 NASA CI-
PAIR and NASA NSTI Research Grants and supported by
Goddard Space Flight Center and NASA Langley Research
Center We would like to thank the NASA team of collabo-
rators lead by Dr Deshpande and our colleagues at Virginia
State University for their time and thoughtful insights dur-
ing ad hoc research gatherings In addition the authors wish
to extend their gratification to the anonymous reviewers for
their time assistance and patience
References
Badombena-Wanta S amp Sheybani E O (2010) Mobile
communications for development Enabling strategic
and low-cost e-applications for rural and remote areas
Proceedings of Wireless Telecommunications Symposi-
um Piscataway NJ IEEE doi 101109
WTS20105479644
Bonsiepe G (1989) Interpretations of human user inter-
face Visible Language 24(3) 262-285
Hayes F amp Baran N (1989 July) A guide to GUIs Byte
4 250-257
Garcia-Otero S amp Sheybani E (2010) Engineering senior
design course (ldquonew and improvedrdquo) Proceedings of
ASEE Annual Conference Washington DC ASEE
Gawa A (2006) Smith chart Retrieved from http
amanogawacomarchivedocsG-tutorialpdf
Hardy M Javidi G Denton L Campbell Y amp Shey-
bani E (2007) Enhancing research capacity and devel-
oping wireless communications curriculum for students
in computer science and engineering Proceedings of
IEEESECon 2007 Piscataway NJ IEEE doi
101109SECON2007342995
Interface (2019) Business Dictionary Retrieved from
httpwwwbusinessdictionarycomdefinition
interfacehtml
Javidi G amp Sheybani E (2008) Content-based computer
simulation of a networking course An assessment
mdashmdashmdashmdashmdashmdashmdashmdashmdashmdashmdashmdashmdashmdashmdashmdashmdashmdashmdashmdashmdashmdashmdashmdashmdashmdashmdashmdashmdashmdashmdashmdashmdashmdashmdashmdashmdashmdashmdashmdashmdashmdashmdashmdashmdashmdashndashmdashmdashmdashmdash
DESIGN AND DEVELOPMENT OF A GUI FOR RF COMMUNICATIONS 35
mdashmdashmdashmdashmdashmdashmdashmdashmdashmdashmdashmdashmdashmdashmdashmdashmdashmdashmdashmdashmdashmdashmdashmdashmdashmdashmdashmdashmdashmdashmdashmdashmdashmdashmdashmdashmdashmdashmdashmdashmdashmdashmdashmdashmdashmdashndashmdashmdashmdashmdash
mdashmdashmdashmdashmdashmdashmdashmdashmdashmdashmdashmdashmdashmdashmdashmdashmdashmdashmdashmdashmdashmdashmdashmdashmdashmdashmdashmdashmdashmdashmdashmdashmdashmdashmdashmdashmdashmdashmdashmdashmdashmdashmdashmdashmdashmdashndashmdashmdashmdashmdash
36 INTERNATIONAL JOURNAL OF ENGINEERING RESEARCH AND INNOVATION | V11 N1 SPRINGSUMMER 2019
Journal of Computers 3(3) 64-72
Javidi G amp Sheybani E (2010) Making youth excited
about STEM education Journal of Computing Sciences
in Colleges 26(1) 140-147
Norman D (1988) The psychology of everyday things
New York Basic Books
Ouyang Y Yang S Franklin T Michaelson K Morge
S Sheybani EhellipNarayan S (2010) Games sims
and virtual worlds in K-20 STEM education
Proceedings of 21st International SITE Conference
Chesapeake VA Association for the Advancement of
Computing in Education
Sheybani E amp Arora K (1993) Measurement of temporal
coherence of underwater optical scattered field
Microwave and Optical Technology Letters 6(2) 151-
154
Sheybani E amp Sankar R (2002) Integrated network
architecture and signal processing for telemammography
Proceedings of IEEEICASSP Piscatawny NJ IEEE
Sheybani E amp Javidi G (2006) Visualization effects in
virtual engineering labs II Proceedings of IEEEFIE
Piscataway NJ IEEE
Sheybani E (2011) Dimensionality reduction and noise
removal in wireless sensor networks Proceedings of
2011 4th IFIP International Conference on New
Technologies Mobility and Security Piscataway NJ
IEEE doi 101109NTMS20115721151
Sheybani E amp Javidi G (2007) Development and
evaluation of an educational computer network
software Proceedings of IEEESECon 2007
Piscataway NJ IEEE doi 101109
SECON2007342904
Sheybani E O Mengshoel O J amp Poll S (2010)
Removing spikes while preserving data and noise using
wavelet filter banks Proceedings of IEEE Aerospace
Conference Piscataway NJ IEEE doi 101109
AERO20105446821
Sheybani E Garcia-Otero S Adnani F Javidi G amp
Deshpande M (2012) An algorithm for real-time blind
image quality comparison and assessment International
Journal of Electrical and Computer Engineering 2(1)
doi httpdxdoiorg1011591ijecev2i1112
Varde A Rundensteiner E Javidi G Sheybani E amp
Liang J (2007) Learning the relative importance of
features in image data Proceedings of IEEE ICDErsquos
DBRank-07 Piscataway NJ IEEE doi 101109
ICDEW20074400998
Zhou Y amp Chen Y (2008) Properties of mixed-mode S-
parameters Microwave and Optical Technology
Letters 50(11) 2869-2874
Biographies
EHSAN SHEYBANI earned his BS MS and PhD in
electrical engineering from UF FSU and USF respectively
His main research area is applications of communication
signal processing and data analysis He has been involved
in teaching practicing researching and consulting
applications of DSP in technology system analysis and
data sciences for the past 20 years He has a long list of
publications and research grants including projects with
NASA NSF NIH DoD DEd and industry partners
Currently he serves as a faculty member at the University
of South Florida Dr Sheybani may be reached at
sheybaniusfedu
GITI JAVIDI earned her BS from the University of
Central Oklahoma and MS and PhD from the University of
South Florida Her main research area is human computer
interaction data visualization and STEM education She
has been involved in teaching computer science and
conducting research in that area for the past 16 years Dr
Javidi has a long list of publications and research grants
including projects with NASA NSF MSIP and industry
partners Currently she serves as a faculty member at the
University of South Florida Dr Javidi may be reached at
javidiusfedu
A DIAGNOSTIC CLOCK FOR VERIFICATION
OF IMAGE TIME SYNCHRONIZATION mdashmdashmdashmdashmdashmdashmdashmdashmdashmdashmdashmdashmdashmdashmdashmdashmdashmdashmdashmdashmdashmdashmdashmdashmdashmdashmdashmdashmdashmdashmdashmdashmdashmdashmdashmdashmdashmdashmdashmdashmdashmdashmdashmdashmdashmdashndashmdashmdashmdashmdash
Curtis Cohenour Ohio University
Abstract
The GPS clock is a diagnostic tool for measuring time
synchronization errors in aerial surveillance systems Aerial
surveillance systems are used in many civilian and military
applications including law enforcement border security
military situational awareness and military forensics The
goal is to collect images and project them onto the local
terrain such that the images form a map A common exam-
ple is Google Earth Aerial platforms can include drones
fixed or rotary winged aircraft and lighter-than-air vehicles
An aerial surveillance system consists of an imaging system
and a navigation system The navigation system is used to
determine the camera position and attitude known as the
pose which contains the necessary information required for
the projection of the image onto the terrain The images and
pose come from two sources and must be synchronized
Any error in the synchronization will create a projection
error
One method of determining when an image has been cap-
tured is to take a picture of a clock The GPS-synchronized
clock creates a display of the GPS time that can be recorded
in an image By taking images of the clock using the sur-
veillance system each image will have a true time from the
image of the GPS clock and a time derived from the pose If
the synchronization is correct they will match Any differ-
ence between the clock time from the image and the time
from the pose is an error that must be corrected In this pa-
per the author describes the operation testing and accuracy
of the clock Tests were performed using an independent
GPS receiver and a precise time protocol (PTP) server The
resolution of the clock was 1 millisecond (ms) and the ac-
curacy was 01 ms Case studies describe how the clock is
used to discover and subsequently correct timing errors in a
surveillance system
Introduction
Aerial surveillance is used in many civilian and military
applications including law enforcement (Ersoy
Palaniappan Seetharaman amp Rao 2012) border security
and improved situational awareness (Bryant Johnson Kent
Nowak amp Rogers 2008) The goal is to collect images and
project them onto the local terrain such that the image forms
a map A common example is Google Earth (GE) where
for example the image of a road overlays a map of the road
Images are captured by a camera while the pose is most
often generated by an integrated global positioning system
(GPS)inertial measurement unit (IMU) Distortion in the
camera image and errors in the GPSIMU will result in er-
rors in the projection These errors have been studied in
detail and are well documented in the literature for camera
models (Cohenour Price Rovito and van Graas 2015) and
corrected pose data (Cohenour Price Rovito amp van Graas
2015) The assumption was made that the pose would be
synchronized with the image as the author was unable to
find research into projection errors caused by time synchro-
nization errors nor any device to measure these errors It
was also assumed to not always be true that an image is
synced with the pose as will be seen in the case studies
below In this paper the author describes a means of testing
this assumption
The pose by default includes an accurate time If the
image includes the time the two can be compared directly
The GPS clock provides a mechanism for including the time
in the image The clock was used as a diagnostic tool Data
were collected and analyzed and the results used to diag-
nose correct and ultimately verify the synchronization of
the image and the pose The details of the projection are
described in a number of papers for camera models
(Cohenour et al 2015) corrected pose date (Cohenour et
al 2015) and others (Wolf 1974 Tsai 1987 Di amp Li
2004) The projection is based on the camera pose (position
and attitude) that corresponds to the image The pose will
have random errors that generate random errors in projec-
tion For example errors in GE can range from a few centi-
meters to a few meters depending on the aerial survey used
In this current study the focus was on errors that occurred
because the pose data were not captured at the same time
the image was captured
The pose data typically come from an integrated GPS
IMU while the image data come from a camera or a bank of
cameras The pose and image data are placed in one-to-one
correspondence But what happens if there is an extra mes-
sage in the IMU buffer or the image buffer If this happens
then the images will be off by one or more frames GPS is a
four-dimensional positioning system it produces position in
three dimensions and time The position errors are typically
less than 10m (Kaplan 1996) A 10m error in time is
10m300e6ms = 33ns An aerial surveillance camera typi-
cally operates with an integration time of 1ms If an aircraft
is traveling at 85ms then the 1ms is 085 of aircraft travel
mdashmdashmdashmdashmdashmdashmdashmdashmdashmdashmdashmdashmdashmdashmdashmdashmdashmdashmdashmdashmdashmdashmdashmdashmdashmdashmdashmdashmdashmdashmdashmdashmdashmdashmdashmdashmdashmdashmdashmdashmdashmdashmdashmdashmdashmdashmdashmdashmdashmdash
INTERNATIONAL JOURNAL OF ENGINEERING RESEARCH AND INNOVATION | V11 N1 SPRINGSUMMER 2019 37
mdashmdashmdashmdashmdashmdashmdashmdashmdashmdashmdashmdashmdashmdashmdashmdashmdashmdashmdashmdashmdashmdashmdashmdashmdashmdashmdashmdashmdashmdashmdashmdashmdashmdashmdashmdashmdashmdashmdashmdashmdashmdashmdashmdashmdashmdashndashmdashmdashmdashmdash
mdashmdashmdashmdashmdashmdashmdashmdashmdashmdashmdashmdashmdashmdashmdashmdashmdashmdashmdashmdashmdashmdashmdashmdashmdashmdashmdashmdashmdashmdashmdashmdashmdashmdashmdashmdashmdashmdashmdashmdashmdashmdashmdashmdashmdashmdashndashmdashmdashmdashmdash
38 INTERNATIONAL JOURNAL OF ENGINEERING RESEARCH AND INNOVATION | V11 N1 SPRINGSUMMER 2019
The GPS time is available for free with an accuracy much
greater than that needed for image time registration This
provides an opportunity for verifying the synchronization of
the pose and the image If there is an accurate clock in the
image the clock time can be compared with the GPS time
in the pose If they match the synchronization is confirmed
If they do not match then hardware or software modifica-
tions are required
GPS Clock Version 1
The original clock Version 1 was not designed specifi-
cally for testing image synchronization and so was modified
for this purpose The clock displayed the minutes and sec-
onds with six gray code bits (Dewar amp Stevens 2012) and
milliseconds with 10 gray code bits Two additional indica-
tors were also displayed The first indicated a valid display
labeled ldquoGPS Okrdquo the second indicator changed state each
time the GPS receiver time sync pulse was received and was
labeled 1 pulse per second (1PPS) Gray code was used in
the clock because only one bit changes at a time If binary
were used the transition from 7 to 8 which in binary is
0111b to 1000b could be read as 0000b or 1111b which
would be 0 or 15 in decimal Version 1 of the clock had a
number of issues
1 Heavy about 35 pounds
2 Separate gray code displays for minutes seconds
and milliseconds
3 No diagnostics for the GPS receiver
4 No way to test the LEDs and drivers
5 Second update occurs 20ms after the 1PPS
6 LEDs are dim
7 Requires 120V alternating current (AC) power
8 Satellite tracking issues
While 35 pounds is not prohibitively heavy the clock was
awkward hard to carry and sometimes used in areas inac-
cessible to autos The clock did not operate on batteries
which could cause issues in remote locations The separate
gray code displays for minutes seconds and milliseconds
meant that multiple bits would sometimes change at the
same time If the change occurred while the exposure was
being made this would create errors since the second up-
date was 20ms late The milliseconds must be read first and
then the seconds adjusted With no receiver diagnostics
simple problems like a bad antenna cable could not be diag-
nosed There was no way to test for a bad LED or driver
The LEDs were not bright enough for use outdoors in the
sun or with a short 01ms integration time Finally receiver
tracking was optimized for survey work and would not track
satellites that were not clearly visible This led to trouble
getting a solution if the antenna did not have a clear view of
the sky
GPS Clock Version 2
Version 2 of the clock resolved all of the aforementioned
issues (see Figure 1) The clock was lightweight designed
for remote use included diagnostics and worked well in
direct sunlight There were test buttons for the LEDs a liq-
uid crystal display (LCD) and a diagnostic RS-232C port
Figure 1 The GPS clock version 2
The GPS clock version 2 used an Arduino Mega 2560 R3
as the computing platform The Arduino Mega (2017) had
four serial ports 54 digital inputoutput (IO) ports and mul-
tiple hardware and software interrupts The GPS receiver
was manufactured by ITEAD and used a RoyalTek REB-
4216 chip The receiver tracked reflected satellites operated
with a limited view of the sky and could often generate a
solution indoors The receiver was selected because it was
the only GPS Arduino shield (at the time of writing) with a
1PPS output All of the receiver outputs were echoed to an
RS-232 serial port for diagnostics
The LED outputs were buffered generating an intense
white light of 12000 mcd The LEDs could easily be seen
in bright sunshine A felt cover was provided to eliminate
reflections when operating in direct sun The LEDs IO pins
and buffers could be tested using two buttons ldquoall onrdquo and
ldquoall offrdquo The time display was 16 bits with 10 bits dedicat-
ed to the fraction All 16 bits were a single gray code word
This complicated manual decoding but ensured that no more
than one bit changed at a time The fraction was 10 bits
therefore the resolution was 2-12 11024th of a second or
09766 ms The resolution was approximately 1ms which
was adequate for an airborne imaging system that typically
has a minimum exposure time of 1 or 2ms
mdashmdashmdashmdashmdashmdashmdashmdashmdashmdashmdashmdashmdashmdashmdashmdashmdashmdashmdashmdashmdashmdashmdashmdashmdashmdashmdashmdashmdashmdashmdashmdashmdashmdashmdashmdashmdashmdashmdashmdashmdashmdashmdashmdashmdashmdashndashmdashmdashmdashmdash
GPS time was kept in seconds of the week starting with 0
at 00000 coordinated universal time (UTC) on Sunday
The six most significant bits of the LED display showed the
GPS time modulo 64 There are 86400 seconds in a day so
8640064 is 1350 with a remainder of zero This happy
coincidence ensured that there would be a continuous rollo-
ver over each day and each week The aerial surveillance
system was assumed to have a time error of less than
32 seconds This could be verified with a single frame of
data and a watch Assuming that the system met this re-
quirement the error would be at most a few seconds and a
modulo 64 second clock would be adequate
An LCD was provided on the clock The LCD displayed
the clock version validinvalid the number of satellite vehi-
cles (SVs) tracked the leap second and a graphic indicating
serial data received The number of SVs tracked was a key
piece of troubleshooting data as was the serial data graphic
The GPS receiver sent out six National Marine Electronics
Association (NMEA) messages The Arduino decoded two
of these messages to extract the time of day validinvalid
and the number of SVs All of the messages were echoed to
a serial port on the left side of the clock for user diagnostics
Finally the clock was lightweight only 35 pounds
8x12x3 with a carry handle and powered by six AA
batteries or an AC adapter The clock and accessories were
shipped in a small Pelican case
Hardware and Software
Figure 2 shows a hardware block diagram of the GPS
clock The ITEAD GPS receiver sends serial data to the
Arduino Mega via serial port 2 The baud rate is 9600 with
eight data bits one stop bit and no parity These data are
converted to RS-232 signal levels using a MAX-232-CPE
and outputted to a 9-pin d-shell serial port The 1PPS signal
is routed to the Arduino on pin 2 interrupt 0 The Arduino
processes the data and outputs to 18 LEDs which are con-
nected to three SN74LS07 hex buffers and drivers with
open-collector high-voltage outputs (Texas Instruments
2016) The LEDs are connected to the battery or AC adapter
and do not draw power through the Arduino voltage regula-
tor There are 16 LEDs for the time display one for the
1PPS and one for the valid indicator The Arduino drives a
backlit LCD display There is an analog contrast adjustment
for the LCD
There are four button inputs to the Arduino lamp test
buttons ldquoall onrdquo and ldquoall offrdquo and leap second ldquouprdquo and
ldquodownrdquo The lamp test buttons override the normal LED
outputs and verify the Arduino output the buffer and the
LED Not shown is the power A switched barrel jack dis-
connects the batteries when the AC adapter is connected
An on-off switch connects the power to the clock The clock
can operate for about two hours on six AA batteries An
SMA female connector is provided on the left side of the
clock for connection to an amplified 33V GPS antenna
Figure 3 shows a software block diagram for the clock
which is interrupt-driven The 1PPS event sets the seconds
of the day based on the input from the serial parser and ze-
ros out the 11024-second timer This starts the
11024-second counter at zero on the 1pps event From here
on the 11024-second clock increment will be referred to as
1 ms for brevity
Figure 2 GPS clock version 2 hardware block diagram
Figure 3 Software block diagram of the GPS clock
The ITEAD receiver generates six NMEA output messag-
es The serial parser reads and parses the recommended
minimum data (RMC) and global positioning system fixed
data (GGA) messages other messages are not parsed to
reduce processor load All messages are passed via hard-
ware to the diagnostic serial port The RMC message is
parsed to extract the UTC time and the valid flag The GGA
message provides the number of SVs in the solution The
seconds of the day (SOD) is computed based on the hour
minutes and seconds in the RMC message The RMC mes-
sage completes 750 ms into the seconds and is one second
old at the time of the next 1PPS The leap seconds are added
to the SOD to convert UTC SOD to GPS SOD The GPS
SOD is all that is needed for the clock because the seconds
in a day 86400 is an even multiple of 64 During the 1PPS
event if the time is valid the clock is reset to the (SOD
GPS + 1) modulo 64 the milliseconds is set to zero and the
millisecond timer timer 2 is set to zero
mdashmdashmdashmdashmdashmdashmdashmdashmdashmdashmdashmdashmdashmdashmdashmdashmdashmdashmdashmdashmdashmdashmdashmdashmdashmdashmdashmdashmdashmdashmdashmdashmdashmdashmdashmdashmdashmdashmdashmdashmdashmdashmdashmdashmdashmdashndashmdashmdashmdashmdash
A DIAGNOSTIC CLOCK FOR VERIFICATION OF IMAGE TIME SYNCHRONIZATION 39
mdashmdashmdashmdashmdashmdashmdashmdashmdashmdashmdashmdashmdashmdashmdashmdashmdashmdashmdashmdashmdashmdashmdashmdashmdashmdashmdashmdashmdashmdashmdashmdashmdashmdashmdashmdashmdashmdashmdashmdashmdashmdashmdashmdashmdashmdashndashmdashmdashmdashmdash
mdashmdashmdashmdashmdashmdashmdashmdashmdashmdashmdashmdashmdashmdashmdashmdashmdashmdashmdashmdashmdashmdashmdashmdashmdashmdashmdashmdashmdashmdashmdashmdashmdashmdashmdashmdashmdashmdashmdashmdashmdashmdashmdashmdashmdashmdashndashmdashmdashmdashmdash
40 INTERNATIONAL JOURNAL OF ENGINEERING RESEARCH AND INNOVATION | V11 N1 SPRINGSUMMER 2019
The 11024 event is tied to timer 2 The timer pre-scaler is
set to 64 The clock is 16 MHz so the timer counts at 250
KHz The counter should time out at 2500001024-1=
2431406 The timer is set to 243 and the remainder
01406 is accumulated until it is greater than 10 When this
happens one is subtracted from the accumulator and the
timer is set to 244 In this way the clock remains accurate
If this were not done then the last millisecond 1023 would
be over four milliseconds long This is further complicated
by the inaccuracy of the Arduino clocks The clock was
tested with three different Arduinos to investigate the varia-
bility in the oscillators The average number of microsec-
onds per 1PPS was 1e6 for a perfect oscillator The results
for the three units tested were 992592 1001216 and
1000002 The GPS 1PPS had an error of less than 1μs so
it could be used to calibrate the Arduino internal oscillator
To compensate for the oscillator errors the average value of
the microseconds per 1PPS was divided by four and used in
the above calculation instead of 250000
The REB 4216 receiver does not reveal the leap second
To convert from UTC to GPS the leap second is needed
The current leap second is 18 as of August 2017 and can
change twice per year during the first week epoch in Janu-
ary and the first week epoch in July The current leap sec-
ond is officially available on line at https
wwwnavcenuscggov but is more easily found by doing a
Google search for ldquoGPS leap secondsrdquo The conversion is
given by Equation 1[IS-GPS-200]
GPS = UTC + Leap seconds (1)
where GPS is the seconds of the week in GPS time UTC is
the seconds of the week in UTC and Leap seconds is the
integer number of leap seconds
The leap second was stored in a EEPROM and manipulat-
ed by two buttons ldquouprdquo and ldquodownrdquo When the leap second
was changed it was stored in the EEPROM During startup
the EEPROM was read to initialize the leap seconds The
LED test buttons were implemented in the 11024 event
During this event the seconds and milliseconds were com-
puted as well as the status of the valid and 1PPS LEDS The
seconds and milliseconds were converted to gray code If
neither LED test button was pushed the data were placed on
the Arduino IO ports If the ldquoall onrdquo button was pressed the
IO ports were set to on if ldquoall offrdquo was pressed then the IO
ports were set to off In this way the IO ports the buffers
and the LEDs were tested Data displayed on the LCD in-
cluded the GPS clock software revision on the top line and
key data on the second line The second line of the display
included ldquovalrdquoldquoinvrdquo to indicate the status of the clock the
number of satellites the number of leap seconds and a ro-
tating slash to indicate that the GPS messages were being
received
Verification
Accuracy of the GPS clock was verified in a number of
ways First the 1PPS signal was checked against a Novatel
survey receiver second a precise time protocol-enabled
camera (Kaplan 1996) was used and third a Novatel re-
ceiver was used Figure 4 shows a histogram of the error
collected from 31521 images
Figure 4 Histogram of clock errors (31521 measurements)
The first test conducted was to determine the accuracy of
the 1PPS interrupt A NovAtel PWRPAK-4-3151W PN
01016783 was connected to an AeroAntenna AT575-9W-
TNCF-000-05-26-NM amplified antenna The 1PPS was
connected to the Arduino interrupt 0 IO pin 2 The interrupt
routine was set up to toggle the 1PPS LED on the Arduino
The Arduino output was connected to the NovAtel Event1
input The NovAtel ldquoMarkTime OnNewrdquo log (Novatel
2015) was used to determine the interrupt delay This test
showed a delay of 11 micros which is the time required to pro-
cess the interrupt Figure 5 shows how the second and third
tests were set up Table 1 provides descriptions of the com-
ponents
The camera was powered using power over Ethernet
(POE) Communications and control of the camera was by
gigabyte Ethernet A PTP (IEEE 2008) time server was
connected to the camera to provide microsecond-level abso-
lute time to the camera In this configuration a console ap-
plication running on the laptop triggered and recorded 10
images about 08 seconds apart Each image was saved us-
ing the PTP time in microseconds The PTP time is Temps
Atomique International (TAI) seconds since January 1
-02 0 02 04 06 08 1 120
50
100
150
200
250
300
NOV Time Error (ms)
Co
un
t
mdashmdashmdashmdashmdashmdashmdashmdashmdashmdashmdashmdashmdashmdashmdashmdashmdashmdashmdashmdashmdashmdashmdashmdashmdashmdashmdashmdashmdashmdashmdashmdashmdashmdashmdashmdashmdashmdashmdashmdashmdashmdashmdashmdashmdashmdashndashmdashmdashmdashmdash
1970 (McCarthy amp Seidelmann 2009) TAI is always ahead
of GPS by 19 seconds (Time Service Dept nd) and can
be determined using Equation 2
GPS = PTP + 19s (2)
where PTP is seconds since January 1 1970
Figure 5 Test configuration for the clock
Table 1 Equipment used for clock testing
PTP time synchronization in the camera is known to be
within 2 μs (Allied Vision 2016) If the PTP time from the
camera is correct then this would be all that is required to
validate the clock readings to the millisecond To check the
camera PTP time the sync 1 output of the camera was tied
to the Event 1 input of the Novatel Using MATLAB the
console app was executed and the file namesPTP times
were extracted The Novatel logs were collected and the
time extracted Each image was read and the first 20 bytes
of the image were replaced with the GPS time from the No-
vatel receiver This was done 10 images at a time to ensure
that there were no buffering errors Later when processing
the images the PTP time was extracted from the file name
and the GPS time was extracted from the image
Other items in the test setup included a NetGear Ethernet
switch and Cat 5E Ethernet cables This set up was used for
all of the results in the following section Tests were con-
ducted with the lens aperture at max an exposure time of
01 ms and a gain of 35 dB This produced images having
an exposure much shorter than the resolution of the clock
Figure 6(a) shows that the LEDs and clock were clearly
visible Figure 6(a) also shows image one of 31521 images
used to verify the clock accuracy The images were pro-
cessed automatically using MATLAB First the location of
the LEDs was captured This was done by displaying image
one and clicking on each of the 18 LEDs The location of
the LEDs was saved and indicated by circles in Figure 6(a)
Once this was completed the LED locations could be used
for all images as long as the clock and camera were not
moved
(a) The first of 31521 images (b) Mask for bit G15
used for clock verification
Figure 6 The LEDs and clock are clearly visible
For each image the LEDs are read as follows a mask is
generated for each LED position with a value of one within
a radius of pixels Figure 6(b) shows the mask for LED
G15 The mask and the image are multiplied element by
element and the results are summed This gives a low value
for an LED that is off and a high value for an LED that is
on This is repeated for each of the 16 gray code LEDs the
1PPS and the valid LED A threshold value is chosen mid-
way between on and off to differentiate the two states In
this way the 16 gray code bits are extracted This is done
for each image The gray code values for each image are
converted to seconds using Equation 3 Note that the clock
reading is by definition modulo 64
(3)
where Gry is the clock reading in gray code gry2int()
converts in gray code to an integer and 1024 converts
clock increments to seconds Additional MATLAB scripts are available from the author (see contact information
included with this paper)
Item Description
Camera Allied Vision Manta G-319B
Novatel Novatel PWRPAK-4-3151W PN 01016783
PTP Server Time Machine TM2000A
Switch NetGear ProSAFE GS108
Antennas Generic Magnetic Base L1 Patch Antenna
g ry 2 in t(G ry ) =
1 0 2 4M o d G P S
mdashmdashmdashmdashmdashmdashmdashmdashmdashmdashmdashmdashmdashmdashmdashmdashmdashmdashmdashmdashmdashmdashmdashmdashmdashmdashmdashmdashmdashmdashmdashmdashmdashmdashmdashmdashmdashmdashmdashmdashmdashmdashmdashmdashmdashmdashndashmdashmdashmdashmdash
A DIAGNOSTIC CLOCK FOR VERIFICATION OF IMAGE TIME SYNCHRONIZATION 41
mdashmdashmdashmdashmdashmdashmdashmdashmdashmdashmdashmdashmdashmdashmdashmdashmdashmdashmdashmdashmdashmdashmdashmdashmdashmdashmdashmdashmdashmdashmdashmdashmdashmdashmdashmdashmdashmdashmdashmdashmdashmdashmdashmdashmdashmdashndashmdashmdashmdashmdash
mdashmdashmdashmdashmdashmdashmdashmdashmdashmdashmdashmdashmdashmdashmdashmdashmdashmdashmdashmdashmdashmdashmdashmdashmdashmdashmdashmdashmdashmdashmdashmdashmdashmdashmdashmdashmdashmdashmdashmdashmdashmdashmdashmdashmdashmdashndashmdashmdashmdashmdash
42 INTERNATIONAL JOURNAL OF ENGINEERING RESEARCH AND INNOVATION | V11 N1 SPRINGSUMMER 2019
The MATLAB code for this conversion is decGPS=gray2int(Gry)
ModGPS=decGPS1024
When in use it was assumed that the clock was correct so
the error was the time stampmdashthe GPS clock time in the
image The time stamp error can be computed using Equa-
tion 4
ModTimeStamp = mod(TimeStamp64)
Err = ModTimeStamp ‒ ModGPS (4)
if (Err lt -32) Err = Err + 64
where TimeStamp is the time stamp in GPS time mod(a b)
returns the remainder of ab and Err is the clock error
Note that the ldquoifrdquo statement compensates for events where
the ModGPS and the ModTimeStamps occur on opposite
sides of the 64 second boundary
Using the setup above the clock distribution was 05 ms
plusmn03 ms as seen in the histogram of Figure 4 The camera
was triggered asynchronously so that the errors should form
a uniform error distribution in Figure 4 Theoretically the
distribution of the error should be a uniform distribution
with a mean of 05 ms and standard deviation of 028 ms
(Miller amp Freund 1977) which is very close to the meas-
ured values of 05 for the mean and 03 for the standard de-
viation The clock resolution was 1 ms while the actual
accuracy is better than 01 ms To understand why examine
what happens to images taken at various times A through D
in Figure 7 The clock reads 0000 in the range 0000 to
0001 and 0001 in the range from 0001 to 0002 An im-
age taken at B will have a time stamp of 00011 but the
clock will read 0001 and the error is 01 ms The same
applies for C where the error is 09 ms The image taken at
A has a time stamp of 000047 and the clock reads 0000 so
the error is 047 ms All of the errors will map into the range
of 0 to 1 ms
Figure 7 Timeline showing various image capture times
Now consider the image at D This time stamp is 0001
but the clock could be in transition and read either 0000 or
0001 If the clock reads 0000 then the time error for D is
1 ms If the cock reads 0001 then the time error reads 0 So
the image at D could have an error of 0 or 1 ms The same
argument can be made for the image taken at E This is il-
lustrated in Figure 8 Note that most of the images occur
between B and C Since they are random in time they map
to a uniform distribution with an error between 0 and 1 ms
The points at D and E may map to 0 ms plusmn a few microsec-
onds or to 1 ms plusmn a few microseconds The result is the plot
in Figure 4 The camera integration time is 01 ms for the
data collected in Figure 4 This results in a few observations
in the range of 100 to 107 ms
Figure 8 Mapping of image times to error space
The GPS clock has an LED to indicate that the clock is
valid The clock may go to invalid if the GPS solution is
corrupt due to jamming an antenna failure poor visibility
of the sky or other reasons If this happens the valid LED
should turn off To test this the clock was allowed to sync
to GPS time Data recording was started and the GPS an-
tenna was disconnected After a period of time the antenna
connector was reconnected and the clock synced The data
were checked and the invalid state started almost immedi-
ately when the antenna was disconnected When the antenna
was reconnected the time recovered and the clock returned
to valid All measurements with the valid indicator on were
correct For accuracy the imaging system should be set for
a short integration time The recommended exposure time is
01 ms to extract maximum accuracy from the clock This
can usually be achieved by setting the integration time
01 ms and increasing the gain The clock does not have to
be visible as long as the LEDs can be seen in the image An
underexposed image will work because the LEDs are very
bright If a longer exposure time is used the results will be
smeared but the results are still meaningful Some systems
using webcams for example do not allow the user to con-
trol the exposure This is illustrated in the two tests that fol-
low
Two tests were performed using 1 ms and 2 ms integra-
tion times For a 1 ms exposure with 1661 images the
mean is 67 μs and the standard deviation is 06 ms or
00 plusmn 06 ms For a 2 ms exposure with 3701 images the
mean is -04ms with a standard deviation of 10 ms
mdashmdashmdashmdashmdashmdashmdashmdashmdashmdashmdashmdashmdashmdashmdashmdashmdashmdashmdashmdashmdashmdashmdashmdashmdashmdashmdashmdashmdashmdashmdashmdashmdashmdashmdashmdashmdashmdashmdashmdashmdashmdashmdashmdashmdashmdashndashmdashmdashmdashmdash
Case Studies
Version 1 of the clock was developed in 2009 and used to
troubleshoot fix and ultimately verify a number of sys-
tems Case studies are provided here to give the reader an
appreciation of how time sync errors can arise and how the
clock can be used to investigate and correct the any syn-
chronization errors Seven case studies are listed in Table 2
Some of these cases were investigated thoroughly and docu-
mented in publications in others the results were transmit-
ted and results were never communicated to the author
Table 2 Table of case studies using the clock
Case 1 The Novatel ldquoInsPva OnMarkrdquo log was used but
this log was not supported by Novatel There was an inter-
polation error that returned the positon and attitude at the
wrong time The correct log is the ldquoMark1Pva OnNewrdquo log
There is a -10 ms error in the ldquoInsPva OnMarkrdquo log that
reaches as high as 50 ms near the one-second boundary
This indicates that perhaps the Novatel has housekeeping
chores on the one-second boundary that create issues with
the unsupported log
Case 2 The system was switched to use the ldquoMark1Pva
OnNewrdquo log This created additional problems with yaw
errors from IMU Knowing the time tags were correct led to
an examination of the errors Based on this test it became
clear that the ldquoInsPva OnMarkrdquo log has errors that cannot be
explained Novatel was contacted and the user was advised
to do a firmware update This corrected the error
Case 3 A nadir (down looking) camera system mounted on
the Ohio University Avionics Center DC-3 was tested using
the clock The system had zero time errors and no modifi-
cations were required
Case 4 Two independent nadir camera systems were
mounted on the Ohio University Avionics Center DC-3
Both of these systems used Allied Vision PTP cameras
Both systems were tested using the clock and found to have
correct time tags
Case 5 A number of the Version 1 clock shortcomings were
revealed A 30 frames per second (FPS) with a long lens
was tested using Version 1 of the clock It was required to
position the clock outside in order for the camera to capture
the entire clock in the image The sun was so bright that the
LEDs could not be read Folding tables and sawhorses were
used to provide shade so that the clock could be read The
clock was placed in an area that was surrounded by build-
ings that obscured portions of the sky The GPS receiver
lost lock many times and slowed the data collection Once
usable data were obtained from the clock it was discovered
that the images were off by 1 to 3 frames The system hard-
ware included a divide-by-four circuit in the line between
the camera sync and the Novatel mark input The error oc-
curred because the divide-by-four counter was not reset and
not synced with the software The software system was re-
configured to reset the divide-by-four circuit when imaging
was started This resulted in synced images
Case 6 An imaging system similar to that described in
Cohenour et al (Camera 2015) and Conehour et al
(Corrected 2015) recorded at a rate of 3 frames per second
There was a time tag error of 016 The camera sync and the
Novatel mark input were driven by an external time source
The error was frac12 of the frame rate One possible source of
the error could be that the camera was triggered on the posi-
tive edge of the signal and the Novatel was triggered on the
negative edge Changing edge sensitivity of either the cam-
era or the Novatel is trivial The author did not receive any
feedback on the resolution of this issue This is a good ex-
ample of the utility of the clock an easily correctable prob-
lem but difficult to isolate without the clock
Case 7 A forward-looking camera system was installed on
the Ohio University Avionic Engineering Center Beechcraft
Barron The system included both IR and visible spectra
cameras A breadboard prototype of the Version 2 clock
was used to test the time tagging of the visible camera The
LEDs used on the clock are not suitable for IR
The cameras were triggered by a Novatel 1PPS signal
The software written for Microsoft Windows received No-
vatel position and attitude data as well as image data The
visible camera was tested and found to be off by 1 second
Software changes were made to correct this problem The
system was retested and shown to be correct Flight data
were recorded using the system When the images were
projected there were large time synchronization errors The
data for a turn were analyzed to determine if the images
matched the pose data The horizon was tracked in a number
of images to estimate the roll The estimated roll from the
Case Description
1 Incorrect Novatel Log
2 Novatel Log Error
3 DC 3 Camera System
4 DC 3 PTP System
5 Hi Rate Data Collection
6 12 frame error
7 Forward Looking EO and IR
mdashmdashmdashmdashmdashmdashmdashmdashmdashmdashmdashmdashmdashmdashmdashmdashmdashmdashmdashmdashmdashmdashmdashmdashmdashmdashmdashmdashmdashmdashmdashmdashmdashmdashmdashmdashmdashmdashmdashmdashmdashmdashmdashmdashmdashmdashndashmdashmdashmdashmdash
A DIAGNOSTIC CLOCK FOR VERIFICATION OF IMAGE TIME SYNCHRONIZATION 43
mdashmdashmdashmdashmdashmdashmdashmdashmdashmdashmdashmdashmdashmdashmdashmdashmdashmdashmdashmdashmdashmdashmdashmdashmdashmdashmdashmdashmdashmdashmdashmdashmdashmdashmdashmdashmdashmdashmdashmdashmdashmdashmdashmdashmdashmdashndashmdashmdashmdashmdash
mdashmdashmdashmdashmdashmdashmdashmdashmdashmdashmdashmdashmdashmdashmdashmdashmdashmdashmdashmdashmdashmdashmdashmdashmdashmdashmdashmdashmdashmdashmdashmdashmdashmdashmdashmdashmdashmdashmdashmdashmdashmdashmdashmdashmdashmdashndashmdashmdashmdashmdash
44 INTERNATIONAL JOURNAL OF ENGINEERING RESEARCH AND INNOVATION | V11 N1 SPRINGSUMMER 2019
images was correlated with the IMU roll The time error of
the images was determined to be 14 seconds This shows
how buffering or other issues can cause problems The pro-
ject was shelved due to a failure of the IR camera and the
issue was never resolved
Conclusions
A GPS synchronized clock was described The purpose of
the clock was to measure time synchronization errors in an
aerial surveillance system Using the clock a precise GPS
time could be extracted from the image The image time
was compared to the pose time to determine the time error
Any time errors will create projection errors With this in-
formation corrective action can be taken The clock de-
scribed in this paper was Version 2 All of the shortcomings
in Version 1 were corrected The clock is lightweight in-
tensely bright powered by AC or batteries and includes test
features and diagnostics A detailed analysis of the timing
error between the clock and a reference receiver showed
that the resolution of the clock was 1 ms while the accuracy
was better than 01 ms If the exposure time increased the
clock was still valid but the resolution was reduced
The camera integration time impacted the clock readings
If the camera integration was longer than 1 ms the least
significant bit would appear as on with a 50 duty cycle
This was tested and the clock was still valid but the resolu-
tion was reduced For best results the minimum integration
time that allows reading the LEDs should be used A num-
ber of case studies were used to illustrate the utility of the
clock These case studies illustrate the types of errors that
can be encountered and how corrective action can be taken
once the errors are discovered The clock presented here
was for visible light There was also a need for time verifi-
cation of infrared (IR) image data The clock could easily be
converted to cover shortwave IR images simply by using IR
LEDs This becomes more complex at longer wavelengths
A number of schemes are being considered for wavelengths
up to 8 microm Additional information about the clock and on-
going work is available from the author
References
Allied Vision (2016) Application note IEEE 1588
precision time protocol prosilica GT GC and manta
cameras Vancouver British Columbia Canada Allied
Vision
Arduino (2017) Arduino Mega 2650 Retrieved from
httpwwwarduinoorgproductsboardsarduino-mega-
2560
Bryant M Johnson P Kent B M Nowak M amp
Rogers S R (2008) Layered sensing Its definition
attributes and guiding principles for AFRL strategic
technology development Wright-Patterson Air Force
Base OH Sensors Directorate Air Force Research
Laboratory
Cohenour C Price R Rovito T amp van Graas F (2015)
Camera models for the Wright Patterson Air Force
Base (WPAFB) 2009 wide area motion imagery
(WAMI) data set IEEE Aerospace amp Electronic
Systems Magazine 30(6) 4-15
Cohenour C Price R Rovito T amp van Graas F (2015)
Corrected pose data for the Wright Patterson Air Force
Base (WPAFB) 2009 wide area motion imagery
(WAMI) data set SPIE Journal of Applied Remote
Sensing 9(1) 4-15
Dewar M amp Stevens B (2012) Ordering block designsmdash
Gray codes universal cycles and configuration New
York Springer
Di K amp Li R (2004) CAHVOR camera model and its
photogrammetric conversion for planetary applications
Journal of Geophysical Research 109(E04004) 1-9
Ersoy I Palaniappan K Seetharaman G S amp Rao R
M R (2012) Interactive target tracking for persistent
wide-area surveillance Interactive target tracking for
persistent wide-area surveillance Proceedings of SPIE
Conference on Geospatial InfoFusion II Bellingham
WA SPIE doi 10111712920815
IEEE (2008) IEEE standard for a precision clock
synchronization protocol for networked measurement
and control systems Retrieved from http
standardsieeeorg
Kaplan E D (1996) Understanding GPS Principles and
applications Boston Artech House
McCarthy D amp Seidelmann K (2009) Time From earth
rotation to atomic physics Weinheim Germany Wiley-
VCH
Miller I amp Freund J (1977) Probability and statistics for
engineers Englewood Cliffs NJ Prentice-Hall
NovAtel (2015) OEM6 family firmware reference manual
OM-20000129 rev 8 Calgary Alberta Canada
NovAtel
Texas Instruments (2016) SN74LS07 hex buffers and
drivers with open-collector high-voltage outputs
Dallas Texas Instruments
Time Service Dept (nd) Leap seconds Retrieved from
httptychousnonavymilleapsechtml
Tsai R Y (1987) A versatile camera calibration technique
for high-accuracy 3d machine vision metrology using
off-the shelf tv cameras and lenses IEEE Journal of
Robotics and Automation RA-3(4) 323-344
Wolf P R (1974) Elements of photogrammetry New
York McGraw-Hill
mdashmdashmdashmdashmdashmdashmdashmdashmdashmdashmdashmdashmdashmdashmdashmdashmdashmdashmdashmdashmdashmdashmdashmdashmdashmdashmdashmdashmdashmdashmdashmdashmdashmdashmdashmdashmdashmdashmdashmdashmdashmdashmdashmdashmdashmdashndashmdashmdashmdashmdash
Biography
CURTIS COHENOUR is an assistant professor in the
Ohio University Engineering Technology and Management
Department He received his BS degree from West Virginia
Institute of Technology in 1980 MS degree from Ohio Uni-
versity in 1988 and PhD in electrical engineering from
Ohio University in 2009 He is a registered professional
engineer in West Virginia and Ohio Dr Cohenour has
worked in industry as an electrical engineer in the areas of
control systems automation and power He joined Ohio
University in 2002 as a research engineer working for the
Ohio University Avionics Engineering Center He has
worked on projects covering a wide variety of avionics and
navigation systems such as the instrument landing system
microwave landing system distance measuring equipment
LAAS WAAS and GPS His recent work has included
research with the Air Force Research Laboratory in Dayton
Ohio aimed at understanding and correcting image geo-
registration errors from a number of airborne platforms Dr
Cohenour may be reached at cohenourohioedu
mdashmdashmdashmdashmdashmdashmdashmdashmdashmdashmdashmdashmdashmdashmdashmdashmdashmdashmdashmdashmdashmdashmdashmdashmdashmdashmdashmdashmdashmdashmdashmdashmdashmdashmdashmdashmdashmdashmdashmdashmdashmdashmdashmdashmdashmdashndashmdashmdashmdashmdash
A DIAGNOSTIC CLOCK FOR VERIFICATION OF IMAGE TIME SYNCHRONIZATION 45
ASSESSING THE EFFECTIVENESS OF AN AUTOMATIC
DOOR LOCK SYSTEM BY DISCHARGE DETECTION
TO LOWER CASUALTIES DURING AN ACADEMIC
ACTIVE SHOOTER INCIDENT mdashmdashmdashmdashmdashmdashmdashmdashmdashmdashmdashmdashmdashmdashmdashmdashmdashmdashmdashmdashmdashmdashmdashmdashmdashmdashmdashmdashmdashmdashmdashmdashmdashmdashmdashmdashmdashmdashmdashmdashmdashmdashmdashmdashmdashmdashndashmdashmdashmdashmdash
Jae Yong Lee Purdue University James Eric Dietz Purdue University
Abstract
The 2018 Stoneman Douglas High School (Parkland)
shooting emphasized the importance of testing active shoot-
er responses for both first-responder communities and the
general public Since the 1999 Columbine massacre the
preparedness for active shooter incidents (ASIs) included
aggressive police tactical responses to neutralize the shoot-
ing threat Currently the runhidefight response for un-
armed individuals has been implemented as part of the ac-
tive shooter response for both the public and private sectors
However despite the RHFrsquos nationwide implementation
there are few studies in the literature to support the effec-
tiveness of RHF Additionally modeling a scenario similar
to the Parkland shooting suggests that the application of
RHF without situational awareness of the shooterrsquos location
could cause higher casualty rates by an average of more
than 126 individuals
In this study the authors compared the casualty rates of
two models The first model consisted only of hide (shelter-
in-place) and run (evacuate) The second model applied the
first modelrsquos components with the automatic door lock sys-
tem which was triggered by discharge detection To ex-
clude human participation and to prevent physiological and
psychological impact agent-based modeling (ABM) was
used to recreate a one-story academic infrastructure with 26
lecture halls and three exits containing 600 unarmed indi-
viduals The flexibility of ABM allows multiple iterations
while manipulating various parameters The ABM approach
in active shooter research also eliminates human error and
logistical issues The outcome of this study evaluates the
effectiveness of an automated door lock system based on
firearm discharge detection with a campus-wide alert sys-
tem to conduct lockdown
Introduction
The term active shooter incident (ASI) may be a familiar
term for the general public Federal Bureau of Investigation
(2016) statistics suggest that the number of active shooter
incidents has risen from 74 (2000-2008) to 191 (2009-
2016) incidents per year Additionally 456 of the active
shooter incidents occur in areas of commerce and 244 in
educational institutions Finally 60 of ASIs were termi-
nated prior to the arrival of law enforcement The increasing
rate of active shooter incidents in the areas of commerce
and educational institutions with short duration challenges
the first responder and the civilian communities to mitigate
such incidents
Law enforcement communities have applied mitigation
tactics such as unified incident command system (FEMA
2017) hosting school resource officers (Scott amp Schwartz
2014) and the formation of contact teams (Scott amp
Schwartz 2014) to mitigate such incidents The most com-
mon ASI response for the civilian population in both private
and public sectors was ldquorunhidefightrdquo (RHF) (City of Hou-
ston 2012) The RHF response was created in 2012 by the
City of Houston under the Federal Emergency Management
Agencyrsquos grant Yet despite the nationwide application of
RHF there is a lack of literature supporting the effective-
ness of RHF to lower casualties during ASIs Additionally
RHF cannot be applied in areas where the unarmed individ-
uals are incapable of fighting the active shooter such as
kindergarten or elementary schools In this study the au-
thors examined the casualty rates of two models The first
model represented an academic infrastructure without any
preventative system The second model applied an automat-
ed door lock system to the first model which was initiated
by the active shootersrsquo first discharge A campus-wide lock-
down was automatically conducted among unarmed individ-
ual agents The door lock system only prevented entry to the
lecture hall which allowed individuals to evacuate the lec-
ture hall Only run and hide were implemented in both mod-
els since they assumed that the majority of unarmed indi-
vidual agents were either kindergarten or elementary school
students who were limited in their ability to fight the shoot-
er
Agent-Based Model
AnyLogic software consists of three major components
discrete event agent-based and system dynamic methods
mdashmdashmdashmdashmdashmdashmdashmdashmdashmdashmdashmdashmdashmdashmdashmdashmdashmdashmdashmdashmdashmdashmdashmdashmdashmdashmdashmdashmdashmdashmdashmdashmdashmdashmdashmdashmdashmdashmdashmdashmdashmdashmdashmdashmdashmdashndashmdashmdashmdashmdash
46 INTERNATIONAL JOURNAL OF ENGINEERING RESEARCH AND INNOVATION | V11 N1 SPRINGSUMMER 2019
mdashmdashmdashmdashmdashmdashmdashmdashmdashmdashmdashmdashmdashmdashmdashmdashmdashmdashmdashmdashmdashmdashmdashmdashmdashmdashmdashmdashmdashmdashmdashmdashmdashmdashmdashmdashmdashmdashmdashmdashmdashmdashmdashmdashmdashmdashndashmdashmdashmdashmdash
that could be used interchangeably For this study the agent
-based method was used predominantly to recreate active
shooter incidents within the educational environment The
model consists of pedestrian and process modeling libraries
which recreates the interaction between an active shooter
and the unarmed individual agents within the model
The benefits of ABM were its ability to measure emergent
phenomena and collect individual agentrsquos interaction with
other agents Additionally ABM can illustrate ldquobehavior
degree of rationality and ability to learn and
evolverdquo (Bonabeau 2002) which was a crucial component
in measuring the cause and effect of hypothesizing what
increased or decreased the casualty rate Finally using
ABM allows active shooter research to be conducted in a
safe environment by eliminating the participantsrsquo potential
to experience post-traumatic stress disorder or other anxie-
ties (DHS 2017) Both models were based on a general
floor plan for an academic institution which was available
in the public domain as a visual aid intended to support the
emergency evacuation plans The floor plan included class-
rooms and hallway corridors which were converted to an
image file and added to the AnyLogic software
Model Physical Infrastructure
The Wall Target Line Service with Lines and Polygonal
Area from the Space Markup section in the Pedestrian Li-
brary were used to model the physical infrastructure The
wall creates a physical barrier within the model which lim-
its the agentrsquos movement For example if a wall is encoun-
tered by an agent within the model the agent seeks alterna-
tive routes by moving away from the obstacle The service
with lines section can send an agent through the wall which
represents an agent passing through the doorway The po-
lygonal area represents lecture hall seats where the agents
remain in one location for the duration of the class Each
lecture hall consists of one attractor as a point of gathering
during the lockdown phase
Model Agents
There were two agents in this model an active shooter
and the unarmed individuals State Configuration ndash Line of
Sight (LOS) and State Configuration ndash Casualty Each agent
carries different states in order to add flexibility to what an
agent can and cannot do depending on the location For
example just because an active shooterrsquos discharge range is
set to 100 feet does not mean that the shooter is capable of
selecting targets through the wall of the lecture hall or
agents in a different hallway section To limit target selec-
tion of the shooter line of sight (LOS) was modeled by
placing agents into different states depending on the loca-
tion In Figure 1 the agentrsquos state under green LOS is col-
ored purple
Figure 1 The change of agentrsquos state by location
Once the agent enters the light blue LOS the agentrsquos state
and color change to cyan Additionally an agent could be
under both green and blue LOS if two areas are merging
Both agents operate under this concept in order to limit tar-
get selection probability based on the physical location
such as hallways or lecture halls The active shooter selects
the target by using a Function within the Agent Library
Each function is coded in Java which selects the shooter
target based on the LOS state followed by the discharge
range One target could be selected per search where the
rate of each search was set to one target within a 212-
second interval Anklam Kirby Sharevski and Dietz
(2015) used the victim interval ratio by the statistics from
the Patrol Response Challenges (Buster 2008) where there
was one victim every 15 seconds by averaging the 65 active
shooter incidents to the number of victims For this study
the shooter casualty interval was based on the Parkland
Shooting (Fausset Kovaleski amp Mazzei 2018) by as-
sessing total death count and the duration of the shooting
The Java function was divided into three sections The
first section was the target selection among the agentrsquos pop-
ulation For instance the shooter searches for one target
among the pool of unarmed individual agents The second
section of the function entails determining the state of the
potential target agent If an agentrsquos state was a casualty
then the function starts over to find a new target If the
agentrsquos state was not a casualty then the function deter-
mines whether the target was within the same LOS state as
mdashmdashmdashmdashmdashmdashmdashmdashmdashmdashmdashmdashmdashmdashmdashmdashmdashmdashmdashmdashmdashmdashmdashmdashmdashmdashmdashmdashmdashmdashmdashmdashmdashmdashmdashmdashmdashmdashmdashmdashmdashmdashmdashmdashmdashmdashndashmdashmdashmdashmdash
ASSESSING THE EFFECTIVENESS OF AN AUTOMATIC DOOR LOCK SYSTEM BY DISCHARGE DETECTION 47
TO LOWER CASUALTIES DURING AN ACADEMIC ACTIVE SHOOTER INCIDENT
mdashmdashmdashmdashmdashmdashmdashmdashmdashmdashmdashmdashmdashmdashmdashmdashmdashmdashmdashmdashmdashmdashmdashmdashmdashmdashmdashmdashmdashmdashmdashmdashmdashmdashmdashmdashmdashmdashmdashmdashmdashmdashmdashmdashmdashmdashndashmdashmdashmdashmdash
mdashmdashmdashmdashmdashmdashmdashmdashmdashmdashmdashmdashmdashmdashmdashmdashmdashmdashmdashmdashmdashmdashmdashmdashmdashmdashmdashmdashmdashmdashmdashmdashmdashmdashmdashmdashmdashmdashmdashmdashmdashmdashmdashmdashmdashmdashndashmdashmdashmdashmdash
48 INTERNATIONAL JOURNAL OF ENGINEERING RESEARCH AND INNOVATION | V11 N1 SPRINGSUMMER 2019
the shooter If the shooter and the unarmed individual were
in the same state then the function evaluates the discharge
range If the potential target does not qualify under either
state the function restarts The third section of the function
executes the act of firearm discharge to the targeted agent
The exchange of fire was modeled by sending a string mes-
sage to the targeted agent The probability of a failed mes-
sage delivery was zero since the execution would occur
immediately Once the message has been received then the
state of the target agent will change to casualty and the
speed of the agent will be set to zero and the color to red
The agentrsquos movement was conducted by the following
blocks from the pedestrian library PedSource PedGoTo
PedService and PedSink PedSource determines the agent
and the rate of entry from the agent to the model For this
model there were two PedSource blocks one for an active
shooter and the other for the unarmed individual agents
TargetLine was used as an entry point which was deter-
mined within the PedSource block Once the agent exits the
model by the PedSource block the agent enters the PedSer-
vice block which allows the agent to enter the lecture hall
The PedService block prohibits the agent from traveling
through the wall which represents a door Each lecture hall
consists of a polygonal area where the agent waits through-
out the model runtime Figure 2 shows how the agentrsquos state
was changed from green to either purple or yellow based on
their location
Figure 2 The change of an agentrsquos state by location
Agents Logic
All 600 unarmed individual (UI) agents enter the model
and move randomly toward the available lecture hall Once
an agent arrives in a lecture hall it will remain at the ran-
domly selected point until the shooting begins Prior to the
shooting all 600 UI agents are distributed within the lecture
halls no UI agents remained in the hallway
The active shooter enters the model without discharging
and continues to advance down the hallway until the in-
class population count reaches 600 Once all 600 UI agents
are in the lecture hall the shooter immediately begins to
discharge UI casualties will always occur in the lecture
hall The shooterrsquos discharging function is set to one casual-
ty per 212 seconds for UI agents that are in range If there
are zero potential targets within the range the 212-second
delays starts over Once the active shooter agent begins
shooting the UI agents will then evacuate to the nearest
exit The shooter will attempt to randomly enter a lecture
hall one after another while running UI agents in the hall-
way are considered as potential targets If the automatic
door lock system is in place the shooter will remain in the
hallway until the model is terminated while having the
same ability to discharge at the running UI agents
The automatic door lock system begins as soon as the
active shooter discharges the first shot The lock system
prevents the active shooter from entering the lecture halls
while still allowing any UI agents inside to evacuate via the
hallway The shooterrsquos discharge initiates the unarmed indi-
vidual agents to either hide (shelter-in-place) or run
(evacuate) from the shooter The hide probability parameter
determines what percentage of UI agents will hide while
the rest will run from the shooter Table 1 shows that if the
hide probability is set to 20 then the remaining 80 will
run toward the nearest exit after exiting the designated lec-
ture hall
Table 1 Hide and run probability parameter manipulation per
iteration
Model Runtime Properties Limitations
and Iterations by Parameter Manipulation
bull The duration of the model was limited to six minutes
which was equivalent to the Parkland Shooting event
(Fausset et al 2018)
bull The casualty rate was limited to one casualty per 212
seconds by the active shooter again based on the
Parkland Shooting event (Fausset et al 2018)
bull The target selection began once all 600 unarmed indi-
viduals entered the lecture halls which limited the
first casualty to occur only in the lecture hall
bull If there were no potential target within the first 212
seconds the shooter required an additional 212 sec-
onds to select another target
Iteration 1 2 3 4 5 6 7 8 9 10 11
Hide 0 1 2 3 4 5 6 7 8 9 1
Run 1 9 8 7 6 5 4 3 2 1 0
mdashmdashmdashmdashmdashmdashmdashmdashmdashmdashmdashmdashmdashmdashmdashmdashmdashmdashmdashmdashmdashmdashmdashmdashmdashmdashmdashmdashmdashmdashmdashmdashmdashmdashmdashmdashmdashmdashmdashmdashmdashmdashmdashmdashmdashmdashndashmdashmdashmdashmdash
bull The unarmed individuals who were hiding in the
lecture hall could not attempt to escape if the shooter
entered the lecture hall
To allow for position and time variation each hide pa-
rameter was run 100 times and measured the following out-
put data
bull Hide parameter (Double)
bull Run parameter (Double)
bull Number of unarmed individuals in the lecture hall
(Integer)
bull Number of unarmed individuals in the hallway
(Integer)
bull Number of unarmed individual casualties (Integer)
bull Number of unarmed individuals who successfully
evacuated (Integer)
bull Number of lecture hall casualties of unarmed individ-
uals (Integer)
Results
Figure 3 suggests a highest average total casualty rate of
943 of 600 (157) where 20 hid and 80 ran to the
nearest exit The lowest average total casualty rate was 423
of 600 (071) where all unarmed individual agents were
seeking shelter within the lecture halls The highest average
hallway casualty rate was 524 of 600 (087) with 80
hide probability where the lowest rate was 360 of 600
(06) with 0 hide probability The highest average lec-
ture hall casualty rate was 479 of 600 (079) with 10
hide probability with the lowest at 0 of 600 (0) with 100
hide probability
Figure 3 Unarmed individual casualty rate by hide (shelter-in-
place) probability without immediate automatic door lock system
Figure 4 shows a comparison of the casualty rate of un-
armed individuals to the automatic door lock system by the
hide (shelter-in-place) probability
Figure 4 Unarmed individual casualty rate by hide (shelter-in-
place) probability with immediate automatic door lock system
Figure 4 suggests the lowest average casualty rate of 115
(019) was reported when all unarmed individuals hide
from the shooter with the automatic door lock mechanism in
place The highest average casualty rate was 98 (163)
where all agents had to evacuate from the lecture hall re-
gardless of the automated lock mechanism The highest
average hallway casualty rate was 647 of 600 (108) with
90 hide probability where the lowest rate was 0 of 600
(0) with 0 hide probability The highest average lecture
hall casualty rate was 381 of 600 (064) with 30 hide
probability with the lowest at 115 of 600 (019) with
100 hide probability
The locations were made up of total hallway and lecture
hall where casualty probabilities were measured based on
two parameter manipulations The first parameter was the
hide probability ranging from 0 where zero unarmed
individuals (UI) evacuated the lecture hall to 100 where
all 600 evacuated to the nearest exit The second was a
Boolean parameter which determined whether the automat-
ic door lock system was in place or not The total casualty
probabilities were calculated by dividing the total number of
casualties by 600 The hallway and the lecture hall casualty
probabilities were calculated by dividing the casualty rates
by the total number of either run or hide casualties For ex-
ample hallway casualty probability was calculated by di-
viding the hallway casualty rate to the total number of evac-
uees Figure 5 compares the UI agentrsquos casualty probability
without the immediate door lock system based on the
agentrsquos location of casualty
Figure 5 illustrates the total hallway and lecture hall cas-
ualty probability based on the hide parameter without the
door lock system The highest total casualty probability was
157 when 20 of unarmed individuals hid and 80 ran
to the nearest exit The lowest total casualty probability was
071 when 100 evacuated to the nearest exit The lec-
mdashmdashmdashmdashmdashmdashmdashmdashmdashmdashmdashmdashmdashmdashmdashmdashmdashmdashmdashmdashmdashmdashmdashmdashmdashmdashmdashmdashmdashmdashmdashmdashmdashmdashmdashmdashmdashmdashmdashmdashmdashmdashmdashmdashmdashmdashndashmdashmdashmdashmdash
ASSESSING THE EFFECTIVENESS OF AN AUTOMATIC DOOR LOCK SYSTEM BY DISCHARGE DETECTION 49
TO LOWER CASUALTIES DURING AN ACADEMIC ACTIVE SHOOTER INCIDENT
mdashmdashmdashmdashmdashmdashmdashmdashmdashmdashmdashmdashmdashmdashmdashmdashmdashmdashmdashmdashmdashmdashmdashmdashmdashmdashmdashmdashmdashmdashmdashmdashmdashmdashmdashmdashmdashmdashmdashmdashmdashmdashmdashmdashmdashmdashndashmdashmdashmdashmdash
mdashmdashmdashmdashmdashmdashmdashmdashmdashmdashmdashmdashmdashmdashmdashmdashmdashmdashmdashmdashmdashmdashmdashmdashmdashmdashmdashmdashmdashmdashmdashmdashmdashmdashmdashmdashmdashmdashmdashmdashmdashmdashmdashmdashmdashmdashndashmdashmdashmdashmdash
50 INTERNATIONAL JOURNAL OF ENGINEERING RESEARCH AND INNOVATION | V11 N1 SPRINGSUMMER 2019
ture hall casualty probability was the highest at 735
when 10 of the unarmed individuals evacuated The low-
est lecture hall casualty probability was 06 when every-
one sought shelter The highest hallway casualty probability
was 353 when 90 hid upon the first discharge The
lowest hallway casualty probability was 0 when 100
hid from the shooter Figure 6 compares the UI agentrsquos cas-
ualty probability with the immediate door lock system
based on the agentrsquos location of casualty
Figure 5 Unarmed individual survival probability by hide (shelter-
in-place) probability without immediate automatic door lock sys-
tem
Figure 6 Unarmed individual survival probability by hide (shelter-
in-place) probability with immediate automatic door lock system
Figure 6 illustrates the total hallway and lecture hall
casualty probability based on the hide parameter with the
door lock system The highest total casualty probability was
158 during the 10 hide probability where the lowest
probability was 019 during the 100 hide probability
The highest lecture hall casualty probability was 5 during
the 10 hide probability where the lowest lecture hall
probability was 019 for the 100 hide probability The
highest hallway casualty probability was 536 during the
90 hide probability The lowest hallway casualty probabil-
ity was 0 for the 100 hide probability Table 2 compares
the total casualty probabilities for the model with and with-
out a door lock
Table 2 Total casualty probability with and without door lock per
iteration
The overall casualty probability decreased by 026 with
the highest casualty rate decrease of 051 with all agents
sheltering in place In contrast the casualty rate increased
by 005 for the 10 hide probability Table 3 compares
the hallway casualty probabilities for the model with and
without a door lock The overall casualty probability in-
creased by 059 with the highest casualty rate increasing
by 183 when 90 sought shelter There was no decrease
in casualty probability for hallway casualties Table 4 com-
pares the lecture hall casualty probabilities for the model
with and without a door lock The overall casualty probabil-
ity decreased by 101 with the highest casualty rate de-
crease of 235 when 10 sought shelter In contrast the
casualty rate increased by 001 when all agents evacuated
Probability Total Casualty
Probability
Survival Probability
Difference
Hide Run
Without
Door
Lock
With
Door Lock
0 100 139 100 -39
10 90 153 158 05
20 80 157 148 -09
30 70 142 141 -01
40 60 134 112 -21
50 50 129 98 -31
60 40 121 94 -27
70 30 113 84 -29
80 20 126 81 -44
90 10 118 75 -44
100 0 71 19 -51
Average
Casualty
Probability
127 101 -26
mdashmdashmdashmdashmdashmdashmdashmdashmdashmdashmdashmdashmdashmdashmdashmdashmdashmdashmdashmdashmdashmdashmdashmdashmdashmdashmdashmdashmdashmdashmdashmdashmdashmdashmdashmdashmdashmdashmdashmdashmdashmdashmdashmdashmdashmdashndashmdashmdashmdashmdash
Table 3 Hallway casualty probability with and without door lock
per iteration
Table 4 Lecture hall casualty probability with and without door
lock per iteration
Conclusions
Assuming locked doors are effective at separating poten-
tial victims from the shooter this study further demonstrat-
ed the value of agent-based models to design effective poli-
cies by testing the impact of automatic door locking tech-
nology on causality rates Using this model shelter-in-place
proved to be an effective strategy for reducing the impact of
an active shooter event with the greatest reduction shown
when all individuals sought to shelter in place The imple-
mentation of an automated door lock system triggered by
discharge detection did decrease the total casualty rate an
average of 026 over 100 simulated iterations The total
lecture hall casualty rate decreased an average of 101
while the total hallway casualty rate increased by 059
While the automatic door locking system did reduce causal-
ities individuals in the hallways also saw an increase in
causalities due to limits in protection from the shooter and
evacuation paths
References
Anklam C Kirby A Sharevski F amp Dietz J (2015)
Mitigating active shooter impact analysis for policy
options based on agentcomputer-based modeling Jour-
nal of Emergency Management 13(3) Retrieved from
httpswwwwmpllcorgojs-242indexphpjem
articleview176
Bonabeau E (2002) Agent-based modeling Methods and
techniques for simulating human systems Proceedings
of the National Academy of Sciences 99(suppl 3)
7280-7287
Buster C (2008) Patrol response challenge NCJRS Law
and Order 56(6) 62-68
City of Houston (2012) RunHideFightmdashReady Houston
Retrieved from httpreadyhoustonwpenginecom
suspicious-activityrun-hide-fight
Department of Homeland Security [DHS] (2017) Active
shooter recovery guide Retrieved from https
wwwdhsgovsitesdefaultfilespublicationsactive-
shooter-recovery-guide-08-08-2017-508pdf
Fausset R Kovaleski S amp Mazzei P (2018) On a day
like any other at a Florida school 6 minutes of death
and chaos The New Y ork Times Retrieved
from httpswwwnytimescom20180216us
stoneman-douglas-shootinghtml
Federal Bureau of Investigation (2016) Quick look 220
Active shooter incidents in the United States between
2000-2016 FBI Retrieved from httpswwwfbigov
aboutpartnershipsoffice-of-partner-engagementactive
-shooter-incidents-graphics
Probability Total Casualty
Probability
Survival Probability
Difference
Hide Run Without
Door Lock
With
Door Lock
0 100 79 102 23
10 90 89 120 31
20 80 96 131 35
30 70 87 111 23
40 60 88 129 40
50 50 101 151 50
60 40 122 180 58
70 30 125 211 86
80 20 192 308 116
90 10 353 536 183
100 0 0 0 0
Average
Casualty
Probability
121 180 59
Probability Total Casualty
Probability
Survival Probability
Difference
Hide Run Without
Door Lock
With
Door Lock
0 100 60 61 01
10 90 735 500 -235
20 80 402 218 -184
30 70 317 212 -106
40 60 203 88 -114
50 50 157 45 -111
60 40 120 37 -83
70 30 107 29 -78
80 20 109 25 -85
90 10 92 23 -69
100 0 71 19 -51
Average
Casualty
Probability
216 114 -101
mdashmdashmdashmdashmdashmdashmdashmdashmdashmdashmdashmdashmdashmdashmdashmdashmdashmdashmdashmdashmdashmdashmdashmdashmdashmdashmdashmdashmdashmdashmdashmdashmdashmdashmdashmdashmdashmdashmdashmdashmdashmdashmdashmdashmdashmdashndashmdashmdashmdashmdash
ASSESSING THE EFFECTIVENESS OF AN AUTOMATIC DOOR LOCK SYSTEM BY DISCHARGE DETECTION 51
TO LOWER CASUALTIES DURING AN ACADEMIC ACTIVE SHOOTER INCIDENT
mdashmdashmdashmdashmdashmdashmdashmdashmdashmdashmdashmdashmdashmdashmdashmdashmdashmdashmdashmdashmdashmdashmdashmdashmdashmdashmdashmdashmdashmdashmdashmdashmdashmdashmdashmdashmdashmdashmdashmdashmdashmdashmdashmdashmdashmdashndashmdashmdashmdashmdash
mdashmdashmdashmdashmdashmdashmdashmdashmdashmdashmdashmdashmdashmdashmdashmdashmdashmdashmdashmdashmdashmdashmdashmdashmdashmdashmdashmdashmdashmdashmdashmdashmdashmdashmdashmdashmdashmdashmdashmdashmdashmdashmdashmdashmdashmdashndashmdashmdashmdashmdash
52 INTERNATIONAL JOURNAL OF ENGINEERING RESEARCH AND INNOVATION | V11 N1 SPRINGSUMMER 2019
Federal Emergency Management Agency [FEMA] (2017)
Incident command system resources Retrieved from
httpswwwfemagovincident-command-system-
resources
Scott M amp Schwartz J (2014) The police response to
active shooter incidents Washington DC Police Ex-
ecutive Research Forum Retrieved from https
wwwpoliceforumorgassetsdocs
Critical_Issues_Seriesthe20police20response
20to20active20shooter20incidents202014pdf
Biographies
JAE YONG LEE is a graduate research assistant in
computer and information technology at Purdue University
He earned his BA in public relations and minor in computer
and information technology in 2017 from Purdue Universi-
ty His research interests include examining the effective-
ness of active shooter response and mitigation policies with
agent-based modeling utilizing AnyLogic Mr Lee may be
reached at jaeleepurdueedu
J ERIC DIETZ is a Professor of Computer and Infor -
mation Technology at Purdue University and the Director of
Purdue Homeland Security Institute He earned his BS and
MS degrees in chemical engineering in 1986 from Rose-
Hulman Institute of Technology and PhD in chemical engi-
neering from Purdue University He had served as Founding
Executive Director for the Indiana Department of Homeland
Security and retired Lieutenant Colonel from the US Army
Dr Dietz may be reached at jedietzpurdueedu
INSTRUCTIONS FOR AUTHORS
MANUSCRIPT FORMATTING REQUIREMENTS The INTERNATIONAL JOURNAL OF ENGINEERING
RESEARCH AND INNOVATION is an onlineprint publi-
cation designed for Engineering Engineering Technology
and Industrial Technology professionals All submissions to
this journal submission of manuscripts peer-reviews of
submitted documents requested editing changes notifica-
tion of acceptance or rejection and final publication of ac-
cepted manuscripts will be handled electronically The only
exception is the submission of separate high-quality image
files that are too large to send electronically
All manuscript submissions must be prepared in
Microsoft Word (doc or docx) and contain all figures im-
ages andor pictures embedded where you want them and
appropriately captioned Also included here is a summary of
the formatting instructions You should however review
the sample Word document on our website (httpijeriorg
formatting-guidelines) for details on how to correctly format
your manuscript The editorial staff reserves the right to edit
and reformat any submitted document in order to meet pub-
lication standards of the journal
The references included in the References section of
your manuscript must follow APA-formatting guidelines In
order to help you the sample Word document also includes
numerous examples of how to format a variety of scenarios
Keep in mind that an incorrectly formatted manuscript will
be returned to you a delay that may cause it (if accepted) to
be moved to a subsequent issue of the journal
1 Word Document Page Setup Two columns with frac14
spacing between columns top of page = frac34 bottom of
page = 1 (from the top of the footer to bottom of
page) left margin = frac34 right margin = frac34
2 Paper Title Centered at the top of the fir st page
with a 22-point Times New Roman (Bold) small-caps
font
3 Page Breaks Do not use page breaks
4 Figures Tables and Equations All figures tables
and equations must be placed immediately after the first
paragraph in which they are introduced And each must
be introduced For example ldquoFigure 1 shows the opera-
tion of supercapacitorsrdquo ldquoThe speed of light can be
determined using Equation 4rdquo
5 More on Tables and Figures Center table captions
above each table center figure captions below each
figure Use 9-point Times New Roman (TNR) font
Italicize the words for table and figure as well as their
respective numbers the remaining information in the
caption is not italicized and followed by a periodmdasheg
ldquoTable 1 Number of research universities in the staterdquo
or ldquoFigure 5 Cross-sectional aerial map of the forested
areardquo
6 Figures with Multiple Images If any given figure
includes multiple images do NOT group them they
must be placed individually and have individual minor
captions using ldquo(a)rdquo ldquo(b)rdquo etc Again use 9-point TNR
7 Equations Each equation must be numbered
placed in numerical order within the document and
introducedmdashas noted in item 4
8 Tables Graphs and Flowcharts All tables graphs
and flowcharts must be created directly in Word tables
must be enclosed on all sides The use of color andor
highlighting is acceptable and encouraged if it provides
clarity for the reader
9 Textboxes Do not use text boxes anywhere in the
document For example tablefigure captions must be
regular text and not attached in any way to their tables
or images
10 Body Fonts Use 10-point TNR for body text through-
out (18 paragraph indention) indent all new para-
graphs as per the images shown below do not use tabs
anywhere in the document 9-point TNR for author
namesaffiliations under the paper title 16-point TNR
for major section titles 14-point TNR for minor section
titles
11 Personal Pronouns Do not use personal pronouns
(eg ldquowerdquo ldquoourrdquo etc)
12 Section Numbering Do not use section number ing
of any kind
13 Headers and Footers Do not use either
mdashmdashmdashmdashmdashmdashmdashmdashmdashmdashmdashmdashmdashmdashmdashmdashmdashmdashmdashmdashmdashmdashmdashmdashmdashmdashmdashmdashmdashmdashmdashmdashmdashmdashmdashmdashmdashmdashmdashmdashmdashmdashmdashmdashmdashmdashndashmdashmdashmdashmdash
INSTRUCTIONS FOR AUTHORS MANUSCRIPT FORMATTING REQUIREMENTS 53
mdashmdashmdashmdashmdashmdashmdashmdashmdashmdashmdashmdashmdashmdashmdashmdashmdashmdashmdashmdashmdashmdashmdashmdashmdashmdashmdashmdashmdashmdashmdashmdashmdashmdashmdashmdashmdashmdashmdashmdashmdashmdashmdashmdashmdashmdashndashmdashmdashmdashmdash
mdashmdashmdashmdashmdashmdashmdashmdashmdashmdashmdashmdashmdashmdashmdashmdashmdashmdashmdashmdashmdashmdashmdashmdashmdashmdashmdashmdashmdashmdashmdashmdashmdashmdashmdashmdashmdashmdashmdashmdashmdashmdashmdashmdashmdashmdashndashmdashmdashmdashmdash
54 INTERNATIONAL JOURNAL OF ENGINEERING RESEARCH AND INNOVATION | V11 N1 SPRINGSUMMER 2019
14 References in the Abstract Do NOT include any
references in the Abstract
15 In-Text Referencing For the fir st occur rence of a
given reference list all authorsmdashlast names onlymdashup
to seven (7) if more than seven use ldquoet alrdquo after the
seventh author For a second citation of the same refer-
encemdashassuming that it has three or more authorsmdashadd
ldquoet alrdquo after the third author Again see the sample
Word document and the formatting guide for references
for specifics
16 More on In-Text References If you include a refer -
ence on any table figure or equation that was not cre-
ated or originally published by one or more authors on
your manuscript you may not republish it without the
expressed written consent of the publishing author(s)
The same holds true for name-brand products
17 End-of-Document References Section List all refer -
ences in alphabetical order using the last name of the
first authormdashlast name first followed by a comma and
the authorrsquos initials Do not use retrieval dates for web-
sites
18 Author Biographies Include biographies and cur -
rent email addresses for each author at the end of the
document
19 Page Limit Manuscr ipts should not be more than
15 pages (single-spaced 2-column format 10-point
TNR font)
20 Page Numbering Do not use page numbers
21 Publication Charges Manuscr ipts accepted for pub-
lication are subject to mandatory publication charges
22 Copyright Agreement A copyr ight transfer agree-
ment form must be signed by all authors on a given
manuscript and submitted by the corresponding author
before that manuscript will be published Two versions
of the form will be sent with your manuscriptrsquos ac-
ceptance email
Only one form is required Do not submit both forms
The form named ldquopaperrdquo must be hand-signed by each
author The other form ldquoelectronicrdquo does not require
hand signatures and may be filled out by the corre-
sponding author as long as heshe receives written per-
mission from all authors to have himher sign on their
behalf
23 Submissions All manuscr ipts and required files and
forms must be submitted electronically to Dr Philip D
Weinsier manuscript editor at philipwbgsuedu
24 Published Deadlines Manuscr ipts may be submit-
ted at any time during the year irrespective of pub-
lished deadlines and the editor will automatically have
your manuscript reviewed for the next-available issue
of the journal Published deadlines are intended as
ldquotargetrdquo dates for submitting new manuscripts as well
as revised documents Assuming that all other submis-
sion conditions have been met and that there is space
available in the associated issue your manuscript will
be published in that issue if the submission processmdash
including payment of publication feesmdashhas been com-
pleted by the posted deadline for that issue
Missing a deadline generally only means that your
manuscript may be held for a subsequent issue of the
journal However conditions exist under which a given
manuscript may be rejected Always check with the
editor to be sure Also if you do not complete the sub-
mission process (including all required revisions) with-
in 12 months of the original submission of your manu-
script your manuscript may be rejected or it may have
to begin the entire review process anew
INTERNATIONAL JOURNAL OF
MODERN ENGINEERING
THE LEADING JOURNAL OF ENGINEERING APPLIED SCIENCE AND TECHNOLOGY
Mark Rajai PhD
Editor-in-Chief California State University-Northridge College of Engineering and Computer Science Room JD 4510 Northridge CA 91330 Office (818) 677-5003 Email mrajaicsunedu
Contact us
wwwiajcorg wwwijmeus
wwwtiijorg
wwwijeriorg
Print ISSN 2157-8052
Online ISSN 1930-6628
TO JOIN THE REVIEW BOARD
bull The International Journal of Engineering Research and
Innovation (IJERI)
For more information visit wwwijeriorg
bull The Technology Interface International Journal (TIIJ)
For more information visit wwwtiijorg
OTHER IAJC JOURNALS
bull Manuscripts should be sent electronically to
the manuscript editor Dr Philip Weinsier
at philipwbgsuedu
For submission guidelines visit
wwwijmeussubmissions
IJME SUBMISSIONS
bull Contact the chair of the International
Review Board Dr Philip Weinsier at
philipwbgsuedu
For more information visit
wwwijmeusijme_editorialhtm
bull IJME was established in 2000 and is the first and
official flagship journal of the International
Association of Journal and Conferences (IAJC)
bull IJME is a high-quality independent journal steered by
a distinguished board of directors and supported by an
international review board representing many well-
known universities colleges and corporations in the
US and abroad
bull IJME has an impact factor of 300 placing it among
the top 100 engineering journals worldwide and is the
1 visited engineering journal website (according to
the National Science Digital Library)
ABOUT IJME
INDEXING ORGANIZATIONS
bull IJME is indexed by numerous agencies
For a complete listing please visit us at
wwwijmeus
SPRINGSUMMER 2009
VOLUME 1 NUMBER 1
IJERI Contact Information
General questions or inquiries about sponsorship of the journal should be directed to
Mark Rajai PhD
Founder and Editor-In-Chief
Office (818) 677-5003
Email editorijeriorg
Department of Manufacturing Systems Engineering amp Management
California State University-Northridge
18111 Nordhoff St
Room JD3317
Northridge CA 91330
The International Journal of Engineer-
ing Research amp Innovation (IJERI) is
the second official journal of the Inter-
national Association of Journals and
Conferences (IAJC) IJERI is a highly-
selective peer-reviewed print journal
which publishes top-level work from all
areas of engineering research innova-
tion and entrepreneurship
IJERI