international journal of fatigue - home | cavs
TRANSCRIPT

International Journal of Fatigue 32 (2010) 1473–1502
Contents lists available at ScienceDirect
International Journal of Fatigue
journal homepage: www.elsevier .com/locate / i j fa t igue
Nanostructurally small cracks (NSC): A review on atomistic modeling of fatigue
M.F. Horstemeyer a,*, D. Farkas b, S. Kim a, T. Tang a, G. Potirniche c
a Center for Advanced Vehicular Systems, Mississippi State University, Mississippi State, MS 39762, USAb Department of Materials Science and Engineering, Virginia Polytechnic Institute and State University, Blacksburg, VA 24061, USAc Department of Mechanical Engineering, University of Idaho, Moscow, ID, USA
a r t i c l e i n f o
Article history:Received 8 June 2009Received in revised form 4 January 2010Accepted 15 January 2010Available online 1 February 2010
Keywords:Embedded atom methodFatigueNanostructurally small crackAtomistic modelingStructural nanomaterials
0142-1123/$ - see front matter � 2010 Elsevier Ltd. Adoi:10.1016/j.ijfatigue.2010.01.006
* Corresponding author.E-mail addresses: [email protected], mfho
a b s t r a c t
Fatigue is one of the most damaging mechanisms in structural components. With the development ofstructural nanomaterials, it is imperative to investigate the fatigue damage phenomena at the atomicscale. To study fatigue behavior at the nanoscale, one must apply non-continuum modeling frameworks,such as molecular statics (MS), molecular dynamics (MD), and Monte Carlo (MC) methods. To date, onlyMD and MS simulations using embedded atom method (EAM) and modified embedded atom method(MEAM) potentials have been conducted, and this paper reviews these simulations of the nanoscale fati-gue-crack growth in nickel and copper including single crystals, bicrystals, and polycrystals. A nanoscalesize middle tension (MT) specimen with the lateral side applied periodic boundary conditions was usedto investigate the fatigue behavior in nickel and copper single crystals. Simulation results revealed thatthe cyclic plastic deformation at the crack tip was the main influencing factor for fatigue-crack growth.Two main nanoscale mechanisms of crack propagation were observed: (1) the main cracks linked withthe voids nucleated in front of crack tip due to high dislocation density generated by the cyclic loading;and (2) the main cracks broke the atomic bonds in the crack plane without much plasticity. For thebicrystals and polycrystals, the grain boundaries exerted resistance to the crack propagation. To studythe interactions between cracks and grain boundaries, four cases of grain boundary interfaces for copperand two cases of grain boundaries for nickel were simulated. In copper bicrystals, the crack path deviatedand moved from one grain to another for high misorientations, while there were voids nucleating at grainboundaries in front of the crack tip that linked back with the main crack. Similar to macroscale fatigue,dislocation substructures were observed to develop in the atomic lattice during cyclic loading. In nickelbicrystals, for large misorientations, the cracks were stopped by grain boundaries. For small misorienta-tions, the crack propagated through the grain boundary, but the growth rate was reduced due to the resis-tance of the grain boundary. Fatigue-crack growth rates for nanocracks were computed and comparedwith growth rates published in the literature for microstructurally small cracks (micron range) and longcracks (millimeter range). A nanostructurally small crack (NSC) was introduced in terms of the CTOD. Thequantified NSC growth rates in copper single crystals were very similar with those experimentally mea-sured for small cracks (micron range) and with those at stress-intensity-factor ranges lower than thethreshold for long cracks (millimeter range). The atomistic simulations indicated that reversible plasticslip along the active crystallographic directions at the crack tip was responsible for advancing the crackduring applied cycling. In the case of single or double plastic slip localization at the crack tip, a typicalMode I fatigue crack arose along a slip band and then grew into a mixed Mode I + II crack growth mech-anism. For crystal orientations characterized by multiple slip systems concomitantly active at the cracktip, the crack advance mechanism was characterized by nanovoid nucleation in the high density nucle-ation region ahead of the crack tip and by linkage with the main crack leading to crack extension. To facil-itate observations of fatigue-crack growth, the simulation of a copper polycrystal was performed at lowtemperature 20 K as well. The crack propagated along persistent slip bands within the grain. The crackpropagated along grain boundaries when the angle between the direction of crack propagation and thegrain boundary was small, while it was impeded by the grain boundary when the angle was large. Theresults obtained for the crack advance as a function of stress intensity amplitude are consistent withexperimental studies and a Paris law exponent of approximately two.
� 2010 Elsevier Ltd. All rights reserved.
ll rights reserved.
[email protected] (M.F. Horstemeyer).

1474 M.F. Horstemeyer et al. / International Journal of Fatigue 32 (2010) 1473–1502
1. Introduction
Fatigue in metallic materials subject to repeated cyclic loadinghas been an active research area since last century and continuesto be a focus of structural materials study. Most investigations offatigue have been performed at the microscale and/or macroscale.Hence, the mechanism of fatigue failure is fairly well understoodwith the crack lengths ranging from a few microns to millime-ters/centimeters. The classic continuum approaches are very pow-erful tool to solve the problems at the macro- or microscale.However, several reasons exist for performing atomic scale simula-tions. First, due to the development of nanomaterials and nano-structures, fatigue will become, at some point, an issue for thedesigners. Without the knowledge base for nanoscale fatigue, thedesigns will not be as robust. Second, macroscale fatigue models,particularly ones with microstructural sensitivities do not coverthe length scale in the atomic region. To garner nanoscale crackgrowth rules in order to get more accurate macroscale predictivetools, atomistic simulations are warranted to provide mechanismunderstanding of grain boundary effects, crystal orientation effects,and driving force versus material resistance effects. Finally, nano-scale fatigue simulations such as those provided in this reviewcan give insight into the fidelity of higher scale mathematical mod-els and micromechanical finite element simulations by either pro-viding the pertinent equations or at least the parameters foralready developed equations.
With respect to multiscale fatigue models, several have recentlybeen developed [1–5] precious few have focused on the nanoscale.Since atomistic modeling is a useful tool to help understand andmodel the motion of each atom in the material, molecular dynam-ics and statics simulations can provide understanding into the dis-location nucleation, motion, and interaction with cracks. Asopposed to continuum theories, atomistic modeling is capable ofproviding insight into solving fatigue problems based more on firstprinciples. As long as the interatomic potential is reliable, it candisclose the fundamental physical mechanisms of fatigue. As such,some questions that have driven the research in atomistic fatigueare the following: can the equations that represent the microstruc-turally small crack growth regimes be used for nanocrack growthsince material resistance is present at both length scales? Can longcrack growth models be used to capture the nanocrack growthrates? Does the crystallographic orientation effect change our par-adigm of small crack growth? Do we see the same mechanisms atthe nanoscale as we do at the microscale and macroscale?
To provide context for the nanoscale fatigue study presentedhere, it is worth mentioning that extensive studies on single crys-tal, bicrystal, and polycrystalline under monotonic loads have beenaccomplished by several researchers. Daw et al. [49] provided anice summary of using embedded atom method (EAM) potentialsfor understanding dislocation nucleation and propagation, applica-tion to hydrogen environments, and issues with free surfaces likecracks. Holian et al. [81] and Abraham et al. [82] were probablythe first to examine large scale parallel computing simulations ofcracks growing via molecular dynamics simulations. Baskes et al.,[57] studied biomaterials interfaces under monotonic loads. Gallet al. [58] conducted molecular dynamics simulations to studythe crack growth of aluminum–silicon biomaterial interfaces. Fanget al. [59] performed Bauchinger effect studies by examining singleand bicrystal nickel specimens to associate the type of dislocationswith reverse yielding effects. Clearly, a whole review is warrantedjust to discuss the plasticity and fracture related to atomistic sim-ulations, but a few seminal papers were mentioned here to providecontext for the nanoscale fatigue discussions ahead.
The fatigue behavior of materials has not been studied exten-sively at atomic level. The basic reason is relate to the difficultiesarising from the associated length and time scales. To the best of
our knowledge, only several researchers conducted the computa-tional study on fatigue-crack growth of face-centered cubic metal,namely, copper and nickel at atomic scale [6–9]. The results ofatomistic simulation by Farkas et al. [9] are consistent with theexperimental results of fracture and fatigue in a bulk nanocrystal-line Ni–Fe alloy carried out by Yang et al. [10] who revealed thatthe fatigue crack in the nc Ni–Fe alloy initiated by nanovoid coales-cence ahead of the dominant crack tip. Nishimura and Miyazaki[11] performed the molecular dynamics simulation of a-Fe toexamine the mechanical behaviors around a crack tip for a systemcontaining both a crack and two tilt grain boundaries under cyclicloading. They proposed that the fatigue-crack growth mechanismis due to the coalescence of the crack and the vacancies causedby the emission and absorption of the dislocations at the cracktip. Chang and Fang [12] analyzed the tensile and fatigue behaviorof nanoscale copper at various temperature using moleculardynamics simulation. They concluded that the effect of increasingtemperature is an increase in fatigue stress and the ductile fractureconfiguration occurred under lower applied stress.
In light of the aforementioned comments, the focus of this pa-per is to present a review on the atomistic modeling of fatigue-crack growth in single crystals, bicrystals, and polycrystals of cop-per and nickel reported in [6–9]. We try to sum up the works per-formed in this field so far. The survey of the literature is included inSections 2–4. We also added some new atomistic fatigue-crackgrowth results in nickel bicrystals and copper polycrystals, whichhad not been published in the literature. The summary is presentedin the final section with thoughts regarding new areas of researchregarding atomistic modeling of fatigue.
2. Simulation method
2.1. Interatomic potentials
In atomistic modeling, the properties of materials can be de-fined by the interatomic potential (to a continuum mechanics per-son, this is the constitutive relationship), which is the basic inputof molecular simulation besides the structural information suchas the initial configuration of atoms, type of atoms and their veloc-ities, etc. The choice of interatomic potential is vital to the simula-tion results. The embedded atom method (EAM) potential wasdevised to solve practical problems in metals with many-bodybonding properties [13,14] and were used the fatigue studies of[6–9]. EAM treats each individual atom as an embedded particlein a host aggregate composed of all the other atoms. The embed-ding energy contributes to the total energy of the system throughthe local electron density where an individual atom is located. TheEAM theory is based on local-density functional principles and itscentral idea is that the cohesive energy of a system can be de-scribed as the energy provided by an atomic system during theembedding process of each constituent atom in that particular sys-tem, as given in the equation
E ¼X
i
Gi
Xj–i
qaj ðRijÞ
!þ 1=2
Xi;jði–jÞ
UijðRijÞ ð1Þ
where G is the embedding energy, qa is the average electron den-sity, Rij is the distance between the atoms i and j and U is the energydue to the electrostatic interaction between two atoms [14]. Asshown Eq. (1), an important assumption is that the embedding en-ergy of any atom (which can be viewed as an impurity) is a functionof the electron density of the host before the atom is added. Thefunctions Gi and Uij are calculated from experimental curve fittingof the lattice parameter, elastic constants, and sublimation and va-cancy formation energies [13]. An improvement to the EAM is themodified embedded atom method (MEAM) potential [15,16]. In

M.F. Horstemeyer et al. / International Journal of Fatigue 32 (2010) 1473–1502 1475
the MEAM, the electron density is given by two terms, the linearsuperposition of the electron densities from the neighbouringatoms and a correction term that takes into account the angularityof the atomic bonds correlated to the shear modulus [16]. The spe-cific form of the atom density function in the MEAM [15] is given by
qai ¼
Xj–i
qaðRijÞ � aX
j–i;k–i
ð1� 3 cos2 hjikqaðRijqaðRikÞÞÞ ð2Þ
where Rij is the distance between atoms i and j, a is the angularityparameter calculated by correlation with the shear modulus and hjik
is the angle between the atoms i, j and k. The form in Eq. (2) waschosen to minimize the distortional energy. The MEAM was shownby [15] to work well for metals and for other types of materials(semiconductors and diatomic gases).
In this paper, MEAM potential was used to simulate the fatigue-crack growth in copper and nickel single crystals and copperbicrystals. The EAM potential was applied to simulate the fati-gue-crack growth in nickel bicrystals and copper nanocrystallinematerials. The simulations utilize an EAM potential for nanocrys-talline Ni [17] and has been tested as part of our previous workdealing with fracture under monotonic loading [18].
Also, if one were to use molecular dynamics to perform fatiguecycling on polymers and/or ceramics, one would probably not needto use EAM or MEAM potentials. A good summary of the class ofbond order formalisms that has proven valuable for covalently
Fig. 1. Lattice orientation analyzed i
bonded systems was given by Brenner [54]. Stoneham et al. [55]summarized the shell model, which is a modification of a pair po-tential, used for ceramics.
2.2. Atomistic model set-up
2.2.1. Single crystalsTo simulate the fatigue-crack growth in copper and nickel sin-
gle crystals, five specimens with different orientations were em-ployed to study the nanoscale fatigue-crack growth in copperand nickel single crystals. These orientations, shown in Fig. 1, are[1 1 1], [1 0 0], [1 1 0], [1 0 1] and [1 2 2], respectively. These orien-tations represented the crystallographic directions correspondingto the y-axis of the specimen along with the loading that was ap-plied. The x-axis represented the crack growth direction, whereasz represented the thickness dimension of each specimen. Five ori-entations of the specimens were chosen for the analysis, since theyconstitute representative directions on the stereographic triangleor the inverse pole figure. In addition, each of these orientationswere characterized by a varying number of slip systems initiallyactive as shown in Table 1. The atomistic models for each of thefive orientations were built with approximate dimensions of36 � 36 � 1.4 nm, in the x-, y- and z-directions, respectively. Thethickness of the model in z-direction is four times of the unit celllength depending on the indices of z-axis after [50,51]. In order
n the single crystal simulations.

Table 1Summary of fatigue-crack growth data in single crystals.
Orientation No. of activeslip systems
Schmidfactor
Propagationmode
Crack extensionmechanism
A [1 1 1] 6 0.272 Mode I DuctileB [1 0 0] 8 0.408 Mode I DuctileC [1 1 0] 4 0.408 Mode I CleavageD [1 0 1] 4 0.408 Mode I + II DuctileE [1 2 2] 2 0.408 Mode I + II Ductile
1476 M.F. Horstemeyer et al. / International Journal of Fatigue 32 (2010) 1473–1502
to verify the effects of z-direction thickness and potential, we havealso performed the simulation on the models with the thickness inz-direction having eight and twelve times of one unit cell lengthusing the potential given by Mendelev et al. [19]. The simulationresults show that the results have converged when there arefour unit cell in z -direction and the results obtained usingMendelev potential have the same trends as those calculated byMEAM [15].
Another nuance related to the boundary conditions is related tothe periodic boundary conditions. Once a dislocation would initiatewithin the specimen, it might cut through the specimen and comethrough the other side looking like a new dislocation. It is, how-
[1 0 ]1
[1 1 1]
[1 1]2
(111)
( 11)1
Y[0 1 2]
[5 2 ]1
X
Z
(a) orientation AA
[ 1 ]5 2 [1 1]2
(111)
[0 1 2]
[5 2 ]1
(111)
[0 1 2]
[1 1]2
(c) orientation CA
Fig. 2. Lattice orientations for the two
ever, just the same one because of the limitation of the periodicity.This phenomena was observed in several other studies where largestrain plasticity was studied as well [52,53]. Although one couldassert that each of the boundaries could act as a grain boundary,where dislocations would nucleate accordingly, it is still a nuanceof the boundary conditions employed. One could imagine thatother types of boundary conditions would induce different disloca-tion behavior and thus affect the specimen behavior. Some whohave studied these effects include the following: this is an oppor-tunity for future studies.
Therefore, in the following investigations, we employ theMEAM [15] to investigate the fatigue-crack growth in copper andnickel single crystals. The periodic boundary conditions were as-signed in the x- and z-directions. Each specimen had an initial cen-tral crack (middle tension configuration). The atomistic specimenswere assigned periodic boundary conditions in the x- and z-direc-tions. Each specimen included an initial central crack (middle ten-sion configuration).
The ratio of the initial crack length to the width of the specimenwas a0/W = 0.1. Cyclic loading was applied at a strain rate of109 s�1. Also, an initial velocity gradient was employed throughoutthe specimen so as to remove the shock moving through thespecimen as per [52].
[7 ]1 5
[ 4 5]3
[1 2 ]1
(111)
[0 1 2]
[ 2 ]5 1
(111)
(b) orientation BA
[ 1 ]5 2
[1 1]2
(111)
[0 ]1 2
[5 2 ]1
[0 1 2]
[1 1]2
(111)
(d) orientation DA
grains in the bicrystal simulations.

θ_2
Fig. 4. Orientation of the corresponding single crystal.
Fig. 5. Specimen used for the simulation of fatigue-crack growth.
M.F. Horstemeyer et al. / International Journal of Fatigue 32 (2010) 1473–1502 1477
2.2.2. BicrystalsIn the bicrystals studied in this work, the notion of small misori-
entation angles and large misorientation angles were analyzedafter the large strain work of Hansen and Hughes [56]. Clearly,more important grain boundaries or ones that are maybe moreprevalent in copper and nickel should be studied, but this presentstudy only examines some idealizations to show the connections tohigher scale models. Work has been conducted at the atomic scalefor bicrystals [70–75] and polycrystals [76–80] by examining typesof dislocations and plasticity but mainly upon monotonic loadingconditions [65–69].
2.2.2.1. Copper bicrystals. Four cases of grain boundary interfaceswere simulated in the study of fatigue-crack growth in copperbicrystals. The general configurations of these bicrystals followthe types experimentally analyzed by Li [20], and they are shownin Fig. 2. The first case AA, shown in Fig. 2a, corresponds to a[0 1 2]–[1 1 1] tilt grain boundary. The z-axis corresponds to the[1 2 1] direction for both neighbouring grains, while the x-axis inthe first grain is represented by the [5 2 1] direction, and in the sec-ond grain by the direction. The second case BA corresponds to a[0 1 2]–[3 4 5] tilt grain boundary and is shown in Fig. 2b. The pri-mary slip directions [1 0 1](1 1 1) in the two adjacent grains aresymmetrical with respect to the vertical grain boundary, forminga 101.3� angle between them. Fig. 2b shows that the primary slipplanes in the two grains are not parallel to each other. The thirdcase CA corresponds to the two grains being oriented in a [0 1 2]tilt symmetric orientation related to the tensile y-axis. The orienta-tion of the x and z axes for each of the grains are shown in Fig. 2c.The two primary slip systems intersect the grain boundary planealong a common axis, and their components in the x -directionare inversely related to each other. The fourth case DA is a [1 2 1]tilt boundary shown in Fig. 2d. The tensile axis is represented inthe first grain by [0 1; 2] direction and in the second grain by[0 1 2]. The primary slip planes (1 1 1) in the two grains are parallelto each other. In each of these cases, the grain on the left had anedge crack. The fatigue loading applied to the specimens was sim-ilar to the loading conditions applied to the single crystal speci-mens and has been described in the previous section.
2.2.2.2. Nickel bicrystals. The bicrystals of nickel comprised twosymmetrically rotated single crystals, as shown in Fig. 3, whichare demarcated by a tilt grain boundary. The orientation of the[1 1 0] axes of the two single crystals were inclined by equal anglesto the [0 0 1] axis. The angle between the [1 1 0] axes of two singlecrystals was defined as h. The size of the specimen was
Fig. 3. Orientation of bicrystal [1 1 0] axes of the two symmetrical single crystalsare inclined by equal angles to the [0 0 1] axis.
42.4 � 28.2 � 1.4 nm, in the x-, y-, and z-directions, respectively.We investigated two cases of grain boundary, namely, ah = 10�small misorientation and ah = 30� large misorientation grainboundary. There was an edge crack on the left edge of each speci-men. For the sake of comparison, we also simulated the fatigue-crack growth in corresponding single crystal as shown in Fig. 4,whose dimensions were the same as those of bicrystals.
The applied cyclic loading was emax = 5 � 10�2 and stress ratioR = emin/emax = 0.8 for the bicrystal nickel simulations. The loadingwas applied along y-direction, and the periodic boundary conditionwas assigned in z-direction.
2.2.3. Nanocrystalline FCC metals2.2.3.1. Copper nanopolycrystalline. Voronoi construction was em-ployed to build the initial atomic configuration [21]. All of thecolumnar grains in the specimens were constructed using the com-mon axis [0 0 1] around which each grain rotated random angles.We made three specimens containing 5, 20, and 40 grains, respec-tively. After the initial generation, the specimens were equilibratedat a temperature of 20 K. To facilitate the propagation of fatiguecrack, the simulation was performed at 20 K also. Each specimenhad an initial edge crack on the left as shown in Fig. 5. The dimen-sions of each specimen are 16 � 16 � 1.4 nm. The increasing max-imum strain fatigue loading as shown in Fig. 29 was applied alongthe y-direction.
2.2.3.2. Nickel nanopolycrystalline. Just like the copper polycrystal-line specimens, the initial nickel atomic configurations used inour studies were generated using a Voronoi construction [21] aswell. The columnar grains in the sample were generated by usinga common [1 1 0] axis for all grains and a random rotation anglearound this axis for the various grains. The sample contained 36

1478 M.F. Horstemeyer et al. / International Journal of Fatigue 32 (2010) 1473–1502
grains with an average grain size of 6 nm. The periodicity along the[1 1 0] axis common to all grains was kept at the lattice periodicityalong that direction. The grain boundaries present in these sampleswere of pure tilt character and had random misorientation angles.After their initial creation, the samples were fully relaxed using aconjugate gradient technique. The initial relaxation included thesimultaneous energy minimization with respect to the total sam-ple volume. The relaxed configuration was then used as a startingconfiguration in both the molecular statics and the dynamics tech-niques to study crack propagation using the same EAM interatomicpotential and cyclic loading.
The simulation of fracture in nickel was conducted differentlythan in the copper nanocrystalline specimens. With the notion ofa semi-infinite crack loaded to a given stress intensity K, the molec-ular dynamics and molecular statics simulations employed dis-placement fields obtained from the elasticity theory for the givenvalue of the stress intensity. The role of the linear elastic contin-uum displacement served as an initial guess for the relaxed atomicconfiguration in all the regions of the simulation. It also served asthe boundary conditions that were kept fixed in the regions farfrom the crack tip. Based on continuum fracture mechanics, theelastic solution should be valid far from the crack tip. The atomicpositions far from the crack tip were held fixed according to theelastic solution during the conjugate gradient routine used inmolecular statics or during a certain number of time steps in themolecular dynamics technique. As the simulation progressed, theloading increased or decreased superposing corresponding dis-placement given by linear elasticity, updating the fixed boundaryconditions to those representatives of a crack with a higher or alower loading level. These displacements were used to simulatecyclic loading by applying a load to a certain stress intensity Kmax
for the first part of the cycle and then superposing displacementscorresponding to reach a lower stress intensity Kmin in the secondpart of the cycle. The cyclic process between the maximum andminimum stress intensities can be simulated with either moleculardynamics or molecular statics. The latter technique simulates anequilibrium configuration in the crack tip at both the minimumand maximum loading points of each cycle. Alternatively, molecu-lar dynamics represents the response of the crack tip at extremelyhigh cycling rates. In the work reported here we used bothtechniques.
The samples were subject to cyclic loading with an averagestress intensity, Kave of 0.96 MPa
ffiffiffiffiffimp
. Four values of the stressintensity amplitude were considered, namely, 1.28, 1.6, 1.76, and2.9 MPa
ffiffiffiffiffimp
. For the molecular dynamics simulations 2000 MDsteps per cycle were used with a time step of 1 � 10�15 s and atemperature of 300 K. Simulations using molecular statics werealso carried out where the crack was allowed to reach a local equi-librium configuration at both the low and the high loading pointsof the cycle. These simulations were therefore representative oflow cycle fatigue where the system has enough time to reach equi-librium as the cycle proceeds. Most importantly, the comparison ofthese two techniques gave an assessment of the importance of thefast time scale in the MD simulations in the mechanisms observedand in the rates of crack advance. The simulations reported herefollow the crack using this technique for 30 cycles. The thresholdstress intensity amplitude observed was about 1–1.1 MPa
ffiffiffiffiffimp
.
2.3. Discussion of effects of boundary conditions
The major difficulty with the nanofatigue simulations is thestrong constraint imposed by using periodic boundary conditionsin the z-direction with a relatively small through-thickness dimen-sion. Some have studied these effects based upon monotonic loads[62–64]. As mentioned earlier, this can give quantitative differ-ences in the results although the qualitative trends would not be
affected as discussed in [50–53]. In these nanofatigue simulations,different crystal orientations have a geometry in which the [1 1 1]slip planes did not contain the out-of-plane line direction and soare oblique to the crack front. This suppresses dislocation emissionon the accepted slip planes arising in FCC materials. Therefore,such complex dislocation behavior in three dimensions remainsas a need for future study.
To verify the effect of thickness in z-direction, we performed theinvestigations on the specimen with Orientation C as shown inFig. 1c. The thickness varied from four unit cell to twenty unit cells.The length of one unit cell was about 0.35 nm, and a uniaxial ten-sion strain in the y-direction was applied up to a total strainof e = 0.06. The averaged stress–strain curves of the different thick-ness specimens are shown in Fig. 19. We observed that the stressdropped once the dislocations nucleated at the crack tips. The ini-tial slope of the stress–strain curve and dislocation nucleationstress were independent of the thickness in the z-direction. Thisimplies that the first dislocation nucleation was not affected bythe specimen thickness. Also, the cyclic loading was applied alongthe y-direction. Fig. 20 shows the crack growth rate decreasedabruptly when the thickness increased from four unit cells to eightunit cells. The results converged at the thickness of 16 unit cells.
2.4. Visualization
We use the centrosymmetry parameter defined by Kelchneret al. [22] to highlight the dislocations in the specimen for the mostpart. This parameter for each atom is given by
P ¼X
i
jRi þ Riþ6j2 ð3Þ
where Ri and Ri + 6 are the vectors corresponding to the six pairs ofnearest opposite neighbors in the FCC lattice. Thus, P = 0 in anundisturbed portion of the lattice, and P becomes large near dislo-cations or free surfaces. The centrosymmetry parameter is a metricintroduced to quantify nanoscale defects. For example, a vacancyrepresents a situation where only individual atoms are displacedfrom their original equilibrium position, while the surrounding lat-tice remains intact. A dislocation in the atomistic model representsa continuous line of atoms with modified centrosymmetryparameters.
Another parameter that we employed for visualization purposeswas the Green strain tensor adapted from Gullett et al. [60]. Thedifferent components of the strain tensor were employed to giveinsight into the centrosymmetry parameter results and also pro-vide fodder for the local plastic shear strain range used in McDo-well et al. [61].
3. Simulation results
3.1. Fatigue-crack growth in single crystals
3.1.1. Copper single crystalsThe loading applied was in a strain-controlled mode with the
maximum strain level of emin = 0.01 and an applied load ratio ofR = emin/emax. This high load ratio for the tension–tension fatigueloading was chosen to prevent the crack faces from contacting eachother, otherwise partial rewelding of the crack faces occurred,leading to difficulty in growing the crack. All atom velocities wereinitiated in the required direction at the beginning of each loadingand unloading half cycle to alleviate the stress wave overlap thatcould arise from the high rate of deformation. Before applyingthe fatigue loading, the temperature in the specimens was equili-brated at 300 K. During fatigue loading for the first 10–15 cycles,we did not observe the mean stress relaxation. However, for most
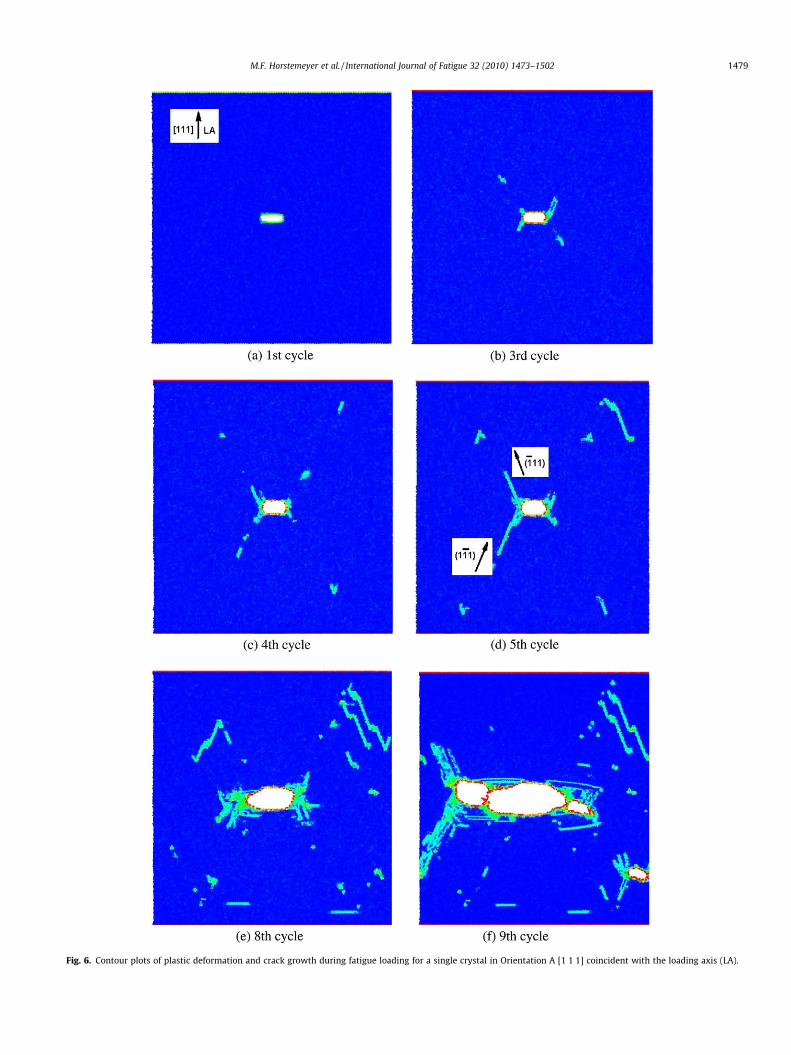
Fig. 6. Contour plots of plastic deformation and crack growth during fatigue loading for a single crystal in Orientation A [1 1 1] coincident with the loading axis (LA).
M.F. Horstemeyer et al. / International Journal of Fatigue 32 (2010) 1473–1502 1479

Fig. 7. Contour plots of plastic deformation and crack growth during fatigue loading for a single crystal in Orientation B [1 0 0].
1480 M.F. Horstemeyer et al. / International Journal of Fatigue 32 (2010) 1473–1502
crystal orientations analyzed, the mean stress stabilization wasrecorded.
The mechanisms of fatigue crack propagation at the macroscalefor long cracks and at the microscale for small cracks have beenstudied intensely [23–25]. These cracks grow as Stage II fatiguecracks at rates up to several microns per cycle. Nanoscale cracksexhibit growth rates in the vicinity of several angstroms per cycle.Using atomistic simulations, insight into the crack propagationmechanisms at the smallest length scales governed by plasticdeformation can be gained. In this section, we show that the plasticprocesses leading to crack propagation at the nanoscale operatesimilarly as in the case of small and long cracks.
Figs. 6–10 show fatigue-crack growth in the specimens indi-cated in Fig. 1a–e. These figures show contour plots of the plasticdeformation around the crack tip at various loading cycles for allfive orientations considered. In the case of Orientation A, shownin Fig. 6, the crack grew in the plane (1 1 1), propagating alongthe [1 1 0] direction, and the view plane is (1 1 2). The two slipbands forming at the crack tip correspond to the directions[1 3 2] and [3 1 2], representing the traces the slip planes (1 1 1)and (1 1 1), respectively on the view plane (1 1 2). The slip bandswere oriented at an angle of 22.2� with respect to the vertical
[1 1 1] orientation. The crack tip exhibited significant bluntingdue to the intense localization of the plastic slip along the two slipbands. An increased dislocation density in front of the crack tipcaused void nucleation and linkup of the voids with the main crackleading to a crack growth increment. Fig. 3 shows the simulationresults from Orientation B. The crack plane was (1 0 0) and propa-gation occurred along [0 1 0] direction. The crack tip plastic zonewas small and localized near the crack tip. Consequently, the cracktip blunting was relatively small, according to the reduced plastic-ity at the crack tip. The propagation mechanism in this case wasvoid nucleation in front of the crack tip and linkage of the void backto the main crack. Since eight slip systems were concomitantly ac-tive at the crack tip, plasticity at the crack tip similar to an isotropiccondition produced high stress triaxialities (Fig. 7).
Fig. 8 shows results from Orientation C with the crack in the(1 1 0) plane and the propagation direction along [1 1 0]. No signif-icant crack tip blunting was observed in this case. Multiple slip ori-entations induced a crack propagation mechanism characterizedby fatigue cleavage of atoms in the (1 1 0) plane.
Fig. 9 shows Orientation D of the atomistic model with the crackin the (1 0 1) plane and propagating in the [0 1 0] direction. Intensedouble slip localization occurred at the crack tip. The two slip

Fig. 8. Contour plots of plastic deformation and crack growth during fatigue loading for a single crystal in Orientation C [1 1 0].
M.F. Horstemeyer et al. / International Journal of Fatigue 32 (2010) 1473–1502 1481

Fig. 9. Contour plots of plastic deformation and crack growth during fatigue loading for a single crystal in Orientation D [1 0 1].
1482 M.F. Horstemeyer et al. / International Journal of Fatigue 32 (2010) 1473–1502

Fig. 10. Contour plots of plastic deformation and crack growth during fatigue loading for a single crystal in Orientation E [1 2 2].
M.F. Horstemeyer et al. / International Journal of Fatigue 32 (2010) 1473–1502 1483

Fig. 11. Crack growth rates from the nanoscale atomistic simulations comparingsmall and long crack growth rates in Cu single and polycrystals. The appliedmaximum strain was emax = 0.02.
Fig. 12. Crack growth rates from the nanoscale atomistic simulations comparingsmall and long crack growth rates in Cu single and polycrystals. The appliedmaximum strain was emax = 0.01 and 0.02.
1484 M.F. Horstemeyer et al. / International Journal of Fatigue 32 (2010) 1473–1502
bands corresponded to the directions [1 2 1] and [1 2 1], represent-ing the intersections of the view plane (1 0 1) with the slip planes(1 1 1) and (1 1 1), respectively. Significant crack tip blunting wasexperienced by the crack due to the plastic slip localization at54.7� with respect to the vertical [1 0 1] direction. Between Cycle2 and Cycle 8, the crack grew under Mode I. Starting at Cycle 9,the crack deviated out-of-plane into mixed Mode I + II of growthalong the primary slip bands. Growth along a crystallographic slipbands has also been observed for larger microstructurally smallcracks within crystallographic grains [26]. The results from Orien-tation E shown in Fig. 10 had a crack located in the (1 2 2) planeand growing in the [2 1 0] direction. A single slip band formed atthe crack tip along the primary slip direction [9 7 1], which is thetrace of the (1 1 1) slip plane with the view plane (1 2 2:5). Plasticshear occurred along the secondary slip system in the [1 7 6] direc-tion, which is the intersection between the (1 1 1) slip plane andthe view plane. The angle between the slip line [9 7 1] and the ver-tical axis [1 2 2] was geometrically calculated to be 43.2�. Crack tipblunting occurred similar to Orientation D as shown in Fig. 1d.Also, similar deviation of the crack was observed, from a Mode Igrowth to a mixed Mode I + II growth along the primary slip band.Deformation bands (DBs) are observed to cover a wide area of thespecimen with even distribution of dislocations, as opposed to theslip bands where the majority of plastic deformation is limited to anarrow band. Usually DBs are highly deformable regions extendingover a large portion of the specimen surface, and they dominatethe cyclic deformation in FCC single crystals [27,28]. A summaryof the main findings from the fatigue-crack growth simulationsin single crystals is shown in Table 1.
To compare the various nanoscale crystal orientation effects, fa-tigue-crack growth rates were computed from the atomistic simu-lations for two strain levels of emax = 0.02 and 0.01. Figs. 11 and 12show the crack growth rates da/dN versus the stress-intensity-fac-tor range DK. The Mode I stress-intensity-factor range has beencalculated using
DK ¼ Kmax � Kmin and K ¼ rffiffiffiffiffiffipap
ð4Þ
where r is the volume average stress in the y-direction calculatedfrom the dipole force tensor of all atoms in the model, and a isthe crack length. The value of the geometrical factor multiplyingthe right-hand side of Eq. (4) was calculated and based upon the dif-ferent atomistic results were not larger than 1.02. Thus, for simplic-ity, in Eq. (4), we assumed this factor to approximate one. Crackgrowth rates da/dN versus DK for an applied strain of emax = 0.02are shown in Fig. 11 The results from this study are compared withexperimental data for microstructural long cracks from the litera-ture. This comparison gives a multiscale view of the fatigue-crackgrowth phenomenon in copper. A few important comments arewarranted. First, nanocracks exhibit growth rates that are compara-ble to those of fatigue cracks from the higher length scales. How-ever, the computed da/dN for nanocracks range between 10�11
and 10�8 m/cycle, while long cracks were found to grow at rateslower than 10�11 m/cycle in the experiments of Marchand et al.[29] in the near-threshold regime, for copper with two grain sizesof 12 and 120 lm, respectively. In polycrystalline copper, Liawet al. [30] recorded da/dN for copper at two heat-treatment condi-tions ranging from approximately 10�10 to values larger than10�7 m/cycle. The crack growth rates computed from our atomisticsimulations were slightly lower than the growth rates experimen-tally measured in copper single crystals oriented for single slip byWang and Mughrabi [31], who found da/dN ranging from5 � 10�9 to 2 � 10�8 m/cycle. Growth rates for microstructurallysmall cracks were measured by Pol‘ak and Li¢skutin [32], and theyindicated a classical small crack effect growing faster than longcracks in single crystals and long cracks.
Crack growth rates from atomistic simulations with a maxi-mum applied emax = 0.01 are shown in Fig. 12 with those of micro-cracks and long cracks in single and polycrystals. For theconvenience of comparison of the values obtained from emax = 0.01and emax = 0.02, we also plotted the atomistic simulation resultsfrom emax = 0.02 in the Fig. 12. The crack growth rates for emax =0.01 were comparable with those for emax = 0.02. From Figs. 11and 12 one can observe that, besides the comparable da/dN, thecrack tip driving force DK values for cracks at different lengthscales were amazingly in the same range. In Fig. 11, the DK valuescomputed for nanocracks ranged from 0.3 to 1.2 MPa
ffiffiffiffiffimp
. Thesevalues for DK were well below the threshold value DKth for longcracks in copper polycrystals experimentally measured atapproximately 2 MPa
ffiffiffiffiffimp
[32]. For an applied maximum strainof emax = 0.01 the crack tip driving force decreased to approxi-mately 0.05 MPa
ffiffiffiffiffimp
. Below this value, the nanoscale cracks inthe present study were observed to become non-propagating,suggesting a threshold between propagating and non-propagating

M.F. Horstemeyer et al. / International Journal of Fatigue 32 (2010) 1473–1502 1485
fatigue cracks at the nanoscale between 0.05 and 2 MPaffiffiffiffiffimp
. How-ever, a more systematic study, using at least one of the well-knownmethods (constant Kmax or constant R) will be required for a rigor-ous characterization of DKth for nanocracks.
The growth rates for nanocracks computed from atomistic sim-ulations indicated that as the applied DK was lowered toward a va-lue of approximately 0.05 MPa
ffiffiffiffiffimp
, the scatter in growth dataincreased considerably. On the contrary, for larger DK values, thecrack growth rates do not exhibit significant scatter, and the datatends to be positioned on a well-defined line on the da/dNversus DK plot. This suggests the existence of a Paris [33] regimefor nanocracks. For the computations with the applied maximumstrain level of emax = 0.02, the Paris equation obtained by curve fit-ting the crack growth data for DK P 1.06 MPa
ffiffiffiffiffimp
is
dadN¼ CðDKÞm ð5Þ
where, C and m are constants with C = 3.149 � 10�10 and m = 3.504.Similar curve fitting for the data in Fig. 12, for emax = 0.01, resultedin C = 2.387 and m = 9.05 � 10�10.
Based on the results obtained from the atomistic simulationsand comparison with fatigue-crack growth data shown in Figs.11 and 12, a map of crack growth rate distributions for cracks rang-ing from the nanoscale to macroscale can be drawn. In Fig. 13, sucha map is shown, indicating distinct regions for growth rates of fa-tigue cracks of various lengths. At the smallest length scale, withnanocrack lengths ranging between 1 nm and 1 lm, the crackgrowth rates da/dN can vary from approximately 10�11 to5 � 10�10 m/cycle depending on the crystal orientation, for an ap-plied stress intensity range, DK, from a threshold value of approx-imately 0.05 to 2 MPa
ffiffiffiffiffimp
, respectively. In this regime, nanocracksgrow under the influence of discrete dislocations and atomic mo-tion, such as plastic slip localization along crystallographic planesand vacancy formation. The next level in material length scale isrepresented by microstructural cracks with lengths ranging from1 lm to approximately 1 mm. Fatigue-crack growth mechanismsare influenced mainly by the microstructural features encounteredby the fatigue crack during its growth history. Among these, themost important are grain boundaries [34], inclusions, and constit-uent particles [35]. The region on da/dN versus DK plot for micro-structural cracks is above the one for nanocracks. Based onexperimental results [32], microstructural cracks in copper havea growth rate between 5 � 10�10 and approximately 2 � 10�8 m/cycle for the same applied values of DK. The largest length scale
Stress intensity factor range ΔK [MPa m1/2]0.1 0.2 0.4 0.60.81 2 4 6 8 10
Cra
ck g
row
th ra
te d
a/dN
[m/c
ycle
]
10-12
10-11
10-10
10-9
10-8
10-7
10-6
10-5
10-4
Nanostructural cracks
Microstructuralcracks
Long cracks
Fig. 13. Crack growth rate map for fatigue cracks ranging from nanoscale tomacroscale in copper single and poly-crystals.
for fatigue cracks is represented by long cracks, larger than1 mm. For this type of crack, the only governing mechanism isthe plastic deformation in the wake and at the crack tip. Thegrowth of long cracks is observed usually for DK values larger thanapproximately 2 MPa
ffiffiffiffiffimp
. As DK is increased, the crack growth of along crack can be represented by a Paris Law type Eq. (5).
Traditionally, for long cracks, researchers have considered thatthe crack growth increment during a cycle is a fraction of the cracktip opening displacement (DCTOD) range. This is supported by thereversible crack tip blunting processes [23]. However, in the case ofsmall cracks, a breakdown of the linear elastic fracture mechanicsprinciple occurs [24,25]. The growth rates of small cracks can bemuch larger than those for long cracks, which makes the incrementin growth rate sometimes equal to DCTOD. In the case of fatiguenanocracks, such a topic has not been studied either experimen-tally or computationally. Correlation of the crack growth rate da/dN versus the DCTOD for nanocracks is shown in Fig. 6. The CTODwas measured at a very short distance behind the crack, usuallybetween 1 and 2 nm, where the crack tip blunting ended and thecrack faces became flat. At any position, the dependence of da/dNversus DCTOD is represented by
dadN¼ cDCTOD ð6Þ
where c is a constant determined from atomistic computations. Theconstant c is observed to vary from one orientation to another. Forexample, the constant c has a low value of 0.38 in the case of orien-tation [1 0 0], while it has similar values of 1.25 and 1.52 for orien-tations [1 1 1] and [1 0 1], respectively. The simulations in the caseof orientation [1 2 2] required a large value of 2.16 for the constantc. In addition, values greater than one for the constant c for someorientations imply that the fatigue damage progressed rapidly atthe nanoscale. An explanation for this situation is that, in the caseof nanocracks, the crack length a, crack growth increment da/dN,and opening displacement range DCTOD are all of comparabledimensions, in the range of nanometers. On the contrary, at themicroscale, da/dN is approximately two to three orders of magni-tude smaller than a (Fig. 14).
3.1.2. Nickel single crystalsDislocation substructures that arose during the cyclic loading at
constant strain amplitude were analyzed, and the main results arepresented in Figs. 15 and 16. The fatigue loading applied had amaximum strain of emax = 5 � 10�3 and a ratio of R = emin/emax =0.5. The high load ratio was chosen in order to prevent the innerfaces of the void from contacting each other during unloading.From previous simulations, it was observed that contact of thecrack surfaces led to the welding of the crack faces which led to dif-ficulty in propagating the crack. All the specimens were cyclicallyloaded up to 11 cycles at which point the simulations werestopped. Fig. 15 presents the dislocation structures observedduring the cyclic loading. These patterns varied widely from oneorientation to another. In the case of Orientation A [1 1 1] crystal-lographic direction, the nickel single crystal experienced a tripleslip pattern with the three main shear bands nucleating from thesmall circular void. One of the shear bands aligned with the x-direction, corresponding to the [1 1 0] direction, while the othertwo shear bands were positioned symmetrically about the [1 1 1]direction (y-axis). In the case of Orientation B, with the loadingin the [1 0 0] direction, practically very little plastic deformationwas experienced by the single crystal, and the slip was localizednear the void. Orientation C [1 1 0] indicates that the dislocationswere organized in vein-like structures in some parallel bands alongthe [1 1 0] direction, very similar to the dislocation structuresobserved experimentally by Zhang [28]. In the case of OrientationD, with loading applied in the [1 0 1] direction, the crystal

Crack tip opening displacement range ΔCTOD (10-10 m)0 2 4 6 8 10 12 14
Cra
ck g
row
th ra
te d
a/dN
(10-1
0 m
/cyc
le)
0
10
20
30
40
A [111]
da/dN ~ 1.25*ΔCTOD
Crack tip opening displacement range ΔCTOD (10-10 m)3210
Cra
ck g
row
th ra
te d
a/dN
(10-1
0 m
/cyc
le)
0
1
2
3
B [100]
da/dN ~ 0.38*ΔCTOD
Crack tip opening displacement range ΔCTOD (10-10 m)0 1 2 3 4 5 6
Cra
ck g
row
th ra
te d
a/dN
(10-1
0 m
/cyc
le)
0
2
4
6
8
10D [101]
da/dN ~ 1.52*ΔCTOD
Crack tip opening displacement range ΔCTOD (10-10 m)0 2 4 6 8 10 12 14 16 18
Cra
ck g
row
th ra
te d
a/dN
(10-1
0 m
/cyc
le)
0
10
20
30
40E [122]
da/dN ~ 2.16*ΔCTOD
Fig. 14. Representation of crack growth rate (da/dN) versus cyclic crack tip opening displacement (DCTOD) for orientations A [1 1 1], B [1 0 0], D [1 0 1] and E [1 2 2].
Fig. 15. Plastic slip patterns in nickel single crystal near a small circular void duringfatigue loading at constant strain amplitude with emax = 0.005 and emin/emax = 0.5.All plots were taken at a 0.0045 applied strain during unloading, except the plot forOrientation B that was taken during loading.
1486 M.F. Horstemeyer et al. / International Journal of Fatigue 32 (2010) 1473–1502
experienced a double slip pattern. Most plastic deformation in thisorientation is localized in the shear bands emanating from thevoid. Smaller voids and crack-like voids are nucleated in the vicin-ity of the main void as a result of the intense plastic deformation in
the shear bands, phenomenon also observed experimentally byZhang [28]. The cyclic stress–strain curves for the first eleven cy-cles are shown in Fig. 16. A dominant feature of all orientationsis that for the first nine cycles, the plastic deformation was verysmall, but still noticeable in the change of the overall slope ofthe stress–strain behavior and some plastic energy dissipated dur-ing the hysteresis loops of the loading and unloading during eachcycle. For all orientations, beginning with Cycle 10, a sudden in-crease in the slope of the stress–strain behavior was observed, asa result of the plastic strain localization in dislocations bands. Nick-el single crystals in Orientation A exhibited triple slip substruc-tures resulting in the largest stress 14 GPa in Cycle 10 at thepeak strain. The smallest stress arose from Orientation B to about9.9 GPa in Cycle 10. From Fig. 16 it can be concluded that afterthe first fatigue cycles, the onset of significant plastic deformationoccurred very suddenly with a stress burst during the tenth load-ing cycle. The crystal orientation determined the configuration ofdislocation structures in the shear bands, but it had no influenceon the cycle at which the single crystal experienced the first largeincrease in stress hardening.
3.1.3. Comparison between fatigue-crack growth in copper and nickelsingle crystals
Comparison between all orientations for nickel and copper areshown in Fig. 17. The results indicated that the crack growth ratewas highly dependent on the orientation of both crystals. For thefirst six cycles when the crack was small, and it did not enter yetthe zone where the edge effect was dominant, the largest crackgrowth rate was experienced by Orientation C [1 1 0]. In this case,

Orientation A [111]
Applied strain ε22
2.0x10⁻³ 2.5x10⁻³ 3.0x10⁻³ 3.5x10⁻³ 4.0x10⁻³ 4.5x10⁻³ 5.0x10⁻³ 5.5x10⁻³
Aver
age
stre
ss σ
22 [G
Pa]
02468
1012141618202224
9
123
8
CycleLoading
Unloading11
10
Orientation B [100]
Applied strain ε22
2.0x10⁻³ 2.5x10⁻³ 3.0x10⁻³ 3.5x10⁻³ 4.0x10⁻³ 4.5x10⁻³ 5.0x10⁻³ 5.5x10⁻³
Aver
age
stre
ss σ
22 [G
Pa]
0
2
4
6
8
10
12
14
9
123
78
Cycle10
LoadingUnloading
Orientation C [110]
Applied strain ε22
2.0x10⁻³ 2.5x10⁻³ 3.0x10⁻³ 3.5x10⁻³ 4.0x10⁻³ 4.5x10⁻³ 5.0x10⁻³ 5.5x10⁻³
Aver
age
stre
ss σ
22[G
Pa]
0
2
4
6
8
10
12
14
16
18
20
9
123
78
Cycle
10
11LoadingUnloading
Orientation D [101]
Applied strain ε22
2.0x10⁻³ 2.5x10⁻³ 3.0x10⁻³ 3.5x10⁻³ 4.0x10⁻³ 4.5x10⁻³ 5.0x10⁻³ 5.5x10⁻³
Aver
age
stre
ss σ
22[G
Pa]
0
2
4
6
8
10
12
14
16
18
9
123
78
Cycle
10
11LoadingUnloading
Fig. 16. Cyclic stress–strain curves for the nickel specimens indicated in Fig. 1. The loading was cyclic at constant strain amplitude with emax = 0.005 and emin/emax = 0.5.
Number of cycles2 4 8 10 12 14 16 18
Cra
ck le
ngth
(10-
10 m
)
0
50
100
150
200
250
300
350
400 A[111]
B[100]
C[110]
D [101]
Nickel
Number of cycles1 2 3 4 5 6 7 8 9 10
Cra
ck le
ngth
(10-1
0 m)
0
50
100
150
200
250
300
350
400A
[1 1 1] B[1 0 0]
C[1 1 0]
D[1 0 1]
Copper
6
Fig. 17. Variation of total crack length with number of cycles. Comparison between different crystal orientations.
M.F. Horstemeyer et al. / International Journal of Fatigue 32 (2010) 1473–1502 1487
the rapid crack growth can be associated with the very little cracktip blunting observed. The smallest crack growth rate for bothnickel and copper is shown by Orientation D [1 0 1]. By comparingthe crack growth rates of individual orientations in Fig. 18, it can beobserved that copper exhibited crack growth rates larger thannickel. When the loading was oriented in the [1 1 1] direction, bothnickel and copper experienced double slip structures with theshear bands symmetrically oriented with respect to the loadingdirection. The third shear band along [1 1 0] observed in the caseof fatigued nickel near a small circular void, was not observed very
significant in the crack growth simulations; however, the crackmaintained a planar configuration, propagating along this thirdshear direction. The [1 0 0] orientation revealed a planar crackpropagation in the case of nickel with small voids nucleating infront of the crack that were coplanar with the crack, while coppersingle crystals experienced void nucleation at 45� from the hori-zontal direction around the crack tip. In the [1 1 0] orientationthe void formation was not significant for the fatigue crack propa-gation mechanisms. The crack tip did not experience significantblunting, and the propagation mechanism involves mainly tearing
Number of cycles
Cra
ck le
ngth
(10-1
0 m)
0
50
100
150
200
250
300
350
400
Cu NiOrientation A [1 1 1]
Number of cycles
Cra
ck le
ngth
(10-1
0 m)
0
50
100
150
200
250
300
350
400Cu Ni
Orientation B [100]
Number of cycles
Cra
ck le
ngth
(10-1
0 m)
0
50
100
150
200
250
300
350
400
Cu Ni
Orientation C [110]
Number of cycles
1 2 3 4 5 6 7 8 9 1 2 3 4 5 6 7 8 9 10
1 2 3 4 5 6 7 8 9 10 11 12 13 0 1 2 3 4 5 6 7 8 9 10 11 12
Cra
ck le
ngth
(10-1
0 m)
0
20
40
60
80
100
120
140Cu NiOrientation D [1 0 1]
(a) (b)
(c) (d)Fig. 18. Comparison of crack growth with number of cycles between nickel and copper single crystals for each Orientation A–D.
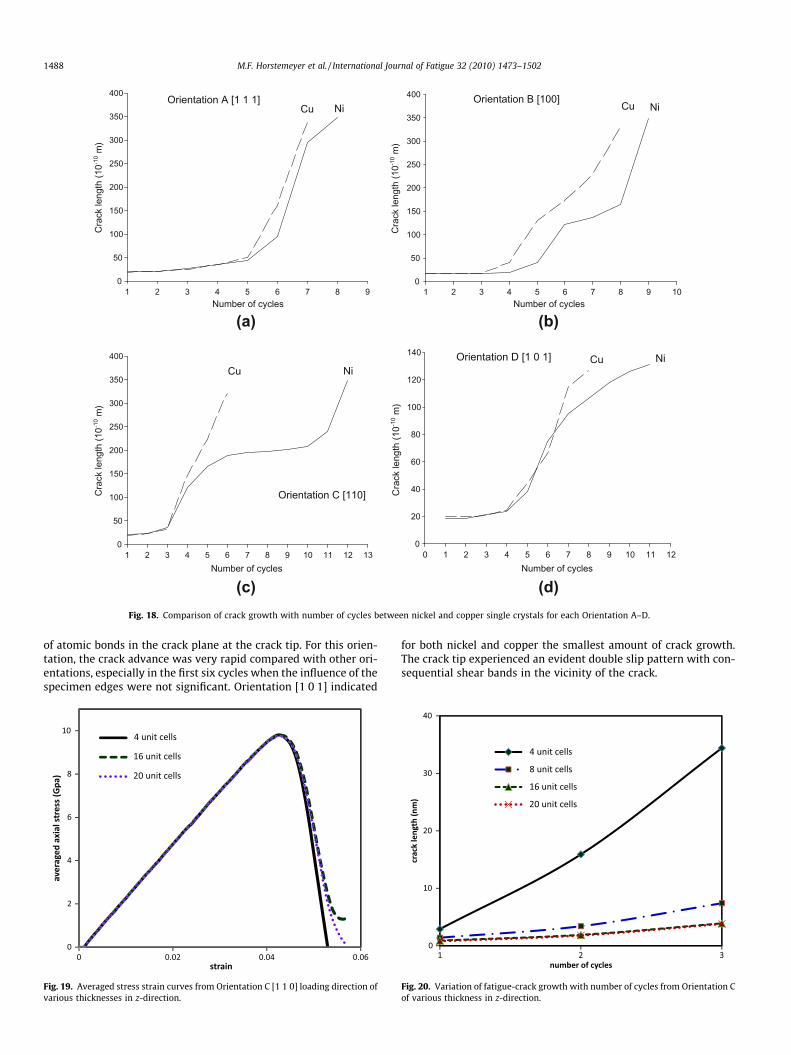
1488 M.F. Horstemeyer et al. / International Journal of Fatigue 32 (2010) 1473–1502
of atomic bonds in the crack plane at the crack tip. For this orien-tation, the crack advance was very rapid compared with other ori-entations, especially in the first six cycles when the influence of thespecimen edges were not significant. Orientation [1 0 1] indicated
Fig. 19. Averaged stress strain curves from Orientation C [1 1 0] loading direction ofvarious thicknesses in z-direction.
for both nickel and copper the smallest amount of crack growth.The crack tip experienced an evident double slip pattern with con-sequential shear bands in the vicinity of the crack.
Fig. 20. Variation of fatigue-crack growth with number of cycles from Orientation Cof various thickness in z-direction.

Fig. 21. Simulation of fatigue crack growing toward the grain boundary for the bicrystal AA. The formation of veins or regions with large concentration of dislocations is illustrated.
M.F. Horstemeyer et al. / International Journal of Fatigue 32 (2010) 1473–1502 1489
3.2. Fatigue-crack growth in bicrystals
Grain boundaries play an essential role in determining the resis-tance of fatigue crack propagation in materials [33,26,20,36]. In
this section, the influences of grain boundary on the fatigue-crackgrowth in copper and nickel bicrystals were investigated. TheMEAM potential was used for copper, and the EAM potential wasused for nickel.

1490 M.F. Horstemeyer et al. / International Journal of Fatigue 32 (2010) 1473–1502
3.2.1. Fatigue-crack growth in copper bicrystalsFig. 21 illustrates the fatigue-crack growth process for the first
tilt grain boundary AA. Fig. 21a shows the initial configuration ofthe specimen. Starting at Cycle 2, the crack tip blunted and devel-oped two distinct slip bands at the crack tip. The upper slip bandwas formed by plastic shear on the primary slip system[1 0 1](1 1 1). The angle between the trace of this slip system onthe view plane (1 2 1) and the vertical tensile axis [0 1 2] is50.76�. The lower slip band is due to plastic slip on the conjugateslip system [1 0 1](1 1 1). The trace of this slip system on the planeof view (1 2 1) is the [3 2 1] direction and forming a 61.41� anglewith the vertical axis. At Cycle 9, the crack deviated along the pri-mary slip band into a mixed Mode I + II crack growth. At Cycle 10,due to the stress concentration effect of the grain boundary, thetwo slip bands active at the crack tip became more diffuse, withthe crack tip plasticity being spread out more evenly around thecrack tip. At Cycle 11, near the grain boundary void nucleationwas observed in front of the crack tip in the region with a fairlyhigh density of dislocations. The nucleated void joined back withthe main crack and induced the crack propagation into the adja-cent grain. Large crack tip blunting was observed at the passageof the crack into the second grain. During loading from Cycle 2 toCycle 15, the development of grain substructures occurred in thespecimen. SBs formation along the primary slip system was ob-served in the first grain. The SBs were parallel to the primary slipdirections. Also, regions with high and low dislocation densitieswere observed in the specimen after Cycle 10. The second grainalso experienced substructuring in dislocation cells, mainly in thebeginning of the fatigue process while the crack was still in the firstgrain.
In Fig. 22 the simulation results of the second grain boundarymisorientation BA are shown. From the loading conditions andthe orientation of the crystalline lattice in the two grains, crackpropagation was more difficult as the crack moved toward thegrain boundary. At the left edge of the specimen, the crack expe-rienced partial closure. Some important dislocation substructuresdeveloped in the two grains. In the first grain, a slip band at thesame orientation as in the case of grain boundary tilt AA was ob-served. This slip band was caused by plastic slip along the pri-mary slip system [1 0 1](1 1 1). Around the crack tip, differentstress states can be identified in Fig. 22a. Behind the crack tip, re-gions with vacancies and veins can be identified. At the grainboundary, voids nucleated at the interface between the twograins. In the second grain, slip bands nucleated from the grain
Fig. 22. Simulation of fatigue crack growing toward the grain boundary for the bicrystanarrow regions as slip bands (SBs) undergoing intense plastic deformation is illustrated
boundary along the slip system [1 0 1](1 1 1). In this case, a largeconcentration of dislocations at the grain boundary was observeddue mainly to the difficulty of dislocations to cross from one grainto another.
The grain boundary tilt CA crack growth is shown in Fig. 23.After the first cycle, the crack developed a slip band along the pri-mary slip system [1 0 1](1 1 1). SBs also formed in the specimenparallel to each other and in the general direction of the primaryslip system. Outside the SBs, the density of dislocations was verysmall. Due to the easy transfer of dislocations across the grainboundary, the density of dislocations at the interface betweenthe two grains was very small. The formation of veins and the in-crease in their volume fraction with applied loading was anothernoticeable feature for boundary tilt CA. No deviation of crack pathout-of-plane was recorded. For the cases of grain boundary tilt AAand CA, the orientation of the first grain from which the crack orig-inated was the same. The difference between the two cases was theorientation of the second grain. By comparing these two cases AAand CA (Figs. 21 and 23), we draw the conclusion that long beforereaching the grain boundary, the crack tip plasticity and implicitlythe kinetics of crack growth was influenced by the orientation ofthe adjacent grain. In the CA boundary tilt, as opposed to AA, thedislocations easily crossed the grain boundary. As no slip band for-mation occurred at the crack tip, and thus, no crack deviation out-of-plane was experienced by the crack. In addition, because thegrain boundary did not create any difficulty for dislocations to passthrough (relatively low intergranular constraint), no grain sub-structuring was observed in the case CA as opposed to case AA.During the crack propagation, the crack plane showed distinctivefatigue striations as recorded by the crack position at differentcycles.
In the case of grain boundary tilt DD shown in Fig. 24, two slipbands formed at the crack tip. The upper slip band was created byplastic slip along the primary slip direction [1 0 1](1 1 1), while thelower slip band was caused by plastic shear along the secondaryslip direction [1 0 1](1 1 1). Comparing grain boundary tilt AA withDA (Figs. 10 and 13), one can compare the difference betweenthem. Even though the orientation for the first grain was the same,different conjugate slip systems were activated to create the lowerslip band at the crack tip. Given the same orientation of the initialcracked grain, due to the different intergranular constraint inducedby the adjacent grain, different slip systems can be activated at thecrack tip to create the conjugate slip band. After approximatelyeleven cycles for Orientation DA, the crack deviated from a Mode
l BA. Formation of vacancies (atoms displaced from their equilibrium position), and.

M.F. Horstemeyer et al. / International Journal of Fatigue 32 (2010) 1473–1502 1491
I crack growth into a mixed Mode I + II along the primary slipdirection due to a larger Schmid Factor on the primary slip bandas compared with the corresponding value for the conjugate slipband. As the crack grew near the grain boundary, at Cycle 12, a voidnucleated at the bicrystal interface, causing the crack to changedirections. For the grain boundary tilt DA, the SBs were generallyoriented along the primary slip direction [1 0 1](1 1 1), with thefamiliar ladder-like structuring of dislocations within two SBs.
Fig. 23. Simulation of fatigue crack growing tow
Outside the SBs, the dislocation density was very low, leading toan increased hardness of the matrix material compared with thesofter material within the SBs. As in the case of other grain bound-ary tilt cases, the DA interface subjected to fatigue loading devel-oped veins, which induced greater volume fractions as fatiguedamage accumulated. A summary of the main findings from thefatigue-crack growth simulations in bicrystals is presented inTable 2.
ard the grain boundary for the bicrystal CA.

Fig. 24. Simulation of fatigue crack growing toward the grain boundary for the bicrystal DA.
Table 2Summary of fatigue-crack growth data in bicrystals.
Grain boundary tilt Misorientation (degree) Dislocation structures Propagation mode Crack extension mechanism
AA [0 1 2]/[1 1 1] 39.23 Grain substructuring, veins, slip bands Mode I + II Ductile
BA [0 1 2]/½34 5� 55.77 Slip bands, vacancies – –CA [0 1 2]/[0 1 2] 37.39 Veins, slip bands Mode I DuctileDA [0 1 2]/½012� 60 Veins slip bands Mode I + II Ductile
1492 M.F. Horstemeyer et al. / International Journal of Fatigue 32 (2010) 1473–1502

M.F. Horstemeyer et al. / International Journal of Fatigue 32 (2010) 1473–1502 1493
3.2.2. Fatigue-crack growth in nickel bicrystalsThe simulation of fatigue-crack growth in bicrystal with a large
misorientation and the corresponding single crystal are shown inFigs. 25 and 26, respectively. These figures show that the crackwas impeded by the grain boundary in the bicrystal. Figs. 27 and28 show the fatigue crack propagation in the bicrystal with a smallmisorientation and the corresponding single crystal, respectively.In the bicrystal, the crack can go through the grain boundary, butits growth rate was obviously lowered by the grain boundary.
Fig. 25. Simulation of fatigue-crack growth toward grain boundary for h = 30� at13th cycle. The crack stops growing in front of the grain boundary at 5th cycle.
Fig. 26. Simulation of fatigue-crack growth in corresponding single crystal forh/2 = 15� at 13th cycle.
Fig. 27. Simulation of fatigue-crack growth toward grain boundary for h = 10� at13th cycle.
Fig. 28. Simulation of fatigue-crack growth in corresponding single crystal for h/2 = 5� at 13th cycle.
Fig. 29. Increasing maximum strain loading.
3.3. Fatigue-crack growth in nanocrystalline
3.3.1. Fatigue-crack growth in nanocrystalline copperFigs. 30–32 illustrate the evolution of fatigue-crack growth for
the nanocrystalline cu specimen containing five grains. Fig. 30shows the centrosymmetry parameter, and Fig. 31 shows the asso-ciated uniaxial Green strain illustrating the fairly large local strains(50%) at the grain boundaries near the crack tip; Fig. 30a alsoshows the initial configuration of the specimen. The crack propa-gated along persistent slip bands within the grain. At the sixth cy-cle, it encountered the grain boundary. Then the crack propagatedalong the grain boundary and traversed into another grain. Thecrack growth in the specimen with 20 grains is illustrated inFig. 33. The crack grew within the grain by the mechanism ofatomic cleavage. It encountered the triple point of grain boundariesat the fourth cycle. After that, the crack propagated along grainboundary.
Fig. 34 shows the simulation results in the specimen containing40 grains. The crack also propagated along a persistent slip bandwithin the grain. When the crack reached grain boundary, itstopped growing due to the resistance of grain boundary. In all ofthe cases, the formation of the dislocation structure due to cyclicloading was observed in different grains. The crack propagatedalong grain boundaries when the angle between the direction ofcrack propagation and the grain boundary was small, while itwas impeded by the grain boundary when the angle was large.Hence, the tortuosity of the fracture path is a function of the crystalorientations, local misorientations between grains, and grain size.
3.3.2. Fatigue-crack growth in nanocrystalline nickelThe crack propagation of nanocrystalline nickel is shown in
Fig. 35, where the position of the crack tip is plotted as a functionof the number of cycles. The slopes in this type of plot were

Fig. 30. Centrosymmetry parameter is shown for the simulation of fatigue-crack growth in polycrystal containing five grains for nanocrystalline copper.
1494 M.F. Horstemeyer et al. / International Journal of Fatigue 32 (2010) 1473–1502
computed for each of the stress intensity amplitudes considered.Fig. 36 shows the resulting rates of crack advance calculated using
molecular dynamics for the three values of the stress intensityamplitude. The figure also shows the results of molecular statics

Fig. 31. The uniaxial strain component (Green strain 22) is shown for the fatigue-crack growth in polycrystal containing five grains for nanocrystalline copper. Note thestrains near the grain boundaries.
M.F. Horstemeyer et al. / International Journal of Fatigue 32 (2010) 1473–1502 1495
and the available experimental data for nanocrystalline Ni by Han-lon et al. [37].
The results show that crack advance rates are not very sensitiveto the technique as the molecular dynamics and molecular staticsgiving similar results. This suggests that the molecular dynamicsresults do not have major spurious effects due to the unrealistically
high loading rates. To further establish confidence in these results,we studied the basic mechanisms of crack advance using bothtechniques. For both cases, we observed a continuous increase inthe number of dislocations present in the crack tip region as thecrack advanced, and the formation of nanovoids or vacancy clus-ters ahead of the main crack. Fig. 37 shows the number of disloca-

Fig. 32. The shear strain component (Green strain 12) is shown for the fatigue-crack growth in polycrystal containing five grains for nanocrystalline copper. Note in Cycle 8the crack path oriented toward the local shear strain.
1496 M.F. Horstemeyer et al. / International Journal of Fatigue 32 (2010) 1473–1502
tions and nanovoids observed as the cyclic deformation pro-gressed. Fig. 38 shows crack tip configurations corresponding to
Cycles 1, 12, and 20. The simulations shown in Figs. 37 and 38 wereconducted using molecular statics at a stress intensity amplitude of

Fig. 33. Centrosymmetry parameter for the simulation of fatigue-crack growth in polycrystal containing 20 grains for nanocrystalline copper.
M.F. Horstemeyer et al. / International Journal of Fatigue 32 (2010) 1473–1502 1497
1.28 MPaffiffiffiffiffimp
. Frames on the left side of Fig. 38 are for maximumloading conditions, whereas frames on the right show the mini-mum loading configurations. The visualization in Fig. 38 is carriedout using the local hydrostatic stress calculated for each atom. Thegray scale shows areas under tension as light gray and areas undercompression in darker shades. The visualization technique requiresan assumption regarding the local atomic volume for each atom,which we considered constant. The technique allows the visualiza-tion of the damage, including stacking faults that are the result ofthe emission of partial dislocations from the grain boundaries.
In Fig. 39 we show greater detail of the configuration of the tipas the crack is loaded to the maximum stress intensity after 26 and31 cycles. The main mechanism of crack advance is the formationof vacancy clusters ahead of the crack tip that result from the plas-tic deformation in the tip region. The results in this figure were ob-tained using a static technique where the crack reached localequilibrium at both the high and the low loading points of each cy-cle. The results obtained using molecular dynamics were similar innature, also showing the formation of nanovoids ahead of the maincrack. This mechanism of the crack advance was also observed inthe monotonic fracture simulation studies of Ni that we carried
out previously [18]. We note that crack advance and the formationof the nanovoids under monotonic loading occurred at stress inten-sity amplitudes that were two to three times higher than thoseused here as the maximum loading. The formation of nanovoidsin a grain boundary ahead of the main crack seems to be a generalfailure mechanism in nanocrystalline materials depending on theorientation as evidenced in the copper as well. In the present sim-ulations we find that these nanovoids were created by the presenceof dislocations emitted from the crack tip. In Fig. 39 we can seenanovoids both within the grain where the crack tip was locatedand at the grain boundary. The nanovoids within the grain were re-lated to the presence of two or more dislocations in adjacentplanes. The arrival of the dislocations to the grain boundary regionalso caused the formation of nanovoids, as the dislocations couldnot cross into the adjacent grain. We observed a distribution ofthese nanovoids that was essentially confined to the grain wherethe crack tip was located, with most of the dislocations being un-able to continue to glide across the grain boundaries.
It is encouraging to note that our results yield four points in thecurve of crack advance versus stress intensity amplitude that arevery consistent with the experimental measurements in nanocrys-

Fig. 34. Centrosymmetry parameter for the simulation of fatigue-crack growth in polycrystal containing 40 grains for nanocrystalline copper.
1498 M.F. Horstemeyer et al. / International Journal of Fatigue 32 (2010) 1473–1502
talline Ni. The results as illustrated in Fig. 36 show that our simu-lations are in the Paris Law regime. This can be related to the smallsize scale of the microstructural features in our sample. The size ofour cyclic plastic zone is comparable to the grain size, as shown in
Fig. 35. Crack advance as a function of the number of cycles observed in a staticsimulation with DK = 1.28 MPa
pm.
Fig. 38, the point where a transition to a Paris regime typicallyoccurs [38]. Our results imply a Paris Law exponent of about two,indicated by the line in Fig. 36. This exponent is expected from
Fig. 36. Rate of crack advance for both molecular statics and dynamics simulationstogether with experimental results by Hanlon et al. [37].

Fig. 37. The number of dislocations and nanovoids present in the crack tip region asthe cyclic loading proceeds for nanocrystalline nickel.
M.F. Horstemeyer et al. / International Journal of Fatigue 32 (2010) 1473–1502 1499
deformation controlled geometrical models that are based on cracktip opening displacement which are related to the square of thestress intensity amplitude [38].
One Paris Law model with an exponent of two is described byWeertman [39] for fatigue-crack growth controlled by crack tipblunting. In this model, the crack growth rate is given by da/dN = b(DK/2 g Kc)2 (Eq. (10.37) in [39]), where da/dN is the crackgrowth rate per cycle, b is the Burgers vector, g is the ratio betweencritical stress-intensity-factors for dislocation emission and cleav-age, and Kc is the critical stress intensity for cleavage. Using a valueof 0.9 for the ratio g, the Burgers vector of a Shockley partial dislo-cation of 0.144 nm and a value of 0.96 MPa
ffiffiffiffiffimp
for Kc, we obtainda/dN = 0.087DK2, with da/dN in nm per cycle and the stress inten-sity in MPa
ffiffiffiffiffimp
. This compares well with the best fit line obtainedfrom our four data points which is da/dN = 0.095DK2 in the sameunits. This good agreement suggests that the crack advance processobserved here is controlled by crack tip blunting caused by disloca-tion emission. Alternatively, one can use a simpler formulation alsodescribed by Weertman [40] for a similar model which gives da/dNof the order of (DK/G)2. This for Ni would imply da/dN = 0.173DK2
in the same units, which is again of the order of our best fit values.The models that give da/dN of the order of (DK/ryield)2 or DK2/G � ryield would significantly overestimate the current results.
To further support our conclusion that the crack advance iscontrolled by blunting caused by dislocation emission, Fig. 40shows a plot of the crack tip position versus the total cumulativeblunting caused by dislocation emission. The total cumulativeblunting values in this figure were obtained from the total num-ber of dislocations observed in the sample, multiplying by theprojected Burgers vector. We assumed that all dislocations emit-ted from the crack tip caused blunting of the crack. The data inFig. 38 indicate that the total crack advance is of the order ofthe total cumulative blunting that can be attributed to the dislo-cations observed in the sample.
Regarding the threshold stress, the values we obtained (about1 MPa
ffiffiffiffiffimp
) also compare very well with the model estimate ofGb1/2 [40] which gives 0.91 MPa
ffiffiffiffiffimp
. The threshold value foundhere also is of the order of the estimates based on dislocationdynamics models [41–44] of 3 � 10�6 E
ffiffiffiffiffimp
, which for a value ofthe Young modulus E of 200 GPa gives 0.6 MPa
ffiffiffiffiffimp
. For stressintensity amplitudes just above the threshold value, we obtaincrack advance rates that are of the order of an interatomic distance,consistent with the analysis given by Weertman [40].
Although we see evidence of damage accumulation in the sam-ple, as shown in Fig. 38, the predicted Paris Law exponent based ondamage accumulation models is four [38], which does not agreewith our results. This can be related to the presence of grainboundary material in the immediate vicinity of the source of dislo-cation emission. For the nanocrystalline materials studied here, thedislocations that are emitted from the crack tip interact with thegrain boundaries present in the crack tip zone at very short dis-tances from where they are emitted. Typically, many dislocationstravel to a nearby grain boundary and are then absorbed. The grainboundaries themselves contribute to accommodating plasticity, ashas been shown in many studies of deformation of nanocrystallinematerials [45]. The models based on damage accumulation arebased on calculations of the field of a distribution of dislocations,as in the model by Weertman [46], or on a calculation of the energybalance necessary for crack advance, as in the model by Rice [47].The particularities related to the very small grain sizes and largefraction of grain boundaries of the nanocrystalline materials dis-cussed above are not taken into account. The very small grain sizesalso promote a more homogeneous distribution of the damage, asdiscussed by Misra and co-workers [48].
4. Summary and future directions
In this paper, we reviewed the research, which is fairly recent,related to atomistic modeling of fatigue-crack growth in FCC met-als at the nanoscale and have added some new simulation resultsto provide understanding of nanostructurally small cracks (NSC).In single crystals, fatigue damage was caused by persistent slipband formation, and crack growth was simulated using centercrack specimens. The crack tip plasticity formation determinedby the number of active slip systems was the main influencing fac-tor for the propagation of nanocracks. The crystallographic orienta-tion played an essential role in determining the particular type ofdislocation structure experienced in single crystals. For orienta-tions resulting in double slip at the crack tip, the plasticity local-ized in the two active slip bands leading to significant crack tipblunting. In such a situation, the crack propagated along one ofthe slip bands, leading to a mixed Mode I + II crack growth. For ori-entations resulting in multiple slip systems concomitantly active atthe crack tip, the plastic deformation was distributed more evenlyaround the crack tip similar to isotropic hardening, yielding a dif-fuse isotropic plastic zone. In general, the propagation mechanismfor nanocracks included void nucleation in front of the crack tipwith a high density of dislocations and then the void linked backto the main crack to incur crack growth. In other situations, crackpropagation involved only cleavage of atomic bonds in the crackplane leading to crack extension.
The molecular dynamics simulations revealed that NSC growthrates based upon the CTOD were found to be comparable withthose of microstructural cracks, but significantly greater than thoseof long cracks. In addition, nanoscale cracks were found to grow atstress-intensity-factor ranges well below the commonly acceptedvalues for long cracks. This indicates that improved multiscale the-ories of fatigue damage progression in metals, cannot neglect theseaccelerated crack growth rates for cracks in the nanometer range.
Analysis of crack growth at grain boundaries revealed that forhigh misorientation angles, the crack path deviated at the grainboundary. For high misorientation angles between the active(1 1 1) planes, grain boundaries acted as barriers, which trappeddislocations. For no misorientation of the active (1 1 1) planes inthe two grains, the dislocations easily crossed the grain boundary.In this case, the grain boundary became almost indistinctive fromthe surrounding grains with the prevalent features being disloca-tion structures. The atomistic simulations revealed the formation

Fig. 38. Crack tip configurations for cycles 1, 12, and 20 for nanocrystalline nickel. Molecular statics with DK = 1.28 MPap
m. Left frames are for maximum loading and rightframes for minimum loading.
1500 M.F. Horstemeyer et al. / International Journal of Fatigue 32 (2010) 1473–1502
of different dislocation structures, such as slip bands and veinstructures, based on the crystallographic orientation. In addition,vacancy formation was observed during the fatigue simulations.Due to the different stress regions created at the crack tip andthe intergranular constraint between the two adjacent grains, weobserved the formation of dislocation cells and walls. The atomisticsimulations also clearly revealed that, according to different tilt an-gles of the grain boundaries, different slip systems could be acti-vated at the same time. In general, the nanocrack followed theslip band path with the highest resolved shear stress. In the vicinityof the grain boundary, the crack growth mechanism was governedby the void nucleation and slip band formation.
The first atomistic studies of fatigue behavior in Ni nanocrystal-line materials showed a Paris Law exponent of two, and a mecha-nism that was dominated by the role of the dislocations emittedfrom the crack tip, with a crack advance that blunted because of
the emitted dislocations. Our results are consistent with experi-mental measurements of crack advance rates [30]. Furthermore,the nanovoids found ahead of the crack tip are in agreement withsimulations and experimental transmission electron microscopyresults obtained for monotonic fracture [38].
Clearly, MD and MS fatigue simulations have recently been usedto reveal mechanisms at the nanoscale but for greater impact sev-eral new research endeavors are warranted:
1. To date, only FCC metals have been investigated. BCC and HCPmaterials need to be examined since many structural materialssuch as iron, steel, magnesium, titanium might find their wayinto nanostructural materials.
2. Because of the ‘‘welding” that occurs in the R = �1 simulations,an increasing applied load was used to characterize the nano-scale crack growth. Clearly, different R-values and boundary

Fig. 40. Crack tip position plotted as a function of the total cumulative bluntingcaused by dislocation emission for nanocrystalline nickel.
Fig. 39. Crack tip configurations for 26 (left) and 31 (right) cycles for nanocrystalline nickel. Molecular statics with DK = 1.28 MPap
m. Frames show maximum loading.
M.F. Horstemeyer et al. / International Journal of Fatigue 32 (2010) 1473–1502 1501
conditions for that matter are needed to examine the differentstress state effects that could be observed in nanostructuralmaterials.
3. Temperature dependent nanoscale cyclic plasticity and fatiguehas yet to be studied. MD and MC could be used to quantifythe temperature effects at different applied strain rates(frequencies).
4. The bridge between atomistic scale fatigue and dislocation den-sity fatigue simulations needs to be defined and used for multi-scale materials modeling. This in turn, could motivate thedevelopment of microstructurally small crack modeling effortsfrom a physical basis.
5. Quantifying high cycle fatigue is an issue currently with MS,MD, and/or MC methods so garnering larger time periods wouldbe of research interest.
6. Methods to get more realistic boundary conditions from higherscale conditions are warranted in order to get quantitativelymore precise crack growth values. Currently, we can get severaldislocations in these molecular dynamics simulations, andsometimes the small length of the specimens admits more dis-locations where larger scale grains would not otherwise induce.
7. Because strain levels of 0.01 are required to grow a crack in MDwith only one local defect (void or crack), one might speculatethat in engineering materials, where many defects are present,
lower strains can induce the crack growth because of the manydefects.
8. Including molecular dynamics studies with probabilistic distri-butions of microstructures and grain boundaries that lead tomacroscale fatigue predictive tools can also be a fruitful endea-vor. The single crystal, simple bicrystal, and simple polycrystal-line studies conducted to date provide only a starting point forNSC behavior.
Acknowledgements
MFH, TT, and SK would like to acknowledge the Center for Ad-vanced Vehicular Systems (CAVS) at Mississippi State Universityfor supporting this work.
References
[1] Vinogradov, Hashimoto S. Multiscale phenomena in fatigue of ultra fine grainmaterials: an overview: special issue on the progress in understanding ofmaterials fracture. Mater Trans JIM 2001;42:74–84.
[2] Sih GC. Modeling of multiscale fatigue crack growth: nano/micro and micro/macro transitions, virtual testing and predictive modeling. Springer; 2009. p.187–219.
[3] Fish J, Yu Q. Computational mechanics of fatigue and life predictions forcomposite materials and structures. Comput Method Appl Mech Eng2002;191:4827–49.
[4] Van KD. Introduction to fatigue analysis in mechanical design by themultiscale approach. Springer-Verlag; 1999.
[5] Oskay C, Fish J. Modeling of fatigue of ductile materials. Int. J. Comp. MultiscaleEng 2004.
[6] Potirniche GP, Horstemeyer MF, Jelinek B, Wanger GJ. Fatigue damage in nickeland copper single crystals at nanoscale. Int J Fatigue 2005;27:1179–85.
[7] Potirniche GP, Horstemeyer MF. On the growth of nanoscale fatigue cracks.Philos Mag Lett 2006;86:185–93.
[8] Potirniche GP, Horstemeyer MF, Gullett PM, Jelinek B. Atomistic modeling offatigue crack growth and dislocation structuring in FCC crystals. Proc Roy SocA, London 2006;462:3707–31.
[9] Farkas D, Willemann M, Hyde B. Atomistic mechanisms of fatigue innanocrystalline metals. Phys Rev Lett 2005;94:165–502.
[10] Yang Y, Imasogie B, Fan GJ, Liaw PK, Soboyejo WO. Fatigue and fracture of abulk nanocrystalline nife alloy. Metall Mater Trans A 2008;39A:1145–56.
[11] Nishimura K, Miyazaki N. Molecular dynamics simulation of crack growthunder cyclic loading. Comput Mater Sci 2004;31:269–78.
[12] Chang Win-Jin, Fang Te-Hua. Influence of temperature on tensile and fatiguebehavior of nanoscale copper using molecular dynamics simulation. J PhysChem Solids 2003;64:1279–83.
[13] Daw MS, Baskes MI. Semiempirical, quantum, mechanical calculation ofhydrogen embrittlement in metals. Phys Rev Lett 1983;50:1285–8.
[14] Daw MS, Foiles SM, Baskes MI. The embedded-atom method: a review oftheory and applications. Mater Sci Rep 1993;9:251–310.
[15] Baskes MI. Modified embedded-atom potentials for cubic materials andimpurities. Phys Rev B 1992;46:2727–33.

1502 M.F. Horstemeyer et al. / International Journal of Fatigue 32 (2010) 1473–1502
[16] Baskes MI. Determination of modified embedded atom method parameters fornickel. Mater Chem Phys 1997;50:152–8.
[17] Mishin Y, Farkas D. Interatomic potentials for monoatomic metals fromexperimental data and ab initio calculations. Phys Rev B 1999;59:3393–407.
[18] Farkas D, Van Swygenhoven H, Derlet PM. Intergranular fracture innanocrystalline metals. Phys Rev B 2002;66:101–4.
[19] Mendelev MI, Kramer MJ, Ott RT, Sordelet DJ, Yagodin D, Popel P. Developmentof suitable interatomic potentials for simulation of liquid and amorphous Cu–Zr alloys. Philos Mag 2009;89:967–87.
[20] Li C. On the interaction among Stage 1 short crack, slip band and grainboundary: a FEM analysis. Int J Fract 1990;43:227–39.
[21] Van Swygenhoven H, Farkas D, Caro A. Grain-boundary structures inpolycrystalline metals at the nanoscale. Phys Rev B 2000;62:831–8.
[22] Kelchner CL, Plimpton SJ, Hamilton JC. Dislocation nucleation and defectstructure during surface indentation. Phys Rev B 1998;58:11085–8.
[23] Laird C. The influence of metallurgical structure on the mechanisms of fatiguecrack propagation fatigue crack propagation. ASTM STP Am Soc Test Mater1967;415:131.
[24] Miller KJ. The behavior of short fatigue cracks and their initiation part I – areview of two recent books. Fatigue Fract Eng Mater Struct 1987;10:75–91.
[25] Miller KJ. The behavior of short fatigue cracks and their initiation part ii – ageneral summary. Fatigue Fract Eng Mater Struct 1987;10:93–113.
[26] Zurek K, James MR, Morris WL. The effect of grain size on fatigue growth ofshort cracks. Metal Mater Trans 1982;14A:1697–705.
[27] Buque C. Dislocation structures and cyclic behavior of [0 1 1] and [11-1]-oriented nickel single crystals. Int J Fatigue 2001;23:671–8.
[28] Zhang ZF, Wang ZG, Sun ZM. Evolution and microstructural characteristics ofdeformation bands in fatigued copper single crystals. Acta Mater2001;102:2875–86.
[29] Marchand NJ, Bailon J-P, Dickson JI. Near-threshold fatigue crack growth incopper and alpha-brass: grain-size and environmental effects. Metal Trans A1988;19A:2575–87.
[30] Liaw PK, Leax TR, Logsdon A. Near-threshold fatigue crack growth behavior inmetals. Acta Metal 1983;31:1581–7.
[31] Wang R, Mughrabi H. Fatigue of copper single crystals in vacuum and in air, II:fatigue crack propagation. Mater Sci Eng 1984;65:235–43.
[32] Pol‘ak J, Liskutın. Nucleation and short crack growth in fatigued polycrystallinecopper. Fatigue Fract Eng Mater Struct 1990;13:119–33.
[33] Paris PC, Erdogan F. A critical analysis of crack propagation laws. J Basic Eng1960;85:528–34.
[34] Potirniche GP, Daniewicz SR. Analysis of crack tip plasticity formicrostructurally small cracks using crystal plasticity theory. Eng FractMech 2003;70:1623–43.
[35] Fan J, McDowell DL, Horstemeyer MF, Gall KA. Computational micromechanicsanalysis of cyclic crack tip behavior for microstructurally small cracks in dual-phase Al–Si alloys. Eng Fract Mech 2001;68:1687–706.
[36] Li C. On crystallographic crack transfer across interfaces in four types ofaluminum bicrystal. Mater Sci Eng A 1994;183:23–30.
[37] Hanlon T, Kwon YN, Suresh S. Grain size effects on the fatigue response ofnanocrystalline metals. Scripta Mater 2003;49:675680.
[38] Suresh S. Fatigue of materials. second ed. Cambridge (England): CambridgeUniversity Press; 1998.
[39] Weertman J. Dislocation based fracture mechanics. first ed. Singapore: WorldScientific Publishing; 1996.
[40] Weertman J. In: Soboyejo WO, Srivatsan TS, editors. High cycle fatigue ofstructural materials. Warrendale (PA): The Minerals, Metals and MaterialsSociety (TMS) of the AIME; 1997. p. 1–48.
[41] Deshpande VS, Needleman A, Van der Giessen E. Discrete dislocation modelingof fatigue crack propagation. Acta Mater 2002;50:831–46.
[42] Deshpande VS, Needleman A, Van der Giessen E. Discrete dislocation plasticitymodeling of short cracks in single crystals. Acta Mater 2003;51:1–15.
[43] Deshpande VS, Needleman A, Van der Giessen E. Scaling of discrete dislocationpredictions for near-threshold fatigue crack growth. Acta Mater2003;51:4637–51.
[44] Deshpande VS, Needleman A, Van der Giessen E. A discrete dislocation analysisof near-threshold fatigue crack growth. Acta Mater 2001;49:3189–203.
[45] Kumar KS, Van Swygenhoven H, Suresh S. Mechanical behavior ofnanocrystalline metals and alloys. Acta Mater 2003;51:5743–74.
[46] Weertman J. Int J Fract Mech 1966;2:460.[47] Rice JR. Fatigue crack propagation, vol. 415. Philadelphia: ASTM; 1967. p. 247.[48] Misra A, Kung H, Hammon D, Hoagland RG, Nastasi M. Damage mechanisms in
nanolayered metallic composites. Int J Damage Mech 2003;12:365–76.[49] Daw MS, Foiles SM, Baskes MI. The embedded-atom method: a review of
theory and applications. Mater Sci Rep, A Rev J 1993;9(7–8):251–310.[50] Horstemeyer MF, Baskes MI. Atomistic finite deformation simulations: a
discussion on length scale effects in relation to mechanical stresses. J EngMater Tech Trans ASME 1999;121:114–9.
[51] Horstemeyer MF, Baskes MI, Hughes DA, Godfrey A. Orientation effects on thestress state of molecular dynamics large deformation simulations. Int J Plast2002;18:203–9.
[52] Horstemeyer MF, Plimpton SJ, Baskes MI. Size scale and strain rate effects onyield and plasticity of metals. Acta Mater 2001;49:4363–74.
[53] Horstemeyer MF, Baskes MI, Plimpton SJ. Computational nanoscale plasticitysimulations using embedded atom potentials. In: George Sih, editor. Prospectsin mesomechanics. Theor Appl Fract Mech, 2001;37(1–3):49–98.
[54] Brenner DW. Chemical dynamics and bond-order potentials. MRS Bull1996:36–41.
[55] Stoneham M, Harding J, Harker T. The shell model and interatomic potentialsfor ceramics. MRS Bull 1996:29–35.
[56] Hansen N, Hughes DA. Analysis of large dislocation populations in deformedmetals. Phys Stat Solid: B 1995;149:155–72.
[57] Baskes MI, Angelo JE, Bison CL. Atomistic calculations of composite interfaces.Model Simulat Mater Sci Eng 1994;2:505–18.
[58] Gall KA, Horstemeyer MF, Van Schilfgaarde M, Baskes MI. Atomisticsimulations on the tensile debonding of an aluminum–silicon interface. JMech Phys Solids 2000;48:2183–212.
[59] Fang H, Horstemeyer MF, Baskes MI, Solanki K. Atomistic simulations ofBauschinger effects of metals with high angle and low angle grain boundaries.Comput Methods Appl Mech Eng 2004;193:1789–802.
[60] Gullett PM, Horstemeyer MF, Baskes MI, Fang H. Deformation gradient tensorand strain tensors for atomistic simulations. MSMSE 2008;6:1–17.
[61] McDowell DL, Gall K, Horstemeyer MF, Fan J. Microstructure-based fatiguemodeling of cast A356-T6 alloy. Eng Fract Mech 2003;70:49–80.
[62] Deng C, Sansoz F. Fundamental differences in the plasticity of periodicallytwinned nanowires in Au, Ag, Al, Cu, Pb and Ni. Acta Mater2009;57(20):6090–101.
[63] Sansoz F, Molinari JF. Size and microstructure effects on the mechanicalbehavior of FCC bicrystals by quasicontinuum method. Thin Solid Films2007;515(6):3158–63.
[64] Warner DH, Curtin WA. Origins and implications of temperature-dependentactivation energy barriers for dislocation nucleation in face-centered cubicmetals. Acta Mater 2009;57(14):4267–77.
[65] Rittner JD, Seidman DN. Limitations of the structural unit model. Mater SciForum 1996;207–209(1):333–6.
[66] Tschopp MA, McDowell DL. Structures and energies ofP
3 asymmetric tiltgrain boundaries in copper and aluminium. Philos Mag 2007;87(22):3147–73.
[67] Tschopp MA, McDowell DL. Asymmetric tilt grain boundary structure andenergy in copper and aluminium. Philos Mag 2007;87(25):3871–92.
[68] Olmsted David L, Holm Elizabeth A. Survey of computed grain boundaryproperties in face-centered cubic metals-II: grain boundary mobility foiles. In:Stephen M, editor. Acta Mater, 2009;57(13):3704–13.
[69] Olmsted David L, Foiles Stephen M, Holm Elizabeth A. Survey of computedgrain boundary properties in face-centered cubic metals: I. Grain boundaryenergy. Acta Mater 2009;57(13):3694–703.
[70] Zhou Lang, Zhang Hao, Srolovitz David JA. Size effect in grain boundarymigration: a molecular dynamics study of bicrystal thin films. Acta Mater2005;53(20):5273–9.
[71] Kim Ki Jung, Yoon Jang Hyuk, Cho Min Hyung, Jang Ho. Molecular dynamicssimulation of dislocation behavior during nanoindentation on a bicrystal witha R = 5(210) grain boundary. Mater Lett 2006;60(28):3367–72.
[72] Wang L, Zhang HW, Deng X. Influence of defects on mechanical properties ofbicrystal copper grain boundary interfaces. J Phys D: Appl Phys 2008;41(13).
[73] Luque A, Aldazabal J, Martínez-Esnaola JM, Gil Sevillano J. Molecular dynamicssimulation of crack tip blunting in opposing directions along a symmetrical tiltgrain boundary of copper bicrystal. Fatigue Fract Eng Mater Struct2007;30(11):1008–15.
[74] Spearot Douglas E, Jacob Karl I, McDowell David L. Dislocation nucleation frombicrystal interfaces with dissociated structure. Int J Plast 2007;23(1):143–60.
[75] Spearot Douglas E, Jacob Karl I, McDowell David L, Plimpton Steven J. Effect ofdeformation path sequence on the behavior of nanoscale copper bicrystalinterfaces. J Eng Mater Technol, Trans ASME 2005;127(4):374–82.
[76] Li Xiaofan, Hu Wangyu, Xiao Shifang, Huang Wei-Qing. Molecular dynamicssimulation of polycrystalline molybdenum nanowires under uniaxial tensilestrain: size effects. Phys E: Low Dimens Syst Nanostruct 2008;40(10):3030–6.
[77] Zahn Dirk. Molecular dynamics simulation of optimized shearing routes insingle- and polycrystalline aluminum. Comput Mater Sci 2009;45(4):845–8.
[78] Shabib Ishraq, Miller Ronald E. Deformation characteristics and stress–strainresponse of nanotwinned copper via molecular dynamics simulation. ActaMater 2009;57(15):4364–73.
[79] Zhang D-B, Hua M, Dumitric T. Stability of polycrystalline and wurtzite Sinanowires via symmetry-adapted tight-binding objective moleculardynamics. J Chem Phys 2008;128(8).
[80] Krivtsov Anton M. Molecular dynamics simulation of impact fracture inpolycrystalline materials. Meccanica 2003;38(1):61–70.
[81] Holian Brad Lee, Abraham Farid F, Ravelo Ramon. Fracture simulations viamassively parallel molecular dynamics. Adv Comput Methods Mater Model1993;180:207–17.
[82] Abraham Farid F, Brodbeck Dominique, Rudge William E, Xu Xiaopeng.Molecular dynamics investigation of rapid fracture mechanics. J Mech PhysSolids 1997;45(9):1595–619.