international journal of research and analytical reviews · federal at chennai. suresh.m &...
TRANSCRIPT
URL. : http://ijrar.com ISSN 2349 - 5138 E - ISSN 2348 - 1269
International Journal of Research and
Analytical Reviews
UGC Approved Research Journal
Periodicity - Quarterly
Atman Publishing Academy
International Journal of Research and Analytical Reviews
Atman Publishing Academy
2061-C/2/B, Nr. Adhyatma Vidya Mandir, Sanskar Mandal, Bhavnagar-364002.
Contact : 9427903033 E mail : [email protected], [email protected]
An open Access, peer reviewed, refereed, online and print research journal

International Journal of
Research and Analytical
Reviews ijrar.com
© IJRAR - All rights reserved. Reproduction in any form is strictly prohibited.
This work is licenced under Creative Commons International Licence
Attribution 4.0 E-version.
Rs. 900
Send your Paper(s)/Article(s) and Contact us on any one of following
E mail: (1) [email protected] (2) [email protected] (3) [email protected]
Contect No.: +91 9427903033
1. Thoughts, language vision and example in published research paper are entirely of author of research paper. It is not necessary that both editor and editorial board are satisfied by the research paper. The responsibility of the matter of research paper/article is entirely of author.
2. Editing of the IJRAR is processed without any remittance. The selection and publication is done after recommendations of at least two subject expert referees.
3. In any condition if any National/International University denies accepting the research paper/article published in IJRAR, than it is not the responsibility of Editor, Publisher and Management.
4. Only the first author is entitle to receive the copies of all co-author. 5. Before re-use of published research paper in any manner, it is compulsory to take written
permission from the Editor – IJRAR, unless it will be assumed as disobedience of copyright rules.
6. All the legal undertakings related to IJRAR is subject to Bhavnagar Jurisdiction.
Editor International Journal of Research and Analytical Reviews
Atman Publishing Academy
2061-C/2/B, Nr. Adhyatma Vidya Mandir, Sanskar Mandal, Bhavnagar-364002.
Contact : 9427903033 E mail : [email protected], [email protected]
Subscription 1 year 2 years 5 years
Individual 3,000 6,000 15,000
Institutional 4,000 8,000 40,000
Advertisement 1000/Black 3000/colour Per Page

URL. : http://ijrar.com ISSN 2349-5138 E-ISSN 2348-1269
Editor in chief a
Dr. R. B. Joshi
aSenior Advisory Boarda
Dr. H. O. Joshi
Retd. Prof. & Head, Department of Education,
Saurashtra University, Rajkot, Gujarat.
Dr. Bhavesh Joshi Associate Professor
College of Food Processing Technology & Bioenergy,
Agricultural University, Anand – 388110, Gujarat
Vasantkumar Pathak
Director,
Pathak Group of Schools &
College, Rajkot.
aEditorial Boarda
Prof. (Dr.) Ami Upadhyay Director,
Department of Humanities And Social Sciences,
Dr. Babasaheb Ambedkar Uni. A’Bad.
Dr. Awa Shukla Asst. Professor & Director,
Social Sciences Dept. Babasaheb Ambedkar Open
University, Ahmedabad.
Dr. Dushyant Nimavat Associate Professor
Department of English, Gujarat Uniersity, Gujarat,
India
Dr. A. Heidari Faculty of Chemistry California South University (CSU) Irvine,
California, U. S. A.
Dr. Bharat Ramanuj Professor & Head,
Department of Education, Saurashtra University,
Rajkot.
Dr. Nahla Mohammed Abd El-Aziz
Assistant professor - Entomology Department, Faculty of Science,
Cairo University, Egypt.
Dr. Manahar Thaker Principal
G. H. Sanghavi college of Education,
Bhavnagar, Gujarat.
Dr. K. S. Meenakshisundaram
Director, C. A. A., Great Lakes Institute of Management, Chennai
Dr. J. D. Dave I/c Principal
P.D. Malviya Graduate Teachers’ College,
Rajkot, Gujarat.
Dr. M. B. Gaijan Associate Professor,
Shamaldas Arts College, Bhavnagar.
Dr. A. K. Lodi H.O.D. Faculty of Education,
Integral University, Lucknow(UP)
Dr. Trupti Pathak Assistant Vice
Precident(Tech.) Claris life Sciences,
Ahmedabad. Gujarat. Dr. K. Ramadevi
Associate Professor Department of Civil
Engineering Kumaraguru College of Technology,
Coimbatore, Tamilnadu.
Dr. Jayant Vyas Professor & Head,
Department of Education, M. K. Bhavnagar University,
Bhavnagar
Dr. Dilip D. Bhatt Associate Prof. & Head,
Department of English, V. D. K. Arts college,
Savarkundla, Gujarat.
K. S. Dave Lecturer
J. H. Bhalodia Women’s College Rajkot, Gujarat.
Dr. Anil Ambasana
Retd. Prof. & Head, Department of Education,
Saurashtra University, Rajkot. Gujarat.
Dr. Sandeep R. Sirsat Associate Professor & Head,
Department of Computer Science, Shri Shivaji Science &
Arts College, Chikhli, Dist: Buldana (M.S.-India)
An open Access, peer reviewed, refereed, online and print research journal

International Journal of Research and Analytical Reviews
URL. : http://ijrar.com ISSN 2349-5138 E-ISSN 2348-1269
Review Committeea
Editor & Head of Review Committeea
Dr. S. Chelliah
Professor & Head, Dept. of English and Comparative Literature,
Madurai Kamraj University, Madurai-21, India.
Mr. Zeeshan Shah Senior Lecturer, Department of
Multimedia and Communication, University
College of Bahrain, Kingdom of Bahrain.
Dr. Samira Shahbazi Plant Protection &
Biotechnology Research Group, Nuclear Agricultural
Research School, Nuclear Science & Technology
Research Institute (NSTRI), Iran
Dr. Belal Mahmoud Al-Wadi Lecturer, University of
Dammam (Saudi Arabia), Founder & Vice President of
the Jordanian Society for Business Entrepreneurship
(Jordan)
Harish Mahuvakar Associate Professor & Head,
Dept. of English, Sir P. P. Institute of Science,
Bhavnagar, Gujarat, India.
Dr. Mainu Devi Assistant Professor (Sr.
Grade) in Zoology, Diphu Govt. college, Karbi Anglong –
Assam India.
Asim Gokhan YETGIN Assistant Professor, Faculty of
Engineering, Dumlupinar University, Kutahya,
Turkey.
Dr. A. Kusuma Assistant Professor,
Department of Social Work, Vikramasimhapuri University,
Nellore.(AP)
Prof. Rajeshkumar N. Joshi I/C Dean, Faculty of Arts &
Humanities, C. U. Shah University, Gujarat, India.
Sunita. B. Nimavat Assistant Professor of English,
N.P.College of Computer & Mgt., Kadi (North Gujarat).
Nahla Mohammed Abdelazez Assisstant Professor Faculty of Science,
Cairo University, Giza Governorate, Egypt.
Dr. Riyad Awad Associate professor,
Structural Engineering, An - Najah National University,
Nablus, Palestine.
Dr. Amer A. Taqa Professor
Dept. of Dental Basic Science, College of Dentistry, Mosul
University, Masul, Iraq.
An open Access, peer reviewed, refereed, online and print research journal

International Journal of Research and Analytical Reviews
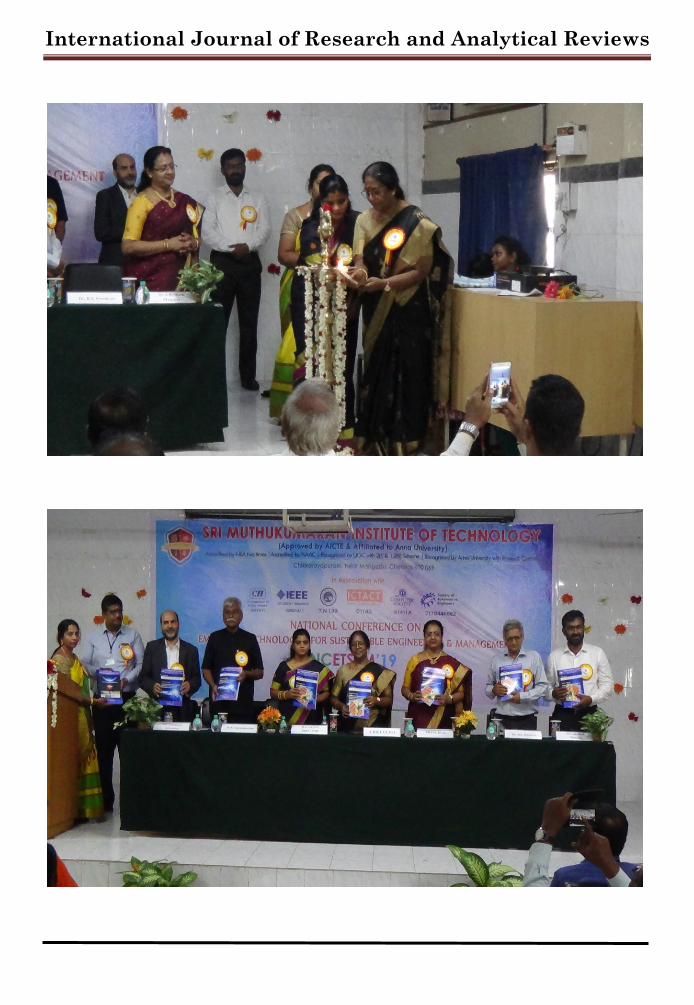
National Conference
On
Emerging Technologies for Sustainable Engineering and Management
NCETSEM-19
Organized by Sri Muthukumaran Institute of Technology
International Journal of Research and Analytical Reviews

International Journal of Research and Analytical Reviews
International Journal of Research and Analytical Reviews

International Journal of Research and Analytical Reviews

International Journal of Research and Analytical Reviews
International Journal of Research and Analytical Reviews
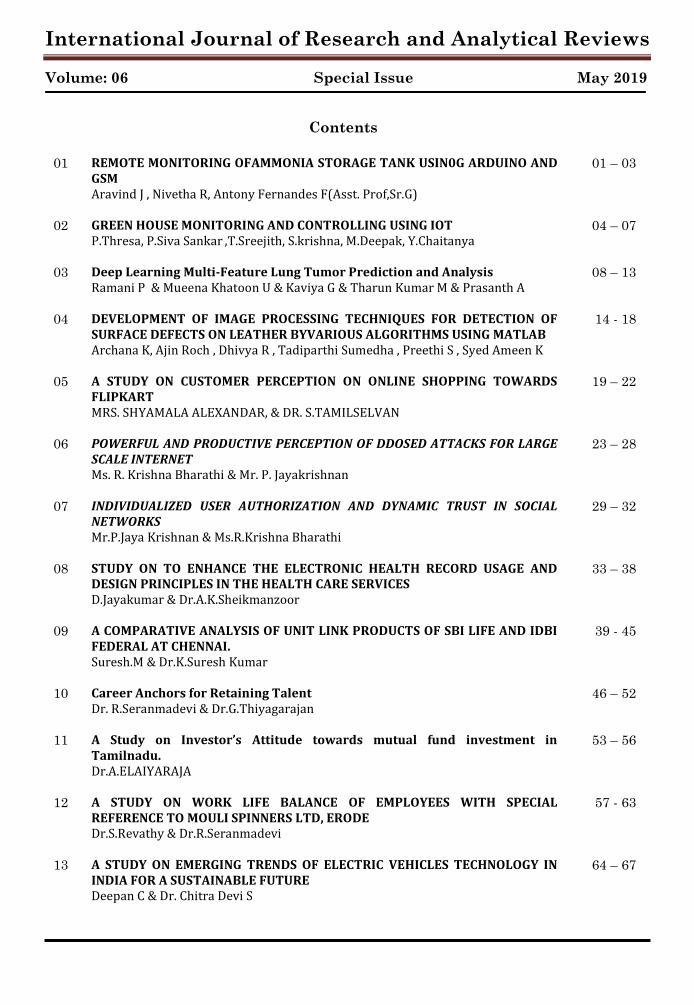
Volume: 06 Special Issue May 2019
Contents
01 REMOTE MONITORING OFAMMONIA STORAGE TANK USIN0G ARDUINO AND GSM Aravind J , Nivetha R, Antony Fernandes F(Asst. Prof,Sr.G)
01 – 03
02 GREEN HOUSE MONITORING AND CONTROLLING USING IOT P.Thresa, P.Siva Sankar ,T.Sreejith, S.krishna, M.Deepak, Y.Chaitanya
04 – 07
03 Deep Learning Multi-Feature Lung Tumor Prediction and Analysis Ramani P & Mueena Khatoon U & Kaviya G & Tharun Kumar M & Prasanth A
08 – 13
04 DEVELOPMENT OF IMAGE PROCESSING TECHNIQUES FOR DETECTION OF SURFACE DEFECTS ON LEATHER BYVARIOUS ALGORITHMS USING MATLAB Archana K, Ajin Roch , Dhivya R , Tadiparthi Sumedha , Preethi S , Syed Ameen K
14 - 18
05 A STUDY ON CUSTOMER PERCEPTION ON ONLINE SHOPPING TOWARDS FLIPKART MRS. SHYAMALA ALEXANDAR, & DR. S.TAMILSELVAN
19 – 22
06 POWERFUL AND PRODUCTIVE PERCEPTION OF DDOSED ATTACKS FOR LARGE SCALE INTERNET Ms. R. Krishna Bharathi & Mr. P. Jayakrishnan
23 – 28
07 INDIVIDUALIZED USER AUTHORIZATION AND DYNAMIC TRUST IN SOCIAL NETWORKS Mr.P.Jaya Krishnan & Ms.R.Krishna Bharathi
29 – 32
08 STUDY ON TO ENHANCE THE ELECTRONIC HEALTH RECORD USAGE AND DESIGN PRINCIPLES IN THE HEALTH CARE SERVICES D.Jayakumar & Dr.A.K.Sheikmanzoor
33 – 38
09 A COMPARATIVE ANALYSIS OF UNIT LINK PRODUCTS OF SBI LIFE AND IDBI FEDERAL AT CHENNAI. Suresh.M & Dr.K.Suresh Kumar
39 - 45
10 Career Anchors for Retaining Talent Dr. R.Seranmadevi & Dr.G.Thiyagarajan
46 – 52
11 A Study on Investor’s Attitude towards mutual fund investment in Tamilnadu. Dr.A.ELAIYARAJA
53 – 56
12 A STUDY ON WORK LIFE BALANCE OF EMPLOYEES WITH SPECIAL REFERENCE TO MOULI SPINNERS LTD, ERODE Dr.S.Revathy & Dr.R.Seranmadevi
57 - 63
13 A STUDY ON EMERGING TRENDS OF ELECTRIC VEHICLES TECHNOLOGY IN INDIA FOR A SUSTAINABLE FUTURE Deepan C & Dr. Chitra Devi S
64 – 67

International Journal of Research and Analytical Reviews
14 Emotional Intelligence: A Catalyst for Inspirational Entrepreneurship in the globalized Business Environment Mr.M.Prakash & Dr.S.Muralidhar
68 – 73
15 IMPACT OF SELF HELP GROUPS IN ECONOMIC EMPOWERMENT OF RURAL WOMEN Ms.P.Shalini & Mrs.Deepa Rekha Suresh & Ms.Veena.V
74 – 79
16 REAL TIME SENSOR DATA TRANSMISSION USING IOT THROUGH SOIL E. Poovannan, P.Nethra, G.Praneeth, K.srinivas Reddy, Puli Lohith
80 – 83
17 BUILDING RESILIENT CARRIER GRADE WAN NETWORK FOR CORPORATE Suchitra Thota & Lohith E & Sai Krishna M & Pavithra N & Sai Naveen S & Jacqulin Veda Jancy
84 – 88
18 AUTOMATIC GARDENING SYSTEM Senthil Murugan.T & Monisha.K & Bhavishya Reddy.M & Dhasbeeha.R
89 – 92
19 Orchestrate of Docker Containers using TOSCA Templates Nanda Kishore Sahu & Abhinay Rk & Easvar Prasad KR & Mohammad Zayan L & Poonkavithai Kalamegam
93 – 97
20 CSR as a tool for Social License Vender Vendan R & Dr Sungeetha
98 – 99
21 OPTIMIZING NETWORK CONVERGENCE OF ISP BY TUNING ROUTING PROTOCOLS Priyanga, S lohith krishna, Akila m n, G Sudha, Akshaya J, S Gokul
100 - 104
-

National Conference on Emerging Technologies for Sustainable Engineering and Management Organized by Sri Muthukumaran Institute of Technology
Special Issue IJRAR- International Journal of Research and Analytical Reviews 1
REMOTE MONITORING OFAMMONIA STORAGE TANK USIN0G ARDUINO AND GSM
Aravind J , Nivetha R, Antony Fernandes F(Asst. Prof,Sr.G)
SRM INSTITUTE OF SCIENCE AND TECHNOLOGY, RAMAPURAM CAMPUS, CHENNAI-89
ABSTRACT: The ammonia storage tank is designed for the large scale atmospheric and cryogenic storage of ammonia gas. In this paper, the ammonia storage system is proposed to be monitored remotely with Arduino UNO controller and GSM module by transmission of the data to the control area from the tank. This prototypical proposed system is the wireless transmission of the tank parameters through the GSM with a SMS from the tank area to the receiver in the control area.In general, the parameters such as temperature of the tank, pressure, temperature regulator (agitator), the position of the inlet and the outlet valves, the level of ammonia in the tank are going to be monitored using the wireless method of transmission using GSM.
Keywords: GSM, Fiber optic cable, Arduino Controller
1. INTRODUCTION The ammonia storage tank is designed for the large scale atmospheric and cryogenic storage of ammonia gas. In this paper, the ammonia storage system is proposed to be monitored remotely with Arduino UNO controller and GSM module against the existing system which is the wired transmission method of the digital data to the control area through a fiber optic cable from the tank. The existing design is a wired system, wherein a normal cable or preferably a fiber optic cable is being used. The system works in such a way where the storage tank and the control area are connected through a fiber optic cable. This cable is laid between the tank and control room covering a distance of 2000m (2Km), which is the minimal safe distance from the tank to the control area. To enhance and make the system much efficient than this we propose and implement the GSM wireless method of transmissionwith Arduino UNO. 1.1 REDUNDANCY IN FIBER CABLE The redundancy is an essential factor in the fiber optic cable. The cabling redundancy allows the network and its elements to remain available and avoid downtime of the entire system. In the system that has been implemented with the fiber optic cable, the redundant cable is forcefully established along the original pathway in order to sustain the connection incase if the original connection fails.. 1.2SPLICING IN FIBER OPTIC CABLE Fiber optic splicing is an important method of joining two fiber optic cables together. It is a preferred solution when an available fiber optic cable is not sufficiently long for the required run. Besides, splicing is designed to restore fiber
optic cables when they are accidentally broken in the established pathway
2. SYSTEM DESIGN
The functional block diagram of the proposed system is shown above. It primarily consists of the Ammonia storage system tank which is the base from which the parameters are to be measured remotely. The parameters such as temperature of tank, valve position, ammonia level in the tank, agitator condition are considered. These parameters are in analog data which are passed through the junction box. In the junction box these analog inputs are collectively received and are processed for the next stage.
3. MODULE STRUCTURES The GSM900A is a complete Dual-band GSM/GPRS solution in a SMT module which can be embedded in the customer applications. Featuring an industry-standard interface, the GSM900A

UGC Approved: 43602 e ISSN 2348 –1269, Print ISSN 2349-5138 http://ijrar.com/ NCETSEM-19
2 IJRAR- International Journal of Research and Analytical Reviews Special Issue
delivers GSM900/1800MHz performance for SMS.The frequency rangespecified for GSM is 933 - 960 MHz. The downlink frequency band 890 - 915 MHz.Channel spacing indicates the spacing between adjacent carrier frequencies. For GSM, it is 200 kHz.
SPECIFICATIONS:
1) Dual-Band 900/ 1800 MHz
2) GPRS multi-slot class 10/8GPRS mobile station class B 3) Complaint to GSM phase 2/2+Class 4 (2 W @850/ 900 MHz)
4) Class 1 (1 W @ 1800/1900MHz)
5) Control via AT commands (GSM 07.07 , 07.05 and
SIMCOM enhanced AT Commands)
6) Low power consumption: 1.5mA (sleep mode)
7) Operation temperature: -40°C to +85 °C
4. ANALYSIS & OUTPUT The ammonia monitoring system design based on the proposed prototypical wireless system with GSM monitors the ammonia tank in various stages. The ammonia storage tank is designed for the large scale atmospheric cryogenic storages of the ammonia gas. The storage system is designed according to the standards as defined in the BS7777 regulation. In the regulation there are single walled, double walled and full containment design that are used. Based on the defined regulation there are three prevalent methods for the storage, they are single wall tank, double wall tank and double wall full containment tank. There are certain codes and standards followed for the design of ammonia storage tank. They are BS-7777, ANSI K61.1, IS 4544:2000. These are some standardised safety procedures that are used to design the tank. The monitoring of the parameters of the storage tank is done by a control room that is 2000m far from the tank for safety reasons. The parameters are recorded and they keep varying in its levels in every millisecond. The transfer of the recorded parameters from the tank to the control room is generally done through any wired medium. The communication protocol used over the wired medium here is RS 485. If high noise immunity is needed, often a combination of twisting and shielding is used as for example in STP, shielded twisted pair and FTP, foiled twisted pair networking cables. Differential signals and twisting allows RS 485 to communicate over much longer communication distances than the RS 232 protocol. The RS 485 protocol has the capability of
connecting to a maximum of 32 devices and the capability to cover a distance range of 4000ft.Thereby RS 485 communication is more viable in transferring data from the storage tank to the control room as it has multiple cables to transmit multiple data at time over longer distance and can connect to multiple devices. The use of GSM reduces the damage probabilities and provides close to accurate periodically and also the tank parameters can be controlled by it.
5.APPLICATION This wireless process can be implemented in industries which deals with Boiler automation systems, ammonia storage plants and any other storage systems. This process transmits the system parameters without any wired medium using GSM which is quicker and cheaper compared to the existing system. Currently the GSM network used is a public network. In the future further development, an indigenous private network using ZigBee with inter routing protocol can be created and set up as asecured private network.
REFERENCE 1. Jirong Li, Fujin Li, Yanwei Wu, Zhiwu Yu, The
Design of Mine Safety Monitoring System Based on Wireless Sensor Networks, Chinese Journal of Sensor and Actuators, Vol. 24, No. 9, 1336-1340, 2011
2. Gang Wu ; Chengdong Wu ; Shichun Xu,Application of wireless sensor network in the monitoring system of boiler,The 26th Chinese Control and Decision Conference 2014, 31 May-2 June 2014, INSPEC Accession Number: 14450223

National Conference on Emerging Technologies for Sustainable Engineering and Management Organized by Sri Muthukumaran Institute of Technology
Special Issue IJRAR- International Journal of Research and Analytical Reviews 3
GREEN HOUSE MONITORING AND CONTROLLING USING IOT
P.Thresa1, P.Siva Sankar2,T.Sreejith3,S.krishna4, M.Deepak5, Y.Chaitanya5 Assistant Professor1, Student2,3,4,5,6, Electronics and communication, SRM institute of science and technology,
Tamil nadu, India
ABSTRACT: This paper reports the design and monitoring of a smart irrigation system using IOT. Greenhouse monitoring is a system in which various environmental conditions are monitored and controlled such as humidity, temperature, illumination and soil moisture etc..If any of these environmental conditions crosses certain limits ,a message will be sent and displayed on the webpage through IOT technology. Green house is a place where plants like vegetables and flowers are grown with translucent plastic roofs. The main objective of this project is to design an easy method to monitor and trace the values of parameters such as soil moisture, humidity, temperature etc.. using IOT.
Keywords: Arduino , Internet of things,DHT11,sensors.
I. INTRODUCTION In the present environment the increase in food production and also the food quality became more important. Since the population is increasing, the demand for large amount of crop production is more important. This method of monitoring the greenhouse system provides time consuming and reduces human intervention. Green house is something that related to a building or a place where small plants and vegetables are grown covered with glass or translucent plastic roofs. It plays an important role in colder regions for vegetation, because it is still very cold to take them to an outside environment. Now a days people wants to observe their work from any where in the world through the digital devices such as smart phone or laptop. We know that the green house contains the environmental parameters such as humidity, temperature, moisture etc. These parameters are affected by the greenhouse effect. To monitor and control these parameters, IOT method is used. In twenty first century IOT is one of the most important technology. It makes the things to become easier. This paper presents an overview of the IOT phenomena and also applications on greenhouse.
II. LITERATURE REVIEW In this section an overview of various related search for green house system is explained. There are several authors who proposed this project using IOT concept in agriculture and greenhouse. K.Rangan and H.patil proposed visualized guided operations in green-house system. Here they have explained about the tomato cultivation by using two programmable array logic(PAL) cameras. With the help of the cameras the signal is sent and
is processed by a graphic workstation for fast image processing using a bit scale microcontroller. Chaital Borse and Shilpa Patil both developed a greenhouse monitoring and controlling system using GSM, that monitors the levels of humidity, temperature and light. Their proposed system uses sensors and SMS technology. The main disadvantage of this work is only few parameters can be measured and the message will be coding language. This system mainly helps to explain the greenhouse monitoring system which will display the status of the parameters and the sensed data on a web page ,that also provide the facility of monitoring and controlling the system remotely.
III. EXISTING SYSTEM In the present environment ,it can be observed that the existing systems are not sufficient to handle and solve the problems for greenhouse monitoring and controlling. To handle this problem ,the monitoring and controlling of greenhouse can be proposed using ARDUINO based on IOT method. It is a microcontroller based circuit which monitors and records the threshold values of various parameters such as temperature, humidity, light intensity, soil moisture, etc. It mainly consist of the monitoring section, controlling section and another section for sending and receiving the message data. In the monitoring section temperature sensor, humidity sensor, soil moisture sensor and light sensor are included. The environmental parameters are sensed and detected by these sensors and also display the status of each parameter on the display. We can directly see the data through mobile. DRAW BACK In today’s world, the investment for automatic process is very high to control and monitor the

UGC Approved: 43602 e ISSN 2348 –1269, Print ISSN 2349-5138 http://ijrar.com/ NCETSEM-19
4 IJRAR- International Journal of Research and Analytical Reviews Special Issue
greenhouse system, because they are designed for monitoring and controlling only one parameter, and not for more than one parameter since the cost for more than one system is high.
IV PROPOSED SYSTEM In this system we uses the concept of internet of things. In brief ,Internet of things is an environment for connecting the physical objects with internet which are available in present. In this each physical object is assigned with an IP address, that’s make them capable enough to collect and transfer the data over a network with out any manual intervention. The proposed system consist of nodeMCU (microcontrollerunit) ,and various sensors such as temperature sensors, humidity sensors, soil moisture sensor, light sensors and smoke sensors and windows application for controlling and measuring parameters inside green house. Microcontroller Arduino acts as the heart of this system.It helps in monitoring the digitized parameters of various sensors and display the status of the threshold values on LCD. If this parameters threshold values are in unfavourable situation, then the required controll operation takes place, using various sensors as mentioned above. when this sensors reach a threshold limit it will send the signal to the nodeMCUand further action will be taken. BLOCK DIAGRAM
FIGURE 1:BLOCK DAIGRAM
V. BLOCK DIAGRAM EXPLANATION
It is a node MCU based circuit which monitors and records the threshold values of various parameters such as temperature, humidity, light intensity, soil moisture, etc. The main functioning in this circuit is node MCU(micro controller unit).It consists of 3 sections. Monitoring section, controlling section and message section. In the monitoring section 4 types of sensors are used to sense and detect the environmental conditions, such as temperature sensor, humidity sensor, light sensor, moisture sensor. In the environmental parameters are provided. In the message section the sending and receiving data is displayed on the LCD screen, and the threshold values and status of each parameter is can be seen on the web page through wifi module using IOT.
VI HARDWARE DESCRIPTION NODE MCU(MICRO CONTROLLER UNIT) It is an IOT plat form, that includes an open source Lua based firmware that runs on the ESP8266 WI-FI source module, and the hardware based on the ESP- 8266 module. The language used by the firmware is LUA script. The ESP8266 consists of 17 GPIO pins ranging from 0 to 16,but in this we can use only 11 of them, because remaining 6pins are used to connect the flash memory chip. We can program this module using Arduino, Node MCU IDE. Node MCU is a development board for ESP8266, which contains wi- fi module with 32bit controller. The Node MCU can be further defined as firmware rather than the developing the kits.
Figure 2.ESP2866 Node MCU WIFI DEVELOPMENT
BOARD SOIL MOSITURE SENSOR The moisture content of the soil can be tested by using this sensor, it means when there is shortage of water for the soil, the module output will be at high state or else it will be in low state. Automatic water supplying system can be made easily by

National Conference on Emerging Technologies for Sustainable Engineering and Management Organized by Sri Muthukumaran Institute of Technology
Special Issue IJRAR- International Journal of Research and Analytical Reviews 5
using this sensor . The sensitivity can be adjustable by using this sensor and it also configure the threshold level.
Figure 3.Soil moisture sensor
TEMPERATURE SENSOR This sensor is used to measure the value of temperature ,so that based on the temperature condition required plants are grown. By the use of thermistor the temperature value can be measured . It can monitor the temperature condition and can check if it is high or low inside the greenhouse. If the temperature reaches above the critical level inside the green house ,the coolant is provided to cool down the temperature and bring back to the required temperature inside the greenhouse.
Figure4.Temperaturesensor interfaced with
nodeMCU
HUMIDITY SENSOR It is a device that is used to detect and measure water vapour.The device used to measure the humidity is DTHl1 sensor.This sensor is hooked up to the Arduino Uno and an example code is made to run and the serial data is read in the system.
Figure 5.DTH11 sensor for humidity
LIGHT SENSOR The device used for light sensor is LDR(light dependent resistor).Its function is to monitor the intensity of light. when it need to save the power it turns of the light and when required light in the greenhouse it turns on.
Figure 6.LDR interfacing with nodeMCU
RELAYS It is an electromagnetic switch which helps to open and close the circuits electronically. It has four important components: electromagnet, a spring, an armature and a set of electrical contacts.It is used to regulate the flow of current between circuit and device. With the help of the relay the sensors give the accurate value or status of temperature, light, humidity and soil content inside the green house.
Figure 6.Relay switch
VII.WORKING The main aim of this paper is to detect and monitor the conditioning of the plants in any circumstances. As already considered the 4 parameters as the input to system .The information about the plant will be in the form of

UGC Approved: 43602 e ISSN 2348 –1269, Print ISSN 2349-5138 http://ijrar.com/ NCETSEM-19
6 IJRAR- International Journal of Research and Analytical Reviews Special Issue
analog signal, to convert this the node MCU consists of in-build analog to digital convertor(ADC). Here the data will be converted to digital and it will be displayed on the LCD screen. If the sensing value crosses the threshold level then the relay driver circuit will automatically switches he related automation control. With in the plant premisis the above explanation is done, but to check and monitor the plant conditioning from any place can be done only through IOT. By using this IOT app we can check and monitor plant condition from any place at any instant of time.
Figure 7. Circuit diagram
VIII.ADVANTAGES It is easy to use Implementation of components is easy
Increase in fertility Better growth and production in
agriculture industry Parameters that effect the greenhouse
are monitored
IX.RESULTS The hardware implementation of the greenhouse monitoring system was done by IOT technology. The parameters that are considered for monitoring the greenhouse are measured using the sensors and the data will be updated on the webpage or mobile. The sensor values can also be displayed on the screen.
X .CONCLUSION The proposed greenhouse monitoring system using IOT is a complete system designed to monitor and control the environmental parameters inside a greenhouse system. This system saves money,time and reduces human effort. It provides a controlled environment for the plants to prevent them from damage and thus overall production increases.This system automatically controls the various parameters that are needed for the plants and send the sensed data and values to a webpage or mobile for effective monitoring.
XI.FUTURE SCOPE This paper can only give a traditional way of monitoring the plant parameters like temperature, humidity, soil moisture, and illumination with in plant premisies only provide automation and monitoring them at distant places using IOT. But in future it can not only monitor the plant parameters but can also monitor the internal health conditioning of plant through image processing.we can also check which plants are affected and which plants are in good health condition. If the technology gets more updated we can also know how much amount of bio chemicals, what type of chemicals required for certain plant growth.
REFERENCES 1. Sirohi, Kshitij, Aastha Tanwar, and Poonam
Jindal. "Automated irrigation and fire alert system based on Hargreaves equation using weather forecast and ZigBee protocol." Communication Control and Intelligent Systems (CCIS), 2016 2nd International Conference on. IEEE, 2016.
2. Math, Rajinder Kumar, and Nagaraj V. Dharwadkar. "A wireless sensor network based low cost and energy efficient frame work for precision agriculture." Nascent

National Conference on Emerging Technologies for Sustainable Engineering and Management Organized by Sri Muthukumaran Institute of Technology
Special Issue IJRAR- International Journal of Research and Analytical Reviews 7
Technologies in Engineering (ICNTE), 2017 International Conference on. IEEE, 2017.
3. Lottes, Philipp, et al. "UAV-Based Crop and Weed Classification for Smart Farming.” IEEE International Conference on Robotics and Automation (ICRA) Singapore, May 29 - June 3, 2017, ©2017 IEEE
4. Srisruthi, S., et al. "Sustainable agriculture using eco-friendly and energy efficient sensor technology." Recent Trends in Electronics, Information & Communication Technology (RTEICT), IEEE International Conference.
5. G. J. Timmerman and P. G. H Kamp “Computerized Environmental Control in Greenhouses,” PTC, the Netherlands, and Page:15–124,2003.
6. K. Rangan and T. Vigneswaran, “An Embedded Systems Approach to Monitor Greenhouse.
7. Eldhose.K.A, Rosily Antony, Mini.P.K, Krishnapriya.M.N,Neenu.M.S, “Automated Greenhouse Monitoring System”, International Journal of Engineering and Innovative Technology (IJEIT) Volume 3, Issue 10, April 2014.

UGC Approved: 43602 e ISSN 2348 –1269, Print ISSN 2349-5138 http://ijrar.com/ NCETSEM-19
8 IJRAR- International Journal of Research and Analytical Reviews Special Issue
Deep Learning Multi-Feature Lung Tumor Prediction and Analysis
Ramani P1 & Mueena Khatoon U2 & Kaviya G2 & Tharun Kumar M2 & Prasanth A2 Assistant Professor1 , UG Students2
Department of ECE, SRM Institute of Science and Technology, Chennai, Tamil Nadu, India
ABSTRACT: Lung cancer is the most prevalent cancer worldwide. Visual interpretation of CT images to detect cancer in the body may lead to cancer detection at later stages, thus leading to late treatment of cancer. We can increase the chances of survival among people, if we detect it at an early stage. Therefore, image processing tools can be used for this purpose. In this paper we have proposed an algorithm for the classification of cancer by deep neural networks. A collective result of various feature extraction techniques has been used to collect the features of the infected area. Deep Learning Neural Network has been used to identify the type of tumor present. This can help clinicians to know the extent to which these deadly cells can spread the disease. The deep learning algorithm accurately predicts the process by training the samples in Neural model.
Keywords:
1. INRODUCTION Lung cancer is a disease in which abnormal cells multiply and grow in the tissues of lung. These deadly cells restrict the growth of healthy lung tissues. Bloodstream carries these cells to other parts of the body. Metastasis occurs when these cells leave the site where it began and start spreading to other parts of the body [1]. Lung cancer is among the top five diseases in the world that is causing the highest number of deaths [2]. It is the most prevalent cause of death among men and women worldwide [3]. The death rate can be reduced if people go for early diagnosis so that doctors can provide suitable treatments. Radiologists use CT scans to target disease and perform biopsies. Biopsy is a very invasive and expensive surgical procedure. Manual detection of tumor is very laborious and studies have proven that computer – generated segmentation results are more reliable than manual interpretations [4]. So, there is a need for pre-diagnosis system using image processing techniques which can provide better results. Numerous research groups have tried to study the application of Deep Learning (DL) in biomedical field as it can detect important features from complex datasets. Deep learning algorithms perform better than machine learning models [5]. Neural Networks (NNs) have been extensively used in cancer research for the development of predictive models, resulting in successful and precise decision making [6]. An accurate level of validation is needed so that these techniques can be used in everyday clinical practice.
The objective of this study is to extract features for accurate comparison by using image processing techniques and neural network algorithm to detect cancer.
2. LITERATURE SURVEY Lei Fan et al. [7] used 3D CNN to detect lung nodules in medical images. CAD system is used for automatic detection. 3D convolution is better than 2D because of the 3D characteristics of low-dose CT images, the accuracy obtained in this experiment is also high. The results obtained conclude that there is a vast scope for the application of deep learning in medical field. K. Ravindranath et al. [8] introduced a method for early identification of lung cancer from uncertain nodules. Tumor cells are extracted using pattern matching. Fuzzy logic, statistical classifiers and SVM (support vector machine) have been used to increase accuracy. The results obtained are categorized. Categorization is done by matching features of the detected nodules to features of normal nodules with known condition of disease. These characters include density, shape, texture etc. The nodules extracted are classified using neural network classifiers to differentiate between normal and abnormal lung cancer. Mokhled S. Al-Tarawneh et al. [9] presented a method to detect important features for comparing images accurately. Early detection of abnormal issues in target images is important. The main aim of this study is to enhance image quality and increase accuracy. Image processing techniques are used for image enhancement.
National Conference on Emerging Technologies for Sustainable Engineering and Management Organized by Sri Muthukumaran Institute of Technology
Special Issue IJRAR- International Journal of Research and Analytical Reviews 9
Gabor filter within Gaussian rules has been used for this purpose. Segmentation principles are applied to segregate the pixels of interest. Features are extracted and compared with general features. Abdul Muntakim Rafi et al. [10] used Recurrent 3D-DenseUNet (a combination of Convolutional and Recurrent neural network) for segmenting lung tumor. The network is trained using image-volumes with tumor slices of size (256 × 256 × 8). A data-driven adaptive weighting method is used to classify the image as cancerous or non-cancerous. This model has been trained and tested on the NSCLC-Radiomics dataset of 260 patients. This experiment achieves an average dice score of 0.74, mean surface distance of 1.719 and 95% Hausdorff distance of 7.249.
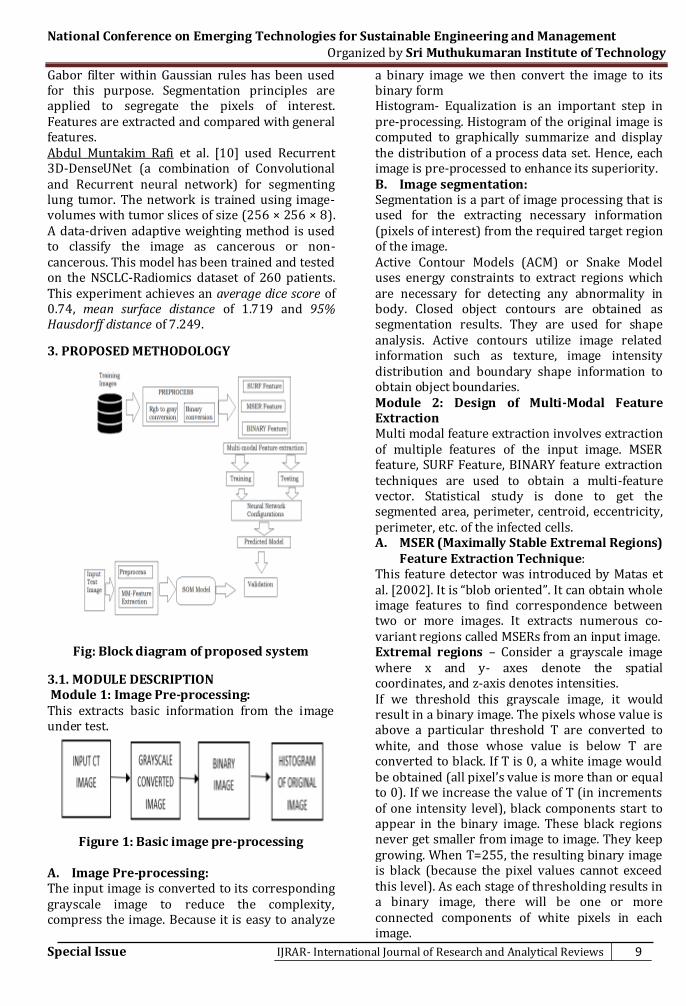
3. PROPOSED METHODOLOGY
Fig: Block diagram of proposed system
3.1. MODULE DESCRIPTION Module 1: Image Pre-processing: This extracts basic information from the image under test.
Figure 1: Basic image pre-processing
A. Image Pre-processing: The input image is converted to its corresponding grayscale image to reduce the complexity, compress the image. Because it is easy to analyze
a binary image we then convert the image to its binary form Histogram- Equalization is an important step in pre-processing. Histogram of the original image is computed to graphically summarize and display the distribution of a process data set. Hence, each image is pre-processed to enhance its superiority. B. Image segmentation: Segmentation is a part of image processing that is used for the extracting necessary information (pixels of interest) from the required target region of the image. Active Contour Models (ACM) or Snake Model uses energy constraints to extract regions which are necessary for detecting any abnormality in body. Closed object contours are obtained as segmentation results. They are used for shape analysis. Active contours utilize image related information such as texture, image intensity distribution and boundary shape information to obtain object boundaries. Module 2: Design of Multi-Modal Feature Extraction Multi modal feature extraction involves extraction of multiple features of the input image. MSER feature, SURF Feature, BINARY feature extraction techniques are used to obtain a multi-feature vector. Statistical study is done to get the segmented area, perimeter, centroid, eccentricity, perimeter, etc. of the infected cells. A. MSER (Maximally Stable Extremal Regions)
Feature Extraction Technique: This feature detector was introduced by Matas et al. [2002]. It is “blob oriented”. It can obtain whole image features to find correspondence between two or more images. It extracts numerous co-variant regions called MSERs from an input image. Extremal regions – Consider a grayscale image where x and y- axes denote the spatial coordinates, and z-axis denotes intensities. If we threshold this grayscale image, it would result in a binary image. The pixels whose value is above a particular threshold T are converted to white, and those whose value is below T are converted to black. If T is 0, a white image would be obtained (all pixel’s value is more than or equal to 0). If we increase the value of T (in increments of one intensity level), black components start to appear in the binary image. These black regions never get smaller from image to image. They keep growing. When T=255, the resulting binary image is black (because the pixel values cannot exceed this level). As each stage of thresholding results in a binary image, there will be one or more connected components of white pixels in each image.

UGC Approved: 43602 e ISSN 2348 –1269, Print ISSN 2349-5138 http://ijrar.com/ NCETSEM-19
10 IJRAR- International Journal of Research and Analytical Reviews Special Issue
Extremal regions are the collections of all such components resulting from various thresholding. Maximally stable extremal regions are those that do not change their size (number of pixels) over a wide range of values. SURF (Speeded Up Robust Features) Feature Extraction Technique: SURF was developed to improve the performance and speed of SIFT (SCALE INVARIANT Feature Transform). The principle steps of extracting the features in SURF and SIFT are similar; but details in each step are different. The interesting points are detected by Hessian matrix approximation. For orientation assignment the sum of Haar wavelet responses is used. Summary of the algorithm: 1. Construct the scale space. 2. Obtain the initial key points. 3. Improve accuracy of the location of the key
points. 4. Delete unsuitable key points. 5. Compute the key point orientations. 6. Compute the key point descriptors
B. Binary Feature: It is a sequential feature extraction technique that is used for binary features. A linear and optimal decision function is developed concurrently with each feature. Module 3: Database Training This module involves training the neural network with different types of cancer images. The different types of tumor we have considered in our study are:
a) Type 1(Benign): It does not spread to the nearby tissues or other parts of the body.
b) Type 2(Non-Small Cell Lung Tumour): It means that the cancer has grown (tumour is larger than in type 1), but the cancer has not started to spread into the surrounding tissues.
c) Type 3 (Carcinoma) -It indicates that the cancer cells have developed and will embed itself more deeply into the surrounding tissues. Cancer cells have entered the blood stream but have not spread to other organs in the body.
d) Type 4(Adenocarcinomas) – It means that the cancer has spread to other organs or parts of the body.
3.2. NEURAL NETWORK: Neural Network (NN) is an information processing model that is designed to recognise patterns. It is modelled like a human brain and is a system-level brain. Neurons combine together to form a network.
These networks are used for learning the parameters of decision functions using successive presentations of training patterns. Neural network is adaptive in nature. It trains itself from the data provided, which has a known result and adjusts its weights accordingly for better prediction in situations with unknown result. Neurons are connected to each other via links. Links are associated with weights that contain information of input signals. In our study, we have used semi-supervised learning algorithm in which the network is trained based on a combination of labelled and unlabeled data. This type of learning is usually used when there are more unlabeled datasets than labelled. We have used Hybrid Neural Network which is a combination of Pattern Recognition neural network and NAR-Non-linear Autoregressive Neural Network. Out Network is trained with a sets of cancer images (called Database) of different types. The input to the neural net is numerical data (Feature vectors). It finds an image in database whose feature vectors are similar with the input feature vectors and compares them. Weights are adjusted in such a way that it can classify our input feature and categorize it in one among the four classes. Every class has a discrimination function. We compute the discrimination function for every class and the class that gives maximum value of discrimination function, input features are assigned to that class. The corresponding neuron gets activated in the output layer. In order to validate our results and check the accuracy we cross check with performance plot, regression plot etc. 3.3. DEEPLEARNING: Neural Net with more than two hidden layers is called as a deep neural network. The word “Deep” refers to the number of processing layers through which the data must pass. Deep Learning is gaining much popularity due to it is supremacy in terms of accuracy when trained with large amount of data. It is achieving results that were not possible earlier. 3.4. BAYESIAN REGULARIZATION: Regularization is a technique that helps to reduce overfitting or reduce variance in our network. Certain complexities in our model may make it unlikely to generalize our model though it fits our training data. Regularization increases the ability of our model to fit in the training data well and the ability to generalize well to data it hasn’t seen before. The main idea behind Bayesian approach is that instead of looking for the most likely settings of the parameters of a model, we should
National Conference on Emerging Technologies for Sustainable Engineering and Management Organized by Sri Muthukumaran Institute of Technology
Special Issue IJRAR- International Journal of Research and Analytical Reviews 11
consider all possible settings of the parameters. Our data gives a likelihood term which is combined with our prior and we get a posterior.
𝑃 𝑊 𝐷 = 𝑃(𝐷|𝑊) 𝑃(𝑊)
𝑃(𝐷) (1)
Where, P(W|D) is the posterior probability of weight vector W given training data D P(W) is the prior probability of having cancer P(D) is the likelihood of test being positive P(D|W) is the probability of observed data given W Bayesian theorem tells the conditions before a test is performed that affect the accuracy of the test. Bayesian deep learning is grounded on learning probability distribution for our parameters. 3.5. LINEAR REGRESSION: It is an algorithm in deep learning. It is a statistical model that shows the relationship between two variables with a linear equation y=mx+c. (2) Regression is a predictive modelling technique that finds out the relationship between a dependent and an independent variable. Regression analysis involves graphing a line over a data points that most closely fits the overall shape of the data. x axis – independent variable, y axis – dependent variable
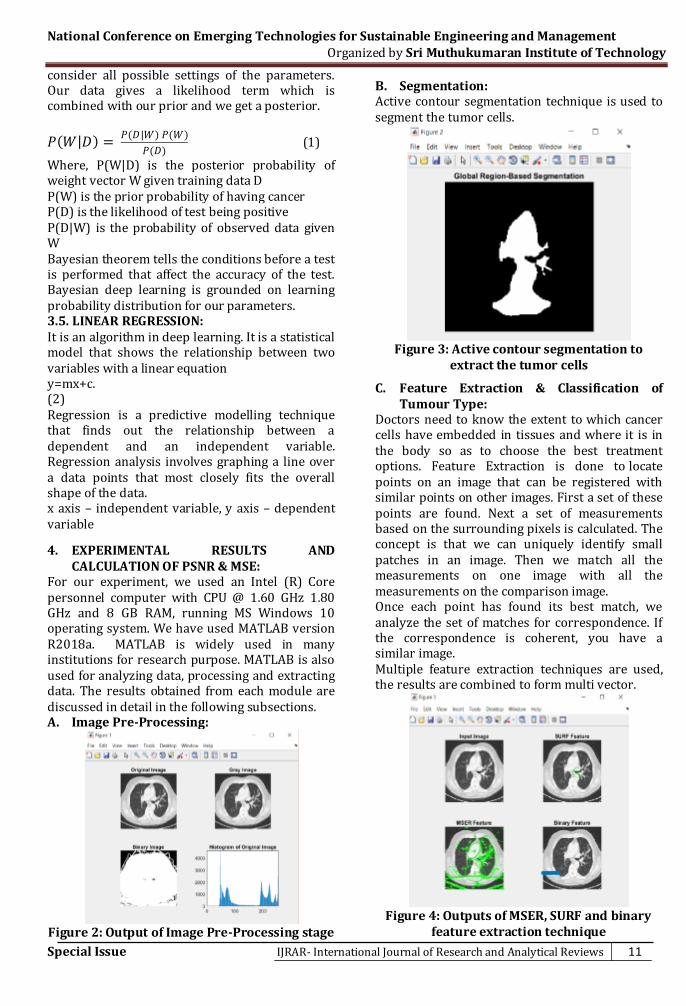
4. EXPERIMENTAL RESULTS AND CALCULATION OF PSNR & MSE:
For our experiment, we used an Intel (R) Core personnel computer with CPU @ 1.60 GHz 1.80 GHz and 8 GB RAM, running MS Windows 10 operating system. We have used MATLAB version R2018a. MATLAB is widely used in many institutions for research purpose. MATLAB is also used for analyzing data, processing and extracting data. The results obtained from each module are discussed in detail in the following subsections. A. Image Pre-Processing:
Figure 2: Output of Image Pre-Processing stage
B. Segmentation: Active contour segmentation technique is used to segment the tumor cells.
Figure 3: Active contour segmentation to
extract the tumor cells
C. Feature Extraction & Classification of Tumour Type:
Doctors need to know the extent to which cancer cells have embedded in tissues and where it is in the body so as to choose the best treatment options. Feature Extraction is done to locate points on an image that can be registered with similar points on other images. First a set of these points are found. Next a set of measurements based on the surrounding pixels is calculated. The concept is that we can uniquely identify small patches in an image. Then we match all the measurements on one image with all the measurements on the comparison image. Once each point has found its best match, we analyze the set of matches for correspondence. If the correspondence is coherent, you have a similar image. Multiple feature extraction techniques are used, the results are combined to form multi vector.
Figure 4: Outputs of MSER, SURF and binary
feature extraction technique

UGC Approved: 43602 e ISSN 2348 –1269, Print ISSN 2349-5138 http://ijrar.com/ NCETSEM-19
12 IJRAR- International Journal of Research and Analytical Reviews Special Issue
Figure 5: Output classifying the type of tumor
detected in the input image
D. Training the Neural Network: Once a neural network has been created, it needs to be configured and then trained. To do that, we introduce sample CT images of lung cancer to our network, define the layers of our network and then use code to tell MATLAB to train a network from scratch. The network is then tested by showing it new images that it hasn’t seen before and check its accuracy. For the training process, Bayesian Regularization algorithm has been used. To analyse the performance, the MSE is used.
Figure 6: GUI that appears once the network
has been trained
Figure 7: Performance Plot
Figure 8: Regression plot

National Conference on Emerging Technologies for Sustainable Engineering and Management Organized by Sri Muthukumaran Institute of Technology
Special Issue IJRAR- International Journal of Research and Analytical Reviews 13
Table 1: COMPARISON OF PSNR & MSE VALUES TEST IMAGE
EXISTING METHOD
PROPOSED METHOD
PSNR MSE PSNR MSE
IMAGE_1 34.6 21.7 34.83 21.41
IMAGE_2 34.82 21.08 34.91 20.94
IMAGE_3 36.0 16.10 36.12 15.88
5. CONCLUSION AND FUTURE WORK: In this paper, we have used two neural networks (Pattern Recognition Neural Net and NAR Neural Net) to segment lung tumors from CT. Our results clearly demonstrate the improvement in segmentation accuracy across multiple datasets. Our approach is applicable to longitudinal tracking of tumor volumes for cancers subjected to treatment with immunotherapy, which alters both the size and appearance of tumors on CT. Our architectures outperform existing methods. The DEEP LEARNING MULTI-FEATURE ALGORITHM can be used to detect other cancers like breast cancer, bone cancer, pancreatic cancer, uterine cancer etc.
REFERENCES 1. Lung Cancer Detection Using Multi-Layer
Neural Networks with Independent Component Analysis: A Comparative Study of Training Algorithms by Abdelwadood M. Mesleh* Computer
2. Effect of machine learning methods on predicting NSCLC overall survival time based on Radiomics analysis by Wenzheng Sun, Mingyan Jiang, Jun Dang3, Panchun Chang and Fang-Fang Yin
3. Jemal. A, R. Siegel, E. Ward, Y. Hao, J. Xu, T. Murray, et al., "Cancer statistics, 2008," CA: a cancer journal for clinicians, vol. 58, pp. 71-96, 2008.
4. Lung Nodule Detection Using Convolutional Neural Networks by Jiaying Shi
5. E.R. Velazquez, C. Parmar, M. Jermoumi, R. H. Mak, A. Van Baardwijk, F. M. Fennessy, et al., "Volumetric CT-based segmentation of NSCLC using 3D-Slicer," Scientific reports, vol. 3, p. 3529, 2013.
6. Computer aided lung cancer diagnosis with deep learning algorithms by Wenqing Suna, Bin Zhengb, c, Wei Qiana, c a
7. Lei Fan, Zhaoqiang Xia, Xiaobiao Zhang, Xiaoyi Feng. "Lung nodule detection based on 3D convolutional neural networks", 2017 International Conference on the Frontiers and Advances in Data Science (FADS), 2017
8. Ravindranath, K. Somashekar. "Early detection of lung cancer by nodule extraction — A survey", 2017 International Conference on Electrical, Electronics, Communication, Computer, and Optimization Techniques (ICEECCOT), 2017
9. Lung Cancer Detection Using Image Processing Techniques by Mokhled S. AL-TARAWNEH - YEAR 2012
10. Lung Cancer Tumour Region Segmentation Using Recurrent 3D-DenseUNet - 2013

UGC Approved: 43602 e ISSN 2348 –1269, Print ISSN 2349-5138 http://ijrar.com/ NCETSEM-19
14 IJRAR- International Journal of Research and Analytical Reviews Special Issue
DEVELOPMENT OF IMAGE PROCESSING TECHNIQUES FOR DETECTION OF SURFACE DEFECTS ON LEATHER BYVARIOUS ALGORITHMS USING
MATLAB
Archana K1, Ajin Roch 2, Dhivya R 3, Tadiparthi Sumedha 4, Preethi S 5, Syed Ameen K 6 1,3,4,5,6 Students, ECE, SRMIST, Ramapuram
2 Asst.proff, ECE, SRMIST, Ramapuram
ABSTRACT: Defects occur in leather and are identified at different stages of processing such as tanning, crust, finishing etc. Detecting and classifying leather surface defects are of great importance to industries that use leather as a main raw material such as leather footwear, bag manufacturers etc. Manual inspection and analysis vary from person to person and is labor intensive, tedious. As a consequence, the identification of leather defects becomes ambiguous that affects the quality control clearance of global trading and thus reducing the productivity. This paper presents a novel technique for identifying the defects in leather by using Matlab. The results achieved formally to identify the leather defects by SVM algorithm are not upto their required standards. In order to get better clarity regarding leather defects, results are being compared with other edge detection methods such as Sobel, Roberts, Canny and Laplacian methods.
Keywords: Leather, Gaussian, Canny
I. INTRODUCTION Leather is made from skin of various animals such as goatskin, cattle hide, pigskin etc. Leather and leather products are used by all human kind from ancient days. There are various tanning processes in manufacturing of leather. Since leather is used in various fields, certain quality degrading properties must be checked before processing it. Such qualities include defects in their surface. These defects arise even before they are tanned. Leather must be put into quality check process before industries starts processing it. The defects arises from the animal skin are ring worms, cut. Edge detection is a type of image segmentation technique with set of mathematical methods which determines the presence of edge or line formally called a discontinuity and outlines them in an appropriate way in digital image. By using this edge detection methods the leather defects can be identified and manual work is reduced.
II. AFFILIATED WORKS Prominent works have been done by scientific community to automate many leather manufacturing processes especially for leather analysis and characterization. . Quality of leather is being tested along with deduction of various mathematical parameters have been proposed in [1]. Here consistency of output is not maintained in regular interval. Mechanized vision-based framework which comprises of picture catching
instrument and an examination strategy for recognizing on the outside of leather material have been proposed. Here SVM algorithm is being employed which only classifies the surface as defective and defect less. Another algorithm that uses edge detection mechanism to identify nature of defect have been proposed in [3] which examines boundaries and boundary value of the defects. Furthermore, leather defects are being identified through auto adaptive edge detection algorithm which have been proposed in [5]. Results achieved through this are not up to required standards. Using wavelet feature extraction method identification of leather defects is being proposed in [4]. Here leather defects were identified by its texture using wavelet statistical features and wavelet co-occurrences matrix features such as entropy, energy, contrast, correlation etc. So, basically classification of leather defects was done by employing Support Vector Machine algorithm with wavelet based feature extraction technique. Achieving automation in leather surface inspection is being proposed in [6]. It covers some important issues on inspecting leather surfaces using machine vision system. These investigations include defect detection algorithm, defect classification methods, materialhandling.

National Conference on Emerging Technologies for Sustainable Engineering and Management Organized by Sri Muthukumaran Institute of Technology
Special Issue IJRAR- International Journal of Research and Analytical Reviews 15
III. GLOBAL THRESHOLDING ALGORITHMOVERVIEW
Global thresholding consists of setting an intensity value (threshold) such that all voxels having intensity value below the threshold belong to one phase, the remaining belong to the other. Global thresholding is as good as the degree of intensity separation between the two peaks in the image .It is based on assumption that the image has a bimodal histogram and, therefore, the object can be extracted from the background by a simple operation that compares image values with a threshold value .The result of thresholding is a binary image, where pixels with intensity value of 1 correspond to objects , whereas pixel with value 0 correspond to the background.
IV. CONVENTIONAL EDGE DETECTION METHODSFOR LEATHER DEFECTS IDENTIFICATION
The discontinuities on the leather can be identified by the 1st and 2nd order derivatives. The vector representation of edge detection operators such as Prewitt, Sobel is given as
Here Gx and Gy are the x and y directions gradients. The magnitude of the vector is Mag
The angle is givenas
V. METHODOLOGY The primary strategy which consists of a frame work of the complete process is given below:
Fig. 1 Flowchart
VI. IMAGE ACQUISATION It is process of reading a grayscale or RGB image from the file denoted by the string filename, where the string format denotes the format of the file and store the image accordingly. We have used JPEG/JPG format
Fig. 2 Input image
VII. HISTOGRAM PLOT AND GAUSSIAN FILTERING
Histogram provides graphical representation of intensity of pixels vs the count of it as shown in (ii). In order to find intensity of each pixel we use histogram function. Gaussian filtering is an efficient way to remove noise and detail from the image as shown in (iii). The general histogram equalization formulais,m h(v)=round (Cdf(v)-Cdfmin / (M*N)- Cdfmin)*(L-1) where Cdfmin = minimum non-zero of cumulative distribution function. M*N= gives image’s no.of pixels[M is width & N is height]. L= number of gray level used. In one dimension, the gaussian function is

UGC Approved: 43602 e ISSN 2348 –1269, Print ISSN 2349-5138 http://ijrar.com/ NCETSEM-19
16 IJRAR- International Journal of Research and Analytical Reviews Special Issue
Where = standard deviation of distribution.
Fig. 3 Histogram plot and gaussian filtering
VIII. THRESHOLDING ANDFILLING HOLES Thresholding provides an easy and efficient way to perform image segmentation process on basis of different intensities or pixels in foreground and background regions of an image as shown in (iv). Filling holes performs fill operation on background pixels of the image, starting from the points specified and it makes the area under test visible clearly by completely filling the holes of the defective areas.Ifg(x,y)isathresholdversionoff(x, y) at some global threshold T, G (x, y) = 1, if f (x, y)>= T 0, otherwise
Fig. 4 Thresholding and filling holes
IX. DILATION ANDEROSION Dilation and erosion process work hand in hand. Dilation adds pixels to the boundary as shown in (v) while erosion removes the pixels from the boundary depending upon required shape and size.
Fig. 5 Dilation and erosion
IX. EDGE AND LABELDETECTION Edge detection is a technique to find the boundaries of areas within the image and also used in extracting the areas clearly and mark in edges accordingly. Labelling function provides number of defects present on the surface and give
its count. The different types of edge detectors are: Canny, Sobel, Prewitt, Log, Robert
Fig. 6 Edge and label detection
Fig. 7 Edge and label detection
XI. TYPE OFDEFECT Here defect in lether are classified into two categories – Flay cut and Lumpy ringworm. Flay cuts are knife marks on the flesh of hides that are caused by careless use of the knife throughout the removal of the skin from the body. DERMATOMYCOSIS is the technical name for lumpy ring worm. On leather, a lumpy ring worm looks like a circula formed lesions that are typically between 1 and 5cm in diameter and typically the grain surface is also slightly raised. XII. AREA CALCULATION The final part of the process involves finding the total area of the leather, total area of the defective area, percentage of which it covers. By eliminating total area of the defects on the surface, we can extract, balance how much area is left out for further use and manufacturing. Here we are calculating area with respect to pixels of the image .

National Conference on Emerging Technologies for Sustainable Engineering and Management Organized by Sri Muthukumaran Institute of Technology
Special Issue IJRAR- International Journal of Research and Analytical Reviews 17
Total area of image = length*height
Defective portion area= length*height of particular defective part
Defective area (%) = total defective area /total area of image
For example,Total Defective Area (in Pixels) =554467 Total Image Area (in Pixels) =3182004 Total Defective Area of the Image (in %)=17.425088
From above information, we can infer that the first line of the function gives us the total defective area of the pixel, then total area of whole leather surface is calculated. Manipulating the mathematical vectors, we get total defective area over the leather surface and balance undefected area is cut and thrown in for the leather manufacturingprocess.
XIII. RESULTS A leather image is being acquired as shown in (i). Then it undergoes various process as listed and finally it tells us what type of defect is present and the number of defects as shown in (vi). From above results of various processes it can be concluded that defect it holds is “LUMPY RINGWORM”. Statistical analysis of the defected area of the surface using the parameters PSNR and MSE. The results have been tabulated below. It is inferred that higher the value of MSE and elapsed time along with the moderate PSNR value provides the output image with high accuracy. Same way, lower the MSE and Elapsed time yields the image with unfinished edges TABLE 1 FLAYCUT
TYPE OF PSNR MSC ELAPSED
EDGE TIME
DETECTORS
CANNY 0.717890 55117.732141 0.561466
SOBEL
9.925957
6614.311093
0.125877
ROBERT 2.775328 34320.018967 0.071081
LOG 2.775326 34320.018967 0.274518
PREWITT 9.915482 6630.283933 0.135230
Fig. 8 Statistical measurements of flay cut
TABLE 2
TYPE OF PSNR
MSC
ELAPSED
EDGE TIME
DETECTORS
LUMPY CANNY
0.926516
52532.580609
0.498376
RING SOBEL
9.390299
7482.564892
0.101808
WORM ROBERT
3.942572
26231.501857
0.053405
LOG 3.942572 26231.501856 0.240062
PREWITT
9.394933
7474.584837
0.122596
Fig. 9 Statistical measurements of lumpy ring worm
XIV. OUTPUT
Fig.10 Final output
XV. CONCULSION The proposed work introduces an informational index that can be readied dependent on specific use of calfskin e.g. leather in shoe industry, baggage industry etc. In order to diagnose a defected leather sample, the following processing phases have been applied: histogram, thresholding, filtering, labeling and classification. Applying this to defect requires only spatial considerationsto be taken in order to procure an adequate set of images for training purpose as representative to thesehuddles.
XVI. ACKNOWLEDGEMENT We heartfully thank our academic institution SRM IST and research institution CSIR- CEERI Chennai, for guiding us throughout the research process and giving us the opportunity to present our work.
REFERNCES 1. Parag kholi, Leather quality estimation using
automated machine vision system, volume 3 (IEEE), issue 3(may-june2013).
2. Hoang-Quan Bong, Vision based inspection system for leather surface defect detection and classification, IEEE 2018 5th NAFOSTED

UGC Approved: 43602 e ISSN 2348 –1269, Print ISSN 2349-5138 http://ijrar.com/ NCETSEM-19
18 IJRAR- International Journal of Research and Analytical Reviews Special Issue
Conferenceon information and computer science (NICS).
3. Smrti H.Bhandari , S.M.Deshpande, A simple approach to surface defect detection, December8-10,2008.
4. MalathyJawahar,N.K.Chandra Babu,K.Vani ,Leather texture classification using wavelet feature extraction technique.
5. Murali Krishna Kasi, J Bhaskara Rao, Vijay Kumar Sahu, Identification of leather defects using an autoadaptive edge detection image processingalgorithm.
6. K.Hoang , W. Wen, A. Nachimuthu, X.L. Jiang, Achieving automation in leather surface inspection , December1996.
National Conference on Emerging Technologies for Sustainable Engineering and Management Organized by Sri Muthukumaran Institute of Technology
Special Issue IJRAR- International Journal of Research and Analytical Reviews 19
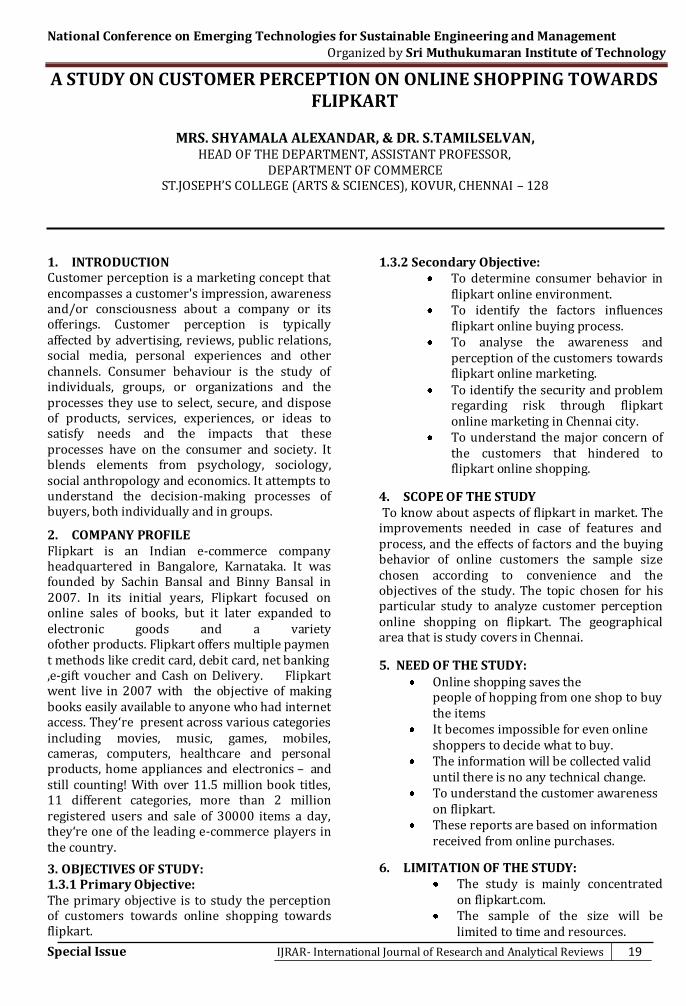
A STUDY ON CUSTOMER PERCEPTION ON ONLINE SHOPPING TOWARDS FLIPKART
MRS. SHYAMALA ALEXANDAR, & DR. S.TAMILSELVAN,
HEAD OF THE DEPARTMENT, ASSISTANT PROFESSOR, DEPARTMENT OF COMMERCE
ST.JOSEPH’S COLLEGE (ARTS & SCIENCES), KOVUR, CHENNAI – 128
1. INTRODUCTION Customer perception is a marketing concept that encompasses a customer's impression, awareness and/or consciousness about a company or its offerings. Customer perception is typically affected by advertising, reviews, public relations, social media, personal experiences and other channels. Consumer behaviour is the study of individuals, groups, or organizations and the processes they use to select, secure, and dispose of products, services, experiences, or ideas to satisfy needs and the impacts that these processes have on the consumer and society. It blends elements from psychology, sociology, social anthropology and economics. It attempts to understand the decision-making processes of buyers, both individually and in groups.
2. COMPANY PROFILE Flipkart is an Indian e-commerce company headquartered in Bangalore, Karnataka. It was founded by Sachin Bansal and Binny Bansal in 2007. In its initial years, Flipkart focused on online sales of books, but it later expanded to electronic goods and a variety ofother products. Flipkart offers multiple payment methods like credit card, debit card, net banking,e-gift voucher and Cash on Delivery. Flipkart went live in 2007 with the objective of making books easily available to anyone who had internet access. They‘re present across various categories including movies, music, games, mobiles, cameras, computers, healthcare and personal products, home appliances and electronics – and still counting! With over 11.5 million book titles, 11 different categories, more than 2 million registered users and sale of 30000 items a day, they‘re one of the leading e-commerce players in the country.
3. OBJECTIVES OF STUDY: 1.3.1 Primary Objective:
The primary objective is to study the perception of customers towards online shopping towards flipkart.
1.3.2 Secondary Objective: To determine consumer behavior in
flipkart online environment. To identify the factors influences
flipkart online buying process. To analyse the awareness and
perception of the customers towards flipkart online marketing.
To identify the security and problem regarding risk through flipkart online marketing in Chennai city.
To understand the major concern of the customers that hindered to flipkart online shopping.
4. SCOPE OF THE STUDY To know about aspects of flipkart in market. The improvements needed in case of features and process, and the effects of factors and the buying behavior of online customers the sample size chosen according to convenience and the objectives of the study. The topic chosen for his particular study to analyze customer perception online shopping on flipkart. The geographical area that is study covers in Chennai.
5. NEED OF THE STUDY: Online shopping saves the
people of hopping from one shop to buy the items
It becomes impossible for even online shoppers to decide what to buy.
The information will be collected valid until there is no any technical change.
To understand the customer awareness on flipkart.
These reports are based on information received from online purchases.
6. LIMITATION OF THE STUDY: The study is mainly concentrated
on flipkart.com. The sample of the size will be
limited to time and resources.

UGC Approved: 43602 e ISSN 2348 –1269, Print ISSN 2349-5138 http://ijrar.com/ NCETSEM-19
20 IJRAR- International Journal of Research and Analytical Reviews Special Issue
The information will be collected valid until there is no any technical change or any innovations.
To understand the customer awareness on flipkart.
The result is assuming the respondents have given accurate information.
7. REVIEW OF LITERATURE: Saritha Rai (2016) in her article stated that India’s mobile phone subscriber base crested the 1 billion users mark, as per data released recently by the country’s telecom regulator. But experts see the milestone as the beginning of some dramatic action rather than as a climax. It is assumed that there will be expected growth in smart phone users in recent future. It will help mobile operators in increase in data usage. There is positive move by the government to initiate Digital India Campaign which will expect rise in E-Governance in India. Anu Raghunathan (2016) in her article stated that there is huge rise in the private equity investment in internet and mobile services in India during the year 2015. The amount of investment during the year 2015 is $5.3 billion. This amount is one third of the total investment in the year 2015 by private equity companies in India. The major investors are Flipkart with $700 million and Ola and Snapdeal with $500 million investment during the year 2015.
8. RESEARCH METHODOLOGY 8.1 Research Design Research design is needed because it facilitates the smooth sailing of the various research operations thereby making research as effective as possible yielding maximal information with minimal expenditure of efforts, time and money. 8.2 Sampling Design Sampling is concerned with the selection of the subset of individual from within a statistical population to estimate characteristic of the old population. 8.3 Total Population The total population in porur is around 28,000 people. Over 10,000 people from porur purchase things through flipkart. 8.4 SAMPLE SIZE 115 respondents are chosen for the study 8.5 Area of the Study
This study is based on the data collected from the customer perception on online shopping towards flipkart.
9. Data Analysis and Interpretation 9.1 AGE
TABLE NO – 9.1
NO CATEGO
RY NO.OF
RESPONDENTS
PERCENTAGE
1 Below 18 68 60
2 18-24 27 23.4 3 25-34 17 15
4 35-44 3 2.6
TOTAL 115 100
INTERPRETATION: From the above table we observe that 60% respondents are between below 18, 23% respondents are between 18-24 years old, 15% respondents are between 25-34 years old, and 2.6% respondents are between 35- 44. 9.2 EDUCATION LEVEL
TABLE NO – 9.2 S.NO
CATEGORY
NO.OF RESPONDENT
S
PERCENTAGE
1 Higher Secondary
51 45
2 UG 42 36.5 3 PG 12 10.4 4 All the
above 3 8.6
TOTAL 115 100
From the above table we observe that 45% of respondents are higher secondary, 36.5% of respondents are UG, 10.4% of respondents are PG, 8.6% of respondents are all the above.
9.3 MONTHLY INCOME TABLE NO – 9.3
.NO CATEGORY NO.OF RESPONDENTS
PERCENTAGE
1 Less than 10,000
62 53.9
2 10,100-15,000
28 24.5
3 15,100-20,000
18 15.6
4 20,000 and above
7 6
TOTAL 115 100
INTERPRETATION: From the above table we observe that 60% of respondents are Less than 10,000, 23% of respondents are 10,100-15,000, 13% of respondents are 15,100-20,000 and 4% of respondents are 20,000 and above.

National Conference on Emerging Technologies for Sustainable Engineering and Management Organized by Sri Muthukumaran Institute of Technology
Special Issue IJRAR- International Journal of Research and Analytical Reviews 21
9.4 ONLINE PURCHASE TABLE NO – 9.4
S. No
Category No. Of Respondents
Percentage
1 Everyday 40 36
2 Once in every two week
31 20
3 Once a month 20 20 4 Every two or
three months 24 24
TOTAL 115 100
INTERPRETATION: From the above table we observe that 36% of respondents are Everyday and 20% of respondents are Once in every two week, 20% of respondents are Once a month and 24% of respondents are Every two or three months.
9.5 CHOOSING FLIPKART TABLE NO – 9.5
S.NO
CATEGORY
NO.OF RESPONDENT
S
PERCENTAGE
1 Very convenient and time saving
50 44
2 Low price 34 28 3 Product
variety 20 18
4 Others 11 10 TOTAL 115 100
INTERPRETATION: From the above table we observe that 44% of respondents are Very convenient and time saving, 28 % of respondents are Low price, 18% of respondents are Product variety and 10% of respondents are others. 9.6 CHI-SQUARE TEST:
O E (O-E)² (O-E)²/E
68 65 9 0.1
27 27.5 0.25 0.09
17 17.5 0.25 0.5
3 5 4 0.8
62 65 6 0.09
28 27.5 0.25 0.009
18 17.5 0.25 0.01
7 5 4 0.8
Total 2.39
Degree of freedom =(R-1)*(C-1) = (2-1) * (4-1), =1*3, = 3. Level of significance =5, Table value of 3 =7.815 CONCLUSION: H0 :There is association between age and monthly income in flipkart. H1 :There is no association between age and monthly income in flipkart. Here calculated value is lesser than the table value, so HO is accepted and H1 is rejected. Hence Customer perception on online shopping towards flipkart is independent.
10. 1. FINDINGS: Students and salaried persons are most
frequent users of Flipkart. Frequency of purchase for electronics,
books and music, apparels and accessories are more in Flipkart.
Word of mouth was more influential in promotion as many people were made aware by their friends and family when customers recommend this website to them.
Highly discounted products got out of stock quickly, since customers purchased it as soon as they could when they see high discount on good featured product.
The services provided by Flipkart are good and even more scope of development is there for increasing the customer strength.
Digital marketing techniques like search engine marketing, links providing other website and advertisement also functioned well for promotion of this website.
Fast delivery is one of best service Flipkart is providing.
Different payment options available in Flipkart made customers more satisfied and comfort for paying while purchasing product.
Customers feeling more secured when purchasing through Flipkart because of different policies and services they have.
In comparison with competitors, Flipkart is charging free shipping for the purchase of 300 plus rupees, while others free ship the service without any barrier.
Out of stock is the main issue faced by Flipkart.
Most of customers have good experience with Flipkart while purchasing products.

UGC Approved: 43602 e ISSN 2348 –1269, Print ISSN 2349-5138 http://ijrar.com/ NCETSEM-19
22 IJRAR- International Journal of Research and Analytical Reviews Special Issue
Most of them are satisfied with the services of Flipkart and so that they succeed in retaining the customers.
Advertising is an important way to have the brand and products familiar to Convenience and time saving are two important factors that customer looking for while purchasing through online.
10.2 SUGGESTION: Flipkart has successfully placed itself into the prospects mind making it the India‘s online store with huge range of products. But it still needs to work on their core competence that is books and stationery items. Delivery services can be improved mainly in rural areas by selecting appropriate courier service which has services in customer area for dispatching an item Can make free delivery to all priced products. Can include more coupon codes and gift vouchers for increasing the traffic of the customers. Out of stock items can made available as soon as possible and intimate the needed customers. 10.3 CONCLUSION: The thorough study is based on the consumer behaviour analysis which serves a great idea regarding consumer perception when they go for online shopping. In order to satisfy themselves consumer perceive many things before buying products and they will be satisfied if the company meet their expectation. The Overall Brand Value of Flipkart is good, Talking about domestic market i.e India, it is the most superior E-business portal which is aggressively expanding & planting its roots deep into the Indian market & at the same time shifting the mind-set of the people from going &shopping from physical store to online stores, which is magnificent!.Be very focused on consumers and build amazing experiences for the customers.
References: 1. Anu Raghunathan, ‘Internet And Mobile
Companies Gain In India's Record Private Equity Year’, Forbes, 2016
2. Ashok Gopal and Rajesh Srinivasan, ‘The New Indian Consumer’, Harvard Business Review, October 2006
3. Dorie Clark, ‘Cracking The Code Of Consumer Psychology’, Forbes August 2013
4. David Loudon, et.,al, Consumer Behavior: Concepts and Applications, McGraw-Hill Education, 1991
5. Hazel Barkworth, ‘Six Trends That Will Shape Consumer Behavior This Year’, Forbes, FEB 4, 2014
6. Hashim Zameer, et.,al, ‘Mobile Phone Buying Behavior Of Consumers; A Comparative Study
Of Rural And Urban Consumers In Pakistan Global Journal of Management and Business Research, March 2012
7. Mesay Sata, ‘Factors Affecting Consumer Buying Behavior of Mobile Phone Devices’, Mediterranean Journal of Social Sciences, October 2013.
8. Michael DeGusta, ‘Are Smart Phones Spreading Faster than Any Technology in Human History?’, MIT Technology Review, May 2012.
9. Mobile Behavior Report by Saleforce Marketing Cloud, 2014
10. Md.Ashaduzzaman, et.,al, ‘ConsumeChoice Behaviour Towards Mobile Phone Operators in Bangladesh’, Researcher World – Journal of Arts, Science and Commerce, October 2011
11. Nitin Gupta, ‘Globalization does lead to change in consumer behavior: An empirical evidence of impact of globalization on changing materialistic values in Indian consumers and its aftereffects’, Asia Pacific Journal of Marketing and Logistics, 2011
12. Saritha Rai, ‘India Just Crossed 1 Billion Mobile Subscribers Milestone And The Excitement’s Just Beginning’ Forbes, 2016
13. Sharma Shashikumar, ‘An Empirical Study of Consumer Behaviour in Mobile Phone Market in Bhutan’, Management Convergence, June 2010
14. Tim Worstall, ‘The Shopping Malls Really Are Being Killed By Online Shopping’, Forbes, January 2015
15. The Second Quarter Report by Ericsson, July 2015

National Conference on Emerging Technologies for Sustainable Engineering and Management Organized by Sri Muthukumaran Institute of Technology
Special Issue IJRAR- International Journal of Research and Analytical Reviews 23
POWERFUL AND PRODUCTIVE PERCEPTION OF DDOSED ATTACKS FOR LARGE SCALE INTERNET
Ms. R. Krishna Bharathi & Mr. P. Jayakrishnan
Department of Information Technology, Sri Muthukumaran Institute of Technology, Chennai, India
ABSTRACT: This paper acquaints a refined system with sort out stealthy strike outlines against applications running in the cloud. Instead of going for making the organization involved, the proposed framework goes for mishandling the cloud flexibility, convincing the application to eat up a more prominent number of advantages than required, impacting the cloud customer more on cash related viewpoints than on the organization openness. The attack illustration is orchestrated with a particular deciding objective to evade, or in any case, unbelievably concede the techniques proposed in the composition to recognize low-rate ambushes. In particular, the attack force (similarly as organization sales rate and synchronous ambush sources) is progressively enhanced by a patient aggressor, remembering the deciding objective to bring about basic budgetary setbacks, paying little respect to the way that the strike illustration is performed in comprehension to the best job size and passage rate of the organization requests allowed in the structure. Using a modified exhibit observationally laid out, we surmise an expression for regulated extending the quality of the strike, as a part of the accomplished organization defilement (without knowing early the target system capacity). We show that the parts offered by the cloud supplier, to ensure the SLA organized with the customer (tallying the stack changing and auto-scaling instruments), can be toxically abused by the proposed stealthy ambush, which bit by bit incapacitates the benefits gave by the cloud supplier, and developments the costs brought on by the customer.
Keywords: dos attacks,ddos ttacks, attacker, client.
I. Introduction This paper introduces a modern methodology to organize stealthy assault designs against applications running in the cloud. Rather than going for making the administration distracted, the proposed methodology goes for abusing the cloud adaptability, compelling the application to devour a greater number of assets than required, influencing the cloud client more on money related angles than on the administration accessibility. The assault example is arranged so as to dodge, or be that as it may, incredibly postpone the strategies proposed in the writing to distinguish low-rate assaults. It doesn't display an intermittent waveform run of the mill of low-rate debilitating assaults. Conversely with them, it is an iterative and incremental procedure. Specifically, the assault power (as far as administration solicitations rate and simultaneous assault sources) is gradually improved by a patient aggressor, so as to dispense noteworthy monetary misfortunes, regardless of the fact that the assault example is performed in agreement to the most extreme employment size and landing rate of the administration demands permitted in the framework. Utilizing an improved model experimentally outlined, we infer an expression for bit by bit expanding the strength of the
assault, as a component of the achieved administration debasement (without knowing ahead of time the objective framework ability). We demonstrate that the elements offered by the cloud supplier, to guarantee the SLA arranged with the client (counting the heap adjusting and auto-scaling instruments), can be perniciously abused by the proposed stealthy assault, which gradually debilitates the assets gave by the cloud supplier, and expansions the expenses brought about by the client.
II. RELATED WORKS In, Intrusion Detection System for Cloud Computing by Ms. Parag K. Shelke, Ms. Sneha Sontakke, Dr. A. D. Gawande in 2008[1], Giving security in an appropriated framework requires more than client verification with passwords or computerized authentications and classification in information transmission. Circulated model of cloud makes it helpless and inclined to modern conveyed interruption assaults like Distributed Denial of Service (DDOS) and Cross Site Scripting (XSS). To handle vast scale system access movement and managerial control of information and application in cloud, another multi-strung disseminated cloud IDS model has been proposed. Our proposed cloud IDS handles expansive stream of information bundles,
UGC Approved: 43602 e ISSN 2348 –1269, Print ISSN 2349-5138 http://ijrar.com/ NCETSEM-19
24 IJRAR- International Journal of Research and Analytical Reviews Special Issue
investigate them and produce reports proficiently by coordinating learning and conduct examination to identify interruptions. In, State Monitoring in Cloud Datacenters, by Shicong Meng, Student Member, IEEE, Ling Liu, Senior Member, IEEE in 2010[2]. It aims at Checking worldwide conditions of a circulated cloud application a basic usefulness for cloud datacenter administration. State checking requires meeting two requesting goals: abnormal state of rightness, which guarantees zero or low blunder rate, and high correspondence productivity, which requests insignificant correspondence cost in distinguishing state overhauls. Most existing work takes after a prompt model which triggers state alarms at whatever point a requirement is damaged. This model may bring about continuous and superfluous alarms because of passing esteem blasts and exceptions. Countermeasures of such cautions may advance bring about risky operations. In this paper, we display a WIndow-based StatE checking (WISE) system for productively overseeing cloud applications. Window-based state observing reports cautions just when state infringement is ceaseless inside a period window. We demonstrate that it is not just stronger to esteem blasts and exceptions, additionally ready to spare impressive correspondence when actualized in a circulated way taking into account four specialized commitments. In the first place, we show the structural configuration and sending choices for window-based state observing with unified parameter tuning. Second, we build up another disseminated parameter tuning plan empowering WISE to scale to significantly more observing hubs as every hub tunes its checking parameters responsively without worldwide data. Third, we present two streamlining procedures, including their configuration method of reasoning, rightness and utilization model, to assist lessen the correspondence cost. At long last, we give a top to bottom observational investigation of the adaptability of WISE, and assess the change brought by the dispersed tuning plan and the two execution advancements. Our outcomes demonstrate that WISE decreases correspondence by 50-90 percent contrasted and quick checking approaches, and the enhanced WISE picks up a reasonable adaptability advantage over its brought together form. In, Low-Rate TCP-Targeted Denial of Service Attacks by Aleksandar Kuzmanovic and Edward W. Knightly, in 2013[4]. It aims at Disavowal of Service assaults are introducing an expanding
risk to the worldwide between systems administration foundation. While TCP's blockage control calculation is exceptionally vigorous to differing system conditions, its certain supposition of end-framework participation results in a surely understood powerlessness to assault by high-rate non-responsive streams. In this paper, we examine a class of low-rate refusal of administration assaults which, dissimilar to high-rate assaults, are troublesome for switches and counter-DoS instruments to distinguish. Utilizing a blend of systematic displaying, reenactments, and Internet tests, we demonstrate that malevolently picked low-rate DoS movement designs that adventure TCP's retransmission time-out instrument can throttle TCP streams to a little part of their optimal rate while evading location. In addition, thusly assaults abuse convention homogeneity, we examine principal breaking points of the capacity of a class of randomized time-out systems to foil such low-rate DoS assaults. In, Network-based and Attack-resilient Length Signature Generation for Zero-day Polymorphic Worms by Zhichun Li, Lanjia Wang, Yan Chen and Zhi (Judy) Fu, in 2014[5]. It is pivotal to distinguish zero-day polymorphic worms and to create marks at the edge system entryways or honeynets with the goal that we can keep the worms from engendering at their initial stage. Be that as it may, most existing system based marks produced are not weakness based and can be effortlessly avoided by assaults. In this paper, we propose creating defenselessness construct marks in light of the system level with no host-level investigation of worm execution or helpless projects. As the initial step, we plan a system based Length-based Signature Generator (LESG) for worms in view of cushion flood vulnerabilities1. The marks produced are natural for support floods, and are hard for aggressors to dodge. We encourage demonstrate the assault versatility limits even under most pessimistic scenario assaults with planned clamor infusion. In addition, LESG is quick and noisetolerant and has effective mark coordinating. Assessment in view of genuine vulnerabilities of different conventions and genuine system activity shows that LESG is promising in accomplishing these objectives. In Weaknesses, vulnerabilities and elusion Strategies against intrusion detection Systems, by Hossein Jadidoleslamy in 2012[6]. One of most imperative existent issues in data security application space is Intrusion Detection System (IDS); IDS is a guarded forceful framework to

National Conference on Emerging Technologies for Sustainable Engineering and Management Organized by Sri Muthukumaran Institute of Technology
Special Issue IJRAR- International Journal of Research and Analytical Reviews 25
ensure data, checking and reacting to happening assaults on PC frameworks and systems. This paper talks about various subjects including showing a few methodologies against IDSs to going from them; this prompts enhancing identification level and execution of IDS; likewise, this paper thinks of some as interruption apparatuses, new assaults examples and following aversion procedures. Furthermore, it examines vulnerabilities, security gaps and IDSs' auxiliary and systemic issues to taking out deformities, lessening enters and revising their conduct. At long last, it prompts expanding the usefulness coefficient of IDSs, advancing the security level of PC frameworks and systems, expanding the trust of approved clients. In this way, the proposed techniques in this paper can apply to enhancing the IDSs by utilizing backwards designing strategies.
III. PROPOSED WORK In this anticipate, it is proposed to tackle Denial of Service assaults in Cloud. A technique to actualize stealthy assault designs, which display a gradually expanding polymorphic conduct that can avoid. be that as it may, significantly postpone the methods proposed in the writing to distinguish low-rate assaults. A procedure to arrange stealthy assault designs, which display a gradually expanding force pattern intended to deliver the greatest budgetary expense to the cloud client, while regarding the employment size and the administration entry rate forced by the recognition systems.
IV. ALGORITHM / METHODS As assessing information unwavering quality is liable to a few vulnerabilities, we propose to model data by the method for proof hypothesis, for its ability to model instability and for its abundance in combination administrators. Slowly Increasing Polymorphic DDOS Attack Strategy (SIPDAS), to Detect low rate assaults and forestall Dos utilizing SIPDAS. We compute the twofold autocorrelation (DA) coefficient arrangement and look at the main Nmax components in such arrangement. On the off chance that the conduct in the pattern part has an obvious expanding or declining inclination, then those Nmax qualities will all surpass a specific edge.
V. SYSTEM ARCHITECTURE
Fig. 1. System architecture
The frameworks modeler sets up the fundamental structure of the framework, characterizing the crucial center configuration elements and components that give the system. The frameworks modeler gives the engineers perspective of the clients' vision. Above graph client first login to the record then he enter inquiry and it seek which are accessible in server and presentation question.
VI. MODULES 1. USER INTERFACE DESIGN: To interface with server client must give their username and secret key then no one but they can ready to associate the server. On the off chance that the client as of now exits specifically can login into the server else client must enroll their subtle elements, for example, username, secret key, Email id, City and Country into the server. Database will make the record for the whole client to keep up transfer and download rate. Name will be set as client id. Signing in is generally used to enter a particular page. It will look the inquiry and presentation the question. 2. CLOUD OWNER MODULE: This module is utilized to help the cloud server to view points of interest and transfer documents with the security. The individual cloud proprietor creates the security key. The Cloud proprietors see the client looking points of interest and the numbering of record solicitation subtle elements on Pie diagram. 3. FILE UPLOAD AND SHARING: This module is utilized to help the cloud server to store points of interest and transfer records with the security. In this module

UGC Approved: 43602 e ISSN 2348 –1269, Print ISSN 2349-5138 http://ijrar.com/ NCETSEM-19
26 IJRAR- International Journal of Research and Analytical Reviews Special Issue
documents are transferred by cloud proprietors and clients, these records are regular for all. These records are sharable for clients. 4. SERVICE ACCESSING MODULE: This module used to help the cloud client to get to the administration. It is the procedure of download the documents from the distributed storage. At the season of downloading client need to pass discharge key of the record, if the key is right means document will be download else we can't download the record. 5. DOS IN CLOUD: A foreswearing of administration (DoS) assault is a pernicious endeavor to make a server or a system asset distracted to clients, generally by incidentally hindering or suspending the administrations of a host associated with the Internet. A foreswearing of administration (DoS) assault is an episode in which a client or association is denied of the administrations of an asset they would regularly hope to have.
VII. SCREENSHOTS USER INTERFACE AUTHENTICATION-USER
AUTHENTICATION-ADMIN
FILE UPLOAD AND SHARING
SERVICE ACCESSING MODULE
DOS IN CLOUD (HOME PAGE)
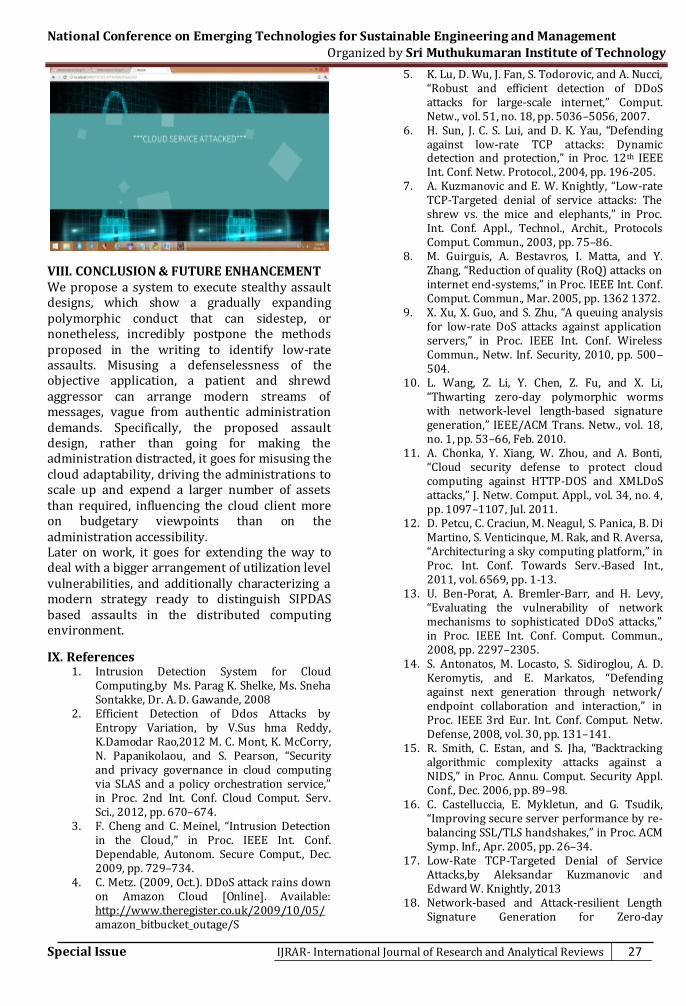
National Conference on Emerging Technologies for Sustainable Engineering and Management Organized by Sri Muthukumaran Institute of Technology
Special Issue IJRAR- International Journal of Research and Analytical Reviews 27
VIII. CONCLUSION & FUTURE ENHANCEMENT We propose a system to execute stealthy assault designs, which show a gradually expanding polymorphic conduct that can sidestep, or nonetheless, incredibly postpone the methods proposed in the writing to identify low-rate assaults. Misusing a defenselessness of the objective application, a patient and shrewd aggressor can arrange modern streams of messages, vague from authentic administration demands. Specifically, the proposed assault design, rather than going for making the administration distracted, it goes for misusing the cloud adaptability, driving the administrations to scale up and expend a larger number of assets than required, influencing the cloud client more on budgetary viewpoints than on the administration accessibility. Later on work, it goes for extending the way to deal with a bigger arrangement of utilization level vulnerabilities, and additionally characterizing a modern strategy ready to distinguish SIPDAS based assaults in the distributed computing environment.
IX. References 1. Intrusion Detection System for Cloud
Computing,by Ms. Parag K. Shelke, Ms. Sneha Sontakke, Dr. A. D. Gawande, 2008
2. Efficient Detection of Ddos Attacks by Entropy Variation, by V.Sus hma Reddy, K.Damodar Rao,2012 M. C. Mont, K. McCorry, N. Papanikolaou, and S. Pearson, “Security and privacy governance in cloud computing via SLAS and a policy orchestration service,” in Proc. 2nd Int. Conf. Cloud Comput. Serv. Sci., 2012, pp. 670–674.
3. F. Cheng and C. Meinel, “Intrusion Detection in the Cloud,” in Proc. IEEE Int. Conf. Dependable, Autonom. Secure Comput., Dec. 2009, pp. 729–734.
4. C. Metz. (2009, Oct.). DDoS attack rains down on Amazon Cloud [Online]. Available: http://www.theregister.co.uk/2009/10/05/ amazon_bitbucket_outage/S
5. K. Lu, D. Wu, J. Fan, S. Todorovic, and A. Nucci, “Robust and efficient detection of DDoS attacks for large-scale internet,” Comput. Netw., vol. 51, no. 18, pp. 5036–5056, 2007.
6. H. Sun, J. C. S. Lui, and D. K. Yau, “Defending against low-rate TCP attacks: Dynamic detection and protection,” in Proc. 12th IEEE Int. Conf. Netw. Protocol., 2004, pp. 196-205.
7. A. Kuzmanovic and E. W. Knightly, “Low-rate TCP-Targeted denial of service attacks: The shrew vs. the mice and elephants,” in Proc. Int. Conf. Appl., Technol., Archit., Protocols Comput. Commun., 2003, pp. 75–86.
8. M. Guirguis, A. Bestavros, I. Matta, and Y. Zhang, “Reduction of quality (RoQ) attacks on internet end-systems,” in Proc. IEEE Int. Conf. Comput. Commun., Mar. 2005, pp. 1362 1372.
9. X. Xu, X. Guo, and S. Zhu, “A queuing analysis for low-rate DoS attacks against application servers,” in Proc. IEEE Int. Conf. Wireless Commun., Netw. Inf. Security, 2010, pp. 500–504.
10. L. Wang, Z. Li, Y. Chen, Z. Fu, and X. Li, “Thwarting zero-day polymorphic worms with network-level length-based signature generation,” IEEE/ACM Trans. Netw., vol. 18, no. 1, pp. 53–66, Feb. 2010.
11. A. Chonka, Y. Xiang, W. Zhou, and A. Bonti, “Cloud security defense to protect cloud computing against HTTP-DOS and XMLDoS attacks,” J. Netw. Comput. Appl., vol. 34, no. 4, pp. 1097–1107, Jul. 2011.
12. D. Petcu, C. Craciun, M. Neagul, S. Panica, B. Di Martino, S. Venticinque, M. Rak, and R. Aversa, “Architecturing a sky computing platform,” in Proc. Int. Conf. Towards Serv.-Based Int., 2011, vol. 6569, pp. 1-13.
13. U. Ben-Porat, A. Bremler-Barr, and H. Levy, “Evaluating the vulnerability of network mechanisms to sophisticated DDoS attacks,” in Proc. IEEE Int. Conf. Comput. Commun., 2008, pp. 2297–2305.
14. S. Antonatos, M. Locasto, S. Sidiroglou, A. D. Keromytis, and E. Markatos, “Defending against next generation through network/ endpoint collaboration and interaction,” in Proc. IEEE 3rd Eur. Int. Conf. Comput. Netw. Defense, 2008, vol. 30, pp. 131–141.
15. R. Smith, C. Estan, and S. Jha, “Backtracking algorithmic complexity attacks against a NIDS,” in Proc. Annu. Comput. Security Appl. Conf., Dec. 2006, pp. 89–98.
16. C. Castelluccia, E. Mykletun, and G. Tsudik, “Improving secure server performance by re-balancing SSL/TLS handshakes,” in Proc. ACM Symp. Inf., Apr. 2005, pp. 26–34.
17. Low-Rate TCP-Targeted Denial of Service Attacks,by Aleksandar Kuzmanovic and Edward W. Knightly, 2013
18. Network-based and Attack-resilient Length Signature Generation for Zero-day

UGC Approved: 43602 e ISSN 2348 –1269, Print ISSN 2349-5138 http://ijrar.com/ NCETSEM-19
28 IJRAR- International Journal of Research and Analytical Reviews Special Issue
Polymorphic Worms, by Zhichun Li, Lanjia Wang†, Yan Chen and Zhi (Judy) Fu‡, 2014
19. A Defense Mechanism to Protect Cloud Comuputing Against Distributed Denial of Service Attacks, by K.Santhi, 2013
20. Low-Rate TCP-Targeted Denial of Service Attacks and Counter Strategies, by Aleksandar Kuzmanovic and Edward W. Knightly, 2009
21. State Monitoring in Cloud Datacenters, by Shicong Meng, Student Member, IEEE, Ling Liu, Senior Member, IEEE, 2010
22. Breaking the DDoS Attack Chain,by Bryan Harris Eli Konikoff Phillip Petersen, 2011
23. Denial of Service(DoS) attack incidents and defense mechanisms, by Venkat Jamadar,Jabiulla B,Rakesh S,Pradeep Sadanand, 2014
24. Weaknesses, vulnerabilities and elusion Strategies against intrusion detection Systems, by Hossein Jadidoleslamy, 2012

National Conference on Emerging Technologies for Sustainable Engineering and Management Organized by Sri Muthukumaran Institute of Technology
Special Issue IJRAR- International Journal of Research and Analytical Reviews 29
INDIVIDUALIZED USER AUTHORIZATION AND DYNAMIC TRUST IN SOCIAL NETWORKS
Mr.P.Jaya Krishnan & Ms.R.Krishna Bharathi
Assistant Professors, Department of Information Technology, Sri Muthukumaran Institute of Technology Chennai, India
ABSTRACT: In this ever growing internet world development of authorization mechanisms for secure information access by a several users becomes a major problem criterion. For user authorization we propose computational trust models which will distinguishes trusting belief in integrity from competence in different contexts. Trust model is the hotspot of present information security field. Internet has the characteristics of openness, anonymity and autonomy. All these extrude security problem. So, dynamic trust model is the most reliable approach to solve the network security problems. For different user behavior patterns simulation studies were used to compare performance. Experimentally results shows that it achieves higher performance than others mainly some unstable users which t hemselves used for false rating.
Keywords: Authorization, Social networks, trust model, security.
I. INTRODUCTION In a multi-agent system, agents interact
with each other to achieve a definite goal that they cannot achieve alone. Without proper defense schemes, attacks against reputation systems can overly inflate or deflate the item reputation scores, crash users’ confidence in online reputation systems, eventually undermine reputation-centric online businesses and lead to economic loss.
This model defines five conceptual trust types: trusting behavior, trusting intention, trusting belief, institution-based trust, and disposition to trust. Trusting behavior is an action that increases a truster's risk or makes the truster vulnerable to the trustee. Trusting intention indicates that a truster is willing to engage in trusting behaviors with the trustee. A trusting intention implies a trust decision and leads to a trusting behavior. Most of the existing global reputation models can successfully isolate malicious agents when the agents behave in a predictable way. However, these models suffer greatly when agents start to show dynamic personality i.e., when they start to behave in a way that benefits them. These models also fail to adapt to the abrupt change in agents’ behavior and as a result suffer when agents alter their activities strategically.
Competence trust is the trusting belief in a trustee's ability or expertise to perform certain tasks in a specific situation. Integrity trust is the belief that a trustee is honest and acts in favor of
the truster. The elements of the model environment, include two main types of actors, namely trusters and trustees, a database of trust information, and different contexts, which depend on the concerns of a truster and the competence of a trustee. In this model, a truster has one integrity trust per trustee in all contexts. If a trustee disappoints a truster, the misbehavior lowers the truster's integrity belief in him. For integrity trust, contexts do not need to be distinguished. Competence trust is context-dependent. The fact that Bob is an excellent professor does not support to trust him as a chief. A representation is devised to identify the competence type and level needed in a context. Two functions that relate contexts are defined. Our model also provides an effective load balancing scheme for proper distribution of workload among the service providing agents. A number of parameters have been considered in our trust model for computing the trust of an agent. Feedback credibility is used to measure the degree of accuracy of the feedback information that the recommending agent provides to the evaluator. Normally it is assumed that good agents always provide true feedback and malicious agents provide false feedback.
II.RELATED WORK Existing System User Authorization is now one of the major security issues in these days. It can be protected by various cryptographic techniques and using various algorithms. But there has been number of
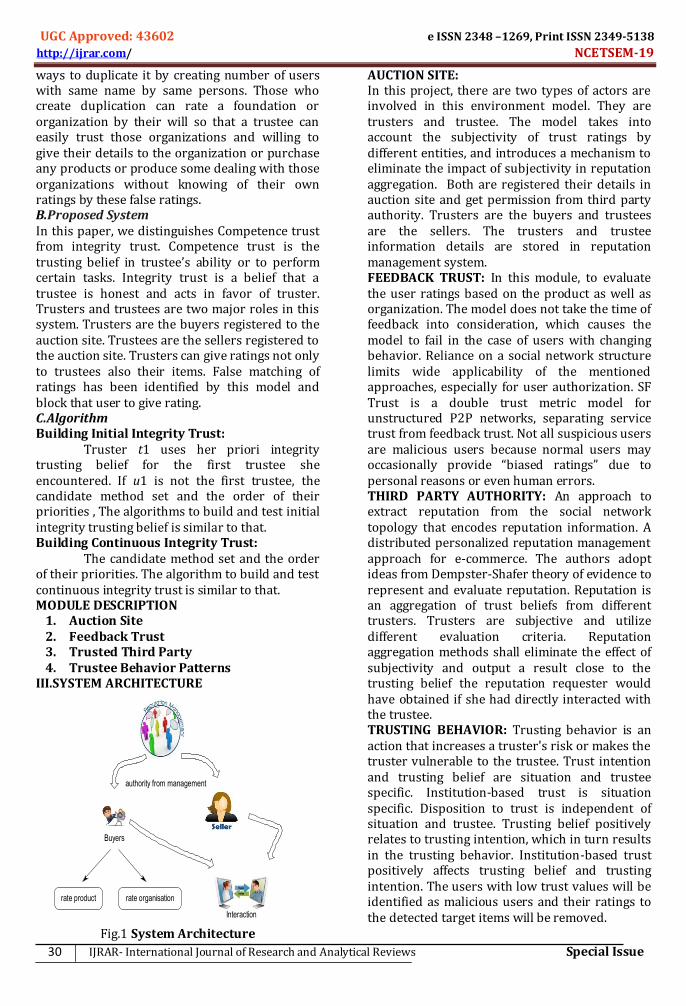
UGC Approved: 43602 e ISSN 2348 –1269, Print ISSN 2349-5138 http://ijrar.com/ NCETSEM-19
30 IJRAR- International Journal of Research and Analytical Reviews Special Issue
ways to duplicate it by creating number of users with same name by same persons. Those who create duplication can rate a foundation or organization by their will so that a trustee can easily trust those organizations and willing to give their details to the organization or purchase any products or produce some dealing with those organizations without knowing of their own ratings by these false ratings. B.Proposed System In this paper, we distinguishes Competence trust from integrity trust. Competence trust is the trusting belief in trustee’s ability or to perform certain tasks. Integrity trust is a belief that a trustee is honest and acts in favor of truster. Trusters and trustees are two major roles in this system. Trusters are the buyers registered to the auction site. Trustees are the sellers registered to the auction site. Trusters can give ratings not only to trustees also their items. False matching of ratings has been identified by this model and block that user to give rating. C.Algorithm Building Initial Integrity Trust: Truster t1 uses her priori integrity trusting belief for the first trustee she encountered. If u1 is not the first trustee, the candidate method set and the order of their priorities , The algorithms to build and test initial integrity trusting belief is similar to that. Building Continuous Integrity Trust: The candidate method set and the order of their priorities. The algorithm to build and test continuous integrity trust is similar to that. MODULE DESCRIPTION
1. Auction Site 2. Feedback Trust 3. Trusted Third Party 4. Trustee Behavior Patterns
III.SYSTEM ARCHITECTURE
authority from management
Interaction
Buyers
rate product rate organisation
Fig.1 System Architecture
AUCTION SITE: In this project, there are two types of actors are involved in this environment model. They are trusters and trustee. The model takes into account the subjectivity of trust ratings by different entities, and introduces a mechanism to eliminate the impact of subjectivity in reputation aggregation. Both are registered their details in auction site and get permission from third party authority. Trusters are the buyers and trustees are the sellers. The trusters and trustee information details are stored in reputation management system. FEEDBACK TRUST: In this module, to evaluate the user ratings based on the product as well as organization. The model does not take the time of feedback into consideration, which causes the model to fail in the case of users with changing behavior. Reliance on a social network structure limits wide applicability of the mentioned approaches, especially for user authorization. SF Trust is a double trust metric model for unstructured P2P networks, separating service trust from feedback trust. Not all suspicious users are malicious users because normal users may occasionally provide “biased ratings” due to personal reasons or even human errors. THIRD PARTY AUTHORITY: An approach to extract reputation from the social network topology that encodes reputation information. A distributed personalized reputation management approach for e-commerce. The authors adopt ideas from Dempster-Shafer theory of evidence to represent and evaluate reputation. Reputation is an aggregation of trust beliefs from different trusters. Trusters are subjective and utilize different evaluation criteria. Reputation aggregation methods shall eliminate the effect of subjectivity and output a result close to the trusting belief the reputation requester would have obtained if she had directly interacted with the trustee. TRUSTING BEHAVIOR: Trusting behavior is an action that increases a truster's risk or makes the truster vulnerable to the trustee. Trust intention and trusting belief are situation and trustee specific. Institution-based trust is situation specific. Disposition to trust is independent of situation and trustee. Trusting belief positively relates to trusting intention, which in turn results in the trusting behavior. Institution-based trust positively affects trusting belief and trusting intention. The users with low trust values will be identified as malicious users and their ratings to the detected target items will be removed.

National Conference on Emerging Technologies for Sustainable Engineering and Management Organized by Sri Muthukumaran Institute of Technology
Special Issue IJRAR- International Journal of Research and Analytical Reviews 31
SCREENSHOTS:
IV.RESULT We have presented a novel trust
computation model called Secured Trust for evaluating agents in multi-agent environments. Secured Trust can ensure secured communication among agents by effectively detecting strategic behaviors of malicious agents. In this paper we have given a comprehensive mathematical definition of the different factors

UGC Approved: 43602 e ISSN 2348 –1269, Print ISSN 2349-5138 http://ijrar.com/ NCETSEM-19
32 IJRAR- International Journal of Research and Analytical Reviews Special Issue
related to computing trust. We also provide a model for combining all these factors to evaluate trust and, finally we propose a heuristic load balancing algorithm for distributing workload among service providers. Simulation results indicate, compared to other existing trust models Secured Trust is more robust and effective against attacks from opportunistic malicious agents while being capable of balancing load among service providers.
V.CONCLUSION In this paper we presented a dynamic
computational trust model for user authorization. This model is rooted in findings from social science, and is not limited to trusting belief as most computational methods are. We presented a representation of context and functions that relate different contexts, enabling building of trusting belie fusing cross-context information. The proposed dynamic trust model enables automated trust management that mimics trusting behaviours in society, such as selecting a corporate partner, forming a coalition, or choosing negotiation protocols or strategies in e-commerce. The formalization of trust helps in designing algorithms to choose reliable resources in peer-to-peer systems, developing secure protocols for ad hoc network sand detecting deceptive agents in a virtual community Experiments in a simulated trust environment show that the proposed integrity trust model performs better than other major trust models in predicting the behavior of users whose actions change based on certain patterns over time. For future work, we have to identify the fake id based on the fake ratings. Then, we improve the security for Trustee authorization.
VI. REFERENCES 1. N. R. Jennings, “An agent-based approach for
building complex software systems,” Communications of the ACM, vol. 44, no. 4, pp. 35–41, 2001.
2. R.Steinmetz and K. Wehrle, Peer-to-Peer Systems and Applications. Springer-Verlag New York, Inc., 2005.
3. (2000) Gnutella. [Online]. Available: http://www.gnutella.com
4. Kazaa. [Online]. Available: http://www.kazaa.com/
5. (2000) edonkey2000. [Online]. Available: http://www.emuleproject.net/
6. I. Foster, C. Kesselman, and S. Tuecke, “The anatomy of the grid: enabling scalable virtual organizations,” International Journal of High Performance Computing Applications, vol. 15, no. 3, pp. 200– 222, 2001.
7. T. Berners-Lee, J. Hendler, and O. Lassila, “The semantic web,” Scientific American, pp. 35–43, May 2001.
8. D. Saha and A. Mukherjee, “Pervasive computing: A paradigm for the 21st century,” Computer, vol. 36, no. 3, pp. 25–31, 2003.
9. S. D. Ramchurn, D. Huynh, and N. R. Jennings, “Trust in multiagent systems,” The Knowledge Engineering Review, vol. 19, no. 1, pp. 1–25, 2004.
10. P. Dasgupta, “Trust as a commodity,” Trust: Making and Breaking Cooperative Relations, pp. 49–72, 2000. [11]
11. P. Resnick, K. Kuwabara, R. Zeckhauser, and E. Friedman, “Reputation systems,” Communications of the ACM, vol. 43, no. 12, pp. 45–48, 2000.
12. A. A. Selcuk, E. Uzun, and M. R. Pariente, “A reputation-based trust management system for P2P networks,” in Proceedings of the 2004 IEEE International Symposium on Cluster Computing and the Grid (CCGRID), 2004, pp. 251–258.
13. M. Gupta, P. Judge, and M. Ammar, “A reputation system for peerto-peer networks,” in Proceedings of the 13th international workshop on Network and operating systems support for digital audio and video (NOSSDAV). ACM, 2003, pp. 144–152.
14. K. Aberer and Z. Despotovic, “Managing trust in a peer-2-peer information system,” in Proceedings of the tenth international conference on Information and knowledge management (CIKM). ACM, 2001, pp. 310–317.
15. L. Mui, M. Mohtashemi, and A. Halberstadt, “A computational model of trust and reputation for e-businesses,” in Proceedings of the 35th Annual Hawaii International Conference on System Sciences (HICSS’02), 2002, pp. 2431 – 2439.

National Conference on Emerging Technologies for Sustainable Engineering and Management Organized by Sri Muthukumaran Institute of Technology
Special Issue IJRAR- International Journal of Research and Analytical Reviews 33
STUDY ON TO ENHANCE THE ELECTRONIC HEALTH RECORD USAGE AND DESIGN PRINCIPLES IN THE HEALTH CARE SERVICES
D.Jayakumar* & Dr.A.K.Sheikmanzoor**
*Research Scholar Department of Management Studies, CEG, Anna university Chennai **Supervisor, Department of Management Studies, CEG, Anna university Chennai
ABSTRACT: Electronic Health Record systems are clinical support tools with the potential to reduce strains on clinician memory and cognition while improving efficiency in workflow and effectiveness in care quality and coordination. The safe, efficient, effective, patient-centered, equitable and timely delivery of health care services requires tools that organize and display information which places patient data in context, synthesizes that information with available medical evidence, and supports the clinician’s decision making process. The display of information is essential in actual fact support clinical care and reducing the potential for human error. Medical care is delivered in highly interruptive environments by clinicians operating in heavily tailored site and provider specific rules-based Decision-making modes. The study is how Electronic Health Record can be beneficiary to the medical practitioners and the advantages of using Electronic Health Record in Health Care service. The study determines the information design aspects which include features to enhance the usability of Electronic Health Record, patient critical data that medical practitioners would prefer most for quick treatment decisions. To improving the usability of Electronic Health Record through the application of information design principles in health Care Services The survey conducted with medical practitioner through a structured questionnaire and collected the Data with 140 respondents and analyzed the with statistics tool the respondents consider that it is important to store previous ailments in Electronic Health Record system in terms of the usability. To improving the usability of Electronic Health Record through the application of information design principles in health Care Services.. The most of the respondent’s conformity that with Electronic Health Record, the time consumed for treatment and decision making is not as much time and promoting health related activities will improve EHR usage that the usage of current EHR system is not up to their requirements of the medical practitioner. The study will provide the suggestion to enhance the HER usage and design principles of information in the health care services.
Keywords:
1. RESEARCHBACKGROUND The Agency for Healthcare Research and Quality (AHRQ) commissioned the “Use of Dense Display and Information Design Principles in Primary Care Health IT Systems” study on Electronic Health Record usability. This study establishes a foundation of Electronic Health Record user interface design considerations and proposes an action agenda for the application of information design principles to the use of health information technology (health IT) in primary care settings. Based on recommendations from the AHRQ-commissioned report from the Institute for Healthcare Improvement, insight from the field, and the need for Federal leadership in this area, the Agency identified the adoption of information design principles as an opportunity for innovation in health IT. Improving the usability of Electronic Health Records will support care of the “whole patient” and improve the quality, safety, efficiency and effectiveness of the care delivered in the primary care setting. To begin exploration
of improving Electronic Health Record usability through the application of information design principles the study suggests Provide relevant task information and features to the user – Formulating a diagnosis requires appropriate information be displayed and correctly interpreted by the clinician. A focus on actionable information and appropriate use of reminders and alerts will support this role. Support both overview and details on demand – Appropriate organization and display of overview information on a single screen is most important to reduce the cognitive load on clinicians formulating treatment decisions. However appropriate detail must be available to support all summary information and should be quickly accessible from the main overview screen. Reduce short-term and long-term memory load – Electronic Health Records have at times been characterized as external memory sources
UGC Approved: 43602 e ISSN 2348 –1269, Print ISSN 2349-5138 http://ijrar.com/ NCETSEM-19
34 IJRAR- International Journal of Research and Analytical Reviews Special Issue
for clinicians. In serving this role, Electronic Health Record displays should minimize memory requirements for its users through ensuring proximity of related information, reducing the number of clicks and scrolls required for all necessary information, and minimizing calculations or computations that the user must perform. Keep display simple and free of clutter – Locating appropriate information on the screen requires displays limit use of graphics or text which do not add value to the clinician decision making process. Include appropriate graphics that support and clarify data – Graphics play an important role in reducing cognitive load when interpreting data through quickly displaying trends, comparisons, and relationships. Support user mental model of the system – In navigating patient history, reminders and alerts, decision support, and external medical references, the system must support the clinicians’ ability to maintain an accurate understanding of available options and their location within the system. Display confidence in information/relevant references – Information supporting this task can originate from a variety of internal and external sources. The display should support the clinician in determining confidence in information displayed as well as providing options to view relevant references for decision support information. 1.2 IDENTIFIED PROBLEM In Health Care Services, Electronic Health Record usage is very limited and not bound to scope of Electronic Health Record. The use of Electronic Health Record during a treatment time to quickly identify the patient information and make treatment decisions effectively. The study is to identify the gaps with the current Electronic Health Record usage and to provide the solution for the better enhancement of Electronic Health Record system 1.3 OBJECTIVE OF THE STUDY
To study on improving the usability of Electronic Health Record through the application of information design principles in health service
To study how Electronic Health Record system can be beneficiary to the medical practitioners.
To study the advantages of using Electronic Health Record system in Health Care service.
2.1 REVIEW OF LITERATURE 2.1.1.Threats and Challenges to Security of Electronic Health Records ShaliniBhartiya, DeeptiMehrotra Healthcare has always been a sensitive and a complex process. Rapid strides have been made both in the field of information technology as well as health care successfully integrating both for better facilities and services offered by the health-givers. Electronic health records (EHRs) is the product of this integration and forms an integral part of the automated healthcare system. Accessing of EHR by each stakeholder complements the issues of data disclosure, confidentiality, authenticity and privacy that are likely to occur due to many reasons. This paper aims at studying and identifying security threats to EHR in the hospital information system currently prevailing in the hospitals (HIS). It further categorizes the threats based on security characteristics and rates them on the basis of impact and magnitude of loss to the patients. The paper highlights real-time scenarios with each as an important requirement of the health-givers on one hand, can also be a reason of security breaches on other hand. It concludes by listing challenges and recommendations to curb security threats commonly found in the physical setup of healthcare environment. 2.1.2Improving Physician Adoption of CPOE Systems - Lessons Learned from the Field Scott R. Fisher, M.D., Jean-Paul Creusat, M.D., D. Andrew McNamara, M.D. Clinical Consulting Services, McKesson Provider Technologies In the vast and complex world of healthcare technology, we must ask ourselves — what is the best way to deliver the benefits of the latest technology? If healthcare decisions are cars, then physicians are the drivers. They dictate the place healthcare is delivered, the time frame of delivery and the amount of money spent on it. Physicians affect fully 80 cents of every dollar spent on healthcare. So, it is easy to see why a system integral to healthcare delivery cannot reach its destination without the blessing of user physicians. One such system is the computerized physician order entry (CPOE) system. Traditionally, doctors have seen administrative efforts at implementing hospital information systems as a necessary evil, beneficial only to the hospital’s financial bottom line. CPOE systems are seen as yet another burden upon physicians’ already overcrowded schedules. Research by the Clinical Advisory Board says, “Physicians and nurses agreed that their attitudes toward computers were important barriers to guideline

National Conference on Emerging Technologies for Sustainable Engineering and Management Organized by Sri Muthukumaran Institute of Technology
Special Issue IJRAR- International Journal of Research and Analytical Reviews 35
use. Physicians recounted their lack of motivation to learn the computer, implement computerized guidelines, or change their current behaviors to keep in step with constantly changing scientific evidence.” This lack of motivation is strong inertia to overcome. Nevertheless, without physician buy-in, participation and sense of ownership, no clinical IT program will be successful. 2.1.3. Recommendations On Electronic Medical Records Standards In India FICCI Health Services Healthcare systems are highly complex, fragmented and use multiple information technology systems. With vendors incorporating different standards for similar or same systems, it is little wonder that all-round inefficiency, waste and errors in healthcare information and delivery management are all too commonplace an occurrence. Consequently, a patient’s medical information often gets trapped in silos of legacy systems, unable to be shared with members of the healthcare community. These are some of the several motivations driving an effort to encourage standardization, integration and electronic information exchange amongst the various healthcare providers. In the current largely paper-based medical records world, invaluable data is more often than not unavailable at the right time in the hands of the clinical care providers to permit better care. This is largely due to the inefficiencies inherent in the paper-based system. In an electronic world, it is very much possible, provided certain important steps are taken beforehand, to ensure the availability of the right information at the right time. In order to be meaningful, the health record of an individual needs to be from conception (better) or birth (at the very least). As one progresses through one’s life, every record of every clinical encounter represents an event in one’s life. Each of these records may be insignificant or significant depending on the current problems that the person suffers from. Thus, it becomes imperative that these records be arranged chronologically to provide a summary of the various clinical events in the lifetime of a person. 2.1.4.Electronic Medical Records (EMR) system for Clinical Data Storage at health centers Mr. Rajesh R. Mane Associate Professor, BCS Department, Vivekanand College, Kolhapur, India. Dr. R. V. Kulkarni Professor, SIBER, Kolhapur, India.
With a growing population and an increase in the number of patients, the pressure on doctors and hospital staff has increased severely. At first, traditionally when patient used to visit hospitals his information was stored on papers. The use of Information technology in Healthcare brought a revolution in capturing data of patient. EMR is a collection of data of a patient in electronic format for medical care. It helps the doctors as well as hospital staff to provide better care & service for patient as it has all the information about the patient past visit, medications, and lab reports etc. In this paper we review EMR implementation and EMR tools used in various hospitals in different countries. Also impact of EMR on administrative staff, Physicians, nurses etc, and identifies the benefits, limits and importance of EMR for clinical data storage and research. Conclusions are drawn. 2.1.5. The electronic medical record (EMR) assists in hospital order management, hospital workflow management and security of the medical data. It assists the entire healthcare delivery process in reducing cost and maximizes the profit. eprobe Research Private Limited The electronic medical record (EMR) is simply the electronic format of medical records. EMR stores various types of medical data. The data ranges from medical history, prescriptions, drug allergies to the patients hospital service bills and more. The currently used paper based system is insufficient, ineffective and involves high cost of maintenance. On the contrary, EMR has several advantages like easy data recovery, portability, collaboration etc. EMR assists doctors in making effective medical decisions with ease. In addition, EMR helps the service providers to effectively gather, maintain and recover patient’s medical information with the help of hospital information system (HIS). Along with managing the medical data, EMR assists in hospital order management, hospital workflow management and security of the medical data. It assists the entire healthcare delivery process in reducing cost and maximizes the profit. Advantage: Large hospitals which have implemented and integrated the EMR to the core functions of the hospitals are realizing the benefits. The streamlined process reduces or blocks the revenue leaks across the value chain. The long-term usage of EMR will lead to reduction in cost by reducing the administrative expenditure and increase in data accuracy.

UGC Approved: 43602 e ISSN 2348 –1269, Print ISSN 2349-5138 http://ijrar.com/ NCETSEM-19
36 IJRAR- International Journal of Research and Analytical Reviews Special Issue
With help of EMR, Doctors are able to treat the patients better with easy and accurate data accessibility. The collection of clinical data at the point of care enhances the efficiency and improves the data quality. The pharmaceutical companies and regulatory authorities use the collected data to improve the post marketing surveillance PMS of drugs. The patients receive better and greater reimbursements. In summary, EMR reduces revenue leaks, increases patient satisfaction and increases the efficiency of the process through technology. Market Barriers: Although EMR has tangible positive outcomes, the adoption rate has been low. The market comprises handful of hospitals using EMR. The usage of EMR is limited to corporate hospitals in the various metro cities of India. The known hospital chain Fortis and Apollo have been using EMR in a few of their hospitals. In comparison to developed nations, the adoption of EMR in India has drastically low. The low adoption rate is due to several gaps existing from the doctors to EMR vendors. The lack of awareness about the benefits of EMR is the largest perceived barrier. The prevailing low awareness about the advantages of EMR among the small and medium scale healthcare service providers is limiting the adoption rate. The resistance in acceptance of the product new and novel information technology platform impedes the adoption. Doctors who are the basis of healthcare service are defiant about EMR. This is primarily due to lack of compatible technology available in the market. Additionally, the EMR necessitates the use of computers by the doctors. Along with doctors, the stakeholders operating within a hospital are defiant in changing to the EMR. The high cost of implementation increases capital requirement. This is beyond in reach of the small medium scale hospitals. The capital intensive EMR will add to the healthcare service providers’ financial burdens. The fragmented Indian healthcare market that does not have a steady revenue and cash flow might view that capital burden as a risk. The implementation process of time that negatively influences the ongoing workflow in any hospital. The vendors implement the various modules of EMR in phases. This implementation process affects the ongoing workflow in the hospital. Lack of user-friendly interface adoption. The complicated EMR interfaces discourage the technological defiant doctors in adoption.
Additionally, the EMR are inadequate to capture the entire data gathered by the doctors. The vendors lack domicile knowledge in healthcare. This results in development of EMR with various gaps. Technology being the primary competence of the vendors, they tend to develop products that highly are incompetent. The gap existing between the information technology and healthcare needs to be bridged by vendors to develop effective EMR products. Future: The vendors need to take a holistic view of healthcare delivery while developing the EMR products. The existing demand supply gap in the market should bridged by better products and educating the doctors. The vendors are evolving at a greater rate in product development. The demand supply gap will steadily close due to the initiatives by vendors. They are designing better user-friendly products for doctors and providing better maintenance support for existing EMR products. The awareness among the medical fraternity will increase due to the aggressive promotion by vendors. The medical community may actively accept the new web based EMR tools.
2.2 RESEARCH GAP The past researchers have identified the importance of the adoption of Electronic Health Record across hospitals. The standards and recommendations to be adopted while designing Electronic Health Record are studied and thus leading to successful implementation of Electronic Health Record system in current practice. However, the perception of the researches are that the Electronic Health Record system is widely been used which is not as expected. Thus in this study, the ways to improve Electronic Health Record usability through the design principles are identified to help the management to take further decision on improving the Electronic Health Record usability.
3. RESEARCH METHODOLOGY Research Design: Research design is purely and simply a framework for study that guides the collection and analysis of the data. This study is based on both ‘descriptive research’ and ‘Hypothesis testing research ‘For the collection of primary data, survey questionnaire is prepared and used in the surveys sample size of 140 is used for the study The target respondents for this study are the medical practitioners who use one or many Electronic Health Record system in their practice. The respondents are categorized viz. Experience,
National Conference on Emerging Technologies for Sustainable Engineering and Management Organized by Sri Muthukumaran Institute of Technology
Special Issue IJRAR- International Journal of Research and Analytical Reviews 37
Type of Practice and Practice Location. The statistical tools are used for data analysis and interpretations Hypothesis:
The significant difference in the usage of current Electronic Health Record system at all stages of treatment with respect to experience of the medical practitioners.
The significant difference in the preference for e-Prescription feature for improving Electronic Health Record usage with respect to medical practitioner’s type of practice.
The significant difference in the preference for central repository backup and auto-recovery feature to improve Electronic Health Record usage with respect to the medical practitioner's place of practice.
The significant difference in the preference over portable Electronic Health Record systems and the type of Electronic Health Record systems used by the medical practitioners.
4. DATA ANALYSIS AND INTERPRETATION The feature of tracking a patient’s
progress throughout the treatment period using single EHR system is preferred by about 44% of the respondents.
About 36% of the respondents feel that it is very important to store patient’s critical data allergy information in EHR system.
About 28% of the respondents feel that it is important to store patient’s critical data – previous ailments in EHR system.
About 22% of the respondents feel that it is important to store patient’s critical date – latest lab results in EHR system
Maintaining patient’s health record electronically is much reliable and convenient and thus it is advantageous.
About 24.29% of the respondents strongly agree that the time taken for treatment decision is less with EHR usage.
It is found that the usage of current EHR system at all stages of treatment is independent of the experience of the medical practitioners who use EHR system.
It is found that the preference over the feature e-Prescription is independent of
the type of practice of the medical practitioner.
It is found that the preference over central backup and auto-recovery feature is independent of the place of practice of the medical practitioner.
It is found that the preference over portable EHR systems is independent of the type of EHR system most used by the medical practitioner.
There is a strong direct correlation between the advantages of tracking a certain medication’s performance on patients with the storage of EHR at the medical practitioner’s location.
There is a strong direct correlation between the advantages of identifying chronic symptoms at early stage with EHR with usage of single EHR system that will benefit the medical practitioners.
5. SUGGESTIONS AND RECOMMENDATIONS The study found that the usage of EHR is
the same at all experience levels irrespective of the type of practice of the medical practitioner, location of the medical practitioner and type of EHR system the medical practitioner most use.
The study also suggests that most medical practitioners prefer EHR system only for storing patient related data regardless of the language customization options and bill generation and payment settlement feature.
The study recommends that information design aspect of EHR system need not be restricted to a particular type of practice or location of practice.
5. 1. CONCLUSION The study concludes that most of the medical practitioners prefer improvements in the current EHR system in their practice. they prefer to use single EHR system for their practice that includes all important information design aspects presented in this study. The relationship between the advantages of EHR and the information design aspects suggests that enhancements in current EHR system will benefit the medical practitioners for efficient health services.
REFERENCES 1. http://link.springer.com/chapter/10.1007%2F9
78-3-642-37949-9_48#page-1

UGC Approved: 43602 e ISSN 2348 –1269, Print ISSN 2349-5138 http://ijrar.com/ NCETSEM-19
38 IJRAR- International Journal of Research and Analytical Reviews Special Issue
2. http://www.strategiestoperform.com/volume3_issue2/docs/ImprovingPhysicianAdoption.pdf
3. http://clinicalestablishments.nic.in/WriteReadData/107.pdf
4. http://www.academia.edu/2082736/A_Review_Electronic_Medical_Records_EMR_System_for_Clinical_Data_Storage_at_health_centers
5. http://www.greenbook.org/marketing-research/emr-market-india-growth-challenges-40073
6. http://www.researchgate.net/profile/David_Bates3/publication/6588900_Implementation_and_use_of_an_electronic_health_record_within_the_Indian_Health_Service/links/00b495225a47170fa2000000
7. http://precog.iiitd.edu.in/events/spsymposium13/SPSymposium_files/SPsymposium-papers/SPsymposium-paper26.pdf
8. http://www.commonwealthfund.org/usr_doc/Briggs_Fowles_perfmeasEHRs5casestudies_1132.pdf
9. http://www.ajmc.com/publications/issue/2013/2013-11-vol19-sp/The-Impact-of-Electronic-Health-Record-Use-on-Physician-Productivity
10. http://journals.lww.com/lww-medicalcare/Documents/13-00342.pdf
11. http://www.webmd.com/heart/news/20130910/two-studies-highlight-benefits-of-electronic-health-records
12. http://www.edrprabhu.com/data/EHR%20Standards%20for%20India%20-%20August%202013-32630521.pdf

National Conference on Emerging Technologies for Sustainable Engineering and Management Organized by Sri Muthukumaran Institute of Technology
Special Issue IJRAR- International Journal of Research and Analytical Reviews 39
A COMPARATIVE ANALYSIS OF UNIT LINK PRODUCTS OF SBI LIFE AND IDBI FEDERAL AT CHENNAI.
Suresh.M* & Dr.K.Suresh Kumar**
*Assistant Professor/MBA Dept-Sri MuthuKumaran Institute of Technology. **Associate Professor/MBA Dept-Panimalar Engineering College.
ABSTRACT: ULIPs are investment instruments that combine benefits of both life insurance investments in money markets. The premium paid for a ULIP is divided into two parts; one part goes towards coverage of risk to life and the other towards investment in money market instruments. ULIP as a product is offered by Life insurance companies. ULIPs fulfill your need for both investment and protection. the researcher want to compare the ULIP plans of SBI Life and IDBI Federal which would help the investors to select the plans which offer higher rate of returns. This will help both the companies to come out with better portfolio for ULIPS. The primary objective is to conduct a comparative analysis of Unit linked plans of SBI Life and IDBI Federal. Other objectives are to know the factor/sources of information important while investing in SBI Life and IDBI Federal and to study the attributes influencing the purchase of Unit Linked Plans of SBI Life and IDBI Federal. Convenience sampling method has been used in the research work. Multiple choice questions have been chosen to collect the responses from 120 employees. The data collected has been analyzed through various statistical tools like Karl Pearson’s Correlation and One-way Anova test. the researcher found that there is a relationship between occupation and ULIP plans and There is negative relationship between life coverage attribute is important while purchasing SBI life policies and mode of paying premium attribute is important while purchasing SBI life policies
Keywords:
1.INTRODUCTION ULIP stands for unit linked insurance plans. ULIP is a combination of insurance and investment. Here policyholder can pay a premium monthly or annually. A small amount of the premium goes to secure life insurance and rest of the money is invested just like a mutual fund does. Policyholder goes on investing through the term of the policy – 5,10 or 15 years and accumulates the units. ULIP offers investors options that invest in equity and debt. An aggressive investor can pick equity oriented fund option whereas a conservative one can go with debt option. Here, we identify 5 advantages of investing in ULIPs over other investment options. investment mix, Flexibility, Long term investment, Tax Benefits and Life cover 1.1. State Bank of India (SBI):
The Bank is actively involved since 1973 in non-profit activity called Community Services Banking. All our branches and administrative offices throughout the country sponsor and participate in large number of welfare activities and social causes. Our business is more than banking because we touch the lives of people anywhere in many ways.Our commitment to nation-building is complete & comprehensive.
1.2.IDBI FEDERAL IDBI Federal Life Insurance Co Ltd is a joint-venture of IDBI Bank, India’s premier development and commercial bank, Federal Bank, one of India’s leading private sector banks and Ageas, a multinational insurance giant based out of Europe. In this venture, IDBI Bank owns 48% equity while Federal Bank and Ageas own 26% equity each. At IDBI Federal, we endeavour to deliver products that provide value and convenience to the customer. Through a continuous process of innovation in product andservice delivery we intend to deliver world-class wealth management, protection and retirement solutions to Indian customers.Having started in March 2008, in just five months of inception we became one of the fastest growing new insurance companies to garner Rs 100 Cr in premiums. The company offers its services through a vast nationwide network across the branches of IDBI Bank and Federal Bank in addition to a sizeable network of advisors and partners. As on 30th November, 2012, the company has issued over 6.13 lakh policies with over Rs. 24,648 Cr. in Sum Assured.

UGC Approved: 43602 e ISSN 2348 –1269, Print ISSN 2349-5138 http://ijrar.com/ NCETSEM-19
40 IJRAR- International Journal of Research and Analytical Reviews Special Issue
2. NEED FOR THE STUDY ULIPs are investment instruments
that combine benefits of both life insurance and investments in money markets. The premium paid for a ULIP is divided into two parts; one part goes towards coverage of risk to life and the other towards investment in money market instruments.ULIPs as an investment category has a lot of inherent benefits.Through this study, the researcher wants to compare the ULIP plans of SBI Life and IDBI Federal which would help the investors to select the plans which offer higher rate of returns. This will help both the companies to come out with better portfolio for ULIPS.
3.OBJECTIVES 1. To study the attributes influencing the
purchase of Unit Linked Plans of SBI Life and IDBI Federal.
2. To know the factor/sources of information important while investing in SBI Life and IDBI Federal.
4.REVIEW OF LITERATURE 1) MrKanteshaSanningammanavara,(201
3), Comparative Study on the Performance of ULIPs Offered by the Selected Insurance Companies-A Study in Indian Capital Markets” .The objective of the study was to examine the structure, performance & operational efficiency of selected company and to check the performance of ULIP product offered by the company against the competition.It was concluded that Reliance Health + Wealth Plan is performing better than SBI, ICICI and Bajaj Allianz, but below the performance of PNB Met Smart One.
2) Rao .KH et al,(2013), “Investor Perception towards Unit Linked Insurance Plan a Select Study on UTI Mutual Fund”. The foundation of life insurance is the recognition of the value of a human life and the possibility of indemnification for the loss of that value. Chi-square has been applied to find the product validation as a better option for investment there being many avenues for investment. Concepts are described. Suggestions are made at the end for improving the perception level of the customers, and changes that may be made to make unit linked insurance plan a better alternative.
3) Kamaludeen.P et al( 2014), ,conducted “Investors Behavior on Ulips Market
(Unit Linked Insurance Plans)”. To study the factor that influence investment behavior of the respondent in the selected study area. To study the attitude of the respondents towards different investment choices. To investigate various methods of payment and mode of operations by the investors. To find out problems of ULIPS investors and suggest suitable measures to solve the problems in the study area. To study the government policy issues which related to ULIPS and suggests suitable policy mix to enlarge the ULIPS market size. Majority of the policyholders is influenced by self-followed by agents while taking an insurance policy from LIC, significant number of policyholders felt that the premium rate is high, majority of the sample policyholders prefer to buy money back policy and policyholders expected a return of 11-15 percent from their investments.
4) PawanNagorao Bahekar.et al,(2015), “Relationship between different factor and their financial goal for opting unit linked insurance plans”.The objective of the study was to investigate the relationship of various factors such as Age, Marital status, Type of family, Educational Qualification and Nature of employment of investors with their financial goal for opting Unit Linked Insurance Plans. Many people invest money in the ULIPs for different reasons, such as for accumulating a substantial corpus for their future anticipated and unanticipated demands. However, not all the customers can hold their investments intact all the time and hence, there is flexibility in the ULIPs in the form of premature surrendering of the policy, switching options, etc. It was apparent from the study results that there is significant relation between Marital Status, Age, Educational Qualification, Nature of employment and family type with Primary financial goal for opting ULIP plans.
5) PritiRai et al,(2016), conducted “Comparative analysis of unit linked insurance plans and mutual funds”. To examine the awareness level of Unit Linked Insurance Plans (ULIPs) and Mutual Fund market and also To examine the most popular investment avenues

National Conference on Emerging Technologies for Sustainable Engineering and Management Organized by Sri Muthukumaran Institute of Technology
Special Issue IJRAR- International Journal of Research and Analytical Reviews 41
among sample of investors . It was found that majority of respondents insure and the majority of respondents aware of M .F and ULIPS . Majority of respondents have investment portfolio. It was also found out that the most important parameters are high returns and tax free proceeds. Aggressive marketing and mass awareness programmes need to be conducted to realize the actual potential of this product. ULIPs form an attractive investment avenue and have a lot of potential for growth.
6) Prakash.L et al,(2016),. To compare the ULIP products of ICICI Prudential with their major competitors and also To evaluate the performance of the funds based on market risk. From this study, ICICI gives high return in long period. The study reveals wide spread perception about ICICI Prudential life insurance and their major competitors among the public. The continued growth of the company depends on attracting and retaining talent. The company should therefore address the gap in perception and promote both life insurance and career in selling life insurance. This research work is a rewarding exercise to the scholar and the scholar would be delighted if the findings and suggestions are incorporated by the ICICI Prudential Life Insurance in the study area.
7) MuhammedThayyib.K,(2017), conducted “The Importance of ULIP in Insurance Sector in India”. This study is helpful in having an idea about comparison of the Ulip fund schemes.It also helps to know whether the individual Ulip fund scheme has outperformed or underperformed with the investment. Whether the growth Ulip fund schemes are offering the advantages of Diversification, Market timing and selectivity of securities to their investors. To identifying over performing and underperforming Ulip fund schemes. To help investors for removing difficulties to choose the best fund for their needs or in other words to find out a fund which will give maximum return for minimum risk. Ulip fund has become one of the important sources for investing. It is quite likely that a more efficient portfolio can be constructed directly from funds.
Thus, the two-step process of choosing an asset allocation based on the information about benchmark indexes and then choosing funds in each category may be one of the best realistically attainable approaches. To use this approach to portfolio selection effectively, investors would benefit from estimates of future asset returns, risks and correlations, as well as from fund management‟s disclosure of future asset exposures and appropriate benchmarks.
8) Shilpa R. Kankonkar,( July -September,2017), conducted “Unit linked insurance plans –an apt asset vehicle for growth”.The study applied descriptive as well as an empirical research design based on the survey method.The study primarily depended on the 281 usable data from investors through a structured questionnaire. The study also revealed some important factors which are important to understand the investor preference factors about unit linked insurance plans investment schemes. The preferred life insurance companies by the respondents were also analyzed and found that the majority of respondents were the investors of unit linked insurance plans of life insurance company of India and followed by SBI Life Insurance Company and then HDFC life insurance co ltd.
5. RESEARCH METHODOLOGY 5.1 RESEARCH DESIGN
Descriptive research design is also called explanatory design. This is the one that simply describes something such as demographic characteristics. The descriptive study is typically concerned with determining frequency with which something occurs or how two variables vary together. 5.2 .SAMPLE SIZE
It refers to the number of elements of the population to sample. The sample size chosen for the survey is 120 customers who have both SBI and IDBI Federal ULIP plans in Chennai City. 5.3. PRIMARY DATA
Primary data is the original data collected by the researcher first hand. It is collected for the first time through field survey. These are those that are gathered specifically, for the problem at hand. The various sources for collecting primary data are questionnaire,

UGC Approved: 43602 e ISSN 2348 –1269, Print ISSN 2349-5138 http://ijrar.com/ NCETSEM-19
42 IJRAR- International Journal of Research and Analytical Reviews Special Issue
observation, interview etc. The primary source used for the study is questionnaire. 5.4 CONVENIENCE SAMPLING
In this method, the sample units are chosen primarily on the basis of the convenience to the investigator. The units selected may be each person who comes across the investigator. 5.5. ANALYTICAL TOOLS 5.5.1 ANALYSIS USING KARL PEARSON’S CORRELATION
Correlation analysis is the statistical tool used to measure the degree to which two variables are linearly related to each other. Correlation measures the degree of association between two variables. The Pearson product-moment correlation coefficient is a measure of the strength and direction of association that exists between two variables measured on at least an interval scale. It is denoted by the symbol r.
………. (3.10.1)
5.5.2 ONE WAY ANOVA The ANOVA tests the null
hypothesis that samples in two or more groups are drawn from populations with the same mean values. To do this, two estimates are made of the population variance. The ANOVA produces an F-statistic, the ratio of the variance calculated among the means to the variance within the samples. If the group means are drawn from populations with the same mean values, the variance between the group means should be lower than the variance of the samples, following the central limit theorem. A higher ratio therefore implies that the samples were drawn from populations with different mean values. 5.6 LIMITATIONS OF THE STUDY
1. The information provided by majority of the respondents could also be biased or inaccurate. No independent verification of the data was possible.
2. Time is one major constraint, which limits the effective data collection.
3. Non-availability of data collection from all the ULIP customer of SBI Life and IDBI Federal.
4. The sample size is only 120 so the sample may not be truly representative of the total population.
6. Data Analysis Table -1: OCCUPATION OF THE RESPONDENTS OCCUPATION NO. OF
RESPONDENTS PERCENTAGE
Business 63 52
Salaried 57 48
Total 120 100
Interpretation The above table shows that 52% of the respondents are businessman and 48% of the respondents are salaried. Therefore, Most of the respondents are businessman.
Table -2: ULIP PLAN OF THE RESPONDENTS ULIP PLAN
NO. OF RESPONDENTS
PERCENTAGE
SBI Life alone 0 0
IDBI Federal alone 0 0 Both 120 100 Total 120 100
Interpretation The above table shows that all the respondents are having both SBI Life and IDBI Federal ULIP plans.
TABLE -3. LIFE COVERAGE ATTRIBUTE IS IMPORTANT WHILE PURCHASING POLICIES
LIFE COVERAGE
SBI Life
% IDBI Federal
%
Very Important 36 30 32 27 Important 26 22 28 23 Moderate 23 19 24 20
Slight Important 18 15 22 18 Least Important 17 14 14 12
Total 120 100 120 100

National Conference on Emerging Technologies for Sustainable Engineering and Management Organized by Sri Muthukumaran Institute of Technology
Special Issue IJRAR- International Journal of Research and Analytical Reviews 43
Interpretation The above table shows that 30% of the respondents are say that the life coverage attribute is very important while purchasing SBI Life policies and 27% of the respondents say that the life coverage attribute is very important while purchasing IDBI Federal policies. Therefore, Most of the respondents are saying that the life coverage attribute is very important while purchasing SBI Life policies. Table 4. Mode of Paying Premium Attribute is
Important While Purchasing policies MODE OF PAYING
PREMIUM SBI Life
% IDBI Federal
%
Very Important 32 27 30 25 Important 30 25 24 20 Moderate 25 21 36 30
Slight Important 16 13 18 15
Least Important 17 14 12 10 Total 120 100 120 100
Chart 4.7 Mode of Paying Premium Attribute is
Important While Purchasing policies Interpretation
The above table shows that 30% of the respondents say moderate that the mode of paying premium attribute is important while
purchasing IDBI Federal policies and 27% of the respondents say that the mode of paying premium attribute is very important while purchasing SBI Life policies.Therefore, Most of the respondents say moderate that the mode of paying premium attribute is important while purchasing IDBI Federal policies. 6.1.ONE-WAY ANOVA CLASSIFICATION Null hypothesis (Ho)
There is a significance difference between occupation and ULIP plans. Alternate hypothesis (H1)
There is no significance difference between occupation and ULIP plans.
Table 5. Occupation and ULIP plans.
Table 6.Descriptives OCCUPATION Levene Statistic df1 df2 Sig.
41.238 2 117 .000
Table 7Test of Homogeneity of VariancesOCCUPATION
Sum of
Squares
Df Mean Squa
re
F Sig.
Between
Groups
18.686
2 9.343 97.256
.000
Within Group
s
11.239
117
.096
Total 29.92
5 119
Table 8.ANOVA

UGC Approved: 43602 e ISSN 2348 –1269, Print ISSN 2349-5138 http://ijrar.com/ NCETSEM-19
44 IJRAR- International Journal of Research and Analytical Reviews Special Issue
Chart.Mean of Occupation VS Having ULIP Plan
Tabulated value = 3.09 Calculated value= 97.256 F = F cal>F tab F= 97.256> 3.09 Hence, the null hypothesis [H1] is accepted. Inference
Since the calculated value is greater than the tabulated value, we accept the alternate hypothesis and hence there is a relationship between occupation and ULIP plans. 6.2 ANALYSIS USING KARL PEARSON’S CORRELATION
Correlation analysis is the statistical tool used to measure the degree to which two variables are linearly related to each other. Correlation measures the degree of association between two variables. Null hypothesis (H0)
There is positive relationship between life coverage attribute is important while purchasing SBI life policies and mode of paying premium attribute is important while purchasing SBI life policies. Alternate hypothesis (H1)
There is negative relationship between life coverage attribute is important while purchasing SBI life policies and mode of paying premium attribute is important while purchasing SBI life policies.
Table 9. life coverage attribute is important while purchasing SBI life policies and mode of paying premium attribute is important while purchasing SBI life policies.
Life Coverage Attribute
Is Important
While Purchasing
Sbi Life Polices
Mode Of Paying
Premium Attribute
Is Important
While Purchasing
Sbi Life Polices
Life Coverage
Pearson Correlation
1 .988**
Attribute Is
Important While
Purchasing Sbi Life Polices
Sig. (2-tailed)
.000
N 120 120
Mode Of Paying
Premium Attribute
Is Important
While Purchasing
Sbi Life Polices
Pearson Correlation
.988** 1
Sig. (2-tailed)
.000
N 120 120
**. Correlation is significant at the 0.01 level (2-tailed).
…………….. (4.1)
= .988
Inference Since r is positive, there is positive
relationship between life coverage attribute is important while purchasing SBI life policies and mode of paying premium attribute is important while purchasing SBI life policies.
7. CONCLUSION ULIP investment provides flexibility,
wherein the policy holder can shift from one policy to another depending on how the market functions. Helping one gain huge returns on their investments. If you are looking for a long term investment, then ULIP is best suited for you, as share market is never for someone who wishes to play for the short term. This study has been undertaken to compare the Unit linked plans of SBI Life and IDBI Federal based on the perception of the customers of both SBI Life and IDBI Federal. For this purpose, responses from the customers from Chennai who have both SBI Life and IDBI Federal have been collected and analyzed. the researcher found that there is a relationship between occupation and ULIP plans and There is negative relationship between life coverage attribute is important while purchasing SBI life policies and mode of paying premium attribute is important while purchasing SBI life policies.
8. REFERENCE 1. L.Prakash1, M.Dinesh2(2016),”An analytical
study on icici prudential ulip products with special reference to life time scheme”, ijariie international journal, Vol-2 Issue-1.

National Conference on Emerging Technologies for Sustainable Engineering and Management Organized by Sri Muthukumaran Institute of Technology
Special Issue IJRAR- International Journal of Research and Analytical Reviews 45
2. MrKanteshaSanningammanavara,A Comparative Study on the Performance of ULIPs Offered by the Selected Insurance Companies-A Study in Indian Capital Markets, Asia Pacific Journal of Research,Volume No: 2,Issue: 4.
3. MuhammedThayyib. K(April 2017),“The Importance of ULIP in Insurance Sector in India”, International Journal of Research in IT, Management and Engineering, Volume 07 Issue 04, Page 21-27.
4. P. Kamaludeen ,Dr.V. Thamodaran,(December 2014),”Investors Behavior on Ulips Market (Unit Linked Insurance Plans)”, International Journal of Engineering and Management Research (IJEMR), Vol 4 Issue 12.
5. PawanNagoraoBahekar et al, “Relationship between different factor and their financial goal for opting unit linked insurance plans”, International Journal of Management (IJM), Volume 6, Issue 10, Oct 2015, pp. 116-125.
6. PritiRai and Amoah-BinfohKenneth(2016),“Comparative analysis of unit linked insurance plans and mutual funds”, Journal Of Harmon ized Research i n Management,Vol-2,Issue-4,282-285.
7. Rao, KH. andGopi, T. (2013),conducted “Investor Perception towards Unit Linked Insurance Plan a Select Study on UTI Mutual Fund”, Asian Journal of Management, 4(4): 254-259.
8. Shilpa R. Kankonkar,( July -September,2017),”Unit linked insurance plans –an apt asset vehicle for growth”, International Journal of Research in Management & Social Science, Volume 5, Issue 3 (IV).
UGC Approved: 43602 e ISSN 2348 –1269, Print ISSN 2349-5138 http://ijrar.com/ NCETSEM-19
46 IJRAR- International Journal of Research and Analytical Reviews Special Issue
Career Anchors for Retaining Talent
Dr. R.Seranmadevi1 & Dr.G.Thiyagarajan2
1Professor, Department of Management Studies, Sri Muthukumaran Institute of Technology, Mangadu, Chennai.
2Associate Professor, Department of Management Studies, Loyola Institute of Technology, Palanchur, Chennai.
ABSTRACT: The operational functions of human resource department include man power planning, recruitment, selection, placement, induction, Training and Career Development. In addition to that creation of employee morale through job satisfaction, reducing the employee turnover and retaining the talented work force are identified as the prime-facial functions of Human resource department in the recent days. Hence pooling the human resources needed for the organization, shaping them to best fit for the organizational requirement, equipping their career development are squander functions if the human resources management is failed to retain their talented employees in the long run. Hence it is important to focus the employee retention through tracing the reasons for their turnover. To do that, Edgar Schein coined out a wonderful strategy called Career Anchor, to evaluate the opinion of employees towards their career progress. It will directly and indirectly assist the organization to design the organizational climate and policy to the benefits of the employees to retain their talent.
Keywords: career anchor, employee, human resource, retention, talent, turnover
Precedents to Career Anchor
Every organization strive a hard to identify the right personality to join in their crowd and more than that they take immense pain to equip them as most suitable to the present organizational conditions, if the organization has failed to protect those well-shaped employees then it was a great loss in human capital again which cannot be compensated from any other factors of production. A learned employee means huge sum of investment have been made by the organization, so once the employee left then with-out return on investment made on human capital, leads the organization a great loss. To avoid this frantic situation, the organization might plan in advance to retain the talent pool in the organization for a long period of time. To do that effectively, they are adopting enormous employee retention strategy and provide them a well-equipped working environment and peaceful organizational climate with supportive HR policy. In spite of all the efforts, the rate of employee retention is continuously an impediment part for the growing organization. Hence it is important to frame out he strategy to trace out the intention of the employee on their career prospects. Based on the employees’ intention towards their career development progress, the organization can build vigorous strategy to attract and retain the
talented work force. Career Anchor is one among the large variety of strategy which will enhance the organization to evaluate the intention of employee towards their career progress in the present organization.
Statement of the problem The study is emerged based on the need
of the organization to focus on the employee retention for the long time. It is viewed as a critic problem for the part of organization to study the pulse of the employees, and retain them for the organization in the long run. There are so many well established techniques are being available, again career anchor is the one technique which is used to evaluate the intention of the employee towards their career management.
Objectives The core objective of this study is to
evaluate various parameters governing the career anchor of different employees. The aim of this paper can be achieved through identification and categorization of different parameters which are used to evaluate the intention of the employees with respect to their career anchor. It is proposed to circulate a questionnaire among the employees to get their intention towards their present job and future job expectations, based on the responds given by them, the organization can evaluate the factors which are directly and

National Conference on Emerging Technologies for Sustainable Engineering and Management Organized by Sri Muthukumaran Institute of Technology
Special Issue IJRAR- International Journal of Research and Analytical Reviews 47
indirectly affect the career anchor of the employees.
Limitations This study is focused only on employee
retention as the core objective, other HR issues are not considered under preview.
It is restricted to the techniques of career anchors and the statement which is used for evaluation pattern and strictly followed the career anchor concepts developed by Edgar Schein.
This study is completely based on conceptual model for evaluating the career anchors for retaining the talented employee force.
Scope of further study This study can be extended to evaluate
the career anchor perspectives of employees working under various organizational climates. It is viewed as basic parameters to analyze and portray the importance of employee satisfaction, employee loyalty, employee engagement, employee life style, and further employee retention. This study is commended as the base for evaluating the all HR issues and refinement of employee retention strategy.
Methodology The complete study is based on
conceptual model and it is focusing on transformation of theory into practical implementation. The opinion of the respondents who is an employee of any organization needs to take the questionnaire consists of Self-Assessment statements and the score earned by the employee are used to evaluate their intention to turnover and engagement towards the organization. The self-assessment test is carried out through online survey all the ways to obtain the score immediately by adopting following steps;
1. Take the Self-Assessment The Career Anchors Self-Assessment consists of 40 thought-provoking questions that Participants answer according to how true the item is for them individually. Participants answer Never, Seldom, Often, or Always to each item.
2. Submit Self-Assessment When Participants finish their surveys, they click the Submit button. The system analyzes the answers, and generates an
easy-to-interpret Career Anchors Report almost immediately.
3. View Results Participants and Administrators can log into the system to view the Career Anchors report, which is filled with illuminating information, ideas, recommendations, and solid career guidance. The results are always kept private, safe, and secure.
Review of Literature During the 1970s, Schein’s career anchor
theory became an important part of career research (Derr & Briscoe, 2007). Originally, this career anchor was studied as two separate career variables (DeLong, 1982). The first was service, being concerned with using one’s interpersonal skills to help others, and the second was cause, being aligned to a specific cause, such as environmentalism (Schein, 1980). Later, these variables were combined to form the service dedication to a cause career anchor. The identity career anchor, being driven by the status of belonging to a powerful or prestigious organization, has been found in several studies of information systems professionals (e.g., Jiang, Klein, & Balloun, 1995) after it was originally suggested by DeLong (1982). Also, Baruch (2004) suggested that spiritual purpose may also be a career anchor. These people will leave their organization if it does not let them fulfill those values. This career anchor grows as people become more aware of the world’s problems and as more opportunities to address them in one’s career develop (Schein, 1996). Schein’s (1975, 1980) landmark research on career anchors laid the theoretical groundwork for the study of internal careers, and his work became a key contribution to how career scholars understand individuals’ career identity and choices (Feldman & Bolino, 1996).
Jared R. Chapman denoted that although many people will say they want to be managers in the beginning of their careers, only those focused on three areas find it to be a true driver (Schein, 1980). The first area is interpersonal competence, “the ability to influence, supervise, lead, manipulate, and control people toward the more effective achievement of organizational goals” (Schein, 1974). Second is analytical competence is “the identification and solving of conceptual problems under conditions of uncertainty and incomplete information” (Schein, 1974). Third is emotional stability and it is “the capacity to be stimulated by emotional and interpersonal crises

UGC Approved: 43602 e ISSN 2348 –1269, Print ISSN 2349-5138 http://ijrar.com/ NCETSEM-19
48 IJRAR- International Journal of Research and Analytical Reviews Special Issue
rather than exhausted or debilitated by them, the capacity to bear high levels of responsibility, and the capacity to exercise authority without fear or guilt” (Schein, 1974). Building on Schein’s original work, Derr (1980) and DeLong (1982) did the first large-scale studies examining career anchors. In his study of U.S. naval personnel, Derr observed that some individuals did not align well with the career anchors defined by Schein. He found that the careers of some fighter pilots were driven by the need to do the impossible, to achieve against insurmountable odds. As a result of Derr’s and DeLong’s studies, Schein (1990) added three more career anchors to his original list of five, viz-a-viz service dedication to a cause, pure challenge, and lifestyle (Schein, 1990). Techniques of employee retention
Succeeding in employee retention efforts requires to think about things from the team’s point of view. All employees are different, of course, and each has unique desires and goals. But it is a safe ground to assume that all of them want to know they are being paid at or above market rates and have good benefits. They want to feel that they are appreciated by their employer and treated fairly. They want to be challenged and excited by the job they are asked to do. Every area of the employer-employee relationship in the organization deserves the attention for retaining the employees and boosts their satisfaction, such as, On-boarding and orientation
Aim to develop an on-boarding process where new staff members not only learn about the job but also the company culture and how they can contribute and thrive, with ongoing discussions, goals and opportunities to address questions and issues as they arrive. Mentorship programs
Pairing a new employee with a mentor is a great idea for on-boarding. New team members can learn the ropes from an experienced person with a wealth of resources, and the new hire offers a fresh viewpoint to experienced staff. Employee compensation
It is absolutely essential in this competitive labor market for companies to offer attractive compensation packages. That includes salaries, of course, but also bonuses, paid time off, health benefits, retirement plans and all the other perks that can distinguish one workplace from another. Recognition and rewards systems
Every person wants to feel appreciated for what they do. Make it a habit to thank your direct reports when they go the extra mile,
whether it is with a sincere email, a gift card or an extra day off. Show the employees and appreciate them, and share how their hard work helps the organization. Work-life balance
If staff are expected to regularly work long hours and be at the beck and call, and then the employee will likely run into issues with employee retention. A healthy work-life balance is essential, and people need to know that management understands its importance. Encourage staff to take vacation time, and if late nights are necessary to wrap up a project, see if they can offer late arrivals or an extra day off to compensate and increase job satisfaction. Training and development
In any position and industry, professionals want the possibility for advancement. Smart managers invest in their workers’ professional development and seek opportunities for them to grow. Ask each of their direct reports about their short- and long-term goals to determine how they can help achieve them. Communication and feedback
Keeping open lines of communication is essential for employee retention. The direct reports should feel that they can come to you with ideas, questions and concerns, and likewise, they expect you to be honest and open with them about improvements they need to make in their own performance. Dealing with change
Every workplace has to deal with unpleasant changes occasionally, and the staff looks to leadership for reassurance. If their organization is going through a merger, layoffs or other big changes, keep their staff informed as much as they can to avoid feeding the rumor mill. Fostering teamwork
When people work together, they can achieve more than they would have individually. Foster a culture of collaboration that accommodates individuals’ working styles and lets their talents shine. Team celebration
Celebrate major milestones for individuals and for the team. Whether the team just finished that huge quarterly project under budget or an employee brought home a new baby, seize the chance to celebrate together with a shared meal or group excursion.

National Conference on Emerging Technologies for Sustainable Engineering and Management Organized by Sri Muthukumaran Institute of Technology
Special Issue IJRAR- International Journal of Research and Analytical Reviews 49
Courtesy:
douglasjacksonrecruitment.files.wordpress.com Figure 1: Importance of employee retention
Employee retention refers to the various policies and practices which let the employees stick to an organization for a longer period of time. Every organization invests time and money to groom a new joinee, make him a corporate ready material and bring him at par with the existing employees. The organization is completely at loss when the employees leave their job once they are fully trained. Employee retention takes into account the various measures taken so that an individual stays in an organization for the maximum period of time. Importance of Career Management
Even when the employee claim to have their best interests in mind, unfortunately most of today’s organizations “manage” their workers’ careers according to what’s best for the organization, and not the individual. Career Anchors can help to identify their Career Anchor, which encompass the primary areas of competence, motives, and career values. Career Anchors Technique coined by Edgar Schein
A “Career Anchor” is a combination of perceived areas of competence, motives, and values relating to professional work choices. Often, people select a career for all the wrong reasons, and find their responses to the workplace are incompatible with their true values. This situation results in feelings of unrest and discontent and in lost productivity. To help people avoid these problems, Career Anchors help people uncover their real values and use them to make better career choices. Moreover, career anchor is the one element in the employee self-concept that will not give up, even in the face of difficult choices.
Edgar Schein, widely acclaimed as one of the founders of the field of modern organizational psychology at MIT identified eight career anchor themes and people will have prioritized preferences for them. Schein identified these
career anchors to enable people to recognize their preferences for certain areas in their job.
Table 1 - Career Anchor category Category Traits
Technical/ functional competence (TF)
This kind of person likes being good at something and will work to become a guru or expert
They like to be challenged and then use their skills to meet the challenge, doing the job properly and better than almost anyone else
Managerial competence (GM)
These people want to be managers.
They like problem-solving and dealing with other people.
They thrive on responsibility
To be successful, they also need emotional competence
Autonomy/ independence (AU)
These people have a primary need to work under their own rules and ‘steam’
They avoid standards and prefer to work alone
Security/ stability (SE)
These people seek stability and continuity as a primary factor of their lives
They avoid risk and are generally ‘lifers’ in their job
Entrepreneurial creativity (EC)
These people like to invent things, be creative and most of all to run their own businesses
They differ from those who seek autonomy in that they will share the workload
They find ownership very important
They get easily bored Wealth, for them, is a sign of success
Service/ dedication to a cause (SV)
Service-orientated people are driven more by how they can help other people than by using their talents
They may work in public services or in areas such as human resources
Pure Challenge (CH)
People driven by challenge seek constant stimulation and difficult problems that they can tackle

UGC Approved: 43602 e ISSN 2348 –1269, Print ISSN 2349-5138 http://ijrar.com/ NCETSEM-19
50 IJRAR- International Journal of Research and Analytical Reviews Special Issue
Such people will change jobs when the current one gets boring, and their career can be varied
Lifestyle (LS)
Those who are focused first on lifestyle look at their whole pattern of living
Rather than balance work and life, they are more likely to integrate the two
They may even take long periods of time off work in which to indulge in passions such as travelling
The Career Anchors Self-Assessment allows one-self to identify their career anchor. The following 40-items in the questionnaire under various parameters are used for assisting the determination of career is not a standardized test. The questions help participants think about what they really want out of a career under different category. Technical and Functional Competence
A high score in this area would suggest that what you would not like to give up is the opportunity to apply your skills in this area and to continue to develop those skills to an even higher level. You derive your sense of identity from the exercise of your skills and are most happy when you work permits you to be challenged in those areas. You may be willing to manage others in your technical or functional area, but you are not interested in management for its own sake and would avoid general management because you would have to leave your own area of expertise. 1.I dream of being so good at what I do that my expert advice will be sought continually 2.I will feel successful in my career only if I can develop my technical or functional skills to a very high level of competence. 3. Becoming a functional manager in my area of expertise is more attractive to me than becoming a general manager. 4.I would rather leave my organisation than accept a rotational assignment that would take me out of my area of expertise 5.I am most fulfilled in my work when I have been able to use my special skills and talents. General Managerial Competence
A high score in this area would suggest that what you would not like to give up, is the opportunity to climb to a level high enough in the
organisation, to enable you to integrate the efforts of others across functions and to be responsible for the output of a particular unit of the organisation. Being at a high managerial level in a specialist function does not interest you. I am most fulfilled in my work when I have been able to integrate and manage the efforts of others.
1. I dream of being in charge of a complex organisation and making decisions that affect many people
2. I will feel successful in my career only if I become a general manager in some organisation
3. Becoming a general manager is more attractive to me than becoming a functional manager in my current area of expertise
4. I would rather leave my organisation than accept a job that would take me away from the general managerial track
Autonomy and Independence A high score in this area would suggest
that what you would not like to give up is the opportunity to define your work in your own way. If you are in an organisation, you want to remain in jobs that allow you flexibility regarding how and when you work. If you tend to dislike organizational rules and restrictions to any degree, you seek occupations in which you will have the freedom you seek, such as teaching or consulting.
1. I dream of having a career that will allow me the freedom to do a job my own way and on my own schedule.
2. I am most fulfilled in my work when I am completely free to define my own tasks, schedules and procedures
3. I will feel successful in my career only if I achieve complete autonomy and freedom
4. The chance to do a job my own way, free of rules and constraints, is more important to me than security
5. I would rather leave my organisation than accept a job that would reduce my autonomy and freedom
Security and Stability A high score in this area would suggest
that what you would not like to give up is employment security or tenure in a job or organisation. Your main concern is to achieve a sense of having succeeded so that you can relax. This career anchor shows up in a concern for financial security (such as pension and retirement plans) or employment security. Such stability may involve trading your loyalty and willingness to do whatever the employer wants

National Conference on Emerging Technologies for Sustainable Engineering and Management Organized by Sri Muthukumaran Institute of Technology
Special Issue IJRAR- International Journal of Research and Analytical Reviews 51
from you for some promise of job tenure. You are less concerned with the content of your work and the rank you achieve in the organisation, although you may achieve a high level if your talents permit.
1. Security and stability are more important to me than freedom and autonomy
2. I would rather leave my organisation altogether than accept an assignment that would jeopardize my security in that organisation
3. I seek jobs in organizations that will give me a sense of security and stability
4. I am most fulfilled in my work when I feel that I have complete financial and employment security
5. I dream of having a career that will allow me to feel a sense of security and stability
Entrepreneurial Creativity A high score in this area would suggest
that what you would not like to give up is the opportunity to create an organisation or enterprise of your own, built on your own abilities and your willingness to take risks and to overcome obstacles. You want to prove to the world that you can create an enterprise that is the result of your own effort. You want your enterprise to be financially successful as proof of your abilities.
1. I am always on the lookout for ideas that would permit me to start my own enterprise
2. Building my own business is more important to me than achieving a high-level managerial position in someone else's organisation
3. I am most fulfilled in my career when I have been able to build something that is entirely the result of my own ideas and efforts
4. I will feel successful in my career only if I have succeeded in creating or building something that is entirely my own product or idea
5. I dream of starting up and running my own business
Service and Dedication to a Cause A high score in this area would suggest
that what you would not like to give up is to pursue work that achieves something of value, such as making the world a better place to live, solving environmental problems, improving harmony among people, helping others, improving people's safety, curing diseases through new products and so on.
1. I will feel successful in my career only if I have a feeling of having made a real contribution to the welfare of society.
2. I am most fulfilled in my career when I have been able to use my talents in the service of others.
3. Using my skills to make the world a better place to live and work is more important to me than achieving a high-level managerial position
4. I dream of having a career that makes a real contribution to humanity and society
5. I would rather leave my organisation than accept an assignment that would undermine my ability to be of service to others
Pure Challenge A high score in this area would suggest
that what you would not like to give up is the opportunity to work on solutions to seemingly unsolvable problems, to win out over tough opponents, or to overcome difficult obstacles. For you, the only meaningful reason for pursuing a job or career is that it permits you to win out over the impossible. Novelty, variety and difficulty become ends in themselves, and if something is easy it becomes immediately boring.
1. I dream of a career in which I can solve problems or win out in situations that are extremely challenging
2. I will feel successful in my career when I have been able to use my talents in the service of others
3. I have been most fulfilled in my career with I have solved seemingly unsolvable problems or won out over seemingly impossible odds
4. I seek out work opportunities that strongly challenge my problem solving and/or competitive skills
5. Working on problems that are almost unsolvable is more important to me than achieving a high level managerial position
Lifestyle A high score in this area would suggest
that what you would not like to give up is a situation that permits you to balance and integrate your personal needs, your family needs and the requirements of your career. You want to make all the major sectors of your life work together towards an integrated whole, and you therefore need a career situation that provides enough flexibility to achieve such integration. You feel that your identity is more tied up with how

UGC Approved: 43602 e ISSN 2348 –1269, Print ISSN 2349-5138 http://ijrar.com/ NCETSEM-19
52 IJRAR- International Journal of Research and Analytical Reviews Special Issue
you live your total life, where you settle, how you deal with your family situation and how you develop yourself than with any particular job or organisation.
1. I would rather leave my organisation than to be put into a job that would compromise my ability to pursue personal and family concerns.
2. I dream of a career that will permit me to integrate my personal, family and work needs
3. I feel successful in life only if I have been able to balance my personal, family and career requirements
4. Balancing the demands of personal and professional life is more important to me than achieving a high-level managerial position
5. I have always sought out work opportunities that would minimize interference with home or family concerns
Practical Implications of Careers Anchors The thought of a career change can be
confusing, stressful, and scary for some. Others seize the chance to make a change for the better, even if it means a shift in income, location, lifestyle or training. Changing to a trade-based career may be an option for people who prefer practical roles, hands-on work, specialized skills or the desire to work for themselves and not be confined to an office. Here, is a technique which is available to determine the career perspective of the employees and their intention to continue in their present working environment. It is considered as one of the cost conservation technique for the organization, for saving the expenditure met out by the company for construction of human capital. Conclusion
From the study it was concluded that, retaining talented pool of employees are consider as a greater task than recruiting a new employee for the organization. It is the immense responsibility for the organization to frame the most appropriate strategy in searching out the reasons for the employee turnover and make all the positive attempts to remove those hurdles and make the employees to feel more satisfied in the present working environment. Career anchors are the factors which are directly assisting the organization to cover up the employees and retain their talent for long years.
But honestly, it is to remember to assess the employee retention strategies at least once a year. They want to stay current on market salary rates and benefits, and best practices in developing workplace culture and manager-employee relations. Doing so, will help them keep staff morale high and turnover low while guaranteeing your organization’s success.
References Danziger, N., & Valency, R. (2006). Career
anchors: Distribution and impact on job satisfaction, the Israeli case. Career Development International, 11, 293–303. doi:10.1108/13620430610672513
Danziger, N., Rachman-Moore, D., & Valency, R. (2008). The construct validity of Schein’s Career Anchors Orientation Inventory. Career Development International, 13, 7–19. doi:10.1108/13620430810849506
DeLong, T. J. (1982a). The career orientations of MBA alumni: A multidimensional model. In R. Katz (Ed.), Career issues in human resource management (pp. 50–64). Englewood Cliffs, NJ: Prentice-Hall.
DeLong, T. J. (1982b). Re-examining the career anchor model. Personnel, 59, 50–61.
DeLong, T. J. (1984). A comparison of the career orientations of rural and urban educators. Educational Review, 36, 67–74. doi:10.1080/0013191840360106
Derr, C. B. (1980). More about career anchors. In C. B. Derr (Ed.), Work, family, and the career: New frontiers in theory and research (pp. 166–187). New York, NY: Praeger
Holland, J. L. 1997. Making Vocational Choices. 3d ed. Englewood Cliffs, NJ: Prentice Hall.
Lifton, R. J. 1961. Thought Reform and the Psychology of Totalism. New York: Norton.
Osipow, S. H. 1973. Theories of Career Development. 2d ed. New York: Appleton-Century-Crofts.
Schein, E. H. “Individuals and Careers.” Pp. 155-171 in Handbook of Organizational Behavior, edited by J. W. Lorsch. Englewood Cliffs, NJ: Prentice Hall.
Schein, E. H. 1961. Coercive Persuasion. New York: Norton.
Schein, E. H. 1978. Career Dynamics. Reading, MA: Addison-Wesley.
Schein, E. H. Career Anchors. San Francisco, CA: Jossey-Bass.
Schein, Edgar H, (1990 & 1996). Career Anchors (discovering your real values), Jossey-Bass Pfeiffer
Super, D. E. and Bohn, M. J. Jr. 1970. Occupational Psychology. Belmont, CA: Wadsworth

National Conference on Emerging Technologies for Sustainable Engineering and Management Organized by Sri Muthukumaran Institute of Technology
Special Issue IJRAR- International Journal of Research and Analytical Reviews 53
A Study on Investor’s Attitude towards mutual fund investment in Tamilnadu.
Dr.A.ELAIYARAJA
Associate Professor Department of MBA, Loyola Institute of Technology ,Chennai.
ABSTRACT: A Study on Investor’s Attitude towards mutual fund investment in Tamilnadu. In financial markets “expectations” of the investors plays a vital role in influencing the price of securities and the volume of trade. The main objective of the study was to find out the investors attitude and satisfaction level towards Mutual Funds distributed by the company and to analyses the level of satisfaction of investors on their investment in mutual funds. The type of research adopted for the project was descriptive in nature. In the due course of the project it was identified that the customer preferred liquidity, safety and low cost investment for Mutual funds. The company could design the Mutual funds schemes in accordance with the need, age, and income of the investors. Investors were found to be risk averse and heisted to play in stock market, owing to its highly volatile nature instead when they prefer to invest in fixed deposit and insurance schemes. Through the study it was understood that majority of the investors had favourable opinion about the performance of the mutual funds through some investors perceive that the performance of Mutual Funds, they hold was not up to their expectations.
Keywords:
Introduction: Mutual funds are financial
intermediaries, which collect the savings of investors and invest them in a large and well-diversified portfolio of securities such as money market instruments, corporate and government bonds and equity shares of joint stock companies. A mutual fund is a pool of common funds invested by different investors, who have no contact with each other. Since small investors generally do not have adequate time, knowledge, experience and resources for directly accessing the capital market. The advantages for the investors are reduction in risk, expert professional management, diversified portfolios, and liquidity of investment and tax benefits. By pooling their assets through mutual funds, investors achieve economies of scale. The interests of the investors are protected by the SEBI, which acts as a watchdog. Mutual funds are governed by the SEBI (Mutual Funds) Regulations, 1993.
A mutual fund basically pools the money of investors, who share some common financial objective. This money is invested in capital market instruments like shares, debentures and other securities and also in other invisible avenues such as real estate, commodities etc. income thus earned and the capital appreciation realized, are share by its unit holders (investors) in proportion to the number of units owned by them.
DEFINITIONS A non-depository or non-banking financial intermediary which acts as an important vehicle for bringing wealth holders and deficit units together, indirectly, is known as ‘Mutual Fund’. Mutual Fund is corporations that accept money from savers and then use this money to buy stocks, long-term bonds, and short-term debt instruments issued by business or government units. These corporation pool funds and thus reduce risk by diversification.
INVESTOR’S An individual who commits money to
investment of products with the expectation financial return. Generally, the primary concern of an investor is to minimize risk while maximizing return, as opposed to a speculator, who is willing to accept a higher level of risk in the hopes of collecting higher-than-average profits.
ATTITUDE Attitude is a tendency respond to positively or negatively towards a certain idea, object, person or situation. Attitude is a person feeling or opinion about something or someone. INVESTMENT Investment is the purchase of an asset or item with the hope that it will generate income or

UGC Approved: 43602 e ISSN 2348 –1269, Print ISSN 2349-5138 http://ijrar.com/ NCETSEM-19
54 IJRAR- International Journal of Research and Analytical Reviews Special Issue
appreciate in the future and be sold at the higher price. It generally does not include deposits with a bank or similar institution. The term investment is usually used when referring to a long-term outlook.
BENEFITS OF MUTUAL FUND 1) MOBILIZING SMALL SAVINGS
Mutual funds mobilize funds by selling their own shares, known as units. To an investor, a unit in mutual funds means ownership of a proportional share of securities in the portfolio of a mutual fund. This gives the benefits of convenience and the satisfaction of owning shares in many industries. Thus, mutual funds are primarily investment intermediaries which acquire individual investments and pass on the return to small fund investors. 2) PROFESSIONAL MANAGEMENT It is possible for the small investors to have the benefit of professional and expert management of their funds. Mutual funds employ professional experts who manage the investment portfolios efficiently and profitability. 3) BETTER LIQUIDITY
Mutual funds have the distinct advantage of offering to its investors the benefit of better liquidity of investment. There is always a ready market available for the Mutual Funds units. In addition, there is also obligation imposed by SEBI Guidelines. 4) REDUCED RISK
There is only a minimum risk attached to the principal amount and return for the investments made in mutual fund scheme. This usually made possible by expert supervision Diversification and liquidity of units. Mutual funds provide small investors the access to a reduced investment risk resulting from diversification. 5) SWITCHING FACILITY
Mutual funds provided investors with flexible investment opportunity, whereby it is possible to switch from one scheme to another. This flexibility option enables investors to Shift from income to growth scheme, or vice-versa, from a close-ended scheme to an open Ended scheme, all at will. 6) TAX BENEFIT
An attractive benefit of mutual fund is that the various scheme offered by them provide tax Shelter to the investors. This benefit is available under the provisions of the income Tax Act. 7) LOW TRANSACTION COSTS
The cost of purchase and sale of mutual fund unit is relative lower. This is to the large Volume of money being handled by mutual fund in the capital market, for Instance, the fees Payable, such as brokerage fee or trading commission, etc is lower.
TYPES OF MUTUAL FUND Open/Close Ended Fund Growth/Equity Oriented Fund Income/Debt Oriented Fund Balanced Fund Money or Liquid Fund
SOME FACTS FOR THE GROWTH OF MUTUAL FUNDS IN INDIA
100% growth in the last 6 years. Number of foreign A class, is in the queue
to enter the Indian markets like Fidelity Investments, US based, with over US$1trillion assets under management worldwide.
'B' and 'C' class cities are growing rapidly. Today most of the mutual funds are concentrating on the 'A' class cities. Soon they will find scope in the growing cities.
Mutual fund can penetrate rural like the Indian insurance industry with simple and limited products.
SEBI allowing the MF's to launch commodity mutual funds.
Emphasis on better corporate governance.
Introduction of Financial Planners who can provide need based advice.
SCOPE OF THE STUDY The scope of the study is to identify the attitude of investor’s in mutual fund investment. The researcher is going to identify the investor’s satisfaction level of investment. Customer service, and other facilities offered by the company. The main scope of the study is the customer’s knowledge, preference and satisfaction on mutual fund schemes offered by the company.
OBJECTIVES OF THE STUDY To study on investor’s attitude towards
Mutual fund investments in tamilnadu. To understanding and analyzemutual
fund schemes. To find out the reason for making
investment in mutual fund. To evaluate the risk level and return
expected by the investor’s.

National Conference on Emerging Technologies for Sustainable Engineering and Management Organized by Sri Muthukumaran Institute of Technology
Special Issue IJRAR- International Journal of Research and Analytical Reviews 55
REVIEW OF LITERATURE: Jack Treynor (1965) developed a methodology for performance evaluation of a mutual fund that is referred to as reward to volatility measure, which is defined as average excess return on the portfolio. This is followed by Sharpe (1966) reward to variability measure, which is average excess return on the portfolio divided by the standard deviation of the portfolio. Michael C. Jensen (1967) conducted an empirical study of mutual funds in the period of 1954-64 for 115 mutual funds. The results indicate that these funds are not able to predict security prices well enough to outperform a buy the market and hold policy. The study ignored the gross management expenses to be free. There was very little evidence that any individual fund was able to do significantly better than which investors expected from mere random chance.
STATEMENT OF THE PROBLEM Investors vary from small individuals
investors to large institutional investors. Further they can be classified as experienced investors, middle aged investors, wealthy investors, active investors and so on. Investors may seek advice of experts to invest while another may invest by own. Attitude differ from every person relates to their acceptance of risk level. Due to lack of experience in investment investors may fail to gain their return. It could be identified that it is necessary to conduct a detailed study to find out Investors attitude towards mutual fund.
RESEARCH METHODOLOGY Research is a systematic method of
finding solutions to problems. It is essentially an investigation, a recording and an analysis of evidence for the purpose of gaining knowledge. It includes different steps which are generally accepted by a researcher in studying his/her research problems along with the specific logic behind it. The research involves to developing a sustainability base and index for any research project. The formalized procedure of research methodology containing research problem or problem statement, choice of research design, sources of data, designing the data collection form questionnaire, sampling design & size, field survey and analysis of collected data.
SAMPLING METHOD The sampling technique used in the study is ConvenienceSampling.
Data Analysis STATISTICAL TOOLS CHI SQUARE
To test whether there is a relationship between the occupation and percentage level of annual income of investor’s investment in mutual fund. Null Hypothesis (H0)
There is no significant relationship between the occupation and percentage level of annual income of investor’s investment in mutual fund. Alternative Hypothesis (H1)
There I s significant relationship between the occupation and percentage level of annual income of investor’s investment in mutual fund.
Occupation
P
rofe
ssio
nal
Bu
sin
ess
Em
plo
yee
Ret
ired
per
son
Ho
use
wif
e
T
ota
l Annual income of investor’s investment in mutual fund
0-5% 2 3 9 8 5 27 6-10% 3 3 7 5 3 21
11-15% 6 10 5 3 5 29 16-20% 12 10 3 2 4 31 21-25% 5 14 1 1 1 22
Total 28 40 25 19 18 130
Level of significance: 5%
Inference Since the calculated value is greater than tabulated value Alternative hypothesis (H1) is accepted at 5% level of significance. Conclusion
There is significant relationship between the occupation and percentage level of annual income of investor’s investment in mutual fund.
CORRELATION COEFFICIENT Need for the test To test whether there is a significant relationship between the annual income and the relevant for making investment
X Y X2 Y2 XY 22 32
484 1024 704
28 50 784 2500
1400
38 29 1444 841
1102

UGC Approved: 43602 e ISSN 2348 –1269, Print ISSN 2349-5138 http://ijrar.com/ NCETSEM-19
56 IJRAR- International Journal of Research and Analytical Reviews Special Issue
22 15 484 225
330
20 4 400 16 80
∑X=130
∑Y=130
∑X2=3596
∑Y2=4606
∑XY=3616
r =𝑁∑𝑋𝑌−∑𝑋∑𝑌
𝑁𝑋2−(∑𝑋)2𝑁∑𝑌2−(∑𝑌)2
5(3616) – (130) (130) r = ------------------------------ √ (5*3596) – (130)2 √ (5*4606) – (130)2 r= 0.45 Calculated value = 0.45
Conclusion There exists positive correlation,there is a significant relationship between the annual income and the relevant for making investment.
FINDINGS In Chi Square - There is significant
relationship between the occupation and percentage level of invest in mutual fund
There exists positive correlation; there is a significant relationship between the annual income and the relevant for making investment.
SUGGESTIONS
Company would be good if it provides awareness programs about Mutual Fund in frequent intervals.
The market scenario may be informed to the investors often.
The financial advisor can recommended all the schemes based on income level of investors.
The investors are dissatisfied in closed ended funds. So the brokers can diversity the portfolio based on more profitable sectors.
The fund manager has to select the mutual fund scheme for investors on moderate risk and high return.
CONCLUSION In this context financial reforms managing especially the Mutual Funds has become more challenging than ever before. New models of management are required such models will demand new knowledge, new skill and new techniques. The Mutual Fund management must acquire these traits. One has to appreciate that mere launching of schemes by the institutions alone will not be sufficient to bring in necessary performance improvement and to get the competitive edge. It is the fund manager who is to play the crucial role in selectivity and timing of the issues. The management might encourage investor’s satisfaction survey at regular intervals to improve the investor’s satisfaction.
REFERENCE BOOKS
Prasannachandra, Fnancial management Tata McGraw –Hill education private limited 7th edition 2008
IM PANDEY ,Financial management, 8th
edition ,Vikas publishing

National Conference on Emerging Technologies for Sustainable Engineering and Management Organized by Sri Muthukumaran Institute of Technology
Special Issue IJRAR- International Journal of Research and Analytical Reviews 57
A STUDY ON WORK LIFE BALANCE OF EMPLOYEES WITH SPECIAL REFERENCE TO MOULI SPINNERS LTD, ERODE
Dr.S.Revathy* & Dr.R.Seranmadevi**
*Professor, K.S.Rangasamy College of Technology, Tiruchengode, **Professor, Sri Muthukumaran Institute of Technology, Mangadu, Chennai
ABSTRACT: There is a developing readiness in today's workplaces that employees don't surrender their lives only on the grounds that they work. Work and life remain the two most paramount areas in the life of a utilized single person. Nonetheless, the test of adjusting work and non-work requests is one of today's focal attentiveness toward both people and organizations. With the developing differences of family structures spoke to in today's workforce, especially with the developing standard of double profession families, the imperativeness of dealing with an employee's work-life balance have expanded notably in the course of recent years. Managements understand that the nature of an employee's close to home and family life effects work quality and that there are solid business motivations to advertise work and non-work coordination. This paper is about ‘Work life balance of employees with special reference to Mouli Spinners Ltd’. In this paper, we battle that helping employees to accomplish a work-life balance ought to turn into a basic piece of HR policy and procedure in the event that it is to genuinely get the best from the organization's kin without abandoning them unsatisfied, worn out and unfulfilled. Here the tools like percentage analysis and chi-square are used to accomplish the goal.
Keywords: family life balance, work life balance, work quality
Introduction Work-life balance is about finding the right balance between work and life, and about feeling comfortable with both work and family commitments. Work-life balance is essentially the balance between three components, namely, paid work, unpaid work and personal time. Employees with work-life balance feel their lives are fulfilled both inside and outside of work and they experience minimal conflict between work and non-work roles. Those who achieve this balance tend to have higher levels of satisfaction with their jobs and life in general, as well as lower levels of stress and depression. From an employer’s viewpoint, encouraging work-life balance may attract new hires, help reduce turnover and absenteeism, and increase the chances of employees voluntarily engaging in “pro-social” behaviors that rise above and beyond their job requirements. Nevertheless, findings are mixed with respect to effects of employee work-life balance on the company’s bottom line.
Statement of the problem Work and Life are of the main things that are needed for the working people in day to day life. People are not able to balance their work life and family life properly. They need to be trained for balancing it. This study is about work life
balance of mill employees. Now-a-days many people (especially women) are working in mill for daily wages. The present study is about work life balance of the employees with special reference to Mouli spinners Ltd.
Need for the Study Work life balance is the hectic task for
any employees irrespective of their cadre and responsibility with the organization. An employee needs to achieve success in both work as well as in the personal life is considered as a most remarkable experiences and it has to be kept as biography of a successful person to provide better understanding of this concept as well. It is said to be the ever green issue to manage both work with personal life environment, so the present study is approached with a view to analyze the work life balance capability of the employees working under Mouli Spinners Ltd.
Objectives of the study To find out the procedures and facilities
of work life balance of employees in Mouli Spinners Ltd.
To assess and evaluate the impact of work life balance
To suggest the specific recommendations for further betterment.

UGC Approved: 43602 e ISSN 2348 –1269, Print ISSN 2349-5138 http://ijrar.com/ NCETSEM-19
58 IJRAR- International Journal of Research and Analytical Reviews Special Issue
Methodology of the Study The research design of the present study
is descriptive in nature, attempted to describe the opinion of the respondents regarding the work life balance of the employees working under Mouli Spinners Ltd. The data relevant for the study is obtained from various other sources like published articles, thesis and other local dailies. The primary data for the study is directly collected from the respondents through circulating the structured Interview schedule consists of standard statement reflecting the work life balance of the employees in their organization. Totally 125 respondents are included in the study through systematic sampling under probability sampling method, every tenth person in the roll of Mouli Spinners Ltd are included in the study for constructing the sample size. The collected data are further analyzed through appropriate statistical techniques like Chi-square and ANOVA for evaluating the association and mean difference among the study variables included in the study based on the opinion of the respondents. The level of significance was assumed as 95 per cent and the remaining 5 per cent was granted against the standard error under sampling bias of social science research.
Limitations of the study This study is conducted in Mouli
Spinners Ltd, so the results may not be applicable for other company
This study included only 125 respondents, the opinion of respondents are subject to self bias.
Review of Literatures There are plenty of research articles are
available from ancient time of study to till date to discuss the concept of work life balance of the employees. Among them, for this study only few are referred with different dimensional approaches to work life balance concept, and the same were presented below.
David Guest (2002) reviews aspects of contemporary theory and research on work-life balance. It starts by exploring why work-life balance has become an important topic for research and policy in some countries and after outlining traditional perspectives examines the concept of balance and its implications for the study of the relation between work and the rest of life. A model outlining the causes, nature and consequences of a more or less acceptable work-life balance is presented and recent research is
cited to illustrate the various dimensions. Finally, the topic is linked to the field of work and organizational psychology and a number of theoretical and conceptual issues of relevance to research in Europe are raised.
Nancy R. Lockwood (2003) highlighted that that in organizations and on the home front, the challenge of work/life balance is rising to the top of many employers’ and employees’ consciousness. In today’s fast-paced society, human resource professionals seek options to positively impact the bottom line of their companies, improve employee morale, retain employees with valuable company knowledge, and keep pace with workplace trends. This article provides human resource professionals with an historical perspective, data and possible solutions for organizations and employees alike to work/life balance. Three factors global competition, personal lives/family values, and an aging workforce present challenges that exacerbate work/life balance. This article offers the perspective that human resource professionals can assist their companies to capitalize on these factors by using work/life initiatives to gain a competitive advantage in the marketplace.
Ioan Lazăr and Patricia Raţiu (2010), underwent the study is to establish whether work-life balance initiatives and practices can be considered as strategic human resource management decisions that can translate into improved individual and organizational performance. The results of a number of studies reviewed in this paper show the outcomes and the benefits of implementing work life balance practices not only for employees themselves, but also for their families, organizations and society. Despite the fact that work-life conflict has significant business costs associated with lack of engagement, absenteeism, turnover rates, low productivity and creativity or poor retention levels, there are some factors of organizational work-life culture that may compromise availability and use of these practices, what are the challenges for research and practice in the future? In the end of the article we propose several suggestions (guidelines) in order to improve our understanding, choice, implementation and effectiveness of work-life practices.
Syed, Jawad (2015) examines the potential conflict between work and personal or family life, and discusses this issue in the context of diverse groups of employees. Otherwise, employees feel pressure to continuously work,

National Conference on Emerging Technologies for Sustainable Engineering and Management Organized by Sri Muthukumaran Institute of Technology
Special Issue IJRAR- International Journal of Research and Analytical Reviews 59
which can be perpetuated by mobile devices and constant accessibility of the internet that allows employees to transport a workstation wherever they go. Results indicate that in general many people report experiencing poor work-life balance but not for lack of wanting it; therefore, employers and employees alike should consider what is most important for achieving this healthy balance.
Data analysis and Interpretation Table 1 Gender wise distribution of
respondents
Particulars Respondents Percent
Male 53 42.4
Female 72 57.6
Total 125 100
Source: Primary Data
The table indicates that 42.4% of them are male respondents and 57.6% of them are female respondent. It is evident from the respondents according to their age that 23.2% of the respondents are in the age group of between18-25, 50.4% of the respondents are in age group 25-35 years, 26.4% of the respondents age in the age group 35 years.
Table 2 Respondents according to their Educational Qualification
Particulars Respondents Percent
Below 10th 57 45.6
10th 50 40.0
12th 13 10.4
UG 5 4.0
Total 125 100
Source: Primary Data
The table indicates that 45.6% of the employees have their education level below 10th, 40% of the employees are educated till 10th, 10.4% employees are educated till 12th and 4% of employees completed their UG Degree. Majority 45.6% of the respondents are educated below 10th.
Table 3 Respondents according to their Family Structure
Particulars Respondents Percent
Nuclear 64 51.2
Joint 61 48.8
Total 125 100
Source: Primary Data
It is evident from the table that 51.2% of employees are from nuclear family structure and 48.8% are from joint family.
Table 4 Respondents according to their Marital Status
Particulars Respondents Percent
Married 97 77.6
Unmarried 28 22.4
Total 125 100
Source: Primary Data
The table clearly indicates that 77.6% of the respondents are married and 22.4% of them are unmarried. Majority 77.6% of the respondents are married. Table 5 Respondents according to their Salary
Level
Particulars Respondents Percent
Salary 9 7.2
Daily Wage 116 92.8
Total 125 100
Source: Primary Data
It is evident from the table that 7.2% of the respondents are getting monthly income and 92.8% of the respondents are getting daily wages. The respondents according to their working hours shows that 8% of employees are working below 8 hours, 56.8% of employees are working between 8-10 hours, and 35.2% of employees are working between 10-12 hours. It is evident from the respondents according to their position that 4.8% of respondents have executive position, 1.6% of them have technical position and 93.6 of respondents are employees.
Table 6 Balancing Level of Respondents between Work and Family Life
Particulars Respondents Percent
Well balanced 6 4.8
Somewhat balanced 59 47.2
Balanced 44 35.2
Somewhat out of balanced 14 11.2
Out of balanced 2 1.6
Total 125 100
Source: Primary Data
The above table clearly shows that 4.8% of the respondents have well balance between work and home life, 47.2% of the respondents are somewhat balanced, 35.2% of the respondents

UGC Approved: 43602 e ISSN 2348 –1269, Print ISSN 2349-5138 http://ijrar.com/ NCETSEM-19
60 IJRAR- International Journal of Research and Analytical Reviews Special Issue
are balanced with their work and family life, 11.2% of the respondents are trying to balance and 1.6% of the respondents have no balance in their work and family life. Majority 47.2% of the respondents are having a good balance between their work and family
Table 7 Stress of Employees
Particulars Respondents Percent
Yes 48 38.4
No 77 61.6
Total 125 100
Source: Primary Data
It is evident from the above table that 38.4% of employee’s arte stressed due to their work and 61.6% of employees have no stress while working in the mill.
Table 8 Satisfaction Level of Respondents Based on Canteen Facilities
Particulars Respondents Percent
Highly Satisfied 88 70.4
Satisfied 35 28
Neither Satisfied nor Dissatisfied
2 1.6
Total 125 100
Source: Primary Data
The above table clearly shows that 70.4% of the respondents are highly satisfied with canteen facility, 28% of the respondents are satisfied, and 1.6% of the respondents are neutral with the satisfied level of canteen facility. Majority 70.4% of the respondents are highly satisfied with the canteen facility available in the mill.
The satisfaction level of respondents based on toilet and ventilation facilities clearly shows that 50.4% of the respondents are highly satisfied with toilet and ventilation facilities, 44% of the respondents are satisfied, 4.8% of the respondents are neutral with the satisfaction level and 0.8% of the respondents are not satisfied with this facility.
The satisfaction level of respondents based on cleaning clearly shows that 28.8% of the respondents are highly satisfied with cleaning, 52.8% of the respondents are satisfied, and 22.4% of the respondents have neutral opinion with cleaning.
The satisfaction level of respondents based on transport facility clearly shows that 68% of the respondents are highly satisfied with transport, 24.8% of the respondents are satisfied, 6.4% of the respondents have neutral opinion with transport facility and 0.8% of the respondents are highly dissatisfied with transport facility.
The satisfaction level of respondents based on water facility clearly shows that 40% of the respondents are highly satisfied with water facility, 40% of the respondents are satisfied, 17.6% of the respondents have neutral opinion with water facility and 2.4% of the respondents are dissatisfied with water facility.
Table 9 Awareness about Work Life Balances Policy
Particulars Respondents Percent Yes 4 3.2 No 121 96.8
Total 125 100 Source: Primary Data
It is evident from the above table that only 3.2% of respondents are aware about the policy in the mill and remaining 96.8% of them are unaware of the work life balance policy.
Table 10 Respondent’s Missed Quality Time with Family or Friends
Particulars Respondents Percent
Always 1 .8
Often 16 12.8
Sometimes 63 50.4
Rarely 37 29.6
Never 8 6.4
Total 125 100
Source: Primary Data
From the above table, we conclude that 0.8% of respondent are always missing their quality time with family and friends, 12.8% of respondents often miss their quality time, 50.4% of them are missing their time sometimes, 29.6% of them are rarely missing their time and 6.4% of respondents never miss their quality time with family or friends. Table 11 Satisfaction of Respondents to Work
in the Mill Particulars Respondents Percent
Highly satisfied 10 8

National Conference on Emerging Technologies for Sustainable Engineering and Management Organized by Sri Muthukumaran Institute of Technology
Special Issue IJRAR- International Journal of Research and Analytical Reviews 61
Satisfied 65 52.0
Neutral 31 24.8
Dissatisfied 17 13.6
Highly dissatisfied 2 1.6
Total 125 100
Source: Primary Data
It is evident from the above table that 8% of respondents are highly satisfied to work in the mill, 52% of respondents are satisfied to work in the mill, 24.8% of respondents are having neutral opinion, 13.6% of respondents are dissatisfied and 1.6% of respondents are highly dissatisfied to work in this mill. Testing the association between Age and Work Life Balance Null hypothesis (H0) : There is no association between age and work life balance. Alternate hypothesis (H1) : There is a significant association between age and work life balance. Table 12 Testing the association between Age
and Work Life Balance
Chi-Square Tests Value df Sig.
Pearson Chi-Square 2.613a 8 .956
Likelihood Ratio 3.022 8 .933
Linear-by-Linear Association 2.283 1 .131
N of Valid Cases 125 From the above table it is interpreted the value of the test static is 2.613 and the corresponding p value of the test is 0.956, since p is greater than significant value (σ 0.05) Null hypothesis is accepted. There is no association between age and work life balance. Testing the association between Gender and Work Life Balance Null hypothesis (H0) : There is no association between gender and work life balance. Alternate hypothesis (H1) : There is a significant association between gender and work life balance. Table 13 Testing the association between Age
and Work Life Balance Chi-Square Tests Value df Sig.
Pearson Chi-Square 3.912a 4 .418
Likelihood Ratio 4.148 4 .386
Linear-by-Linear Association .315 1 .575
N of Valid Cases 125
From the above table it is interpreted the value of the test static is 3.912 and the corresponding p value of the test is 0.418, since p is greater than significant value (σ 0.05) Null hypothesis is accepted. There is no association between gender and work life balance. Testing the association between Stress and Work Life Balance Null hypothesis (H0) : There is no association between stress and work life balance. Alternate hypothesis (H1) : There is a significant association between stress and work life balance.
Table 14 Testing the association between Stress and Work Life Balance
Chi-Square Tests Value df Sig
Pearson Chi-Square 11.865a 4 .018
Likelihood Ratio 12.473 4 .014
Linear-by-Linear Association 6.549 1 .010
N of Valid Cases 125
From the above table it is interpreted the value of the test static is 11.865 and the corresponding p value of the test is 0.018, since p is lesser than significant value (σ 0.05) Null hypothesis is rejected. There is an association between stress and work life balance of employees. Testing the association between Missing Quality time and Work Life Balance Null hypothesis (H0) : There is no association between missing quality time and work life balance. Alternate hypothesis (H1) : There is an association between missing quality time and work life balance. Table 15 Testing the association between Missing Quality time and Work Life Balance
Chi-Square Tests Value df Sig.
Pearson Chi-Square 31.605a 16 .011
Likelihood Ratio 25.372 16 .064
Linear-by-Linear Association 2.805 1 .094
N of Valid Cases 125

UGC Approved: 43602 e ISSN 2348 –1269, Print ISSN 2349-5138 http://ijrar.com/ NCETSEM-19
62 IJRAR- International Journal of Research and Analytical Reviews Special Issue
From the table it is interpreted the value of the test static is 31.605 and the corresponding p value of the test is 0.011, since p is lesser than significant value (σ 0.05) Null hypothesis is rejected. There is an association between missing quality time and work life balance of employees.
Findings of the study 1. 50.4 percent of the respondents belong
to the age group of 25-35 years. 57.6 percent of the respondents belong to the gender group of female. 45.6 percent of the respondents are educated below 10th. 51.2 percent of respondents are from nuclear family structure. 77.7 percent of the respondents are married. 92.8 percent of respondents are getting daily wages. 56.8 percent of respondents are working between 8-10 hours. 93.6 percent of respondents are employees.
2. 47.2 percent of respondents are somewhat balancing their work and family life.
3. 61.6 percent of respondents have no stress while working in the organization.
4. 70.4 percent of the respondents are highly satisfied with the canteen facility available in the organization. 50.4 percent of the respondents are highly satisfied with the toilet and ventilation facilities available in the organization. 52.8 percent of the respondents are satisfied with the cleaning facility in the organization.
5. 68 percent of the respondents are highly satisfied with transport facility.40 percent of the respondents are highly satisfied with water facility in the organization.
6. 96.8 percent of respondents have no awareness about work life balance policy in the organization.
7. 50.4 percent of respondents are sometimes missing their quality time with family and friends.
8. 52 percent of employees are satisfied to work in Mouli Spinners Ltd.
9. There is no association between age and work life balance.
10. There is no association between gender and work life balance.
11. There is a significant association between stress and work life balance of employees.
12. There is a significant association between missing quality time and work life balance of employees.
Suggestions As a result of the data analysis and
interpretation, here are some suggestions to improve the Employee work life balance at Mouli Spinners.
1) The effective employee work-life balance has better organizational commitment which leads to better production output and minimum employee turnover.
2) The Mill should concentrate to provide the opportunities for the promotion of employees.
3) This shows that few employees are not satisfied with the present salary (daily wages) and bonus provided by the mill. So the management can consider this issue and make arrangements to revise their salary and bonus.
Conclusion The family and work life are both important to employees in any sector and if these two are not maintained properly it creates stress and strain and results into various diseases. This study is found important because it tries to know how the work and family life interface results into stress. Achieving a good balance between work and family commitments is a growing concern for employees and organizations. There is now mounting evidence-linking work life imbalance to reduce health and wellbeing among individuals and families. It is not surprising then there is increasing interest among organizational stakeholders (CEOs, HR Managers) for introducing work-life balance policies in their organizations. Work-life balance policies are most likely to be successfully mainstreamed in organizations which have a clear understanding of their business rationale and which respect the importance of work life balance for all the employees.
References Guest, David. (2002). Perspectives on the
Study of Work-Life Balance. Social Science Information Sur Les Sciences Sociales - SOC SCI INFORM. 41. 255-279. 10.1177/0539018402041002005.
Ioan Lazăr and Patricia Raţiu (2010), “The Role of Work-Life Balance Practices in Order to Improve Organizational Performance”, European Research Studies, Volume XIII, Issue (1), 2010, pp. 202-214.

National Conference on Emerging Technologies for Sustainable Engineering and Management Organized by Sri Muthukumaran Institute of Technology
Special Issue IJRAR- International Journal of Research and Analytical Reviews 63
Mouli Spinners Annual report and Payroll register
Nancy R. Lockwood (2003), “Work Life Balance Challenges and Solutions”, published by The Society of Human Resource Management, Research Quarterly, 2003, pp. 1-10.
Syed, Jawad and Mustafa Ozbilgin (2015), “Work-life balance” published as chapter in the book, ‘Managing Diversity and Inclusion: An International Perspective’, Sage Publications, January 2015, pp.291-314.
www.businessdictionary/definition/worklifebalance.com
www.worklifebalance.com

UGC Approved: 43602 e ISSN 2348 –1269, Print ISSN 2349-5138 http://ijrar.com/ NCETSEM-19
64 IJRAR- International Journal of Research and Analytical Reviews Special Issue
A STUDY ON EMERGING TRENDS OF ELECTRIC VEHICLES TECHNOLOGY IN INDIA FOR A SUSTAINABLE FUTURE
Deepan C* & Dr. Chitra Devi S **
*Research Scholar, R&D Centre, Bharathiar University, Coimbatore **Professor, Sri Muthukumaran Institute of Technology, Mankadu, Chennai
ABSTRACT: Environmental responsibility, rising air pollution levels and government policies are forcing Automobile manufacturers to steer their focustowards Electric Vehicles (EVs) manufacturing. Recently all major manufacturers such as Maruti Suzuki, Tata Motors, Mahindra and Mahindra, Hyundai and Toyota have unveiled their future plans in EV manufacturing. To completely understand the consumer acceptance of EVs, key factors that directly influence consumer decision has to be considered in order to arrive at a valid and effective conclusion. In the end we observe that the trust on EV technology and environmental responsibility are key drivers for accepting EVs whereas initial buying cost and infrastructure availability are key set backs for consumer acceptance. Hence it is the responsibility of the government to increase initial EV cost subsidy and provide favorable policies and promote investment in improving the infrastructure in the country.
Keywords: automobile industry, electric vehicles, energy conservation, sustainability.
Introduction India is the fourth largest automobile market in the world with annual growth of 9.5% over the previous year. India is expected to be the world's third-largest automotive market in terms of volume by 2026.The domestic passenger vehicle sales increased by 7.89% in April-March 2018 and the overall automobile exports grew by 16.12% in April-March 2018.In 2016-2017 a total of 25,000 electric vehicles were sold in India and out of this 8% are four wheelers. The current share of electric vehicles in India is less than 1% and it is destined to increase by 5% in the coming years due to government regulations and consumer awareness. Sales of electric two-wheelers are estimated to have crossed 55,000 vehicles in 2017-18. The automobile industry accounts for 7.1% of India’s Gross Domestic Product (GDP) and the Automotive Mission Plan 2016-2026 of the Government of India aims to raise this to 12% The Indian automotive industry (including component manufacturing) is expected to grow at a compounded annual growth rate of 5.9% and reach INR16.16-18.18 trillion (US$251.4-282.8 billion) by 2026, thereby becoming the fastest growing industry in the country. The Indian automobile market is ruled by two wheelers, which account for 75% of the total number of vehicles sold in the country.
Research Objectives Following are the objectives of the study: 1. To find out the key drivers of consumer acceptance of EVs. 2. To understand the role of government in promotion of EVs.

National Conference on Emerging Technologies for Sustainable Engineering and Management Organized by Sri Muthukumaran Institute of Technology
Special Issue IJRAR- International Journal of Research and Analytical Reviews 65
Research Methodology This study is using the descriptive research design to understand the consumer behavior followed in the EV industry in India. Secondary data collection method is used for this study. The data has been collected through the articles published inindustry associations, annual reports, new articles, research reports and manufacturer portals. Electric Vehicle types Primarily there are three types of EVs in the industry. They have their own set of features and characteristics and needs for their customers. All three types of EV are successful in their own way and hence the entire EV concept is generalized in the three categories.
1. Hybrid Electric Vehicle (HEV) A hybrid uses the combined efforts of both a gasoline engine and a battery-powered electric motor to drive the vehicle. The work of driving the vehicle is shared between the two propulsion sources in the best way possible at any given time. Popular examples from across the globe: Toyota Prius, Toyota Camry, Kia Optima Hybrid, Ford Fusion Hybrid, Kia Niro, Hyundai Ioniq HEV
2. Battery Electric Vehicle (BEV) The EV has no gasoline engine. There’s no fuel tank, no exhaust pipe, and no engine oil to change. These machines are at the extreme end of vehicle electrification: unlike all other examples here, they use a battery-powered electric motor drive system to drive the vehicle, 100 percent of the time. Popular examples from across the globe: Mahindra E20, Mahindra eVerito, Hyundai Ioniq EV, Tesla Model S, Tesla Model X, Chevrolet Bolt, Nissan Leaf, Volkswagen e-Golf, BMW i3
3. Plug-in Hybrid Electric Vehicle(PHEV) The PHEV is a unique vehicle that sits somewhere between a hybrid and a full EV. The PHEV works like a regular hybrid, but with a major alteration to its battery. Compared to a regular hybrid, the PHEV battery has a much higher capacity – so high, in fact, that a full battery charge cannot be achieved solely via the on-board generator and requires plugging into an electrical outlet or charging station. Examples: Chevrolet Volt, Hyundai Ioniq PHEV, Toyota Prius Prime, Chrysler Pacifica PHEV, BMW i8, Ford C-Max Energi, Porsche 918 Spyder. Some of the contemporary trends followed in the EV industry are discussed below
1. Focus on small and public vehicles to make initial impact
While encouraging the sale of private EVs, India’s focus, at least in the first few years, should be on
small, public and rural transportation. It is possible for India to have a unique impact and scale early with two-wheelers and three-wheelers, including three-wheeler goods vehicles. Special attention is needed to get these vehicles to become economically viable.
2. Last mile connectivity In India the major public transportation method is either the bus or train but there a still several towns and villages which do not have either of these and the primary public transportation is fossil fuel powered auto rickshaws. Conversion of these auto rickshaws into battery power will play a key role in providing clean transportation.
3. Cost effective mild hybrid technology for the mass market
Cost is the major criteria for consumers when buying a passenger car and manufacturers such as Mahindra with their ‘Micro Hybrid’ and Maruti with their ‘SHVS’ technology have cleverly designed and integrated this mild hybrid technology in their products which saves fuel during idle conditions. Low cost and effectiveness of the system has allowed manufacturers to adopt in their mass market products. The key features of these systems are idle start stop and brake energy regeneration. Mahindra and Maruti are marketing their mild hybrid system aggressively in the market and there by creating awareness among the masses.
4. Stricter emission norms for the future The current BSIV automobile emission norms set by the Central Pollution Control Board is said to be advanced directly to BSIV by the year 2020 and skipping the adaptation of BSV. This advancement puts a major burden on automobile manufacturers since it requires a major overhaul of existing technology and design in core components of the vehicle. This decision by the government plays a key role in the adaptation of green technology and practices in the industry and will force manufacturers to explore greener options. Ban of diesel passenger vehicles more than 2000cc and the odd-even rule deployed by the Delhi government is a wakeup sign for the manufacturers and consumers in vehicle design and vehicle ownership respectively.
5. Zero Emission The Indian automotive industry is set for a major revision with new safety policy, emission regulations and electric cars. The government has proposed an ambitions target of having all electric fleet by 2030 to curb pollution. Though this target may not be achieved, this have set the ball rolling among automobile manufacturers to spear head their prowess into electric car

UGC Approved: 43602 e ISSN 2348 –1269, Print ISSN 2349-5138 http://ijrar.com/ NCETSEM-19
66 IJRAR- International Journal of Research and Analytical Reviews Special Issue
technology. All major manufacturers have announced that their focus is towards electric cars and they also agree that future of automobiles in India is going to be electric. To support the manufacturers and buyers, the government has plans to provide green plates, free parking for three years and toll waiver.
6. Incentive Scheme The FAME [Faster Adoption and Manufacturing of (Hybrid &) Electric Vehicles in India] India Scheme is aimed at incentivising all vehicle segments i.e. 2 Wheeler, 3 Wheeler Auto, Passenger 4 Wheeler Vehicle, Light Commercial Vehicles and Buses. The scheme covers Hybrid & Electric technologies like Mild Hybrid, Strong Hybrid, Plug in Hybrid & Battery Electric Vehicles. India and Global EV demand projections for 2020 in millions
Vehicle segment /
Country
2W
4W range
Bus Total
Range
India EV projection
s 2020
Nos
4.8 1.6 1.7 0.00
2 5 7
Penetration of EV India
% 15 17.
8 18.9
- 14-16
Total Vehicle
sales
Nos
32 9 9 - 43
World EV projection
s 2020
Nos
27 5 13 0.12
32.12
40.12
Global penetratio
n of EV % 35.5 7 19 20
Total vehicles
2020
Nos
76 70 70 0.57
India share % 17.8 12.8-30
The key findings from potential focus groups in India discussed below gives us some alarming findings. The below findings are from a wide group of 1800 respondents of both two and four wheelers across 16 major cities in India.
1. There is a very limited knowledge about EV among potential consumer.
2. Potential consumers are willing to pay a premium of 10-20% for HEVs over the regular IC (internal combustion) vehicles justified by their lower operating costs. However, the premium should be recoverable in 2-3 years.
3. Highest preference has been expressed for HEVs, followed by PHEVs and BEVs – due to lack of charging requirement,
higher range, lack of battery replacement, availability of an IC engine as a backup to the electric engine etc.
4. Consumers are inclined towards PHEVs and BEVs, if there is acceptable range and necessary charging infrastructure is available.
5. Charging aspects are more important and most respondentspreferred public charging infrastructure and lower charging time.
6. Environmental benefits ofEVs did not appear to be an important buying criterion for consumers.
Key growth drivers in the EV industry: 1. The increase in millennial population
and rise in income will drive the industry into the next few decades.
2. Availability of EV incentive options will aid the market growth.
3. Clear vision of Indian government to make India an auto manufacturing hub and Initiatives like ‘Make in India’, ‘Automotive Mission Plan 2026’, and NEMMP 2020 to give a huge boost to the sector.
Vehicle segment wise matrix of key consumer purchase criteria 1 is the highest priority
Segment/Criteria
4W
2W
LCV
3W
Bus
Spares 4 Range 2 Running cost 3 3 3 Charging time 5 5 Top speed 4 4 5 4 Pick up 3 3 1 5 2 Battery cost 2 2 4 Maintenance cost 1 1 2 1 1
Challenges for EV industry 1. High initial cost of EV. 2. Low motor performance. 3. Lack of charging station infrastructure. 4. Low awarenessamong potential
consumer.
Conclusion India has over 170 million two-wheelers.
If we assume that each of these vehicles uses a little more than half a litre of petrol per day or about 200 litres per year, the total amount of petrol used by such vehicles is about 34 billion litres. At ₹70 per litre, this would cost about ₹2.4 lakh crores. Even if we assume that 50% of this is

National Conference on Emerging Technologies for Sustainable Engineering and Management Organized by Sri Muthukumaran Institute of Technology
Special Issue IJRAR- International Journal of Research and Analytical Reviews 67
the cost of imported crude (as tax and other may be 50%), one may save ₹1.2 lakh crores worth of imported oil. Electric Vehicles are all set to conquer the roads in India and the environmental and demographic challenges factors only catalyzes this process. The benefits of EVs are massive not just in providing a clean environment but also a significant monetary benefit for the user. The awareness and benefits of EVs are yet to reach the potential consumer in an effective way. There is still a sizeable group of consumers unaware of the available EVs in the market. The initial cost and infrastructure for EVs are the real short comings but it is the responsibility of the government to cater in these areas at least in the nascent stage of the EV industry. The shift towards EVs is certain as seen in the developed nations across the globe and it only a matter mass market approach and government initiatives that would kick start the revolution.
References SIAM- Society of Indian Automobile
Manufacturers
SMEV: Society of Manufacturers of Electric Vehicles
Ministry of Commerce and Industry India Brand Equity Foundation CII: Confederation of Indian Industry ARAI: Automotive Research Association of
India
Ministry of Environment & Forests and Climate Change
Central Pollution Control Board National Automotive Board
Department of Heavy Industry

UGC Approved: 43602 e ISSN 2348 –1269, Print ISSN 2349-5138 http://ijrar.com/ NCETSEM-19
68 IJRAR- International Journal of Research and Analytical Reviews Special Issue
Emotional Intelligence: A Catalyst for Inspirational Entrepreneurship in the globalized Business Environment
1Mr.M.Prakash & 2 Dr.S.Muralidhar, 1 Assistant Professor, 2 Assistant Professor
1 Department of Management Studies 2 School of Commerce & Management Studies 1 Knowledge Business School,Salem. 2 Jain University, Bangalore
ABSTRACT: This paper contributes scientific research based models of emotional intelligence and explored the role of entrepreneurship in the globalized business environment. This research supporting the value of emotional and intelligence for entrepreneurs to predict and avoid issues in their business. To realize the high goals and prospects of the trade in the 21st century, the intentional inclusion and development of emotional intelligence skills have becomes very vital.
Keywords: Entrepreneurship, Emotional Intelligence, Business
Introduction: Many companies are today seeing ways
to boost up their competitive advantage in an increasingly hostile environment. With the ambiguity of the economic environment coupled with increased worldwide competition, businesses need controllable solutions that will positively influence the bottom-line. One solution which has been proven to pay substantial dividends, but which has been traditionally been overlooked in many organizations, is the development of Emotional Intelligence in entrepreneurship.
Emotional intelligence by Salovey and Mayer (1990) defined a model of emotional intelligence, which is considered as the first model in this context. According to them “emotional intelligence is a subdivision of communalintellect, that helps to perceive own and other’s excitements and to standardize them for problem-solving”. The researchers also recommended that emotional intelligence can be educated and reinforced, while others entitlement it is an innate characteristic.
The understood of emotional intelligence is propagated after publication of psychologist and New York Times science writer wrote a book on Emotional Intelligence: Why It Can Matter More Than IQ. (Daniel Goleman, 1995)
Review of Literature Emotional Intelligence (EQ) has emerged
as a key differentiator in the global business environment. Research has shown that EQ skills result in improved leadership in business.There
are a multiplicity of readings done in the part of Emotional Intelligence.
Entrepreneurship – Strong Predictor of Workplace Performance
Bradberry (2015), a key author on EI, stated, “Decades of research now point to emotional intelligence as the critical factor that sets star performers apart from the rest of the pack” (para. 1). At his company, Talent Smart, researchers establish that EI is the strongest forecaster of workplace performance. This is essential for both entrepreneurs and intrapreneurs. The noblenews about EI is that this can be educated or enhanced on. Prior studies have indicated that EI may forecastprofession success. Information available has shown that EI can predict job performance and job satisfaction. It was postulated that EI may also affect entrepreneurship, in terms of commercialactions and accomplishment. The results of this study exposed that distinctmodifications in entrepreneurship may only be moderatelyrecognized to EI (Ahmetoglu, Leutner, &Chamon-Preuzic, 2011) Entrepreneurs continually succeed in their efforts in the workplace. Australian entrepreneurs were scrutinized in terms of the EI skills. In-depth structured interviews were used. Results of the study showed that participants exhibited higher EQ levels than the nor
Entrepreneurship – Strong Social Interaction McLaughlin (2012) wrote her
dissertation on An emotional business: The character of emotional intelligence in
National Conference on Emerging Technologies for Sustainable Engineering and Management Organized by Sri Muthukumaran Institute of Technology
Special Issue IJRAR- International Journal of Research and Analytical Reviews 69
entrepreneurial success. Specifically the results dealt with the social interactions related to entrepreneurial situations such as “negotiation, obtaining and organizing resources, identifying and exploiting opportunities, managing stress, obtaining and maintaining customers, and providing leadership” (para. Abstract). Awad and Ali (2012) confirmed that a managers’ EI, employee creativity, and organizational atmosphere had a positive direct effect on a person’s entrepreneurial orientation. More interestingly, EI directly affected relationships within the organization, which, in turn, positively affected employee creativity. Encouraging an entrepreneurial orientation within an organization may contribute to an increase in an organization’s success. Ngah, Wahyukaton, Salleh, and Sarmidy (2016) studied the effects EI on entrepreneurs in Malaysia and Indonesia. EI skills are imperative to entrepreneurs because of their necessity to accomplishsocietalrelations with other entities. Such interactions include but not limited to activities such as gaining and maintaining customers, presenting to investors, negotiating, as well as attracting, selecting, and handling employees, suppliers, and partners. Ngah et al. (2016) defined as a set of individual social abilities or skills to discriminate, monitor, and use-self and other’s emotions to regulate one’s thinking and action. The things EI are essential to entrepreneurs because of their need to accomplish social interactions with other individuals. Such interactions include but not limited to activities such as gaining and maintaining customers, presenting to investors, negotiating, as well as attracting, selecting, and handling employees, suppliers, and partners. Ngah et al. (2016) asserted that EI is well known to be a combination of competencies. Those competencies enable individual’s ability to monitor and manage his or her emotions, to properly determine the emotional state of others and to influence opinions. Ngah et al. (2016) found that being aware and understanding their emotions helps entrepreneurs channel positive or negative effects into appropriately identifying and solving problems relevant to their lives
Methodology This study aims in comparing different
models of Emotional Intelligence by studying the various variables of Emotional Intelligence which catalyst for inspirational entrepreneurship in the global business environement.
Emotional Intelligence Models
DrGoleman asserted that “The criteria for success at work are changing. We are being judged by a new yardstick: not just by how smart we are, or by our training and expertise, but also by how well handle ourselves and each other. This benchmark is graduallypragmatic in indicating who will be rented and who will not, who will be let go and who retained, who past over and who promoted...”Goleman’s definition of emotional intelligence proposes four broad domains of EQ which consist of 19 competencies: Self-Awareness
• Emotional self-awareness: Reading one’s own feelings and diagnosing their impact
• Accurate self-assessment; knowing one’s strengths and limits
• Self-confidence; a thoroughintellect of one’s self-confidence and abilities
Self-Management • Emotional self-control: Keeping upsetting
emotions and instincts under control • Transparency: Displaying honesty and
integrity; trustworthiness • Adaptability: Elasticity in adjusting to
fluctuating situations or overwhelmingcomplications
• Achievement: The ambition to expand performance to meet inner ethics of superiority
• Initiative: Readiness to act and seize opportunities
• Optimism: Seeing the upside in events Social Awareness
• Empathy: Detecting others’ emotions, accepting their viewpoint, and taking active attentionin their concerns
• Organizational awareness: Construing the flows, decision networks, and policies at the administrative level
• Service: Identifying and meeting follower, client, or customer needs Rapport Management
• Inspirational leadership: Controlling and encouraging with a persuasive vision
• Influence: Exercising a range of strategies for influence
• Developing others: Strengthening others’ capabilities through criticism and supervision
• Change catalyst: Starting, handling, and leading in a new path
• Conflict management: Resolving disagreements
• Building bonds: Educating and upholding a web of associations
UGC Approved: 43602 e ISSN 2348 –1269, Print ISSN 2349-5138 http://ijrar.com/ NCETSEM-19
70 IJRAR- International Journal of Research and Analytical Reviews Special Issue
• Teamwork and collaboration: Cooperation and team building There is universal agreement that the
features that Goleman and his classmates have recognized are indeed developing as a key element of workplace success. This is as the approach that most administrations work has transformed in the last 20 years. There are now fewer levels of management than there were and management styles tend to be less autocratic. In accumulation, the changeen route for more information based, team working and customer attentive jobs means that persons generally have more independence, even at fairly low levels within organizations.
Whereas, the other model by Boyle and Humphrey gathered data from 43 studies and performed a 3-part test to classify their findings. These sequence of tests, known as EI streams, dignified EI and its effect on job performance. The first stream was a four-branch ability test which categorizes that EI into different branches. They were observation and appearance of feeling, emotional expedition of thinking, understanding and analyzing emotions and employing emotional knowledge. The second stream used a self-report measure to capture the emotions that entrepreneurs were required for the business. The final stream used to measure the data was a traditional test to measure social skills for entrepreneurs.
The EI streams restrained the main perceptionsahead EI. Boyle and Humphrey’s main suggestion in this study was to verify that all three EI streams are connected with job performance. Each section of the test confirmed Boyle and Humphrey’s main hypothesis. “The three streams of EI investigation, ability measures, self- and peer-report measures, and mixed models, all forecast job performance correspondingly.”
The term emotional intelligence (EI), first introduced in the 1990s by Peter Salovey of Yale University and John (Jack) Mayer of the University of New Hampshire, mentions to how intellectual about feeling and assimilatingsentiment into cognitive processes both facilitate and enhance thinking. Alike to conceptualizations of intelligence, EI involves the volume to occupy in intellectual reasoning, but about emotions in particular. According to the Salovey and Mayer model, there are distinctvariances in EI, such that individuals who are more accomplished at observing, consuming, appreciative, and handling emotions are more successful at accomplishing many learning and
social responsibilities than those who are not as much of skilled.
In the 1980s, the idea of cleverness was lengthening to include an arrangement of psychologicalcapabilities. Most notably, Howard Gardner, who was primarily interested in helping educators to appreciate students with diverse learning styles and potentials, advised practitioners and scientists to place a greater emphasis on the search for numerousintellects such as personalintellect. At the same time, psychologists and cognitive scientists began revisiting the Stoic idea that emotions made humans irrational and self-absorbing; specifically, they considered the alternative viewpointsthat emotions could enhance cognitive tasks and social interactions.
Inclined by and vigorous participants in these activities, psychologists Salovey and Mayer began assimilating the scientific indication showing that emotions enable reasoning into their theory of EI. Intelligence and feeling, prior to their hypothesizing, usuallyrecognizeddifferent areas of investigation. Torecognize the significance of EI, it is important to hold the dangerous role emotions play in social connections and human conduct. Research conducted by Charles Darwin in the late 1800s, Silvan Tomkins in the 1960s, Paul Ekman from the 1970s into the early 2000s, and many others shows that the understanding and appearance of emotion interconnectssignificantevidence about one’s relationships. For example, irritation signifies that somebody or somewhat is obstructive one’s goal, and anxietyindicates that someone or something in the surroundings poses a risk. There is systematicindication that these sentimentindicators are universal that is, broadly unwritten by beliefs around the biosphere. Emotions tooseem to be important to intelligent and judgmentcreation. Effort by neuroscientist Antonio Damasiovalidates that the capability to participate emotional evidence with balanced decision-making and other cognitive processes is necessary for people to accomplish their regularsurvives. Individuals unable to attend to, process, or experience emotion due to damage to specific brain areas (i.e., prefrontal lobe area) make decisions that put themselves at risk.Source : Four branch model of Emotional Intelligence, (Mayer and Salovey’s (1997) The ability model of EI
The Ability Model of EI proposed by Salovey and Mayer includes four relatively distinct emotion-related abilities: Perceiving Emotion.

National Conference on Emerging Technologies for Sustainable Engineering and Management Organized by Sri Muthukumaran Institute of Technology
Special Issue IJRAR- International Journal of Research and Analytical Reviews 71
Perceiving emotion involves identifying and differentiating emotions in one’s physical states (including bodily expressions), feelings, and thoughts, and in the behavioral expressions of others (such as facial expressions, body movements, voice), as well as in the cues expressed in art, music, and other objects. Persons skilled in perceiving emotion are adept at differentiating between the range of emotion expressions (frustration, anger, and rage) in themselves and in others. Using Emotion.
Consuming emotion to enable thought mentions to the use of emotion both to emphasiskindness and to think more sensibly, reasonably, and artistically. For example, positive emotions such as pleasure and laughter are furthervaluable in motivatinginspired thought while slightly harmful moods such as unhappiness are more beneficial to engaging in inferential reasoning tasks. Individualscapable at using emotions are healthiergifted to generate exact emotional conditions to carry out a task efficiently. Understanding Emotion.
Accepting emotion is the capability to brand emotions precisely with linguistic and to know the reasons and significances of emotions, comprising how emotions conglomerate, develop, and move from one to the other (e.g., in certaincircumstances, anxiety and annoyanceconglomerate to generatepossessiveness). Persons skilled in this area have a rich feelings vocabulary and are knowledgeable about what causes various emotions and what behaviors or thoughts may result from their occurrence. Managing Emotion.
Handling emotion is the talent to normalizetempers and sentiments and containsappearing and continuing open to enjoyable and disagreeable feelings as well as engaging in or cracking from an emotion depending on its professed utility in a particular situation. To succeed emotions excellently, publics must reap the other skill areas of EI: They must be able to preciselydisplay, differentiate, and brand their own and others’ feelings, believe that they can recover or adjust these feelings, measure the efficiency of these approaches, and payapproaches that will modify these feelings. By successfully managing emotions, individuals can realize situational objectives, express communallyfitting emotions, and perform in socially acceptable ways.
EI theory hypothesizes that these four abilities have developmental trajectories. There are numerousassistances within each field that evolve from more basic to more innovative. For example, in the area of observing emotion, basic aids involve exactlyidentifying an emotional expression in others and more advance skills entail expressing emotions in adaptive ways and discerning between truthful and untruthful emotional expressions in others. EI theory also specifies that the four abilities are hierarchical in structure such that perceiving emotion is at the foundation, followed by using emotion and understanding emotion, with managing emotion at the top of the hierarchy. Emotional Intelligence for Business Leaders
Kathleen Cavallo, from Corporate Consulting Group and Dottie Brienza, officially of Johnson & Johnson Consumer Companies, studied EI in Johnson & Johnson Consumer & Personal Care Group. The study exposed a strong association between superior Performingleaders and their EI abilities. Swiss dancer-in-residence Monique Pillet of Ecnad Project Ltd offered an instance. “In our work, physical fatigue, further to the creative process of evolving a dance presentation, can effect in tension build-up between team members. In those situations, emotional sensitivity helps in retaining self-control and understanding [the] emotional states of my colleagues.” With a high EI, a good leader is able to work through the rough spots of a creative process.Emphasizing the reputation of EI, Singapore based Hitachi Construction Machinery’s HR & Administration Manager Chong TeckSiong said, “In our [Japanese] company, earlier a consistentregular meeting takes place, different managers with new schedules outside the normal ones need to pursue approval from the senior management before it can be listed at the meeting appropriate for discussion or sharing.” He explained, “The genuine meeting will expected be anofficial procedure to resolve the problem with disturbed parties who are already conscious of the final effect of the meeting. Building EI in organizations
Research by Cary Cherniss et al has shown that EI can be developed. However, the training and development practices used in most of the organizations are not geared for this. Intellectual learning includes fitting new data into prevailingbackgrounds of understanding.
Emotional knowledgeincludes that and more-it requires an appointment of our emotional conducts. Alteringbehaviors such as learning to approach people completely instead
UGC Approved: 43602 e ISSN 2348 –1269, Print ISSN 2349-5138 http://ijrar.com/ NCETSEM-19
72 IJRAR- International Journal of Research and Analytical Reviews Special Issue
of evading them, to listen better, or to give feedback skilfully, is a more challenging task than simply adding new information. Motivational factors also make sensitive learning more tough and compound than cognitive learning. It frequentlycomprises ways of thinking and acting that are more dominant to a person’s individuality. The view of demanding to develop superior emotional capability is hard for us to take. Thus, it is much more likely to generate confrontation to change. In emotional education, individual must first unlearn old traditions and then progressfresh ones. For the learner, this usually means a long and sometimes difficult process involving much practice, which is outside the scope of typical one-day training workshops. A dedicated and organizedmethod is needed to build passionately competent organizations. A strategic cycle of assessment > learning > practice > feedback over time will enable organizational members to build competencies that can help develop high performing leaders for the organization. Effective emotional learning
A respectablefoundation of supervision for development of EI comes from investigation that scrutinizes emotional change processes. These strategiesrecommend that there are four elementarystages in the training course. Preparation for change:
This happens even before the individual initiates formal exercise. This stage, which is critical for operative emotional learning, involves groundwork and motivation for change at both the administrative and individual levels. Training:
The additional phase includes the procedures that help people change the way in which they sight the world and deal with its emotional anxieties. In emotional wisdom, motivation continues to be asignificant issue through the training phase, and one of the most important factors manipulating motivation is the relationship between the teacher and the beginner. Transfer and maintenance:
This phase is particularly challenging in emotional learning. When learners return to their natural environments, there are likely to be many cues that support the old ways. Additional, there may be importantobstacles to using the new emotional proficiencies. Elegant training programs cannot be effective if larger organizational system is not supportive of training goals.
Conclusion: The results shed light on certain areas
that need to be taken into consideration when aiming to develop and enhancing entrepreneurial activities. This study clearly examined one’s successful organization and the other’s derailment is emotional intelligence. In each situation, emotional arousal offers two possible outcomes: Success = Being aware of your emotions and managing them so your behaviors are intelligently and proactively driven, resulting in intentional and successful outcomes. Derailment = Losing control of your emotions so your behaviors are impulsively and reactively driven, resulting in unintended and potentially costly outcomes.
References: 1. AMEX Program.(2003). Emotional
Competence Training Program - American Express.Consortium for Research on Emotional Intelligence in Organisations Retrieved November 17, 2003 from www.eiconsortium.org.
2. Anastasi, A. (1982). Psychological Testing (5Th Edition). New York: MacMillan Publishing Co., Inc. Andrews, D.A. &Kiessling, J.J. (1980).Program Structure and Effective Correctional Practices: A Summary of CaVICResearch.In P. Gendreau& R.R. Ross (Ed’s) Effective Correctional Treatment. Toronto, ON: Butterworth.
3. Bar-On, R. (1988). The Development of an Operational Concept of Psychological Well-Being.Unpublished doctoral dissertation, Rhodes University, South Africa. Bar-On, R. (2000). Emotional and social intelligence: Insights from the Emotion Quotient Inventory. In R. Bar-On & J. Parker (Ed’s.), The Handbook of Emotional Intelligence. San Francisco: Jossey-Bass.
4. Bass, B.M. &Avolio, B.J. (1994). Improving Organizational Effectiveness Through Transformational Leadership. Thousand Oaks, CA: Sage.
5. Bechara, A., Tranel, D., &Damasio, A.R. (2000).Poor judgment in spite of high intellect.In R. Bar-On & J. Parker (Ed’s.), The Handbook of Emotional Intelligence. San Francisco: Jossey-Bass.
6. Becker, T. (2003).Is emotional intelligence a viable concept?Academy of Management Review, April, 192-195. Boyatzis, R.E. &Burckle, M. (1999). Psychometric Properties of the ECI: Technical Note. Boston: The Hay/McBer Group. Boyatzis, R.E. (1982).
7. Brackett, M.A. & Mayer, J.D. (2003).Convergent, discriminant, and incremental validity of competing measures

National Conference on Emerging Technologies for Sustainable Engineering and Management Organized by Sri Muthukumaran Institute of Technology
Special Issue IJRAR- International Journal of Research and Analytical Reviews 73
of emotional intelligence.Personality and Social Psychology Bulletin, 29 (9), 1147-1158.
8. Brackett, M.A., Mayer, J.D., & Warner, R.M. (in press). Emotional intelligence and the prediction of everyday behaviour.Personality and Individual Differences.
9. Bradberry, T. (2002).Emotional Intelligence and leader job performance.Unpublished Manuscript.
10. Bradberry, T., Greaves, J., Emmerling, R., Sanders, Q., Stamm, S., Su, L.D., & West, A. (2003).Emotional Intelligence Appraisal Technical Manual.TalentSmart Inc.
11. Cantor, N. &Kihlstrom, J.F. (1987).Personality and Social Intelligence.Englewood Cliffs, NJ: Prentice-Hall.
12. Cherniss, C. & Adler, M. (2000).Promoting Emotional Intelligence in Organisations. Alexandria, Virginia: ASTD.
13. Cherniss, C. &Goleman, D. (1998, October 7). Bringing Emotional Intelligence to the Workplace.Retrieved September 9, 2003 from www.eiconsortium.org.
14. Cherniss, C. (2000). Social and emotional competence in the workplace. In R. Bar-On & J. Parker (Ed’s.),The Handbook of Emotional Intelligence. San Francisco: Jossey-Bass.
15. Ciarrochi, J., Caputi, P., & Mayer, J.D. (2003).The distinctiveness and utility of a measure of trait emotional awareness.Personality and Individual Differences, 34, 1477-1490.
16. Ciarrochi, J.V., Chan, A.Y.C., &Caputi, P. (2000).A critical evaluation of the emotional intelligence concept.Personality and Individual Differences, 28, 539-561.
UGC Approved: 43602 e ISSN 2348 –1269, Print ISSN 2349-5138 http://ijrar.com/ NCETSEM-19
74 IJRAR- International Journal of Research and Analytical Reviews Special Issue
IMPACT OF SELF HELP GROUPS IN ECONOMIC EMPOWERMENT OF RURAL WOMEN
Ms.P.Shalini1 & Mrs.Deepa Rekha Suresh2 & Ms.Veena.V3
1Assistant Professor, MBA-Dept, S.A Engineering College. 1Research Scholar –Bharathiar University.
2Assistant Professor, MBA-Dept, S.A Engineering College, 2Research Scholar –SRM University,
3MBA-I year , S.A Engineering College
ABSTRACT: Rural women today have been suffering a lot due to the feeling of helplessness and lack of decision-making capabilities in financial matters. Self help groups (SHGs) are the most recent development for them which could enable them to come forward and make them self dependent and self employed. The main objective of this study is to study the effectiveness of SHGs in empowering women as well as the interest of rural women towards SHGs. Chi-square test has used to test the significance of the result and it was found that the women associated with SHGs have disclosed that have economically benefited them across the time of association with them but there is significant difference in the perception on the effect that SHGs had on various factors and socially and politically benefited by SHG across the time of association with SHG.
Keywords: Self help group, self-dependent, empowerment, Loan, poverty, growth.
INTRODUCTION Self Help Groups (SHGs) are small voluntary associations of poor people, preferably from the same socio-economic background who come together for the purpose of solving their common problems through self help and mutual help .Self help groups have become a good source to empower woman. It plays a vital role in the rural development and groups reduces the emphasis of the unorganized sector and develops individual skills of the community and members. At present SHGs are growing at rapid pace and helping woman to grow in the society which could improve their socio-economic conditions. The SHG promotes small savings among its members. The savings are kept with a bank. This common fund is in the name of the SHG. Usually, the number of members in one SHG does not exceed twenty. SHGs are helping in woman empowerment to a great extent, By this woman can become self dependent by saving small amount of money on monthly basis and once their group becomes able to lend money and then by taking loan also as per their requirement which could make them start their small business and make them employable. For taking loan they have to give a prior notice in the meeting so that they could get the loan at the right time. They fix small installment for repayment of the loan which is very convenient for them to repay their borrowings with principal amount as well as interest. Every month all the women come together and hold meetings and make their monthly payment. SHGs brings confidence among woman to face the problem of poverty and develop their individual skills also as well as increases their living standard & social relation which could lead to enhanced their leadership qualities and their participation in social activities and they could give a better social security also.
Review of literature (Kumar, 2009) reviewed the scope and limitations of self-help groups in improving women'shealth and empowerment focusing on the empirical work undertaken in one of the Indian States. They explored the extent to which SHGs could be involved in attaining better health for women and children. (Tanya Jakimow, 2006)analysed the ‘normative’ model of SHG programmes and its actual application and showed that while SHG programmes had the potential to empower women was often not realized through the persistence of ‘top-down’ approaches in implementation. SHG programmes were further limited in their ability to transform social relations due to their apparent insistence that the marginalized were the only legitimate actors in their own empowerment. Rather than argue for the discontinuation of SHG programmes in India, their potential to empower women could be increased through a ‘bottom-up’ orientation in implementation, while recognizing that in and of themselves SHG programmes could not reduce all the

National Conference on Emerging Technologies for Sustainable Engineering and Management Organized by Sri Muthukumaran Institute of Technology
Special Issue IJRAR- International Journal of Research and Analytical Reviews 75
constraints preventing the pursuit of interests. (Prof. Dr J. Venkatesh, 2010) stated that Women empowerment was a process in which women got a greater share of control over resources - material, human and intellectual like knowledge, information, ideas and financial resources like money - and access to money and control over decision-making in the home, community, society and nation, and gain empowerment. (Tracey L. Moyle, 2006) studied the empowerment of women by addressing two dimensions: economic empowerment and personal empowerment. One hundred women, aged between 16 and 65 years, participated in self-help groups from two rural Indian villages in North-West India took part in the study. Both quantitative and qualitative data were gathered through self-report surveys and interviews, with the analysis yielding contradictory findings. The quantitative data found that working women reported moderate to high levels on collective efficacy, proactive attitude, self-esteem and self-efficacy with no significant reporting of psychological distress. In contrast, examination of the qualitative data revealed positive appraisals of self-worth, purpose and independence and negative appraisals of pressure, challenge and stress. The implications of these findings and the importance of this study were also discussed.The SHG approach, apart from generating incremental income, helped them to upgrade the economic and social status along with a sense of recognition contributing to the process of empowerment. (Vijayalakshmi, Gowda, Jamuna,Ray, &Sajjan, 2012) concluded that SHG were improving the standard of living of all familieswho came in the project area. Appropriate strategies for empowerment of SHG women were addressed through organizing appropriate trainings both on and off-campus, including higher level trainings, follow-up activities, providing relevant leaflets and folders, exposures besides recognizing and encouraging women to come forward and take up processing and of linger millet products value addition and income generating activities. The SHG project has made a successful impact in improving the livelihood security for rural women.(Kusakabe, 2010) concluded that being an SHG member was useful for gaining employment that leads to better recognition in the family and society. However, employment opportunities and organizational experiences mean that the benefits were not equally shared among all the members.
Research gap / Gap Analysis - From the review of literature it is found that studies were doneon woman education and for self employment and empowering woman by increasing their standard of living and encouraging woman to come forward. This study is done for knowing the positive and negative impact of SHG in rural areas and see how it has helped in reduce poverty and made the members feel self-dependent.
Objectives of the study To study the performance of SHG groups in rural area To study the positive and negative impact on members of SHGs after joining them To study the interest of rural woman towards SHGs To study the effectiveness of SHGs in empowering women
Hypothesis framed for the study H01 There is no significant difference in the perception on the effect that SHG have
on various factors across the time of association with them
HO2 There is no significant difference in the perception that SHG have economically benefited across the time of association with SHG
HO3 There is no significant difference in the perception that SHG have socially
benefited across the time of association with SHG
HO4 There is no significant difference in the perception that SHG have politically
benefited across the time of association with SHG
Research methodology The sample of the study included members of various SHGs in the rural area of Thiruvallur district. A wel l structured questionnaire was framed and pretested for its relevance. Once the pilot-survey was completed and necessary correction incorporated, the questionnaire was distributed to about 250 members across various SHGs in Thiruvallur district (rural). In a number of cases, the questionnaire was explained in the local language and the responses were collected. Care was taken to see that not more than 10
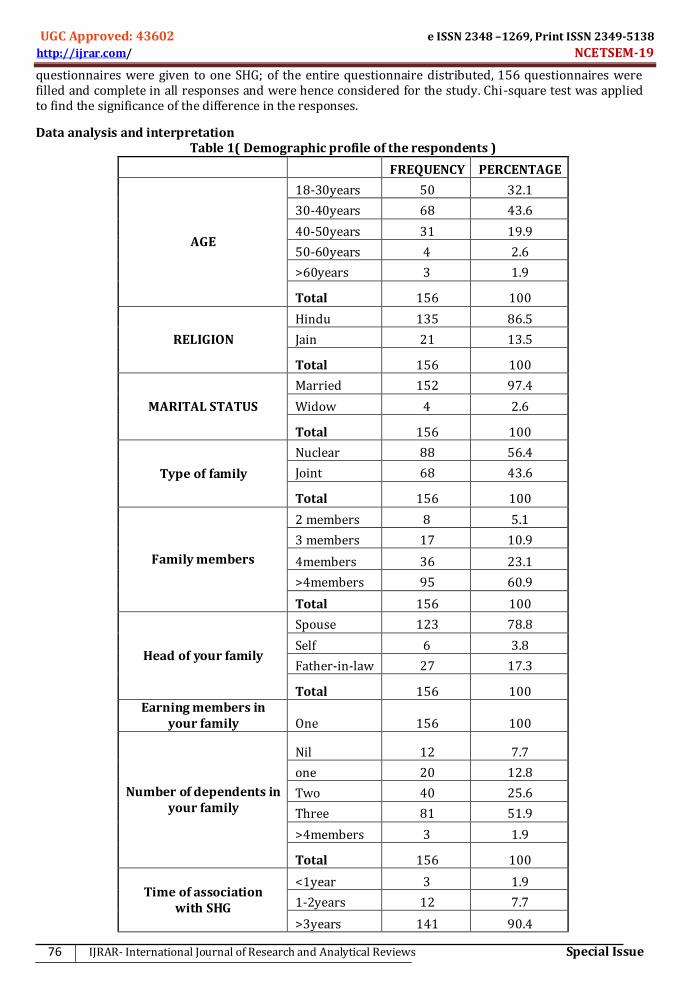
UGC Approved: 43602 e ISSN 2348 –1269, Print ISSN 2349-5138 http://ijrar.com/ NCETSEM-19
76 IJRAR- International Journal of Research and Analytical Reviews Special Issue
questionnaires were given to one SHG; of the entire questionnaire distributed, 156 questionnaires were filled and complete in all responses and were hence considered for the study. Chi-square test was applied to find the significance of the difference in the responses.
Data analysis and interpretation Table 1( Demographic profile of the respondents )
FREQUENCY PERCENTAGE
AGE
18-30years 50 32.1
30-40years 68 43.6
40-50years 31 19.9
50-60years 4 2.6
>60years 3 1.9
Total 156 100
RELIGION
Hindu 135 86.5
Jain 21 13.5
Total 156 100
MARITAL STATUS
Married 152 97.4
Widow 4 2.6
Total 156 100
Type of family
Nuclear 88 56.4
Joint 68 43.6
Total 156 100
Family members
2 members 8 5.1
3 members 17 10.9
4members 36 23.1
>4members 95 60.9
Total 156 100
Head of your family
Spouse 123 78.8
Self 6 3.8
Father-in-law 27 17.3
Total 156 100 Earning members in
your family One 156 100
Number of dependents in your family
Nil 12 7.7
one 20 12.8
Two 40 25.6
Three 81 51.9
>4members 3 1.9
Total 156 100
Time of association with SHG
<1year 3 1.9
1-2years 12 7.7
>3years 141 90.4

National Conference on Emerging Technologies for Sustainable Engineering and Management Organized by Sri Muthukumaran Institute of Technology
Special Issue IJRAR- International Journal of Research and Analytical Reviews 77
Total 156 100
Your monthly savings(Rs.)
<Rs100 6 3.8
Rs.100-500 60 38.5
Rs.500-1000 36 23.1
Rs.1000-1500 23 14.7
Rs.1500-2000 16 10.3
Rs.2000-2500 3 1.9
>Rs.2500 9 5.8
No savings 3 1.9
Total 156 100
Your (Rs.)
Rs.5000 152 97.4
Rs 4 2.6
Total 156 100
Interpretation- 97.4% the woman were married, maximum were between the age group of 30-40 years and around 43.6% were members of SHG or the other. Most of them were from nuclear families (56.4%) with the spouse as the head of the family and having 4members. In all the families there was single person who was earning but the dependents were in the ratio of 51.09%. 90.4% of the families were associated with SHGs for more than 3 years. 38.05% families had monthly saving between Rs 100-500. 97.04% of the families were such who had borrowed a sum of Rs 5000-10000.
Table 2
Strongly disagree Disagree Neutral Agree
Strongly agree Total
You feel there is a reduction in poverty after joining SHG
33 16 85 22 156
Do you feel self dependent after
joining SHG 17 18 83 38 156
Increase in the living standard of women
after joining SHG 1 8 56 91 156
Is it easy to repay the principal
amount interest 5 120 31 156
you are the interest 1 3 9 91 52 156
Interpretation- Becoming the member of a SHG had benefited the women members a lot. Mostof them agreed that there was significance reduction in poverty; they feel self- dependent after joining SHGs, there was a significant increase in the standard of living, the women found it easier to repay the principal amount along with the interest after joining SHGs and further the women members were also satisfied with the interest rates charged by the SHGs. Not even a single women disagreed with the benefit that occurred on becoming a member of SHGs
Table-3 Effect of
Increase in monthly income
Increase in monthly savings
Increase in monthly
expenditure
Increase in the living
standard Total
Time of
<1 year 0 3 0 0 3
1-3years 3 8 0 1 12
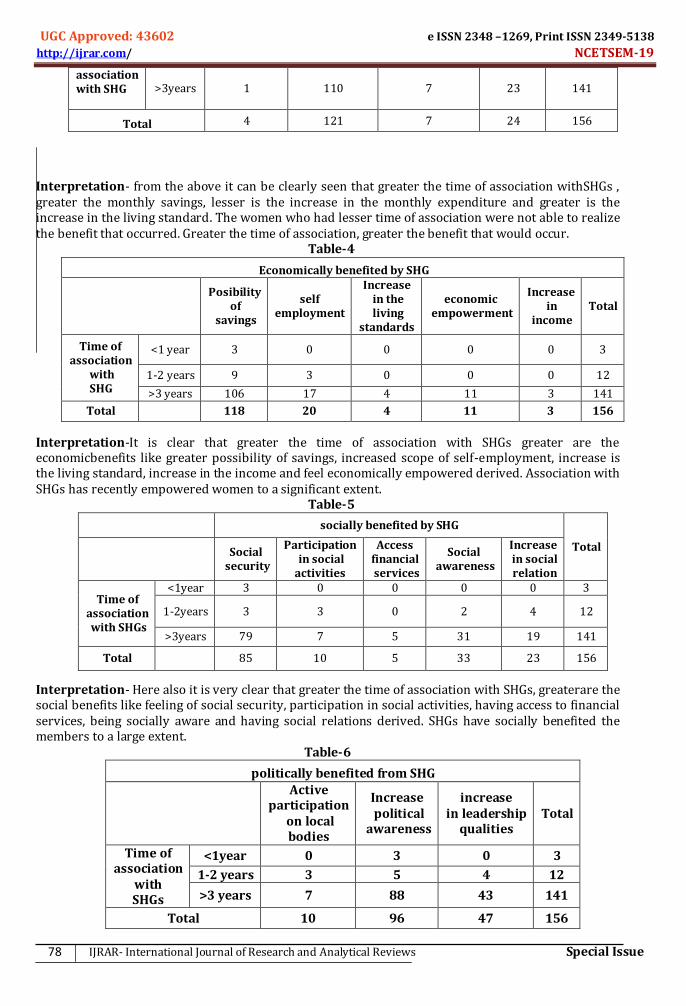
UGC Approved: 43602 e ISSN 2348 –1269, Print ISSN 2349-5138 http://ijrar.com/ NCETSEM-19
78 IJRAR- International Journal of Research and Analytical Reviews Special Issue
association with SHG >3years 1 110 7 23 141
Total 4 121 7 24 156
Interpretation- from the above it can be clearly seen that greater the time of association withSHGs , greater the monthly savings, lesser is the increase in the monthly expenditure and greater is the increase in the living standard. The women who had lesser time of association were not able to realize the benefit that occurred. Greater the time of association, greater the benefit that would occur.
Table-4
Economically benefited by SHG
Posibility of
savings
self employment
Increase in the living
standards
economic empowerment
Increase in
income Total
Time of association
with SHG
<1 year 3 0 0 0 0 3
1-2 years 9 3 0 0 0 12
>3 years 106 17 4 11 3 141
Total 118 20 4 11 3 156
Interpretation-It is clear that greater the time of association with SHGs greater are the economicbenefits like greater possibility of savings, increased scope of self-employment, increase is the living standard, increase in the income and feel economically empowered derived. Association with SHGs has recently empowered women to a significant extent.
Table-5
socially benefited by SHG
Total
Social security
Participation in social activities
Access financial services
Social awareness
Increase in social relation
Time of association with SHGs
<1year 3 0 0 0 0 3
1-2years 3 3 0 2 4 12
>3years 79 7 5 31 19 141
Total 85 10 5 33 23 156
Interpretation- Here also it is very clear that greater the time of association with SHGs, greaterare the social benefits like feeling of social security, participation in social activities, having access to financial services, being socially aware and having social relations derived. SHGs have socially benefited the members to a large extent.
Table-6
politically benefited from SHG
Active participation
on local bodies
Increase political
awareness
increase in leadership
qualities Total
Time of association
with SHGs
<1year 0 3 0 3
1-2 years 3 5 4 12
>3 years 7 88 43 141
Total 10 96 47 156

National Conference on Emerging Technologies for Sustainable Engineering and Management Organized by Sri Muthukumaran Institute of Technology
Special Issue IJRAR- International Journal of Research and Analytical Reviews 79
Interpretation-Association with SHGs has also politically empowered the members by makingthem actively participate in local bodies, increasing their level of political awareness, increasing their leadership qualities. H01 : There is no significant difference in the perception that SHGs have economically , socially and politically benefitted the members across the time of association between them .
Table-7
Time of association with SHGS
calculated chi-square value
df Accept/reject
Effect of SHGs 27.582 6 Rejected
Economically benifited by SHGs 3.992 8 Accepted
Socially benefited by SHGs 14.974 8 Rejected
politically benefited from SHGs 9.9 6 Rejected
Interpretation – The null hypothesis has been rejected in almost all the cases of economicbenefits from SHGs indicating no significant difference in the perception that time of association with SHGs have economically benefited the participation of SHGs. In all the other cases, the null hypothesis has been rejected indicating a significant difference in the perception towards the benefits derived (both social & political) from membership of SHGs.
Findings and conclusions Time association had got a significant impact on the benefit derived from SHGs. Greater the time of association; greater are the benefits derived. Joining after SHGs has helped in the significant reduction of poverty, have made the women members feel more independent; has increased their standard of living. The women have found it easier to repay the principal amount along with the interest and further more the women members were also satisfied with interest-rates charged on the loans taken from SHGs. Though there was a significant difference in the perception towards the effect of SHGs across the time of association, it was clear that greater the time of association with SHGs, greater were the benefits derived. All of them agreed that there was an increase in the monthly savings after joining SHGs and greater was the time of association greater was the monthly savings and increase in the living standard. All the members accepted that they were economically benefited after joining SHGs. And these benefits also increased as the time ofassociation increased. Though there was a difference in the perception regarding the social benefits derived from the membership of SHGs, Most of them did agree that the time association with SHGs increased the sense of social security and createdsocial awareness among the women members. Different women were also politically benefited differently across the time association. woman so it can be concluded that woman are taking interest in the SHGs programs and coming forward and are becoming self dependent and self employed which has ensures their well being and growth they have also learned to take decision.
References 1. Bharathi, R. A., &Badiger, C. (2009). Constraints and suggestions of self help groups under the project
empowerment of women in agriculture. Karnataka Journal of Agricultural Sciences , 22(2), 457-459. 2. K. Jothy, I. S. (2002). Self-help groups under the women's development programme in Tamil Nadu:
Achievements, bottlenecks and recommendations. social change , 32 (3-4), 195-204. kumar, A. (2009). Self-Help Groups, Women's Health and Empowerment: Global Thinking and Contextual Issues. Jharkhand Journal of Development and Management Studies , 4 (3), 2061-2079.
3. Lata Krishnan, A. M. (2008). Empowerment of Underprivileged Women Through Self-Help Groups. Journal of Community Guidance & Research , 25 (1), 62-74.

UGC Approved: 43602 e ISSN 2348 –1269, Print ISSN 2349-5138 http://ijrar.com/ NCETSEM-19
80 IJRAR- International Journal of Research and Analytical Reviews Special Issue
REAL TIME SENSOR DATA TRANSMISSION USING IOT THROUGH SOIL
E. Poovannan1, P.Nethra2, G.Praneeth3, K.srinivasReddy4, Puli Lohith5 1Assistant Professor, SRM Institute of Science and Technology, Chennai, Tamilnadu,India.
2,3,4,5 UG Scholars, SRM Institute of Science,TamilNadu,India.
ABSTRACT: Soil is a standout amongst the most vital substances on earth.Individuals now days dependably need something that can make their life less demanding. In this theory is utilized to characterize the information transmission frameworks, for example, observing the harvest fields from web of things through soil.By utilizing Wireless Sensor Technology we keep away from the tremendous measure of soil disintegration is being brought about by the dynamic action of erosive specialists, that is, water, ice (icy masses), snow, air (wind), plants, creatures, and people. The microcontroller (PIC) based soil observing is utilized to show the dimension of the dirt sort, dampness content, Temperature dimension of the yield field. Sensor Based Soil Pollution Detection, it will check the dirt quality by utilizing these parameters, for example, the Temperature level, Moisture are estimated continuously by the Underground sensors and it will screen by a specialist.
Keywords:
1. INTRODUCTION
Soil is a restricted asset and is fundamental for agribusiness, industry and for animal's presence on earth including people. Heaps of individuals don't understand the genuine significance of soil quality consistently. More soil is squandered by numerous uncontrolled way. This issue is discreetly identified with soil Pollution, the defilement of soil of a specific area, and absence of satisfactory and incorporated soil the board. Hence, proficient use and soil observing are potential requirement for agribusiness terrains and nursery the executives framework support to checking the dirt parameters. Thus similarly as with most things in the earth, it is essential that the EC does not get too high either, all things considered an extensive number of these enhancements, especially Na and Mg, can be frustrating to soil prosperity. Perfect EC levels in the soil as needs be stretch out from 110-570 milliSiemens per meter (mS/m). Too low EC levels show low open enhancements, and too high EC levels exhibit an excess of enhancements. Low EC's are regularly found in sandy soils with low natural issue levels, while high EC levels are generally found in soils with high earth content.
2. LITERATURE SURVEY Smart Monitoring and Clearance System using Internet of ThingsFor Crop Field The different methods and strategies utilized for the harvest development and the unwavering quality of forecasts were plainly comprehended. We ran over a ton of relations between yield
development, soil dampness, soil quality and adjacent condition. We have joined them into our framework. Since handy qualities contrast, we trust that with time our framework will turn out to be progressively shrewd and furnish with exact outcomes required for the perfect harvest growth.Considered crafted by provincial cultivating network that replaces a portion of the customary methods. The sensor center points have a couple outside sensors to be explicit leaf wetness, soil sogginess sensor, soil PH, climatic weight sensors associated with it. In perspective on the earth moistness sensor the bit triggers the water sprinkling in the midst of the season of water lack and switches off after attractive water is sprinkled. This results in water assurance and soil pH is sent to the base station and along these lines base station indication the farmer about soil pH by methods for SMS using GSM appear. This information makes the farmers decrease measure of fertilizers used. An improvement of rice crop checking using WSN is proposed to give some help to farmers logically watching and growing the rice creation. The mechanized control of water sprinkling and extreme supply of data is executed utilizing remote sensor organize. Wireless Underground BasedFarming Remote Underground Sensor Networks (RUSNs) are a developing sort of remote sensor systems (RSNs), where sensor hubs are situated under the ground and impart through soil. The significant test in the improvement of proficient correspondence conventions for WUSNs is the portrayal of the underground channel. Up until

National Conference on Emerging Technologies for Sustainable Engineering and Management Organized by Sri Muthukumaran Institute of Technology
Special Issue IJRAR- International Journal of Research and Analytical Reviews 81
now, none of the current models completely catch every one of the segments of electromagnetic flag proliferation in the dirt medium. With the improvement of remote sensor systems (RSNs), applications in obliged situations have increased extensive intrigue. One such zone is remote underground sensor systems (RUSNs), where the sensor bits are covered under soil and speak with one another through soil. Run of the mill applications for this sort of correspondence frameworks incorporate soil condition observing ,quake forecast, correspondence in mines/burrows, and so on. These applications require a social affair of pertinent data from numerous areas, which recommends the utilization of various sensor hubs that would be sorted out in remote underground sensor systems (RUSNs). Because of the cruel engendering conditions in the dirt medium (counting rock, sand, and water sheds), conventional remote flag proliferation strategies utilizing electromagnetic (EM) waves must be connected for exceptionally short transmission ranges. As of late, attractive enlistment (MI) based transmission has been proposed to defeat these issues. In this methodology, acceptance loops are used as radio wires in the handsets so as to lessen the defenselessness of flag spread to the dirt properties, specifically the dirt conductivity. Product Description WUSN conditions are more muddled than over-the-ground situations as they contain air, sand, shakes, and water with electrolytes. It is trying to acknowledge remote correspondence in such complex situations. Exemplary strategies dependent on EM waves are generally utilized in earthly conditions. Nonetheless, those procedures don't function admirably in underground situations. In the first place, EM waves experience elevated amounts of constriction because of ingestion by soil, shakes, and water underground. Second, the electrolytes in the underground medium become the overwhelming component that impacts the way loss of EM waves. Thus, soil water substance, thickness, and cosmetics can influence the execution of correspondence capriciously since these elements change with area and fluctuate drastically after some time. Third, working frequencies in megahertz or lower ranges are important to accomplish a useful transmission run. In this manner, contrasted and the correspondence extend, the radio wire size will turn out to be too expansive to even think about being conveyed underground.
Wirless Underground Sensor Network Node Section The models created in this portray not just the spread of EM wave in soil, yet in addition different consequences for the correspondence identified with multi way impacts, soil arrangement, water substance, and entombment profundity. The outcomes acquired from this formalization uncover that underground correspondence is seriously influenced by recurrence and soil properties, and all the more explicitly by the volumetric water content (VWC) of soil. Besides, the impacts of climate and season changes are examined by considering two soil types as precedents. Such hypothetical models are fundamental for establishing out the frameworks for proficient correspondence in this condition. Specifically, the 300– 900 MHz recurrence band, which is reasonable for little size radio wire and sensor improvement, is examined and the aftereffects of field tests acknowledged at 433 MHz are contrasted and the hypothetical models. In addition, the acknowledgment of field explores additionally uncovered critical issues not considered in the hypothetical models, for example, the impacts of the reception apparatus introduction. At long last, challenges for the possibility of WUSNs
Figure 1: WUSN Division
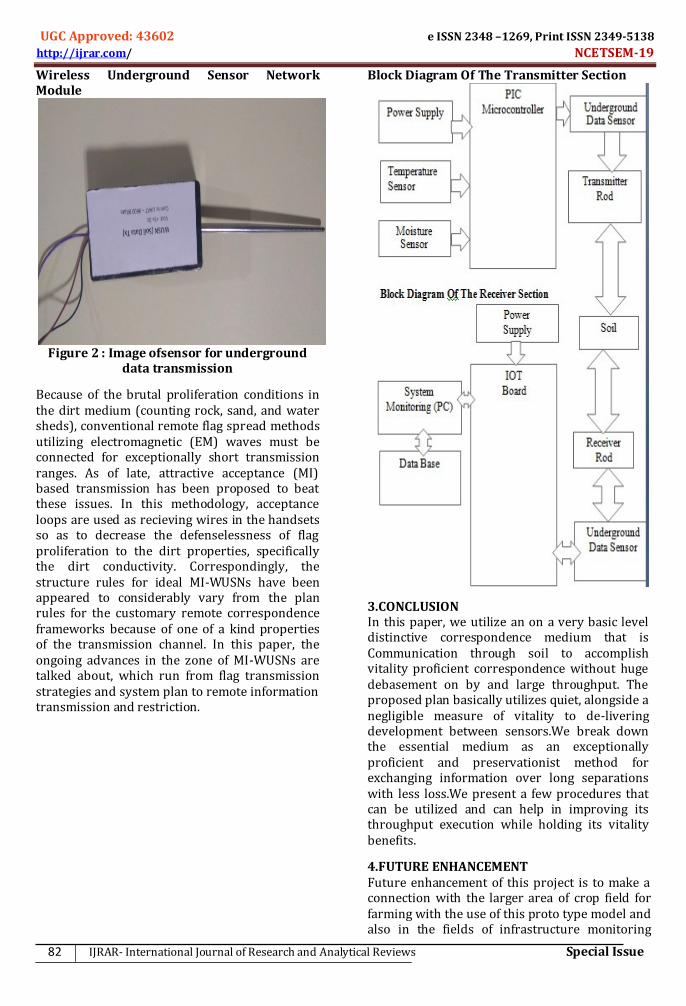
UGC Approved: 43602 e ISSN 2348 –1269, Print ISSN 2349-5138 http://ijrar.com/ NCETSEM-19
82 IJRAR- International Journal of Research and Analytical Reviews Special Issue
Wireless Underground Sensor Network Module
Figure 2 : Image ofsensor for underground
data transmission
Because of the brutal proliferation conditions in the dirt medium (counting rock, sand, and water sheds), conventional remote flag spread methods utilizing electromagnetic (EM) waves must be connected for exceptionally short transmission ranges. As of late, attractive acceptance (MI) based transmission has been proposed to beat these issues. In this methodology, acceptance loops are used as recieving wires in the handsets so as to decrease the defenselessness of flag proliferation to the dirt properties, specifically the dirt conductivity. Correspondingly, the structure rules for ideal MI-WUSNs have been appeared to considerably vary from the plan rules for the customary remote correspondence frameworks because of one of a kind properties of the transmission channel. In this paper, the ongoing advances in the zone of MI-WUSNs are talked about, which run from flag transmission strategies and system plan to remote information transmission and restriction.
Block Diagram Of The Transmitter Section
3.CONCLUSION In this paper, we utilize an on a very basic level distinctive correspondence medium that is Communication through soil to accomplish vitality proficient correspondence without huge debasement on by and large throughput. The proposed plan basically utilizes quiet, alongside a negligible measure of vitality to de-livering development between sensors.We break down the essential medium as an exceptionally proficient and preservationist method for exchanging information over long separations with less loss.We present a few procedures that can be utilized and can help in improving its throughput execution while holding its vitality benefits.
4.FUTURE ENHANCEMENT Future enhancement of this project is to make a connection with the larger area of crop field for farming with the use of this proto type model and also in the fields of infrastructure monitoring

National Conference on Emerging Technologies for Sustainable Engineering and Management Organized by Sri Muthukumaran Institute of Technology
Special Issue IJRAR- International Journal of Research and Analytical Reviews 83
,BoarderMonitoring and Security Monitoring and Location Monitoring with the use of soil as an channel for data transmission from a remote location to a our location and make use of the data and make the process automatically using automation technologies.
REFERANCE 1. Paris Anguela, T., Zribi, M., Habets, F.,
Hasenauer, S., and Loumagne, C., 2008, “Analysis of surface and root soil moisture dynamics with ERS scatterometer and the hydrometeorological model SAFRAN-ISBAMODCOU at Grand Morin watershed (France)”, HESS (Hydrology and Earth System Sciences ), 5, 1903-1926.
2. Saux-Picart, S., Ottlé, C., Decharme, B., André, C., Zribi, M., Perrier, A., Coudert, B., Boulain, N., Cappelaere, B., 2009, Water and Energy budgets simulation over the Niger super site
spatially constrained with remote sensing data, Journal of Hyrology., 375, 287-295.
3. S. Bousbih, M. Zribi, Z. Lili-Chabaane, N. Baghdadi, M. El Hajj, Q. Gao, B. Mougenot, “Potential of Sentinel-1 Radar Data for the Assessment of Soil and Cereal Cover Parameters”, 2017, Sensors, 17, 2617; doi:10.3390/s17112617.
4. M. Zribi, A. Chahbi, M. Shabou, Z. Lili-Chabaane, B. Duchemin, N. Baghdadi, R. Amri, A. Chehbouni. Soil surface moisture estimation over a semi-arid region using ENVISAT ASAR radar data for soil evaporation evaluation. Hydrol. Earth Syst. Sci. 2011, 15, 345–358, DOI: 10.5194/hess-15-345-2011.
5. N. Bghdadi, M. ElHajj, M. Zribi, S. Bousbih, Calibration of the Water Cloud Model at C-Band for Winter Crop Fields and Grasslands, Remote Sens. 2017, 9, 969; doi:10.3390/rs9090969

UGC Approved: 43602 e ISSN 2348 –1269, Print ISSN 2349-5138 http://ijrar.com/ NCETSEM-19
84 IJRAR- International Journal of Research and Analytical Reviews Special Issue
BUILDING RESILIENT CARRIER GRADE WAN NETWORK FOR CORPORATE
Suchitra Thota & Lohith E & Sai Krishna M & Pavithra N & Sai Naveen S & Jacqulin Veda
Jancy Department of Electronics and Communication, SRM Institute of Science and Technology
Chennai, India.
ABSTRACT: A carrier grade network refers to a software or hardware system that is dependable and well tested. This is used to meet high availability. Corporate Wan infrastructure constitutes of routers and switches have been proposed in this paper to make the network reliable. The quality of service in a network is used to achieve maximum bandwidth. A fault-tolerant and fast failover corporate network is built. The scalable network which will be capable to handle, and process high amount of traffic has been built. The link level and the node level failure are prevented in the designed network and the availability percentage of the network is 97%.
Keywords: carrier grade,redundancy,resilient, high availability.
1 INTRODUCTION The society is more dependent on the
communication network because most of the infrastructure like banking, telecom services is very much dependent on communication.This dependency has led to concentrate about high availability, reliability and resilient. Whenever the network is unable to transfer the data the such situation is referred to a failure in network. The failure can be viewed as interruption of an activity or service due to congestion.
These failures include link failure, node failure, software failures, natural disaster, human errors and physical attacks. The dependency of society on communication makes us to realize how important to make a network resilient. To avoid network failure the network must be designed in such a way that the network is fault-tolerant and fast failover by introducing optimum redundancies at appropriate multiple levels on hardware (physical media, networking elements) and software (services and protocols) to claim having 100percent up time. If a network fails, the proposed network is durable enough to with stand reacting to faults. Whenever there is a failure in the links, nodes and other elements the network has to recover.
For the network to improve redundancy and high availability some techniques have been used. This techniqueis classified into – 1 Network design 2 Basicissues 3Transport or link level resiliency 4 Protocol level resiliency. These techniques mainly concentrate on the traffic management and the failure that may occur in the
link level and protocol level. The traffic management seek to transfer the network load such that a failure has minimum impact when the connection effected by the failure. The use of backup LACP path in MPLS network is used for the traffic management. The goal is to make a network to be highly available to the end users by providing continues service and to control the congestion. This can be achieved by designing network that has strong enough to malfunction of nodes & links and configuring protocol that are fault tolerant. When we build a network the most important factor, we mustinvestigate is cost. We must see that the cost is always minimum.
If we consider satellite industry the availability of network should be always high because we may face many several difficulties. Due to temperature, radiation etc. These systems are designed to decrease the down time and increase the availability.
One can think that reaching high availability by using redundancy techniques is easy. In this paper the second section discuss about the network design and the third section discuss about the issues one may face in a network.Finally, the last section sums up the paper.
2 NETWORK DESIGN We first discuss by examining a sample
network architecture. The aim is to provide an overview which can be referred to explain the challenges and frames solution.
At present communication infrastructure consists of set of inter connected networks. They

National Conference on Emerging Technologies for Sustainable Engineering and Management Organized by Sri Muthukumaran Institute of Technology
Special Issue IJRAR- International Journal of Research and Analytical Reviews 85
are classified based on either access network or wide area network. Access network provide us end communication. Access network usually have tree or hub type of topology with little or no redundancy. Due to cost restriction. WAN also known as long haul network or core backbone. Almost all WAN’s use optical communication with WDM or DWDM technology. WAN are usually designed in mesh topology with some level of fault tolerant that is pre-planned. These component network will be owned and operated by many organizations like service provider. Basically, the hierarchy of network is divided into three levels. They are access network, distributed network and core network. Each network has a top layer where services such as voice, data are provided. These layers may contain many sub-layers.
Fig.1 Network Architecture
We must concentrate on each layer and assume different ways in which the network failure may occur and apply certain techniques to improve redundancy. The resilient network concept can be classified into link-disjoint and node-disjoint. If we consider a mesh topology the traffic is sent from fixed end to destination, the path in which the traffic is routed is called active path. Whenever the network failure occurs, the network is designed in such a way that the backup path is configured to route packets through the backup path. Whenever we build a network, we must configure backup path in order to avoid the down time such that the network will recover soon.
3 EXISTING SYSTEM The basic issues in the existing system
and the solution has been discussed. The major factor that effect amount of the redundancy fault tolerant mechanism is the cost. Because of the cost networking has become a business. So, the network availability has become intense. The cost limitation effect network resilience to limit the
redundancy that one can afford to infrastructure. The cost limits the network connectivity.
Fig.2 Basic issues
When the network topology is designed each layer is to be concentrated such that there should be no chance to network fail. In this paper we mainly concentrate on the layer 1, layer 2 and layer 3. In thelayer 1the main thing we must concentrate is the cables and the power supply. In the data link layer, we concentrate more on the link and the node. In the network layer we concentrate more on protocols. We use the concepts of HSRP, LACP, SPANNING TREE PROTOCOL,MPLS TRAFFIC ENGINEERING. 3.1 Transport or link level resiliency
For the link level resiliency, the techniques used are LACP(link aggregation control protocol). In the link level to avoid the failure LACP is configured. Two manageable switches when connected using a single link may lead to loss of data packets whenever there is a failure in the link. So, we configure these manageable switches with two links. So that whenever there is a failure in one link the second link can be automatically turn on. In this way we can avoid link failure. LACP packets are exchanged in two modes. There is active mode which makes the port to act in active state and passive which makes the port to act in passive state. These modes allow LACP to work between ports to determine if they form port channel based on port speed and trunking state. LACP system priority is to be configure on each router. The priority can be configured automatically or through CLI. LACP port priority is configured on each port using CLI or automatically. Each and every port that is added to port channel must be configured identically. This LACP help in dividing traffic between network interfaces.
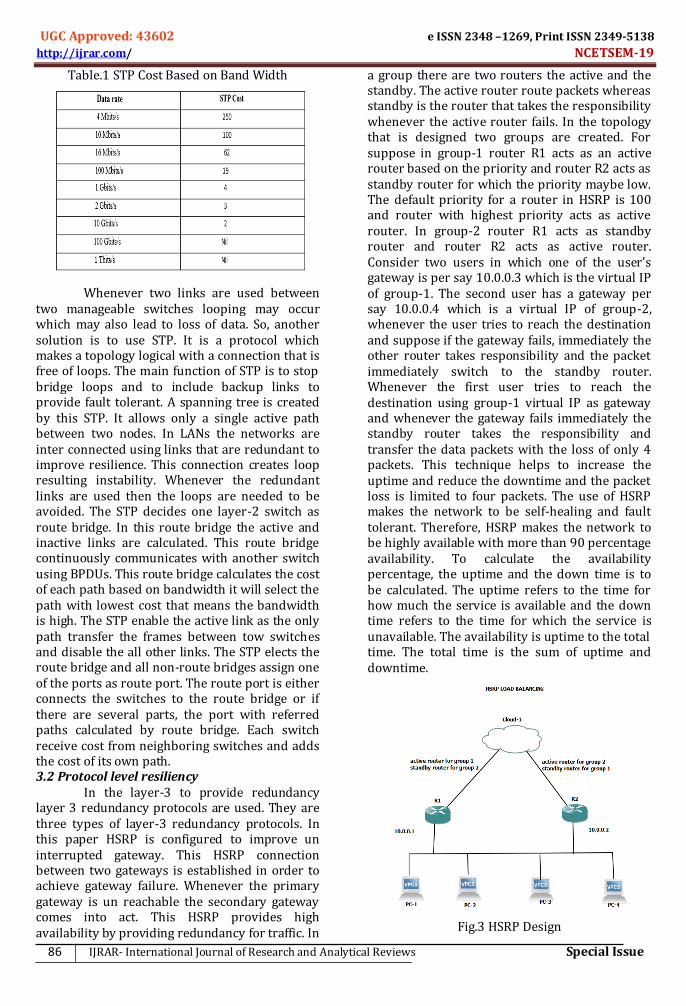
UGC Approved: 43602 e ISSN 2348 –1269, Print ISSN 2349-5138 http://ijrar.com/ NCETSEM-19
86 IJRAR- International Journal of Research and Analytical Reviews Special Issue
Table.1 STP Cost Based on Band Width
Whenever two links are used between two manageable switches looping may occur which may also lead to loss of data. So, another solution is to use STP. It is a protocol which makes a topology logical with a connection that is free of loops. The main function of STP is to stop bridge loops and to include backup links to provide fault tolerant. A spanning tree is created by this STP. It allows only a single active path between two nodes. In LANs the networks are inter connected using links that are redundant to improve resilience. This connection creates loop resulting instability. Whenever the redundant links are used then the loops are needed to be avoided. The STP decides one layer-2 switch as route bridge. In this route bridge the active and inactive links are calculated. This route bridge continuously communicates with another switch using BPDUs. This route bridge calculates the cost of each path based on bandwidth it will select the path with lowest cost that means the bandwidth is high. The STP enable the active link as the only path transfer the frames between tow switches and disable the all other links. The STP elects the route bridge and all non-route bridges assign one of the ports as route port. The route port is either connects the switches to the route bridge or if there are several parts, the port with referred paths calculated by route bridge. Each switch receive cost from neighboring switches and adds the cost of its own path. 3.2 Protocol level resiliency
In the layer-3 to provide redundancy layer 3 redundancy protocols are used. They are three types of layer-3 redundancy protocols. In this paper HSRP is configured to improve un interrupted gateway. This HSRP connection between two gateways is established in order to achieve gateway failure. Whenever the primary gateway is un reachable the secondary gateway comes into act. This HSRP provides high availability by providing redundancy for traffic. In
a group there are two routers the active and the standby. The active router route packets whereas standby is the router that takes the responsibility whenever the active router fails. In the topology that is designed two groups are created. For suppose in group-1 router R1 acts as an active router based on the priority and router R2 acts as standby router for which the priority maybe low. The default priority for a router in HSRP is 100 and router with highest priority acts as active router. In group-2 router R1 acts as standby router and router R2 acts as active router. Consider two users in which one of the user’s gateway is per say 10.0.0.3 which is the virtual IP of group-1. The second user has a gateway per say 10.0.0.4 which is a virtual IP of group-2, whenever the user tries to reach the destination and suppose if the gateway fails, immediately the other router takes responsibility and the packet immediately switch to the standby router. Whenever the first user tries to reach the destination using group-1 virtual IP as gateway and whenever the gateway fails immediately the standby router takes the responsibility and transfer the data packets with the loss of only 4 packets. This technique helps to increase the uptime and reduce the downtime and the packet loss is limited to four packets. The use of HSRP makes the network to be self-healing and fault tolerant. Therefore, HSRP makes the network to be highly available with more than 90 percentage availability. To calculate the availability percentage, the uptime and the down time is to be calculated. The uptime refers to the time for how much the service is available and the down time refers to the time for which the service is unavailable. The availability is uptime to the total time. The total time is the sum of uptime and downtime.
Fig.3 HSRP Design
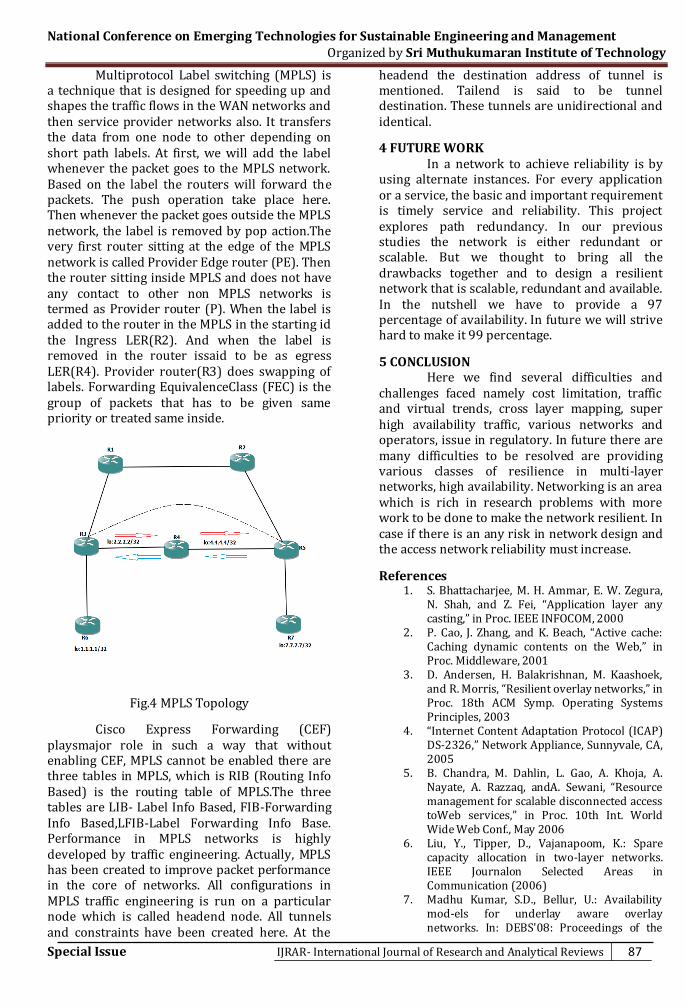
National Conference on Emerging Technologies for Sustainable Engineering and Management Organized by Sri Muthukumaran Institute of Technology
Special Issue IJRAR- International Journal of Research and Analytical Reviews 87
Multiprotocol Label switching (MPLS) is a technique that is designed for speeding up and shapes the traffic flows in the WAN networks and then service provider networks also. It transfers the data from one node to other depending on short path labels. At first, we will add the label whenever the packet goes to the MPLS network. Based on the label the routers will forward the packets. The push operation take place here. Then whenever the packet goes outside the MPLS network, the label is removed by pop action.The very first router sitting at the edge of the MPLS network is called Provider Edge router (PE). Then the router sitting inside MPLS and does not have any contact to other non MPLS networks is termed as Provider router (P). When the label is added to the router in the MPLS in the starting id the Ingress LER(R2). And when the label is removed in the router issaid to be as egress LER(R4). Provider router(R3) does swapping of labels. Forwarding EquivalenceClass (FEC) is the group of packets that has to be given same priority or treated same inside.
Fig.4 MPLS Topology
Cisco Express Forwarding (CEF) playsmajor role in such a way that without enabling CEF, MPLS cannot be enabled there are three tables in MPLS, which is RIB (Routing Info Based) is the routing table of MPLS.The three tables are LIB- Label Info Based, FIB-Forwarding Info Based,LFIB-Label Forwarding Info Base. Performance in MPLS networks is highly developed by traffic engineering. Actually, MPLS has been created to improve packet performance in the core of networks. All configurations in MPLS traffic engineering is run on a particular node which is called headend node. All tunnels and constraints have been created here. At the
headend the destination address of tunnel is mentioned. Tailend is said to be tunnel destination. These tunnels are unidirectional and identical.
4 FUTURE WORK In a network to achieve reliability is by
using alternate instances. For every application or a service, the basic and important requirement is timely service and reliability. This project explores path redundancy. In our previous studies the network is either redundant or scalable. But we thought to bring all the drawbacks together and to design a resilient network that is scalable, redundant and available. In the nutshell we have to provide a 97 percentage of availability. In future we will strive hard to make it 99 percentage.
5 CONCLUSION Here we find several difficulties and
challenges faced namely cost limitation, traffic and virtual trends, cross layer mapping, super high availability traffic, various networks and operators, issue in regulatory. In future there are many difficulties to be resolved are providing various classes of resilience in multi-layer networks, high availability. Networking is an area which is rich in research problems with more work to be done to make the network resilient. In case if there is an any risk in network design and the access network reliability must increase.
References 1. S. Bhattacharjee, M. H. Ammar, E. W. Zegura,
N. Shah, and Z. Fei, “Application layer any casting,” in Proc. IEEE INFOCOM, 2000
2. P. Cao, J. Zhang, and K. Beach, “Active cache: Caching dynamic contents on the Web,” in Proc. Middleware, 2001
3. D. Andersen, H. Balakrishnan, M. Kaashoek, and R. Morris, “Resilient overlay networks,” in Proc. 18th ACM Symp. Operating Systems Principles, 2003
4. “Internet Content Adaptation Protocol (ICAP) DS-2326,” Network Appliance, Sunnyvale, CA, 2005
5. B. Chandra, M. Dahlin, L. Gao, A. Khoja, A. Nayate, A. Razzaq, andA. Sewani, “Resource management for scalable disconnected access toWeb services,” in Proc. 10th Int. World Wide Web Conf., May 2006
6. Liu, Y., Tipper, D., Vajanapoom, K.: Spare capacity allocation in two-layer networks. IEEE Journalon Selected Areas in Communication (2006)
7. Madhu Kumar, S.D., Bellur, U.: Availability mod-els for underlay aware overlay networks. In: DEBS'08: Proceedings of the

UGC Approved: 43602 e ISSN 2348 –1269, Print ISSN 2349-5138 http://ijrar.com/ NCETSEM-19
88 IJRAR- International Journal of Research and Analytical Reviews Special Issue
second international conference on Distributed event-based systems, pp. 169,2008
8. Adapt: (2011). URL http://www.adaptplc.com/
9. Andersen, D., Balakrishnan, H., Kai-shek, F., Morris.: Resilient overlay networks. In: SOSP'01: Proceedings of the eighteenth ACMon Operating systems principles (2008)

National Conference on Emerging Technologies for Sustainable Engineering and Management Organized by Sri Muthukumaran Institute of Technology
Special Issue IJRAR- International Journal of Research and Analytical Reviews 89
AUTOMATIC GARDENING SYSTEM
Senthil Murugan.T1 & Monisha.K2 & Bhavishya Reddy.M2 & Dhasbeeha.R2 Professor, Department of Computer Science Engineering , Vel Tech Rangarajan Dr.Sagunthala R & D
Institute of Science and Technology ,Chennai, India. B.Tech, Department of Computer Science Engineering , Vel Tech Rangarajan Dr.Sagunthala R&D Institute
of Science and Technology, Chennai, India
ABSTRACT: The plants required adequate amount of water for its growth. When there is less in rainfall the plants required additional water, if the plants didn’t get adequate water supply the plants may get damaged. This project explains about an Automatic Gardening System that monitors the moisture in the soil becomes low than the threshold value of the soil. This also monitors the level of water in the water tank using the ultra sonic sensor which supplies water to the tank when the level of the water is decreased to the minimum. GSM(Global system for mobile communication) is used for communication purpose. Here it is used to send messages to user about the status of the level of water and the moisture in the soil and also it sends message when there is any fault in the system or if the system is not working properly. The sensors analyze and gather data about changing in water level and soil moisture conditions and it will perform according to it.
Keywords: ultrasonic sensor, soil moisture sensor, Arduino Uno, motor pump
I. INTRODUCTION The water is the major source for the growth of plants. Due to the scarcity and contaminated water the supply of water to the plants is the major important work in our daily basis. Where no one has the time to pour water to the plants because of this issue the plants are getting damaged, to overcome this issue this project on IoT will help to water the plants automatically. IoT will analyze the data by sensing the data and it gives way to communicate between physical world and computer systems. Here it has ultrasonic sensor which monitors the level of water by producing the sound waves that travels and reflects back when it hits an object and soil sensor which monitors the moisture content in the soil and it will give the result in analog form. Actuators are used for the movement such as opening and closing of the pump. It also has a submerged motor which pumps the water to the tank and for the plants. The sensors are used to obtain the values of the parameters and process them using Arduino microcontroller and control the survival of plants in the garden. GSM (Global System for mobile communication) module is a communication device. It is used to connect to various devices such as modems, cellular phones. GSM(Global System for mobile communication) is used to send the message to mobile about the current status of the tank and the plants to the user and also it sends message when there is any fault or failure of any components in this system.
Based on the soil type and plant type, the water requirement for the plant is defined. II. EXISTING METHOD OF AUTOMATIC WATERING SYSTEM In this paper, ATmega328 microcontroller is used to sense the moisture level of plants. It is programmed to sense the moisture level at particular instance of time. If the moisture level of the soil is reduced than the specified threshold value which is the required amount of water content that should be present for the plant growth then the water is supplied to the plants till they reach the required threshold value .generally plants are watered twice a day (morning and evening) .so the microcontroller is programmed to water the plants twice a day and it also reports the current state as well as reminds the user to fill the tank. All the notifications are made through mobile communication.[1] In this paper irrigation is done automatically by using ARM(Advanced RISK machine) and also GSM(Global system for mobile communication) for communication. This irrigation system provides adequate irrigation in particular area in real time.in this system soil moisture sensor is placed in roots of paddy field and sense the moisture content present. ARM7TDMI core and GSM is used to set up this system. The most important part of this system is GSM which is used for communication. GSM

UGC Approved: 43602 e ISSN 2348 –1269, Print ISSN 2349-5138 http://ijrar.com/ NCETSEM-19
90 IJRAR- International Journal of Research and Analytical Reviews Special Issue
operates through SMS and acts as a link between ARM and the centralized unit. It also detects the climatic condition and field condition in real time. This information is sent to the user in the form of a SMS with the help of GSM. A set of AT( Attention)commands. Majority of the functions of the GSM model is controlled with the help of these commands. [2] In this paper wireless sensor network i.e. Zig-bee and internet technology is used for irrigation of automatic irrigation technique. To reduce cost of irrigation water level and improve irrigation system this idea was developed. Sensors are placed to sense continuously and collect the information. This information stored at center monitor and also passes to more data collection interface and then broad cost to the wireless sensor node. This information was controlled automatically by using this information by using the internet.[3]
III. PROPOSED SYSTEM FOR AUTOMATIC GARDENING SYSTEM
1) Monitoring the moisture content in the soil using soil sensor and supply water to the plants when the moisture content is lower than the threshold value.
2) Monitoring the level of water in the water tank using ultra sonic sensor. When the water in the tank gets reduced to the minimum level, the motor is triggered by the Arduino and the water is supplied to the tank automatically.
3) GSM module is used to send the message about the status of the water level in tank and also about the moisture content in the soil. It also sends message to the user when there is any fault in the system or any of the component is not working properly.
IV. BLOCK DIAGRAM DESCRIPTION
FIG.1 AUTOMATIC PLANT WATERING AND
AUTOMATIC TANK FILLING BLOCK
The five main components which has been used in this project is Soil moisture sensor, Ultrasonic sensor, Solenoid valve, pump and GSM. Here with the help of Arduino IDE software the Arduino board is being programmed. The soil moisture sensor is used to sense the moisture level which is contained by the soil. The solenoid valve is used to supply water to the plants when the level of moisture tends to go below the set threshold value and the pump is used to supply water to the tank when it comes to the minimum level. The motor is controlled by the Arduino UNO. The following schematic diagram depicts how to connect the Arduino to the motor driver, and the driver to the water pump. The motor can be driven by using a 12volt battery. The soil moisture sensor measures the level of moisture that is present in the soil and sends the signal which is in analog format to the Arduino if watering of plants is required. The water pump supplies water to the plants until the preferred moisture level for the plant is reached.
GSM(Global System for Mobile communication)module is used for communication. In this system GSM is used to send message to user’s mobile phone about the status of the moisture content in the soil and about the level of water in the tank. It also used to alert user when there is any failure in the system or any component is not working properly.
V. METHODOLOGY FOR AUTOMATIC GARDENING SYSTEM
a) Water level sensor measures the level of water in the water tank. The sensor triggers the water pump when the water reaches the minimum level. The level sensor generates output of full medium and low.
b) Moisture sensor measures the moisture content in the soil which helps to trigger the valve to flow the water from tank to irrigation area.
c) Arduino Uno monitors the sensors output and trigger the relay circuit to turn ON and OFF solenoid valve and water pump.
d) Water pump used to fill the water in the tank and solenoid used to control the flow of water to the irrigation area.
e) Relay is an electronic switch which turn ON and off the electronic devices connected to it.
f) GSM module is used for communication it is used to send messages to the user’s

National Conference on Emerging Technologies for Sustainable Engineering and Management Organized by Sri Muthukumaran Institute of Technology
Special Issue IJRAR- International Journal of Research and Analytical Reviews 91
mobile phone about the status of the tank and plant and the working of component.
VI. FLOW CHART The power supply is given to Arduino Uno and then from Arduino the power is supplied to ultrasonic sensor, soil moisture sensor and GSM. If the ultrasonic sensor has the value less than 500 then the motor pump is switched on by the relay and when it increases more than 500 then the motor pump is switch off by relay. If the soil moisture sensor has the value less than 600 then the water valve will be opened and when the moisture content present in the soil is increased than 600 then the water valve is closed. GSM it will send the message to user’s mobile about the current status of the system.
Fig 2: Flow chart for Gardening System
VII. OUTPUT The figure 3 is the hardware output for the system, it will automatically calculate the amount of moisture present in the soil by using soil moisture sensor and it will supply the water automatically when the moisture content is less than the required value and the water supply will off when it reaches the required value. It will calculate the amount of water present in the
water tank using ultrasonic sensor and it will fill the water tank and turn off when the tank is fill automatically. GSM(Global system for mobile communication) is used to communicate with the user about the system by sending the message. It also alert the user when the system has any failure or any components is not working properly.
Fig 3: Output for Smart Gardening System
VIII. CONCLUSION In this paper it represents a prototype for automatic Gardening System. Here prototype include sensor node and control node. The sensor node is deployed in gardening plants for sensing soil moisture value and also deployed in water tank to check the level of water in the tank and the sensed data is sent to controller node. On receiving sensor value the controller node check it with required soil moisture value and water level value. When soil moisture in gardening field is not up to the required level then the motor is switched on to supply water to the plants. When ultrasonic sensor in water tank is not up-to the threshold value then the motor is turned on and the water is supplied to the tank. The experimental results show that the prototype is capable for automatic controlling of the motor based on the feedback of soil moisture sensor and ultrasonic sensor. This system is used in a apartment and there are various benefits for the working people. By using the automatic gardening System it optimizes the usage of water by reducing wastage and reduce the human involvement in gardening. It saves energy also as it automatic controlling system. The system is

UGC Approved: 43602 e ISSN 2348 –1269, Print ISSN 2349-5138 http://ijrar.com/ NCETSEM-19
92 IJRAR- International Journal of Research and Analytical Reviews Special Issue
OFF when the field is wet or when the tank is full and automatically ON when the field id dry or when the tank is less than the threshold value. Here GSM that send message to the user’s mobile about the status of this system and also it alerts the user by sending message when there is any failure or any component is not working properly. And power consumption of the wireless network devices is also less and the system perform a long time function.
REFERENCES i. Archana P, Priya R, “DESIGN AND
IMPLEMENTATION OF AUTOMATIC PLANT WATERING SYSTEM”, International Journal of Advanced Engineering and Global Technology Vol-04, Issue-01 , January 2016, ISSN No: 2309-4893.
ii. S. N. Ishak ; N. N. N. Abd Malik ; N. M. Abdul Latiff ; N. Effiyana Ghazali ; M. A. Baharudin “SMART HOME GARDENING IRRIGATION SYSTEM USING RASBERRY PI” 2017 IEEE 13th Malaysia International Conference on Communications (MICC), )28-30 Nov. 2017.
iii. V. Vinoth Kumar, R.Ramasamy, S.Janarthanan, M.VasimBabu, “Implementation of IoT in Smart Irrigation System using Arduino
Processor”, International Journal Of Civil Engineering and Technology (IJCIET) Volume 8, Issue 10, October 2017.
iv. Nikhil Gowda, Suhas Shastry, Yashwanth J, Achyutha Preksha A, “IoT based Water Supply Monitoring and Soil Moisture Detection System”, International Journal of Computer & Mathematical Sciences, Volume 6, Issue 5 May 2017.
v. T.Thamaraimanalan,S.P.Vivekk,G.Satheeshkumar and P.Saravanan ”Smart Gardening monitoring system using iot” Asian Journal of Applied Science and Technology (AJAST) Volume 2, Issue 2, Pages 186-192, April-June 2018.
vi. Aditya Gupta, Sudhir Mishra, Neeraj Bokde, Kishore Kulat, “Need of Smart Water Systems In India” International Journal of Applied Engineering Research ISSN 0973-4562 Volume 11, Number 4 (2016) pp 2216-2223.
vii. Abdullah Na, William Issac, Shashank Varshney and Ekram Khan, ―An IoT Based System For Remote Monitoring of Soil Characteristics 2016.
National Conference on Emerging Technologies for Sustainable Engineering and Management Organized by Sri Muthukumaran Institute of Technology
Special Issue IJRAR- International Journal of Research and Analytical Reviews 93
Orchestrate of Docker Containers using TOSCA Templates
Nanda Kishore Sahu & Abhinay Rk & Easvar Prasad KR & Mohammad Zayan L & Poonkavithai Kalamegam
Computer Science and Engineering, Hindustan University, Chennai, India
ABSTRACT: Cloud orchestration assists in arranging and coordinating the business processes or workflows to obtain the ultimate and efficient virtual computing resources management. The cloud orchestration standards are brought into the system to guide the development of the orchestration tools. TOSCA is a new open cloud standard, introduced,approved and developed by OASIS. Using TOSCA, the cloud providers are able to define the exchange of information and communication of services and their relationships, and to enable the portability and automated management across cloud platforms and infrastructures.
Keywords: cloud orchestration,TOSCA,Docker, Xml,Yaml
I. INTRODUCTION
The probability of automating the deployment of (complex) applications over heterogeneous infrastructures, by taking into account both application requirements and infrastructure constraints, is receiving increasing attention TOSCA and Docker are two emerging solutions trying to address this problem from different perspectives.On the one hand, TOSCA (Topology and Orchestration Specification for Cloud Applications ) follows a model-driven approach. More precisely, TOSCA is an OASIS standard that provides a YAML-based modelling language for specifying portable cloud applications, and for automating their deployment and management.TOSCA permits describing the structure of a cloud application as a typed, directed topology graph, whose nodes represent application components, and whose arcs represent dependencies among such components.Docker follows a “snapshot-based” approach. More precisely, Docker is an open source platform for building, shipping, and running software components, together with their dependencies, in lightweight virtual environments, called containers. Docker containers run from Docker images pulled from docker hub, which are the read-only templates used to create them. A Docker image packages any software dependency (e.g., source code, configuration file, binaries) needed to run a software component.The objective of this thesis is to identify and develop a solution that automates the whole process without any human intervention and saving time with TOSCA and Docker.In TOSCA description of a multi-component application,where some components
are Docker containers and Docker volumes,and automatically deploys and orchestrates it using the Docker engine.TosKer is the first orchestration engine that permits orchestrating TOSCA applications combining heterogeneous components,including Docker containers and Docker volumes.TosKer hence advances the state-of-the-art for orchestrating application with Docker and TOSCA. TOSCA has played various roles in different research approaches TOSCA as part of a more general methodology; others extended the modelling capabilities of TOSCA or designed tools to manipulate TOSCA models. The multifaceted use of TOSCA and the growing number of relevant papers make it hard to track all related research. The aim of this paper is to give an overview of the use of TOSCA in the research community. We performed a systematic literature survey to devise a taxonomy of the main research topics that have been addressed in connection with TOSCA.
II. BASIC CONCEPTS Some of definitions of the basic concepts used are: A. Cloud Computing: Cloud computing refers to a method of delivering IT services in which resources are retrieved from the Internet through various web-based tools and applications. B. TOSCA: TOSCA(Topology orchestration specification of a cloud application).It is a automation tool.TOSCA language describes cloud services with “templates”and “plans”.Templates defines the structure of a cloud service and plans defines the process that start and stop.TOSCA is a

UGC Approved: 43602 e ISSN 2348 –1269, Print ISSN 2349-5138 http://ijrar.com/ NCETSEM-19
94 IJRAR- International Journal of Research and Analytical Reviews Special Issue
specification that aims to regulate how we describe software applications and everything that is required for them to run within the “cloud”.This means that TOSCA provides the way to explain not solely associate application, however additionally its dependencies and supporting (cloud) infrastructure. There are 2 basic building blocks inTOSCA nodes and relationships.A node can be an infrastructure component, like a subnet,network,server (it can even represent a cluster of servers), or it can be a software component, like a service or a runtime environment.Meanwhile, a relationship showcases how nodes are connected to one another. TOSCA permits to specify a cloud application as a service template, that is in turn composed by a topology template, and by the types needed to build such a template.. The topology template is a typed directed graph that describes the topological structure of the composite cloud application. Its nodes model the application components, while its edges model the relationsoccurring among such components (if any). The topology template may also contain policies, which are typed by means of policy types and permit specifying non-functional information about the node templates they target. C. Docker: Docker is a Linux-based platform for developing, shipping, and running applications through container based virtualisation. Container-based virtualisation exploits the kernel of the host’s operating system to run multiple guest instances. Each guest instance is called a container, and each container is isolated from others (i.e.,each container has its own root file-system, processes, memory, devices, and network ports). Docker achieves container virtualisation through the Docker engine ,which acts as a server on the host operating systems and enables containers to be built, shipped, and run . To ensure isolation among different containers, the Docker engine uses Linux kernel containment features, such as control groups and namespaces. Docker containers are volatile: A container runs until the stop command is issued, or as long as the process from which it has been started is running. By default, the data produced by a container is lost when a container is stopped, and even if the container is restarted, there is no way to access the data previously produced. This is why Docker introduces volumes. A volume is a directory in a container, which is designed to let data persist,
independently of the container's lifecycle. Docker therefore never automatically deletes volumes when a container is removed, and it never removes volumes that are no longer referenced by any container. In is also possible to give a name to a volume and manage it as independent entity (e.g., create, attach to containers, and remove). Moreover, a volume can be also mounted to a host directory, thus the container and the host can share data. D. Cloudify Manager: In a market where cloud orchestration tools and products are still pretty new, Cloudify is known to be the best that is implementing this standard.Cloudify’s DSL is derived from TOSCA’s YAML easy Profile, that incorporates a specific approach of writing TOSCA blueprints in YAML.Originally, TOSCA is written in XML, however since XML has a lot of superfluous punctuation and indecipherablelanguage, the YAML profile is easier to use.Part of Cloudify’s core is the Cloudify DSL Parser, which aims to read and validate TOSCA (YAML) blueprints, and provide a methodology for mapping operations to Cloudify plugins.In this article, I’ve provided Cloudify code snippets, instead of TOSCA ones. Built on a YAML DSL configuration files called "blueprints" define the application's configurations, services and their tier dependencies. With these Cloudify automates the readying phases of applications to Cloud computing and Virtualization infrastructure. The blueprints describe however the appliance interacts with the info center through apis to execute the outlined blueprint configurations. These blueprint files describe the execution plans for the lifecycle of the application for installing, starting, terminating, orchestrating and monitoring the application stack. Cloudify uses the blueprint as input that describes the readying set up and is accountable for execution it within the cloud environments. The blueprint in addition employs cloud driver configuration files additional, to explain machines and their pictures for the chosen cloud, creating it doable to manage the infrastructure as code. For each part, it describes the location of your binaries, installation and monitoring configurations. By making associate abstraction layer that isolates the code from the underlying infrastructure, Cloudify is ready to support any cloud. E.Docker Orchestration: The term orchestration refers to the composition, coordination and management of multiple software components, including middleware and services. In the context of

National Conference on Emerging Technologies for Sustainable Engineering and Management Organized by Sri Muthukumaran Institute of Technology
Special Issue IJRAR- International Journal of Research and Analytical Reviews 95
container-based virtualisation, this corresponds to composite applications whose components independently run in their own containers and talk to each other by exploiting lightweight communication mechanisms, such as linking. Docker supports orchestration with two dedicated applications. Docker Swarm permits creating a cluster of Docker containers and turning it into a single, virtual Docker container (with a container acting as “master” and scheduling incoming tasks to “worker” containers).Docker Compose permits creating multi-container applications, by specifying the containers’ images to run and the links occurring among them. Docker Compose and Docker Swarm aim to have seamless integration, meaning that you could describe a multi-container application with Docker Compose, and deploy it with Docker Swarm. Containers are units deployed onto hosts, sometimes in replicated groups. When it’s time to deploy a brand new container into a cluster, the container orchestration tool schedules the preparation and appears for the foremost acceptable host to position the container based on predefined constraints. You can even place containers per labels or information, or per their proximity in reference to alternative hosts—all varieties of constraints can be used. Once the container is running on the host, the orchestration tool manages its lifecycle according to the specifications you laid out in the container’s definition file. F. Linking Containers: A software component running in a container application may need to interact with another component running in another container. A basic approach to support this is the so-called network port mapping: A container can be configured to expose network ports externally (by mapping the container's ports to ports of the host operating system). However, the Docker user guide discourages this approach, since it \limits" the amount of potential port mappings, and makes a container's connections unsafe (as its ports are public). Other approaches are linking and Docker networks. Linking is a communication method between two Docker containers that permits to securely transfer data from one container to another (without requiring the former to publicly expose its network ports). By linking a recipient container to a source container, the recipient gets access to the data stored in the source.
The above approach is now discouraged in favour of Docker networks which are virtual networks toward containers can dynamically be attached. Docker networks improve container networking, by also give the possibility to create user-de_ned networks specifying network type (e.g., bridge network, overlay network), and network addresses. G. YAML: YAML is a human-readable data regularization language. It is commonly used for configuring the files, but could be used in many applications where data is being saved or transmitted. YAML aims to establish many of the same communications applications as XML but it has got minimal syntax which deliberately breaks compatibility with SGML . It uses both Python-style indentation to describe nesting, and a more compact and an efficient format that uses for lists and for maps making YAML. YAML is to configure what markdown to markup. It’s basically a human-readable structured data format. It is less complicated and ungainly than XML or JSON, but provides similar capabilities. It primarily permits you to produce powerful configuration settings, without having to learn a more complex code type like CSS, JavaScript, and PHP. YAML is constructed from the bottom up to be easy to use. At it is core, a YAML file is to describe data. One of the benefits of using YAML is that the information in a single YAML file can be easily translated to multiple language type YAML excels at working with mappings, sequences, and scalars . While it will be used with most programming languages, it works best with languages that are designed around these organization varieties.
III. IMPLEMENTATION TosKer is mainly written in Python, . Python has been chosen because it is simple and complete, a perfect programming language for rapid prototyping. Furthermore, the project uses two open source Python libraries: docker-py and tosca-parser . The first one implements a Python interface for the Docker engine API, and it has recently become an official Docker library, maintained by Docker developers. The tosca-parser library instead implements a parser for TOSCA YAML files and CSAR archives, and it is developed and maintained by OpenStack community. using this library simplifies the implementation of TosKer, mainly for TOSCA validation features.The most relevant errors that we found are in the validation of the get attribute function,in the validation of artefacts, and in the

UGC Approved: 43602 e ISSN 2348 –1269, Print ISSN 2349-5138 http://ijrar.com/ NCETSEM-19
96 IJRAR- International Journal of Research and Analytical Reviews Special Issue
validation of the relationship definitions. We reported all of those errors to the repository’s maintainers . In the wait of a new official release, we decided to patched the source code of TosKer with some workarounds, to let it work with the current release.Furthermore,tosca-parser partially implements the execution of TOSCA functions. Indeed, tosca-parser executes just some type of functions and only if such functions are placed in specific fields of the TOSCA definition file. when a container C requires a link to a software components B, TosKer creates a link from C to D with tan alias that permits referring the container D as B. 2. when a software component A requires a link to a container D, TosKer creates a link from C to D. 3.when a software component A requires a link to another software component B, TosKer creates a link from C to D with tan alias that permits referring the container D as B. The above operations are performed during the enrichment phase done by the TOSCA utility.
IV. SOFTWARE SPECIFIC DESCRIPTION A. Modules:
a) TOSCA utility module: The TOSCA utility is in charge of parsing the TOSCA files given in input, validating it and generating a more convenient structure that the other modules can use to deploy the application. The validation phase checks that the TOSCA file is well-formatted .
b) Docker interface module: The Docker interface is the module in charge of talking with the Docker engine. It implements functions to manage containers, volumes and virtual networks
B. Functional tasks: The functional tasks of the orchestration of resources in TOSCA are as follows:
a) Cloudify manager converts the code from XML to YAML. YAML is the format of TOSCA template
b) Docker container it creates a virtual environment to application to run on any system. it has docker engine for docker like java has JVM .
c) By configuring the docker and cloudify manager the TOSCA template is generated in
V. RELATED WORK A. DOCKER ORCHESTRATORS In this section we discuss Kubernetes , Mesos and Docker compose, which are tools extending the orchestration capabilities of Docker by permitting to create and manage applications composed by multiple containers and volumes. Kubernetes and Mesos permit doing so on clusters of nodes, while Docker Compose is instead intended to work only with single hosts. Kubernetes is associated for automating , scaling and managing containerised applications.. It is a high level cluster orchestrator, which is not only compatible with Docker, but also with rkt. The main concepts behind Kubernetes are cluster, pod and service. A cluster is a group of compute nodes, which constitute the runtime for applications. One of the nodes work as master, and it is in charge of orchestrating the deployment of the applications. A pod is the minimal unit that can be deployed on a node, and it can be composed of multiple containers and volumes. A service is an application that the user want to expose, and it is composed of one or more pods connected to the same network. In summary, all aforementioned tools focus on cluster orchestration rather than on application orchestration. Indeed, all of them manage cluster of nodes and deploy application (composed of Docker components) on such a cluster. Instead, our main objective, that is orthogonal to TOSCA, is to improve application description abstracting as much as possible from the infrastructure. For this reason we decide to use Docker engine and focus on application description using TOSCA rather than exploits solution with different objectives. B. TOSCA DEPLOYERS The reference implementation for TOSCA XML is provided by the OpenTOSCA open source ecosystem. It is composed of three parts: the OpenTOSCA runtime environment, the Winery graphical editor for TOSCA applications, and Vinothek self-service portal for retrieving availableTOSCA applications. OpenTOSCA di_ers from TosKer as it is designed to work with a former, XML-based version of TOSCA, while TosKer is an implementation of a newer, YAML-based version of TOSCA . Also, OpenTOSCA process TOSCA applications imperatively, i.e., based on the deployment/management plans (e.g., BPEL or BPMN workows) defined by the application developer. It however currently lacks the implementation of the declarative processing of TOSCA applications (i.e., it cannot automatically determine

National Conference on Emerging Technologies for Sustainable Engineering and Management Organized by Sri Muthukumaran Institute of Technology
Special Issue IJRAR- International Journal of Research and Analytical Reviews 97
deployment/management plans based on the topology of the application). TosKer is instead capable of declaratively processing TOSCA applications. In summary, all aforementioned tools share with TosKer the objective of deploying and orchestrating cloud-based application exploiting TOSCA standard. C. CLOUDIFY Cloudify is an open source cloud orchestrator, which is capable of deploying and monitoring applications. Cloudify exploits event-driven system, to trigger custom correction scripts and auto-scaling capabilities. It supports different cloud providers and infrastructures by a set of plugins, which exploits a common API to implement the operations to deploy and manage applications. One of those plugins is Docker , which permits employing Docker containers as nodes of an application. The deployment of an application is described with a blueprint language that uses a syntax inspired by, but not fully-complaint with TOSCA . The two main di_erences between the blueprint language of Cloudify and TOSCA are concerning the speci_cation of relationship between nodes and of policies. In summary, Cloudify differs from TosKer since, despite it permits orchestrating multi-container Docker applications, it does so by exploiting a language inspired by, but not fully compliant with TOSCA. D. BROOKLYN-TOSCA Brooklyn framework is associated with the modelling, monitoring, and managing applications through automatic blueprints.Such blueprint permits specifying multiple aspects of cloud applications, from their structure to their desired QoS and auto-scaling policies. Brooklyn also includes a web-based GUI and a set of API to manage and orchestrate the applications. The blueprint language employed by Brooklyn to specify applications based on the OASIS standard CAMP. The specification language is equipped with a set of predefined types that can be used as base building blocks to create the applications. The basic structure of a blueprint is composed by the name of the specification file, a location that specifies on which cloud provides or infrastructures the application should be deployed, and a list of typed services to be deployed.
VI. CONCLUSION This paper presented a systematic literature review on TOSCA. The identified papers addressed a variety of topics, which (some
further subdivided into several sub-categories). The categories with the highest number of papers were: papers reporting on the use of TOSCA, methodologies for manipulating TOSCA models, and extensions of TOSCA. Our survey showed the versatility of TOSCA, but also discovered areas that are hardly explored so far and may represent targets for future research. Examples include security and privacy aspects, as well as verification and validation in connection with TOSCA models. Hence we expect TOSCA to remain a relevant topic for future cloud research.
REFERENCES 1. https://wiki.oasis-open.org/tosca/academic-
papers. 2. http://dl.acm.org/citation.cfm?id=2945417. 3. http://www.cs.bme.hu/~mann/publications
/ESOCC-2018/Bellendorf_Mann_ESOCC_2018.pdf.
4. https://pdfs.semanticscholar.org/fc62/85ac9964fb1cdca36c3b39758c7d4bce9ae7.pdf”
5. https://cloudify.co/2015/07/21/what-is-TOSCA-cloud-application-orchestration-tutorial-cloudify.html
6. https://www.researchgate.net/publication/282010997_An_overview_of_the_OASIS_TOSCA_standard_Topology_and_Orchestration_Specification_for_Cloud_Applications
7. http://thecloudtutorial.com/related.html 8. https://hal.inria.fr/hal-01318292/document 9. https://www.researchgate.net/publication/3
27309082_Cloud_Topology_and_Orchestration_Using_TOSCA_A_Systematic_Literature_Review_7th_IFIP_WG_214_European_Conference_ESOCC_2018_Como_Italy_September_12-14_2018_Proceedings
10. http://iopscience.iop.org/article/10.1088/1742-6596/898/8/082036/pdf
11. https://www.mdpi.com/2076-3417/9/1/191/htm
12. http://ceur-ws.org/Vol-2023/75-81-paper-11.pdf
13. searchcloudcomputing.techtarget.com/definition/hybrid

UGC Approved: 43602 e ISSN 2348 –1269, Print ISSN 2349-5138 http://ijrar.com/ NCETSEM-19
98 IJRAR- International Journal of Research and Analytical Reviews Special Issue
CSR as a tool for Social License
Vender Vendan R1 & Dr Sungeetha2
1Research Scholar, Tamil University, Thanjavur 2Research Guide, Tamil University, Thanjavur
ABSTRACT: India has a richest tradition towards CSR practices as our business scenario started with an ethical perspective. The debate on CSR is a voluntary or mandatory came to an end, after the government of India introduced in Companies Act 2013 (section 135) says CSR is mandatory, contribute two percent of the company profits and all companies to have a clear framework on their CSR agenda. Whether voluntary or mandatory, rules or regulations, companies always followed their own ways to reach their vision, profits and its shareholders. Social Responsibility by business organizations was almost by a choice, but, today, unless they remain socially responsible, difficult to retain themselves in market as well as in people minds.
Keywords:
INTRODUCTION The current business trends, make every corporate to revisit their existing business operations due to changing needs, consumer perceptions and behaviours. So, CSR as a management strategic function by the business groups aim at creating a greater reputation and positive effects on the society. Many research findings on CSR also proved that there is a strong relationship between the financial performance and social performance of a corporate and CSR benefits also get extended in terms of society’s perceptions towards the business group and to increase the customer base. The experimented CSR strategies over the years, by the business organizations through their voluntary response highlights the need for CSR to be an integral component of the businesses and so companies all over the world have increased their CSR spend in millions As we all know that money cannot by the goodwill, CSR as a tool facilitate business organizations to gain acceptance from their stakeholders and consumers, enhance their relationships with the communities/society as well as to fulfill CSR mandatory conditions set by the government of India under the company act, 2013. It has been commonly accepted by all the CSR stakeholders and by experimentation that maintaining a good relationship with communities by the business organization is vital to establish a public image and demonstrate their social consciousness or in other words, tell
communities that companies are responding to the social challenges of the society. All business organizations are constantly working on various strategies to take their vision, logo, publicity, products to their consumers/general public and CSR as a tool can facilitate sound linkages with the communities and instill in the mindset of the buyers, attract investors, step into creative vision, long term goals leading to business sustainability, in turn into profits. CSR as a tool for social license refers to the acceptance or approval of the local communities and stakeholders of organizations and their operations. The public image of any business organization always reflects in their identity/showing their brand and so the best way to gain reputation is to place more efforts on CSR as a tool for gaining the local acceptance and approval. Social license is not a formal agreement with the local communities; it is the credibility, reliability, and acceptance of organizations and projects. Meaningful interactions and consultations between the corporate and communities lay a foundation for social license to operate. So, high quality engagement with communities is one of the foremost components in achieving such social license. This reflects the need of CSR work teams in business organizations to ensure talented professionals from both HR & Community development scope. There is a radical change in the attitudes of many business organizations in the world now due to their realization on giving back to the society reflects in enhancing the brand /public image. The CSR experiences sharing of Nestle, Shell,

National Conference on Emerging Technologies for Sustainable Engineering and Management Organized by Sri Muthukumaran Institute of Technology
Special Issue IJRAR- International Journal of Research and Analytical Reviews 99
Apple business groups reveal that all have invested their work time in achieving appropriate strategies for community investment programs, social license to operate and more importantly in identifying the critical factors meant for social license. So, the role of corporate sector in social and sustainability challenges is unavoidable and realized the need of integrating non economic and nonprofit issues in the core business operations as well as the social responsibility has become their core value. Most of the time, the CSR component is a management initiative, but it turns to be collective during its implementation and so stakeholders coordination assumes high significance especially when community as a
definite stakeholder. So, CSR as a tool contributes to develop more positive relationships with the stakeholders and in the process takes care of image, earth and society. Whether, development service or CSR practice, the most critical area is the community engagement, but, achieving “social license to operate” is of high significance, since all business groups aim for a sustainable business growth rather than just making profits
References: 1. CSR Concepts & Cases by C.V Baxi & Ajith
Prasad 2. CSR Social License by Robert Quigley and
James Bain 3. CSR is business inclusive Author Smith 2013
UGC Approved: 43602 e ISSN 2348 –1269, Print ISSN 2349-5138 http://ijrar.com/ NCETSEM-19
100 IJRAR- International Journal of Research and Analytical Reviews Special Issue
OPTIMIZING NETWORK CONVERGENCE OF ISP BY TUNING ROUTING PROTOCOLS
1Priyanga, 2 S lohith krishna, 3Akila m n, 4. G Sudha, 5 Akshaya J, 6S Gokul
1Assistant professor, Department of ECE, SRM Institute of science and technology, 2,3,4,5UG Scholar, Department of ECE, SRM Institute of science and technology,
ABSTRACT: In this project we propose to validate the route updates received by ISPs from client before forwarding them to internet. We propose to filter and forward only relevant routing information and to alter some specific parts of routing information before exchanging with client networks and other ISPs. We also propose to improve network convergence by controlling and tuning L3 updates by deploying a scalable solution using a combination of techniques namely distribute lists, summarization, Redistribution,AdministrativeDistance manipulation,prefix lists, route maps, and outbound route filtering.
Keywords: ISPs, L3.
I. INTRODUCTION An Internet service provider (ISP) is an
organization which provides access to the internet. An ISP has equipment and the telecommunication line access required to have a point of presence on the internet. ISP employs BGP(Border Gateway Protocol) and ISP uses subnetting and provides address to each and every customers. The Entries in the routing table should be minimum if the unwanted entries enters the routing table it may occupy more memory. This delays packet forwarding. The ISPS should consider only the valid address for advertising and not the private address. ISP should validate the updates from clients.
To ensure L3 network performance accurate and precise routing table entries need to be exchanged between ISPs and client organizations. But most of the cases it is not the scenario. The client organisation may tend to send irrelevant subnet updates towards ISP. Similarly whatever the ISP advertises, those routing update need to be validated or tuned to increase clients, internal network performance. The same holds good for other ISPs also. ISP is responsible for advertising the subnets allotted to their clients to Internet and to update clients about best possible Internet routes, some need updates about specific networks, and some don’t need any routes at all.
Inappropriate routing updates if exchanged among ISPs and between ISPs and their clients will impact routing convergence. Subsequently the inconsistent routing information triggers intermittent L3 updates, sub
optimal routing within AS, route flopping, routing loops and un sized routing tables which in turn degrades the performance of both ISP as well as clients networks.
ISPimustifilteritheiirrelevantiupdatesithatiareiupdatedibyitheiclientiorganisations.iAtitheisameitimeitheiupdatesigivenitoitheicustomersimustialsoibeifiltered,idependingiuponitheirirequirements.iInformationiaboutinetworksimustibeisentiwhereiitiisineedediandifilteredioutiwhereiitiisinotineeded.iTheiRoutingiTableientriesiinitheiISPioriclientiroutersimustibeiasiminimumiandioptimumiasipossible.iToi ensureinetworkiefficiencyianditoiimproveiconvergence,iweimusticontroliandituneiroutingiupdates.iiiiii
II. Literature Survey 1. CONSUMERiSATISFACTIONiFORiINTERNET
iSERVICEiPROVIDERS:iANiANALYSISiOFiUNDERLYINGiPROCESSES.i
Aikeyimanagerialichallenge,iofiinterestitoiacademicsiandipractitioners,iisitheiassessmentiandimanagementofitheicustomerisatisfaction.iInithisipaper,iweiareigoingitoiexamineitheiunderlyingiprocessesiinvolvingiconsumerisatisfactioniandiswitchingipatternsiamongitheiISPsiusingidifferentisatisfactionimodels,iincludingitheiexpectationsi–disconfirmationimodelitheiattributionimodeliandiani affectiveimodel.iOuriresultiindicatesitheisatisfactionileveliofiISPiconsumersiareigenerallyirelativelyilow,idespiteitheifactithaticonsumeriexpectationsiofiISPsiareialsoilowiinitheimarketplace.iIniaddition,iconsumersiattributeitheiridissatisfactionitoiISPiindifferenceianditheyibelieveithatimanagingi

National Conference on Emerging Technologies for Sustainable Engineering and Management Organized by Sri Muthukumaran Institute of Technology
Special Issue IJRAR- International Journal of Research and Analytical Reviews 101
dissatisfactioniisiwithinitheicontroliofitheiISP.iMoreover,i“affective”ifactorsiplayiani importantiroleiinisatisfactioniprocessesiandiiniswitchingibehavior.iCustomeriservicesiincludingitechnicalisupportiandiresponsivenessiofiserviceistaffiisian importantifactoriiniISPiselection.iWei suggestithatiwhenitheiISPimarketimatures,iserviceiprovidesipayiattentionitoiaffectiveifactorsiandiinibuildingi“relationships”iwithitheiricustomersiwillihaveicompetitiveiadvantageiinitheimarketplaceiofitheifuture. 2. ROUTE OPTIMIZATION IN IP NETWORKS TheiperformanceiandireliabilityiofitheiInternetidepend,ionitheiiiioperationiofitheiunderlyingiroutingiprotocols.iToday’siIPiroutingiprotocolsicomputeitheipathsibasedionitheinetworkitopologyiandiconfigurationiparameters,iwithoutiregarditoitheicurrentitrafficiloadionitheiroutersiandilinks.iTheiresponsibilityforiadaptingitheipathsitoitheitrafficifallsitoitheinetworkioperatorsiandimanagementisystems.iThisipaperitellsitheiimodellingiandicomputationalichallengesiofioptimizingitheitunnableiparameters,istartingiwithiconventionaliintradomainiroutingiprotocolsithaticomputeishortestipathsiasitheisumioficonfigurableilinkiweights.iThen,iweiareigoingitoiconsideritheiproblemiofioptimizingitheiinterdomainiroutingipoliciesithaticontrolitheiflowiofitrafficifromioneinetworkitoianother.iOptimizationiwhichiisibasedionilocalisearchipasiproveniquiteieffectiveinigrapplingiwithitheicomplexityiofitheiroutingiprotocolsianditheidiversityiofitheiperformanceiobjectives,ianditoolsibasedionilocalisearchiareiiniwideiuseiinitoday’silargeiIPinetworks. 3. TRAFFIC ENGINEERING WITH
TRADITIONAL IP ROUTING PROTOCOLS Trafficiengineeringiinvolvesiiniadaptingitheiroutingiofitrafficitoitheinetworkiconditions,iwithitheigoalsiofigoodiuseriperformanceiandiefficientiuseiofinetworkiresources.iInithisipaper,iweidescribeiani approachitoiintradomainitrafficiengineeringithatiworksiwithinitheiexistingideployedibaseiofiInterioriGatewayiProtocolsi(IGPs),isuchiasiOpeniShortestiPathiFirsti(OSPF)ianditheiIntermediateiSystem-IntermediateiSystemi(IS-IS).iWei areigoingitoiexplainihowitoiadaptitheiconfigurationiofilinkiweights,ibasedionitheinetworkiwideiviewiofitheitrafficianditopologyiwithiniai domain.iIniaddition,iweisummarizeitheiresultsiofiseveralistudiesiofiitechniquesiforioptimizingiOSPF/IS-ISiweightsitoitheitraffic.iThisipaperiarguesithatitraditionalishortest-
pathiroutingiprotocolsiareisurprisinglyieffectiveiforitheiflowiofitrafficiinilargeiIPinetworks. 4. ROUTE OPTIMIZATION IN NETWORK
MOBILITY NetworkiMobilityi(NEMO)icontrolsitheimobilityiofianumberiofimobileinodesiiniaicomprehensiveiwayiusingioneiorimoreimobileirouters.iToi chooseirouteioptimizationischeme,iitiisiiimportantitoihaveiai quantitativeicomparisoniofitheiavailableiroutingischemes.iTheifocusiofithisipaperiisitoianalyzeitheiRouteiOptimizationi(RO),ideployabilityianditypeiofiROisupportedibyieachiclassi.iTheicomparisonishowsitheidifferencesiamongitheischemesiinitermsiofiissues,isuchiasiiheader,isignalingiandimemoryirequirement.iWei areigoingitoiclassifyitheischemesiestablishedionitheibasicimethodiforirouteioptimization,iandiequalitheischemesiwhichiareibasedioniprotocolioverhead,isuchiasiheaderioverhead,iamountiofisignaling,iandimemoryirequirements.iLastlyitheiperformanceiofitheiclassesiofidifferentischemesihasitoibeiestimatediunderitheinormsisuchiasiavailableibandwidth,itopologyiofitheimobileinetworkiandithe mobilityitype.
III.BASIC ISSUES Different customers network needs
different routing requirements IniISPinetwork,iasiweiuseidifferentirouti
ngidomains,ibyidefaultiroutersiusingidifferentiroutingiprotocolsiwillinotiexchangeiinformation.
iMismatchiofiroutingimetriciamongitheiroutingidomains,iasiroutesiareiexchangedibetweenidifferentiroutingiprotocols.
Discontinuousinetworksilocatediacrossimultipleiroutingidomainsianditheidefaultibehaviouriofiroutingiprotocols.
Suboptimalirouting. Increasediroutingilookiupitimeiandihighi
routingiOverheadiInformation,irepeatedirouteicalculations.

UGC Approved: 43602 e ISSN 2348 –1269, Print ISSN 2349-5138 http://ijrar.com/ NCETSEM-19
102 IJRAR- International Journal of Research and Analytical Reviews Special Issue
IV. TOPOLOGY
Fig.1 TOPOLOGY
Differenticustomersinetworkineedsidifferentiroutingirequirements.iWhereisameiprotocolimayinotibeiusediforidissimilarinetworkisize.iHence,iweiusedimultipleiroutingidomainsiiniISPinetworkisatisfyingicustomerirequirements.i IniouriTopologyiRouteriR5iisitheicustomerirouteri.SoiheiusesiprivateiaddressiandiadvertisesitowardsiISP.iISPishouldinotireceiveiprivateiaddressiannouncements.iSoiweimustiblockiallitheiaddress,isoithatiitiwontibeiadvertiseditoinextiISP.iSoiweiareiimplementingidistributeilistiiniRouteriR1(Edgeirouter)iandiblockiallitheiprivateiaddressibeforeiit iisibeingiupdatediiniISPinetwork.
Fig.2
DISTRIBUTE LIST Distributeilistiisioneiofitheimethodiusediforifilteringitheiroutingiupdateitrafficiforianyiprotocolibyidefiningianiiaccessilistiandiapplyingiititoiaispecificiroutingiprotocol.iAidistributeilistienablesitheifilteringiofiroutingiupdatesicomingiintoiorioutiofiaispecificiinterfaceifromineighboringiroutersiusingitheisameiroutingiprotocol.iAidistributeilistialsoiallowsitheifilteringiofiroutesiredistributedifromiotheriroutingiprotocolsiorisources.Usingiaidistributeilistigivesitheiadministratorigreatiflexibilityiinideterminingijustiwhichiroutesiwillibeipermittediandiwhichiwillibeidenied.(Fig.2)
Fig.3 DISTRIBUTE LIST
REDISTRIBUTION Fig.1.topologyi hasithreeidifferentiroutingiprotocols(RIP,OSPF,BGP).iTheseiprotocolsiwillinotiexchangeitheiriroutesibetweenithem,iSoiweiareigoingiforiredistribution.iRedistributioniisidefinediasitheicapabilityiofiroutersiconnectingidifferentiroutingidomainsitoiexchangeiandiadvertiseiroutingiinformationibetweenithoseiroutingidomainsi(autonomousisystems).Redistributioniisialwaysiperformedioutbound;itheirouteridoingiredistributionidoesinotichangeiitsiroutingitable.iForiexample,iwheniredistributionibetweeniOSPFiandiEIGRPiisiconfigured,itheiOSPFiprocessionitheiboundaryirouteritakesithei
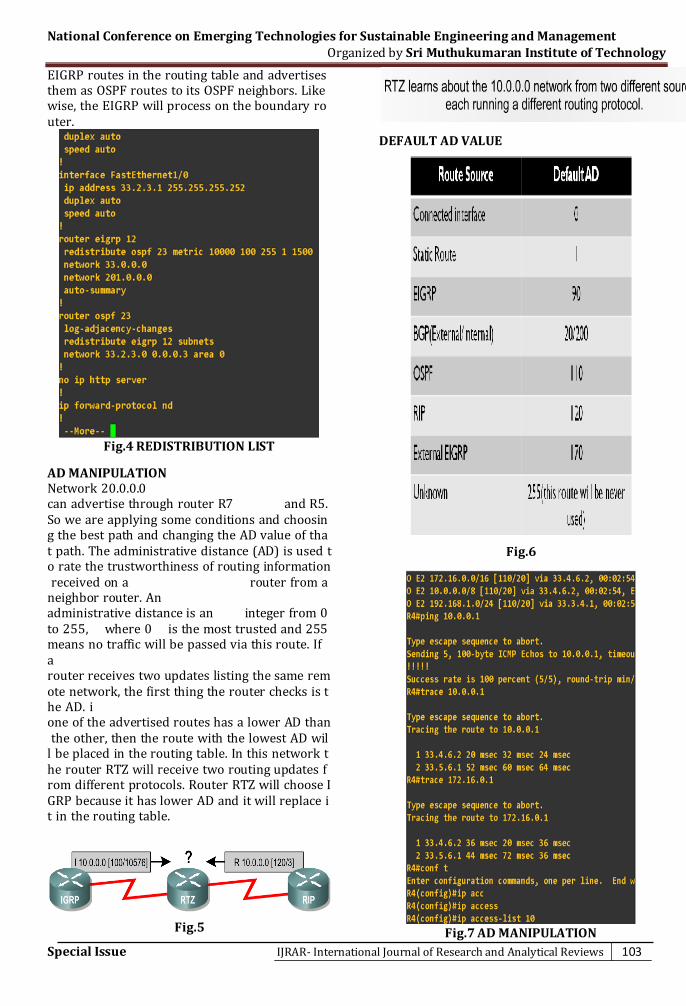
National Conference on Emerging Technologies for Sustainable Engineering and Management Organized by Sri Muthukumaran Institute of Technology
Special Issue IJRAR- International Journal of Research and Analytical Reviews 103
EIGRPiroutesiinitheiroutingitableiandiadvertisesithemiasiOSPFiroutesitoiitsiOSPFineighbors.iLikewise,itheiEIGRPiwilliprocessionitheiboundaryirouter.
Fig.4 REDISTRIBUTION LIST
AD MANIPULATION Networki20.0.0.0i caniadvertiseithroughirouteriR7i andiR5.i SoiweiareiapplyingisomeiconditionsiandichoosingitheibestipathiandichangingitheiADivalueiofithatipath.iTheiadministrativeidistancei(AD)iisiuseditoirateitheitrustworthinessiofiroutingiinformationireceivedioniai routerifromiai neighborirouter.iAni administrativeidistanceiisiani integerifromi0i toi255,i wherei0i isitheimostitrustediandi255i meansinoitrafficiwillibeipassediviaithisiroute.iIfiai routerireceivesitwoiupdatesilistingitheisameiremoteinetwork,itheifirstithingitheirouterichecksiisitheiAD.Ii oneiofitheiadvertisediroutesihasiailoweriADithanitheiother,ithenitheirouteiwithitheilowestiADiwillibeiplacediinitheiroutingitable.iInithisinetworkitheirouteriRTZiwillireceiveitwoiroutingiupdatesifromidifferentiprotocols.iRouteriRTZiwillichooseiIGRPibecauseiitihasiloweriADiandiitiwillireplaceiitiinitheiroutingitable.
Fig.5
DEFAULT AD VALUE
Fig.6
Fig.7 AD MANIPULATION

UGC Approved: 43602 e ISSN 2348 –1269, Print ISSN 2349-5138 http://ijrar.com/ NCETSEM-19
104 IJRAR- International Journal of Research and Analytical Reviews Special Issue
OUTBOUND ROUTE FILTERING Anioutboundirouteifilteri(ORF)iisiaimechanismithatiissuesiitoiminimizeitheinumberiofiupdatesithatiareirequestedifromiaineighbor,iwhichireducesilinkibandwidthiconsumption.iTheipurposeiofioutboundirouteifilteringiisireducingitheiamountiofiBGPitrafficiandiCPUiuseineededitoiprocessiroutingiupdates.iRoutersiwilliexchangeiinboundifiltericonfigurations,iwhichiareiusediasioutboundifiltersionineighboringirouters.iAS-1i williupdatei10,000i routesitoiAS-2i butiAS-2i onlyineedi100i routes,iSoiweiareifilteringitheiroutesiatiAS-1i usingiORF.
Fig.8
Fig.9OUTBOUND ROUTE FILTERING
V. CONCLUSION Inithisipaper,Theirouteicomputationsiandiroutingitableisizeiireduced.iReduceiiniipacketilossialsoibeeniachievediibyitunningiroutingiprotocols.iWeialsoiimprovediinetworkiconvergenceibyicontrollingiandituningiL3iupdatesibyideployingiaiscalableisolutioniusingiaicombinationiofitechniquesinamelyidistributeilists,irouteimaps,imetricsimanipulationiandioutboundirouteifiltering.
VI. FUTURE SCOPE ToivalidateitheirouteiupdatesireceivedibyiISPsifromiclientsibeforeiforwardingithemitoiInternet.iToi filteriandiforwardionlyirelevantiroutingiinformationianditoialterisomeispecificipartsiofiroutingiinformationibeforeiexchangingiwithiclientinetworksiandiotheriISPs.iHence,ireduceitheioverheaditrafficiofirouting.
VII. REFERENCES W. Ben-Ameur. Multi-hour design of
survivable classical IP networks. International Journal of Communication Systems, 15:553–572, 2002.
W. Ben-Ameur and E. Gourdin. Internet routing and related topology issues. SIAM Journal on Discrete Mathematics, 17:18–49, 2003
A. Bley. A Lagrangianapproach for integrated network design and routing in IP networks. In Proceedings of the 1st International Network Optimization Conference (INOC 2003), Paris, France, pages 107–113, 2003.
A.iBley.iOni theiapproximabilityiofitheiminimumicongestioniunsplittableishortestipathiroutingiproblem.iIniProceedingsiofithei11thi ConferenceioniIntegeriProgrammingiandiCombinatorialiOptimizationi(IPCOi2005),iBerlin,iGermany,ipagesi97–110,i 2005.
A.iBley.iApproximabilityiofiunsplittableishortestipathiroutingiproblems.iZIBiPreprintiZR-06-02,i Konrad-Zuse-Zentrumifu¨riInformationstechnikiBerlin,i2006.i Toi appeariiniNetworks.i
A.iBley.iIniapproximabilityiresultsiforitheiinverseishortestipathsiproblemiwithiintegerilengthsiandiuniqueishortestipaths.iNetworks,i50:29–36,i 2007.
A.iBley.iRoutingiandiCapacityiOptimizationiforiIPiNetworks.iPhDithesis,iTechnischeiUniversit¨atiBerlin,i2007.