international journal of water resources development inland waterways ... · international journal...
TRANSCRIPT

PLEASE SCROLL DOWN FOR ARTICLE
This article was downloaded by: [Tortajada, Cecilia]On: 13 December 2010Access details: Access Details: [subscription number 907435202]Publisher RoutledgeInforma Ltd Registered in England and Wales Registered Number: 1072954 Registered office: Mortimer House, 37-41 Mortimer Street, London W1T 3JH, UK
International Journal of Water Resources DevelopmentPublication details, including instructions for authors and subscription information:http://www.informaworld.com/smpp/title~content=t713426247
Inland waterways for transportation of agricultural, industrial and energyproductsAsit K. Biswasab
a President of the International Society for Ecological Modelling, b Director, Biswas & Associates,Oxford, England
To cite this Article Biswas, Asit K.(1987) 'Inland waterways for transportation of agricultural, industrial and energyproducts', International Journal of Water Resources Development, 3: 1, 9 — 22To link to this Article: DOI: 10.1080/07900628708722329URL: http://dx.doi.org/10.1080/07900628708722329
Full terms and conditions of use: http://www.informaworld.com/terms-and-conditions-of-access.pdf
This article may be used for research, teaching and private study purposes. Any substantial orsystematic reproduction, re-distribution, re-selling, loan or sub-licensing, systematic supply ordistribution in any form to anyone is expressly forbidden.
The publisher does not give any warranty express or implied or make any representation that the contentswill be complete or accurate or up to date. The accuracy of any instructions, formulae and drug dosesshould be independently verified with primary sources. The publisher shall not be liable for any loss,actions, claims, proceedings, demand or costs or damages whatsoever or howsoever caused arising directlyor indirectly in connection with or arising out of the use of this material.

Inland waterways fortransportation of agricultural,industrial and energy products
Asit K. Biswas
This paper examines the use of inland waterways throughout the world, particularlyfor the transportation of agricultural, industrial and energy products. It is found thatthere are great variations in their importance from one country to another. Thisdiscrepancy can be explained to a certain extent by geographical conditions, butlack of realization of the potential benefits to the national economies also plays animportant role. Some countries - especially the oil-importing developing countries- are now making determined efforts to expand and modernize their waterwaystransportation systems, but generally there is a lack of national master plans fortransportation, including inland waterways, so their development is still taking placeon a piecemeal basis.
Inland bodies of water have been used as importantcorridors of transportation in different parts of theworld from prehistoric times. The important ancientcivilizations developed along the banks of major riv-ers like the Nile, Indus, Euphrates and Tigris becausewater could be used not only for agricultural anddrinking purposes but also for transportation of goodsand people. As civilization progressed and newtechnologies were developed, rivers were madenavigable and canals were constructed to provide anintricate system of waterway networks through whichagricultural, industrial, mineral and energy productscould be transported. Many of the centres of indust-rial activities in Europe during the Industrial Revolu-tion developed along the various rivers, since it
Asit K. Biswas is President of the International Society forEcological Modelling, and Director, Biswas & Associates,76 Woodstock Close, Oxford, England.
Grateful acknowledgement is made to Mr K.K. Framji, ManagingDirector, Consulting Engineering Services (India) PrivateLtd, New Delhi; Mr Peter J. Reynolds, President, InternationalWater Resources Association, Ottawa; and Lt General J.W.Morris (ret), President, National Waterways Foundation,Arlington, VA, for providing some of the data on which this paperis based.
provided easy availability of water for industrial pro-cesses, discharge of waste products to the rivers atminimal costs, and transportation of raw materials tofactories and manufactured goods to customers.
Over the past several centuries, important water-borne inland transportation networks havedeveloped along major rivers, including theirtributaries, and lakes like the Ganges, Brahmaputra,Narmada, Chang Jiang and Mekong in Asia; the Nilein Africa; the Rhine, Main, Seine, Danube, Elba,Volga and Don in Europe; and the Mississippi and theGreat Lakes in North America.
Naturally as technological and economic con-ditions have changed, the importance of inland trans-portation in specific countries has changed as well.The advent of air transportation and the constructionof extensive highway and railway systems have some-times reduced the importance of inland waterways.However, the increase in energy prices has giveninland waterways an added advantage during the pastdecade, and many countries — especially the oil-importing developing countries that have potentialsfor this type of transport - are now making a deter-mined effort to expand and modernize their existingwaterways transportation.
It should be noted that inland waterways transport-
0790-0627/87/010009-14$3.00 © 1987 Butterworth & Co (Publishers) Ltd
Downloaded By: [Tortajada, Cecilia] At: 18:28 13 December 2010
Inland waterways for transportation of agricultural, industrial and energy products: A. K. Biswas
ation, coastal and ocean shipping are often inter-related. Sometimes transportation of goods beginsand/or ends in inland waterways, but the rest of thejourney could entail coastal and ocean shipping.Similarly there are complementary relationships be-tween road and rail transportation and waterway car-riage of goods. The main focus of this paper, however,is on the transportation of agricultural, industrial andenergy products through inland waterways.
Major considerations for inland waterwaysAs is to be expected, the major considerations for theuse of inland waterways, rather than other forms oftransportation, often vary from country to country,depending on economic, technical, social and politi-cal considerations. While certain considerations likecost-effectiveness or technical feasibility are univer-sal, the priorities accorded to these factors, comparedto other factors, could vary from one country toanother, and also from one time period to another. Incontrast, other considerations like employmentpotential often have different policy implications,depending on the countries concerned. Thus, forcountries like Bangladesh, India and any otherdeveloping countries that have serious employmentand underemployment problems, labour-intensiveprocesses may often be preferred. In contrast, indust-rialized countries often prefer highly mechanized,automated and thus capital-intensive processes.
There are many major considerations for usinginland waterways, and some of these issues are inter-related. Because of space limitations, only the follow-ing five major considerations will be briefly discussedhere:
(i) economic efficiency;(ii) employment potential;
(iii) energy use;(iv) environmental factors; and(v) socioeconomic requirements.
(i) Economic efficiencyIt is a difficult task to determine the economic effi-ciency of any process, and inland waterways transpor-tation (IWT) is no exception. Three factors need to beconsidered for determining total costs - capital,labour and operating expenses - which, when com-bined, form an operating system. The productivity ofa system, however, depends on the system used (egeconomies of scale for a barge), the extent ofmechanization, the use of the latest technology andoverall management. For example, labour cost reduc-tions may often represent higher capital costs formechanization. From a purely economic viewpoint,
195
175-
inCO
- 150
_oau8. 125
Class 1 railroads +4.8%/yr
Waterways and harbours+3.7%/yr -f-
o
100
H// 1
• ~ * /
~~—~yy-f'
1
// Intercity trucking
1
+3.2%/yr
1962 64 66 68 70 72 74 76 781979
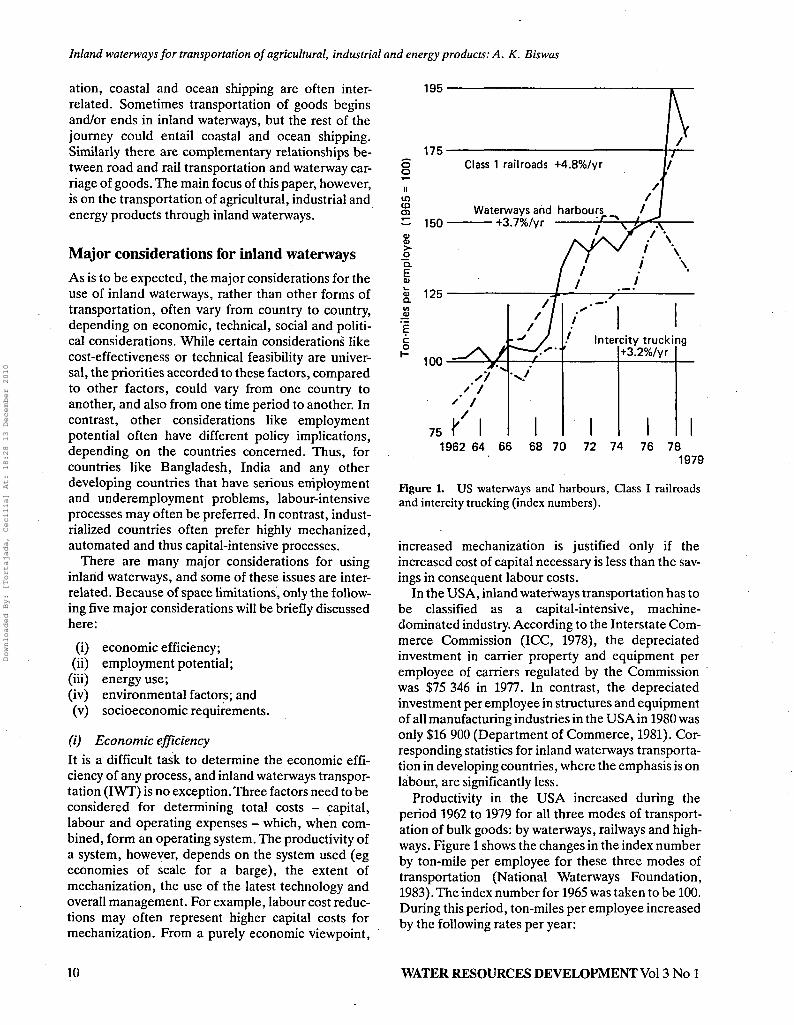
Figure 1. US waterways and harbours, Class I railroadsand intercity trucking (index numbers).
increased mechanization is justified only if theincreased cost of capital necessary is less than the sav-ings in consequent labour costs.
In the USA, inland waterways transportation has tobe classified as a capital-intensive, machine-dominated industry. According to the Interstate Com-merce Commission (ICC, 1978), the depreciatedinvestment in carrier property and equipment peremployee of carriers regulated by the Commissionwas $75 346 in 1977. In contrast, the depreciatedinvestment per employee in structures and equipmentof all manufacturing industries in the USA in 1980 wasonly $16 900 (Department of Commerce, 1981). Cor-responding statistics for inland waterways transporta-tion in developing countries, where the emphasis is onlabour, are significantly less.
Productivity in the USA increased during theperiod 1962 to 1979 for all three modes of transport-ation of bulk goods: by waterways, railways and high-ways. Figure 1 shows the changes in the index numberby ton-mile per employee for these three modes oftransportation (National Waterways Foundation,1983). The index number for 1965 was taken to be 100.During this period, ton-miles per employee increasedby the following rates per year:
10 WATER RESOURCES DEVELOPMENT Vol 3 No 1
Downloaded By: [Tortajada, Cecilia] At: 18:28 13 December 2010

Io
co
Inland waterways for transportation of agricultural, industrial and energy products: A. K. Biswas
bly one principal reason for the decline in output perman-hour from 1973 onwards was increasing energycosts. While inland waterways use much less energyper ton-mile, when compared to other modes of trans-portation which will be discussed later, its otherexpenses and revenues per ton-mile are also low. As ageneral rule, IWT's energy costs account for a higherpercentage of overall operating expenses than in thecase of railways. For example, the energy costs ofICC-regulated carriers in the Mississippi riveraccounted for 20.0% of their operating costs in 1979;the corresponding figure for the Class I railroads wasonly 9.9%.
For a developing country like India, analyses car-ried out by the National Transport Policy Committee(1980) of the Government of India indicate that thecost of operation of inland waterways transportation,computed for a 500-tonne self-propelled unit workingat 75% load factor working for 300 days a year, is sig-nificantly lower than rail and road transportation ofbulk products like coal and fertilizer. The cost advan-tages of IWT become even more favourable whenlarger-size vessels are used. For example, for a 1500-tonne vessel operating costs are less than half of therail transportation costs and less than one third of theroad transportation costs. Comparative estimates areshown in Table 1.
It should be noted that the intermodal cost com-parison shown in Table 1 is valid for IWT for directmovement of cargo from one waterfront terminal toanother. However, if multimodal movement and addi-tional transshipment costs for IWT for surface trans-portation are considered, it was found that small-size,500-tonne barge operations lost their cost advantageover railways, while 1000- and 1500-tonne bargesmaintained their cost advantages over railways, andeven more over roads.
Intercomparison of actual transportation costs bydifferent modes of transportation is not easy underthe best of circumstances, because of the differentprocesses involved, the nature of government policiestowards different modes of transportation, pricingpolicies and subsidies. For example, costs for road-ways are not fully paid by roadway operators (roadsare generally constructed and maintained by federal,
8.0
7.5 —7 n
6.5
5.5
r n
4.0 -4-
3.5
3.0
2.5
2.0
1.5
n ^ — -
n n
i/
J V\
\/
ICC-regulated carriers by water,Mississippi ri\ er and tributa
Class 1 railroads, USA
11
— •
11
— - — •
I1
les
— ••
11
1966 1968 1970 1972 1974 1976 19781979
Figure 2. ICC-regulated carriers by water - Mississippiriver and tributaries - and Class I railroads, USA (ton-milesper man-hour).
Class I railroads: 4.8%Waterways and harbours: 3.7%Intercity trucking: 3.2%
Figure 2 shows ton-miles carried per man-hour bythe ICC-regulated carriers on the Mississippi riverand its tributaries and Class I railroads (NationalWaterways Foundation, 1983). It should be pointedout that important differences in the service charac-teristics and goods composition of the two modesaccount for a substantial part of the differences in-dicated by the two graphs.
Figure 2 also indicates that output per man-hourcontinued to increase until 1972: in fact outputincreased by 9.0% per year from 1964 (the year theICC started to report these statistics) to 1972. Proba-
Table 1. Operating costs for railways, road and IWT in paise* per tonne-km.
Distance(km)
50100300
Railways, diesei operation,single line, wagon load movementCoal Fertilizer
23.614.68.6
23.414.38.4
Road transportationCoal Fertilizer
27.021.015.0
35.017.419.0
IWT for self-propelled vessels,500 tonne 1000 tonne
13.79.16.1
10.36.54.1
75% load factor1500 tonne
9.45.83.4
Source: National Transport Policy Committee (1980).a 100 paise = 1 Rupee; $1.00 = 13 Rupees.
WATER RESOURCES DEVELOPMENT Vol 3 No 1 11
Downloaded By: [Tortajada, Cecilia] At: 18:28 13 December 2010

Inland waterways for transportation of agricultural, industrial and energy products: A. K. Biswas
state and local governments, who in turn seek to raisethe necessary funds through taxation), but railwaysown and operate their tracks. IWTtrack costs are min-imal, except when major locks need to be con-structed. To some extent the marginal cost conceptmay resolve this problem, but even then it is not poss-ible to trace each element of cost to particular kinds ofservices or quantities of output produced by differentmodes of transport.
(ii) Employment potentialFor many developing countries that are facing seriousunemployment and underemployment problems, theobjective of employment creation is often an impor-tant component of the national transportation policy.However, maximization of employment generation isseldom the most important criterion for determiningtransportation modes. The sole use of the employ-ment maximization criterion could very often lead toa transportation mode which is most labour-intensiveper unit of investment but inefficient in terms of cost,time and service. Hence, in an interdependenteconomy, where transportation plays a crucial part,such an inefficient transport system could well jeopar-dize the overall employment level of the country by itsfailure to provide a cost-effective and timely service.Accordingly, the objective of employment creationneeds to be analysed carefully by its impact on theeconomy as a whole.
Creation of employment, both direct and indirect,by various modes of transportation is a subject thathas received inadequate attention in most developingcountries thus far. Direct employment is created bythe construction, operation and maintenance of thetransportation system. Indirect employment isinduced by a chain of forward and backward linkages.Backward linkages include employment generateddue to the inputs necessary (materials and services)for the construction and operation of the system. For-ward linkages include employments due to loading,unloading, service stations, wayside amenities, etc.
While it is comparatively easy to identify directemployments created by IWT, it is difficult to enumer-ate indirect employment creation with any significantdegree of confidence, since both backward and for-ward linkages become weaker and weaker as onemoves away from the industry where direct employ-ments are created.
The National Transport Policy Committee (1980)estimated employment intensity of IWT for India;their results are shown in Table 2 for both passengerand freight services. In addition to the 33.59 person-years of employment indicated in the table, it was esti-mated that another 13.2 person-years of employmentwere generated for the construction and maintenance
Table 2. Estimated employment intensity in inland waterwaystransportation.
Activity
Passenger transportPublic sector
MechanizedPrivate sector
MechanizedCountry crafts
Freight transportMechanizedNon-mechanized
BoatbuildingMechanizedNon-mechanized
Indirect employment3
Overall average
Persons employed per RslOO 000of investment
9.2
2.958.8
1.420.8
14.8NA
160
33.59
Source: National Transport Policy Committee (1980)."Includes freight handling, forwarding and clearing services.
of navigational channel and terminal facilities perRslOO 000 of investment.
Analysis by the Indian National Transport PolicyCommittee (1980) indicated that IWT provided ahigher employment coefficient per unit of investmentthan any other mode of transportation. This compara-tive analysis is shown in Table 3. Interestingly, thenext best form of transportation was found to be
Table 3. Comparative employment intensity in different modes oftransport, India, 1977-78.
Transport mode
Inland water transportOperationsDevelopment of navigational
channel
Road construction andmaintenance
Road transport operationBullock-cartsThree-wheelersTrucksBusesTaxisVehicle production (chassis)
Coastal shippingSailing vesselsOther coastal shipping
Railways
Airtransport
Employment in person-years perRslOO 000 of investmentDirect
33.59
13.20
15.0
27.013.4211.157.752.761.78
20.02.40
3.64
0.72
Indirect
12.50
3.735.801.510.95
0.66
0.25
Total
33.59
13.20
27.50
27.017.1516.959.263.711.78
20.02.40
4.30
0.97
12 WATER RESOURCES DEVELOPMENT Vol 3 No 1
Downloaded By: [Tortajada, Cecilia] At: 18:28 13 December 2010
Inland waterways for transportation of agricultural, industrial and energy products: A. K. Biswas
bullock-carts. The committee noted that both theseforms of transportation required low capital invest-ment but were slow-moving and can be used forspecific cases and areas.
(Hi) Energy useEnergy use by different modes of transportation hasbecome an important criterion since 1972. Not only isthe cost of energy used an issue but also the problemof the impact of imports of energy material on a coun-try's balance of payments has equally become impor-tant, especially for oil-importing developing coun-tries.
As far as transportation of bulk products is con-cerned, IWT is comparable more with railways andpipelines, since the uses of air cargo and roadways arenot that relevant. In the USA, combined energy useby IWT, railways and pipelines in 1979 accounted foronly 3.2% of the national consumption of petroleumfuels and was equivalent to only 1.5% of total energyconsumption. These three modes of transportation,however, carried 80.4% of all the intercity ton-milesof freight (Transportation Association of America,1981).
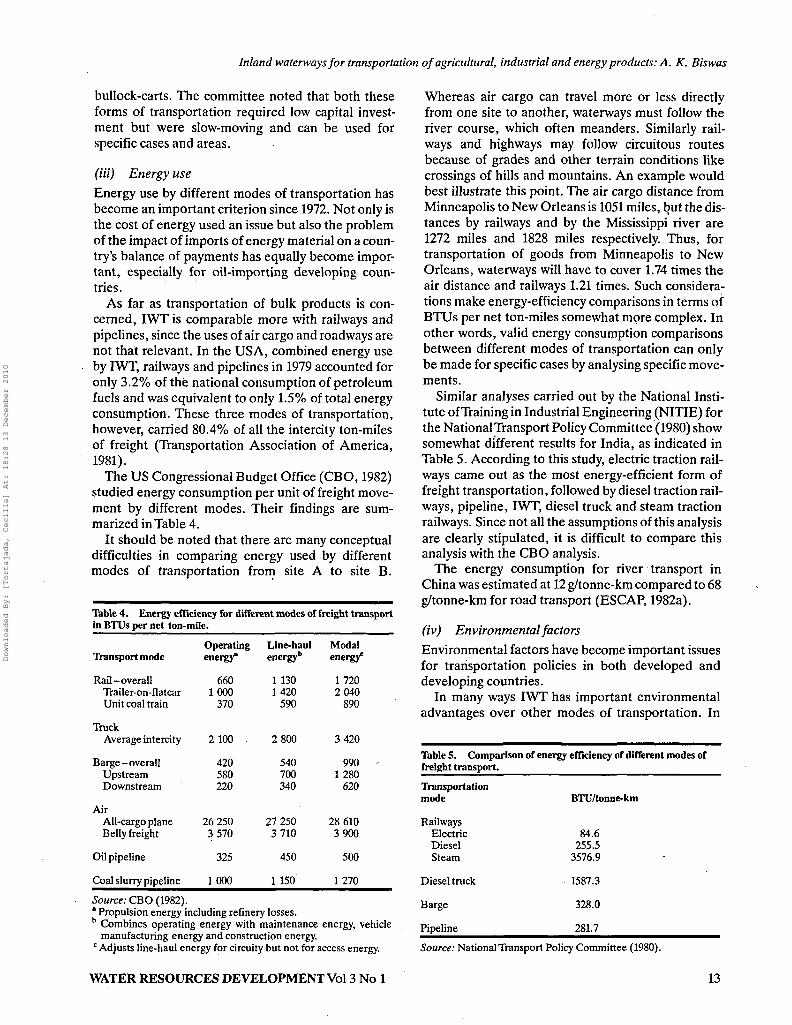
The US Congressional Budget Office (CBO, 1982)studied energy consumption per unit of freight move-ment by different modes. Their findings are sum-marized in Table 4.
It should be noted that there are many conceptualdifficulties in comparing energy used by differentmodes of transportation from site A to site B.
Table 4. Energy efficiency for different modes of freight transportin BTUs per net ton-mile.
Transport mode
Rail-overallTrailer-on-flatcarUnit coal train
Operating Line-haul Modalenergy* energy11 energy*
6601000
370
TruckAverage intercity 2 100
Barge-overallUpstreamDownstream
Air
420580220
All-cargo plane 26 250Belly freight 3 570
1 1301420
590
2 800
540700340
27 2503 710
Oil pipeline
Coal slurry pipeline
325 450
1 000 1 150
17202 040
890
3 420
9901280
620
28 6103 900
500
1 270
Source: CBO (1982).a Propulsion energy including refinery losses.b Combines operating energy with maintenance energy, vehicle
manufacturing energy and construction energy.c Adjusts line-haul energy for circuity but not for access energy.
Whereas air cargo can travel more or less directlyfrom one site to another, waterways must follow theriver course, which often meanders. Similarly rail-ways and highways may follow circuitous routesbecause of grades and other terrain conditions likecrossings of hills and mountains. An example wouldbest illustrate this point. The air cargo distance fromMinneapolis to New Orleans is 1051 miles, but the dis-tances by railways and by the Mississippi river are1272 miles and 1828 miles respectively. Thus, fortransportation of goods from Minneapolis to NewOrleans, waterways will have to cover 1.74 times theair distance and railways 1.21 times. Such considera-tions make energy-efficiency comparisons in terms ofBTUs per net ton-miles somewhat more complex. Inother words, valid energy consumption comparisonsbetween different modes of transportation can onlybe made for specific cases by analysing specific move-ments.
Similar analyses carried out by the National Insti-tute of Training in Industrial Engineering (NITIE) forthe National Transport Policy Committee (1980) showsomewhat different results for India, as indicated inTable 5. According to this study, electric traction rail-ways came out as the most energy-efficient form offreight transportation, followed by diesel traction rail-ways, pipeline, IWT, diesel truck and steam tractionrailways. Since not all the assumptions of this analysisare clearly stipulated, it is difficult to compare thisanalysis with the CBO analysis.
The energy consumption for river transport inChina was estimated at 12 g/tonne-km compared to 68g/tonne-km for road transport (ESCAP, 1982a).
(iv) Environmental factorsEnvironmental factors have become important issuesfor transportation policies in both developed anddeveloping countries.
In many ways IWT has important environmentaladvantages over other modes of transportation. In
Table 5. Comparison of energy efficiency of different modes offreight transport.
Transportationmode
RailwaysElectricDieselSteam
Diesel truck
Barge
Pipeline
BTU/tonne-km
84.6255.5
3576.9
1587.3
328.0
281.7Source: National Transport Policy Committee (1980).
WATER RESOURCES DEVELOPMENT Vol 3 No 1 13
Downloaded By: [Tortajada, Cecilia] At: 18:28 13 December 2010

Inland waterways for transportation of agricultural, industrial and energy products: A. K. Biswas
the important area of land use, requirements for IWTare minimal since, in contrast to railways and high-ways, no additional land is necessary for tracks androads because waterways already exist. Similarly,noise and vibrations are almost non-existent for IWT,but they are important considerations for other formsof transport, except for pipelines. Pipelines in certaininstances have contributed to difficulties in terms ofthe migration of animals and also for aestheticreasons.
Probably the most important environmental con-siderations for IWT are the problem of oil spills andspills of hazardous substances. In this regard, it is use-ful to review potential risks due to spills of hazardoussubstances as reported in the USA. These are shownin Table 6. The study concluded that 'For this relativesafety analysis, rail movements are found to be themost hazardous, in regard to human exposure index,with little difference in the safety of barges and trucks... Expected property damage is about equally low forthe barge and truck modes and somewhat higher forrail' (National Waterways Foundation, 1983).
Three other environmental factors that need to beconsidered are the impacts on water quality, bank ero-sion, and safe disposal of dredged material. In termsof water quality, IWT contributes to some deteriora-tion in terms of disposal of organic wastes (human andotherwise), hydrocarbons and other foreign sub-stances and turbidity. Organic wastes are seldom amajor problem: it is normally localized and within theassimilative capacity of waterways. The issue of oilspills and other chemical substances has been discus-sed earlier. Safe disposal of dredging spoils and aqua-tic weeds seldom presents a serious problem, if plan-ned properly. This, however, does not mean theseproblems should be neglected. For example, inBangladesh alone nearly 1.0 million cubic yards ofmaintenance dredging and about 2.6 million cubicyards of capital dredging are carried out annually.
Table 6. Risks in annual expected number of people exposed ifeach chemical were shipped entirely by one mode.
Expected number of people exposed
Urban Rural
ChemicalsStyreneAcrylonitrileSulphuric acidLiquid chlorineCaustic sodaBenzeneMethanolEthylene glycolLiquid ammoniaSugar
Barge0.0280.008
00.280
00.0120.060
00.017
0
Rail0.7200.1600.0030.4900.0380.0480.6000.0060.120
0
Barge0.0080.004
00.120
00
0.0100
0.0040
Rail0.1400.0160.0030.1300.003
00.1200.0040.040
0
Source: Arthur D. Little, as reported by National Waterways Foun-dation (1983).
However, no serious environmental problem hasbeen reported thus far.
IWT does not appear to have any noticeable impacton wildlife, including waterfowls.
(v) Socioeconomic requirementsThere are some important socioeconomic require-ments, in addition to those discussed earlier, for IWT.In developing countries, where most of the peoplelive in rural areas, transportation is an important con-sideration for development. For example, as theNational Transport Policy Committee (1980) haspointed out, out of a total of 575 936 villages in India,407 297 are still to be connected by all-weather roads.For many of these villages, IWT is an important modeof transport. Similarly, in Bangladesh about 65% offreight traffic and 38% of passenger traffic is carriedby IWT; the rest is carried by roads and railways(ESCAP, 1982a). Also, in the Jiangsu and Guandongprovinces of China, IWT is the main mode of trans-port and accounts for more than 60% of the total traf-fic volume carried by all modes of transport. Underthese conditions, IWT fulfils a very importantsocioeconomic need.
Present status of inland water transportAs might be expected, the recent rates of growth ofinland water transport in different parts of the worldhave not been uniform. The growth rates have notbeen similar even within a specific region. For exam-ple, in Asia, cargo handled by inland waterwaysincreased by 12% in China in 1982, and by 9.1% inBurma during 1982-83. In contrast, cargo handled inBangladesh declined by 4% during 1982-83 (ESCAP,1984).
The present status of inland water transport inthree important regions - Asia, Europe and NorthAmerica - will be briefly discussed here.
AsiaInland waterways are an important means of transpor-tation and communication for a significant percen-tage of people in Asia, especially those living in riverbasins and deltaic areas. Countries like Bangladeshand Thailand have always relied on transportationthrough their rivers which cover almost the entirelength of the countries from north to south. The statusof inland water transport in four Asian countries willbe discussed.
(a) Bangladesh. Inland water transportation plays amajor part in the economy of Bangladesh. Becausethe country is flat and low-lying, and approximately
14 WATER RESOURCES DEVELOPMENT Vol 3 No 1
Downloaded By: [Tortajada, Cecilia] At: 18:28 13 December 2010

Inland waterways for transportation of agricultural, industrial and energy products: A. K. Biswas
one third of it is flooded for various periods every yearduring the monsoon season, navigation is an essentialmode of transportation. The country has 15 000 milesof waterways, of which 5 240 miles are navigable dur-ing the monsoon season and 3 200 miles during thedry season. The three major rivers - Ganges,Brahmaputra and Meghna -carry an annual sedimentload of some 2.4 billion tons, and thus Bangladesh
, Inland Water Transport Authority (BIWTA) has toconduct nearly 1.0 million cubic yards of maintenancedredging and 2.6 million cubic yards of capital dredg-ing.
Currently IWT accounts for nearly 65% of thecountry's freight traffic and 38% of passenger traffic;the rest is carried by roads and railways (see Table 7,which clearly indicates the importance of the privatesector in IWT).
In spite of the importance of IWT, navigation hasdeclined in Bangladesh in recent years. For example,the length of waterways with 6 ft draft decreased from2270 miles in 1973 to only 840 miles in 1981. Unstableriver banks, a sharp reduction of channel depth in thelow-water season, a high rate of siltation, inadequatechannel markings, a lack of ports, substandard berth-ing facilities, a lack of telecommunication networksand a shortage of technical and managerial personnelhave hindered further increases in IWT. A five-yearplan has now been drawn up to resolve these prob-lems. The budget of BIWTA for the fiscal year 1982-83 for the development of this sector was 50% higherthan the allocation of the previous year.
(b) China. The total length of inland waterways inChina is 430 000 km (ESCAP, 1982a). The totallength of navigable waterways, according to a 1980survey, was 107 829 km, which was nearly double thelength of only 30 years earlier. The Chang Jiang(Yangtze) is the longest river in China, and flows atotal distance of 6300 km. The Chang Jiang system(the river and its 700 tributaries) constitutes the mostimportant navigable system of waterways in China - atotal of some 70 000 km. Since the system is exten-sively connected to many other modes of transport -railways, highways, airports, sea, lakes and canals-itprovides the very basis of the most extensive networkof transportation in China. Once the present plan of
Table 7. Passengers and cargoes carried by inland waterways inBangladesh.
Passengers (millions)Cargo (million
metric tons)
1975
Public
1.55
1.31
Private
36.68
1.56
1977-78
Public
2.00
1.59
Private
41.21
2.10
south to north water transfer from the Chiang Jiang iscompleted, the navigation system will be furtherincreased and improved (Biswas et al, 1983). TheChang Jiang Shipping Administration moved 48 mill-ion metric tons of cargo and 23 million passengers in1980.
The Pearl river (Zhu Jiang) and its 998 navigablewaterways form the second most important naviga-tion system in China after the Chang Jiang system.Formed by the confluence of three rivers, West river(Xi Jiang), North river (Bei Jiang) and East river(Dong Jiang), its navigational potentials are yet to befully developed. The delta of the Pearl river iscrisscrossed by some 823 branches and tributaries(ESCAP, 1982a), and has a total navigable length of5332 km. The Pearl river has eight outlets to the SouthChina Sea, and two of these outlets have an annualtraffic volume of more than 5 million metric tons.
The 1747 km long Grand Canal is another impor-tant inland waterway that connects Beijing in thenorth to Hangzhou in the south. The traffic is veryheavy in the southern part of the canal, and signallights had to be installed at some sections to providebetter traffic control. The traffic volume in 1979 was36 million metric tons.
China currently has over 100 river ports which havean annual cargo-handling capacity of over one millionmetric tons. Another 200 ports have an annual cargo-handling capacity of over 100 000 metric tons. Nan-jing and Wuhan are the two biggest ports, with annualcapacities exceeding 12 and 10 million metric tonsrespectively. The overall throughput capacity hasincreased more than 19 times since 1979 (ESCAP,1982a).
Both passengers and cargo carried by IWT haveincreased consistently in China in recent years as fol-lows:
Passengers carried (millions)Cargo carried (million tons)
1975207.16288.42
1977221.29317.22
1980250.00330.00
This general discussion, however, does not indicatethe importance of IWT in certain Chinese provinceslike Jiangsu and Guangdong, where this mode oftransportation accounted for more than 60% of trafficvolume by all modes of transport.
During the recent past, the total length of navigablewaterways has decreased significantly in China sinceinsufficient attention was given to navigation duringwater resources development, which contributed to theblocking of navigation in many waterways. However,the Government of China currently considers nav-igation to be strategically important, since one fifthof total national freight is transported via inland water-ways. A long-term plan to develop more navigable
WATER RESOURCES DEVELOPMENT Vol 3 No 1 15
Downloaded By: [Tortajada, Cecilia] At: 18:28 13 December 2010

Inland waterways for transportation of agricultural, industrial and energy products: A. K. Biswas
waterways and the modernization and extensionof river ports have already been approved (Biswas etal, 1983). It is expected that waterways traffic will bedouble the present level by 1990.
(c) India. With a coastline of 5660 km, 178 ports (10major, 23 intermediate and 136 minor) serving sevenprovinces and two union territories, and navigableinland waterways extending over 14 500 km, thepotential for exploiting IWTin India is immense. Theimmediate hinterland for the coastal trade alone cov-ers an area over 400 000 km2 and some 92 millionpeople. In spite of this potential, cargo shipped bycoastal transportation increased from 1951 to 1962,but thereafter has continued to decline progressively.
IWT has started to receive more attention in Indiathan ever before not only because of increasing pres-sure on the already capacity-constrained rail and roadtransport systems but also due to economics, espe-cially energy as discussed earlier. Currently most ofthe inland waterways in the country suffer from navi-gational constraints like shallow water and narrowwidth during dry seasons, and bank erosion and silta-tion. Because of these constraints, only about 5200km of major rivers and 485 km of canals can be usedby mechanized drafts.
IWT is an economically suitable mode of transportin India for high-volume, low-value and non-perisha-ble commodities like foodgrains, coal, iron ore, otherminerals, fertilizers, petroleum products, salt, build-ing materials and iron and steel. Goa accounted forthe largest proportion of total originating traffic in1976-77, including 3.924 million tonnes of iron ore(176.6 million tonne-km of traffic) and 254 000 tonnesof sea sand (7.62 million tonne-km). No accurate esti-mates of total bulk transportation by inland water-ways in India are available at present.
Great potential exists for IWT for the movement ofbulk commodities in the coastal belt and the riverinestates of Uttar Pradesh, Bihar, West Bengal, Assam,Orissa, Andhra Pradesh, Kerala and Goa (a union ter-ritory). The present consensus is that for the develop-ment of IWT the Ganges-Bhagirathi-Hooghly riversystem, Brahmaputra, Sundarbans, Narmada,Mahanadi, Tapti, Godavari, Krishna, Mandovi andZuvari river systems and the west coast canal systemin Kerala offer potential. These waterways are beingrecommended for declaration as National Waterwaysso that an integrated development of IWT could betaken up under one unified authority at the nationallevel.
Notwithstanding the IWT and coastal shippingpotential and the advantages offered, these modespresently play an insignificant role in the Indian trans*portation system. The traffic carried by these modes
in 1980 was only 0.5% in terms of tonne-km of totaltraffic moved in the country. IWT has also suffereddue to the withdrawal of large supplies of water forirrigation, an essential requirement for increasingfood production, but which has resulted in reducedlengths of navigable stretches as well as reduced timeperiods within which the rivers are navigable. In addi-tion, the limited spatial accessibility of the navig-able waterways makes multimodal movement inevit- •able resulting in increasing transport costs.
Hardly any comprehensive study of IWT traffic atthe national level has been conducted so far. A studyby the Indian Planning Commission in 1981 provideda perspective for transportation of coal by IWT andcoastal shipping. The study identified IWT access formovement of coal from the Assam coalfield on theBurhi-Dehing river, the Bengal-Bihar coal belt, theRajmahal coalfield on the river Ganges, the Raniganjcoalfield through the extension of Durgapur Barragelinking with the DVC canal, the Singrauli coalfieldthrough the river Son, and the Central India coal-fields through the river Godavari. For the Ganges andthe Narmada river systems, detailed technoeconomicfeasibility studies have already been carried out. Theresults are highly impressive. Similar studies areunderway for other rivers and canal systems.
A study of the Narmada Water Transport Project,conducted in 1982 by Consulting Engineering Ser-vices (India) Private Limited (CES), projected coaltraffic at 24 million metric tonnes by 1990-91 and 49million metric tonnes by 2005-06. In addition, CESprojected 4 million metric tonnes of other traffic in1990-91 and 8 million metric tonnes by 2005-06,mainly comprising salt, timber, fertilizer and edibleoils.
According to another study by CES on the feasibil-ity of IWT services between Haldia and Allahabad,the total IWT traffic by 2001 is expected to increasefrom over 7 million to 18 million metric tonnes interms of originating tonnes, corresponding to 1600 to
Table 8. Cargo transported annually in Thailand by inlandwaterways.
Commodities
Sand and gravelRice and paddy .MaizeSugar, salt, etcCementFuel, fertilizer, etcMineral oresLogs
Annually transported byinland waterways in 106 ,metric tonnes
4.751.801.600.700.650.600.350.20 (million m3)
Source: ESCAP (1982a).
16 WATER RESOURCES DEVELOPMENT Vol 3 No 1
Downloaded By: [Tortajada, Cecilia] At: 18:28 13 December 2010

Inland waterways for transportation of agricultural, industrial and energy products: A. K. Biswas
4500 tonne-km. It is generally felt that with thedevelopment of IWT services on the navigable water-ways considerable volumes of traffic can be generatedto make these services economically viable in the longrun.
The development of coastal shipping and IWT willgo a long way in supplementing the internal transportsystem, particularly when freight traffic in the countryis expected to increase from 240 billion tonne-km in1977-78 to 650 billion tonne-km by 2000-01. The Gov-ernment of India has now taken positive steps to pro-mote the growth of water transport in the country. Anincreasing amount of investment is being provided inthe national economic development plan to improvethe infrastructural facilities and augmenting the ship-ping fleet and its tonnage.
(d) Thailand. IWT in Thailand is found primarily inthe Central Plains which cover approximately onethird of the territory. This includes the Chao Phrayariver system, which consists of the Nan river and itsmain tributary the Yom, the Ping river and its maintributary the Wang, the Pasak and Chao Phraya,which separates into three main branches - theSophan, Noi and Lower Chao Phraya rivers - theMaeklong and Bang Pakong rivers. Numerous canalsinterconnect these rivers. From surveys carried out in1975 and 1976, annual traffic may be estimated asshown in Table 8.
Thailand is now in the process of developing itsmain Chao Phraya river system through a $53 millionthree-year programme during 1981-84. A second five-year plan has been drawn up (ESCAP, 1984). Whenthe improvements are carried out, Chao Phraya isexpected to carry 2.1 million metric tonnes by 1985and 5 million metric tonnes by the year 2000, asagainst its present freight traffic of about 600 000 met-ric tonnes. The improved navigation system will besustainable only by appropriate maintenance. It isestimated that an annual maintenance dredging ofabout 400 000 m3 of silt will be necessary just beforethe dry season in order to ensure year-round naviga-tion.
EuropeAs in Asia, no uniform pattern of IWT emerges in thevarious countries of Europe. If the West Europeancountries are considered, in general the total tonnageof goods carried has declined over the past decade, asshown in Table 9. The average length of haul/tonnehas mostly increased, as can be seen in countries likeAustria, France and West Germany. In East Europeancountries, however, the reverse trends can be seen:tonnages of goods carried have increased significantly
but the average lengths of haul/tonne have decreasedsomewhat (ECE, 1983).
If the two main international rivers, the Rhine andthe Danube, are considered, no consistent patternemerges in terms of freight carried. For example,total freight carried in the Rhine during 1970-82 isshown in Table 10. In contrast to the Rhine, however,freight transport on the Danube increased signific-antly during the period 1970 to 1981, but declinedsomewhat in 1982. The reduction can to some extentbe attributed to the decline in economic activities.
Table 9. Total goods carried and distance carried by inland water-ways in selected European countries.
Country 1970 1981 1982
AustriaGoods carried (106 tonne) 7.59Tonne-km in 106 1293Average length of haul/tonne 170
BelgiumGoods carried (106 tonne) 91.57Tonne-km in 106 6 743Average length of haul/tonne 74
FranceGoods carried (10s tonne) 110.35Tonne-km in 106 14 183Average length of haul/tonne 129
Germany, EastGoods carried (10s tonne) 13.66Tonne-km in 106 2 358Average length of haul/tonne 173
Germany, WestGoods carried (106 tonne) 240.00Tonne-km in 106 48 813Average length of haul/tonne 203
NetherlandsGoods carried (10s tonne) 241.45Tonne-km in 10s 30 743Average length of haul/tonne 127
USSRGoods carried (10* tonne) 357.8Tonne-km in 106 174 984Average length of haul/tonne 486
Byelorussian SSRGoods carried (106 tonne) 5.30Tonne-km in 106 1224Average length of haul/tonne 231
Ukrainian SSRGoods carried (10s tonne) 27.28Tonne-km in 10s 6 079Average length of haul/tonne 222
UKGoods carried (106 tonne) 6.53Tonne-km in 10s 129Average length of haul/tonne 20
7.171428199
97.205 44256
83.5711 068132
16.632 359142
231.7150 010216
253.831792125
594.5255 600430
11.251961179
52.911 100210
4.627216
6.621377208
90.56500455
76.4110 190133
16.832 290136
221.9049 401223
241.1331386130
604.5262 400436
12.112 065171
54.111 300209
5.127114
Source: ECE (1983).
WATER RESOURCES DEVELOPMENT Vol 3 No 1 17
Downloaded By: [Tortajada, Cecilia] At: 18:28 13 December 2010

Downloaded By: [Tortajada, Cecilia] At: 18:28 13 December 2010

Inland waterways for transportation of agricultural, industrial and energy products: A. K. Biswas
Figure 4. Bulk cargo traffic in the Welland Canal and the Montreal-Lake Ontario section of the St Lawrence Seaway,1981-83.
WATER RESOURCES DEVELOPMENT Vol 3 No 1 19
Downloaded By: [Tortajada, Cecilia] At: 18:28 13 December 2010

Inland waterways for transportation of agricultural, industrial and energy products: A. K. Biswas
Table 10. Freight carried on the river Rhine, 1970-82.
Freight transport
Year Million tonnes Million tonne-km
197019811982
274.42270.02257.34
5156754 96254 391
Table 11. Freight transport on the river Danube, 1970-82.
Type 1970 1981 1982
ABCTotalIndex
34.0619.891.52
55.47100
56.9723.166.00
86.13155
52.9622.204.60
79.76143
A: Internal transport, goods carried between parts of the samecountry.
B: International transport, goods loaded in one coutnry but desti-nation another, whether Danubian or not.
C: Goods entered by sea.
Freight transport on the Danube during 1970-82 isshown in Table 11.
North AmericaTransportation of bulk goods in Canada and the USAhad different patterns as well.
(a) Canada. Water transport has historically played adominant role in the Canadian economy because ofthe nation's size, geography and presence of a largenumber of water bodies. For example, StatisticsCanada reported that in 1980 water transportationgenerated revenues of C$1,841 billion for 308 Cana-dian-domiciled for-hire, private, government andsightseeing carriers. Corresponding revenue for 1979was C$1,626 billion. The largest portion of theserevenues, C$1,224 billion, was generated by 210 for-hire carriers (corresponding figures for 1979 wereC$1,039 billion by 191 carriers).
The most important waterways in Canada are the StLawrence. Seaway and the Welland Canal. The StLawrence Seaway Authority was constituted as a cor-poration by an act of the Canadian parliament in 1951.The authority undertook to construct, maintain andoperate the Canadian facilities between Montreal andLake Erie to allow navigation by vessels of 79.25decimetres draft. Similar facilities were simultane-ously constructed in the International Rapids Sectionof the St Lawrence river by the St Lawrence SeawayDevelopment Corporation of the USA. The Seawaywas opened for commercial traffic on 1 April 1959. TheSt Lawrence Seaway Authority is also responsible forthe operation and maintenance of the Welland Canal.
Cargo tonnages continued to increase in theMontreal-Lake Ontario and Welland Canal sectionssince the opening of the Seaway in 1959 to about 1979,as shown in Figure 3. Since 1979, the total cargotonnages have declined (St Lawrence Seaway Author-ity, 1983). The various types of bulk cargoes carried in1981 and.1982, and forecast for 1983, are shown inFigure 4 (St Lawrence Seaway Authority, 1982).
Among the major constraints for IWT in Canadaare the shortness of the season due to the freezing ofwaterways, the relative inflexibility of capacity insome areas (the difficulty of moving tugs or barges inor out of the system), slowness, the restriction of ser-vices to river and canal communities - unless com-plemented by rail and road - and vulnerability tomajor variations in water levels in different river sec-tions at different times during the year.
(b) USA. There are about 25 500 miles of commer-cially navigable inland waterways in the USA (Na-tional Waterways Foundation, 1983). Three differentsystems can be identified geographically: AtlanticCoast waterways, Pacific Coast waterways and theMississippi river-Gulf Intercoastal system. There isno inland connection between these three systems.The Mississippi river system plays a dominant role inIWTin the USAsince it carried 60.9% of all ton-milesof cargo on the federally-improved and maintainedwaterways in 1979.
If the total waterborne commerce in the USA isconsidered, it increased from 0.7 billion to 2.1 billionshort tons between 1947 and 1979, a compoundannual rate of increase of about 3.1%. This is shown inFigure 5 (National Waterways Foundation, 1983).
The total domestic waterborne commerce - inter-nal, coastwise and Great Lakes - increased from 579million to 1079 million short tons during 1947 to 1979.This is shown in Figure 6 (National Waterways Found-ation, 1983).
The growth of transportation of major bulk com-modities by inland waterways is shown in Figure 7. Interms of tonnage, coal is the most important commod-ity, and the amount moved steadily increased from 58million to 130 million short tons during the period1953 to 1979. The next most important commodity ispetroleum products, which includes gasoline,residual fuel oil, distillate fuel oil and jet engine fuel.The amount of petroleum products moved increasedfrom 52 million to 113 million short tons during 1953to 1977, but declined to 103 million short tons by 1979.Similarly, transport of crude petroleum increasedfrom 24 million to 60 million short tons during 1953 to1972, but declined to only 47 million short tons by1979. In contrast, the movement of grains increaseddramatically from 4 million to 50 million short tons
20 WATER RESOURCES DEVELOPMENT Vol 3 No 1
Downloaded By: [Tortajada, Cecilia] At: 18:28 13 December 2010

Inland waterways for transportation of agricultural, industrial and energy products: A. K. Biswas
1945 1955 1965 1975
Year
Figure 5. Net total waterborne commerce of the USA,1947-79.
Internal inlandwaterways
1945 1975
co
inCo
Coal
Petroleumproducts
Crude petroleum
01950 1955 1975 1980
Figure 7. Leading commodities in US domestic water-borne commerce on inland waterways, 1953-79.
during 1953 to 1979 - which represents a 12.5 foldincrease.
The total commodities carried by inland waterwaysin the USA in 1979 amounted to 535 million shorttons, of which 54.5% consisted of energy materials,13.6% non-metallic minerals excluding fuels and13.3% agricultural supplies and products. The actualtonnages transported and percentages are shown inTable 12.
Table 12. Commodities carried by inland waterways (except local)in the USA, 1979.
Figure 6. US domestic waterborne commerce by type oftraffic, 1947-79.
Commodities transported
Energy materialsCoal and lignitePetroleum and coal productsCrude petroleum
Agricultural products and suppliesFarm productsFood and kindred productsFertilizers
OthersNon-metallic minerals, excluding
energy materialsChemical and allied productsMarine productsMetallic oresPrimary metal productsWaste and scrap materialsStone, clay, glass and concrete
productsLumber and wood products, excluding
furniturePulp, paper and allied productsAll other
Millions ofshort tons
291.5125.7118.647.2
71.351.812:27.3
172.2
72.529.610.27.18.6
12.4
5.6
17.82.55.9
Percentage
54.523.522.254.5
13.39.72.21.4
32.2
13.65.51.91.31.62.3
1.1
3.30.51.1
Source: National Waterways Foundation (1983).
WATER RESOURCES DEVELOPMENT Vol 3 No 1 21
Downloaded By: [Tortajada, Cecilia] At: 18:28 13 December 2010

Inland waterways for transportation of agricultural, industrial and energy products: A. K. Biswas
ConclusionAn analysis of the global situation with respect toinland waterways transportation clearly indicates thegreat variations in their importance and use from onecountry to another. While geographical conditionscan explain this anomaly to a certain extent, lack ofrealization of the potential impact of IWTon nationaleconomies continues to be an important factor. Whilesome countries like China are specifically expandingIWT activities because
no use is made of farm land, the cost of investment in chan-nel construction and maintenance is less than that for rail-ways and roadways; energy is saved; industries set up alongthe rivers are helped by providing a convenient means oftransport, water supply and drainage; inland water trans-port has a greater carrying capacity and can transport over-weight and oversize cargoes; and it is almost pollution-free[ESCAP, 1982b],
other nations have made very little progress thus far.On a global basis, expansion of IWT in developing
countries has more potential than in developed coun-tries, where this mode of transportation is moremature. Fortunately some developing countries havenow started to recognize the potential of IWT, and areplanning to integrate it properly in their nationaltransportation frameworks. Still, the development ofnational master plans for transportation, includingIWT, is lacking in most countries. Without a nationaltransportation policy, development of IWT can pro-ceed only on an ad hoc, piecemeal basis.
ReferencesBiswas, Asit K., Zuo Dakang, J.E. Nickum and Liu
Changming (1983). Long Distance Water Transfer: AChinese Case Study and International Experiences,Tycooly International Publishing Ltd, Dublin.
Department of Commerce (1981). Statistical Abstract of theUnited States, 1980, Department of Commerce,Washington, DC, pp 805, 809.
ESCAP (1982a). 'Review of the Developments and Prob-lems in the ESCAP Region with Regard to (a) InlandWater Transport and (b) Inland Waterways', DocumentSPIW/IWTIWA(1)/3, United Nations Economic andSocial Commission for Asia and the Pacific, Bangkok, 12May.
ESCAP (1982b). 'Report of the Meeting of Chief Execu-tives of Inland WaterTransport and Inland Waterways onits First Session', Document SPIW/IWTIWA(1)/4,United Nations Economic and Social Commission forAsia and the Pacific, Bangkok.
ESCAP (1984). Economic and Social Survey of Asia andPacific, 1983, United Nations Economic and Social Com-mission for Asia and the Pacific, Bangkok, February.
ECE (1983). Annual Bulletin of Transport Statistics forEurope, 1982, Vol C 34, Sales No E/F/R.83.11.E.28,United Nations Economic Commission for Europe,New York.
ICC (1978). Transport Statistics in the United States, 1977,Part V, Interstate Commerce Commission, Washington,DC, pp 34-35.
National Transport Policy Committee (1980). Report, Gov-ernment of India Planning Commission, New Delhi,May.
National Waterways Foundation (1983). US Waterways Pro-ductivity: A Private and Public Partnership, Strode Pub-lishers, Huntsville, AL.
St Lawrence Seaway Authority (1982). The Seaway: Opera-tions, Outlooks, Statistics, St Lawrence Seaway Author-ity, Ottawa.
St Lawrence Seaway Authority (1983). 1982 Annual Report,St Lawrence Seaway Authority, Ottawa.
Transportation Association of America (1981). Transporta-tion Facts and Trends, 17th Edition, TransportationAssociation of America, Washington, DC, December.
22 WATER RESOURCES DEVELOPMENT Vol 3 No 1
Downloaded By: [Tortajada, Cecilia] At: 18:28 13 December 2010