international monetary · pdf fileprepared by staff of the international monetary fund ......
TRANSCRIPT

INTERNATIONAL MONETARY FUND
Promising Domestic Fiscal Instruments for Climate Finance
Background Paper for the Report to the G20 on―Mobilizing Sources of Climate Finance‖
Prepared by staff of the International Monetary Fund
November 2011
2
Contents Page
Executive Summary ...................................................................................................................3
I. Introduction ............................................................................................................................7
II. Conceptual Rationale for Carbon-Pricing .............................................................................8
III. Specific Carbon Pricing Proposals and Other Domestic, Carbon-Related Alternatives ...13
IV. Broader (Non-Carbon-Related) Fiscal Instruments ...........................................................28
V. Conclusion ..........................................................................................................................31
Tables
1. Summary Comparison of Carbon-Related Fiscal Instruments ..............................................8
2. Energy-related CO2 Emissions, Climate Finance Contributions, and GDP per Capita by
Country ........................................................................................................................16
3. Impacts of Carbon Pricing on Electricity Prices, Selected Developed Countries ...............17
4. Impacts of Carbon Pricing on Gasoline Prices ....................................................................18
5. Cross-Country Incidence of Electricity Taxes, Selected Countries .....................................21
6. Cross Country Incidence of Surcharges on Gasoline and Petroleum Consumption ............23
Figures
1. Distributional Incidence of Carbon Tax on U.S. Households .............................................19
Boxes
1. Emissions Taxes Versus Cap-and-Trade .............................................................................11
2. Carbon Pricing and Border Tax Adjustments ......................................................................25
References ................................................................................................................................32
3
EXECUTIVE SUMMARY
At the 2010 global climate talks in Cancun, Mexico, developed countries re-affirmed a pledge
to raise $100 billion per year by 2020, and $30 billion in total between 2010 and 2012, to
finance climate mitigation and adaptation projects in developing countries.1 The focus of this
paper is how some of the $100 billion funding target might be mobilized through fiscal
instruments.2
The case for carbon pricing
In general, the least costly (or least distortive) instruments for revenue purposes are broad
fiscal instruments,3 but carbon pricing instruments have a critical role to play in mitigating
climate change. Taxes with a relatively narrow base tend to cause greater distortions in the
economy than broad fiscal instruments (e.g., taxes on labor income or general consumption)
because the former are easier for households and firms to avoid by altering consumption decisions.
Moreover, it is generally better to tax final consumption goods rather than tax an input (e.g., fuels)
as the latter distorts production decisions and raises production costs. Up to a point however, well-
designed carbon pricing policies levied on fossil fuel inputs are more efficient than broader
instruments, because they also correct for a huge market failure—excessive global emissions of
greenhouse gases (GHGs). Roughly speaking, carbon pricing policies should be set to reflect
environmental damages in the price of fuel and energy and remaining general government revenue
needs should be met through broader fiscal instruments.
The revenue generated by such carbon-pricing policies need not be earmarked for climate
finance. In fact, most of the revenue could be used for deficit reduction. The case for using carbon
pricing as a tool for addressing externalities is quite distinct from that for using it to generate
climate finance. However, earmarking part of carbon tax revenue can be a commitment device for
developed countries and may reduce the risk of crowding out other aid to developing countries.
Conversely, there is no reason why climate finance has to come from ―innovative sources‖. Some
funds might be raised through broader fiscal instruments that have no direct benefits in terms of
climate mitigation.
Comprehensive carbon pricing policies in developed countries are crucial for reducing
emissions, leveraging private finance, and promoting clean technology development. Pricing
GHG emissions in developed countries should ideally occur through carbon taxes or auctioned
cap-and-trade systems. Reasonably scaled carbon taxes might yield annual revenues of around
1 All $ figures refer to U.S. dollars.
2 The limited data available suggest that climate finance is currently around $10–15 billion a year from grants and
concessional loans through bilateral and multilateral channels and credits from the Clean Development Mechanism
(OECD 2011a).
3 Some commodities of course may be suitable for heavy taxation because of relatively inelastic demand and/or
perceived externality or self-control problems—notable non-climate related examples being cigarettes and alcohol.
4
$25 billion, if governments earmarked 10 percent of total revenues for climate finance.4 In
addition, however, there are important channels through which carbon pricing—either carbon taxes
or cap-and-trade—can powerfully leverage private finance. These include enhanced returns for
clean technology investments and flows through carbon markets as developed countries purchase
emissions offsets from developing countries.
Taxes on electricity and motor fuels could raise significant revenue but are far less effective
at reducing emissions than carbon pricing. Simple per kilowatt-hour (kWh) taxes (―wires
charges‖) are quite common in developed countries, but are much less effective at reducing
emissions than a carbon tax and could be more costly than broader fiscal instruments. A
surcharge on motor fuels could make sense, but only in a limited number of countries like the
United States where fuel taxes currently under-charge for adverse side effects of vehicle use
(e.g., pollution, congestion).
A modest levy on petroleum consumption could raise significant revenue. The base of a
petroleum tax is about three times as large as that for a gasoline tax, implying much greater
revenue potential. And this tax more effectively addresses concerns about oil dependence
(e.g., macroeconomic vulnerabilities to oil price volatility), though it fails to exploit the majority
of CO2 reduction opportunities.
Overcoming obstacles to carbon pricing
Carbon pricing can face stiff political opposition. Recycling revenues in economically
productive ways (e.g., alleviating distortions from the broader fiscal system) keeps down the
overall policy costs. At the same time, these revenue transfers are reflected in higher energy
prices, which can meet fierce opposition from households and industry (especially in trade
sensitive sectors).
International cooperation can greatly improve the efficiency of carbon pricing policies and
reduce the need for compensation measures. Equalizing marginal abatement costs across
countries (by imposing a uniform emissions price) minimizes the costs of emission reductions.
Moreover, cooperation reduces the risk of industry relocation and carbon leakage, thus reducing
the pressure to exempt certain industries or impose (contentious) border tax adjustments. Thus,
international cooperation raises the chance that governments collect significant revenue from
carbon pricing policies.
Without international coordination, domestic opposition to carbon pricing might be
overcome by providing compensation to target groups—but that can be costly.
Compensation, for example in the form of transfers to households and industry, has an economic
cost by diverting revenue from more productive (economically efficient) purposes. Moreover,
4 See also OECD (forthcoming).

5
compensation could be excessive: for example, free allowance allocations in the initial phases of
the EU ETS grossly over-compensated power companies (e.g., Sijm and others, 2006).
Alternatively, some compensation might be provided by scaling back relatively ineffective
policies as carbon pricing is introduced. In some developed countries, using some of the
domestically retained revenue from carbon taxes to cut electricity excise taxes would go at least
some way in neutralizing the increase in electricity prices for households and industry, while the
overall tax shift still reduces GHGs (and other pollution emissions). Similarly, the burden of
carbon pricing on motorists could be alleviated by scaling back (environmentally-ineffective)
taxes on vehicle ownership.
If broad carbon pricing is infeasible, “feebates” are a possible alternative source of finance.
Feebates impose taxes (fees) on relatively dirty products and production processes and provide
subsidies (rebates) for relatively clean products and production processes. They can be used to
promote de-carbonization of the power sector, and improvements in the efficiency of major
energy-using products, in a cost-effective way, while (with appropriate provisions) promoting
international carbon markets and raising some climate finance revenue. Unlike carbon taxes and
cap-and-trade policies, feebates can be designed to have a small impact on energy prices. This
would likely increase their acceptability, but there is a tension with environmental effectiveness
(which requires higher energy prices) and revenue needs (which also imply higher energy prices).
Non-carbon related revenue sources
While carbon pricing is critical in efficiently curbing emissions, there is no need to earmark
funds from carbon pricing for climate finance. Indeed, the revenue from carbon pricing could
flow into national budgets instead, and climate finance can be based on other criteria than carbon
emissions.
Taxes on general consumption, labor income, and recurrent property taxes on real estate
are thought to be the most efficient broader fiscal instruments for raising revenue. In
contrast, corporate income taxes are often seen especially harmful for economic growth.
Moreover, with increased international mobility of capital and people, uncoordinated tax-setting
can lead to collectively inefficient outcomes. However, greater reliance on taxation of mobile
sources may be appropriate if countries coordinate over tax policy.
New taxes on the financial sector have been proposed as a way to raise money for climate
finance. These include most prominently Financial Transactions Taxes (FTT)—levied on the
value of a wide range of financial transactions—and Financial Activities Taxes (FAT)—levied
on the sum of the wages and profits of financial institutions. Both were considered and compared
extensively in the IMF’s 2010 report to the G20 on financial sector taxation.5 Broadly speaking,
5 IMF (2010a).

6
the FTT has acquired greater political momentum (notably with the recent proposal from the
European Commission), while the FAT has acquired greater support from tax policy specialists
(as a way to redress distortions arising from the exemption of most financial services from
VAT). Both, nonetheless, are technically feasible—with the appropriate degree of international
cooperation—and both could raise significant revenues.
There are a number of further options that would be worth studying. These include, for
example, scaling back agricultural protection programs, taxing satellite launches to reduce the
accumulation of space debris, and taxing other sources of externalities like road congestion,
excessive fishing, and household waste. Moreover, mineral rights in offshore areas that are
outside any countries’ territory or in the Antarctic may offer opportunities for climate finance.
These options are beyond our scope, however.6
6 For some discussion, see Atkinson (2004) and World Bank-IMF (2005).
7
I. INTRODUCTION
1. This paper responds to a June 2011 request by the G20 Finance Ministers and
Central Bank Governors to conduct an analysis of the economic, environmental, social, and
distributional implications of public instruments for climate change financing. Domestic,
climate-related instruments are examined, as well as broader fiscal options, as potentially
applicable to developed countries.7 Taxes on international aviation and shipping fuels, which are
potentially borne in part by developing countries, are discussed in a separate paper (IMF, 2011).
Options for leveraging other (non-public) sources are finance, and removing fossil fuel subsidies,
are discussed in World Bank/IMF (2011).
2. The paper extends aspects of the work of the high-level Advisory Group on Climate
Finance (AGF) established by the UN Secretary-General. This evaluated a wide range of
carbon-related and other fiscal instruments and multiple criteria and provided an approximate
sense of the revenue potential of different instruments. This paper builds on and extends the AGF
report by providing more analysis of the environmental effectiveness, revenue, costs, incidence,
and effects on competitiveness of certain instruments and considering some instruments not
addressed there. 8 In addition, innovative ways to improve the feasibility of carbon pricing
instruments are considered. Promising instruments (i.e., those that raise revenue without a burden
on developing countries, that are environmentally effective, and that have limited effects on
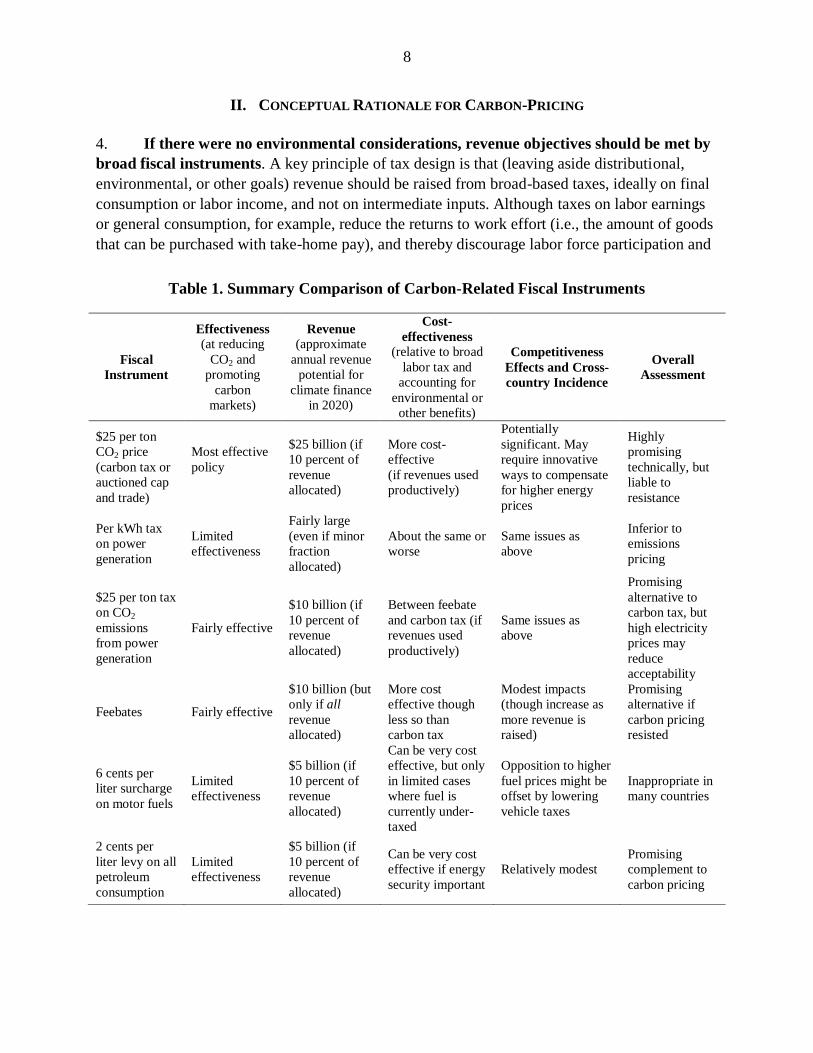
competitiveness) are identified. Table 1 provides a brief summary of the main findings.
3. The paper is organized as follows. Section II briefly provides the conceptual rationale
for environmentally-motivated taxes. Section III discusses carbon pricing, other (less effective)
carbon-related domestic instruments, and possibilities for improving the feasibility of carbon
pricing. Section IV discusses broader (non-carbon-related) fiscal instruments. Section V
concludes.
7 Developed countries are taken in this paper to be the members of the European Union and other Annex II
countries, all of which have pledged to provide fast start finance. This includes the 27 EU Member States as well as
Australia, Canada, Iceland, Japan, New Zealand, Norway, Switzerland, and the United States.
8 Carbon pricing policies, taxes on electricity use or electricity emissions, ―feebates‖, motor fuel taxes, vehicle taxes,
petroleum levies and various broader fiscal instruments are discussed.
8
II. CONCEPTUAL RATIONALE FOR CARBON-PRICING
4. If there were no environmental considerations, revenue objectives should be met by
broad fiscal instruments. A key principle of tax design is that (leaving aside distributional,
environmental, or other goals) revenue should be raised from broad-based taxes, ideally on final
consumption or labor income, and not on intermediate inputs. Although taxes on labor earnings
or general consumption, for example, reduce the returns to work effort (i.e., the amount of goods
that can be purchased with take-home pay), and thereby discourage labor force participation and
Table 1. Summary Comparison of Carbon-Related Fiscal Instruments
Fiscal
Instrument
Effectiveness (at reducing
CO2 and
promoting
carbon
markets)
Revenue
(approximate
annual revenue
potential for
climate finance
in 2020)
Cost-
effectiveness (relative to broad
labor tax and
accounting for
environmental or
other benefits)
Competitiveness
Effects and Cross-
country Incidence
Overall
Assessment
$25 per ton
CO2 price
(carbon tax or
auctioned cap
and trade)
Most effective
policy
$25 billion (if
10 percent of
revenue
allocated)
More cost-
effective
(if revenues used
productively)
Potentially
significant. May
require innovative
ways to compensate
for higher energy
prices
Highly
promising
technically, but
liable to
resistance
Per kWh tax
on power
generation
Limited
effectiveness
Fairly large
(even if minor
fraction
allocated)
About the same or
worse
Same issues as
above
Inferior to
emissions
pricing
$25 per ton tax
on CO2
emissions
from power
generation
Fairly effective
$10 billion (if
10 percent of
revenue
allocated)
Between feebate
and carbon tax (if
revenues used
productively)
Same issues as
above
Promising
alternative to
carbon tax, but
high electricity
prices may
reduce
acceptability
Feebates Fairly effective
$10 billion (but
only if all
revenue
allocated)
More cost
effective though
less so than
carbon tax
Modest impacts
(though increase as
more revenue is
raised)
Promising
alternative if
carbon pricing
resisted
6 cents per
liter surcharge
on motor fuels
Limited
effectiveness
$5 billion (if
10 percent of
revenue
allocated)
Can be very cost
effective, but only
in limited cases
where fuel is
currently under-
taxed
Opposition to higher
fuel prices might be
offset by lowering
vehicle taxes
Inappropriate in
many countries
2 cents per
liter levy on all
petroleum
consumption
Limited
effectiveness
$5 billion (if
10 percent of
revenue
allocated)
Can be very cost
effective if energy
security important
Relatively modest
Promising
complement to
carbon pricing
9
effort on the job, they tend to cause less distortion to the economy than narrow-based taxes. For
comparable revenues, taxes on dirty energy sources generally cause similar employment effects
to those from broader-based taxes (through the effect of higher energy prices on contracting
economic activity). However, they also cause a shift towards more expensive (albeit) cleaner
fuels, as well as inducing households and firms to consume less energy than they would
otherwise.
5. Up to a point however, raising revenue from carbon pricing can be far more
efficient than raising the same revenue through broader fiscal instruments. This is because
carbon taxes generate large benefits through reducing future climate change and by providing
(otherwise inadequate) incentives for clean technology development. To balance the
environmental benefits and costs of emissions abatement, carbon prices should approximately
reflect the marginal environmental damages per ton of CO2, and further revenue needs met
through broader fiscal instruments (e.g., Goulder, 2002, Part III).
6. Comprehensive carbon taxes, or cap-and-trade systems, are by far the most
effective instruments for cutting CO2 emissions. Pricing the carbon content of fossil fuels
upstream in the fossil fuel supply chain (e.g., at the wellhead, minemouth, or point of
importation) drives up the prices of fuels and electricity and thereby exploits all (energy-related)
emission reduction opportunities across the economy. This includes (a) reducing the emissions
intensity of power generation, for example, by switching from high-carbon-intensity coal to
intermediate-carbon-intensity natural gas and fuel oil, from these fuels to zero-carbon nuclear
(though of course safety concerns arise) and renewables, and also improving plant efficiency;
(b) reductions in residential and industrial demand for electricity; (c) reductions in the use of, and
fuel consumption rate of, transportation vehicles; and (d) reductions of direct fuel use in homes,
offices, factories, and shops (e.g., for heating). Fuel switching in power generation usually
provides the biggest source of low-cost options for reducing CO2, at least in countries with
significant shares of (carbon-intensive) coal generation.
7. Taxes on electricity use, vehicle ownership, or industrial CO2 emissions are poor
substitutes for comprehensive carbon taxes. Pure electricity taxes are a blunt climate
instrument because they exploit only one of the four main channels for CO2 emissions reductions
described above. Taxes on vehicle ownership are even more problematic—not only do they miss
out on three out of the four emissions reduction channels, but they also, within the transport
sector, fail to reduce miles driven per vehicle and (depending on their design) may have little to
no effect on vehicle fuel economy. Pricing major industrial sources of CO2 emissions as they are
released into the atmosphere, as in the EU ETS, is far more effective from an environmental
perspective than a pure tax on electricity. However, this approach still fails to cover emissions
10
from households, transport, and small-scale industry, which account for about 50 percent of
CO2 emissions in the EU ETS.9
8. Regulatory policies (at least on their own) are also poor substitutes for carbon
taxes—and do not raise revenues. For example, mandates for renewable generation fuels will
not reduce emissions beyond the power sector and will not reduce the emissions intensity of the
remaining generation mix (e.g., it will not encourage shifting from coal to natural gas or nuclear
power). Regulatory combinations may do a lot better—for example, combining a CO2 per kWh
standard (which reduces the emissions intensity of generation) with miles per gallon standards
for vehicles, building codes, and energy efficiency standards for appliances, will exploit most of
the emissions reductions exploited under a carbon tax (e.g., Krupnick and others, 2010).
However, not all opportunities (such as reduced use of vehicles and appliances) are exploited and
regulatory combinations could involve a considerable loss of cost effectiveness, unless there are
comprehensive credit trading provisions.10
9. Cap-and-trade systems are reasonable carbon-pricing instruments, if they are
designed to mimic carbon taxes. As discussed in Box 1, cap-and-trade systems can be as
effective as carbon taxes at reducing emissions, and can be designed to raise revenue, and limit
emissions price volatility.
10. Using (domestically-retained) revenue from carbon pricing to reduce broader tax
distortions (e.g., labor tax distortions) produces significant economic benefits. With this
recycling, the overall costs of carbon pricing (excluding environmental benefits) are likely
modest. But even if domestic revenues are used in this way, the overall impact of carbon pricing
is unlikely to have a big impact on overall employment, either way, given the offsetting, adverse
employment effects of higher energy prices (Goulder, 2002, Part III). On the other hand, if
retained revenues are not used productively (e.g., for other tax reductions)—or a large portion of
allowances in a cap-and-trade system are given away for free—the offsetting revenue-recycling
benefit is forgone, and the overall costs of the policy to the economy can be considerably higher.
11. Carbon pricing policies are effective instruments for promoting the development
and deployment of clean energy technologies. With the price of CO2 reflected in fuel and
energy prices, incentives are provided across the economy for innovative activity to develop
energy-saving and clean-fuel technologies that are ultimately needed to halt rising global
9 A qualification is that, given the ETS promotes (relatively low-cost) fuel switching opportunities in the power
sector, it exploits a lot more than 50 percent of the reductions that would occur if the same price were extended to all
CO2 emissions. A downstream system also automatically encourages adoption of carbon capture and storage
technologies at coal plants and other facilities, if and when those technologies become economically viable.
However, an upstream system can also reward adoption of these technologies through crediting provisions.
10 These provisions help to equate the cost of the last ton reduced across emissions sources within a sector and
across different sectors.
11
Box 1. Emissions Taxes versus Cap-and-Trade
Emissions taxes and cap-and-trade systems are potentially equally effective at reducing emissions, so
long as they are applied to the same base. As the price of emissions allowances is (at least in part) passed
forward into higher prices for fuels, electricity, and so on, a cap-and-trade system would exploit the same
behavioral responses across the economy for reducing emissions (reductions in energy demand, shifts
towards clean power generation fuels, etc.) as under an emissions tax.
Carbon taxes directly raise government revenues. Using this revenue productively (e.g., to lower other
distortionary taxes or for climate finance) is important for keeping down the overall costs of the policy to
the economy. Cap-and-trade systems can raise comparable revenues if all allowances are auctioned and
revenues accrue to a finance ministry.
Emissions price volatility can be problematic under cap-and-trade systems. Under cap-and-trade,
allowances prices are determined in the market and will vary with energy demand, changes in the relative
price of clean and dirty fuels, technological advances, etc. This price volatility raises program costs over
time and can deter clean technology investments (which often have high upfront costs and provide
emissions savings over many years).1 Usually, price stability provisions (e.g., allowance banking and
borrowing, price ceilings and floors) are recommended to make cap-and-trade systems behave more like a
carbon tax (which fixes the emissions price).
Carbon taxes are additive to other emissions reduction efforts, while cap-and-trade systems may not
be. If emissions are rigidly fixed by a cap, other measures (e.g., energy taxes, efficiency standards) that
cover the same emissions sources are environmentally ineffective (they only change the allowance price). In
contrast, under a carbon tax other mitigation efforts can still be environmentally effective.
___________________________________ 1 For example, citing uncertainty over future US carbon prices, American Electric Power announced in July
2011 the cancellation of a major project to construct a coal-fired generation plant with carbon capture and
storage technology.
temperatures (e.g., Eyraud and others, 2011). Regulatory policies in isolation, or taxes that do not
cover all CO2 emissions, focus on a much narrower range of technological opportunities.
(Nonetheless, carbon pricing policies may need to be complemented by additional technology
policies—such as technology prizes—where there are market barriers to clean technology
development and deployment).
12. Comprehensive carbon pricing in developed countries can, via international carbon
markets, promote emissions mitigation in, and technology transfer to, developing countries,
though monitoring and verifying emissions reductions in those countries is challenging. In
the absence of comprehensive emissions pricing in developing countries, mitigation projects
(e.g., adoption of clean technologies) can still be encouraged, if sources in developed countries
subject to pricing are credited for funding such projects. The demand for offsets (and hence the
flow of carbon market funds) is maximized when all, rather than just a portion, of developed
country emissions are priced. However, establishing whether mitigation projects in developing
counties would have occurred anyway (in the absence of offset programs) can be difficult.
Measuring carbon reductions can also be challenging (for example, accurate estimates of the
carbon contained in many forested areas are not available at present). And mitigation projects

12
may also lead to offsetting emissions (as, for example, when forest preserved in one area is offset
by forest clearance elsewhere). Carbon markets should therefore be expanded progressively, as
institutional capacity for monitoring and verifying emissions reductions improves.
13. Carbon emissions pricing policies to date often exempt a large portion of emissions
and generate revenues below their potential. The EU ETS prices about 50 percent of CO2
emissions in the European Union, or about 15 percent of developed country CO2 emissions and
the huge bulk of allowances were given away for free in the initial phases of the EU ETS.
However, in the next phase of the ETS (from 2013 to 2020) fifty percent or more of allowances
will be auctioned, and most allowances will be auctioned in Australia’s prospective cap-and-
trade system (scheduled to begin in 2012).
13
III. SPECIFIC CARBON PRICING PROPOSALS AND OTHER DOMESTIC, CARBON-RELATED
ALTERNATIVES
14. This section begins by evaluating specific carbon pricing policies based on environmental
effectiveness, revenue potential, cost-effectiveness, incidence, and feasibility. Other carbon-
related instruments that might be implemented domestically, including taxes on the electricity,
and on the domestic transport sector, are then evaluated. Finally, options for improving the
feasibility of carbon pricing are discussed.
Carbon pricing proposals
Effectiveness
15. A carbon price of $25 per ton is considered for a central case, applied to all sources
of energy-related CO2 emissions in 2020 for developed countries. Based on a recent study
(US IAWG, 2010), $25 per ton (in current dollars), rising at about 2–3 percent a year in real
terms, seems a reasonable price to put on CO2 emissions in 2020 from the perspective of
charging for environmental damages, though others (e.g., Stern, 2007) would recommend a
much higher figure.11 However, even if widely implemented in major emitting countries, and
ramped up steadily over time, many believe that these emissions prices would not be high
enough to limit eventual mean projected global warming to 2 Celsius above pre-industrial levels
(the official target of the UN Framework Convention on Climate Change).12 Following the AGF,
carbon prices of $15 and $50 per ton are also considered.
16. For EU countries, carbon taxes on the content of fossil fuels would have no effect on
emissions already covered by the Emissions Trading Scheme (ETS), unless the cap is
tightened. For a given emissions cap, any reductions in ETS emissions in one member country,
in response to new carbon taxes, will be offset ton-for-ton by additional emissions elsewhere in
the EU as the allowance price adjusts to keep the total quantity of EU emissions equal to the cap.
Under these circumstances, taxing ETS emissions is essentially equivalent to auctioning
11
US IAWG (2010) evaluated the discounted value of worldwide damages from the additional climate change over
the next 100 years or so, caused by an additional ton of emissions. Estimates reflect (rudimentary) attempts to
measure, for example, future impacts on world agriculture, costs of protecting against rising sea levels, non-market
effects like human mortality and species loss. Damage estimates are much disputed however, due to different
perspectives on the appropriate rate at which to discount damages imposed on future generations and how to
incorporate the risks of more extreme warming scenarios.
12 See Clarke et al. (2009) and IEA (2010). Limiting projected long-run arming to 2
Celsius would require
stabilizing global atmospheric concentrations of CO2 and other greenhouse gases (where the warming potential of
the latter gases is expressed in CO2 equivalents) at about 450 parts per million (ppm). Current CO2 equivalent
concentrations, already around 440 ppm, will overshoot this long-run target, requiring extensive use of negative
emission technologies (e.g., co-firing biomass in power generation and capturing and storing its CO2 emissions) to
stand any chance of bringing concentrations back down to 450 ppm.
14
allowances. It is conceivable however, that that policymakers will tighten the cap in response to
a carbon tax in which case, effectively, there is some impact on emissions.
17. Although difficult to project, a $25 per ton CO2 price applied in OECD countries
might reduce their emissions by around 10 percent in 2020 (relative to 2020 baseline
emissions). Gauging the impact of carbon pricing on future emissions is challenging because this
will depend on the costs of carbon-intensive versus non-carbon-intensive fuels, the availability of
energy-saving technologies, expectations about emissions prices in the more distant future (that
affect current investment behavior), other emissions-abatement policies (e.g., renewable fuel
mandates) that might affect baseline emissions, and so on. A large number of models of the
global economic and energy system are regularly used to project the impact of pricing on future
emissions. Based (loosely) on results from the typical model it is assumed here that emissions
prices of $15, $25, and $50 per ton would reduce developed country CO2 emissions by 6, 10, and
18 percent respectively, below levels that would otherwise occur in 2020 (e.g., Clarke and
others, 2009).
Revenue
18. A carbon price of $25 per ton applied to developed country CO2 emissions would
raise annual revenue of around $250 billion in 2020. Carbon prices of $15 and $50 per ton
would raise revenues of around $155 and $450 billion, respectively.13 It is difficult to predict the
fraction of these revenues that national governments would be willing to allocate for climate
finance in 2020, especially during times of fiscal consolidation. For illustration, following AGF
(2010) it is assumed that 10 percent of revenues from carbon pricing (or auctioning ETS
allowances) would be earmarked for this purpose, leaving projected climate finance revenues of
approximately $15, $25, and $45 billion under different pricing scenarios.
Cost-effectiveness
19. A CO2 tax of about $25 per ton (or more) is a more cost-effective way to raise
revenue than broad fiscal instruments. As noted above, this is because the carbon tax produces
environmental benefits which (up to the point where the emissions externality is fully priced)
13
From Table 1, total CO2 emissions across developing countries in 2008 were 11.7 billion tons. Based on the
―Current Policies‖ scenario for 2020 in IEA (2010a), OECD emissions (which are a reasonable proxy for our
developed country emissions) are projected to decline by about 6 percent between 2008 and 2020 in the absence of
policy. Accounting for the assumed 10 percent emissions reduction in response to pricing, this leaves projected
emissions of 9.9 billion tons for 2020 under the $25 per ton scenario. Multiplying by the emissions price gives the
above revenue figure. The same calculation is performed for the other emissions price scenarios, using the assumed
emissions reduction for that scenario. These revenue estimates are approximately consistent with those in
AGF (2010) who project that an extra $1 tax per ton on OECD CO2 emissions will raise approximately $10 billion
in revenue. The above figures do not account for offsetting revenues losses as carbon pricing reduce the base of pre-
existing taxes (e.g., on motor fuels).
15
outweigh the inefficiency of this policy due to its relatively narrow base compared with broader
fiscal instruments.
20. Leaving aside environmental benefits, the costs of a $25 per ton price carbon price
would be modest—in the order of around 0.03 percent of GDP for the average developed
country—assuming all revenues are used productively.14 However costs rise considerably if
revenues are not used to increase economic efficiency (or revenues are forgone by giving away
free allowance allocations). According to Parry and Williams (2011) for the United States, costs
could easily be two to four times as high depending on how much of the potential revenue
recycling benefit is squandered (for the level of CO2 reductions assumed here).
Cross-country distribution of revenues
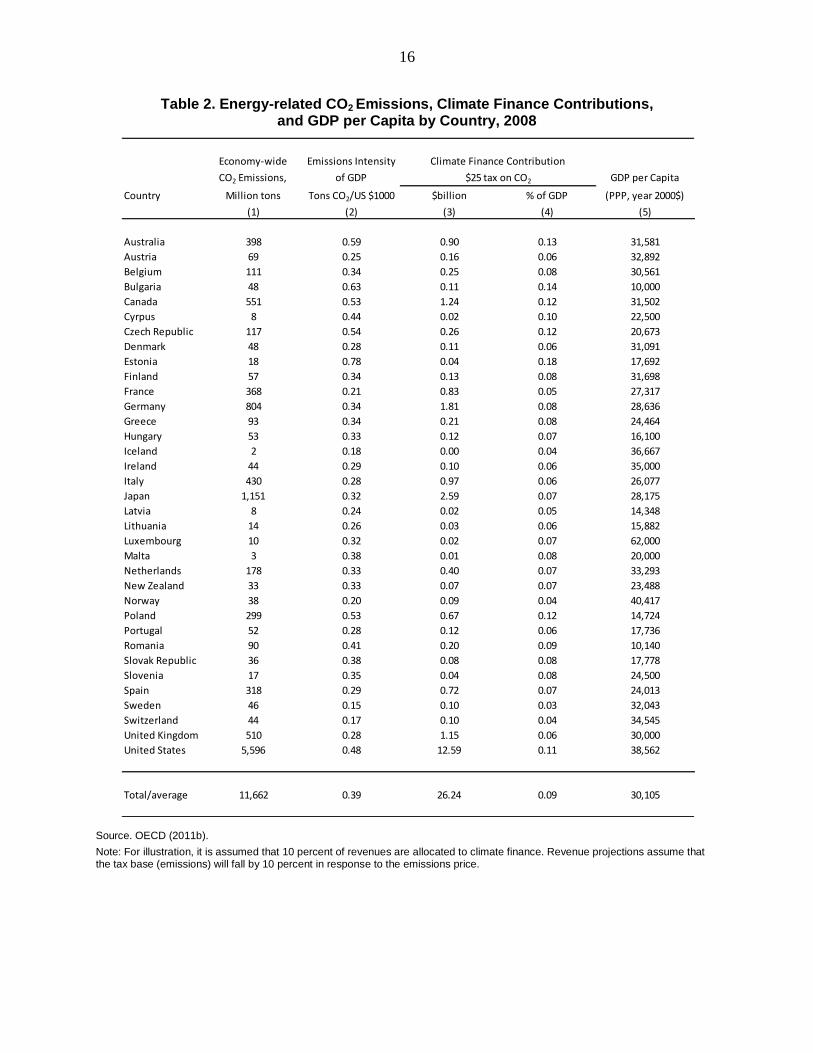
21. Revenue collected and hence potentially available for climate finance, as a percent
of GDP would vary across countries depending on their emissions intensity. Table 2 shows
climate finance contributions as a percent of GDP for the $25 per ton CO2 tax, had it been
applied retrospectively for year 2008 to the developed country classification used here (country-
level projections of emissions are not available for 2020).15 For most countries the revenue is
around 0.06 to 0.10 percent of GDP (see column 4). Contributions for Iceland, Norway, Sweden,
and Switzerland are less than 0.05 percent of GDP, as their power generation sectors have
relatively low CO2 intensity. On the other hand, contributions exceed 0.10 percent of GDP for
emissions-intensive countries like Australia, United States, and Canada, but also for the Czech
Republic and Poland.
Impact on energy prices
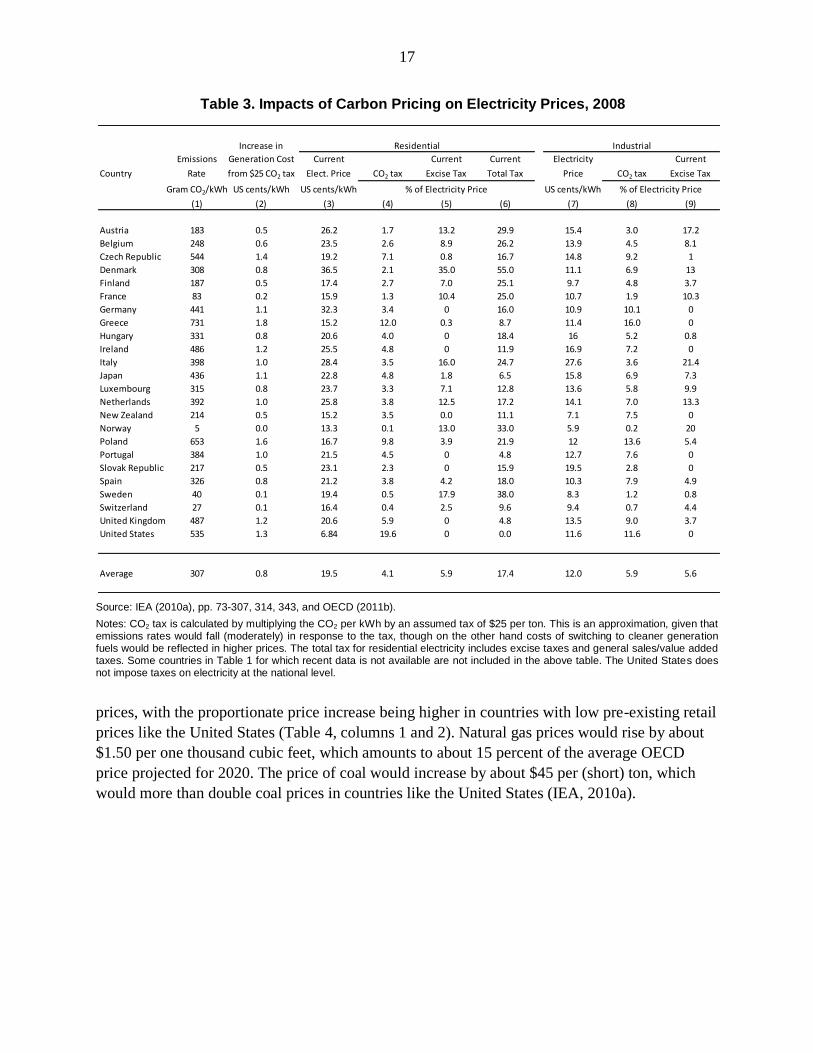
22. A $25 per ton carbon price would increase average electricity prices by about
US 1 cent per kWh but only moderately increase motor fuel prices. If carbon prices are fully
passed forward, a $25 per ton carbon tax would increase electricity prices by around 0.5 to
1.5 cents per kWh across OECD countries, at least on year 2008 data (Table 3, column 2). On
average this would increase residential electricity prices by about 4 percent and industrial
electricity prices by about 7 percent, though price impacts are small for countries like France,
Norway, and Sweden that rely very little on carbon intensive fuels (Table 3, columns 5 and 8).
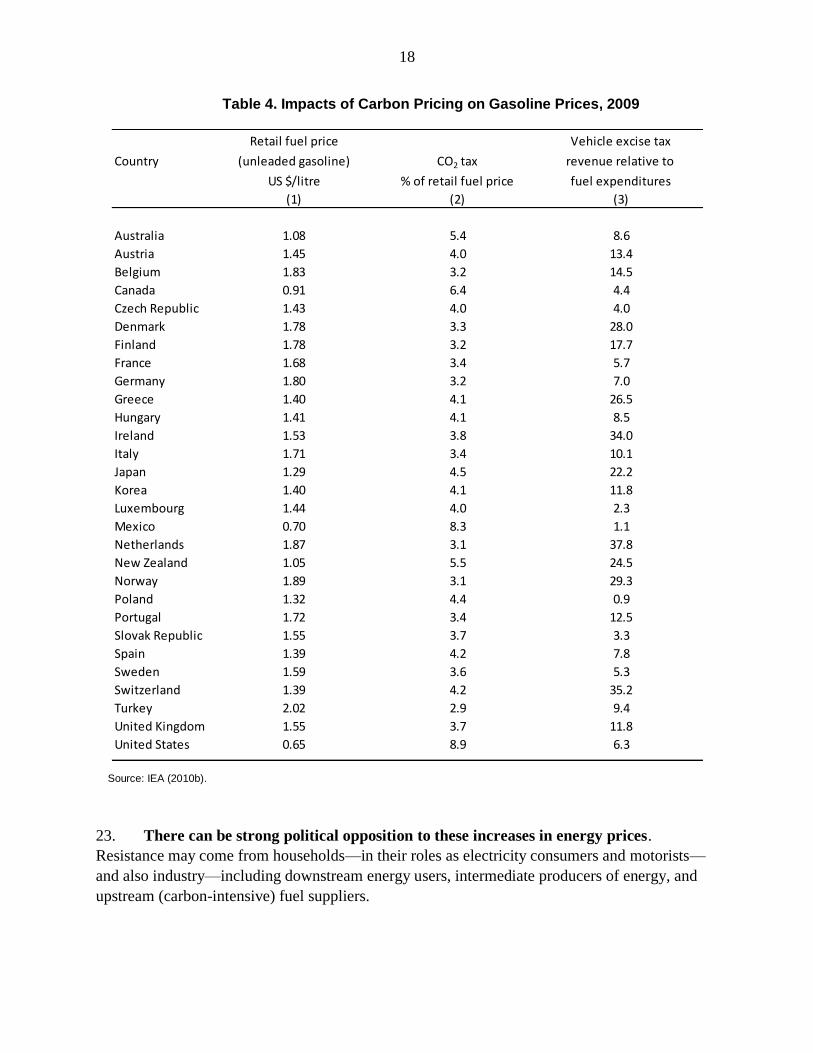
Motor gasoline prices would rise by 6 cents per liter, or 3 to 9 percent of (year 2009) pump
14
A standard approximation for the economic costs of an emission pricing policy (i.e., the costs of the behavioral
responses to reduce emissions) is one half, times the emissions reduction, times the emissions price (e.g., Harberger,
1964). Using this formula and the above assumptions gives a total cost for 2020 of $13.7 billion. GDP for OECD
countries in 2008 was $41,400 billion (OECD 2011b). Assuming GDP growth of 1.5 percent a year gives GDP
in 2020 of $ 49,498 billion. Dividing the cost number by this latter figure gives the above percentage. 15
The overall economic cost to the domestic economy from carbon pricing will exceed the climate finance
contribution as it also includes the costs of emissions reductions, including the broader cost to the economy from
higher energy prices, less benefits from domestic revenue recycling.
16
Table 2. Energy-related CO2 Emissions, Climate Finance Contributions, and GDP per Capita by Country, 2008
Source. OECD (2011b).
Note: For illustration, it is assumed that 10 percent of revenues are allocated to climate finance. Revenue projections assume that the tax base (emissions) will fall by 10 percent in response to the emissions price.
Economy-wide Emissions Intensity
CO2 Emissions, of GDP GDP per Capita
Country Million tons Tons CO2/US $1000 $billion % of GDP (PPP, year 2000$)
(1) (2) (3) (4) (5)
Australia 398 0.59 0.90 0.13 31,581
Austria 69 0.25 0.16 0.06 32,892
Belgium 111 0.34 0.25 0.08 30,561
Bulgaria 48 0.63 0.11 0.14 10,000
Canada 551 0.53 1.24 0.12 31,502
Cyrpus 8 0.44 0.02 0.10 22,500
Czech Republic 117 0.54 0.26 0.12 20,673
Denmark 48 0.28 0.11 0.06 31,091
Estonia 18 0.78 0.04 0.18 17,692
Finland 57 0.34 0.13 0.08 31,698
France 368 0.21 0.83 0.05 27,317
Germany 804 0.34 1.81 0.08 28,636
Greece 93 0.34 0.21 0.08 24,464
Hungary 53 0.33 0.12 0.07 16,100
Iceland 2 0.18 0.00 0.04 36,667
Ireland 44 0.29 0.10 0.06 35,000
Italy 430 0.28 0.97 0.06 26,077
Japan 1,151 0.32 2.59 0.07 28,175
Latvia 8 0.24 0.02 0.05 14,348
Lithuania 14 0.26 0.03 0.06 15,882
Luxembourg 10 0.32 0.02 0.07 62,000
Malta 3 0.38 0.01 0.08 20,000
Netherlands 178 0.33 0.40 0.07 33,293
New Zealand 33 0.33 0.07 0.07 23,488
Norway 38 0.20 0.09 0.04 40,417
Poland 299 0.53 0.67 0.12 14,724
Portugal 52 0.28 0.12 0.06 17,736
Romania 90 0.41 0.20 0.09 10,140
Slovak Republic 36 0.38 0.08 0.08 17,778
Slovenia 17 0.35 0.04 0.08 24,500
Spain 318 0.29 0.72 0.07 24,013
Sweden 46 0.15 0.10 0.03 32,043
Switzerland 44 0.17 0.10 0.04 34,545
United Kingdom 510 0.28 1.15 0.06 30,000
United States 5,596 0.48 12.59 0.11 38,562
Total/average 11,662 0.39 26.24 0.09 30,105
$25 tax on CO2
Climate Finance Contribution
17
Table 3. Impacts of Carbon Pricing on Electricity Prices, 2008
Source: IEA (2010a), pp. 73-307, 314, 343, and OECD (2011b).
Notes: CO2 tax is calculated by multiplying the CO2 per kWh by an assumed tax of $25 per ton. This is an approximation, given that emissions rates would fall (moderately) in response to the tax, though on the other hand costs of switching to cleaner generation fuels would be reflected in higher prices. The total tax for residential electricity includes excise taxes and general sales/value added taxes. Some countries in Table 1 for which recent data is not available are not included in the above table. The United States does not impose taxes on electricity at the national level.
prices, with the proportionate price increase being higher in countries with low pre-existing retail
prices like the United States (Table 4, columns 1 and 2). Natural gas prices would rise by about
$1.50 per one thousand cubic feet, which amounts to about 15 percent of the average OECD
price projected for 2020. The price of coal would increase by about $45 per (short) ton, which
would more than double coal prices in countries like the United States (IEA, 2010a).
Increase in Industrial
Emissions Generation Cost Current Current Current Electricity Current
Country Rate from $25 CO2 tax Elect. Price CO2 tax Excise Tax Total Tax Price CO2 tax Excise Tax
Gram CO2/kWh US cents/kWh US cents/kWh US cents/kWh
(1) (2) (3) (4) (5) (6) (7) (8) (9)
Austria 183 0.5 26.2 1.7 13.2 29.9 15.4 3.0 17.2
Belgium 248 0.6 23.5 2.6 8.9 26.2 13.9 4.5 8.1
Czech Republic 544 1.4 19.2 7.1 0.8 16.7 14.8 9.2 1
Denmark 308 0.8 36.5 2.1 35.0 55.0 11.1 6.9 13
Finland 187 0.5 17.4 2.7 7.0 25.1 9.7 4.8 3.7
France 83 0.2 15.9 1.3 10.4 25.0 10.7 1.9 10.3
Germany 441 1.1 32.3 3.4 0 16.0 10.9 10.1 0
Greece 731 1.8 15.2 12.0 0.3 8.7 11.4 16.0 0
Hungary 331 0.8 20.6 4.0 0 18.4 16 5.2 0.8
Ireland 486 1.2 25.5 4.8 0 11.9 16.9 7.2 0
Italy 398 1.0 28.4 3.5 16.0 24.7 27.6 3.6 21.4
Japan 436 1.1 22.8 4.8 1.8 6.5 15.8 6.9 7.3
Luxembourg 315 0.8 23.7 3.3 7.1 12.8 13.6 5.8 9.9
Netherlands 392 1.0 25.8 3.8 12.5 17.2 14.1 7.0 13.3
New Zealand 214 0.5 15.2 3.5 0.0 11.1 7.1 7.5 0
Norway 5 0.0 13.3 0.1 13.0 33.0 5.9 0.2 20
Poland 653 1.6 16.7 9.8 3.9 21.9 12 13.6 5.4
Portugal 384 1.0 21.5 4.5 0 4.8 12.7 7.6 0
Slovak Republic 217 0.5 23.1 2.3 0 15.9 19.5 2.8 0
Spain 326 0.8 21.2 3.8 4.2 18.0 10.3 7.9 4.9
Sweden 40 0.1 19.4 0.5 17.9 38.0 8.3 1.2 0.8
Switzerland 27 0.1 16.4 0.4 2.5 9.6 9.4 0.7 4.4
United Kingdom 487 1.2 20.6 5.9 0 4.8 13.5 9.0 3.7
United States 535 1.3 6.84 19.6 0 0.0 11.6 11.6 0
Average 307 0.8 19.5 4.1 5.9 17.4 12.0 5.9 5.6
Residential
% of Electricity Price % of Electricity Price
18
Table 4. Impacts of Carbon Pricing on Gasoline Prices, 2009
Source: IEA (2010b).
23. There can be strong political opposition to these increases in energy prices.
Resistance may come from households—in their roles as electricity consumers and motorists—
and also industry—including downstream energy users, intermediate producers of energy, and
upstream (carbon-intensive) fuel suppliers.
Retail fuel price Vehicle excise tax
Country (unleaded gasoline) CO2 tax revenue relative to
US $/litre % of retail fuel price fuel expenditures
(1) (2) (3)
Australia 1.08 5.4 8.6
Austria 1.45 4.0 13.4
Belgium 1.83 3.2 14.5
Canada 0.91 6.4 4.4
Czech Republic 1.43 4.0 4.0
Denmark 1.78 3.3 28.0
Finland 1.78 3.2 17.7
France 1.68 3.4 5.7
Germany 1.80 3.2 7.0
Greece 1.40 4.1 26.5
Hungary 1.41 4.1 8.5
Ireland 1.53 3.8 34.0
Italy 1.71 3.4 10.1
Japan 1.29 4.5 22.2
Korea 1.40 4.1 11.8
Luxembourg 1.44 4.0 2.3
Mexico 0.70 8.3 1.1
Netherlands 1.87 3.1 37.8
New Zealand 1.05 5.5 24.5
Norway 1.89 3.1 29.3
Poland 1.32 4.4 0.9
Portugal 1.72 3.4 12.5
Slovak Republic 1.55 3.7 3.3
Spain 1.39 4.2 7.8
Sweden 1.59 3.6 5.3
Switzerland 1.39 4.2 35.2
Turkey 2.02 2.9 9.4
United Kingdom 1.55 3.7 11.8
United States 0.65 8.9 6.3

19
24. Higher energy prices may also undermine distributional objectives. This is because
they can impose a disproportionately large burden on poorer households, who tend to spend a
relatively large portion of their income on fuels and electricity. According to one study, a $15 per
ton CO2 tax in the United States in 2015 would impose a burden of 3.5 percent of income for the
lowest income decile, but only 0.8 percent of income for the highest income decile (Figure 1).
Figure 1. Distributional Incidence of Carbon Tax on US Households
Source: Metcalf (2007). Notes: Results are for a $15 per ton tax on CO2 in 2015, prior to recycling of revenues. The first and tenth deciles refer to the ten percent of households with lowest and highest income respectively.
25. Higher energy prices may cause competitiveness concerns for energy-intensive firms
competing in global markets (e.g., aluminum, steel, cement, plastics). Such firms may re-
locate activities to other countries where energy is cheaper (but perhaps more emissions
intensive) causing some moderate offsetting increase in emissions. This leakage problem is less
of a higher concern if carbon pricing is implemented across developed countries, though this
would still exempt some large competitors. Energy price impacts could always be limited by
setting lower carbon prices, though this is not desirable as it would reduce environmental
effectiveness and carbon market flows. Instead, policymakers may need to devise creative ways
to enhance the feasibility of effective carbon pricing proposals (see below).16
16
The burden of carbon prices may, in part, be borne by domestic fuel suppliers and power generators in the form of
lower producer prices. At least for the United States however, evidence suggests that most of the burden is instead
passed forward into higher energy prices for end-users (e.g., Bovenberg and Goulder 2001, Smith and others, 2002).
0.0
0.5
1.0
1.5
2.0
2.5
3.0
3.5
1 2 3 4 5 6 7 8 9 10
Per
cen
t o
f an
nu
al i
nco
me
Income decile

20
Other (domestic) carbon-related instruments
Electricity taxes (“wires charges”)
26. Taxes on electricity have significant revenue potential. A (relatively small) direct tax
of US 0.04 cents per kWh on power generation in developed countries, or a tax of $1 per ton on
electricity CO2 emissions (which would average about US 0.04 cents per kWh), would each raise
projected annual revenue in 2020 of about $5 billion, though even the latter policy would have a
trivial effect on emissions.17 Alternatively, a more substantial tax of $25 per ton on power sector
emissions would raise revenues of around $100 billion, or $10 billion for climate finance if
10 percent of revenues are earmarked.18
27. Pure electricity taxes (levied per kWh) perform poorly on environmental grounds
compared with carbon pricing. The CO2 reductions from electricity taxes are relatively modest
because these taxes only exploit a minor portion of reduction opportunities that are exploited
under carbon pricing—for example, electricity taxes do nothing to lower the emissions intensity
of power generation. If the electricity tax is scaled to CO2 emissions per kWh—effectively, this
policy is a tax on CO2 emissions from the power sector—environmental effectiveness is greatly
improved, though the policy still fails to reduce emissions outside of the power sector. Neither
form of electricity tax is therefore a good substitute for comprehensive carbon pricing. However,
if comprehensive carbon pricing is infeasible, taxing carbon emissions from the power sector
would be the next best option (combined with policies for other sectors), given that for many
countries the huge bulk of the low-cost opportunities for CO2 reduction are in the power sector
(e.g., Clarke and others, 2009).
28. If carbon emissions are priced, broader fiscal instruments may be preferable to
pure electricity taxes on cost-effectiveness grounds. As noted already, if environmental
considerations are already addressed through carbon pricing, raising further revenue
requirements from electricity taxes could involve higher economic costs than raising that revenue
from broader fiscal instruments: both policies have a (slight) contractionary effect on overall
economic activity, but in addition electricity taxes distort energy markets (once emissions
externalities have been corrected).
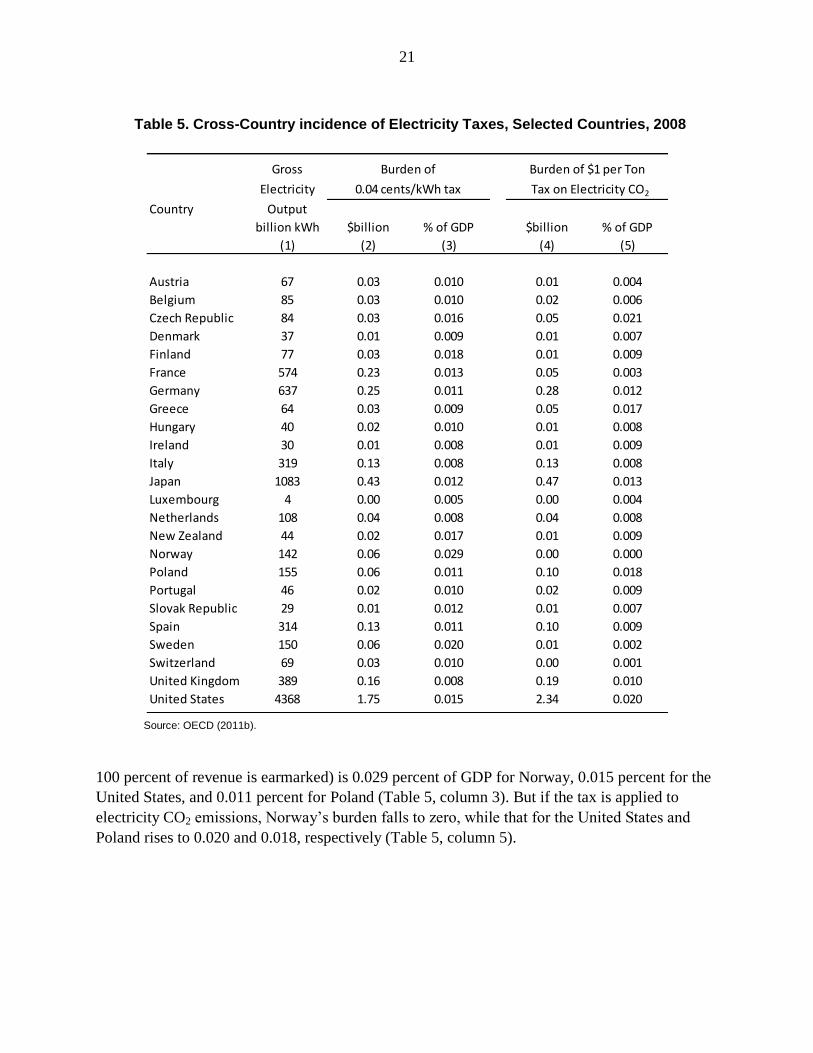
29. The distributional incidence of pure electricity taxes across countries is more even
than for taxes scaled to CO2 per kWh. This is because there is greater variation in electricity
CO2 emissions than in electricity consumption across countries. For example, if applied to 2008
emissions, the burden of climate finance contributions under the pure electricity tax (assuming
17
This was projected by the AGF based on an assumed electricity consumption of about 12,000 TWh in OECD
countries. This projection changed little in IEA (2010a), ―Current Policies‖ scenario, and there is only a modest
difference between electricity consumption in our developed county classification and OECD consumption.
18 This estimate assumes the policy would reduce power sector emissions by 20 percent.
21
Table 5. Cross-Country incidence of Electricity Taxes, Selected Countries, 2008
Source: OECD (2011b).
100 percent of revenue is earmarked) is 0.029 percent of GDP for Norway, 0.015 percent for the
United States, and 0.011 percent for Poland (Table 5, column 3). But if the tax is applied to
electricity CO2 emissions, Norway’s burden falls to zero, while that for the United States and
Poland rises to 0.020 and 0.018, respectively (Table 5, column 5).
Gross
Electricity
Country Output
billion kWh $billion % of GDP $billion % of GDP
(1) (2) (3) (4) (5)
Austria 67 0.03 0.010 0.01 0.004
Belgium 85 0.03 0.010 0.02 0.006
Czech Republic 84 0.03 0.016 0.05 0.021
Denmark 37 0.01 0.009 0.01 0.007
Finland 77 0.03 0.018 0.01 0.009
France 574 0.23 0.013 0.05 0.003
Germany 637 0.25 0.011 0.28 0.012
Greece 64 0.03 0.009 0.05 0.017
Hungary 40 0.02 0.010 0.01 0.008
Ireland 30 0.01 0.008 0.01 0.009
Italy 319 0.13 0.008 0.13 0.008
Japan 1083 0.43 0.012 0.47 0.013
Luxembourg 4 0.00 0.005 0.00 0.004
Netherlands 108 0.04 0.008 0.04 0.008
New Zealand 44 0.02 0.017 0.01 0.009
Norway 142 0.06 0.029 0.00 0.000
Poland 155 0.06 0.011 0.10 0.018
Portugal 46 0.02 0.010 0.02 0.009
Slovak Republic 29 0.01 0.012 0.01 0.007
Spain 314 0.13 0.011 0.10 0.009
Sweden 150 0.06 0.020 0.01 0.002
Switzerland 69 0.03 0.010 0.00 0.001
United Kingdom 389 0.16 0.008 0.19 0.010
United States 4368 1.75 0.015 2.34 0.020
Burden of
0.04 cents/kWh tax
Burden of $1 per Ton
Tax on Electricity CO2
22
Taxes on gasoline and petroleum consumption
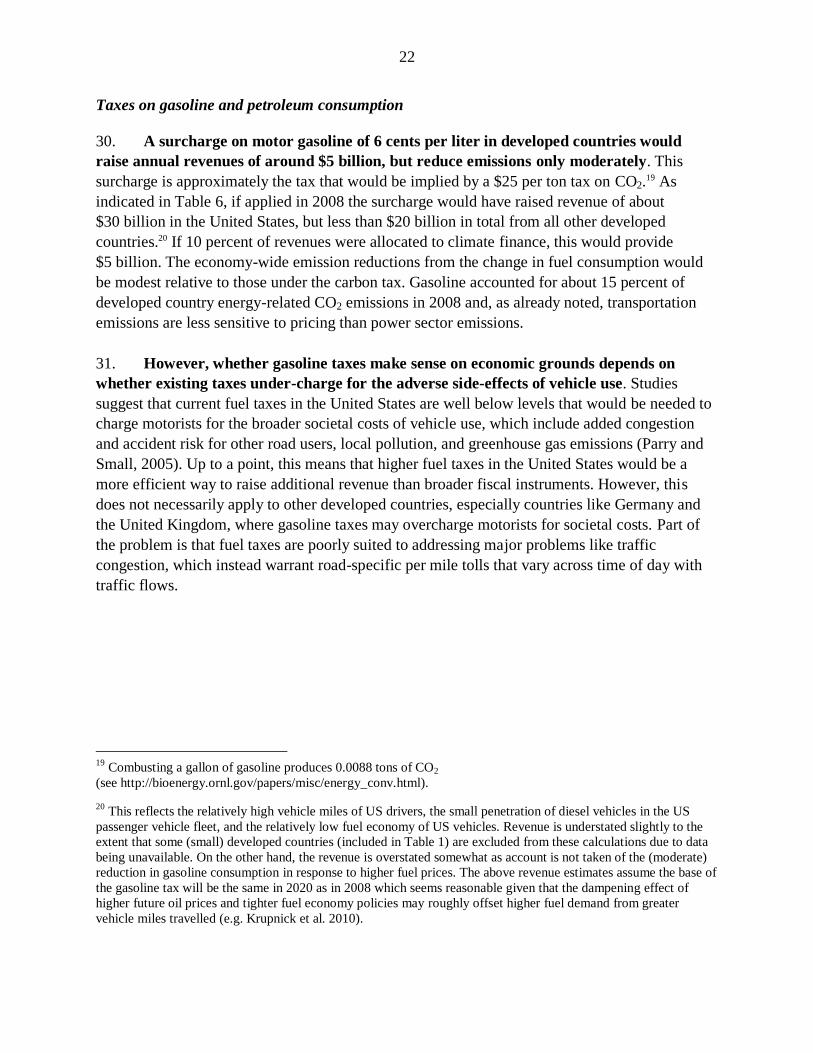
30. A surcharge on motor gasoline of 6 cents per liter in developed countries would
raise annual revenues of around $5 billion, but reduce emissions only moderately. This
surcharge is approximately the tax that would be implied by a $25 per ton tax on CO2.19 As
indicated in Table 6, if applied in 2008 the surcharge would have raised revenue of about
$30 billion in the United States, but less than $20 billion in total from all other developed
countries.20 If 10 percent of revenues were allocated to climate finance, this would provide
$5 billion. The economy-wide emission reductions from the change in fuel consumption would
be modest relative to those under the carbon tax. Gasoline accounted for about 15 percent of
developed country energy-related CO2 emissions in 2008 and, as already noted, transportation
emissions are less sensitive to pricing than power sector emissions.
31. However, whether gasoline taxes make sense on economic grounds depends on
whether existing taxes under-charge for the adverse side-effects of vehicle use. Studies
suggest that current fuel taxes in the United States are well below levels that would be needed to
charge motorists for the broader societal costs of vehicle use, which include added congestion
and accident risk for other road users, local pollution, and greenhouse gas emissions (Parry and
Small, 2005). Up to a point, this means that higher fuel taxes in the United States would be a
more efficient way to raise additional revenue than broader fiscal instruments. However, this
does not necessarily apply to other developed countries, especially countries like Germany and
the United Kingdom, where gasoline taxes may overcharge motorists for societal costs. Part of
the problem is that fuel taxes are poorly suited to addressing major problems like traffic
congestion, which instead warrant road-specific per mile tolls that vary across time of day with
traffic flows.
19
Combusting a gallon of gasoline produces 0.0088 tons of CO2
(see http://bioenergy.ornl.gov/papers/misc/energy_conv.html).
20 This reflects the relatively high vehicle miles of US drivers, the small penetration of diesel vehicles in the US
passenger vehicle fleet, and the relatively low fuel economy of US vehicles. Revenue is understated slightly to the
extent that some (small) developed countries (included in Table 1) are excluded from these calculations due to data
being unavailable. On the other hand, the revenue is overstated somewhat as account is not taken of the (moderate)
reduction in gasoline consumption in response to higher fuel prices. The above revenue estimates assume the base of
the gasoline tax will be the same in 2020 as in 2008 which seems reasonable given that the dampening effect of
higher future oil prices and tighter fuel economy policies may roughly offset higher fuel demand from greater
vehicle miles travelled (e.g. Krupnick et al. 2010).
23
Source: EIA (2011).
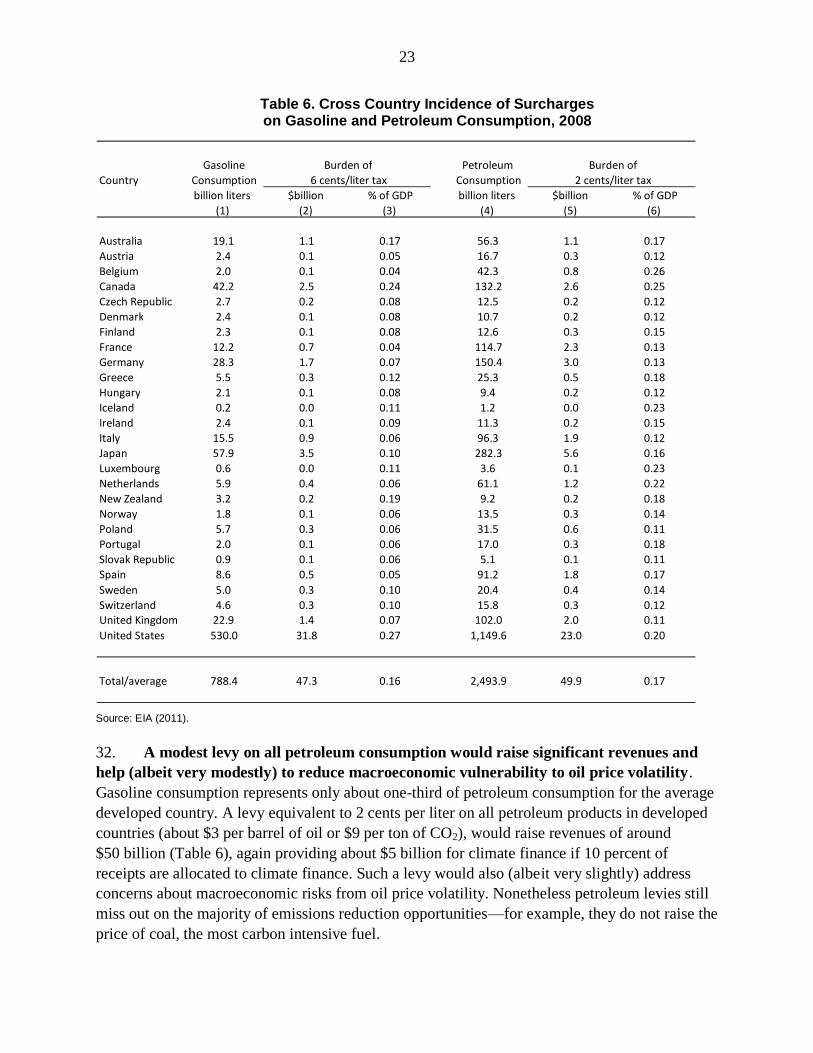
32. A modest levy on all petroleum consumption would raise significant revenues and
help (albeit very modestly) to reduce macroeconomic vulnerability to oil price volatility.
Gasoline consumption represents only about one-third of petroleum consumption for the average
developed country. A levy equivalent to 2 cents per liter on all petroleum products in developed
countries (about $3 per barrel of oil or $9 per ton of CO2), would raise revenues of around
$50 billion (Table 6), again providing about $5 billion for climate finance if 10 percent of
receipts are allocated to climate finance. Such a levy would also (albeit very slightly) address
concerns about macroeconomic risks from oil price volatility. Nonetheless petroleum levies still
miss out on the majority of emissions reduction opportunities—for example, they do not raise the
price of coal, the most carbon intensive fuel.
Gasoline Petroleum Country Consumption Consumption
billion liters $billion % of GDP billion liters $billion % of GDP (1) (2) (3) (4) (5) (6)
Australia 19.1 1.1 0.17 56.3 1.1 0.17 Austria 2.4 0.1 0.05 16.7 0.3 0.12 Belgium 2.0 0.1 0.04 42.3 0.8 0.26 Canada 42.2 2.5 0.24 132.2 2.6 0.25 Czech Republic 2.7 0.2 0.08 12.5 0.2 0.12 Denmark 2.4 0.1 0.08 10.7 0.2 0.12 Finland 2.3 0.1 0.08 12.6 0.3 0.15 France 12.2 0.7 0.04 114.7 2.3 0.13 Germany 28.3 1.7 0.07 150.4 3.0 0.13 Greece 5.5 0.3 0.12 25.3 0.5 0.18 Hungary 2.1 0.1 0.08 9.4 0.2 0.12 Iceland 0.2 0.0 0.11 1.2 0.0 0.23 Ireland 2.4 0.1 0.09 11.3 0.2 0.15 Italy 15.5 0.9 0.06 96.3 1.9 0.12 Japan 57.9 3.5 0.10 282.3 5.6 0.16 Luxembourg 0.6 0.0 0.11 3.6 0.1 0.23 Netherlands 5.9 0.4 0.06 61.1 1.2 0.22 New Zealand 3.2 0.2 0.19 9.2 0.2 0.18 Norway 1.8 0.1 0.06 13.5 0.3 0.14 Poland 5.7 0.3 0.06 31.5 0.6 0.11 Portugal 2.0 0.1 0.06 17.0 0.3 0.18 Slovak Republic 0.9 0.1 0.06 5.1 0.1 0.11 Spain 8.6 0.5 0.05 91.2 1.8 0.17 Sweden 5.0 0.3 0.10 20.4 0.4 0.14 Switzerland 4.6 0.3 0.10 15.8 0.3 0.12 United Kingdom 22.9 1.4 0.07 102.0 2.0 0.11 United States 530.0 31.8 0.27 1,149.6 23.0 0.20
Total/average 788.4 47.3 0.16 2,493.9 49.9 0.17
6 cents/liter tax Burden of
2 cents/liter tax
Table 6. Cross Country Incidence of Surcharges on Gasoline and Petroleum Consumption, 2008
Burden of
24
Overcoming resistance to carbon pricing
33. Given the pivotal importance of carbon pricing in mitigating global climate change,
novel strategies need to be developed to improve its feasibility. Appropriate strategies may
differ across countries depending on the nature of political obstacles.
34. One way to increase the feasibility of carbon pricing might be to use some of the
revenues for compensating target groups. Domestically-retained revenues from carbon pricing
could be used to adjust the broader tax/benefit system to offset the regressive effects of higher
energy prices on households. For example, revenues might fund both a general reduction in
personal income taxes rates and an earned income tax credit. However, tax reliefs (e.g., in the
form of lower corporate income tax rates) for energy-intensive firms in trade sensitive sectors
may be problematic as they complicate policy design, may compromise cost effectiveness, and
there is a risk that reliefs will become permanent.21 Alternatively, the competitiveness of trade
vulnerable industries might be preserved through border tax adjustments, but these are
contentious (Box 2).
35. An alternative approach is to scale back pre-existing, environmentally ineffective
energy taxes. In many countries, reducing pre-existing taxes on electricity and vehicle
ownership can go a long way in neutralizing the burden of carbon pricing on households and
firms (see below). Moreover, with appropriate carbon pricing in place, pre-existing excise taxes
on electricity and vehicles (though not value added or general sales taxes) are redundant as they
imply higher economic costs for a given carbon reduction.22 Furthermore, replacing
environmentally ineffective policies with policies targeted more directly at dirty fuels—
especially coal—may significantly alleviate local environmental problems.23 The drawback is
that net revenues raised from carbon pricing are lower as a result of these tax shifts.
36. In many OECD countries, the impacts of carbon taxes on electricity prices could be
offset by lowering pre-existing taxes on electricity use.24 As indicated in Table 3, 12 out of the
21
The last federal cap-and-trade proposal in the United States (the Waxman-Markey bill) contained a complex
allocation of emissions allowances designed to compensate a range of different industries and prevent a large
increase in residential electricity prices—less than 10 percent of allowances were to be auctioned initially (see
www.govtrack.us/congress/bill.xpd?bill=h111-2454).
22 A carbon tax and an excise tax on electricity together will place too much of the burden of a given emissions
reduction on electricity conservation and too little on other abatement opportunities. Similarly, a carbon tax and
excise tax on vehicle ownership will place too much of the burden of emissions reductions on reduced vehicle
demand and too little on other opportunities.
23 For example, coal combustion is a major cause of local air pollution, which poses mortality risks for vulnerable
populations (NRC, 2009).
24 Under Energy Directive 2003/96/EC, minimum excise taxes on electricity are imposed in EU countries, though
there are current discussions to revise this Directive to target carbon emissions more directly.
25
Box 2. Carbon Pricing and Border Tax Adjustments
In principle, imposing taxes on carbon ―embodied‖ in imports can be an efficient way to address concerns about
emissions leakage. This will ensure that foreign-produced output is treated, in climate terms, the same as domestic
production. Such border tax adjustments (BTAs) can therefore help mitigation efforts without impacting the
international competitiveness of domestic industry, while potentially also encouraging participation by other
countries, as this will obviate the need for BTAs. And from a wider perspective of global efficiency too, such
adjustments can in principle have a role to play (Keen and Kotsogiannis, 2011).
Because of the product or sector-specificity required, BTAs could be administratively complex. Determining the
appropriate (equivalent) carbon tax for any given product is not straightforward. BTAs should accurately reflect
the production process used by the exporting firm, including the use of inputs and their carbon content.
Information on this will often not be available and generating it can be costly and easily give rise to arbitrary
decisions and inappropriate outcomes. One major operational challenge is that climate change-related policies
often will target plants or enterprises in certain industries, whereas the application of BTAs will (must) center on
the products that are cleared through Customs at the border. As argued by Moore (2010) the precedents in those
areas of trade policy where detailed information is needed to determine whether and how much to tax imports –
most notably antidumping and countervailing duty mechanisms – are not encouraging. Aside from the formidable
technical challenges of accurately assessing the carbon footprints-cum-GHG emissions that have been generated
by in producing imported products, the history of the use of contingent trade policies suggests that there is a high
probability that domestic import-competing industries will lobby and capture the process to their advantage.
Important legal and equity issues also need to be considered. There has been much discussion and argument
regarding the WTO compatibility of trade measures that are related to domestic measures to reduce GHG
emissions. In the absence of concrete disputes there is significant uncertainty whether BTAs would be deemed to
be consistent with WTO obligations and much will depend on the specifics of any BTA regime.1
Many developing countries oppose a globally uniform carbon tax on the grounds that that it is appropriate for
those countries that are primarily responsible for global warming to take most action to reduce GHG emissions.
The unilateral application of BTAs as part of the implementation of carbon tax regimes could give rise to
retaliation. Indeed, some major developing countries have indicated that they will consider such a response.
Moreover, studies suggest that using trade policy to take action against countries that have decided not to apply a
carbon tax may do little to further the goal of reducing global GHG emissions (e.g., McKibben and Wilcoxen,
2009; Dong and Whalley, 2009; Rutherford, 2010). These suggest that BTAs could have adverse consequences on
developing countries’ output and trade. The magnitude of the effects will depend on how the BTAs are applied.
Mattoo et al. (2009), for example, note that BTAs imposed by OECD nations will impact developing country
manufacturers much more detrimentally if tariffs are based on the carbon content embodied in imports than if they
were to be based on the carbon content of competing domestic production in the jurisdiction imposing a carbon
tax.
_____________________ 1 Many analysts have concluded that BTAs motivated on the basis of a national carbon tax are likely to violate the
WTO’s national treatment requirement. However, in practice a government has significant scope to justify the use
of BTAs under ―general exceptions‖ provision that permits countries to use trade policy measures to protect the
environment, so long as they apply to all trading partners equally and are least trade-restrictive (see Low
et al., 2011).
24 countries could completely neutralize the impacts of carbon pricing on residential electricity
prices by scaling back excise taxes on electricity use (i.e., these taxes exceed, often by a large
amount, the potential pass through of carbon pricing in residential prices). Similarly, 10 countries
26
(mostly the same ones) could fully offset the effect of carbon pricing on industrial electricity
prices by cutting excise taxes.25
37. Similarly in many developed countries, the burden on motorists can be
approximately offset by lowering vehicle ownership taxes as carbon pricing is introduced
(though again this reduces net revenue impacts). Annual revenues from vehicle ownership
taxes (primarily sales taxes, registration fees, and road taxes) are equivalent to more than
5 percent of annual expenditures on motor fuels in 21 out of 26 developed countries and exceed
10 percent of fuel expenditures in 14 countries (Table 4, column 3). In fact, in 22 out of
26 developed countries ownership taxes could be scaled back prevent an increase in the total tax
burden (fuel plus vehicle ownership) on the average motorist (compare columns 2 and 3 in
Table 4).
Feebates: An alternative to carbon taxes
38. If broad carbon pricing is infeasible, feebates are a possible alternative. Feebates are
tax/subsidy combinations that can be used to lower the emissions intensity of power generation
and improve the energy efficiency of vehicles, household appliances, etc. A feebate for the
power generation sector, for example, would impose a tax (or fee) per kWh on relatively dirty
generators, equal to an emissions price times the difference between their CO2 per kWh
(averaged across their portfolio of plants) and a ―pivot point‖ CO2 per kWh. And relatively clean
generators would receive a subsidy (rebate) per kWh equal to the same emissions price times the
difference between the pivot point and their average CO2 per kWh. The policy is cost effective
because all generators receive the same reward (lowering their tax rate or raising their subsidy)
for reducing CO2 intensity through switching to lower or zero carbon fuels and/or improving
plant efficiency. A combination of feebates across different sectors can exploit many (though not
all) of the economy-wide CO2 reduction opportunities. Feebates can be designed to raise
revenue—the more revenue they raise the greater their impact on the price of energy and energy-
using products.26
39. Power sector feebates can raise a significant amount of revenue. For example, a
feebate price of $25 per ton of CO2 per kWh, and a pivot point set at 90 percent of the projected
25
At the household level, 22 out of 26 countries could fully neutralize the effects of carbon pricing by reducing
some combination of excise and general value added (or sales) taxes. However, from an economic perspective it is
generally not desirable to cut value added taxes as this effectively subsidizes electricity relative to other goods
(rather than reducing excessive taxation of electricity). In this latter case, too little of the burden of emissions
abatement will come from reduced electricity demand from a cost-effectiveness perspective.
26 The feebate for power generation is equivalent to a tax on generators’ CO2 emissions, with a portion of the
revenues used to finance a subsidy per kWh of generation. The lower the pivot point, the greater the amount of
revenue raised, the greater the impact on electricity prices, and the more the feebate resembles a simple tax on power
sector CO2 emissions.
27
industry-average CO2 per kWh, would yield revenues of approximately $6 billion in 2020 for the
United States.27 Given that the United States accounts for about 60 percent of power sector
CO2 emissions in developed countries, this suggests total revenues from similar feebate policies
applied more broadly could be around $10 billion. To maintain revenues over time the pivot
point would need to be reduced, perhaps annually, as the emissions intensity of power generation
falls progressively (though presumably this revenue loss would be partially offset by a rising
emissions price).
40. Feebates can also cost-effectively increase energy efficiency and raise further
revenues. Most obviously, feebates can be applied to new passenger vehicles, with a tax on
relatively fuel inefficient vehicles—equal to an emissions price times the difference between
their CO2 per mile and a pivot point CO2 per mile—and a subsidy for relatively fuel efficient
vehicles—equal to the emissions price times the difference between the pivot point and their CO2
per mile (e.g., Small, 2010). Again, the policy is cost effective as it provides the same reward
across all vehicle classes and across all possibilities for reducing CO2 per mile
(e.g., improvements in engine efficiency, reductions in vehicle size, use of lighter materials).
Feebates could also be used to promote increased efficiency of electricity-using durables
(e.g., refrigerators, air conditioners). Across sectors, a set of feebates is cost effective if a
uniform price is imposed on emissions from different sectors.
41. Feebates may be more acceptable than carbon taxes, because they avoid a large
increase in energy prices. For example, under the feebate discussed above for the power sector,
the increase in residential and industrial electricity prices is only about one-tenth as large as
under the carbon tax.28 However, feebates raise much less revenue—and the more they are
designed to raise revenue, the greater their impact on energy prices (as net tax payments are
passed forward into prices).
42. Neither feebates nor the other schemes for preventing large energy price increases
alleviate the burden on upstream (domestic) coal suppliers. This is because all the carbon
pricing schemes discussed above are designed to promote a substantial shift away from carbon-
intensive fuels—unless there is widespread development and deployment of carbon capture and
storage technologies, which face many technical and legal obstacles (e.g., Jepma and
Hauck, 2010).
27
In (spreadsheets underlying) Krupnick et al. (2010), projected power generation for the United States in 2020 is
4,125 billion kWh and the projected emissions intensity is 0.000597 tons per kWh. Therefore on average (after the
90 percent rebate), there will be a net tax payment of 0.15 cents per kWh. This assumes the feebate covers all (new
and existing) generation sources, rather than just new sources.
28 Loosely speaking, the price increase is proportional to the amount of revenues that are raised, to the extent that
revenues are eventually passed forward into higher prices for end users.
28
IV. BROADER (NON-CARBON-RELATED) FISCAL INSTRUMENTS
43. Traditional tax instruments and new taxes on financial institutions could be
important revenue sources for climate finance. Although carbon pricing is critical in
efficiently curbing CO2 emissions, there is no need to earmark funds from carbon pricing for
climate finance. Indeed, the revenue from carbon pricing could flow into national budgets
instead, and climate finance can be based on other criteria than carbon emissions. This raises the
question as to what other, domestic revenue sources would be appropriate in developed countries
to generate additional contributions for climate finance. In principle, countries could reshuffle
expenditures in order to free up funds for climate finance, without raising extra revenue.
However, they could also increase revenue from traditional domestic taxes. In the latter case, the
question is what tax would be most desirable. The discussion below builds on the detailed
analyses of revenue-raising possibilities in advanced and emerging economies in IMF (2010b)
and of options for new taxes on the financial sector in IMF (2010a).
44. The value-added tax (VAT) has proved to be a relatively efficient source of revenue,
generating fewer distortions than many other taxes.29 Almost all developed countries―with
the exception of Saudi Arabia and the United States―have a VAT. On average, the VAT raises
over 5 percent of GDP in revenue in these countries. However, in many countries exemptions
and excessive rate differentiation reduce the effectiveness of the VA—achieving little equity
gain that could not be better achieved by more directly—targeted instruments, and creating
further distortions—as well as increasing costs of administration and compliance. Hence, there is
generally substantial scope for further improving the revenue performance of the VAT by
reducing exemptions and eliminating reduced rates, combined if needed by measures to address
any adverse distributional impact. In a number of emerging economies with a VAT, there is
often a compliance gap, that is, a loss of revenue due to poor tax compliance, suggesting that
improved enforcement would allow for substantial revenue gains. In countries with very low
rates, such as Japan, a higher VAT rate could add to revenue. In countries without a VAT, its
introduction is a leading option for substantially enhancing revenues.
45. Many countries have scope to increase revenues from excises on tobacco and
alcohol. Their yield has been declining over the last decades, partly reflecting falling real tax
rates. Policymakers might have moderated rate increases to avoid cross-border shopping and
smuggling. International cooperation can help avoid such threats and allow countries to increase
their revenue yield. Scope for new types of excises on specific products, however, seems fairly
limited. Taxing telecom services is sometimes suggested, partly to tax rents (where these have
not been collected by auction). Caution is needed, however, as this can undermine valuable
network externalities and distinguishing, as would be appropriate, between personal and business
use is typically hard.
29
See e.g., Norregaard and Kahn (2007) for a general assessment and Arnold (2008) for empirical evidence.
29
46. The corporate income tax (CIT) seems an unlikely candidate as a source of additional
revenue. International tax competition over the past decades has intensified, and led to
significant reductions in statutory CIT rates. Many countries have, at the same time, broadened
their tax bases by adjusting tax depreciation rules and restricting deductions (e.g., for interest).
There remains some scope for base broadening in some countries, but the potential revenue gains
are fairly modest. International coordination could perhaps strengthen the revenue potential of
the CIT, but this remains contentious in principle and quite remote in practice.
47. The personal income tax (PIT) is generally considered key to achieving equity
objectives and might have some potential for higher revenue, although not likely through
rate increases. High effective marginal rates of PIT can have damaging incentive effects on both
real activity and compliance. For instance, while incentive effects on labor supply of primary
workers are generally found to be modest, tax effects on the participation decisions of secondary
workers (mainly married females) can be substantial. Moreover, high marginal tax rates for low-
wage earners tend to create large labor-market distortions by driving unskilled workers out of the
formal labor market. There is also significant evidence that higher rates of PIT encourage tax
avoidance and evasion, particularly for high income individuals. These considerations do not
necessarily point to applying low PIT rates across the board, such as envisioned under flat tax
regimes. Rather, a case can be made for a progressive system, combining rates that rise with
income and with targeted tax credits where distortions are largest. Some countries may still have
scope for base-broadening and simplification within—and higher revenue from—the PIT by
reducing allowances and exemptions. Personal income taxes on capital income are generally
non-neutral―taxing some but exempting other forms of capital income or applying different
rates to different sources of income―leaving some scope for higher revenue from PIT. Yet, the
opportunities for rate increases are limited in light of the disincentive and avoidance effects it
will cause.
48. Recurrent property taxes are a promising source of increased revenue for a number
of countries. Efficiency and fairness arguments strongly favor the use of property taxes: they
appear to have only limited effects on growth, and to be borne mainly by the well-off. At present,
they yield approximately 3 percent of GDP in Canada, the United Kingdom, and the United
States, but well below 1 percent in other developed countries. This suggests significant untapped
potential, but realizing this requires overcoming practical obstacles such as administrative
complexities and unpopularity in light of their transparency. Nonetheless, property taxation has
clear potential for significant and relatively efficient revenue enhancement in several countries.
49. Taxes on the financial sector have received increased attention during recent years.
There are several forms, as described and discussed in IMF (2010b) and (European
Commission, 2010). ―Bank taxes‖ have been introduced by several countries over the last two
years or so, in some cases contributing to general revenue in others feeding a resolution fund.
Their revenue yield, however, is relatively low, and seems unlikely to increase substantially.
Broad-based financial transactions taxes have attracted considerable popular support, and their
30
adoption has recently been proposed by the European Commission.30 Advocates argue that an
FTT can raise substantial revenue at a low rate and may improve financial market performance
by discouraging high-frequency trading. Others see drawbacks and risks. For instance, an FTT
would increase the cost of capital and so could have a significant adverse impact on long-term
economic growth; their real burden will likely fall on final consumers rather than on actors in the
financial sector; and these taxes are particularly vulnerable to avoidance and evasion. IMF
(2001b)31 stresses the feasibility of taxing a wide range of financial transactions, and the revenue
this might yield, but concludes that a Financial Activities Tax (FAT) is more attractive. This is a
tax that would be levied on the sum of profits and remuneration of financial institutions
(variously defined). In one form, the FAT would effectively be a tax on value added in the
financial sector and so and serve as an (imperfect) offset to any tendency of the financial sector
becoming too large because of the commonplace exemption of financial services under the VAT.
30
See http://ec.europa.eu/taxation_customs/taxation/other_taxes/financial_sector/index_en.htm
31 See also Brondolo (2011) and Matheson (2011).
31
V. CONCLUSION
50. Broad-based, revenue-raising, carbon pricing policies (i.e., carbon taxes and cap-
and-trade systems with allowance auctions) are a particularly promising source of climate
finance. If scaled appropriately, these policies can raise substantial revenues—about $25 billion
if 10 percent of revenues are earmarked. These policies automatically exploit all possible
opportunities for reducing carbon emissions across all sectors of the economy—other carbon-
related instruments (whether fiscal or not) are less effective in exploiting these reduction
opportunities. Carbon pricing instruments also provide across-the-board incentives for clean
technology development and (with appropriate crediting provisions) maximize the breadth of
international carbon markets for promoting clean development in low-income countries. And,
because of all these benefits, carbon-pricing policies of the scale considered here are a more
attractive source of climate finance than broader (non-carbon-related) fiscal instruments.
51. There are many options for improving the acceptability of carbon pricing. These
range from scaling back other (environmentally weaker) taxes in the power and transport sectors
to help neutralize the overall burden on households and firms, to broader adjustments to the
fiscal system targeted, for example, at low-income households. Another promising option is
feebates to promote energy efficiency and de-carbonization of the power sector—under this
approach, policymakers can choose the point at which firms pay taxes or receive rebates to trade
off raising net revenue against impacts on energy prices. The drawback of these schemes is that
they result in lower overall revenues for climate finance, fiscal consolidation, or other purposes.
32
References
Atkinson, Anthony B., ed., 2004, New Sources of Development Finance (Oxford: Oxford
University Press).
Bovenberg, A. Lans, and Lawrence H. Goulder, 2001, ―Neutralizing the Adverse Industry
Impacts of CO2 Abatement Policies: What Does It Cost?‖ In Behavioral and
Distributional Effects of Environmental Policy, C. Carraro and G. Metcalf ed., pp. 45–85
(Chicago: University of Chicago Press).
Brondolo, J., 2011, Taxing Financial Transactions: An Assessment of Administrative Feasibility,
IMF Working Paper 11/185 (Washington: International Monetary Fund).
Clarke and others, 2009, ―International Climate Policy Architectures: Overview of the EMF 22
International Scenarios,‖ Energy Economics Vol. 31, pp. S64–S81.
Dong, Y. and J. Whalley, 2009, ―How Large are the Impacts of Carbon Motivated Border Tax
Adjustments?‖ EPRI Working Paper (http://economics.uwo.ca/centres/epri/).
Energy Information Administration, 2011, International Energy Statistics (Washington: U.S.
Department of Energy). Available at: www.eia.gov/cfapps/ipdbproject/IEDIndex3.cfm.
European Commission, 2010, Financial Sector Taxation, Taxation Paper No. 25, DG Taxation
and Customs Union. (Brussels).
Eyraud and others, 2011, Who’s Going Green and Why? Trends and Determinants of Green
Investment, IMF Working Paper (Washington: International Monetary Fund).
Harberger, Arnold, C., 1964, ―The Measurement of Waste,‖ American Economic Review
Vol. 54, pp. 58–76.
International Energy Agency, 2010a, World Energy Outlook 2010 (Paris: OECD, IEA).
International Energy Agency, 2010b, Energy Prices and Taxes, Fourth Quarter (Paris: OECD,
IEA).
International Monetary Fund, 2010a, A Fair and Substantial Contribution by the Financial
Sector, Final Report for the G-20. Available via the Internet:
www.imf.org/external/np/g20/pdf/062710b.pdf .
______, 2010b, From Stimulus to Consolidation: Revenue and Expenditure Policies in Advanced
and Emerging Economies (Washington).
33
______, 2011, Market-Based Instruments for International Aviation and Shipping as a Source of
Climate Finance (Washington).
Jepma, Catrinus, and D. Hauck, 2010, ―The Economics of Carbon Capture and Storage: An
Update,‖ International Review of Environmental and Resource Economics, Vol. 4,
pp. 221–60.
Keen, Michael, and C. Kotsogiannis, 2011, Coordinating Climate and Trade Policies: Pareto
Efficiency and the Role of Border Tax Adjustments (Washington: International Monetary
Fund).
Krupnick and others, 2010, Toward a New National Energy Policy: Assessing the Options,
(Washington: Resources for the Future and National Energy Policy Institute).
Matheson, Thornton, 2011, ―Taxing Financial Transactions: Issues and Evidence,‖ IMF Working
Paper 11/54 (Washington: International Monetary Fund).
Mattoo and others, 2009, ―Reconciling Climate Change and Trade Policy,‖ World Bank Policy
Research Working Paper 5123 (Washington).
McKibbin, Warwick, and P. Wilcoxen, 2009, ―The Economic and Environmental Effects of
Border Tax Adjustments for Climate Change Policy,‖ Lowy Institute Working Paper
(Sydney).
Metcalf, Gilbert, 2007, ―A Proposal for a U.S. Carbon Tax Swap: An Equitable Tax Reform to
Address Global Climate Change,‖ The Hamilton Project (Washington: Brookings
Institution).
Moore, Michael, 2010, ―Implementing Carbon Tariffs: A Fool’s Errand,‖ World Bank Policy
Research Paper (Washington: The World Bank Group).
Organization for Economic Cooperation and Development, 2012, OECD Environmental Outlook
to 2050, (Paris: OECD, forthcoming).
______, 2011a, Development Perspectives for a Post-Copenhagen Climate Financing Architecture,
(Paris: OECD).
______, 2011b, OECD Library. Database available via the Internet: www.oecd-ilibrary.org .
Parry, Ian W.H., and K. A. Small, 2005, ―Does Britain or The United States Have the Right
Gasoline Tax?‖ American Economic Review Vol. 95, pp. 1276–89.
34
______, and R. C. Williams, 2011, ―Moving U.S. Climate Policy Forward: Are Carbon Tax Shifts
the Only Good Alternative?‖ In Robert Hahn and Alistair Ulph (eds.), Climate Change and
Common Sense: Essays in Honor of Tom Schelling (Oxford University Press, forthcoming).
Rutherford, Thomas, 2010, ―Climate-Linked Tariffs: Practical Issues,‖ ETH Zurich Working
Paper (Switzerland).
Sijm, Jos, K. Neuhoff and Y. Chen, 2006, ―CO2 Cost Pass-Through and Windfall Profits in the
Power Sector,‖ Climate Policy, Vol.6, No.1, pp. 49–72.
Smith, Anne E., M. E. Ross, and W. D. Montgomery, 2002, ―Implications of Trading
Implementation Design for Equity-Efficiency Tradeoffs in Carbon Permit Allocations,‖
Working Paper (Washington: Charles River Associates).
Stern, Nicholas, 2007, The Economics of Climate Change: The Stern Review (Cambridge, U.K.:
Cambridge University Press).
United Nations, 2010, Report of the Secretary-General’s High-Level Advisory Group on Climate
Change Financing (New York).
U.S. Interagency Working Group on Social Cost of Carbon, 2010, Technical Support Document:
Social Cost of Carbon for Regulatory Impact Analysis Under Executive Order 12866
(Washington: United States Government).
World Bank and International Monetary Fund, 2005, Moving Forward: Financing Modalities
Toward the MDGs, Paper for the Development Committee, 2005-8 (Washington).
______, 2011, Mobilizing Climate Finance, Paper for the G20 Finance Ministers (Washington).