international monetary fund annual report 1977
TRANSCRIPT


ANNUAL REPORT1977
©International Monetary Fund. Not for Redistribution

This page intentionally left blank
©International Monetary Fund. Not for Redistribution
INTERNATIONAL MONETARY FUND
ANNUAL REPORT
OF THE
EXECUTIVE DIRECTORS FOR THEFISCAL YEAR ENDED APRIL 30, 1977
WASHINGTON, D.C.
©International Monetary Fund. Not for Redistribution
This page intentionally left blank
©International Monetary Fund. Not for Redistribution

Contents
PageLetter of Transmittal xi
Chapter 1. DEVELOPMENTS IN THE WORLD ECONOMY 1Introduction 1Domestic Activity and Policies 2
Industrial Countries 2Primary Producing Countries 6
Trends in World Trade 9Volume of Trade 9Foreign Trade Prices 10
International Adjustment Process 12Background Considerations 12Major Oil Exporting Countries 14Industrial Countries 14More Developed Primary Producing Countries 19Less Developed Primary Producing Countries 20Conclusions 24
Chapter 2. DEVELOPMENTS IN THE INTERNATIONAL MONETARY SYSTEM . . 25Exchange Rate Arrangements 25Exchange Rate Changes and Uncertainty 27The Role of the Exchange Rate in the Adjustment Process 28Reserve Developments 35Factors Affecting the Adequacy of Reserves 38
Chapter 3. ACTIVITIES OF THE FUND 45Second Amendment of the Articles 45
By-Laws, Rules and Regulations, and General Decisions 45Surveillance over Exchange Rate Policies 46
The Sixth and Seventh General Reviews of Quotas 46Supplementary Credit Facility 47Special Drawing Account 47
Allocations of SDRs and the Basic Period 48Transactions with Designation 48Transactions by Agreement 48Transactions and Operations Between Participants and
the General Account 49Reconstitution 49BIS as a Holder of SDRs 50Valuation of SDR, Its Interest Rate, and the Rate of Remuneration . . 50
v
©International Monetary Fund. Not for Redistribution
CONTENTS
PageTransactions and Operations in the General Account 50
Gold Tranche Purchases 52Credit Tranche Purchases and Stand-By Arrangements 52Purchases Under the Compensatory Financing Facility 53Extended Fund Facility 53Buffer Stock Facility 53Oil Facility 54Repurchases 54Use of Currencies in Fund Transactions 55Borrowing, Interest, and Repayments by the General Account 57Borrowing for the Oil Facility 57General Arrangements to Borrow 57Borrowing from the Swiss National Bank 58Gold Sales 58Charges 61Remuneration 63Income, Expenses, and Reserves 64
The Subsidy Account 64The Trust Fund 66Consultations with Member Countries 67Training and Technical Assistance 68Relations with Other International Organizations 69Membership, Quotas, and Participation in the Special Drawing Account 71Executive Directors and Staff 71Publications 71
Appendices 73I. The Fund in 1976/77 77
II. Principal Policy Decisions of the Executive Board and Reportby the Managing Director 101
III. Press Communiqués and Announcements of the InterimCommittee and the Development Committee 112
IV. Executive Directors and Voting Power 120V. Changes in Membership of Executive Board 123
VI. Administrative Budget 128VII. Comparative Statement of Income and Expenses 130
VIII. Financial Statements • • • • 131
Index . . 157
LIST OF TABLES
Chapter 1. DEVELOPMENTS IN THE WORLD ECONOMY1. Industrial Countries: Changes in Output and Prices, 1962-76 32. Primary Producing Countries : Growth of Real Output, 1967-76 . . . . 73. Primary Producing Countries: Price Increases, 1967-76 84. World Trade Summary, 1962-76 95. Terms of Trade Developments, 1962-76 116. Global Structure of Current Account Balances 137. Global Balance of Payments Summary, 1973-76 158. Industrial Countries: Balance of Payments Summaries, 1973-76 . . . 169. Non-Oil Developing Countries: Current Account Financing, 1973-76 21
VI
©International Monetary Fund. Not for Redistribution
CONTENTS
PageChapter 2. DEVELOPMENTS IN THE INTERNATIONAL MONETARY SYSTEM
10. Official Reserves, End of Years 1969-76 and End of May 1977 3811. Distribution of Reserves, End of Years 1950, 1960, and 1970-76 . . . 4212. Composition of Reserve Change, 1970-76 4313. Composition of Reserve Change by Area, 1976 4414. Official Holdings of Foreign Exchange, by Type of Claim, End of
Years, 1970-76 44
Chapter 3. ACTIVITIES OF THE FUND15. Use and Receipt of SDRs in Transactions with Designation, Fiscal
Year Ended April 30, 1977 4816. Use and Receipt of SDRs in Transactions by Agreement, Fiscal Year
Ended April 30, 1977 4917. Acquisitions of SDRs for Reconstitution from the Fund's General
Account, January 1, 1972-April 30, 1977 5018. Flow of Transactions in the General Account and Resulting Stocks,
Fiscal Years Ended April 30, 1973-77 5119. Changes in Members' Super Gold Tranche Positions, Fiscal Years
Ended April 30, 1975-77 5620. Selected Data on Gold Auctions on Behalf of the Trust Fund,
June 2, 1976-June 1, 1977 5921. Summary of Average Rates of Periodic Charges and Remuneration,
Fiscal Years Ended April 30, 1976 and 1977 6222. Subsidy Account: Total Use of 1975 Oil Facility by Most
Seriously Affected Members and Subsidy Paid for the YearsEnded April 30, 1976 and 1977 65
23. Subsidy Account: Contributions 6524. Trust Fund Investments in U.S. Government Obligations
on June 30, 1977 67
LIST OF CHARTS
Chapter 1. DEVELOPMENTS IN THE WORLD ECONOMY1. Semiannual Changes in Output and Prices in Industrial Countries,
First Half 1973-First Half 1977 42. Indices of Prices of Commodities, Except Oil, Exported by Primary
Producing Countries, 1972-June 1977 113. Industrial Countries: Effective Exchange Rates, 1975-June 1977 . . . 184. Industrial Countries: Short-Term Interest Rates, 1974-June 1977 . . 195. Non-Oil Developing Countries: Debt and Debt Service
Ratios, 1969-77 226. Non-Oil Developing Countries: Share of External Debt Owed to
Various Groups of Creditors, End 1967-End 1976 23
Chapter 2. DEVELOPMENTS IN THE INTERNATIONAL MONETARY SYSTEM7. Indicator of Uncertainty of Future Exchange Rates Against the
U.S. Dollar, January 1973-December 1976 298. Effective Exchange Rates and Relative Prices, 1969-76 319. Relative Prices, the Current Account Balance, and the Effective
Exchange Rate, 1972-76 3310. Effective Exchange Rate and the Terms of Trade 3411. Level and Composition of Reserves, End of Period, 1951-March 1977 3612. Level and Distribution of Reserves, End of Period, 1951-March 1977 37
Vll
©International Monetary Fund. Not for Redistribution
CONTENTS
PageChapter 3. ACTIVITIES OF THE FUND
13. Use of Fund's Resources as at April 30, 1968-77 5114. Relationship Between Periodic Charges and Total of Remuner-
ation and Borrowings Net of SDRs (Excluding Oil Facility),Years Ended April 30, 1974-77 61
15. Rate of Remuneration and Short-Term Interest Rates,July 1975-June 1977 63
The following symbols have been used throughout this Report:
( . . . ) indicate that data are not available;
(—) indicates that the figure is zero or less than half the final digitshown, or that the item does not exist;
(-) is used between years or months (e.g., 1970-77 or January-June)to indicate the years or months covered, including the beginningand ending years or months;
(/.) is used between years (e.g., 1976/77) to indicate a fiscal year.
"Billion" means a thousand million.
Minor discrepancies between constituent figures and totals are due torounding.
The classification of countries employed in the Report is indicated in Tables 1and 2 on pages 3 and 7.
viii
©International Monetary Fund. Not for Redistribution
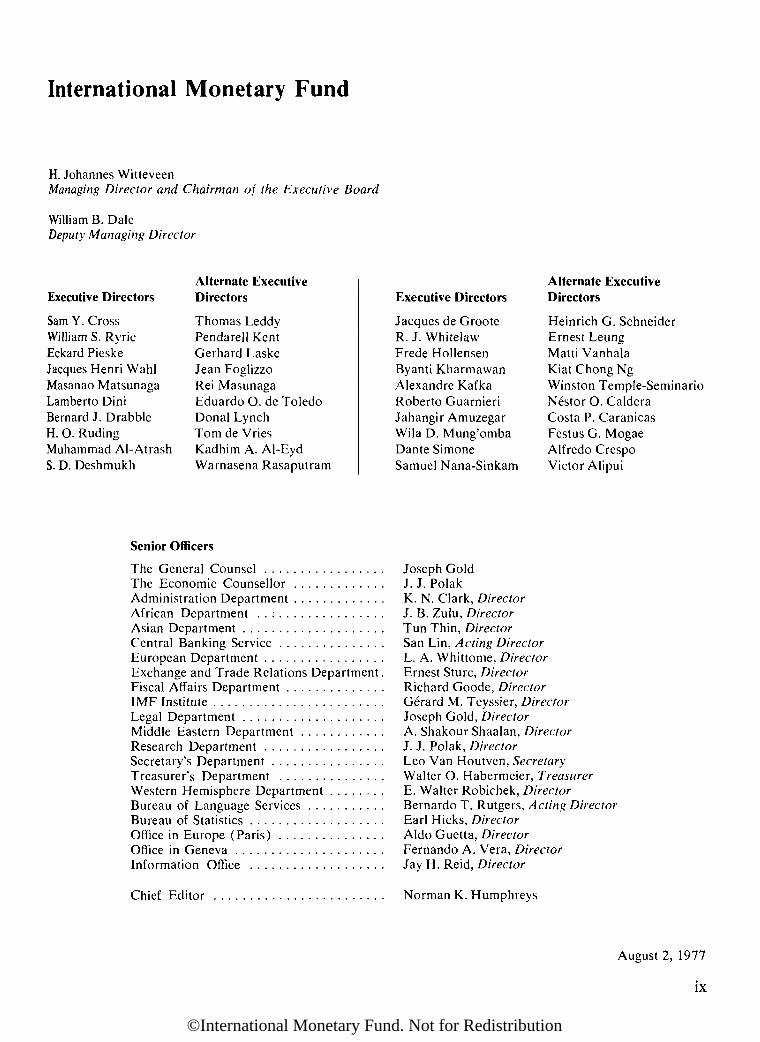
International Monetary Fund
H. Johannes WitteveenManaging Director and Chairman oj the Executive Board
William B. DaleDeputy Managing Director
Executive Directors
Sam Y. CrossWilliam S. RyrieEckard PieskeJacques Henri WahlMasanao MatsunagaLamberto DiniBernard J. DrabbleH. O. RudingMuhammad Al-AtrashS. D. Deshmukh
Alternate ExecutiveDirectors
Thomas LeddyPendarell KentGerhard LaskeJean FoglizzoRei MasunagaEduardo O. de ToledoDonal LynchTom de VriesKadhim A. Al-EydWarnasena Rasaputram
Executive Directors
Jacques de GroóteR. J. WhitelawFrede HollensenByanti KharmawanAlexandre KafkaRoberto GuarnieriJahangir AmuzegarWila D. Mung'ombaDante SimoneSamuel Nana-Sinkam
Alternate ExecutiveDirectors
Heinrich G. SchneiderErnest LeungMatti VanhalaKiat Chong NgWinston Temple-SeminarioNéstor O. CalderaCosta P. CaranicasFestus G. MogaeAlfredo CrespoVictor Alipui
Senior Officers
The General Counsel Joseph GoldThe Economic Counsellor J. J. PolakAdministration Department K. N. Clark, DirectorAfrican Department . . : J. B. Zulu, DirectorAsian Department Tun Thin, DirectorCentral Banking Service San Lin, Acting DirectorEuropean Department L. A. Whittome, DirectorExchange and Trade Relations Department. Ernest Sturc, DirectorFiscal Affairs Department Richard Goode, DirectorIMF Institute Gérard M. Teyssier, DirectorLegal Department Joseph Gold, DirectorMiddle Eastern Department A. Shakour Shaalan, DirectorResearch Department J. J. Polak, DirectorSecretary's Department Leo Van Houtven, SecretaryTreasurer's Department Walter O. Habermeier, TreasurerWestern Hemisphere Department E. Walter Robichek, DirectorBureau of Language Services Bernardo T. Rutgers, Acting DirectorBureau of Statistics Earl Hicks, DirectorOffice in Europe (Paris) Aldo Guetta, DirectorOffice in Geneva Fernando A. Vera, DirectorInformation Office Jay H. Reid, Director
Chief Editor Norman K. Humphreys
August 2, 1977
ix
©International Monetary Fund. Not for Redistribution

This page intentionally left blank
©International Monetary Fund. Not for Redistribution
LETTER OF TRANSMITTALTO THE BOARD OF GOVERNORS
August 2, 1977
Dear Mr. Chairman:
In accordance with Section 10 of the By-Laws of the International MonetaryFund, I have the honor to present to the Board of Governors the Annual Report ofthe Executive Directors for the fiscal year ended April 30, 1977.
Yours sincerely,
/s/
H. JOHANNES WITTEVEEN
Chairman of the Executive Board
Chairman of the Board of Governors
International Monetary Fund
xi
©International Monetary Fund. Not for Redistribution

This page intentionally left blank
©International Monetary Fund. Not for Redistribution

Chapter 1Developments in theWorld Economy
Introduction
At the present juncture, mid-1977, economic andfinancial conditions in many parts of the world aredistinctly better than those of one or two years ago.Nevertheless, the great majority of the Fund's membercountries are still in the process of attempting to restoreorder to their economies in the wake of the serious andunprecedented disturbances of 1973-75—disturbancesthat included a rapid upsurge of prices and costs, themost severe and prolonged recession of the postwarperiod, and the international oil crisis.
Essentially because of those disturbances, the inter-national economic scene in 1977 is still unsatisfactoryby past standards. Economic growth rates are generallysubnormal in a setting of high unemployment, excessplant capacity, and lagging investment. Inflation is alsoa widespread problem, and in a number of countries itis coupled with weakness of the external position. Inmany cases, added to these general features are relatedproblems, such as the presence of inflationary psychol-ogy and expectations, a lack of business and consumerconfidence, and significant distortions in the structureof the economy.
In the short run, the scope for improvement in thissituation is limited. Most member countries—indeed,almost all—have little room for maneuver in their poli-cies of demand management. Because of the constraintsimposed by inflation or balance of payments difficul-ties, fiscal and monetary policies must be kept underrestraint. Moreover, measures that are supplementary todemand management policies, on which there is nowan unusual degree of reliance because of the complexityof current problems, generally take time to establishand to have effect. These measures cover a wide va-riety of efforts in the field of incomes policy to affect themovement of wages and prices in the public interest;diverse types of specific programs to deal directly withthe problem of unemployment; and various policiesto deal with "structural" problems involving supply
conditions, cost pressures, and levels of saving andinvestment.
Clearly, economic policies in the industrial countries,and in most other countries as well, are now placing aprimary emphasis on medium-term objectives. Thecentral aim is to combat inflation and, where necessary,strengthen the external position during the next fewyears, in the firm belief that such an approach will yieldthe best results for economic growth and employmentin the longer run.
Implementation of policies with an emphasis onmedium-term objectives—involving a gradual approachto reduction of inflation, absorption of the unemployed,and adjustment of the external position—is likely toprove difficult. It will require skill, patience, and cour-age on the part of the authorities, together with a sub-stantial measure of continuity. However, despite theproblems that might attend the gradual or moderate ap-proach that has been generally adopted, it would notappear that any better or more promising approach isavailable.
While it is true, as indicated above, that the situationof the world economy is generally unsatisfactory bypast standards, countries show a wide variation as re-gards economic progress in the past few years and,therefore, the severity of current problems. Within theindustrial world, the countries that have been most suc-cessful in holding down inflation—including the UnitedStates, the Federal Republic of Germany, and Japan—are now in a relatively good economic position. In thegroup of more developed primary producing countries,there is a prevalence of double-digit inflation, low ratesof economic growth, and some of the more difficultcases of external imbalance. With respect to the non-oildeveloping group, perhaps the most striking feature ofdevelopments in recent years is the wide disparity amongcountries, with the character of the economic recordrather clearly related to the timing and effectiveness ofadjustment efforts following the onset of the recessionand the oil price increase at the beginning of 1974.
1
©International Monetary Fund. Not for Redistribution

ANNUAL REPORT, 1977
The domestic and external economic difficulties beingexperienced by many countries, particularly with respectto the problem of unemployment, have given rise topressures for protectionist measures. On the whole,such pressures have been resisted, and there have beenrelatively few instances of recourse to trade restrictionsby major trading nations. Nevertheless, the persistenceof such pressures, as evident from rising protectionistsentiments in particular industries in some industrialcountries, continues to be cause for serious concern. Ifthe forces of protectionism are not resisted, the resort torestrictions on trade would harm the open internationaltrading system; it would not provide any real solution tothe economic problems confronting the industrialeconomies and could have effects destructive of pros-perity in the world economy. In this situation, it is en-couraging that strong antiprotectionist statements wereincluded in the communiqués issued after the recentmeetings of the Interim Committee of the Fund's Boardof Governors (in Washington, April 28-29), the lead-ers of seven industrial countries (in London, May 8—9),and the OECD Ministers (in Paris, June 23-24).
This chapter focuses mainly on developments in theworld economy during 1976 and 1977, but with fre-quent reference to longer-term comparisons in order toprovide background perspective. Three broad subjectsare covered: domestic activity and policies, trends inworld trade, and the functioning of the internationaladjustment process. Closely related to this discussionof the adjustment process are several sections of Chap-ter 2, particularly those dealing with the role of theexchange rate in the adjustment process and factorsaffecting the adequacy of reserves.
Domestic Activity and Policies
Industrial CountriesOutput and prices.—After a cessation of economic
growth in 1974 and an unusual decline (of 1 per cent)in 1975, real gross national product (GNP) in theindustrial countries expanded by almost 5% per cent in1976. Increases in the range of 5-6y2 per cent occurredin all of the larger industrial countries except the UnitedKingdom ( 11
/{> per cent) ; the group of smaller industrialcountries experienced a combined increase of У/% Per
cent. (See Table 1.)Changes in output on an annual basis mask the extent
of irregularity that has characterized the course of eco-nomic activity in the industrial world during the pastfew years. The deep and prolonged international reces-sion that started late in 1973 reached its low point in thefirst half of 1975, when real GNP in the industrial coun-tries declined at an average annual rate of 4 per cent.
However, an upturn occurred in most of the majorcountries in the second half of 1975, and by the firsthalf of 1976 the resumption of output expansion waswidespread. Annual rates of increase from the secondhalf of 1975 to the first half of 1976 ranged as high as6!/>-9 per cent for the three largest economies (those ofthe United States, the Federal Republic of Germany,and Japan), as well as for the Canadian, French, andItalian economies, and averaged close to 7 per cent forthe whole group of industrial countries (Table 1).
At mid-1976, it was generally anticipated that cycli-cal recovery in the industrial countries would continueat a satisfactory pace in the latter part of the year. Mod-eration in the rate of economic expansion during thesecond half of 1976 was to be expected as the inevitableproduct of a further working of cyclical forces, but thedegree of moderation that actually occurred was sur-prising. The rate of increase in real GNP from the firstto the second half of 1976 fell off substantially through-out the industrial world, averaging only 3 per cent.
A major factor in this outturn was the disappointingbehavior of private gross fixed investment, which hadbeen showing its customary cyclical lag behind the risein general economic activity but was expected to helpsustain this rise in the second half of 1976 and beyond.The unusual behavior of private investment must ingeneral be attributed to investors' cautiousness in theface of inflation and other economic or political uncer-tainties, together with influences such as the effect ofcost-price relationships on the profitability of invest-ment, a desire to go further in the improvement ofbusiness balance sheets, and the relatively low rates ofcapacity utilization.
Another factor in the slowdown of economic activityin the second half of 1976 was that fiscal policies in anumber of the industrial countries were evidently lessstimulative than had been expected. However, gen-eralizations about this economic slowdown cannot becarried very far. Among countries, it reflected a varietyof developments and had a diverse impact on the imme-diate economic outlook. In France, Italy, and theUnited Kingdom, the slowdown was accompanied bycontinuing high inflation and weakness of the externalpayments position, demonstrating the need for programsof economic stabilization; in the United States, the Fed-eral Republic of Germany, Japan, and some other coun-tries, developments in the latter part of 1976 apparentlysignified only a "pause" in the cyclical recovery andexpansion.
It is estimated that real GNP increased at an averageannual rate of 5 per cent in the industrial countriesfrom the second half of 1976 to the first half of 1977,with the size of increases differing markedly among indi-vidual countries. (See Chart 1.) If overall growth in
2
©International Monetary Fund. Not for Redistribution

DEVELOPMENTS IN THE WORLD ECONOMY
Table 1. Industrial Countries: Changes in Output and Prices, 1962-76
(In per cent)
Change from Preceding Half Year 2
RealGNPCanadaUnited StatesJapan
FranceGermany, Fed. Rep.ItalyUnited Kingdom 3
Other countries 4
All industrial countries
Of which,Seven larger countries 5
European countries
GNP deflatorCanadaUnited StatesJapan
FranceGermany, Fed. Rep.ItalyUnited Kingdom 3
Other countries 4
All industrial countries
Of which,Seven larger countries 5
European countries
AnnualAver-age г
1962-72
5.53.9
10.3
6.04.54.62.4
4.6
4.6
4.64.4
3.63.54.9
4.44.05.05.7
5.2
4.1
4.04.8
Change from Preceding
1973
7.55.59.8
5.44.96.96.1
4.7
6.0
6.25.4
9.15.8
11.5
7.66.1
11.97.6
8.0
7.4
7.37.8
1974
3.7— 1.4
-1.3
2.30.43.9—
3.1
—
-0.31.8
14.99.7
20.7
11.66.9
17.713.6
9.5
11.9
12.110.8
1975
1.1-1.32.4
0.1-2.5
-3.5-1.6
-2.0
-0.9
-0.8-1.9
11.29.67.4
12.97.1
17.328.3
11.2
10.9
10.913.6
Year
1976
4.96.06.3
5.25.75.61.5
3.4
5.4
5.64.4
9.55.36.4
9.73.1
17.815.1
7.8
7.3
7.29.2
1974
FirstHalf
5.4— 1.9-5.1
3.62.15.1
-2.7
6.7
-0.2
-1.03.1
16.59.5
26.4
11.16.0
19.110.6
9.3
12.4
12.810.0
SecondHalf
-0.9-3.13.7
-0.8-2.9
-6.74.8
-1.3
— 1.6
-1.6-1.5
14.711.814.0
14.710.623.323.8
11.7
13.5
13.714.9
1975
FirstHalf
0.5-4.80.7
-1.4-6.9
-3.3— 3.8
— 3.7
-3.7
-3.7—4.4
9.810.0
6.0
13.98.6
18.531.9
12.3
11.3
11.215.5
SecondHalf
4.38.04.8
3.94.50.7-2.9
0.6
4.8
5.31.6
10.66.75.2
9.54.49.0
25.3
9.1
8.1
8.010.4
1976
FirstHalf
7.86.48.8
7.37.38.93.7
5.0
6.8
7.06.3
9.84.86.5
9.02.0
21.212.6
7.1
6.7
6.68.5
SecondHalf
3.52.8
2.23.13.91.8
3.2
3.0
3.02.9
7.84.98.0
11.24.0
20.011.6
7.7
7.1
7.09.1
Sources: National statistical publications, IMF Data Fund, and Fund staff estimates.1 Compound annual rates of change.- Seasonally adjusted changes, at annual rate.3 Expenditure-based estimate of gross domestic product.4 Includes Austria, Belgium, Denmark, the Netherlands, Norway, Sweden, and Switzerland.5 As listed separately above.
the second half of 1977 were to continue at a 5 per centrate, which does not seem implausible, the increase forthe year as a whole (in comparison with 1976) wouldbe some 4% per cent. Like the 5% per cent increase in1976, this would reflect for most countries a moderaterate of recovery in comparison with prior cyclical experi-ence in the postwar period, especially when allowanceis made for the severity of the 1974-75 recession.
The depressed conditions of 1974 and 1975, togetherwith the moderateness of the ensuing recovery, have ledto improvement on the inflation front. From a peakannual rate of 13% per cent in the second half of 1974(nearly a full year after the crest of the 1972-73boom), the overall rate of price increase in the indus-trial countries dropped to 6%-7 per cent in each halfof 1976 and the first half of 1977 (Chart 1). However,an inflation rate of this magnitude is still substantiallyabove the average annual rise of 4 per cent over theperiod 1962-72 (Table 1) and of 2% per cent in thefirst half of the 1960s. In general, current rates of infla-
tion in the industrial countries are much too high to beconsidered acceptable.
Rates of price increase in the industrial countriesduring recent years have also exhibited great disparity;this has tended to generate special problems for eco-nomic policy, particularly as regards the management ofbalance of payments positions. Considerable disparitywas still evident in the first half of 1977, when theestimated rates of price inflation ranged from 3%per cent for the Federal Republic of Germany to 13%per cent for the United Kingdom and 21 per cent forItaly. However, on the basis of the comprehensivestabilization programs that have been established, theU.K. and Italian inflation rates are expected to showsignificant declines in the period ahead.
From the standpoint of the world economy, it isfortunate that recent price performance in the industrialworld has been relatively favorable among the threelargest countries, whose record has such à profoundeffect on the price experience and policies of other
3
©International Monetary Fund. Not for Redistribution

ANNUAL REPORT, 1977
Chart 1. Semiannual Changes in Output and Prices inIndustrial Countries, First Half 1973-First Half 1977
(Percentage changes in real GNP and GNP deflators frompreceding half year, seasonally adjusted, at annual rates)
1 Include, in addition to the countries shown separately inthe chart, Austria, Belgium, Denmark, Luxembourg, the Neth-erlands, Norway, Sweden, and Switzerland.
countries. The United States, the Federal Republic ofGermany, and Japan have also shown the best growthrecords during the period of economic recovery,unhampered by policy constraints because of thebalance of payments.
Unemployment.—The foregoing developments withrespect to output and prices have been accompanied bypersistently high unemployment. The overall rate ofreported unemployment1 in the industrial countriesamounted to 5.3 per cent in the first half of 1977—historically a very high rate, close to the recession-induced peak of 5.5 per cent in the second half of 1975and substantially above the rates, varying between 2.5and 3.8 per cent, that prevailed during the 1960s andearly 1970s.
Numerous reasons may be adduced for this unsatis-factory situation. For instance, it is clear that changesin the composition of the labor force have tended toraise unemployment levels. In particular, the increasingproportions of women and young persons—who tend,on average, to be less firmly attached to specific jobsand, therefore, to have relatively high rates of unem-ployment—have contributed to the upward drift ofunemployment rates in the industrial countries since thefirst part of the 1960s. Similarly, it is also apparent thatlarge increases in unemployment benefits and the trendtoward multiple-income-earning families have reducedthe "costs" of unemployment and job search and, corre-spondingly, have raised the average duration of unem-ployment.
Such "structural" factors have undoubtedly beenimportant. But the escalation of unemployment ratesthat occurred during 1975 was primarily a cyclicalphenomenon, and the lack of any significant overalldecline since then is attributable mainly to the moderatepace of output growth, which has barely offset thecombined effects of (any reasonable estimate of) trendproductivity growth and increases in the labor force.This growth record, in turn, is rooted in the constraintsimposed upon demand management policy by thevirulent inflationary momentum of the mid-1970s.
To the extent that the unemployment problem is"structural," it is not susceptible to solution through theexpansion of aggregate demand. To the extent that thecurrent unemployment is "cyclical," it can be absorbedonly gradually because of the need for demand manage-ment policies to be cautious until inflation is broughtunder better control. Thus, in general, the immediatesituation calls for use of (a) incomes policies in orderto alleviate employment-inhibiting distortions in thecost-price structure (particularly in wage-profit relation-
1 This is a weighted average (with weights proportionate tolabor forces) of reported national rates of unemployment.These differ in definition, with more significance attaching tochanges in the calculated overall rate of unemployment thanto its level.
4
©International Monetary Fund. Not for Redistribution

DEVELOPMENTS IN THE WORLD ECONOMY
ships), as well as to restrain the growth of claims bycompeting groups on the national product; and (b)various types of specific policies to deal with the unem-ployment situation more directly.
Stance of economic policy.—Several generalizationsmay be made about the stance of economic policy in theindustrial countries, with the purpose of indicating howpolicies are being adapted to meet the issues confrontingnational authorities.
—Fiscal and monetary policies are generally cautiousor restrained. Important differences in the degree ofrestraint are attributable to the severity of inflation, aswell as to balance of payments difficulties.
—The complexity of current problems has led to anunusual degree of reliance on measures supplementaryto fiscal and monetary policies; such measures fall intothree main categories, (a) Because of the prevailinghigh rates of unemployment, there has been widespreadadoption of specific programs intended to reduceparticular types of unemployment, to relieve hardshipsassociated with it, or to provide compensation for costsincurred in reducing it. Governments have instituteddiverse types of measures to absorb part of the cost ofhiring new employees, together with programs toprovide manpower training and to expand public sectoremployment, (b) With very few exceptions, the indus-trial countries have also engaged in a wide variety ofefforts in the general field of incomes policy in order toinfluence wage bargaining, rates of payment or accrualof other forms of income, and the development ofprices. The efforts classifiable under the heading ofincomes policy have varied markedly from country tocountry, depending on each nation's own institutions,traditions, and climate for wage bargaining and pricesetting. Mandatory controls of various types are ineffect in some countries, whereas others rely on volun-tary arrangements or guidelines; blends of compulsoryand voluntary techniques are not uncommon. In theFederal Republic of Germany and in Japan, support ofthe management of aggregate demand through effortsto rationalize the claims of business and labor on thenational product has remained on an even moreinformal plane, (c) Partly overlapping the unemploy-ment measures just described under (a), policies aimedat various types of "structural" problems have beeninstituted in a number of the industrial countries. Suchpolicies, as indicated earlier, are intended in generalto improve supply conditions, alleviate cost pressures,and achieve higher levels of saving and investment. Inthis last regard, restraining the growth of the publicsector over the medium term is considered to be amajor policy requirement in some countries.
—Economic policies in the industrial countries havetaken on a medium-term cast. They are directedtoward combating inflation (and/or strengthening the
external position) during the next few years in theconviction that such emphasis of policies will make fora better record of growth and employment over time.The importance of continuing to reduce inflation,together with the link between this and the reduction ofunemployment, was stressed in the communiqué of theInterim Committee after its April 1977 meeting inWashington and in the communiqué of the leaders ofseven industrial countries after their conference inLondon during May.
This greater emphasis of policies on medium-termconsiderations has been accompanied by an evidentparallel change in the strategy of short-term demandmanagement. On the whole, the industrial countriesreacted cautiously to the slowdown or "pause" inactivity that developed in the second half of 1976,apparently being reluctant to provide significantly morestimulus to aggregate demand in the prevailing environ-ment of high inflation and continuing inflationaryexpectations.
From this and other behavior in the recent period,it would appear that these countries have adopted arather patient and even-handed approach to the short-term conduct of fiscal and monetary policies, in contrastto the frequent changes of policy undertaken in thelate 1960s and early 1970s. More than in the past, thecurrent approach involves the steering of a generalcourse toward medium-term growth objectives judgedto be compatible with objectives for employment andprices and with the strength of the balance of payments.It is this apparently greater tendency to gear short-termdemand management to a set of interrelated objectivesover the medium term that distinguishes current prac-tice from that of the earlier period, when the primaryemphasis was on short-term growth targets that fre-quently proved to be overly ambitious.
Sharper differentiation of the fiscal and monetarypolicies pursued by individual industrial countries hasemerged during 1976 and 1977, following a period ofbroadly parallel actions during the closing stages ofthe 1974-75 recession and the early part of the recoveryperiod. Since about the middle of 1976, contrastsgeared to differences in domestic situations and externalpositions have become more apparent.
As regards fiscal policy, shifts toward withdrawal ofat least part of the stimulus provided in 1975 occurredin most of the industrial countries in 1976, and sizablefurther shifts in the same direction are occurring insome of them during 1977. However, the degree ofreversal witnessed in 1976 was quite uneven, and con-trasts among national fiscal policy stances are nowsharper. In general, the large industrial countries withrelatively low rates of inflation and freedom frombalance of payments constraints—i.e., the FederalRepublic of Germany, Japan, and the United States—
5
©International Monetary Fund. Not for Redistribution

ANNUAL REPORT, 1977
withdrew in 1976 only small or moderate proportions ofthe expansionary fiscal impulses imparted in 1975, whilethe major countries whose rates of inflation were by farthe highest in 1975—the United Kingdom and Italy—undertook larger withdrawals of fiscal stimulus in 1976.For each of those countries, as well as France, the netcontractionary shift, apart from purely cyclical changes,was of the order of 2—3 per cent of GNP, whereas noneof the corresponding shifts in the first three countrieswas equivalent to more than about 1 per cent of GNP.The shift was also small in Canada, where the rate ofinflation was above the weighted average for the indus-trial countries, but the external position was not viewedas a constraint.
For 1977, further shifts toward fiscal restraint areexpected in France, Italy, and the United Kingdom.Central government fiscal balances in Canada, theFederal Republic of Germany, Japan, and the UnitedStates, on the other hand, are expected to show roughlyneutral or slightly expansionary changes in 1977.
With respect to monetary policy, too, there is anotable difference between the low-inflation countrieswith relatively strong external positions and the othermajor industrial countries. In the United States, theFederal Republic of Germany, and Japan, monetarypolicies are cautious but are considered by the author-ities to be consistent with the attainment of satisfactoryeconomic growth. Although stocks of money in thesethree countries were expanding much less rapidly inrelation to real output during 1976 than those of theother large industrial countries (except Canada),interest rates were also much lower, and currentdemands for credit have been, in general, readilyaccommodated. In France, Italy, and the UnitedKingdom, the financing of large deficits in the currentaccount has required sizable capital inflows during thepast year or two, but relatively high rates of priceincrease (and their effects on exchange rate expecta-tions) have tended to undermine the attraction ofdomestic yields on financial assets. Even thoughnominal interest rates in all three of these higher-inflation countries have been pushed considerably abovethose prevailing in the three low-inflation countries,private capital movements have sometimes fallen shortof external financing requirements. In these circum-stances, much of the U.K. and French external borrow-ing has been conducted by public agencies or enter-prises; and the Italian authorities also borrowed heavilyfrom foreign official sources during the first half of1976, although the resultant debts were largely repaidin the second half.
The pursuit of publicly announced targets or targetranges for growth of various monetary aggregates is anotable feature of monetary policy implementation ina number of the industrial countries (including Canada,
France, the Federal Republic of Germany, the UnitedStates, and the United Kingdom). It would appear thatutilization of such targets has proved helpful in con-ducting central banking operations and in gaining publicunderstanding and acceptance of the economic policiesbeing followed.
Primary Producing Countries
The statistical picture of the current economic situa-tion is much less complete for the primary producingcountries than for the industrial world. However, theavailable figures on output and prices (summarized inTables 2 and 3 ) may serve to indicate the main featuresof the recent economic experience of this large andheterogeneous group of member countries.
Major oil exporting countries.—Beginning in thelatter part of 1975, the major oil exporting countriesreoriented their economic policies toward reducingdemand pressures and combating inflation. As a resultmainly of curtailment in the growth of governmentexpenditures, coupled with efforts to improve the supplysituation, the estimated average increase in domesticprices was reduced from 18 per cent in 1975 to about15 per cent in 1976 (Table 3). The slower advance ofimport prices and, in a few instances, direct measures ofcontrol over wages and prices also contributed to thisdevelopment.
Despite the prevalence of tighter demand policies,economic activity in the non-oil sectors of the oilexporting group remained relatively high in 1976 andmay increase at a faster rate in several countries in1977. Oil production, however, is likely to rise muchless rapidly in 1977 than in the cyclical rebound of1976. The average rate of growth in total output of theoil exporting countries (Table 2) is therefore expectedto decline considerably in 1977 from the exceptionallyhigh level reached in 1976.
More developed countries.—As a group, the moredeveloped primary producing countries were lessaffected by the international recession than the indus-trial countries. In the current recovery, they are laggingfar behind the performance of the industrial group andhave made much less progress in reducing the extraor-dinary levels of inflation reached in 1974 and 1975. Theaverage increase in consumer prices experienced by themore developed primary producers in 1976, estimatedat 15 per cent (Table 3), was about twice as large as theaverage for the industrial group; if this rate does notchange much in 1977, as seems likely, most of thesecountries will have experienced double-digit inflationfor five years in a row.
The linkage of high inflation and slow recovery inreal economic activity among the more developed pri-mary producers is by no means coincidental. A number
6
©International Monetary Fund. Not for Redistribution

DEVELOPMENTS IN THE WORLD ECONOMY
Table 2. Primary Producing Countries: Growth of Real Output, 1967-76
(Percentage changes in real GNP or GDP)
Major oil exporters 2
Average г
1967-72
9.0
Change from Preceding Year
1973
10.7
1974
8.7
1975
3.0
1976
11.7
Non-oil primary producing countries
More developed 6.1 6.3 4.3 2.0 3.1
In Europe 3
Australia, New Zealand, and South Africa
Less developed *
In AfricaIn Asia G
In the Middle EastIn Latin America and the Caribbean
6.75.1
6.1
5.14.96.46.8
7.34.6
6.7
2.97.04.77.5
4.73.3
5.2
5.92.63.17.2
2.51.1
3.4
2.25.44.52.2
3.32.5
5.1
4.66.34.14.6
Sources: National statistical publications, IMF Data Fund, IBRD, and Fund staff estimates.1 Compound annual rates of change.2 Algeria, Indonesia, Iran, Iraq, Kuwait, Libya, Nigeria, Oman, Qatar, Saudi Arabia, the United Arab Emirates, and Venezuela.3 Finland, Greece, Iceland, Ireland, Malta, Portugal, Romania, Spain, Turkey, and Yugoslavia.4 Comprise Fund member countries not listed in Table 1, or as being major oil exporters (footnote 2) or "more developed"
primary producing countries (as listed above and in footnote 3). The regional subgroups of less developed countries listed herecorrespond to the groupings shown in International Financial Statistics, except that Afghanistan, Ethiopia, Pakistan, and theSudan are included in the Middle East. (See also footnote 5.)
5 Includes estimates for South Viet Nam for the period 1967-74 and for the whole of Viet Nam for the period 1975-77. Esti-mates for Hong Kong, which is a nonmember country, are also included.
of the countries in this group sought, during the initialdownturn in the industrial countries, to maintain theirown levels of activity in the face of slackening exportdemands and increased import costs; as discussed later,they were able to sustain imports and consumptionthrough heavy external borrowing. These efforts, alongwith deterioration in the terms of trade, quickly led toenlarged deficits on the current account and, in mostcases, also to higher budgetary deficits and rapid domes-tic credit expansion. The resultant upsurge of prices—averaging 17 per cent in 1974 and 1975—generated aneed for application of restrictive fiscal and monetarypolicies.
By the latter part of 1976 or early 1977, most coun-tries in the more developed group were applying mea-sures of demand restraint. The only countries not fol-lowing restrictive policies by then were those wherepolitical uncertainty or insecurity prevented decisiveactions by the authorities. A number of the countrieswere also utilizing some form of incomes policy inefforts to contain inflation. However, progress on thatfront remained slow and difficult, partly because of themomentum of the wage-price spiral and partly in somecases because of the initial effects on domestic prices ofexchange depreciations undertaken during the past yearor two to deal with external adjustment problems.
Non-oil developing countries.—By and large, thedomestic economies of the non-oil developing countriesappear to have been less affected by the global recessionthan have the economies of other major groups of oilimporting countries. The average rate of expansion intotal output dropped from 6J/, per cent in 1973 to
3% per cent in 1975, but subsequently recovered toabout 5 per cent in 1976 (Table 2) and should movesomewhat higher in 1977.
Nevertheless, the slowing of growth from 1973 to1975 was obviously a blow to the developmental aspira-tions of the countries affected. Moreover, the terms oftrade of the non-oil developing countries in 1977 areappreciably worse than they were in the period 1967-72(when cyclical conditions were roughly neutral) andthe estimated loss in export purchasing power impliedby this deterioration is equivalent to somewhat morethan 1 per cent of their total gross product. This lossmust be added to the shortfall in growth of real outputin any assessment of the impact of global developmentsof the mid-1970s on supplies available for consumptionand investment in the non-oil developing countries.
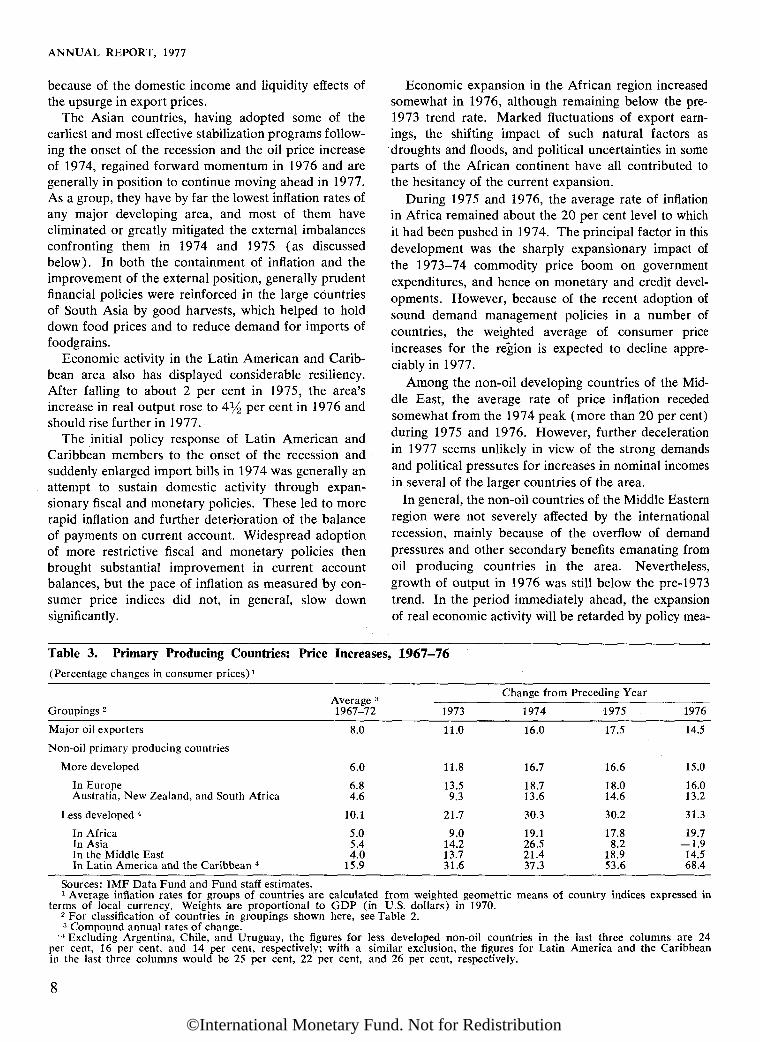
The record of the non-oil developing countries withrespect to inflation in recent years (Table 3) is quitemixed. In Asia, it is better than that of the moredeveloped group of primary producers, and in Africaand the Middle East it is roughly similar. In LatinAmerica and the Caribbean, the composite average ofconsumer price increases has been affected substantiallyby the particularly virulent inflation in a few SouthAmerican countries; excluding these, the average is stillthe highest among regions because of the experience ofa few large countries, with the inflation rates in a num-ber of the smaller countries being relatively quite low.Most of the non-oil developing countries enjoyed somesuccess in cutting back their rates of inflation during1975 and 1976, but a partial reversal of this progressappears to have occurred during the first part of 1977
7
©International Monetary Fund. Not for Redistribution
ANNUAL REPORT, 1977
because of the domestic income and liquidity effects ofthe upsurge in export prices.
The Asian countries, having adopted some of theearliest and most effective stabilization programs follow-ing the onset of the recession and the oil price increaseof 1974, regained forward momentum in 1976 and aregenerally in position to continue moving ahead in 1977.As a group, they have by far the lowest inflation rates ofany major developing area, and most of them haveeliminated or greatly mitigated the external imbalancesconfronting them in 1974 and 1975 (as discussedbelow). In both the containment of inflation and theimprovement of the external position, generally prudentfinancial policies were reinforced in the large countriesof South Asia by good harvests, which helped to holddown food prices and to reduce demand for imports offoodgrains.
Economic activity in the Latin American and Carib-bean area also has displayed considerable resiliency.After falling to about 2 per cent in 1975, the area'sincrease in real output rose to 4% per cent in 1976 andshould rise further in 1977.
The initial policy response of Latin American andCaribbean members to the onset of the recession andsuddenly enlarged import bills in 1974 was generally anattempt to sustain domestic activity through expan-sionary fiscal and monetary policies. These led to morerapid inflation and further deterioration of the balanceof payments on current account. Widespread adoptionof more restrictive fiscal and monetary policies thenbrought substantial improvement in current accountbalances, but the pace of inflation as measured by con-sumer price indices did not, in general, slow downsignificantly.
Economic expansion in the African region increasedsomewhat in 1976, although remaining below the pre-1973 trend rate. Marked fluctuations of export earn-ings, the shifting impact of such natural factors asdroughts and floods, and political uncertainties in someparts of the African continent have all contributed tothe hesitancy of the current expansion.
During 1975 and 1976, the average rate of inflationin Africa remained about the 20 per cent level to whichit had been pushed in 1974. The principal factor in thisdevelopment was the sharply expansionary impact ofthe 1973—74 commodity price boom on governmentexpenditures, and hence on monetary and credit devel-opments. However, because of the recent adoption ofsound demand management policies in a number ofcountries, the weighted average of consumer priceincreases for the region is expected to decline appre-ciably in 1977.
Among the non-oil developing countries of the Mid-dle East, the average rate of price inflation recededsomewhat from the 1974 peak (more than 20 per cent)during 1975 and 1976. However, further decelerationin 1977 seems unlikely in view of the strong demandsand political pressures for increases in nominal incomesin several of the larger countries of the area.
In general, the non-oil countries of the Middle Easternregion were not severely affected by the internationalrecession, mainly because of the overflow of demandpressures and other secondary benefits emanating fromoil producing countries in the area. Nevertheless,growth of output in 1976 was still below the pre-1973trend. In the period immediately ahead, the expansionof real economic activity will be retarded by policy mea-
Table 3. Primary Producing Countries: Price Increases, 1967-76
(Percentage changes in consumer prices)1
Groupings -
Major oil exporters
Non-oil primary producing countries
More developed
In EuropeAustralia, New Zealand, and South Africa
Less developed 4
In AfricaIn AsiaIn the Middle EastIn Latin America and the Caribbean 4
Average 3
1967-72
8.0
6.0
6.84.6
10.1
5.05.44.0
15.9
Change from Preceding Year
1973
11.0
11.8
13.59.3
21.7
9.014.213.731.6
1974
16.0
16.7
18.713.6
30.3
19.126.521.437.3
1975
17.5
16.6
18.014.6
30.2
17.88.2
18.953.6
1976
14.5
15.0
16.013.2
31.3
19.7-1.914.568.4
Sources: IMF Data Fund and Fund staff estimates.1 Average inflation rates for groups of countries are calculated from weighted geometric means of country indices expressed in
terms of local currency. Weights are proportional to GDP (in U.S. dollars) in 1970.2 For classification of countries in groupings shown here, see Table 2.3 Compound annual rates of change.
••* Excluding Argentina, Chile, and Uruguay, the figures for less developed non-oil countries in the last three columns are 24per cent, 16 per cent, and 14 per cent, respectively; with a similar exclusion, the figures for Latin America and the Caribbeanin the last three columns would be 25 per cent, 22 per cent, and 26 per cent, respectively.
8
©International Monetary Fund. Not for Redistribution

DEVELOPMENTS IN THE WORLD ECONOMY
sures to reduce inflationary pressures and by foreignexchange constraints in some countries.
Trends in World Trade
After four years of extremely uneven developments,dominated for the most part by cyclical influences,world trade seems to be settling into a more sustainablepace of moderate expansion during 1977. Its volume isgrowing less rapidly than in 1976, when the first stagesof the cyclical recovery brought a resurgence of importdemands in key areas. However, the present rate ofexpansion is fairly satisfactory. It is not much belowthe average for the whole period since 1960.
In general, foreign trade prices appear to be rising alittle faster in 1977 than in 1976, partly because of amarked upsurge of primary commodity prices fromearly 1976 through April 1977. In the next two months,however, the index of such prices showed sizabledeclines. Although the bulge in late 1976 and early1977 virtually assures a sharper upward movement (onan annual average basis) for the current year than for1976, a marked tapering or flattening of the trend nowseems to be in prospect for the second half of 1977.
Volume of TradeThe current upswing in the volume of world trade
began in the second half of 1975, when demand in the
industrial countries first turned upward from its reces-sion trough. A resurgence of world trade then accom-panied the accelerating recovery of demand in theindustrial countries during the first half of 1976 andcontinued during the second half, despite the "pause"in expansion of economic activity that occurred in thosecountries. For the year as a whole, world trade volumeis estimated to have exceeded the depressed level of1975 by 11 i/a per cent. (See Table 4.)
However, the rise during 1976 was rather unevenlydistributed among groups of importing countries, andwas caused in considerable part by temporary factors.Strong import demands came only from the industrialcountries and the oil exporting countries, while importsof the non-oil primary producing countries—both themore developed and the less developed—remained rela-tively flat and depressed. The sluggish demand forimports in those countries during most of 1976 reflectednot only a cyclical lag in import growth behind theupturn in exports, as is customary during a stage of theinternational business cycle characterized by restorationof reserve positions and curbing of growth in externaldebt; it also reflected the efforts of many primary pro-ducing countries to restrain the expansion of domesticdemand in order to contain inflationary pressures andstrengthen balance of payments positions.
Both in the industrial countries and in the oil export-ing countries, the pace of import growth during 1976was rather uneven. In the former group, it was particu-
Table 4. World Trade Summary, 1962-76 1
(Percentage changes in volume and in unit value of foreign trade)
Change from
World trade 3
Volume of trade
Unit value of tradein SDR terms 4
VolumeUnit value (U.S. dollar terms)
(SDR terms)4
Imports Industrial countriesOther developed countriesMajor oil exportersOther developing countries
Exports Industrial countriesOther developed countriesMajor oil exportersOther developing countries
Imports Industrial countriesOther developed countriesMajor oil exportersOther developing countries
Exports Industrial countriesOther developed countriesMajor oil exportersOther developing countries
1962-72 2
92!/22
9]/2
8 i/2
9Si/2
9896У2
2222
223P/2
1973
1323 VL12Î/2
121/21621>/215
143'/2
138
11 1/2
lQi/210121/2
9 '/2
23261/2
24
1974
54140
16
381/28
81/2
— 1
4У2
3946V428481/2
231/225
205361/2
Preceding Year
1975
-41/28>/2
71/2
-71/2-61/2
421/2—6-41/2
1— 1Ш
—
891/29J/2
91/2
11231/2
-4
1976
\\Vi27
141/231/2
181/2
11/2
101/2
Ш/2
1313
67881/2
51/2
51/2
1213
Sources: National economic reports, IMF Data Fund, and Fund staff estimates.1 For classification of countries in groupings shown here, see Tables 1 and 2.2 Compound annual rates of change.3 Sum of the groupings shown separately; based on approximate averages of growth rates for world exports and world imports.4 For years prior to 1970, an imputed value of US$1.00 has been assigned to the SDR.
9
©International Monetary Fund. Not for Redistribution

ANNUAL REPORT, 1977
larly rapid in the first half of the year, when the cyclicalresurgence of aggregate demand and output was strong-est. By the second half, a subsidence of the inventoryrebuilding that had accompanied the initial upturn offinal demand, coupled with the more general influenceof the pause in growth of industrial output, was alreadytending to slow the rise in demand for most classes ofimports. However, total imports of the industrial coun-tries were bolstered in the latter part of 1976 by a sub-stantial rise in oil imports, partly in anticipation of adecision by the Organization of Petroleum ExportingCountries (OPEC) to raise the price of crude petroleumat the beginning of 1977. Among the major oil export-ing countries themselves, semiannual changes in thepace of import expansion followed a different course;such expansion slowed from about mid-19 75 throughmid-19 76 as port congestion and internal distributionproblems arose and more restrained demand manage-ment policies were instituted in some countries, but itaccelerated in the second half of 1976 and early 1977,when some of the earlier constraints were relieved.
Export volume changes from 1975 to 1976 weremuch more evenly distributed among the various majorgroups of countries than were the changes on the importside of the respective trade accounts. For each of thebroad groups under review here, the 1976 increasein export volume was within the range of 10*4-13per cent. In 1977, rates of export expansion seemlikely to be considerably more moderate (perhaps about7 per cent on average), partly because the potentialsfor cyclical rebounds were largely realized before theend of 1976 and partly because import demands ofmany countries, including several of the larger indus-trial countries, will probably be constrained by eco-nomic policies aimed at control of domestic inflationand/or restoration of external balance.
The pattern of import volume growth expected in1977 differs from that of 1976. Imports of the indus-trial countries are clearly rising much less rapidly inreal terms in 1977 than in 1976, while those of thenon-oil developing countries will probably show a muchstronger rise. For the other two major groups, con-tinuation of 1976 import trends seems more likely. Thiswould mean that the largest percentage increase wouldagain be recorded by the major oil exporting countries,and that the imports of the more developed primaryproducing countries would remain relatively flat.
Foreign Trade Prices
The increase in foreign trade prices, after subsidingmarkedly in 1975 from the highly inflationary rate of1974, moderated further in 1976. In U.S. dollar terms,the unit value of goods moving in international traderose by only 2 per cent in 1976, compared with 8% per
cent in 1975. In SDR terms, however, the degree ofadditional moderation was slight, reflecting the 1976depreciation of the SDR against the U.S. dollar. (SeeTable 4.)
Both in 1976 and in the first half of 1977, the mainimpetus for higher foreign trade unit values came fromincreases in the prices of primary commodities. In thecase of oil, these stemmed mainly from an increase of10 per cent in the U.S. dollar price of the OPEC"marker crude" on October 1, 1975 and from furtherincreases of 5 per cent for two members of the OPECand 10 per cent for the others on January 1, 1977. Theupsurge of export prices for other primary commodities(Chart 2) involved a wide range of foods, agriculturalraw materials, and metals, very unevenly distributedamong products and exporting countries. Soaring pricesfor coffee, cocoa, and tea, as well as for various vege-table oils and oilseeds, contributed disproportionatelyto the rise, while prices for several important food prod-ucts, including grains and sugar, declined throughout1976 and the first half of 1977. Differences in the sup-ply situation—ranging from severe impairment of Bra-zilian coffee production by frost damage to abundantharvests of f oodgrains among leading suppliers of worldmarkets—lay behind these contrasts. Increases in mar-ket prices of metals and agricultural materials over thepast year have been much more moderate than those offoodstuffs and more nearly aligned with the somewhatirregular upswing of demand in the importing countries.The fact that the resurgence of demand occurred in aclimate of still highly inflationary expectations con-tributed to the sensitivity of market reactions.
The particular mix of commodities exported by themore developed primary producing countries showed amuch smaller average increase in unit value in 1976 andthe first half of 1977 than did the exports of the lessdeveloped primary producing countries. In part, thedifference reflected the fact that members of the formergroup are not exporters of any of the products—par-ticularly tropical beverage products—that were subjectto the largest increases in the recent commodity pricebulge. It must also have reflected a higher proportionof manufactured goods in the exports of the moredeveloped primary producers, together with the rela-tively smaller rise in prices of such goods.
For the industrial countries, the average rate ofincrease in SDR-denominated export unit valuesdropped from 11 per cent in 1975 to 5% per cent in1976 (with the drop in terms of U.S. dollar prices beingmuch sharper, from about 12 per cent to virtually noincrease at all). Movements of these export unit valueswere particularly depressed in the first half of 1976 (aswell as in the second half of 1975), for two principalreasons. First, the lagged effects of the 1975 recessionwere depressing raw material prices and sharpening
10
©International Monetary Fund. Not for Redistribution
DEVELOPMENTS IN THE WORLD ECONOMY
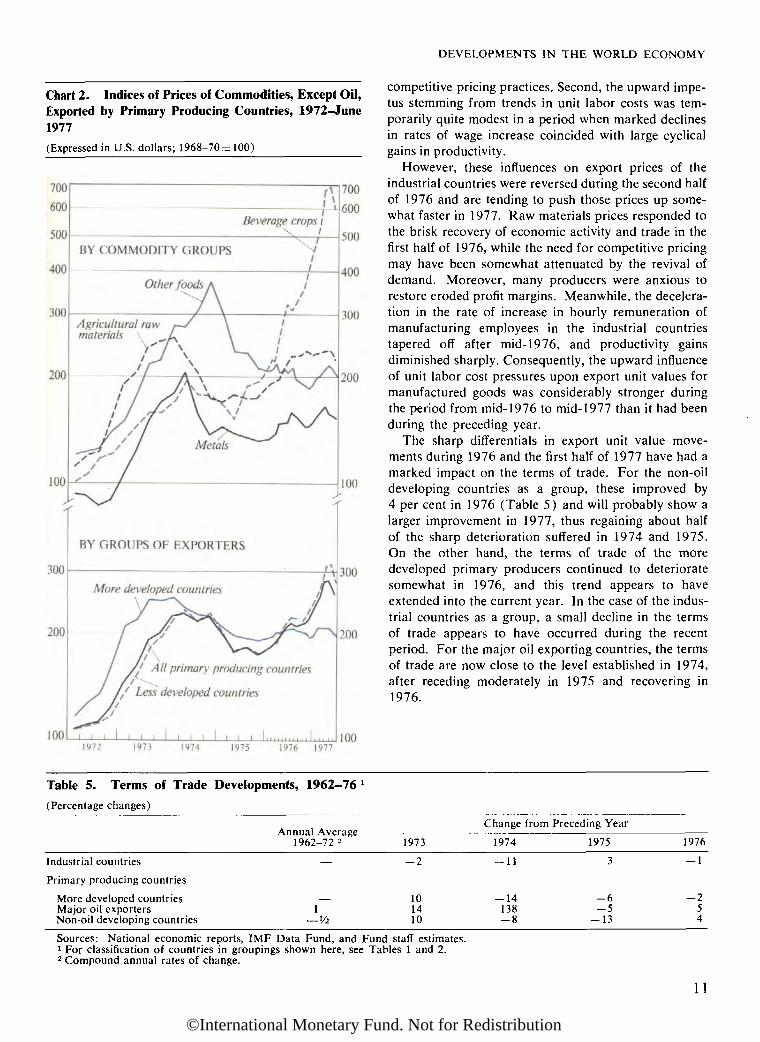
Chart 2. Indices of Prices of Commodities, Except Oil,Exported by Primary Producing Countries, 1972-June1977(Expressed in U.S. dollars; 1968-70=100)
competitive pricing practices. Second, the upward impe-tus stemming from trends in unit labor costs was tem-porarily quite modest in a period when marked declinesin rates of wage increase coincided with large cyclicalgains in productivity.
However, these influences on export prices of theindustrial countries were reversed during the second halfof 1976 and are tending to push those prices up some-what faster in 1977. Raw materials prices responded tothe brisk recovery of economic activity and trade in thefirst half of 1976, while the need for competitive pricingmay have been somewhat attenuated by the revival ofdemand. Moreover, many producers were anxious torestore eroded profit margins. Meanwhile, the decelera-tion in the rate of increase in hourly remuneration ofmanufacturing employees in the industrial countriestapered off after mid-1976, and productivity gainsdiminished sharply. Consequently, the upward influenceof unit labor cost pressures upon export unit values formanufactured goods was considerably stronger duringthe period from mid-1976 to mid-1977 than it had beenduring the preceding year.
The sharp differentials in export unit value move-ments during 1976 and the first half of 1977 have had amarked impact on the terms of trade. For the non-oildeveloping countries as a group, these improved by4 per cent in 1976 (Table 5) and will probably show alarger improvement in 1977, thus regaining about halfof the sharp deterioration suffered in 1974 and 1975.On the other hand, the terms of trade of the moredeveloped primary producers continued to deterioratesomewhat in 1976, and this trend appears to haveextended into the current year. In the case of the indus-trial countries as a group, a small decline in the termsof trade appears to have occurred during the recentperiod. For the major oil exporting countries, the termsof trade are now close to the level established in 1974,after receding moderately in 1975 and recovering in1976.
Table 5. Terms of Trade Developments, 1962-76
(Percentage changes)
Industrial countries
Primary producing countries
More developed countriesMajor oil exportersNon-oil developing countries
Annual Average1962-72 2
—
—1
— !/2
Change from Preceding Year
1973
2
101410
1974
— 11
-14138
g
1975
3
-65
— 13
1976
-1
— 254
Sources: National economic reports, IMF Data Fund, and Fund staff estimates.1 For classification of countries in groupings shown here, see Tables 1 and 2.2 Compound annual rates of change.
11
©International Monetary Fund. Not for Redistribution

ANNUAL REPORT, 1977
International Adjustment Process
Background Considerations
The large and sudden changes in the structure ofinternational payments caused by the raising of oilprices at the beginning of 1974, as well as the problemsthus posed for the functioning of the adjustment pro-cess, have been analyzed in earlier Annual Reports.Here, it may be helpful to single out a few salient devel-opments during the period 1974-76, prior to describingthe review of the international adjustment process thathas been conducted by the Fund during recent months.
First, it will be recalled that very early in 1974, at themeeting of the Committee of Twenty in Rome, it wasagreed that oil importing countries should avoid policiesthat would serve only to shift payments problems amongmembers of the group and would be detrimental toworld trade and economic activity. However, this deci-sion to "accept," for the time being, oil-induced deficitsin the aggregate did not mean that individual oil import-ing countries should not make payments adjustments inrelation to each other.
From 1973 to 1976, there were two major develop-ments in the field of international payments, (a) Thecombined current account surplus of the major oilexporting countries increased from $6 billion to morethan $40 billion. The latter figure was some $25 billionbelow the suddenly enlarged oil surplus in 1974, pri-marily because of rapid import expansion, but it wasconcentrated in a small number of countries whosecapacity to expand their imports is comparatively lowin relation to the size of their export earnings, (b) TheUnited States, the Federal Republic of Germany, andJapan were particularly resolute in fighting the severeinflationary pressures that emerged during 1974, andthe impact of anti-inflation policies and other factors ontheir current account balances was quite dramatic. Inthese three large countries, oil-related deficits were rap-idly offset by positive changes (totaling more than $30billion in 1974) elsewhere in the current account,although these changes were not in themselves an objec-tive of policies. At the same time, it was evident thatmany other oil importing countries had been quite will-ing to postpone adjustment; in the aggregate, the cur-rent account balance of oil importing countries otherthan the United States, the Federal Republic of Ger-many, and Japan shifted from a deficit of $8 billion in1973 to deficits of $64 billion in 1974 and some $55billion in 1975 and in 1976.
At the Annual Meeting in Manila in 1976, the Man-aging Director of the Fund observed that the worldeconomy was moving into a situation where the maindanger was no longer a deepening of recession but aworsening of inflation. For this reason, he said, the
time had come to lay "more stress on the adjustment ofexternal positions and less emphasis on the mere financ-ing of deficits." He spoke of the "additional urgency"that was lent to this need by the buildup of short-termand medium-term debt, which was beginning to affectthe creditworthiness of some borrowers and to createthe possibility of economic and financial difficulties.
At its meeting in Manila, the Interim Committee dis-cussed the international adjustment process on the basisof a paper submitted by the Managing Director. Theconclusions reached by the Committee, as spelled out inits press communiqué, included the following generalprinciples: (a) Adjustment of external payments posi-tions should be symmetrical as between deficit and sur-plus countries, (b) To this end, deficit countries shouldarrange their domestic policies so as to restrain domesticdemand and to permit the shift of resources to the exter-nal sector, to the extent necessary to bring the deficit oncurrent account in line with a sustainable flow of capitalimports and aid. (c) Industrial countries in strong pay-ments positions should ensure continued adequateexpansion in domestic demand, within the limits set byeffective anti-inflation policies, (d) Exchange rate poli-cies should be allowed to play their proper role in theadjustment process.
In the period immediately following the meetings inManila, renewed concern about the prospective strengthof international trade and about the functioning of theadjustment process was engendered by developments inthe industrial world, including both the "pause" in somecountries and the demonstrated need for programs ofeconomic stabilization in others. These developmentswere accompanied by continuing debate as to how theadjustment process should be viewed and analyzed inthe changed circumstances of recent years stemmingprimarily from the oil price increase.
Reference has been made to the review of the adjust-ment process conducted by the Fund in recent months.The approach adopted in this review had two main ele-ments: (1) an analysis of major shifts in the globalpattern of current account balances; and (2) a case-by-case analysis of individual countries' positions.
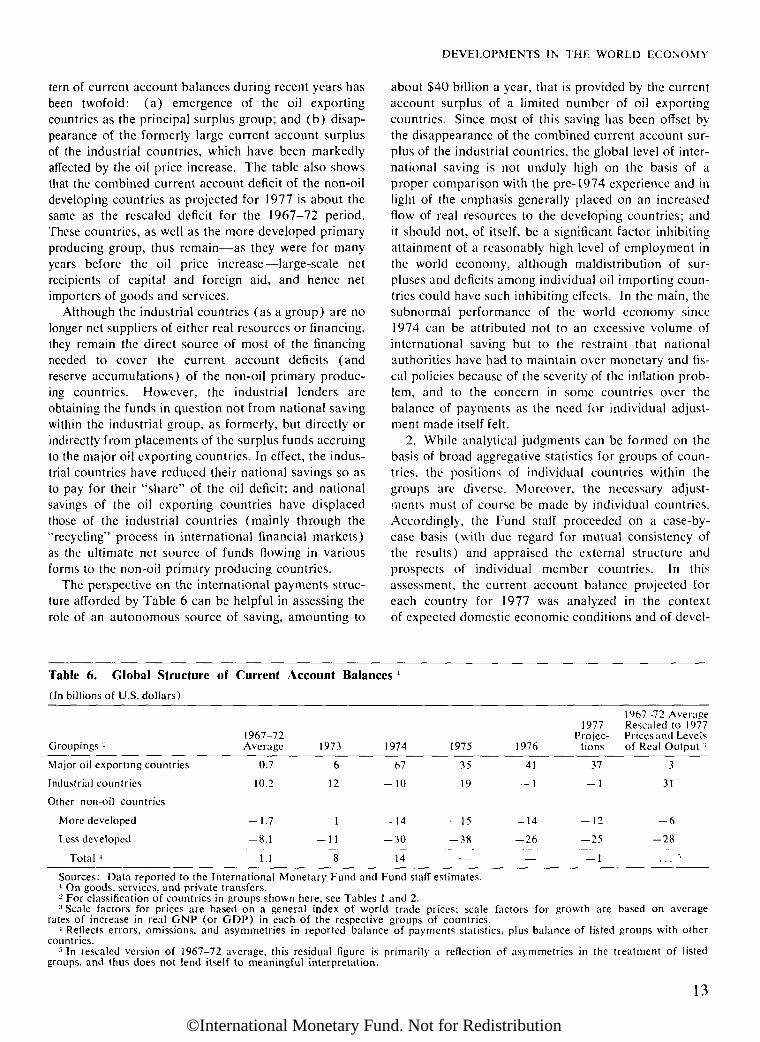
1. Key features of the international payments struc-ture were assessed with the aid of some statistical esti-mates that are reproduced here in Table 6. These esti-mates involve a comparison of the Fund staff's 1977projections of current account balances for majorgroups of countries with annual averages of correspond-ing balances for the years 1967-72 (a period of littlebias in cyclical conditions), after scaling up the 1967-72 figures to 1977 levels of world trade prices and ofreal economic activity in the respective groups ofcountries.
The table shows that the main shift in the global pat-
12
©International Monetary Fund. Not for Redistribution
DEVELOPMENTS IN THE WORLD ECONOMY
tern of current account balances during recent years hasbeen twofold: (a) emergence of the oil exportingcountries as the principal surplus group; and (b) disap-pearance of the formerly large current account surplusof the industrial countries, which have been markedlyaffected by the oil price increase. The table also showsthat the combined current account deficit of the non-oildeveloping countries as projected for 1977 is about thesame as the rescaled deficit for the 1967—72 period.These countries, as well as the more developed primaryproducing group, thus remain—as they were for manyyears before the oil price increase—large-scale netrecipients of capital and foreign aid, and hence netimporters of goods and services.
Although the industrial countries (as a group) are nolonger net suppliers of either real resources or financing,they remain the direct source of most of the financingneeded to cover the current account deficits (andreserve accumulations) of the non-oil primary produc-ing countries. However, the industrial lenders areobtaining the funds in question not from national savingwithin the industrial group, as formerly, but directly orindirectly from placements of the surplus funds accruingto the major oil exporting countries. In effect, the indus-trial countries have reduced their national savings so asto pay for their "share" of the oil deficit; and nationalsavings of the oil exporting countries have displacedthose of the industrial countries (mainly through the"recycling" process in international financial markets)as the ultimate net source of funds flowing in variousforms to the non-oil primary producing countries.
The perspective on the international payments struc-ture afforded by Table 6 can be helpful in assessing therole of an autonomous source of saving, amounting to
about $40 billion a year, that is provided by the currentaccount surplus of a limited number of oil exportingcountries. Since most of this saving has been offset bythe disappearance of the combined current account sur-plus of the industrial countries, the global level of inter-national saving is not unduly high on the basis of aproper comparison with the pre-1974 experience and inlight of the emphasis generally placed on an increasedflow of real resources to the developing countries; andit should not, of itself, be a significant factor inhibitingattainment of a reasonably high level of employment inthe world economy, although maldistribution of sur-pluses and deficits among individual oil importing coun-tries could have such inhibiting effects. In the main, thesubnormal performance of the world economy since1974 can be attributed not to an excessive volume ofinternational saving but to the restraint that nationalauthorities have had to maintain over monetary and fis-cal policies because of the severity of the inflation prob-lem, and to the concern in some countries over thebalance of payments as the need for individual adjust-ment made itself felt.
2. While analytical judgments can be formed on thebasis of broad aggregative statistics for groups of coun-tries, the positions of individual countries within thegroups are diverse. Moreover, the necessary adjust-ments must of course be made by individual countries.Accordingly, the Fund staff proceeded on a case-by-case basis (with due regard for mutual consistency ofthe results) and appraised the external structure andprospects of individual member countries. In thisassessment, the current account balance projected foreach country for 1977 was analyzed in the contextof expected domestic economic conditions and of devel-
Table 6. Global Structure of Current Account Balances 1
(In billions of U.S. dollars)
Groupings 2
Major oil exporting countries
Industrial countries
Other non-oil countries
More developed
Less developed
Total 4
1967-72Average
0.7
10.2
-1.7
-8.1
1.1
1973
6
12
1
-11
8
1974
67
— 10
-14
-30
14
1975
35
19
-15
-38
—
1976
411
-14
-26
—
1977Projec-
tions
37
— 1
— 12
-25
— 1
1967-72 AverageRescaled to 1977Prices and Levelsof Real Output '
3
31
— 6
— 28
... 5
Sources: Data reported to the International Monetary Fund and Fund staff estimates.1 On goods, services, and private transfers.2 For classification of countries in groups shown here, see Tables 1 and 2.3 Scale factors for prices are based on a general index of world trade prices; scale factors for growth are based on average
rates of increase in real GNP (or GDP) in each of the respective groups of countries.1 Reflects errors, omissions, and asymmetries in reported balance of payments statistics, plus balance of listed groups with other
countries.5 In rescaled version of 1967-72 average, this residual figure is primarily a reflection of asymmetries in the treatment of listed
groups, and thus does not lend itself to meaningful interpretation.
13
©International Monetary Fund. Not for Redistribution
ANNUAL REPORT, 1977
opments on capital account, with a view to ascertainingwhether the current account balance had become out ofline with sustainable financing, whether its movementrepresented progress toward balance of paymentsadjustment, and whether additional measures of adjust-ment were likely to be necessary beyond 1977.
Although this individual country material is bothdetailed and sensitive, a brief review of the currentadjustment picture can be provided within the frame-work of the four major groups of countries utilized inthe earlier sections of this chapter. After this review, afinal subsection presents some conclusions.
Major Oil Exporting Countries
One of the sizable shifts in the global pattern of cur-rent account balances in 1976 was a $6 billion increasein the surplus of the major oil exporting countries, toan estimated $41 billion. It may be recalled that thissurplus, after rising—under the impetus of OPEC-determined price increases—from $6 billion in 1973(and much less in earlier years) to $67 billion in 1974,had then subsided to $35 billion in 1975. (See Ta-ble 7.) Both the downward movement in 1975 and therebound in 1976 can be attributed in large degree tocyclical factors affecting primarily the volume of oilexports.
Such factors, together with short-run swings in oilinventories, have distorted the continuity of calendar-year time series and obscured the expected underlyingtendency of the oil exporters' surplus to shrink gradu-ally as their imports rise. This surplus is expected torecede somewhat in 1977; the projected decline is gen-erally in line with the notion that, given their scope forexpansion in imports of goods and services, the oilexporters' current account surplus will tend, for sometime to come, to decline gradually during any period forwhich their terms of trade do not rise significantly.
Reference was made earlier to the fact that the com-bined surplus of the major oil exporters is concentratedin countries of low absorptive capacity. Such a concen-tration tends, of course, to slow the rate at which risingimports may be expected to eat into the aggregate sur-plus for the whole oil exporting group, and means thatthis surplus will probably remain large for some yearsto come.
Available information on placements of the financialsurpluses accruing to the oil exporters indicates a trendtoward diversification of investments and shifts into lessliquid forms. Placements in bank deposits (mainly inthe Eurocurrency market) and short-term governmentsecurities are estimated to have absorbed only a littlemore than one fourth of the net cash inflow availablefor disposition by the major oil exporting countries in1976, compared with about two thirds in 1974, while
the proportion going into other investments in devel-oped countries (including marketable long-term govern-ment securities) has risen from about two tenths to onehalf. Grants and loans extended to developing coun-tries (directly or through multilateral developmentagencies) represented one seventh of the total in 1976,about the same proportion as in 1975 but substantiallylarger than in 1974.
Because of the rather uncertain dividing line betweenreserves and other officially held external financialassets of the oil exporting countries, together with theimprobability of any early net drawing down of theirtotal holdings of external claims, distinctions withrespect to the maturity structure of these claims may besomewhat less significant at the present time than cor-responding distinctions for most other groups of coun-tries. Nevertheless, the shift just described can beregarded as one tending to increase the stability of inter-national capital movements.
Industrial Countries
Following the oil price increase of 1974, whichswung the current account balances of most industrialcountries into substantial deficit, annual changes in thecombined balance for that group of countries weremainly cyclical in origin. From 1975 to 1976, theresponse of import demands to the rebound of economicactivity was the major element in a downward shift of$20 billion in the group's current account balance,from a surplus of $19 billion to a small deficit. (Thesebalances are defined in terms of goods, services, andprivate transfers; see Table 8, which also shows currentaccount balances inclusive of official transfers.)
Cyclical considerations aside, it is sometimes con-tended that each of the industrial countries (and otheroil importing countries as well) should have some "fairshare" of the collective current account deficit that is theinevitable counterpart, for the time being, of the com-bined current account surplus of the major oil exportingcountries. This simplistic notion, however, overlooksthe wide differences among countries in balance of pay-ments structure as between current account transactionsand capital flows—such differences reflecting primarilynational differences in saving propensities and invest-ment requirements. Nevertheless, given the fact thatmany countries throughout the world have currentaccount deficits that are too large to be sustained inlight of the available financing or the burden of externalindebtedness, the working of the international adjust-ment process would be facilitated by declines in the cur-rent account surpluses that still prevail in certain of theindustrial countries. Realization of such declines wouldrequire not only internationally cooperative policies onthe part of the surplus countries themselves, but also
14
©International Monetary Fund. Not for Redistribution

DEVELOPMENTS IN THE WORLD ECONOMY
Table 7. Global Balance of Payments Summary, 1973-76
(In billions of U.S. dollars)
Balance on
Industrial countries 3
Major oil exporters 3
Other primary producing countries 3
More developed areas
Less developed areas
In Africa
In Asia
In the Middle East
In Latin America and theCaribbean
Total, all countries 5
1973197419751976
1973197419751976
1973197419751976
1973197419751976
1973197419751976
1973197419751976
1973197419751976
1973197419751976
1973197419751976
1973197419751976
Trade
12.4-10.1
21.3— 6.2
18.681.752.563.5
-11.4-41.8-48.1-32.3
-4.8-19.1-19.0-16.8
-6.6-22.8— 29.1-15.5
0.50.7
-2.0— 1.3
-2.4-9.1-9.2-2.8
-4.3-7.0-9.1-8.2
-0.3-7.4-8.7-3.1
19.629.825.725.0
Servicesand private
transfers
-1.3— 1 1-2.5
4.8
-12.4-14.3-17.8-22.5
1.8-2.1-4.9-7.8
6.24.84.22.5
-4.4-6.8-9.1
-10.3
-2.3-3.0-3.1-3.9
0.10.50.70.1
2.11.41.01.6
-4.2-5.7-7.6-8.1
-11.8-17.5-25.3-25.5
Currentaccount
11.1-11.2
18.6— 1.4
6.267.434.741.0
-9.6-43.8— 53.0-40.1
1.3-14.3-14.8-14.3
-10.9-29.5-38.2-25.8
-1.9-2.3-5.1-5.2
-2.3-8.6-8.6-2.7
-2.2-5.6-8.2-6.7
-4.5-13.1-16.3-11.2
7.812.30.4
-0.5
CapitalAccountBalance г
-12.5'-3.6'
-19.2'— 3.2*
— 2.2-21.4-17.3-24.0
19.540.645.045.7
1.010.010.111.118.530.634.934.6
2.12.34.84.9
4.39.89.18.4
3.65.76.96.2
8.412.914.115.0
4.815.7
8.418.5
Change inLiabilities Balanceto Foreign Financed by
Official Transactions inAgencies 2 Reserve Assets
5.418.35.2
15.4
0.1-0.2
—
0.11.85.66.4
-0.10.42.43.2
0.11.43.23.2
0.10.20.30.5
_0.90.50.3
0.10.21.81.0
0.10.51.4
5.420.210.621.8
4.03.54.6
10.8
4.046.117.217.0
10.0-1.4-2.412.0
2.3— 3.9-2.3
—
7.72.5
-0.112.0
0.30.2—0.2
2.02.11.06.0
1.50.30.50.5
3.9-0.1— 1.7
5.3
18.048.219.439.8
Sources: Data reported to the International Monetary Fund and Fund staff estimates.1 This balance is computed residually as the difference between the balance financed by transactions in reserve assets and the sum
of the current account balance and the change in liabilities to foreign official agencies; it includes net errors and omissions, as wellas reported capital movements, government transfers, and gold monetization. (See also footnote 2.)
2 The concept of "liabilities to foreign official agencies" used in this table encompasses use of Fund credit and short-term balanceof payments financing transactions in which the liabilities of the borrowing country are presumably treated as reserve assets by thecreditor country.
3 For classification of countries in groups shown here, see Tables 1 and 2.4 See footnote 5.5 Global balance of payments aggregations inevitably contain many asymmetries arising from discrepancies of coverage or classi-
fication, timing, and valuation in the recording of individual transactions by the countries involved. A major area of asymmetricalclassification during recent years concerns the recording of official claims placed in Eurocurrency markets. These transactions,although treated as changes in reserve assets by the investing countries, are recorded as capital inflows by the recipient countries(mainly, the industrial countries). Had such transactions been recorded symmetrically, the global summations would show both alarger net capital outflow and a larger aggregate change in liabilities to foreign official agencies. If identified Eurocurrency reserveplacements (shown in terms of SDRs in Table 12 of this Report) were assumed to have been placed in industrial countries, then theadjusted net capital outflows from those countries would amount to $20.6 billion, $17.7 billion, $26.7 billion, and $11.3 billion overthe years 1973, 1974, 1975, and 1976, respectively.
15
©International Monetary Fund. Not for Redistribution

Table 8. Industrial Countries: Balance of Payments Summaries, 1973-76
(In billions of U.S. dollars)
Balance on
United States
United Kingdom
Canada
France
Germany, Fed. Rep.
Italy
Japan
Other industrial countries 4
Total, industrial countries
1973197419751976
1973197419751976
1973197419751976
1973197419751976
1973197419751976
1973197419751976
1973197419751976
1973197419751976
1973197419751976
Trade
0.9-5.4
9.0-9.2
-5.4-12.0-7.1-6.4
2.71.7
-0.51.1
0.8-3.9
1.5-4.7
14.921.917.616.4
-4.0-8.5-1.1-4.0
3.71.45.09.9
-1.3— 5.5-3.2-9.2
12.4-10.1
21.3-6.2
Servicesand
privatetransfers
1.66.86.5
12.3
4.24.14.35.3
-2.7-3.4— 4.1-5.4
-0.8-1.0-0.4-0.3
-8.2-9.6
— 10.2-9.6
2.81.92.12.3
-3.6-5.9— 5.4-6.0
5.55.94.86.2
-1.3-1.1-2.5
4.8
Currentaccount
2.51.4
15.53.1
-1.2— 7.8-2.8-1.1
-1.6-4.7-4.2
-0.1—4.8
1.1-5.0
6.712.37.56.8
-1.2-6.6
0.9— 1.7
0.1-4.5-0.4
3.9
4.20.41.6
-3.0
11.1-11.2
18.6-1.4
CapitalAccountBalance *
-7.8-10.3-20.2-13.5
1.44.92.80.2
— 0.51.64.34.8
-1.84.52.42.3
2.5-13.0-8.3-3.4
1.02.0
-3.61.7
-6.45.7
— 0.2-0.1
-0.90.83.65.0
-12.5 =-3.6^'
— 19.2--3.25
Change inLiabilitiesto Foreign
OfficialAgencies -
5.110.35.3
13.0
0.33.1
-1.4— 0.5
—
—
0.10.30.5
-0.1
-0.50.1
-0.20.3
0.35.31.02.6——
—
-0.7
0.1
5.418.35.2
15.4
Memo:Balance Current
Financed by AccountTransactions Including
in Reserve OfficialAssets Transfers
-0.21.40.62.5
0.50.2
— 1.4-1.4
-0.5
—0.40.5
-1.8-0.1
.4.0— 2.9
8.7-0.6-1.0
3.7
0.10.7
-1.72.6
-6.31.2
-0.63.8
3.40.55.22.1
4.03.54.6
10.8
-0.4-5.03
11.6-1.3
-2.1-8.6-3.6-2.5
0.1-1.5-4.7-4.2
-0.7-5.9
—-6.0
4.39.63.93.0
-2.5-7.8-0.5-2.9
-0.1-4.7-0.7
3.7
3.8-0.4
—-4.1
2.5-24.3-
5.9-14.3
Sources: Data reported to the International Monetary Fund and Fund staff estimates,^ee Table 7, footnote 1.2 See Table 7, footnote 2.3 Includes the effect of a revision of the terms of the disposition of economic assistance loans made by the United States to India
and repayable in rupees, and of rupees already acquired by the U.S. Government in repayment of such loans. The revision has theeffect of increasing U.S. Government transfer payments by about $2 billion, with an offset in net official loans.
4 Austria, Belgium-Luxembourg, Denmark, the Netherlands, Norway, Sweden, and Switzerland.5 See Table 7, footnote 5.
firm implementation of adjustment measures by theirtrading partners with current account deficits.
Current accounts and capital flows.—The industrialcountries with current account deficits in 1976 includedAustria, Canada, Denmark, France, Italy, Norway,Sweden, and the United Kingdom. Among the largercountries, the deficits of Italy and the United Kingdomwere in excess of amounts considered acceptable by theauthorities, but each country experienced a majorexchange rate depreciation and a gain in internationalprice competitiveness during 1976 that should improveits export prospects. Similar developments occurred in
France, where the 1976 deficit on current account wasdue in considerable part to special factors, such as thesummer drought. All three of these countries, as well asmost of the other deficit countries, are now pursuingpolicy measures that should improve their currentaccount balances within the year. In the case both ofthe United Kingdom, which will benefit from the NorthSea oil fields, and of Italy, the expected improvementmay carry the current account into balance or surplus.
In the financing of current account deficits of indus-trial countries, only France and the United Kingdommade any substantial use of reserve assets in 1976. Most
16
ANNUAL REPORT,1977
©International Monetary Fund. Not for Redistribution
DEVELOPMENTS IN THE WORLD ECONOMY
of the deficit countries have relied mainly on capitalinflows, and a number of them have encouraged privateor semiofficial enterprises to borrow abroad. Nationalgovernments themselves have entered the internationalcapital market in some instances. Policies to encourageexternal borrowing, partly through maintenance of highdomestic interest rates and restraint on domestic credit,continued to be followed in France and the Nordiccountries. The Swedish Government borrowed directlyon the international market for the first time in Febru-
i ary 1977, and it is anticipated that as much as half of; the financing for this year's current account deficit may
be obtained through that channel. Much of Denmark'soverall borrowing abroad has continued to be done bythe authorities.
Some of the larger current account deficits among theindustrial countries do not appear to be of a characterthat poses constraints on overall economic policy. TheCanadian and Norwegian deficits fall in this category.The structure of Canada's balance of payments has tra-ditionally been one of a current account deficit offset byinflows of long-term capital; this pattern was evident in1976 and may be expected to continue in the periodahead. The Norwegian current account has been in sub-stantial deficit since 1974, partly as a consequence ofheavy importation of equipment for the exploration andexploitation of the North Sea oil resources. As the oilsector imports taper off and the share of fuels in theexports of Norway grows, a shift into surplus isexpected.
The current account positions that were strongest in1975 and 1976 remained strong through the first half of1977. The surplus of the Federal Republic of Germanyis clearly a reflection of the continuing strength of thatcountry's exports and the ability of its exporters to holdor raise their market shares despite the loss in pricecompetitiveness experienced in the early 1970s. In viewof its external strength, and in line with its policy stance,the Federal Republic of Germany should maintain anadequate rate of expansion in domestic demand, con-sistent with its anti-inflation objective, and should acceptany appreciation of its currency that may result from theoperation of market forces. However, eventual adjust-ment of that country's current account position will alsodepend importantly on success of anti-inflation policiesin the deficit countries, coupled with willingness of thosecountries to allow exchange rate flexibility.
In the Netherlands, the persistent current accountsurplus of recent years reflects in large part the increas-ing importance of exports of natural gas. Not wishingto count on continuation of recent levels of export earn-ings from depletable reserves of this product, theauthorities are endeavoring to promote capital exports,with the objective of offsetting the current account sur-plus. The size of the Swiss current account surplus is
partly a manifestation of the severity of the recession inSwitzerland, which has resulted in low capacity utiliza-tion along with almost full employment in the labormarket because of a permanent reduction in the num-ber of foreign workers; also, the strong export orienta-tion of several Swiss industries has enabled them tomaintain the stability of their foreign market shares, involume terms, despite the pricing handicaps imposed byappreciation of the Swiss franc. These circumstancessignal a structural imbalance calling for additional mea-sures of adjustment. Meanwhile, the Swiss authoritiesare pursuing a policy of discouraging capital inflowsand encouraging outflows.
Japan's current account balance, although pushedinto substantial deficit by the oil price rise in 1974, hasswung back into surplus. Rapid restoration of exportprice competitiveness after the onset of severe inflation-ary pressures in 1974 contributed to an increase inJapan's share of world markets, allowing its exports torise slightly in volume despite the global recession. Bythe first half of 1977, the Japanese surplus on currentaccount was very large, and realization of the authori-ties' intention to reduce it in the period ahead willdepend crucially on achievement of a satisfactory rateof expansion of domestic demand. The recent apprecia-tion of the yen and the stated willingness of the authori-ties to let the exchange rate be determined by marketforces, with official intervention only for the purpose ofassuring orderly short-run movements, should help indue course to contain upward pressures on the currentaccount balance. Meanwhile, steps may be needed topromote the net outflow of long-term capital, whichcontracted sharply after the oil crisis and provided onlya relatively small offset to the current account surplusin 1976.
The large shrinkage of the current account surplus ofthe United States from 1975 to 1976, reversing a cycli-cal movement of similar size in the opposite directionin 1975, reflected primarily the fact that economicactivity was recovering at a faster rate in the UnitedStates than in its trading partners, with inventories risingstrongly. Net capital outflows from the United Statesgreatly exceeded the small current account surplus in1976—a development that illustrates the role of theU.S. money and capital markets as intermediaries on aninternational scale. In the main, the counterpart of therecorded net outflows of capital (as usually defined forbalance of payments purposes) was to be found inchanges in foreign official assets held in the UnitedStates. These have accounted for one third to one halfof the total inward movement of funds (both capital andreserves) in the past three years, with the investments ofoil exporting countries representing the bulk of the offi-cial inflow over the period as a whole. In effect, inflowsof foreign capital and official reserves, rather than U.S.
17
©International Monetary Fund. Not for Redistribution

ANNUAL REPORT, 1977
national savings, have represented the main source offinancing for investments in assets abroad by U.S. resi-dents in recent years.
A further downward movement in the current accountbalance of the United States occurred in the first halfof 1977, carrying it into substantial deficit. This move-ment was perhaps less wholly attributable to interna-tional cyclical factors (i.e., the stronger growth ofdomestic demand in the United States than in othercountries) than was the 1975-76 swing, although suchfactors were still operating in the same direction.Other influences, such as the sharp rise in prices ofmany imported primary commodities and the impactof an exceptionally severe winter on requirements forimported oil, were also important. Although oil importsaccounted for a considerable part of the total change inthe U.S. trade balance from 1975 to the first half of1977, the change in the balance of other trade transac-tions was more substantial, serving to facilitate theexternal adjustment efforts of many other countries.
Exchange rate developments.—Following a period ofrelative stability in 1975, the effective exchange rates ofItaly, the United Kingdom, and France came underpressure in 1976, at different times, and depreciatedsharply. (See Chart 3.) In each case, the depreciationoccurred despite official efforts to resist it through inter-vention, large increases in domestic short-term interestrates to influence capital movements, or heavy borrow-ings abroad by public or semipublic entities. During thefirst half of 1977, however, there were only smallchanges in the effective exchange rates of these threecountries.
In contrast, the Japanese yen appreciated by 5 percent in effective-rate terms during 1976 and by 10 percent during the first half of 1977. The increase inJapan's current account surplus was apparently themajor factor behind this development.
Both the deutsche mark and the dollar appreciatedin effective-rate terms during 1976, and the former con-tinued to do so in the first half of 1977. The US$/DMrate itself, which had fluctuated rather widely fromearly 1973 to mid-1975, was quite stable from August1975 to June 1976, but then rose sharply in the secondhalf of 1976 and continued upward in the first half of1977. Monetary developments—epitomized by the fallin short-term interest rates in the United States and therise in the interbank rate in Frankfurt during the secondhalf of 1976 (Chart 4)—can be seen as the key factorsbehind the deutsche mark appreciation during thatperiod.
Tensions within the European common marginsarrangement (the "snake") were frequent during 1976and at times became extreme, leading to adjustmentswithin the snake in mid-October. Prior to that realign-ment, the spread of 4—5 percentage points between infla-
Chart 3. Industrial Countries: Effective ExchangeRates, 1975-June 1977(Indices, 1975 = 100)
18
©International Monetary Fund. Not for Redistribution

DEVELOPMENTS IN THE WORLD ECONOMY
tion rates in the Federal Republic of Germany and thosein the other "snake" countries, together with the weak-ening of some of the current account balances, hadencouraged speculation in anticipation of a realignment.Official interventions to maintain the established cur-rency relationships were sizable, and several countriesresorted to stringent monetary policies for defense oftheir currencies. After the realignment, however, ten-sions within the snake abated and remained limited dur-ing the first half of 1977. In April, the Nordic coun-tries, although no speculation against their currencieshad been evident, made another adjustment in theirintervention limits for exchange transactions within thesnake, chiefly because of the weakness of Sweden's cur-
Chart 4. Industrial Countries: Short-Term InterestRates, 1974-June 1977 1
(In per cent per annum)
1 The rates shown are monthly averages of daily rates onmoney market instruments of about 90 days' maturity (the callmoney rate for Japan).
2 The United States, the Federal Republic of Germany, theUnited Kingdom, France, and Japan, with use of weights speci-fied in Section J, Remuneration and Interest Rate on SpecialDrawing Rights, Appendix II, Annual Report, 1976, page 118.
rent account and the loss in competitiveness of Swedishexports.
On the whole, exchange rate movements were rela-tively small during the first half of 1977 despite thepersistence of wide differentials in rates of inflation andof sizable current account imbalances. Although directofficial intervention in exchange markets did not, onbalance, figure prominently in this relative stability, offi-cial financing transactions of the various kinds notedabove contributed. The major stabilizing factors, how-ever, were probably the pursuit of restrictive demandmanagement policies in deficit countries and of moder-ately expansionary demand policies in the United Statesand the Federal Republic of Germany that were broadlysimilar to each other, resulting in a relatively narrowinterest rate differential between those two countries(Chart 4).
Recent developments appear to confirm that there isno close correlation between differences in inflationrates and those in exchange rate movements over shortperiods. With respect to the past four years, however,differences in relative inflation rates among major indus-trial countries and changes in exchange rates for theircurrencies have been, by and large, mutually offsetting.(See Chapter 2, page 28.)
More Developed Primary Producing CountriesThe more developed primary producing countries
were still generally in the backwash of the internationalrecession in 1976. As noted earlier, rates of inflationremained high despite continued weakness of domesticgrowth rates; and the group's external deficit on cur-rent account was still at approximately the high levelreached in 1974 and 1975.
These countries are predominantly net importers ofcapital, and their current account balances are ordi-narily in substantial deficit. Their collective deficit rosesharply with the onset of the global recession and theoil crisis, and many countries in the group borrowedheavily abroad, in addition to drawing down theirreserves, to maintain the inflow of real resources. Mostof the countries have ready access to international finan-cial markets, and they were apparently willing to utilizethis access to postpone downward adjustments of theirimports and current account deficits.
In any event, the price and volume changes discussedin the foregoing review of trends in world trade made itdifficult for the more developed primary producers tocarry out major adjustments of that sort. The cumula-tive deterioration of their terms of trade since 1973 hasbeen substantially greater than that for any other majorgroup of countries (Table 5). Consequently, eventhough the exports of this group have been responsivein volume terms to the cyclical upswing in worlddemand, and might have brought a substantial improve-
19
©International Monetary Fund. Not for Redistribution

ANNUAL REPORT, 1977
ment of the combined trade balance in a setting of morefavorable price developments, the trade deficit declinedonly moderately from 1974 to 1976; moreover, most ofthe improvement that occurred was offset by a declinein net receipts from services and private transfers.
For 1977, a partial reversal of the recent decline inthe service and private transfers account should supple-ment some further shrinkage of the trade deficit to pro-duce a moderately lower current account balance. Asindicated in Table 6, however, the estimated 1977 defi-cit of the more developed primary producing countrieson current account ($12 billion) will remain abouttwice as large as the average current account deficit ofthe same group over the period 1967-72 after allow-ance for the effects of growth and inflation. This obser-vation suggests that the group includes a dispropor-tionate number of countries whose adjustments to theinternational disturbances of recent years remain rela-tively incomplete.
In general, this characterization is most applicable tothe more developed primary producers of southernEurope. In several cases, internal problems haveimpaired the ability and willingness of countries in thatarea to implement meaningful stabilization programs.Delays in the application of restraints on demand havepermitted rates of inflation to accelerate or remainunduly high, and the continuation of relatively highinflation, in turn, has contributed to the maintenanceof current account deficits at the high levels to whichthey had risen in 1974 and 1975. The heavy foreignborrowing to finance these large deficits has includedsubstantial flows of an official compensatory character.
From 1974 to 1976, most of the improvement in thecombined current account balance of the more devel-oped primary producing countries was centered in theaccounts of the non-European members of the group(Australia, New Zealand, and South Africa) and ofFinland. These same countries will probably accountfor the bulk of the further improvement expected in1977. In all four countries, measures of restraint onaggregate demand have been instrumental in bringingabout recent adjustments of balance of payments posi-tions, and the authorities in each case appear deter-mined to persevere with such policies in 1977. Thisgroup of countries pursuing restrictive fiscal and mone-tary policies to curb domestic inflation and adjust exter-nal balances has recently been joined by Portugal,where tighter financial policies have been adopted inconnection with a Fund stand-by arrangement.
Less Developed Primary Producing Countries
Mainly in reflection of the world trade developmentsreviewed above, the current account deficit of the non-oil developing countries, which had risen to unprece-
dented size in 1974 and 1975, showed a substantialreduction in 1976 and may be expected to hold at aboutthe same level in 1977. The estimated deficits for thosetwo years, each about $25 billion, are some $12-13billion below the 1975 peak. (See Table 6.)
The current account deficit and its financing.—De-spite its sharp decline in 1976, the aggregate currentaccount deficit of the non-oil developing countriesremains three times as large, in nominal terms, as it wasduring the late 1960s and early 1970s. However, asnoted earlier (and shown in Table 6), this nominaldifference is chiefly a reflection of growth and inflationin the world economy over the intervening years. Afterallowance for those factors, the estimated currentaccount deficit of the non-oil developing countries in1977 is similar to the annual average for 1967—72.
In this connection, maintenance of perspectiverequires recognition that these countries have long been—and should continue to be—major net importers ofgoods and services. As a group, they are making devel-opmental investments substantially in excess of theirown national savings, and are enabled to do so by apersistent net inflow of capital and aid from abroad.While the degree to which national resources can besupplemented on a sustainable basis in the prevailingglobal environment is a difficult issue for judgment,there is general agreement that it is appropriate for thenon-oil developing countries to continue sizable cur-rent account deficits as long as they are able and will-ing to use borrowed resources to promote economicdevelopment.
Nevertheless, the question of degree remains crucialfrom the standpoint of balance of payments adjustment.It is clear that the upsurge of current account imbal-ances among the non-oil developing countries from1973 to 1975 overshot the mark. In meeting the emer-gency pressures of that period, when a strongly adversecyclical swing was compounded by the increased costsof energy and foods, many of these countries relied onexternal borrowing at rates and costs that were not sus-tainable, either from their own standpoint or from thatof their creditors. However, a considerable proportionof the countries in the group have already made sizableadjustments.
As far as sheer size is concerned, the "scale" consid-erations cited above (i.e., considerations relating to therecord of growth and inflation in the world economy)would suggest that the combined current account deficitfor the non-oil developing countries is no longer asource of serious concern. Its financing would notrequire total capital flows on an extraordinary scale inrelation to relevant flows of income, saving, and invest-ment in either the lending countries or the borrowingcountries. However, this generalized condition doesnot imply an absence of need for further balance of
20
©International Monetary Fund. Not for Redistribution
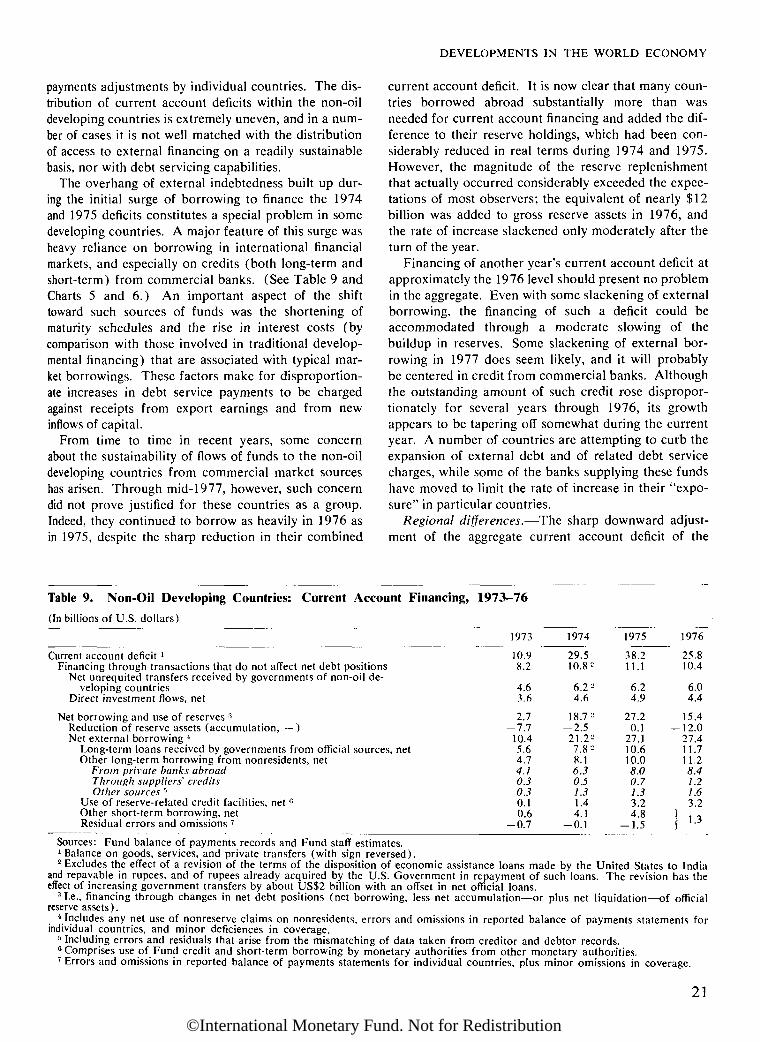
DEVELOPMENTS IN THE WORLD ECONOMY
payments adjustments by individual countries. The dis-tribution of current account deficits within the non-oildeveloping countries is extremely uneven, and in a num-ber of cases it is not well matched with the distributionof access to external financing on a readily sustainablebasis, nor with debt servicing capabilities.
The overhang of external indebtedness built up dur-ing the initial surge of borrowing to finance the 1974and 1975 deficits constitutes a special problem in somedeveloping countries. A major feature of this surge washeavy reliance on borrowing in international financialmarkets, and especially on credits (both long-term andshort-term) from commercial banks. (See Table 9 andCharts 5 and 6.) An important aspect of the shifttoward such sources of funds was the shortening ofmaturity schedules and the rise in interest costs (bycomparison with those involved in traditional develop-mental financing) that are associated with typical mar-ket borrowings. These factors make for disproportion-ate increases in debt service payments to be chargedagainst receipts from export earnings and from newinflows of capital.
From time to time in recent years, some concernabout the sustainability of flows of funds to the non-oildeveloping countries from commercial market sourceshas arisen. Through mid-1977, however, such concerndid not prove justified for these countries as a group.Indeed, they continued to borrow as heavily in 1976 asin 1975, despite the sharp reduction in their combined
current account deficit. It is now clear that many coun-tries borrowed abroad substantially more than wasneeded for current account financing and added the dif-ference to their reserve holdings, which had been con-siderably reduced in real terms during 1974 and 1975.However, the magnitude of the reserve replenishmentthat actually occurred considerably exceeded the expec-tations of most observers; the equivalent of nearly $12billion was added to gross reserve assets in 1976, andthe rate of increase slackened only moderately after theturn of the year.
Financing of another year's current account deficit atapproximately the 1976 level should present no problemin the aggregate. Even with some slackening of externalborrowing, the financing of such a deficit could beaccommodated through a moderate slowing of thebuildup in reserves. Some slackening of external bor-rowing in 1977 does seem likely, and it will probablybe centered in credit from commercial banks. Althoughthe outstanding amount of such credit rose dispropor-tionately for several years through 1976, its growthappears to be tapering off somewhat during the currentyear. A number of countries are attempting to curb theexpansion of external debt and of related debt servicecharges, while some of the banks supplying these fundshave moved to limit the rate of increase in their "expo-sure" in particular countries.
Regional differences.—The sharp downward adjust-ment of the aggregate current account deficit of the
Table 9. Non-Oil Developing Countries: Current Account Financing, 1973—76
(In billions of U.S. dollars)
Current account deficit *Financing through transactions that do not affect net debt positions
Net unrequited transfers received by governments of non-oil de-veloping countries
Direct investment flows, net
Net borrowing and use of reserves 3
Reduction of reserve assets (accumulation, — )Net external borrowing *
Long-term loans received by governments from official sources, netOther long-term borrowing from nonresidents, net
From private banks abroadThrough suppliers' creditsOther sources B
Use of reserve-related credit facilities, net eOther short-term borrowing, netResidual errors and omissions 7
1973
10.98.2
4.63.6
2.7-7.7
10.45.64.74.10.30.30.10.6
-0.7
1974
29.510.82
6.2 2
4.6
18.7 2
-2.521.22
7.82
8.16.30.51.31.44.1
-0.1
1975
38.211.1
6.24.9
27.20.1
27.110.610.08.00.71.33.24.8
-1.5
1976
25.810.4
6.04.4
15.4— 12.0
27.411.711.28.41.21.63.2
} , ,Í U
Sources: Fund balance of payments records and Fund staff estimates.1 Balance on goods, services, and private transfers (with sign reversed).2 Excludes the effect of a revision of the terms of the disposition of economic assistance loans made by the United States to India
and repayable in rupees, and of rupees already acquired by the U.S. Government in repayment of such loans. The revision has theeffect of increasing government transfers by about US$2 billion with an offset in net official loans.
3 I.e., financing through changes in net debt positions (net borrowing, less net accumulation—or plus net liquidation—of officialreserve assets).
4 Includes any net use of nonreserve claims on nonresidents, errors and omissions in reported balance of payments statements forindividual countries, and minor déficiences in coverage.
5 Including errors and residuals that arise from the mismatching of data taken from creditor and debtor records.6 Comprises use of Fund credit and short-term borrowing by monetary authorities from other monetary authorities.7 Errors and omissions in reported balance of payments statements for individual countries, plus minor omissions in coverage.
21
©International Monetary Fund. Not for Redistribution

ANNUAL REPORT, 1977
Chart 5. Non-Oil Developing Countries: Debt andDebt Service Ratios, 1969-77 1
Sources: IBRD Debtor Reporting System and Fund staffestimates.
1 The debt and debt service figures plotted in this chart relateonly to medium-term and long-term external public, or publiclyguaranteed, debt, as defined in the Debt Reporting Statistics ofthe IBRD.
'- Fund staff projections.
non-oil developing countries from 1975 to 1976 wasconcentrated mainly in two regions—Asia and theLatin American and Caribbean area (Table 7). Thedecline recorded for the small group of non-oil coun-tries in the Middle East was relatively moderate, whilethere was no decline at all in the current account deficitof the African region.
For 1977, the virtually unchanged aggregate deficitnow in prospect for the non-oil developing countries asa group seems likely to result from contrasting regionalchanges. These are expected to comprise an appre-ciable further downward adjustment in Latin Americaand the Caribbean and a small reduction in Africa,largely offset by considerable slippage in the MiddleEast and a minor upturn in the collective currentaccount deficit of less developed countries in Asia. Ifthese prospects materialize, the Asian deficit will remainonly about one third as large as it was at its peak in1975, while the Latin American and Caribbean deficitmight amount to about one half of the corresponding1975 figure. On the other hand, the deficits now visual-ized for the African and Middle Eastern regions areboth close to their 1975 levels, suggesting that onlyrelatively minor adjustments have as yet been carriedout in those areas.
The large decline in the Asian current account deficitsince 1975 has stemmed mainly from three factors: theimpact on import demands of the restrained financialpolicies pursued by several of the larger countries; theprevalence, especially in South Asia, of favorableweather conditions, which combined with the easing ofworld market prices for foodgrains to reduce foodimport bills; and the strong revival of export earningsstemming from the cyclical recovery in the industrialcountries, as well as from the recent bulge in worldprices for a number of primary commodities importantin Asian export trade.
For some of the major Asian countries, the processof external adjustment to the international disturbancesof 1974 and 1975 was largely completed in 1976, anddomestic development programs are proceeding withoutcritical balance of payments constraints in 1977. OtherAsian countries appear to require only moderate furtheradjustments, and some of those whose adjustmentsremain incomplete are nevertheless making satisfactoryprogress toward adjustment goals under existing pro-grams. However, the Asian area also includes a fewcountries that remain afflicted with basically weak bal-ance of payments positions, although some of thesehave been masked by unusually favorable harvests in1976 or suppressed by the application of restrictivetrade and payments policies and domestic controls.
The balance of payments record of the Latin Ameri-can and Caribbean area, even more than that of theAsian area, has been dominated in recent years by
22
©International Monetary Fund. Not for Redistribution

DEVELOPMENTS IN THE WORLD ECONOMY
Chart 6. Non-Oil Developing Countries: Share ofExternal Debt* Owed to Various Groups of Creditors,End 1967-End 1976(Per cent of total debt outstanding)
1 Public and publicly guaranteed medium-term and long-termexternal debt.
striking changes in the current account balances of afew large countries. Having strong access to interna-tional financial markets, the Latin American and Carib-bean countries were able to borrow heavily in 1974 and1975, especially from commercial banks, to finance alarge increase in their deficits on current account, andthey also drew down reserves. Their combined deficitrose to a peak of more than $16 billion in 1975, com-pared with only $4% billion in 1973 (Table 7).
Although most national authorities in the LatinAmerican and Caribbean region had initially attemptedto sustain domestic activity through expansionary fiscaland monetary policies during 1974 and much of 1975,there was a widespread swing toward tighter policies asthe effects of unrestrained demands on imports andexternal payments balances became apparent. During1976, this swing was instrumental in bringing a substan-tial reduction in the aggregate current account deficit ofthe region; a further reduction seems to be in processin 1977, in major part because of increases in exportprices, especially for coffee. Lowering of exchange
rates and more restrained wage policies have also beenwidely used to facilitate improvements in currentaccount balances.
The scale of external borrowing by Latin Americanand Caribbean countries was not cut back in step withthe reduction of current account deficits in 1976. Con-sequently, some rebuilding of international reservestook place, and this tendency has continued in the firsthalf of 1977.
For a number of Latin American and Caribbeancountries, issues relating to external debt managementhave come to be important because of the relativelyheavy reliance on private market financing, and espe-cially on commercial bank credit. Debt service ratioshave risen to historically high levels in a number ofcountries, and the need to restrain the growth of debtservice charges has been taken into account by most ofthe national authorities concerned in devising theiradjustment programs.
In Africa, most non-oil developing countries seizedthe opportunity created by the commodity boom of1973-74 to expand development efforts, but found itdifficult to modify their policies quickly when the globalenvironment changed. Through most of 1976, balanceof payments adjustment measures were confined to arelatively few countries. For the African region as awhole, the current account deficit remained as high in1976 as in 1975, and the improvement now in prospectfor 1977 is quite moderate.
Adjustment measures are needed in a considerablenumber of African countries. Financing through netinflows of capital and official transfers at their recentrates does not appear to be fully sustainable in themedium term. Increases in medium-term and long-termofficial and officially guaranteed debt since 1974 haveoccurred mainly in obligations of relatively short matur-ities, and annual debt service charges have been risingsteeply, leaving about a dozen countries in the Africanarea with severe debt service problems.
In many African countries, the main prerequisite forprogress toward satisfactory external adjustment is cor-rection of domestic financial imbalances. Improvedbudgetary policies are essential to permit lower rates ofinflation and to reduce reliance on external financing.In the absence of appropriate stabilization measures,tendencies toward increasing resort to trade and pay-ments restrictions, and to disorderly external financingthrough arrears on external payments, could becomemore widespread. Meanwhile, a continuing flow ofofficial external finance will be necessary, since theprocess of achieving equilibrium at acceptable rates ofgrowth is bound to be slow.
For the Middle Eastern countries that are not majorexporters of oil, there was some decline in the currentaccount deficit in 1976 from the swollen level of 1975,
23
©International Monetary Fund. Not for Redistribution
ANNUAL REPORT, 1977
but prospects for 1977 are not good. The regionalcurrent account deficit seems likely to rise again, andcould well exceed even the 1975 figure. This expecta-tion stems largely from the fact that several of thelarger countries in this group face deep-rooted imbal-ances in both internal and external positions. Programsto deal with these imbalances have been designed, butimplementation has been hampered or delayed bydomestic social and political difficulties.
External financing problems in the Middle Easternnon-oil countries thus remain substantial, but no majordifficulties in financing are expected in view of theavailability of substantial flows of external assistance.In a few cases, increases in official reserves may wellbe realized by countries in this group during 1977.
ConclusionsA few broad conclusions from the Fund's recent
review of the international adjustment process may benoted.
1. A substantial number of countries experiencedimprovements in respect of their external accountsduring the past year or so in the sense that they movedinto positions that could be said to be more nearlysustainable. However, there were also numerousinstances in 1976 where countries' external positionsworsened or existing weaknesses became more appar-ent. Progress in respect of international adjustment inthe period immediately ahead will depend mainly on thedegree of success experienced by the larger countries(both developed and developing) that either haveadopted financial arrangements with the Fund or other-wise are embarked on programs to strengthen theirexternal positions. At the same time, many developingcountries that have postponed adjustment are likely toexperience a prolongation or worsening of their posi-tions in the short run, and such a prospect also appliesto several of the more developed primary producingcountries. All in all, despite the evident progress, adjust-ment needs remain large; as experience shows, delaysin dealing with them could be very costly.
2. Strategies of adjustment must vary with the natureand position of the adjusting country, with differentguidelines or responsibilities in this regard applicableto the oil exporting countries and to surplus and deficitcountries within the oil importing group. Despite anumber of problems and difficulties, substantial im-provement in the working of the international adjust-ment process over the next several years should befeasible provided that certain conditions are met. Themost important of these conditions—which hinge pri-marily on the effectiveness with which countries exer-cise their international responsibilities—are satisfactorygrowth in the volume of world trade; reasonable adher-ence to the principles of adjustment by surplus anddeficit countries as recently developed in the Fund, andsummarized in the communiqué of the Interim Com-mittee after its 1976 meeting in Manila; pursuit ofdemand, pricing, and investment policies by the majoroil exporting countries that contribute to internationaladjustment and to the financing needs of oil importingcountries; and greater efforts by the oil importing coun-tries to conserve energy and to develop additionalsources of supply.
3. In the financing of the current account deficits ofnon-oil primary producing countries, the process of"recycling" the savings of oil countries into interna-tional financial markets has been reasonably effective.Nevertheless, this recycling has not been accompaniedby an appropriate amount of adjustment.
4. Given the persistence of large payments imbal-ances, heavy demands for use of the Fund's resourcesmight well materialize. Programs of adjustment areclearly needed in a number of countries, and expansionof the Fund's capacity to supply financial assistance,subject to adequate conditionality, could contributesignificantly to the promotion of international adjust-ment and to maintenance of confidence in the interna-tional monetary system. It is this central belief thatunderlies the Fund's current plans for establishmentof a supplementary credit facility. (See Chapter 3,page 47.)
24
©International Monetary Fund. Not for Redistribution

Chapter 2Developments in theInternational Monetary System
This chapter reviews a number of significant develop-ments in the international monetary system since theadoption of more flexible exchange rate arrangementsby most industrial countries. The first part of the chap-ter concentrates on exchange rate arrangements, begin-ning with a review of the variety of exchange rate prac-tices adopted by members in recent years. A number ofissues relevant to the behavior of exchange rates underthe present, more flexible, arrangements are then dis-cussed, and an assessment is made of the role ofexchange rate changes in the international adjustmentprocess. This leads on to a review of developments inthe demand for and supply of international liquidity,with particular reference to the role of the Fund in pro-viding conditional and unconditional liquidity.
Exchange Rate Arrangements
The new Article IV concerning exchange rate arrange-ments will take effect when the Proposed SecondAmendment enters into force, that is, after theamended Articles have been accepted by the requisitemajorities of Fund membership and voting power.Meanwhile, considerable progress has been made inputting into place arrangements for surveillance underthe new provisions. Following the meeting of theInterim Committee in April 1977, the Executive Boardapproved principles for the guidance of members'exchange rate policies, and principles and proceduresfor Fund surveillance, to be applied when the SecondAmendment takes effect. (For the decision on Surveil-lance over Exchange Rate Policies, see Appendix II.)The provisions of Article IV, and the principles adoptedby the Fund for the guidance of members' exchangerate policies, allow members to adopt a wide variety ofregimes, thereby recognizing the growing heterogeneityof exchange rate practices that has characterized theinternational monetary system since the adoption offloating exchange rates by major industrial countriesearly in 1973.
The exchange rate practices adopted by membersover the past four years cover a broad spectrum, rang-ing from independent floating with relatively littleattempt to influence market forces, to the maintenanceof a fixed peg against a single intervention currency.The fact that most major currencies float independentlyimplies, of course, that even countries that peg theircurrencies in some manner face variability in their bilat-eral exchange rates against currencies outside theirgroup.
Within the group of countries that permit continuousflexibility in their exchange rates, the extent to whichrates are managed varies quite widely. Some countrieshave generally refrained from efforts to influence thecourse of their exchange rates, other than smoothingshort-term disturbances or countering disorderly mar-ket conditions. These include Canada, the UnitedStates, and the members of the European common mar-gins arrangement (the snake) taken as a group—though individual participants in the snake undertakethe necessary measures to keep their exchange ratesvis-à-vis other snake currencies within the agreed mar-gins, and some participants have engaged in heavy bor-rowing to finance current account deficits. Among othercountries that consider their exchange rates to be float-ing, and particularly for those that have faced difficultbalance of payments adjustment problems, there hasgenerally been a somewhat greater disposition to useintervention and other policies to influence develop-ments in their rate.
A variety of policies, which may of course also beemployed with other objectives in view, have been usedto influence exchange rate developments. Such policiesinclude reserve changes, official and quasi-official bor-rowing and lending, domestic monetary policy, andchanges in exchange controls. On occasion these poli-cies have been employed in the context of a fairly clearobjective for the exchange rate; but more usually, thepolicy has been one of resisting rapid movements in therate.
25
©International Monetary Fund. Not for Redistribution

ANNUAL REPORT, 1977
Among those countries that formally pursue a policyof fixing their exchange rates—the majority of Fundmembers—a number of different pegging techniques arepresently employed. The choice of technique dependsin part on historical and institutional factors and partlyon the view of the authorities concerned of what wouldbe most consistent with their overall economic objec-tives. The most commonly used technique is still thatof pegging to a single currency (a unitary peg). OnJune 30, 1977, a total of 44 countries (with about10 per cent of members' exports in 1975) still retaineda peg to the U.S. dollar; 14 (accounting for % per cent)were pegged to the French franc; and 9 (with % percent) were pegged on other currencies. In addition, 7countries (with roughly 2 per cent) having relativelyhigh inflation rates had an exchange rate that was fixedby the authorities, but adjusted frequently on the basisof indicators of relative costs and prices.
A growing group of countries (29 in number onJune 30, 1977, with about 9 per cent of members'exports) have chosen to link their currencies in somemanner to a basket of other currencies (a compositepeg) or to the special drawing right (SDR). Finally, 7countries (with 24 per cent of members' exports) areparticipating in the European common margins arrange-ment, whereby these countries undertake to use mutualintervention to maintain the exchange rate for their cur-rencies within a narrow band of fluctuation against eachother, although not against the currencies of othercountries.
There has also been a growing preparedness to reap-praise exchange rate policies more frequently than inthe past. Such reappraisal has resulted in changes inpolicy or in exchange rate practices. Some countrieshave changed the intervention points against their pegcurrency without, however, changing the form of thepeg. Others have changed their peg either to anothercurrency or to a currency basket, and still others havemade use of formulas or indicators as a guide to pegchanges. Relatively few countries outside the industrialworld have chosen to move to independent floating asa permanent arrangement, although some have usedexchange rate flexibility as an interim measure pendingre-establishment of a fixed peg.
This change in attitude to exchange rate arrangementsand exchange rate policies can be illustrated by com-paring the actions of members in the later years of thepar value system with experience in the floating period.In the last three complete years of the operation of thepar value system, 1968 to 1970, only one country,Canada, changed from a fixed peg to a floating arrange-ment (although the deutsche mark was allowed to floatbriefly in 1969 prior to returning to a par value).
Since 1973, on the other hand, there have been a con-siderable number of changes in exchange rate arrange-
ments and much more frequent changes in peg by coun-tries adhering to pegging arrangements. In February-March 1973, when the Smithsonian pattern of exchangerates broke down, the European countries participatingin the common margins arrangement allowed the snakeas a whole to float against other currencies, and a num-ber of other European countries and Japan also adoptedfloating arrangements. Later in 1973, 10 other countriesmoved away from a unitary peg, with 3 of these—Greece, Iceland, and Yugoslavia—electing to float inde-pendently and 7—including Finland, Malaysia, NewZealand, and Singapore—adopting composite peggingarrangements. In 1974, there were 10 changes in mem-bers' exchange arrangements, of which one was repeg-ging by a country with a floating currency (Greece), 6were changes in pegging arrangements, including theadoption by Spain and Australia of composite pegs, and3 were the adoption of independent floating (France,Nigeria, and South Africa). In 1975, out of the 22changes in exchange arrangements, the great majoritywere movements from a unitary peg to pegging to acomposite of currencies, though South Africa switchedfrom independent floating to a unitary peg and Francereturned to membership in the European common mar-gins arrangement. A noteworthy feature of develop-ments in exchange rate arrangements during 1975 wasthe adoption of a peg to the SDR by 10 countries thathad previously been pegged either to a single interven-tion currency or to a composite of currencies. Amongcountries adopting an SDR peg during 1975 were Iranand the 3 countries of the East African Community;Saudi Arabia also shifted to an SDR peg early in theyear, but later widened its intervention points to allowa greater measure of stability in its rate against the U.S.dollar.
In 1976 there were rather fewer changes in exchangepractices, partly perhaps because many Fund memberswere by that time already operating under arrangementsthey considered appropriate to the new circumstances.During the year, four more countries ceased to peg tosterling, with two of them electing to peg to the dollar,one to the SDR, and one to a composite peg. Franceagain left the European common margins arrangement,and Mexico stopped pegging to the U. S. dollar to floatindependently. In addition, four other countries, includ-ing Australia, adopted arrangements permitting greaterflexibility in their exchange rates. In the first half of1977, the only country to change its exchange arrange-ments was Portugal, which shifted from floating to acomposite peg.
An increasing tendency to reconsider exchange ratepolicies is also reflected in the greater frequency withwhich countries using pegging arrangements have beenprepared to change their intervention points as a meansof responding to balance of payments disequilibria. In
26
©International Monetary Fund. Not for Redistribution
DEVELOPMENTS IN THE INTERNATIONAL MONETARY SYSTEM
the three years 1968 to 1970, of the 99 countries thatwere continuously operating under par values or unitarypegs, and were members of the Fund during the entireperiod, only 6 proposed changes in par value to theFund or adjusted their pegged rates. In the three years1974 to 1976, by contrast, of the 73 countries that con-tinuously maintained a unitary peg (or a peg to theSDR), a total of 19 countries made one or morechanges in their intervention points.
In summary, the four years that have elapsed sincethe move to greater exchange rate flexibility by a num-ber of industrial countries have seen a perceptibleincrease in flexibility in the exchange arrangements ofFund members as a whole. There has been a growingdiversity of exchange practices among countries, andmembers have been prepared to change their exchangearrangements to meet new circumstances. In addition,there has been an increasing disposition to regard theexchange rate as an instrument of policy that may needto Ьз changed from time to time to respond to disequi-libria that have emerged. Countries that are prepared toconduct their domestic policies so as to maintain arigidly fixed peg for any appreciable period of time nowrepresent only a small proportion of world trade.
A number of factors have combined to induce coun-tries to give greater attention to their exchange ratepolicies as part of their overall economic strategy. Per-haps the most important has been the unstable economicconditions and high level of worldwide inflation inrecent years. This has resulted in fixed exchange ratesbecoming inappropriate more rapidly than was the casewhen underlying economic conditions were more settledand rates of price increase were lower and more uniformamong countries. Second, uncertainty about the impli-cations for exchange rates of changes in the structure ofworld trade has required greater attention to exchangerates in the context of achieving effective adjustment.Third, for smaller countries adopting a unitary peg,changes in exchange rates between the currency towhich they peg and other major currencies have some-times resulted in unwelcome shifts in the local currencyprice of exports and imports. Lastly, and more gen-erally, the breakdown of the par value system hasencouraged countries to give more active considerationto the role of the exchange rate in formulating theiroverall economic policies.
At the same time, many smaller countries have feltthat there were advantages for them in maintaining apoint of reference for their exchange rate through apolicy of pegging. Among the industrial countries thathave a pegging policy, and particularly for the smallermembers of the snake, the advantages of exchange ratestability have been perceived mainly in relation to thefight against inflation. For developing countries, themain fear has been that independent floating might
result in exchange rate instability that would hampertheir planning efforts and be harmful to their growthprospects and the confidence on which both capitalinflows and local investment depend. Among the rea-sons why these countries felt unwilling to allow theirexchange rates to be continuously determined by mar-ket forces alone are the inability of these countries toaffect their export or import prices in foreign currenciesthrough changes in their own exchange rates; the inelas-tic nature of their demand for imports and, in theshort run, of their supply of exports; the lack ofwell-developed financial markets, including forwardexchange markets; the unresponsiveness of capital flowsto conventional yield considerations; and the desire tomaintain a given external objective as a fulcrum fordomestic economic policies.
While recognizing that these factors are often putforward as arguments for pegging in the case of primaryproducing countries, it must also be noted that peggingto a single intervention currency has rather differentimplications when the major currencies are floatingagainst each other than it does when the world as awhole is operating under fixed rates. In particular, whenthe major currencies are floating against one another,movements in the pegged rate of a smaller country willreflect developments in the balance of payments of themajor country to whose currency it is pegging, and maynot necessarily be consistent with the requirements ofits own balance of payments position. Since fluctuationsin the country's effective exchange rate are to this extentnot dependent on the country's own policy, they mayinterfere with the pursuit of internal policy objectives.To help moderate these unwelcome influences, whilestill retaining some of the perceived advantages of peg-ging, a number of countries, most of which are primaryproducers, have chosen to peg the value of their cur-rencies to some composite of currencies of their impor-tant trading partners.
Exchange Rate Changes and Uncertainty
Since the early months of 1973, when a number ofmajor currencies started to float, members' effectiveexchange rates have fluctuated much more than theyhad done during the preceding years, except perhapsduring the months immediately following the discon-tinuation of the convertibility into gold of foreign offi-cial U. S. dollar holdings in August 1971.
After the par value system broke down, concern wasoften expressed that exchange rate uncertainty accom-panying greater rate flexibility could adversely affectinternational trade and capital transactions. There isno satisfactory measure of this uncertainty, but onepossible indication of developments in exchange rate
27
©International Monetary Fund. Not for Redistribution
ANNUAL REPORT, 1977
uncertainty is provided by the information available inspot and forward markets.
In their decisions on the use of the forward marketfor covering exchange risks, market participants com-pare the present spot and forward rates with their expec-tation of the future spot rate at the time when the for-ward contract matures and the interest rate differentialprevailing in the relevant markets. The actions of mar-ket participants taken together result in a tendency forthe forward rate to be drawn toward the future spot ratecollectively expected by the market, with both of theserates tending to differ from the present spot rate by thedifference in short-term interest rates in the two moneymarkets in question. These tendencies may, of course,be prevented from fully manifesting themselves by thethinness of the forward market for many currencies andin some instances also by official intervention in thismarket.
To the extent that the forward rate reflects the mar-ket's expectation of the future spot rate on the date onwhich the forward contract matures, the gap, observedex post, between the forward rate as quoted threemonths earlier and the actual spot rate on this date canserve as an indicator of market participants' errors inforecasting exchange rate developments.
This indicator is shown in Chart 7 for eight majorcurrencies for which forward exchange rates are readilyavailable. The indicator is calculated as the nine-monthmoving average of the absolute deviations, whetherpositive or negative, of the three-month forward rate atthe end of each month and the actual spot rate observedthree months later. It is noteworthy that the indicatorfor the Canadian dollar is considerably lower than thosefor the other currencies during the early part of theperiod under investigation. This is largely explained bythe much narrower range of fluctuations between theCanadian and U. S. dollars than between the currenciesof other countries and that of the United States. Theincrease in the Canadian indicator in the middle of 1975resulted from an appreciation of the spot rate during aperiod when there were discounts on the forward Cana-dian dollar established three months earlier, parallelingthe unprecedented disparity in short-term interest ratesbetween Canada and the United States. For many of theEuropean currencies, the largest deviation occurred in1973 with the onset of floating by many of the majorcurrencies. A smaller peak occurred for countries,adher-ing to the European common margins arrangement inthe second quarter of 1975, when there was doubt con-cerning the effect of the recession on the balance ofpayments of these countries. For Japan, the peakoccurred in the middle of 1974, reflecting the impact ofthe oil price increase and the subsequent recession.
In contrast, during 1976 the deviations remained rela-tively small for most of the currencies shown. Only the
pound sterling and the Dutch guilder did not follow thisgeneral trend. For the pound, the measured deviationsreached a peak during 1976. The rise in the indicatorfor the Dutch guilder above those of most of the othercountries in the second half of 1976 may have beencaused by unfulfilled expectations that the guilder wouldbe realigned within the European common marginsarrangement. The chart shows that, on the whole, thedeviations between forward exchange rates and actualspot rates at the time the forward contracts mature weresmaller during 1976 than in previous years for many ofthe major currencies. While, in part, it may indicatethat market participants are learning how better toanticipate exchange rate movements, it may also be thatthe underlying determinants of exchange rates havebecome less variable and, therefore, more predictable.
The Role of the Exchange Rate in theAdjustment Process
Four years after the breakdown of the fixed rate sys-tem and the move toward greater exchange rate flexi-bility, a number of industrial countries are continuing toexperience serious external imbalances. While it isrecognized that too rapid an adjustment to the 1973 oilprice increase by the industrial countries as a whole wasnot desirable, concern has been expressed recentlyabout the apparent slowness of the adjustment process.This section focuses on the role of the exchange rate inthe adjustment process for industrial countries that arefloating. Evidence from the past four years is reviewedto see whether exchange rate movements have fosteredan improvement in the international price competitive-ness of industrial countries in a weak position on cur-rent account vis-à-vis those in a strong position, andwhether exchange rate movements have significantlyinfluenced current account outturns. The contributionof exchange rate movements to the reduction of existingimbalances is found to have been limited, and two mainexplanations are advanced: (1) until recently the needfor external adjustment has not been given high priorityand the flexibility of exchange rates has been reducedby the use of intervention and other policy measures,such as official and quasi-official borrowing; and (2) theeffectiveness of exchange rate changes has often beenimpaired by the absence of appropriate accompanyingdomestic policies. The greater exchange rate flexibilityof the past four years has, nevertheless, been helpful inoffsetting the effects of divergent inflation rates on coun-tries' external positions.
Since early 1973 changes in exchange rates havetended to offset differences in the rates of inflationamong the major industrial countries. This point is evi-
28
©International Monetary Fund. Not for Redistribution
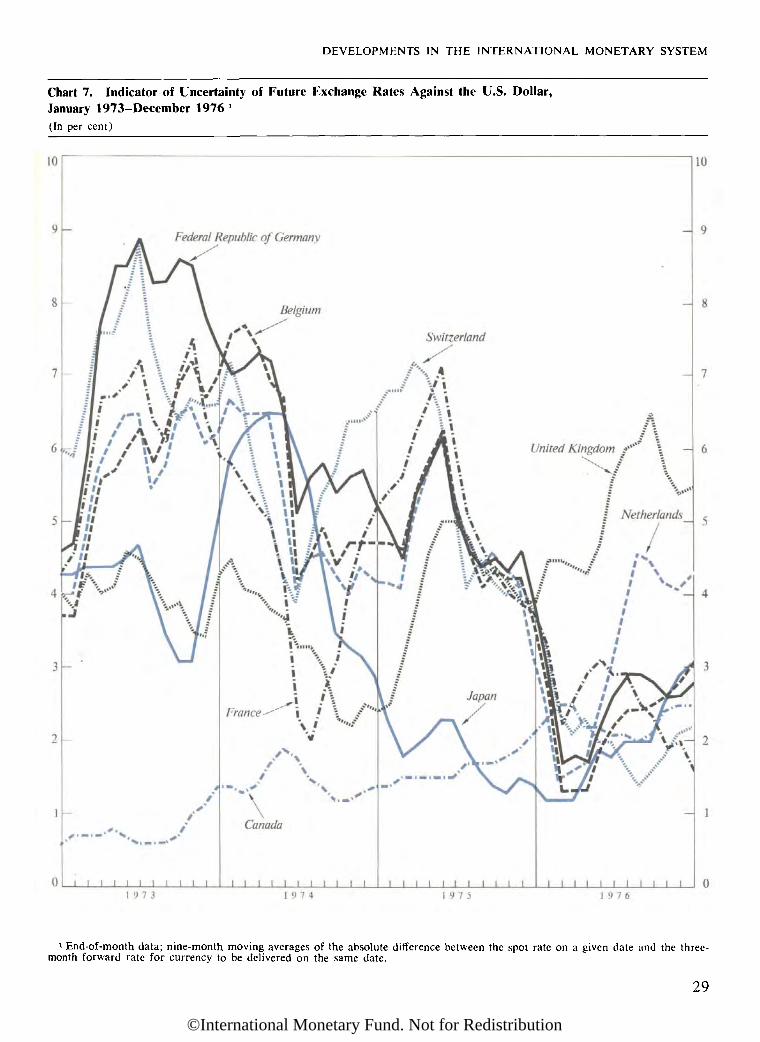
DEVELOPMENTS IN THE INTERNATIONAL MONETARY SYSTEM
Chart 7. Indicator of Uncertainty of Future Exchange Rates Against the U.S. Dollar,
January 1973-December 1976 г
(In per cent)
1 End-of-month data; nine-month moving averages of the absolute difference between the spot rate on a given date and the three-month forward rate for currency to be delivered on the same date.
29
©International Monetary Fund. Not for Redistribution

ANNUAL REPORT, 1977
dent from Chart 8, which shows the effective exchangerate and the relative wholesale price of manufacturedgoods before and after adjustment for exchange ratechanges. The base period for the chart is the first halfof 1973, which corresponds to the beginning of thefloating rate period. As a consequence of these offset-ting price and exchange rate developments, the patternof competitiveness among most of the major industrialcountries is now very similar to what it was in early1973. Only two countries, Switzerland and Italy, haveexhibited a clear change in their competitive positionsas measured by wholesale prices adjusted for exchangerate changes between the first half of 1973 and the firstquarter of 1977.
The type of comparison made above obscures short-term changes in relative prices. For example, the Fed-eral Republic of Germany sustained a sharp rise in rela-tive prices as a result of the large appreciation of thedeutsche mark in early 1973, but its competitive posi-tion gradually improved to the third quarter of 1975 asa result of better domestic price performance and noclear trend in its effective exchange rate. Since the thirdquarter of 1975 there has been some loss in price com-petitiveness by the Federal Republic of Germany as aresult of a further appreciation of the effective exchangerate for the deutsche mark. Japan's price performanceexhibits a similar pattern; after a loss in competitivenessof about 10 per cent from 1973 to mid-1974, whichreflected high domestic rates of inflation, its relativeprice position improved through 1975 as a result ofrelatively low rates of domestic price increases. How-ever, the appreciation of the yen from the early part of1976 has contributed again to some loss in competi-tiveness.
Although the relative price position of French manu-factured goods has not changed over the period takenas a whole, its development has been discontinuous,reflecting alternating periods of appreciation and depre-ciation. The United Kingdom experienced a continuingloss in competitiveness from the second half of 1973 tomid-1975, but an improvement accompanied the rapiddepreciation of the pound exchange rate to the end of1976. During the first quarter of 1977 rapid rates ofdomestic inflation accompanied by an exchange rateappreciation have resulted in a level of competitivenessequal to that experienced in early 1973. The UnitedStates and Canada have experienced lesser movementsin their relative price positions during the four-yearperiod.
A comparison of prices for manufactured goodsmay, however, be a misleading indicator of the com-petitive position of a country, since the producers ofmanufactured goods may be obliged to some extent toprice their products at world price levels despite changesin domestic costs. Under these circumstances, a loss
of competitiveness will not be indicated by the rela-tive price of manufactures adjusted for exchange ratechanges. Indicators of relative unit labor costs are lesssubject to this weakness. They have other well-knowndrawbacks, however, such as their sensitivity to relativecyclical factors. In the present case, the evidence onrelative unit labor costs in manufacturing does notdiverge significantly from earlier results. According tothese indices, the comparative advantage gained by Italyis somewhat larger, while the United Kingdom and theUnited States also moved into positions of increasedcompetitiveness between the first half of 1973 and thefirst quarter of 1977. During the same four-year periodthere was some deterioration in Canada's relative costposition.
Apart from longer-run changes in international com-petitiveness, the recent period has also been charac-terized by short-term fluctuations in exchange rates thathave led to sharp temporary movements in the relativeprice of manufactured goods adjusted for exchangerate changes. The French experience provides anextreme example of the impact of short-run fluctuationsin the exchange rate on the competitive position of acountry. It is clear from Chart 8 that the short-termfluctuations in the French exchange rate have had alarge and immediate impact on the competitive positionof French manufactured goods. To the extent thatlagged adjustment in domestic prices has occurred, ithas tended to amplify the impact of the exchange rate.In 1974 and 1975, domestic prices appear to have beenadjusting in part to the prior depreciation of the francwhile the exchange rate was appreciating. As a conse-quence, both factors contributed to the sharp deteriora-tion in the competitive position of French manufacturedgoods during this period. As discussed below, suchshort-term fluctuations in relative prices do not, how-ever, have much impact on patterns of production anddemand.
The greater exchange rate flexibility of the past fouryears has been helpful to the adjustment process insofaras exchange rate movements have prevented certain cur-rent account imbalances from developing or wideningowing to divergent inflation rates. Rate flexibility hasalso facilitated the financing of current account imbal-ances by encouraging equilibrating capital movements.Exchange rate changes do not seem, however, to haveplayed much of a role in recent years in reducing exist-ing external imbalances among industrial countries.Current account developments since 1973 seem to havebeen dominated by other factors.
First, the volume of oil imports is not the same forall industrial countries, and, therefore, the relative cur-rent account positions of the various countries werechanged by the 1973 oil price increase. Those coun-tries already facing payments deficits in 1973, for exam-
30
©International Monetary Fund. Not for Redistribution

DEVELOPMENTS IN THE INTERNATIONAL MONETARY SYSTEM
Chart 8. Effective Exchange Rates and Relative Prices, 1969-76
(Quarterly indices, first half 1973 = 100)1
Effective exchange rate Unadjusted relative wholesale pricesof manufactured goods
Adjusted relative wholesale pricesof manufactured goods
1 These indices, including those used in the calculation of the effective exchange rates, are based on data for the 14 industrialcountries.
- First quarter partially estimated by the Fund staff.
31
©International Monetary Fund. Not for Redistribution
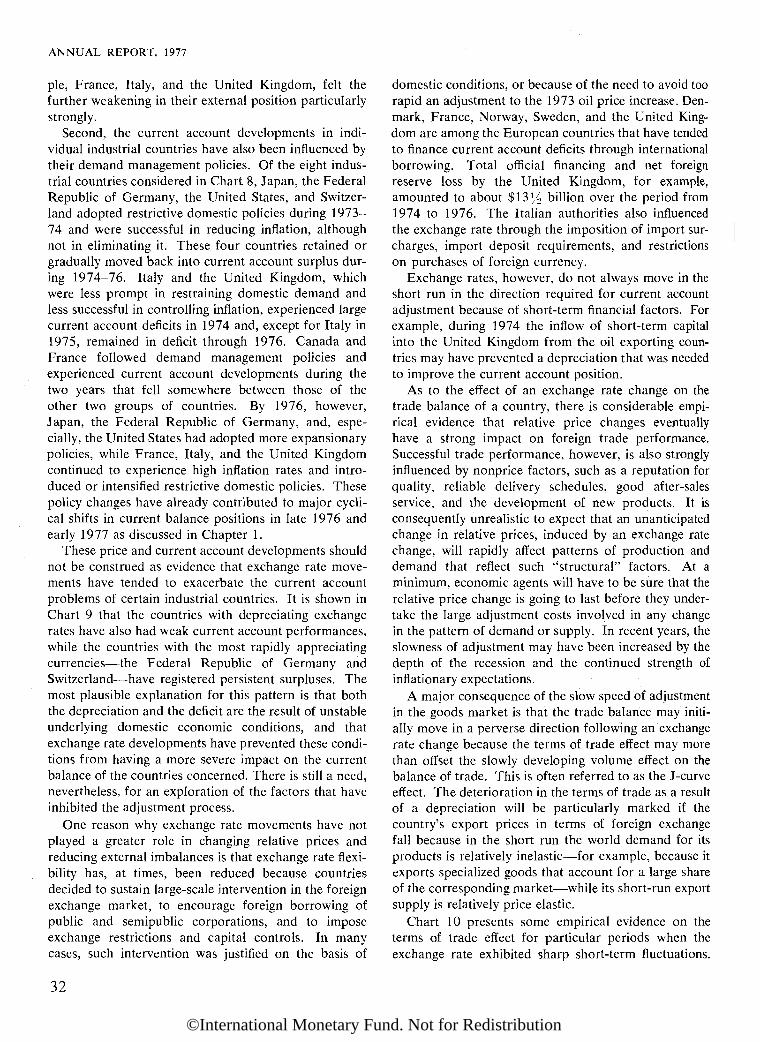
ANNUAL REPORT, 1977
pie, France, Italy, and the United Kingdom, felt thefurther weakening in their external position particularlystrongly.
Second, the current account developments in indi-vidual industrial countries have also been influenced bytheir demand management policies. Of the eight indus-trial countries considered in Chart 8, Japan, the FederalRepublic of Germany, the United States, and Switzer-land adopted restrictive domestic policies during 1973-74 and were successful in reducing inflation, althoughnot in eliminating it. These four countries retained orgradually moved back into current account surplus dur-ing 1974-76. Italy and the United Kingdom, whichwere less prompt in restraining domestic demand andless successful in controlling inflation, experienced largecurrent account deficits in 1974 and, except for Italy in1975, remained in deficit through 1976. Canada andFrance followed demand management policies andexperienced current account developments during thetwo years that fell somewhere between those of theother two groups of countries. By 1976, however,Japan, the Federal Republic of Germany, and, espe-cially, the United States had adopted more expansionarypolicies, while France, Italy, and the United Kingdomcontinued to experience high inflation rates and intro-duced or intensified restrictive domestic policies. Thesepolicy changes have already contributed to major cycli-cal shifts in current balance positions in late 1976 andearly 1977 as discussed in Chapter 1.
These price and current account developments shouldnot be construed as evidence that exchange rate move-ments have tended to exacerbate the current accountproblems of certain industrial countries. It is shown inChart 9 that the countries with depreciating exchangerates have also had weak current account performances,while the countries with the most rapidly appreciatingcurrencies—the Federal Republic of Germany andSwitzerland—have registered persistent surpluses. Themost plausible explanation for this pattern is that boththe depreciation and the deficit are the result of unstableunderlying domestic economic conditions, and thatexchange rate developments have prevented these condi-tions from having a more severe impact on the currentbalance of the countries concerned. There is still a need,nevertheless, for an exploration of the factors that haveinhibited the adjustment process.
One reason why exchange rate movements have notplayed a greater role in changing relative prices andreducing external imbalances is that exchange rate flexi-bility has, at times, been reduced because countriesdecided to sustain large-scale intervention in the foreignexchange market, to encourage foreign borrowing ofpublic and semipublic corporations, and to imposeexchange restrictions and capital controls. In manycases, such intervention was justified on the basis of
domestic conditions, or because of the need to avoid toorapid an adjustment to the 1973 oil price increase. Den-mark, France, Norway, Sweden, and the United King-dom are among the European countries that have tendedto finance current account deficits through internationalborrowing. Total official financing and net foreignreserve loss by the United Kingdom, for example,amounted to about $13% billion over the period from1974 to 1976. The Italian authorities also influencedthe exchange rate through the imposition of import sur-charges, import deposit requirements, and restrictionson purchases of foreign currency.
Exchange rates, however, do not always move in theshort run in the direction required for current accountadjustment because of short-term financial factors. Forexample, during 1974 the inflow of short-term capitalinto the United Kingdom from the oil exporting coun-tries may have prevented a depreciation that was neededto improve the current account position.
As to the effect of an exchange rate change on thetrade balance of a country, there is considerable empi-rical evidence that relative price changes eventuallyhave a strong impact on foreign trade performance.Successful trade performance, however, is also stronglyinfluenced by nonprice factors, such as a reputation forquality, reliable delivery schedules, good after-salesservice, and the development of new products. It isconsequently unrealistic to expect that an unanticipatedchange in relative prices, induced by an exchange ratechange, will rapidly affect patterns of production anddemand that reflect such "structural" factors. At aminimum, economic agents will have to be sure that therelative price change is going to last before they under-take the large adjustment costs involved in any changein the pattern of demand or supply. In recent years, theslowness of adjustment may have been increased by thedepth of the recession and the continued strength ofinflationary expectations.
A major consequence of the slow speed of adjustmentin the goods market is that the trade balance may initi-ally move in a perverse direction following an exchangerate change because the terms of trade effect may morethan offset the slowly developing volume effect on thebalance of trade. This is often referred to as the J-curveeffect. The deterioration in the terms of trade as a resultof a depreciation will be particularly marked if thecountry's export prices in terms of foreign exchangefall because in the short run the world demand for itsproducts is relatively inelastic—for example, because itexports specialized goods that account for a large shareof the corresponding market—while its short-run exportsupply is relatively price elastic.
Chart 10 presents some empirical evidence on theterms of trade effect for particular periods when theexchange rate exhibited sharp short-term fluctuations.
32
©International Monetary Fund. Not for Redistribution
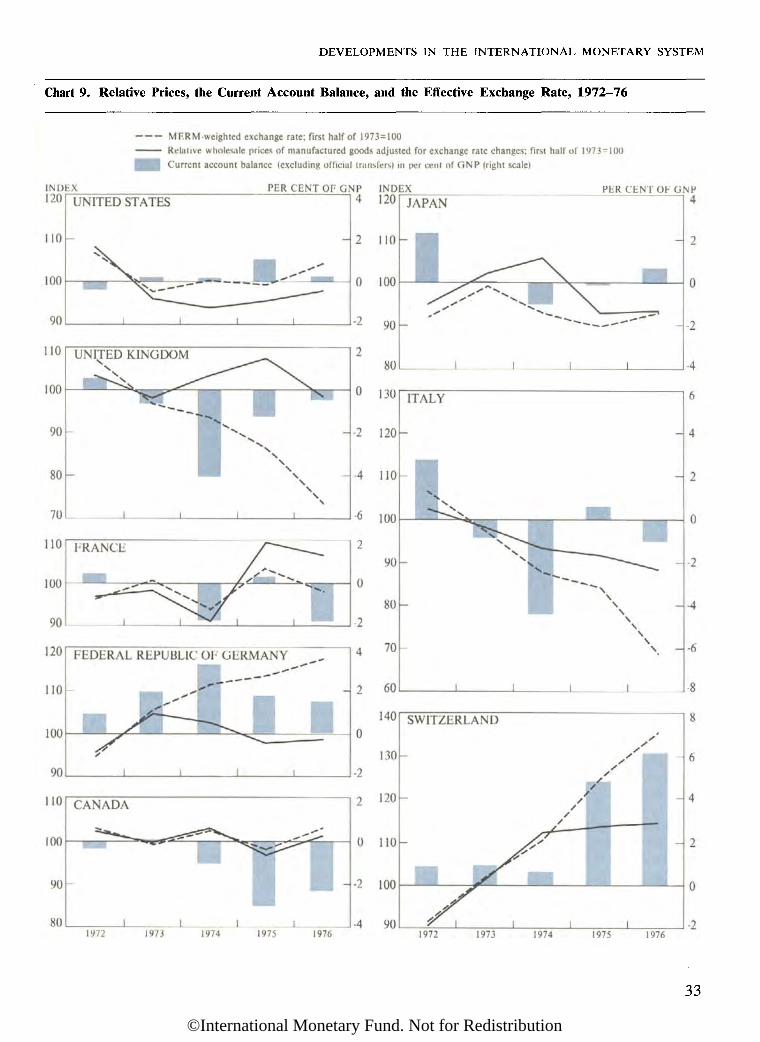
DEVELOPMENTS IN THE INTERNATIONAL MONETARY SYSTEM
33
"hart 9. Relative Prices, the Current Account Balance, and the Effective Exchange Rate, 1972—76
MERM-weighted exchange rate; first half of 1973=100Relative wholesale prices of manufactured goods adjusted for exchange rate changes; first half of 1973=100
Current account balance (excluding official transfers) in per cent of GNP (right scale)
©International Monetary Fund. Not for Redistribution

ANNUAL REPORT, 1977
Chart 10. Effective Exchange Rate and the Terms of Trade
___ MERM-weighled exchange rate
FEDERAL REPUBLIC OF GERMANY
Terms of trade'
FRANCE
1 This chart considers four particular cases in which a sharp change in the effective exchange rate has occurred.2 Export price index divided by import price index, scaled by a trade-weighted average of the terms of trade for the United
Kingdom, France, the Federal Republic of Germany, Italy, and Japan.
34
©International Monetary Fund. Not for Redistribution

DEVELOPMENTS IN THE INTERNATIONAL MONETARY SYSTEM
In each of these cases, the terms of trade of the countryunder consideration relative to those of other industrialcountries were positively related to the movement in theexchange rate, and during the periods considered thechanges in the terms of trade appear to have persisted.Since the volume of trade does not seem to haveresponded rapidly to the exchange rate in these cases,this suggests that a change in the exchange rate mayhave had a perverse effect on the current account for aperiod of time.
For the exchange rate to have the desired impact onthe current account, it must be able, inter alia, to exerta sustained impact on relative costs. The high rates ofinflation that have characterized the 1970s, however,have caused economic agents to focus on wages andprices in real rather than in nominal terms, and havecontributed to the rapid spread of wage indexation. By1976 wage contracts in more than half of the industrialcountries in Europe were indexed to a considerabledegree, while a significant number of contracts in Can-ada and the United States included cost of living clauses.In some countries where there was no formal indexa-tion, wages nevertheless responded rapidly to price rises.These factors help to explain why many countries, andparticularly those with small open economies, nowaccept the vicious circle hypothesis, that exchange ratechanges lead to offsetting price and cost movements andfurther exchange rate adjustments, and why they believethat the benefits from exchange rate adjustments arelimited. The factors considered above cannot beignored, but their importance should not be exaggeratedeither. The evidence presented in Chart 8 and Chart 10,for example, indicates that at least for a period of time,and for the major countries considered here, exchangerate changes have had some impact on relative prices.
In practice, the issue behind the vicious circle argu-ment turns on the effectiveness of different policy instru-ments in bringing about changes in real wages that areessential for effective adjustment, while minimizing theharmful consequences for other objectives, such as rea-sonable price stability and full employment. A neededexchange rate adjustment will become associated witha vicious circle only if demand management policy issufficiently expansionary to permit it. The first step inpreventing the vicious circle is to institute adequaterestraint on the increase in nominal demand; suchrestraint should be coupled with efforts to minimize thefeedback from the exchange rate to wages and otherdomestic costs so as to hold down unemployment. Thismay be helped, for example, by an incomes policy, nego-tiated among the government, labor unions, and indus-try, governing price and wage developments. The effec-tiveness of exchange rate adjustments in the deficitcountries will also depend on the adoption of coopera-tive policies in the surplus countries. The latter must be
willing to maintain an adequate level of domesticdemand and to accept the appreciation of their effectiveexchange rates that results from the play of marketforces.
In short, both demand management and exchangerate policies have essential roles—distinct but interre-lated—to play in the successful functioning of the inter-national adjustment process. As experience clearlyshows, use of one without the other is apt to proveineffective.
Reserve Developments
The previous section has shown that, despite thegreater flexibility of exchange rates in recent years,there are still substantial payments imbalances, and themanner in which liquidity is provided to finance theseimbalances therefore remains a matter of central con-cern. Even among countries whose currencies are float-ing, management of rates in varying degrees is quitewidespread. In addition, many currencies are pegged toother individual currencies, to various baskets of cur-rencies, or to the SDR. As a result, countries have beenmaking considerable use of both credit and reserves todeal with payments imbalances.
To a considerable extent, the expansion of reservesand of balance of payments credit has been in the formof assets and liabilities in international capital markets,rather than being provided through the Fund or otherintergovernmental agencies. An important issue con-fronting the international community is the extent towhich an expansion of official sources of liquidity couldimprove the adjustment process, and, by strengtheningthe international monetary system, support a continua-tion of private lending. In this connection, a number ofissues concerning the volume and nature of the liquidityprovided by the Fund are currently under considerationby the Executive Board, including the Seventh QuotaReview, whether there should be an allocation of SDRs,the characteristics and uses of the SDR, and the plan putforward by the Managing Director for a temporary sup-plementary credit facility. These questions will be dis-cussed below in the section on the adequacy of reserves,but first a brief review will be given of recent reservedevelopments.
Two changes have occurred in recent years that raisequestions with respect to the meaning of comparisonsover time of the total value of international reserves.First, relative prices of the major reserve assets havebeen continuously changing by substantial margins overthe last few years. For example, from the end of 1970to the end of 1976, sterling depreciated against the U. S.dollar by almost 30 per cent, the U. S. dollar depre-ciated against the SDR (and against reserve positions in
35
©International Monetary Fund. Not for Redistribution

ANNUAL REPORT, 1977
the Fund whose value is maintained in terms of SDKs)by 14 per cent, and the market price of gold in terms ofU. S. dollars rose approximately fourfold. The purchas-ing power of a given collection of reserve assets there-fore depends on its composition. Second, there has beena sharp reduction in the use of gold. Under the presentArticles of Agreement gold transactions between mem-bers have to take place at the official price of SDR 35per ounce. Although some gold has been used as apledge for borrowing abroad, very few transactions haveoccurred since 1971. Furthermore, uncertainty aboutthe future course of the free market price, and alsoabout the effect on this price of the disposal of signifi-cant amounts of officially held gold over a short period,has inhibited governments from undertaking substantialsales in the private market. Thus, most countries' hold-ings of gold have remained approximately constantsince 1971.
For purposes of the compilation of reserve data in theStatistical Annex to this chapter, assets are valued atcurrent prices in terms of SDRs, except for gold, whichis valued at SDR 35 per fine ounce. The same conven-tion underlies Charts 11 and 12 and Table 10.
During the 1950s and 1960s, the main reserve assets
held by countries grew at moderate rates (Chart 11).Gold holdings rose from the early 1950s to 1965 by justover 1 per cent per annum; but they subsequentlydeclined until the volume in the mid-1970s was aboutequal to that observed in the mid-1950s. Foreignexchange holdings increased during the 1950s and1960s by about 4 per cent per annum, with substantialvariations from year to year. These variations dependedchiefly on the state of the balance of payments betweenthe United States and the rest of the world, and the will-ingness or desire of monetary authorities outside theUnited States to hold dollars. Reserve positions in theFund grew somewhat more rapidly during this period,on average by about 9 per cent per annum; variationsin this rate of change were caused by the uneven inci-dence over time in the demand for Fund credit.
Beginning in 1970, reserve assets other than goldincreased at a much faster pace. Foreign exchangereserves rose fivefold from the end of 1969 to the endof 1976 and "Fund-based reserve assets"—including inthis concept SDRs as well as reserve positions in theFund—increased fourfold. As already mentioned, thevolume of gold holdings declined slightly.
The rise in official holdings of foreign exchange and
Chart 11. Level and Composition of Reserves, End of Period, 1951-March 1977(In billions of SDRs)
36
©International Monetary Fund. Not for Redistribution

DEVELOPMENTS IN THE INTERNATIONAL MONETARY SYSTEM
Fund-related reserve assets in the 1970s occurred in twodistinct waves, separated by a pause in 1973. During thethree years 1970-72, foreign exchange reserves nearlytripled. Two thirds of the total increment of SDR 63billion took the form of an increase in official claims onthe United States, while the larger part of the remainderwas accounted for by the growth in identified officialholdings of Eurodollars. Following a year of slowergrowth in 1973, foreign exchange reserves expanded bysome 50 per cent in 1974-75, chiefly as a result of theaccumulation of foreign exchange assets by major oilexporting countries. Reserves of non-oil exportingcountries rose very little during these two years. Reservepositions in the Fund expanded rapidly, doubling fromthe end of 1973 to the end of 1975, This was a reflec-tion of the same forces that were responsible for therapid increase in foreign exchange reserves, namely, theimpact of the increase in the price of oil on countries'payments balances. The increase in reserve positionsin the Fund resulted from the rising need for Fundcredit by oil importing countries encountering paymentsdifficulties.
In 1976, the rapid rise in liquid reserves continued,with increases in both foreign exchange holdings and
reserve positions in the Fund. The latter increased bySDR 5 billion, to reach a level of SDR 17.7 billion,bringing the total of Fund-related assets to SDR 26.4billion. Foreign exchange holdings increased bySDR 23 billion (17 per cent), partly as a result of thesame influences that caused a rise of foreign exchangeholdings during the two preceding years but also partlybecause of a broadly based upward movement in theforeign exchange reserves of non-oil countries, bothindustrial and developing. This development was'facili-tated by the recovery in import demand in major indus-trial countries, and the decisions taken by many coun-tries to use a substantial part of the proceeds of theirborrowing to add to their reserves.
During the first five months of 1977, countries'reserves expanded by SDR 13.4 billion and thus con-tinued to rise at about the same pace as in 1976. Thebulk of the increase took the form of foreign exchangeholdings, but there was also a further expansion, bySDR 1.5 billion, of reserve positions in the Fund. Asmall rise in gold holdings, resulting chiefly from thesale of Fund gold to members at the official price, wasoffset by a decline in countries' holdings of SDRs. (SeeChapter 3.) All major country groups except the more
Chart 12. Level and Distribution of Reserves, End of Period, 1951-March 1977(In billions of SDRs)
37
©International Monetary Fund. Not for Redistribution
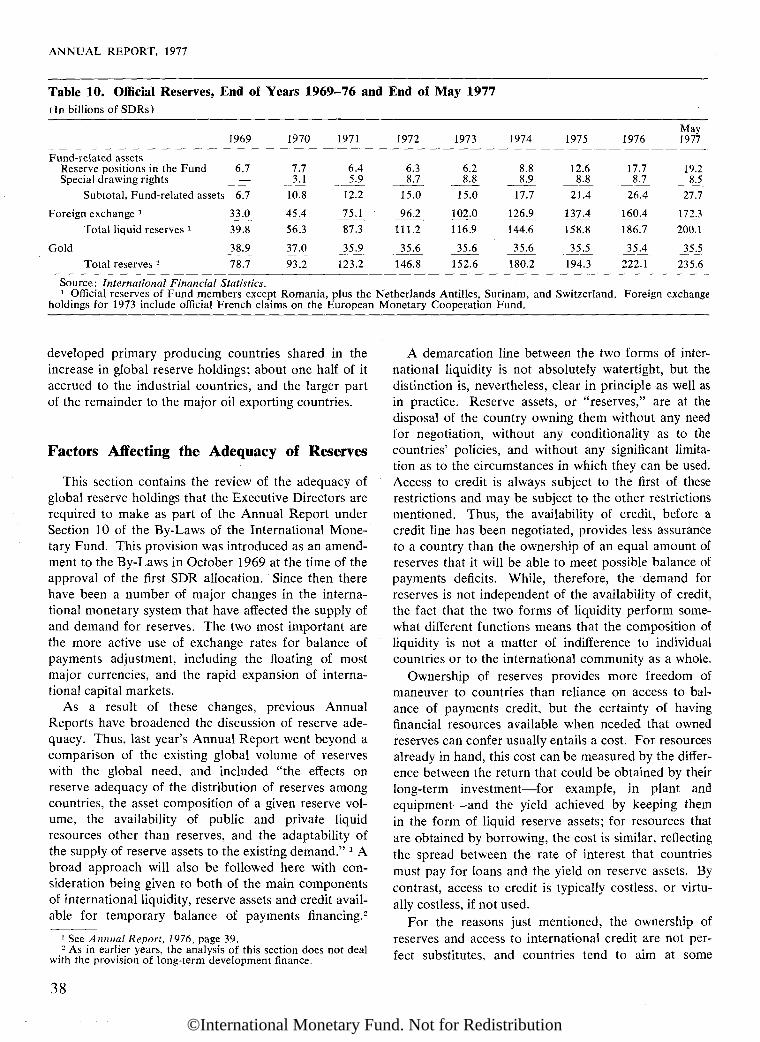
ANNUAL REPORT, 1977
Table 10. Official Reserves, End of Years 1969-76 and End of May 1977(In billions of SDKs)
Fund-related assetsReserve positions in the FundSpecial drawing rights
Subtotal, Fund-related assets
Foreign exchange 1
Total liquid reserves 1
Gold
Total reserves г
1969
6.7
6.7
33.0
39.8
38.9
78.7
1970
7.73.1
10.8
45.4
56.3
37.0
93.2
1971
6.45.9
12.2
75.187.3
35.9
123.2
1972
6.38.7
15.0
96.2
111.2
35.6
146.8
1973
6.28.8
15.0
102.0
116.9
35.6
152.6
1974
8.88.9
17.7
126.9
144.6
35.6
180.2
1975
12.68.8
21.4
137.4
158.8
35.5
194.3
1976
17.78.7
26.4
160.4186.7
35.4
222.1
May1977
19.28.5
27.7
172.3
200.1
35.5235.6
Source: International Financial Statistics.1 Official reserves of Fund members except Romania, plus the Netherlands Antilles, Surinam, and Switzerland. Foreign exchange
holdings for 1973 include official French claims on the European Monetary Cooperation Fund.
developed primary producing countries shared in theincrease in global reserve holdings; about one half of itaccrued to the industrial countries, and the larger partof the remainder to the major oil exporting countries.
Factors Affecting the Adequacy of Reserves
This section contains the review of the adequacy ofglobal reserve holdings that the Executive Directors arerequired to make as part of the Annual Report underSection 10 of the By-Laws of the International Mone-tary Fund. This provision was introduced as an amend-ment to the By-Laws in October 1969 at the time of theapproval of the first SDR allocation. Since then therehave been a number of major changes in the interna-tional monetary system that have affected the supply ofand demand for reserves. The two most important arethe more active use of exchange rates for balance ofpayments adjustment, including the floating of mostmajor currencies, and the rapid expansion of interna-tional capital markets.
As a result of these changes, previous AnnualReports have broadened the discussion of reserve ade-quacy. Thus, last year's Annual Report went beyond acomparison of the existing global volume of reserveswith the global need, and included "the effects onreserve adequacy of the distribution of reserves amongcountries, the asset composition of a given reserve vol-ume, the availability of public and private liquidresources other than reserves, and the adaptability ofthe supply of reserve assets to the existing demand." 1 Abroad approach will also be followed here with con-sideration being given to both of the main componentsof international liquidity, reserve assets and credit avail-able for temporary balance of payments financing.2
1 See Annual Report, 1976, page 39.2 As in earlier years, the analysis of this section does not deal
with the provision of long-term development finance.
A demarcation line between the two forms of inter-national liquidity is not absolutely watertight, but thedistinction is, nevertheless, clear in principle as well asin practice. Reserve assets, or "reserves," are at thedisposal of the country owning them without any needfor negotiation, without any conditionality as to thecountries' policies, and without any significant limita-tion as to the circumstances in which they can be used.Access to credit is always subject to the first of theserestrictions and may be subject to the other restrictionsmentioned. Thus, the availability of credit, before acredit line has been negotiated, provides less assuranceto a country than the ownership of an equal amount ofreserves that it will be able to meet possible balance ofpayments deficits. While, therefore, the demand forreserves is not independent of the availability of credit,the fact that the two forms of liquidity perform some-what different functions means that the composition ofliquidity is not a matter of indifference to individualcountries or to the international community as a whole.
Ownership of reserves provides more freedom ofmaneuver to countries than reliance on access to bal-ance of payments credit, but the certainty of havingfinancial resources available when needed that ownedreserves can confer usually entails a cost. For resourcesalready in hand, this cost can be measured by the differ-ence between the return that could be obtained by theirlong-term investment—for example, in plant andequipment—and the yield achieved by keeping themin the form of liquid reserve assets; for resources thatare obtained by borrowing, the cost is similar, reflectingthe spread between the rate of interest that countriesmust pay for loans and the yield on reserve assets. Bycontrast, access to credit is typically costless, or virtu-ally costless, if not used.
For the reasons just mentioned, the ownership ofreserves and access to international credit are not per-fect substitutes, and countries tend to aim at some
38
©International Monetary Fund. Not for Redistribution
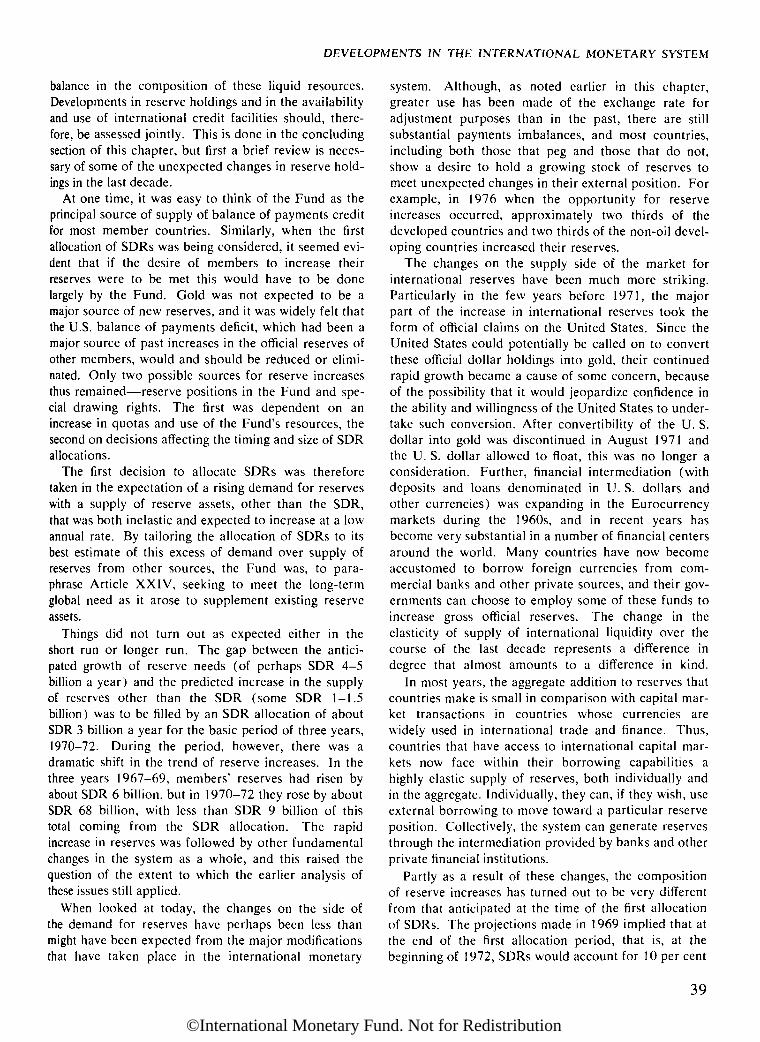
DEVELOPMENTS IN THE INTERNATIONAL MONETARY SYSTEM
balance in the composition of these liquid resources.Developments in reserve holdings and in the availabilityand use of international credit facilities should, there-fore, be assessed jointly. This is done in the concludingsection of this chapter, but first a brief review is neces-sary of some of the unexpected changes in reserve hold-ings in the last decade.
At one time, it was easy to think of the Fund as theprincipal source of supply of balance of payments creditfor most member countries. Similarly, when the firstallocation of SDKs was being considered, it seemed evi-dent that if the desire of members to increase theirreserves were to be met this would have to be donelargely by the Fund. Gold was not expected to be amajor source of new reserves, and it was widely felt thatthe U.S. balance of payments deficit, which had been amajor source of past increases in the official reserves ofother members, would and should be reduced or elimi-nated. Only two possible sources for reserve increasesthus remained—reserve positions in the Fund and spe-cial drawing rights. The first was dependent on anincrease in quotas and use of the Fund's resources, thesecond on decisions affecting the timing and size of SDRallocations.
The first decision to allocate SDRs was thereforetaken in the expectation of a rising demand for reserveswith a supply of reserve assets, other than the SDR,that was both inelastic and expected to increase at a lowannual rate. By tailoring the allocation of SDRs to itsbest estimate of this excess of demand over supply ofreserves from other sources, the Fund was, to para-phrase Article XXIV, seeking to meet the long-termglobal need as it arose to supplement existing reserveassets.
Things did not turn out as expected either in theshort run or longer run. The gap between the antici-pated growth of reserve needs (of perhaps SDR 4—5billion a year) and the predicted increase in the supplyof reserves other than the SDR (some SDR 1-1.5billion) was to be filled by an SDR allocation of aboutSDR 3 billion a year for the basic period of three years,1970-72. During the period, however, there was adramatic shift in the trend of reserve increases. In thethree years 1967-69, members' reserves had risen byabout SDR 6 billion, but in 1970-72 they rose by aboutSDR 68 billion, with less than SDR 9 billion of thistotal coming from the SDR allocation. The rapidincrease in reserves was followed by other fundamentalchanges in the system as a whole, and this raised thequestion of the extent to which the earlier analysis ofthese issues still applied.
When looked at today, the changes on the side ofthe demand for reserves have perhaps been less thanmight have been expected from the major modificationsthat have taken place in the international monetary
system. Although, as noted earlier in this chapter,greater use has been made of the exchange rate foradjustment purposes than in the past, there are stillsubstantial payments imbalances, and most countries,including both those that peg and those that do not,show a desire to hold a growing stock of reserves tomeet unexpected changes in their external position. Forexample, in 1976 when the opportunity for reserveincreases occurred, approximately two thirds of thedeveloped countries and two thirds of the non-oil devel-oping countries increased their reserves.
The changes on the supply side of the market forinternational reserves have been much more striking.Particularly in the few years before 1971, the majorpart of the increase in international reserves took theform of official claims on the United States. Since theUnited States could potentially be called on to convertthese official dollar holdings into gold, their continuedrapid growth became a cause of some concern, becauseof the possibility that it would jeopardize confidence inthe ability and willingness of the United States to under-take such conversion. After convertibility of the U. S.dollar into gold was discontinued in August 1971 andthe U. S. dollar allowed to float, this was no longer aconsideration. Further, financial intermediation (withdeposits and loans denominated in U. S. dollars andother currencies) was expanding in the Eurocurrencymarkets during the 1960s, and in recent years hasbecome very substantial in a number of financial centersaround the world. Many countries have now becomeaccustomed to borrow foreign currencies from com-mercial banks and other private sources, and their gov-ernments can choose to employ some of these funds toincrease gross official reserves. The change in theelasticity of supply of international liquidity over thecourse of the last decade represents a difference indegree that almost amounts to a difference in kind.
In most years, the aggregate addition to reserves thatcountries make is small in comparison with capital mar-ket transactions in countries whose currencies arewidely used in international trade and finance. Thus,countries that have access to international capital mar-kets now face within their borrowing capabilities ahighly elastic supply of reserves, both individually andin the aggregate. Individually, they can, if they wish, useexternal borrowing to move toward a particular reserveposition. Collectively, the system can generate reservesthrough the intermediation provided by banks and otherprivate financial institutions.
Partly as a result of these changes, the compositionof reserve increases has turned out to be very differentfrom that anticipated at the time of the first allocationof SDRs. The projections made in 1969 implied that atthe end of the first allocation period, that is, at thebeginning of 1972, SDRs would account for 10 per cent
39
©International Monetary Fund. Not for Redistribution
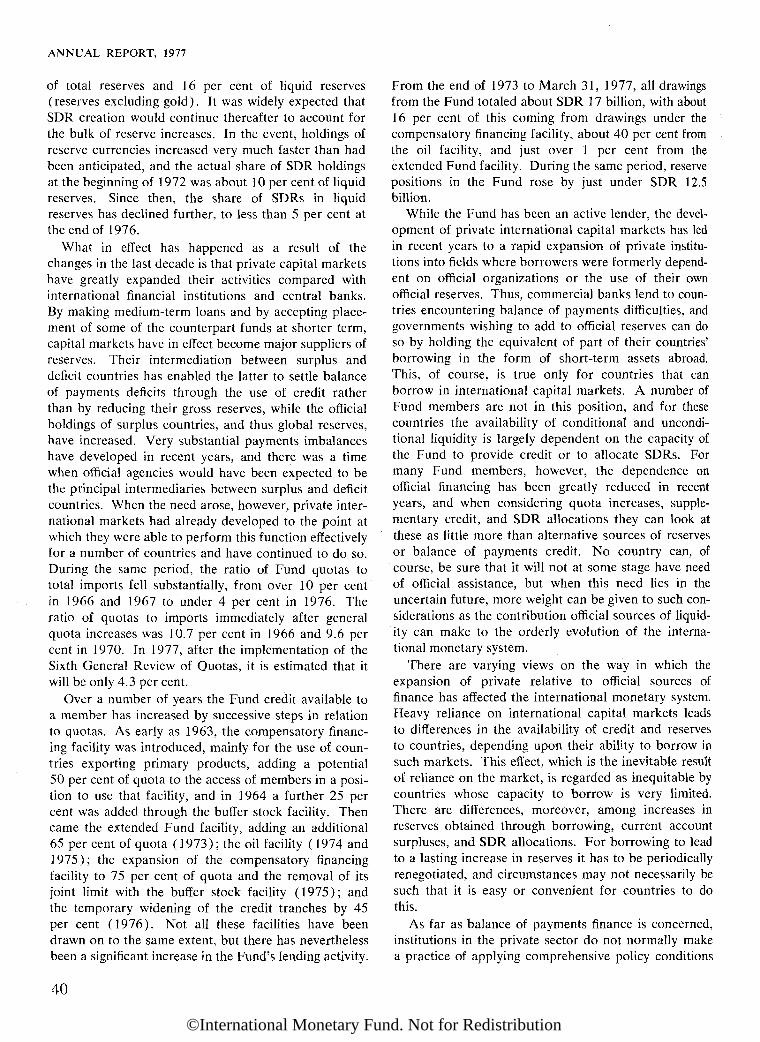
ANNUAL REPORT, 1977
of total reserves and 16 per cent of liquid reserves(reserves excluding gold). It was widely expected thatSDR creation would continue thereafter to account forthe bulk of reserve increases. In the event, holdings ofreserve currencies increased very much faster than hadbeen anticipated, and the actual share of SDR holdingsat the beginning of 1972 was about 10 per cent of liquidreserves. Since then, the share of SDRs in liquidreserves has declined further, to less than 5 per cent atthe end of 1976.
What in effect has happened as a result of thechanges in the last decade is that private capital marketshave greatly expanded their activities compared withinternational financial institutions and central banks.By making medium-term loans and by accepting place-ment of some of the counterpart funds at shorter term,capital markets have in effect become major suppliers ofreserves. Their intermediation between surplus anddeficit countries has enabled the latter to settle balanceof payments deficits through the use of credit ratherthan by reducing their gross reserves, while the officialholdings of surplus countries, and thus global reserves,have increased. Very substantial payments imbalanceshave developed in recent years, and there was a timewhen official agencies would have been expected to bethe principal intermediaries between surplus and deficitcountries. When the need arose, however, private inter-national markets had already developed to the point atwhich they were able to perform this function effectivelyfor a number of countries and have continued to do so.During the same period, the ratio of Fund quotas tototal imports fell substantially, from over 10 per centin 1966 and 1967 to under 4 per cent in 1976. Theratio of quotas to imports immediately after generalquota increases was 10.7 per cent in 1966 and 9.6 percent in 1970. In 1977, after the implementation of theSixth General Review of Quotas, it is estimated that itwill be only 4.3 per cent.
Over a number of years the Fund credit available toa member has increased by successive steps in relationto quotas. As early as 1963, the compensatory financ-ing facility was introduced, mainly for the use of coun-tries exporting primary products, adding a potential50 per cent of quota to the access of members in a posi-tion to use that facility, and in 1964 a further 25 percent was added through the buffer stock facility. Thencame the extended Fund facility, adding an additional65 per cent of quota (1973); the oil facility (1974 and1975); the expansion of the compensatory financingfacility to 75 per cent of quota and the removal of itsjoint limit with the buffer stock facility (1975); andthe temporary widening of the credit tranches by 45per cent (1976). Not all these facilities have beendrawn on to the same extent, but there has neverthelessbeen a significant increase in the Fund's lending activity.
From the end of 1973 to March 31, 1977, all drawingsfrom the Fund totaled about SDR 17 billion, with about16 per cent of this coming from drawings under thecompensatory financing facility, about 40 per cent fromthe oil facility, and just over 1 per cent from theextended Fund facility. During the same period, reservepositions in the Fund rose by just under SDR 12.5billion.
While the Fund has been an active lender, the devel-opment of private international capital markets has ledin recent years to a rapid expansion of private institu-tions into fields where borrowers were formerly depend-ent on official organizations or the use of their ownofficial reserves. Thus, commercial banks lend to coun-tries encountering balance of payments difficulties, andgovernments wishing to add to official reserves can doso by holding the equivalent of part of their countries'borrowing in the form of short-term assets abroad.This, of course, is true only for countries that canborrow in international capital markets. A number ofFund members are not in this position, and for thesecountries the availability of conditional and uncondi-tional liquidity is largely dependent on the capacity ofthe Fund to provide credit or to allocate SDRs. Formany Fund members, however, the dependence onofficial financing has been greatly reduced in recentyears, and when considering quota increases, supple-mentary credit, and SDR allocations they can look atthese as little more than alternative sources of reservesor balance of payments credit. No country can, ofcourse, be sure that it will not at some stage have needof official assistance, but when this need lies in theuncertain future, more weight can be given to such con-siderations as the contribution official sources of liquid-ity can make to the orderly evolution of the interna-tional monetary system.
There are varying views on the way in which theexpansion of private relative to official sources offinance has affected the international monetary system.Heavy reliance on international capital markets leadsto differences in the availability of credit and reservesto countries, depending upon their ability to borrow insuch markets. This effect, which is the inevitable resultof reliance on the market, is regarded as inequitable bycountries whose capacity to borrow is very limited.There are differences, moreover, among increases inreserves obtained through borrowing, current accountsurpluses, and SDR allocations. For borrowing to leadto a lasting increase in reserves it has to be periodicallyrenegotiated, and circumstances may not necessarily besuch that it is easy or convenient for countries to dothis.
As far as balance of payments finance is concerned,institutions in the private sector do not normally makea practice of applying comprehensive policy conditions
40
©International Monetary Fund. Not for Redistribution
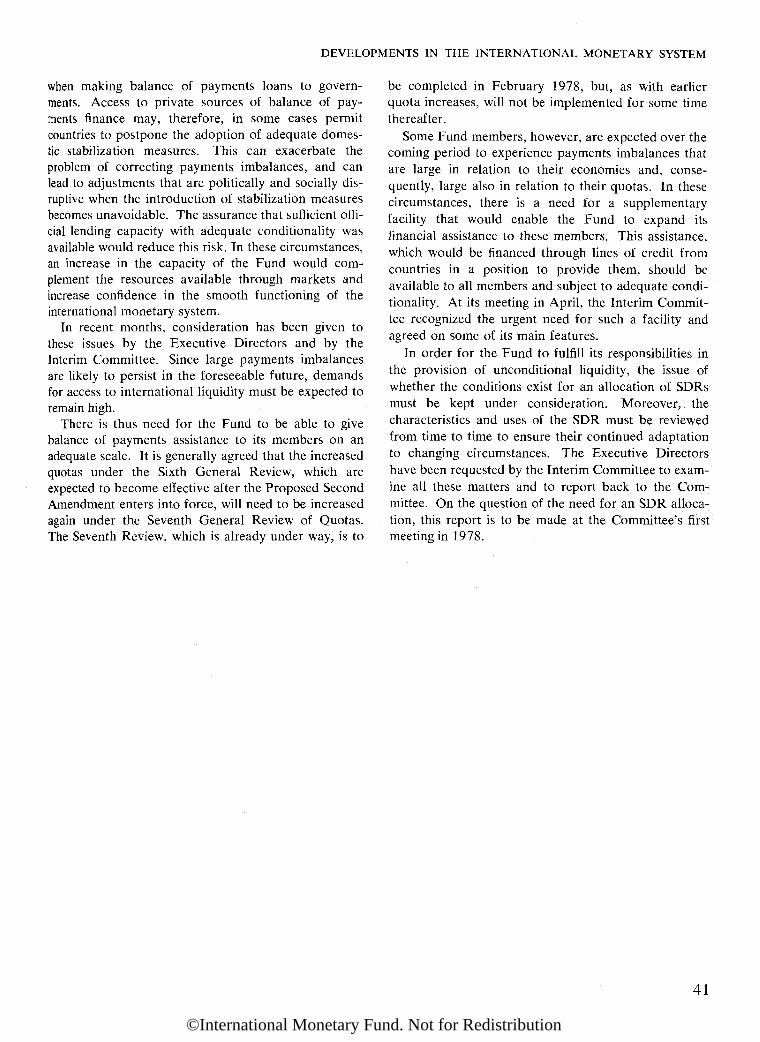
DEVELOPMENTS IN THE INTERNATIONAL MONETARY SYSTEM
when making balance of payments loans to govern-ments. Access to private sources of balance of pay-ments finance may, therefore, in some cases permitcountries to postpone the adoption of adequate domes-tic stabilization measures. This can exacerbate theproblem of correcting payments imbalances, and canlead to adjustments that are politically and socially dis-ruptive when the introduction of stabilization measuresbecomes unavoidable. The assurance that sufficient offi-cial lending capacity with adequate conditionality wasavailable would reduce this risk. In these circumstances,an increase in the capacity of the Fund would com-plement the resources available through markets andincrease confidence in the smooth functioning of theinternational monetary system.
In recent months, consideration has been given tothese issues by the Executive Directors and by theInterim Committee. Since large payments imbalancesare likely to persist in the foreseeable future, demandsfor access to international liquidity must be expected toremain high.
There is thus need for the Fund to be able to givebalance of payments assistance to its members on anadequate scale. It is generally agreed that the increasedquotas under the Sixth General Review, which areexpected to become effective after the Proposed SecondAmendment enters into force, will need to be increasedagain under the Seventh General Review of Quotas.The Seventh Review, which is already under way, is to
be completed in February 1978, but, as with earlierquota increases, will not be implemented for some timethereafter.
Some Fund members, however, are expected over thecoming period to experience payments imbalances thatare large in relation to their economies and, conse-quently, large also in relation to their quotas. In thesecircumstances, there is a need for a supplementaryfacility that would enable the Fund to expand itsfinancial assistance to these members. This assistance,which would be financed through lines of credit fromcountries in a position to provide them, should beavailable to all members and subject to adequate condi-tionality. At its meeting in April, the Interim Commit-tee recognized the urgent need for such a facility andagreed on some of its main features.
In order for the Fund to fulfill its responsibilities inthe provision of unconditional liquidity, the issue ofwhether the conditions exist for an allocation of SDKsmust be kept under consideration. Moreover, thecharacteristics and uses of the SDR must be reviewedfrom time to time to ensure their continued adaptationto changing circumstances. The Executive Directorshave been requested by the Interim Committee to exam-ine all these matters and to report back to the Com-mittee. On the question of the need for an SDR alloca-tion, this report is to be made at the Committee's firstmeeting in 1978.
41
©International Monetary Fund. Not for Redistribution

ANNUAL REPORT, 1977
Statistical Annex
Table 11. Distribution of Reserves, End of Years 1950, 1960, and 1970-76 г
(In billions of SDRs)
1950 1960 1970 1971 1972 1973 1974 1975 1976
Industrial countriesUnited StatesUnited Kingdom
Subtotal
AustriaBelgium-LuxembourgDenmarkFranceGermany, Federal Republic ofItalyNetherlandsNorwaySwedenSwitzerland
Subtotal, continental industrial Europe
CanadaJapan
Total, industrial countries
Primary producing countriesMore developed countries
Other European countries 3
Australia, New Zealand, South AfricaSubtotal, more developed primary
producing countries
Less developed countriesMajor oil exporting countries >Other less developed countries
Other Western Hemisphere »Other Middle East c
Other Asia 7
Other Africa s
Subtotal, other less developed countries
Subtotal, less developed countries 9
Total, primary producing countries
Total
24.34.8
29.1
0.80.10.80.20.70.50.10.31.6
5.2
1.80.6
36.8
1.52.0
3.5
1.3
2.41.13.70.5
7.79.5
13.0
49.7
19.45.1
24.5
0.71.50.32.37.03.31.90.30.52.3
20.1
2.01.9
48.5
2.31.3
3.6
2.3
2.20.72.70.96.6
9.0
12.6
61.2
14.52.8
17.3
1.82.80.55.0
13.65.43.20.80.85.1
39.0
4.74.8
65.8
5.63.0
8.5
5.0
4.51.75.82.0
13.9
18.9
27.493.2
12.18.1
20.3
2.23.20.77.6
17.26.33.51.11.06.4
49.1
5.314.1
88.8
8.04.2
12.1
7.8
4.52.06.31.7
14.5
22.3
34.4
123.2
12.15.2
17.3
2.53.60.89.2
21.95.64.41.21.57.0
57.7
5.616.9
97.5
11.77.6
19.4
10.0
7.52.77.81.9
19.9
29.9
49.3146.8
11.95.4
17.3
2.44.21.17.4
27.55.35.41.32.17.1
63.8
4.810.2
96.0
13.46.5
19.9
12.1
10.03.68.82.2
24.5
36.6
56.5
152.6
13.15.7
18.8
2.84.40.87.2
26.55.75.71.61.47.4
63.4
4.811.0
97.9
12.45.0
17.3
38.4
9.73.9
10.52.4
26.5
64.9
82.2
180.2
13.64.7
18.2
3.85.00.7
10.82
26.54.16.11.92.68.9
70.4
4.510.9
104.1
11.24.2
15.4
48.3
8.64.4
11.22.4
26.6
74.9
90.2
194.3
15.83.6
19.4
3.84.50.88.4 =
30.05.76.41.92.1
11.2
74.8
5.014.3
113.5
11.84.0
15.8
56.1
13.15.0
16.12.6
36.7
92.9
108.7222.1
Source: International Financial Statistics.1 Official reserves of Fund members except Romania, plus the Netherlands Antilles, Surinam, and Switzerland. In addition to the
holdings covered in IPS, the figures for 1973 include official French claims on the European Monetary Cooperation Fund; those for1950 and 1960 include amounts incorporated in published U.K. reserves in 1966 and 1967 from proceeds of liquidation of the U.K.official portfolio of dollar securities. Totals may not add to figures shown because of rounding and because some totals includeunpublished data for component areas.
" The value of the official French and Italian reserve stocks, as shown in this table, differs from that published in official nationalstatistics because, since January 1975 and December 1976, respectively, France and Italy have adopted systems of valuing gold basedon market prices.
3 Finland, Greece, Iceland, Ireland, Malta, Portugal, Spain, Turkey, and Yugoslavia.4 Algeria, Indonesia, Iran, Iraq, Kuwait, Libya, Nigeria, Saudi Arabia, Venezuela, and, beginning in 1966, Qatar, in 1970, Oman,
and in 1973, the United Arab Emirates.•> Argentina, Bolivia, Brazil, Central America, Chile, Colombia, the Dominican Republic, Ecuador, Guyana, Haiti, Jamaica,
Mexico, Panama, Paraguay, Peru, Surinam, Trinidad and Tobago, Uruguay, and, beginning in 1966, Barbados, and in 1968, theBahamas and the Netherlands Antilles.
c Cyprus, Egypt, Israel, Jordan, Lebanon, the Syrian Arab Republic, and, beginning in 1965, the People's Democratic Republic ofYemen and Bahrain, and in 1973, the Yemen Arab Republic.
7 Afghanistan, Burma, the Republic of China, Fiji, India, Korea, Lao People's Democratic Republic, Malaysia, Nepal, Pakistan,the Philippines, Singapore, Sri Lanka, Thailand, Viet Nam, Western Samoa, and, beginning in 1972, Bangladesh.
8 African Fund members other than Algeria, Libya, Nigeria, and South África.9 Includes' residual.
42
©International Monetary Fund. Not for Redistribution
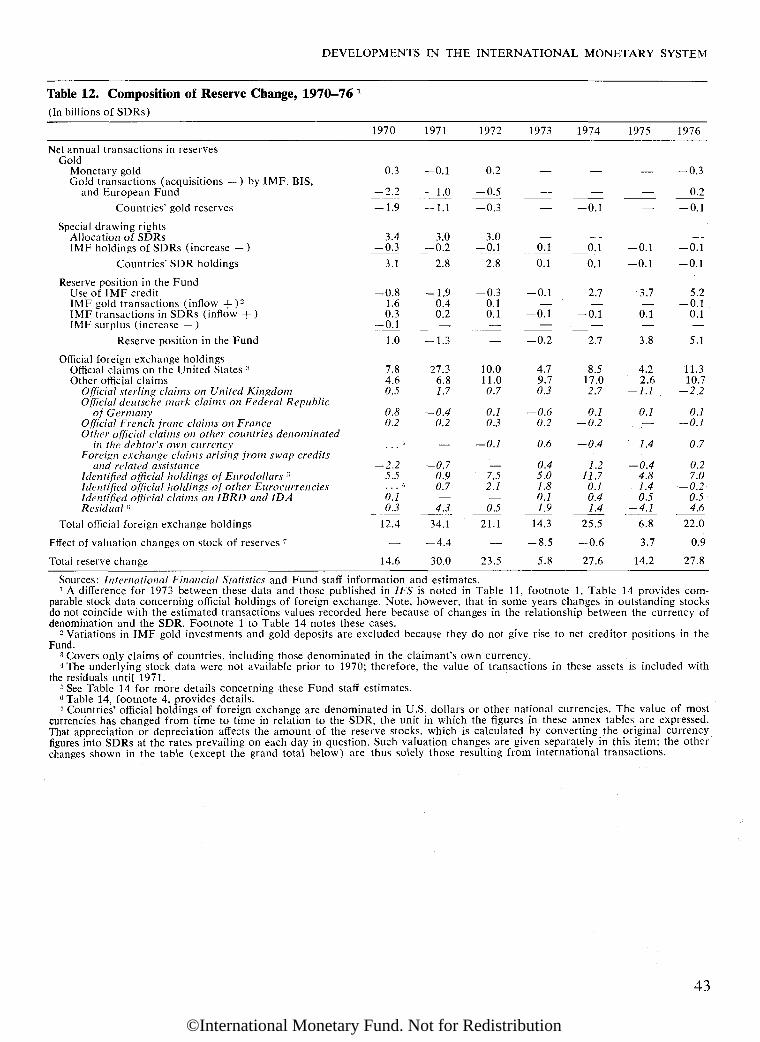
DEVELOPMENTS IN THE INTERNATIONAL MONETARY SYSTEM
Table 12. Composition of Reserve Change, 1970-76 г
(In billions of SDRs)
Net annual transactions in reservesGold
Monetary goldGold transactions (acquisitions — ) by IMF, BIS,
and European Fund
Countries' gold reserves
Special drawing rightsAllocation of SDRsIMF holdings of SDRs (increase — )
Countries' SDR holdings
Reserve position in the FundUse of IMF creditIMF gold transactions (inflow +)2
IMF transactions in SDRs (inflow +)IMF surplus (increase — )
Reserve position in the Fund
Official foreign exchange holdingsOfficial claims on the United States 3
Other official claimsOfficial sterling claims on United KingdomOfficial deutsche mark claims on Federal Republic
of GermanyOfficial French franc claims on FranceOther official claims on other countries denominated
in the debtor's own currencyForeign exchange claims arising from swap credits
and related assistanceIdentified official holdings of Eurodollars °Identified official holdings of other EurocurrenciesIdentified official claims on IBRD and IDAResidual K
Total official foreign exchange holdings
Effect of valuation changes on stock of reserves ~
Tola! reserve change
1970
0.3
— 2.2-1.9
3.4-0.3
3.1
-0.81.60.3
-0.1
1.0
7.84.60.5
0.80.2
•i
— 2.25.5
1
0.1-0.3
12.4
—
14.6
1971
-0.1
-1.0— 1.1
3.0-0.2
2.8
-1.90.40.2— ,
-1.3
27.36.81.7
-0.40.2
—
— 0.70.90.7—43
34.1
-4.4
30.0
1972
0.2
-0.5-0.3
3.0-0.1
2.8
-0.30.10.1—
—
10.011.0
0.7
0.10.3
— 0.1
—7.52.1—0.5
21.1
—
23.5
1973
—
—
—
—0.1
0.1
-0.1—-0.1—
-0.2
4.79.70.3
— 0.60.2
0.6
0.45.01.80.11.9
14.3
-8.5
5.8
1974
—
—
— 0.1
—0.1
0.1
2.7—
-0.1—
2.7
8.517.02.7
0.1— 0.2
-0.4
1.211.7
0.10.41A_
25.5
-0.6
27.6
1975
—
—
—
—-0.1
-0.1
3.7—0.1—
3.8
4.22.6
— 1.1
0.1—
1.4
-0.44.81.40.5
— 4.1
6.8
3.7
14.2
1976
-0.3
0.2-0.1
—-0.1
-0.1
5.2-0.1
0.1—
5.1
11.310.7
-2.2
0.1-0.1
0.7
0.27.0
-0.20.54.6
22.0
0.9
27.8
Sources: International Financial Statistics and Fund staff information and estimates.1 A difference for 1973 between these data and those published in IPS is noted in Table 11, footnote 1. Table 14 provides com-
parable stock data concerning official holdings of foreign exchange. Note, however, that in some years changes in outstanding stocksdo not coincide with the estimated transactions values recorded here because of changes in the relationship between the currency ofdenomination and the SDR. Footnote 1 to Table 14 notes these cases.
2 Variations in IMF gold investments and gold deposits are excluded because they do not give rise to net creditor positions in theFund.
3 Covers only claims of countries, including those denominated in the claimant's own currency.'The underlying stock data were not available prior to 1970; therefore, the value of transactions in these assets is included with
the residuals until 1971.5 See Table 14 for more details concerning these Fund staff estimates.0 Table 14, footnote 4, provides details.7 Countries' official holdings of foreign exchange are denominated in U.S. dollars or other national currencies. The value of most
currencies has changed from time to time in relation to the SDR, the unit in which the figures in these annex tables are expressed.That appreciation or depreciation affects the amount of the reserve stocks, which is calculated by converting the original currencyfigures into SDRs at the rates prevailing on each day in question. Such valuation changes are given separately in this item; the otherchanges shown in the table (except the grand total below) are thus solely those resulting from international transactions.
43
4
©International Monetary Fund. Not for Redistribution

ANNUAL REPORT, 1977
Table 13. Composition of Reserve Change by Area, 1976 1
(In billions of SDRs)
Net transactions in reservesGoldSDR holdingsReserve positions in FundOfficial foreign exchange holdings a
Official claims on United States 4
Official sterling claims on United KingdomIdentified official holdings of EurodollarsResidual holdings of foreign exchange 5
Effect of valuation changes on stock of reserves
Total reserve change
UnitedStates
0.11.90.2———
0.2e
2.2
Othercountries
——
2.24.43.1—
0.80.40.6
7.2
Primary Producing Countries
developedcountries
-0.2-0.1—0.50.3
-0.2-0.1
0.50.2
0.4
exportingcountries
0.1—1.16.61.4
-0.53.02.70.17.8
developedcountries 2
—-0.1-0.110.36.5
-1.53.32.00.1
10.2
Total
-0.1-0.1
5.122.011.3
-2.27.05.90.9
27.8
Sources: International Financial Statistics and Fund staff information and estimates.1 Table 12 provides more detailed information on the composition of changes in official reserves of all countries, including com-
parable data for earlier years.2 The transactions values of the components of foreign exchange shown for this group were derived as residuals and therefore
include any omissions, errors, and asymmetries included in the transactions values estimated for the other groups.3 Area details are based on data provided by those holders of these claims that report this information to the Fund.4 Covers only claims of countries, including those denominated in the claimant's own currency.5 More details of this residual are provided in Table 12." For explanation, see Table 12, footnote 7.
Table 14. Official Holdings of Foreign Exchange, by Type of Claim, End of Years, 1970-76 г
(In billions of SDRs)
1970 1971 1972 1973 1974 1975 1976
Official claims on United States -Official sterling claims on United KingdomOfficial deutsche mark claims on Fed. Rep. of GermanyOfficial French franc claims on FranceOther official claims on countries denominated in the
debtor's own currencyOfficial foreign exchange claims arising from swap credits
and related assistanceIdentified official holdings of Eurocurrencies
EurodollarsIndustrial countriesPrimary producing countries
More developed countriesLess developed countries
Western HemisphereMiddle EastAsiaAfrica
Memorandum item: Major oil exporting countriesTotal identified Eurodollars
Other EurocurrenciesTotal identified holdings of Eurocurrencies
Identified claims on IBRD and IDAResidual '
Total official holdings of foreign exchange
23.85.71.30.6
0.8
0.7
5.1
1.63.81.00.61.11.11.6
10.50.4
10.90.71.1
45.4
46.67.31.00.8
0.9
—
3.4
1.75.41.61.11.11.62.8
10.41.1
11.60.66.4
75.1
56.78.11.11.0
0.7
—
5.6
3.29.23.61.92.01.73.9
18.03.2
21.20.66.8
96.2
55.46.50.61.2
1.4
0.4
7.3
3.410.44.02.32.71.34.0
21.15.0
26.10.69.7
102.0
62.68.30.81.1
1.2
1.63
6.5
3.022.85.0
12.03.02.8
15.632.3
5.637.8
0.912.5
126.9
68.96.40.91.1
2.6
1.33
7.0
3.828.05.6
16.93.52.0
21.038.7
6.845.5
1.69.2
137.4
79.03.21.10.9
3.4
1.53
7.8
3.734.45.9
19.66.03.1
24.146.0
7.052.9
2.116.1
160.4
Sources: International Financial Statistics and Fund staff information and estimates.1 Includes the estimated change in the level of holdings owing to the general realignment of currencies in 1971, the U.S. dollar
devaluation in 1973, and the widespread floating of currencies since 1974.2 Covers only claims of countries, including those denominated in the claimant's own currency.3 Comprises the double deposit arrangement between the Deutsche Bundesbank and the Bank of Italy.1 Part of this residual occurs because some member countries do not classify all the foreign exchange claims that they report to
the Fund. It also includes asymmetries arising because data on U.S. and U.K. currency liabilities are more comprehensive than dataon official foreign exchange as shown in International Financial Statistics.
44
More Major oil Other lessIndustrial Countries
©International Monetary Fund. Not for Redistribution

Chapter 3Activities of the Fund
The principal developments during the period underreview were as follows :
• Progress by members in accepting the ProposedSecond Amendment of the Articles of Agreementand preparations in the Fund for implementingthem, including work on revising the Fund'sBy-Laws, Rules and Regulations, and generalpolicy decisions.
• Agreement on the principles for the guidance ofmembers with respect to their exchange ratepolicies and on procedures for Fund surveillanceover those policies.
• Work on the establishment of a supplementarycredit facility of a temporary nature that wouldenable the Fund to expand its financial assistanceto those of its members that in the next severalyears will face payments imbalances that are largein relation to their economies and quotas in theFund.
• Initiation of the Seventh General Review ofQuotas, which is to be completed in February1978.
• Consideration of the question whether a furtherallocation of SDRs would be advisable at thepresent time.
• A major review of the Fund's financial positionand changes in the rates of charges paid by mem-bers for the use of the Fund's resources.
• Provision for the third successive year of a highlevel of balance of payments assistance to mem-bers, with extensive drawings under both theFund's regular tranche policies and the compensa-tory financing facility.
• Enlargement of the General Arrangements toBorrow and activation of these arrangements inconnection with drawings under stand-by arrange-ments made by two industrial countries.
• Initiation of gold sales, both to the market throughauctions and for distribution to members.
• The initiation of operations by the Trust Fund,
with loans to 12 member countries during thefiscal year.
• The approval of stand-by arrangements for mem-bers for periods of more than one year.
As in the previous year, the work by the ExecutiveDirectors on major policy matters was guided by thediscussions and understandings reached in the meetingsof the Interim Committee of the Board of Governorson the International Monetary System (the InterimCommittee) and the Joint Ministerial Committee ofthe Boards of Governors of the Bank and the Fundon the Transfer of Real Resources to Developing Coun-tries (the Development Committee). During the pastfiscal year, both Committees held meetings in Manilain October 1976 and in Washington in April 1977.The communiqués and announcements issued afterthose meetings are reproduced in Appendix III.
Second Amendment of the Articles
On April 30, 1976 the Board of Governors adopteda Resolution approving the Second Amendment of theFund's Articles. The Second Amendment will becomeeffective when it has been accepted by three fifths ofthe members having four fifths of the total votingpower. At the end of July 1977, the Second Amend-ment had been accepted by 45 members having 51.46per cent of the total voting power.
By-Laws, Rules and Regulations, and GeneralDecisions
In order to conform the Fund's By-Laws, Rules andRegulations, and general decisions with the new Arti-cles, extensive revisions need to be made in theseprovisions. The Fund's staff and the Executive Direc-tors have devoted much time to this work and substan-tial progress has already been made. It is expectedthat all necessary provisions will have been adoptedby the Executive Directors, and, where required, by
45
©International Monetary Fund. Not for Redistribution
ANNUAL REPORT, 1977
the Board of Governors by the time the amendedArticles enter into force.
Surveillance over Exchange Rate PoliciesDuring the latter half of 1976 and the early part of
1977, the Executive Board worked intensively ondeveloping principles for the guidance of memberswith respect to their exchange rate policies and proce-dures for the Fund surveillance over those policies.This was in response to the provisions of Article IVof the amended Articles, which call for the Fund to"adopt specific principles for the guidance of members'exchange rate policies," and to exercise "firm sur-veillance" over these policies.1 As expected, negotiationof these principles and procedures was difficult andtime-consuming. After a series of meetings, however,during which varying positions were gradually recon-ciled, agreement was reached on a text without theneed to refer unsettled issues to the Interim Committee.This set of principles and procedures was endorsed bythe Interim Committee at its meeting in April 1977, andapproved by the Executive Board immediately followingthis meeting.2
The principles for the guidance of members' exchangerate policies are aimed at (a) avoiding manipulationof exchange rates or the international monetary systemin order to prevent effective balance of paymentsadjustment or to gain an unfair competitive advantageover other members, (b) countering disorderly short-term conditions in exchange markets, and (c) takinginto account, in intervention, the interests of othermembers.
Somewhat more detailed are the principles that areto guide the Fund in its function of exercising surveil-lance over exchange rate policies. The provisions inthis part of the decision indicate developments thatmight suggest the need for discussions between theFund and members, and give some guidance as to howthe Fund would set about its task of appraisal.
The text agreed by the Executive Board relates tothe procedures to be followed by the Fund in its dis-cussions with members on their exchange rate policies.Regular consultations are to take place under Arti-cle IV, and these will comprehend existing consultationsunder Articles VIII and XIV. In addition, proceduresare established for discussions between the ManagingDirector and members, and for subsequent review bythe Executive Board, of cases where the ManagingDirector considers that a member's exchange ratepolicies may not be in accord with the exchange rateprinciples.
1 Article IV, Section 3(6).2 Executive Board Decision No. 5392-(77/63), adopted
April 29, 1977 and reproduced in Appendix II.
The Sixth and Seventh General Reviews ofQuotas
As noted in the 1976 Annual Report, the Board ofGovernors approved, effective March 22, 1976, aResolution on Increases in Quotas of Members—SixthGeneral Review, under which the total of presentquotas, amounting to SDR 29.2 billion, will be raisedto SDR 39 billion, if all members consent to the fullquota increases proposed for them in the Resolution.The texts of the Resolution and the Report of theExecutive Directors on the Sixth General Review ofQuotas were reproduced in Appendix II of the 1976Report.3
The Board of Governors Resolution provided thatthe increase in a member's quota would not becomeeffective unless the member had consented to theincrease and had paid the quota in full and providedthat no increase in quota would become effective"before (i) the effective date of the second amendmentof the Articles or (ii) the date of the Fund's determina-tion that members having not less than three fourths ofthe total of quotas on February 19, 1976 have con-sented to increases in their quotas, whichever is thelater of these dates." As noted earlier in this chapter,the Proposed Second Amendment is in the process ofbeing accepted by member governments; by the endof July 1977, 26 members accounting for 42.04 percent of quotas on February 19, 1976 had consentedto increases in quotas.
The Board of Governors Resolution on Increases inQuotas of Members—Sixth General Review providedthat "the seventh general review of quotas shall becompleted by February 9, 1978." At its eighth meetingheld in Washington on April 28-29, 1977, the InterimCommittee considered the main issues relating to theSeventh General Review of Quotas, and agreed that,in view of the expansion of members' internationaltransactions and the need for the Fund to be able togive balance of payments assistance to members on alarger scale than would be available on the basis ofquotas under the Sixth General Review, there shouldbe an adequate increase in the total of quotas pursuantto the Seventh General Review. The Committee notedthat on the question of distribution of quotas, one viewwas that in order to conclude the Seventh Review atan early date, increases should be equiproportional tothe quotas that would result from the Sixth GeneralReview. Another view, however, was that a few specialadjustments should be made for those members whosequotas are seriously out of line with their relativepositions in the world economy, and that in this con-nection some emphasis should be placed on increases
'•'• Board of Governors Resolution No. 31-2. See AnnualReport, 1976, pages 107-11.
46
©International Monetary Fund. Not for Redistribution

ACTIVITIES OF THE FUND
that would strengthen the Fund's liquidity. The Com-mittee urged the Executive Directors to pursue theirwork and to prepare a report, together with draftrecommendations to the Board of Governors, on in-creases in the quotas of members under the SeventhGeneral Review for consideration by the Committeeat its next meeting.
The Executive Directors, following a preliminarydiscussion of the issue in their review of the adequacyof international liquidity, continued their discussion onthe Seventh General Review of Quotas in June 1977.
Supplementary Credit Facility
At its meeting in Washington on April 28-29, 1977,the Interim Committee reviewed the internationaladjustment process and, among its conclusions, agreedthat, given the persistence of large payments imbalances,substantial demands for the Fund's resources could beexpected.
The Committee found good grounds for believingthat expansion of the Fund's role as a financial inter-mediary could contribute significantly to promotion ofinternational adjustment and to maintenance of confi-dence in the continued expansion of the world economyand in the effective functioning of the internationalfinancial system. After reviewing developments in inter-national liquidity and in the financial activities andresources of the Fund, the Committee recognized thatthere was an urgent need for a supplementary facilityof a temporary nature that would enable the Fund toexpand its financial assistance to those of its membersthat in the next several years will face payments imbal-ances that are large in relation to their economies andquotas in the Fund.
The Committee set out the main features of thissupplementary facility as follows:
(a) The Fund would establish substantial lines ofcredit in order to be able to assist members to meettheir needs for supplementary assistance.
(b) Access to assistance under the supplementaryfacility should be available to all members and shouldbe subject to adequate conditionality, and such assist-ance should normally be provided on the basis of astand-by arrangement covering a period longer thanone year.
(c) The Fund should pay interest on amountsborrowed under the lines of credit at market-relatedinterest rates, and charges by the Fund for the useby members of resources borrowed by it under theselines of credit should be based on these rates. Thepossibility of a subsidy related to the rates of chargethat would be payable by low-income countries shouldbe explored.
(d) The claims of lenders under the supplementaryfacility should be appropriately liquid.
In welcoming the willingness of a number of coun-tries in a position to lend to the Fund to collaboratewith it on arrangements for supplementary credit, theCommittee urged the Managing Director to complete,as soon as possible, his discussions with potentiallenders on terms and conditions and amounts. Itfurther requested the Executive Directors to take thenecessary steps for making the supplementary facilityoperative as soon as possible.
Since this meeting of the Interim Committee, theExecutive Directors have given further considerationto these matters with a view to completing the termsand conditions for the establishment of such a supple-mentary facility at an early date.
Special Drawing Account
Overall activity in the Special Drawing Accountremained at a high level during 1976/77 with totaluse of special drawing rights (SDRs) by participantsamounting to SDR 1,241 million, compared with lastyear's record of SDR 1,285 million. Nearly two thirds,or SDR 805 million, of this total was accounted for bytransfers to the Fund's General Account mainly in pay-ment of charges on the use of the Fund's resources anda small amount in repurchases. Outflows from the Gen-eral Account, largely to promote reconstitution, fell toSDR 495 million, and as a consequence the GeneralAccount's holdings of SDRs increased to SDR 771million at the end of April 1977, compared withSDR 461 million on April 30, 1976.
Transfers of SDRs between participants in trans-actions with designation amounted to SDR 119 million,which was the lowest level since 1973/74. However,there was a marked increase to SDR 317 million (fromSDR 176 million) in transactions by agreement betweenparticipants. This increase reflected, in part, the prefer-ence of participants for obtaining SDRs for reconstitu-tion from other participants rather than from theGeneral Account following the Executive Board decisionin August 1976, which prescribed that participantscould engage in transactions by agreement for certainpurposes and be exempt from the requirement of need.4
These latter transactions, which include those that bringholdings closer to net cumulative allocations, aggregatedSDR 211 million by June 30, 1977.
Transfers of SDRs during the fiscal year resulted ina decline of SDR 132 million in the holdings of theindustrial countries and of SDR 178 million in the
4 Executive Board Decision No. 5185-(76/128) S, adoptedAugust 25, 1976 and reproduced in Appendix II.
47
©International Monetary Fund. Not for Redistribution

ANNUAL REPORT, 1977
total holdings of other developed and developing coun-tries. The distribution of holdings on April 30, 1977shows that the industrial countries have recorded a netreceipt of SDR 716 million over their net cumulativeallocations, while the nonindustrial countries made anet use of SDR 1,487 million. The balance of SDR 771million is accounted for by the holdings of the Fund'sGeneral Account.
Allocations of SDKs and the Basic PeriodNo allocation of SDRs was made during the fiscal
year. The total of SDRs in existence therefore remainsunchanged at SDR 9,314.8 million. The calendar year1977 is the last year of the second basic period thatbegan on January 1, 1973, and the Articles of Agree-ment require that the Managing Director must submitto the Board of Governors, not later than six monthsbefore the end of each basic period (i.e., by June 30,1977 in respect of the current period), a proposal withrespect to the allocation of special drawing rights inthe next basic period. If he ascertains that there isno proposal consistent with the Articles that has broadsupport among participants, he must report that to theBoard of Governors and to the Executive Directors.
The Interim Committee of the Board of Governorsannounced on April 29, 1977 that it had consideredthe question of whether a further allocation of SDRswould be advisable at the present time. The Committeenoted that the Executive Directors had been discussingthis question and agreed to request them to give furtherconsideration to all aspects of the matter and to reportto the Committee at its first meeting in 1978. TheCommittee also agreed to request the Executive Direc-tors to review the characteristics and uses of the SDRso as to promote the purposes of the Fund, includingthe objective of making the SDR the principal reserveasset in the international monetary system.
On June 29, 1977 the Managing Director, afterconsulting with the Executive Directors, reported tothe Board of Governors that there was no proposal fora new allocation that he considered to be consistentwith the provisions of the Articles that had broadsupport among participants.5
Transactions with DesignationThe use of SDRs in transactions with designation
continued to decline and reached the lowest level since1973/74. Seven participants used a total of SDR 119million in transactions with designation, compared witheight participants using SDR 292 million in this wayin 1975/76. This sharp decline reflected the low
holdings of many participants, the need to maintain orrestore SDR holdings to meet the rules of reconstitution,and the need to use SDRs for other purposes, particu-larly for the payment of charges to the General Account.More than two thirds of the total amount of designatedtransactions during the fiscal year was accounted forby one participant, Mexico, which used SDR 83 millionin two transactions. Eleven participants were designatedto provide currency in exchange for SDRs; over 80per cent of the total amount was provided by France,India, and the United States. Designated participantsprovided the equivalent of SDR 61 million in U.S.dollars and the equivalents of SDR 35 million in Frenchfrancs, SDR 21 million in pounds sterling, and SDR 2million in deutsche mark. Of the amounts providedin currencies other than U. S. dollars, a total equivalentto SDR 38 million was converted into U. S. dollars tomeet requests of participants using SDRs. Details ofthe designated transactions are shown in Table 15.
Table 15. Use and Receipt of SDRs in Transactionswith Designation, Fiscal Year Ended April 30, 1977(In thousands of SDRs)
Participant Use Receipt
ColombiaDominican RepublicFranceGambia, TheIndia
IndonesiaIranlamaicaKoreaMexico
NicaraguaSpainTrinidad and TobagoUnited StatesViet Nam
YugoslaviaZaïreZambia
Total
1,000—1,500—.—
4,500—
83,298
——
—19,000
8,0001,500
118,798
5,000—35,000—
20,298
2,0004,500
2,000—
1,0005,0001,500
40,500—
2,000— .—
118,798
5 The full text of the report by the Managing Director isreproduced in Appendix II.
Transactions by AgreementTransactions by agreement between participants
increased significantly, from SDR 176 million in1975/76 to SDR 317 million during the past fiscalyear. Of this total, SDR 164 million was used byBelgium and the Federal Republic of Germany in twotransactions in settlement of obligations arising fromforeign exchange market interventions under the Euro-pean common margins arrangement. The remainingamount of SDR 153 million was accounted for bytransfers of SDRs under an Executive Board decisionthat, as indicated earlier, permitted certain transactionsby agreement between participants without the require-
48
©International Monetary Fund. Not for Redistribution
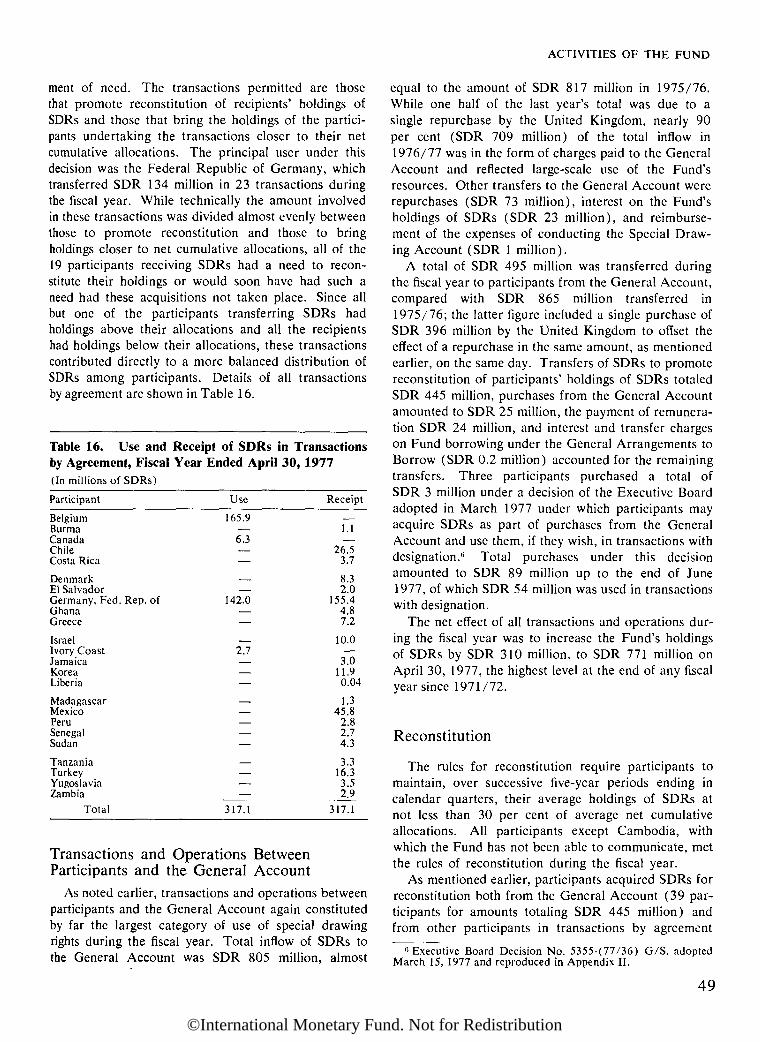
ACTIVITIES OF THE FUND
ment of need. The transactions permitted are thosethat promote reconstitution of recipients' holdings ofSDRs and those that bring the holdings of the partici-pants undertaking the transactions closer to their netcumulative allocations. The principal user under thisdecision was the Federal Republic of Germany, whichtransferred SDR 134 million in 23 transactions duringthe fiscal year. While technically the amount involvedin these transactions was divided almost evenly betweenthose to promote reconstitution and those to bringholdings closer to net cumulative allocations, all of the19 participants receiving SDRs had a need to recon-stitute their holdings or would soon have had such aneed had these acquisitions not taken place. Since allbut one of the participants transferring SDRs hadholdings above their allocations and all the recipientshad holdings below their allocations, these transactionscontributed directly to a more balanced distribution ofSDRs among participants. Details of all transactionsby agreement are shown in Table 16.
Table 16. Use and Receipt of SDRs in Transactionsby Agreement, Fiscal Year Ended April 30, 1977(In millions of SDRs)
Participant
BelgiumBurmaCanadaChileCosta Rica
DenmarkEl SalvadorGermany, Fed. Rep. ofGhanaGreece
IsraelIvory CoastJamaicaKoreaLiberia
MadagascarMexicoPeruSenegalSudan
TanzaniaTurkeyYugoslaviaZambia
Total
Use
165.9—6.3——
.
142.0——
2.7—
——
——
——
———
317.1
Receipt—1.1_ ,
26.53.7
8.32.0
155.44.87.2
10.0—3.0
11.90.04
1.345.8
2.82.74.3
3.316.33.52.9
317.1
Transactions and Operations BetweenParticipants and the General Account
As noted earlier, transactions and operations betweenparticipants and the General Account again constitutedby far the largest category of use of special drawingrights during the fiscal year. Total inflow of SDRs tothe General Account was SDR 805 million, almost
equal to the amount of SDR 817 million in 1975/76.While one half of the last year's total was due to asingle repurchase by the United Kingdom, nearly 90per cent (SDR 709 million) of the total inflow in1976/77 was in the form of charges paid to the GeneralAccount and reflected large-scale use of the Fund'sresources. Other transfers to the General Account wererepurchases (SDR 73 million), interest on the Fund'sholdings of SDRs (SDR 23 million), and reimburse-ment of the expenses of conducting the Special Draw-ing Account (SDR 1 million).
A total of SDR 495 million was transferred duringthe fiscal year to participants from the General Account,compared with SDR 865 million transferred in1975/76; the latter figure included a single purchase ofSDR 396 million by the United Kingdom to offset theeffect of a repurchase in the same amount, as mentionedearlier, on the same day. Transfers of SDRs to promotereconstitution of participants' holdings of SDRs totaledSDR 445 million, purchases from the General Accountamounted to SDR 25 million, the payment of remunera-tion SDR 24 million, and interest and transfer chargeson Fund borrowing under the General Arrangements toBorrow (SDR 0.2 million) accounted for the remainingtransfers. Three participants purchased a total ofSDR 3 million under a decision of the Executive Boardadopted in March 1977 under which participants mayacquire SDRs as part of purchases from the GeneralAccount and use them, if they wish, in transactions withdesignation.6 Total purchases under this decisionamounted to SDR 89 million up to the end of June1977, of which SDR 54 million was used in transactionswith designation.
The net effect of all transactions and operations dur-ing the fiscal year was to increase the Fund's holdingsof SDRs by SDR 310 million, to SDR 771 million onApril 30, 1977, the highest level at the end of any fiscalyear since 1971/72.
Reconstitution
The rules for reconstitution require participants tomaintain, over successive five-year periods ending incalendar quarters, their average holdings of SDRs atnot less than 30 per cent of average net cumulativeallocations. All participants except Cambodia, withwhich the Fund has not been able to communicate, metthe rules of reconstitution during the fiscal year.
As mentioned earlier, participants acquired SDRs forreconstitution both from the General Account (39 par-ticipants for amounts totaling SDR 445 million) andfrom other participants in transactions by agreement
K Executive Board Decision No. 53 55- (77/3 6) G/S, adoptedMarch 15, 1977 and reproduced in Appendix II.
49
©International Monetary Fund. Not for Redistribution

ANNUAL REPORT, 1977
Table 17. Acquisitions of SDRs for Reconstitution from the Fund's General Account,January 1, 1972-April 30, 1977(In millions of SDRs)
Jan. 1, 1972-Apr. 30, 1972
Against currencyacceptable toFund
In purchasesTotal
Num-ber of
Transac-tions
4
3
7
Amount
13.7
32.7
46.4
Fiscal Years Ended April 30
1973
Num-ber of
Transac-tions
34
9
43
Amount
71.5
35.7
107.2
1974
Num-ber of
Transac-tions
64
973
Amount
112.8
44.4
157.2
1975
Num-ber of
Transac-tions
70
5
75
Amount
95.6
21.5117.1
1976
Num-ber of
Transac-tions
88
997
Amount
293.0
111.2404.2
1977
Num-ber of
Transac-tions
93
10103
Amount
401.8
43.4
445.2
ToJan. 1,Apr. 3(
Num-ber of
Transac-tions
353
45398
tal
), 1977
Amount
988.4
288.9
1,277.3
(19 participants for amounts totaling SDR 153 million).Of the amounts acquired from the Fund, SDR 402million was acquired against currencies acceptable tothe Fund and SDR 43 million as part of members' pur-chases from the General Account. (See Table 17.)
The continued growth in the volume of transactionsfor the purpose of reconstitution is explained mainly bythe increased use of SDRs in transfers to the GeneralAccount, in particular for the payment of charges. Formany participants, the need to obtain SDRs for reconsti-tution arose at regular intervals following their use ofSDRs for payment of charges. To reduce the incon-venience of frequent acquisitions necessitated by pay-ment of charges or repurchases, the maximum amountof SDRs that a participant may acquire in any monthfor reconstitution was increased by a decision of theExecutive Board redefining the maximum amount toinclude the total amount of any charges paid to theGeneral Account and any repurchase obligations inSDRs to be discharged prior to the next monthly calcu-lations.7 Details of acquisitions of SDRs from the Gen-eral Account are shown in Table 17.
BIS as a Holder of SDRsAs in preceding years, during 1976/77 there were no
transactions in SDRs between the Bank for Inter-national Settlements (BIS) and participants. The Boardof Governors Resolution under which the BIS was pre-scribed as a holder of special drawing rights providedfor the Resolution to be reviewed at least once everythree years. Accordingly, the Executive Directors con-ducted a review of the Resolution in January 1977 andproposed no change.
Valuation of SDR, Its Interest Rate, and theRate of Remuneration
In June 1976, the Executive Directors completed areview of the valuation of the SDR, the rate at which
the Fund pays remuneration on super gold tranche posi-tions,8 and the rate of interest on the SDR. As a resultof the review, no change was made in the method ofvaluation of the SDR that was announced on June 13,1974. The change in Rule I-10 so as to make the rateof remuneration and the SDR interest rate more respon-sive to variations in market interest rates was describedin last year's Annual Report9 and is also dealt withbelow in relation to the rate of remuneration. The deci-sion on the rate of remuneration and the interest rate onthe SDR will have to be reviewed no later than threeyears after June 30, 1976.
Transactions and Operations in theGeneral Account
The large-scale expansion in use of the Fund'sresources, which began in 1974/75, continued for thethird consecutive year. Gross purchases amounted toSDR 4.9 billion in 1976/77, about 25 per cent belowthe level of the previous fiscal year, but the third highesttotal in the Fund's history. In 1976/77 a record volumeof purchases—45 per cent of the total—fell in the credittranches; the sharp decline in purchases under the oilfacility (which was terminated in May 1976) was partlycompensated for by a doubling of the amount of pur-chases under the Fund's compensatory financing facility,which had been liberalized in December 1975. Theevolving pattern in the use of the Fund's resources inrecent years is shown in Table 18 and Chart 13. As inprevious years, the volume of repurchases, at SDR 0.9billion, was relatively low, reflecting not only the modestuse of the Fund's resources in the period 1972-74 butalso the relatively large amount of repurchases that wasincurred under Article V, Section 7(b), as of April 30,
7 Executive Board Decision No. 5167-(76/120) G/S,adopted August 2, 1976 and reproduced in Appendix II.
s A member's super gold tranche is the extent to which theFund's holdings of that member's currency are below 75 percent of its quota.
9 See Annual Report, 1976, pages 49-50.
50
©International Monetary Fund. Not for Redistribution

ACTIVITIES OF THE FUND
Table 18. Flow of Transactions in the General Account and Resulting Stocks, Fiscal YearsEnded April 30, 1973-77(In millions of SDRs)
Fiscal Year Ended April 30
Type of Transaction
Total purchasesGold trancheCredit trancheBuffer stockCompensatory financingExtended facilityOil facility
Total repurchases
Gold sales for replenishmentIn connection with auctionsFor distribution
Outstanding borrowingsIn connection with oil facilityUnder the General Arrangements to BorrowFrom Swiss National Bank
Holdings of the General AccountUsable currencies 2
SDRsGold
1973
1,175641323
5206——
540
——
———
5,200617
5,370
1974
1,058607239—
212——
672
——
———
7,500499
5,370
1975
5,102981
1,604—18
2,499
518
——
2,499——
10,100510
5,370
1976
6,5911,324
4615
8288
3,966
960
——
6,465——
7,200461
5,370
1977
4,910161
2,370
1,753 1
190437
868
411201210
6,702911
89
4,500771
4,9591 In addition, credit tranche purchases equivalent to SDR 39-56 million in the fiscal year ended April 30, 1976 were reclassified
as having been made under the compensatory financing decision.2 A currency is considered to be usable by the Fund in its regular transactions when the member issuing the currency is judged
to have a sufficiently strong balance of payments and reserve position and has made arrangements with the Fund for such use.The holdings of usable currencies are those currencies included in the currency budget as of April 30, adjusted for working balancesand further adjusted if a member was in a debtor position at the time.
1976 and that would normally have been discharged in1976/77 but was delayed until May 1977. On April 30,1977, the amount of purchases subject to repurchaseamounted to SDR 16 billion—the equivalent of 55 percent of present quotas.
The unprecedented increase in use of the Fund'sresources in the past three years has had an importantfinancial impact on the Fund and on members. As onemeans of financing the increase in demand, the Fundhas almost doubled the number of currencies it uses inits transactions, thereby spreading the financing of Fundtransactions more widely among its membership. Tothe same end, the Fund has borrowed during the pastthree years over SDR 8 billion from 18 members andSwitzerland. Indeed, during 1976/77, 93 members(71 per cent of the total membership) engaged in trans-actions with the Fund, with 55 members using theFund's resources while currencies of 38 members wereused from holdings or were borrowed for the financingof transactions.10
As in the previous two fiscal years, the reduction inthe Fund's liquidity continued during 1976/77. Thevolume of usable currencies fell by about one third, toabout SDR 4.5 billion at the end of the fiscal year,despite the additions to the Fund's list of currencies for
sale and the replenishment of the Fund's holdings ofusable currencies by sales of gold, amounting to theequivalent of SDR 411 million in connection with itsgold sales program. The Fund's holdings of SDRs
Chart 13. Use of Fund's Resources as at April 30,1968-77(In billions of SDRs)
"Ecuadoran sucres were sold by the Fund before Ecuadorpurchased its gold tranche.
51
©International Monetary Fund. Not for Redistribution
ANNUAL REPORT, 1977
increased sharply, owing mainly to the increased amountof charges paid to the General Account. During theyear the Fund borrowed a further SDR 1,437 million,of which SDR 437 million was under the oil facility andthe balance under the General Arrangements to Borrowand from the Swiss National Bank. The relatively lowlevel of usable currencies held by the Fund is alsopartly explained by the fact that the quota increasesapproved under the Sixth General Review of Quotashave not yet come into effect while at the same time thecredit tranches have been enlarged until the date of theSecond Amendment of the Articles, in accordance withthe agreement reached by the Interim Committee at itsmeeting in Jamaica in January 1976.11
Taking into account the volume of loan claims out-standing, which represent Fund borrowing under the oilfacility and under the General Arrangements to Bor-row, members' reserve positions in the Fund amountedto SDR 18.5 billion on April 30, 1977 and accountedfor almost 9 per cent of members' official externalreserves as of that date, compared with 4 per cent threeyears earlier.
Gold Tranche PurchasesPurchases in the gold tranche declined markedly dur-
ing the fiscal year ended April 30, 1977, reflecting inpart the ending of purchases under the oil facility, whichrequired prior use by members of the gold tranche.During the fiscal year, of the 10 members that madegold tranche drawings, 7 subsequently made use of Fundcredit. The Federal Republic of Germany made pur-chases totaling the equivalent of SDR 8.34 million inconnection with the settlement of liabilities under theEuropean common margins arrangement. Bahrain andthe Syrian Arab Republic also made gold tranche pur-chases during the year but did not make further use ofthe Fund's resources.
Credit Tranche Purchases and Stand-ByArrangements
During the fiscal year, drawings in the credit tranchestotaled the equivalent of SDR 2.37 billion, the largestamount ever drawn in the credit tranches in any oneyear. Of this total, 4 members made credit tranchepurchases not under stand-by arrangements totalingSDR 160 million, about the same amount as last year.
Of the SDR 2.2 billion of purchases made understand-by arrangements during the year, all but SDR 500million was accounted for by two drawings by theUnited Kingdom, the first for SDR 700 million in May1976 and the second for SDR 1 billion in January 1977.A further 12 members drew the remainder, of whichthe largest drawings were by Argentina (SDR 159.5
11 See Annual Report, 1976, page 103.
million), South Africa (SDR 89 million), and Zaïre(SDR 40.96 million). In the preceding fiscal year, onlySDR 304 million had been purchased under stand-byarrangements.
The amount of purchases under stand-by arrange-ments in a fiscal year may not be closely related to theamounts approved under stand-by arrangements, sincethe period of the stand-by arrangement may not coin-cide with the fiscal year and new arrangements mayspan one or more fiscal years. In 1976/77 the Fundapproved 19 stand-by arrangements totaling the equiva-lent of SDR 4.68 billion, the largest amount everapproved in any one fiscal year. About 80 per cent ofthis total (SDR 3,810 million), represented stand-byarrangements for two industrial countries—the UnitedKingdom (for SDR 3.36 billion) and Italy (forSDR 0.45 billion). With one exception, South Africa,the remaining stand-by arrangements were for develop-ing countries.
The arrangements for the United Kingdom and Italyapproved purchases which would, if the arrangementswere fully utilized, raise Fund holdings of these mem-bers' currencies to 245 per cent of quota, which is inaccordance with the decision to enlarge the size of eachcredit tranche.12 Both stand-by arrangements wereapproved for a period in excess of 12 months; thearrangement for the United Kingdom, approved inJanuary 1977, was for two years, and that for Italy,approved in April 1977, for 20 months ending onDecember 31, 1978.
The remaining stand-by arrangements approved dur-ing the fiscal year were for 12-month periods, exceptfor one of 10 months and one of б months; ten arrange-ments provided for drawings in the enlarged first credittranche; five arrangements approved drawings in theenlarged second credit tranche; and two arrangementsapproved drawings in the enlarged third and fourthcredit tranches.
As can be seen from Table 18, total credit tranchedrawings have accounted for only 27 per cent of totaluse of the Fund's resources since the rapid expansionin Fund activity from the beginning of the year1974/75. Of this total, 16.3 per cent (SDR 2.7 billion)has been accounted for by drawings by two industrialcountries (Italy and the United Kingdom), 3.3 per centby the more developed primary producing countries,and the remainder by the developing countries. Therelatively large-scale use of the Fund's resources by thedeveloping countries has been concentrated mainly inthe oil facility and under the liberalized compensatoryfinancing facility. The pattern of drawings made undervarious facilities during 1976/77 is shown in Appen-dix I, Table 1.6.
12 See Annual Report, 1976, pages 50 and 51.
52
©International Monetary Fund. Not for Redistribution
ACTIVITIES OF THE FUND
Purchases Under the CompensatoryFinancing Facility
Members' use of the compensatory financing facilityîfor 1976/77 doubled from the previous year, toSDR 1,753 million. At the end of April 1977, total
' purchases outstanding under the facility reached an; unprecedented high of SDR 2,666 million, comparedwith SDR 1,208 million at the end of the previous year.The rapid expansion in use of the facility during theyear was not only a reflection of the adverse impact oncommodity prices of the widespread recession in eco-nomic activity, particularly in the industrial countries,but also of the liberalization of the facility, whichincreased a country's maximum entitlement in terms ofquota, eliminated the upper forecasting limit, and per-mitted export shortfall data to be estimated for up tosix months of the shortfall year.13
Since the amendment of the facility in December1975 through the fiscal year ended April 30, 1977,purchases totaled SDR 2,360 million, representing 53purchases by 47 members. During 1976/77, 35 mem-bers made use of the facility in 39 transactions.
The largest purchase, for the equivalent of SDR 332.5million, was made by Australia. Five members madepurchases in the range of SDR 90-185 million—Egypt(SDR 94 million), Malaysia (SDR 93 million), Mexico(SDR 185 million), New Zealand (SDR 99.5 million),and South Africa (SDR 160 million). At the end ofApril 1977 outstanding purchases by three members—Jamaica, New Zealand, and Zambia—amounted to 75per cent of their quotas, which is the maximum amountthat may be outstanding under this facility. Reclassifica-tion of purchases within 18 months after the date of theoriginal purchase was approved for three members thathad made purchases in the credit tranches.
The decision adopted in December 1975 required theFund to review the provisions of the compensatoryfinancing facility not later than March 1977, and whendrawings under the facility had reached certain quan-titative limits. After a review of the facility in May1976,14 the Executive Directors decided that no changein the provisions was necessary. The Executive Direc-tors again reviewed the facility in March 1977 in viewof the continued large volume of purchases, which hadreached a total of SDR 2.35 billion at the end of Janu-ary 1977. The Executive Board again decided that nochange in the provisions was necessary and agreed toreview the facility again before March 31, 1979, ifdrawings under it exceed SDR 1.5 billion in any12-month period or if outstanding purchases exceeded
13 These changes in the compensatory financing decisionwere described in detail in Annual Report, 1976, pages 52-53.
14 See Annual Report, 1976, page 53.
SDR 4 billion. Commodity prices improved during thecalendar year 1976, and following the relatively heavyuse of the facility by some countries in that period,purchases under the facility fell to SDR 120 million inthe first 6 months of 1977, against purchases amount-ing to SDR 953 million in the corresponding periodof 1976.
Extended Fund Facility
Only three members have entered into extendedarrangements with the Fund since the extended facilitywas established in September 1974. In October 1976,the Fund approved a three-year extended arrangementfor Mexico, effective January 1, 1977, for SDR 518million, the maximum amount (140 per cent of quota)permitted under the facility. This arrangement, togetherwith a purchase in the extended first credit tranche(SDR 134 million), was in support of an economicprogram for the short term and medium term intendedto bring about an improvement in real economic growthand to reduce inflationary pressures. In February 1977,Mexico purchased the equivalent of SDR 100 millionunder the arrangement. The only other purchase underthe extended facility during 1976/77 was made by thePhilippines in September 1976, for the equivalent ofSDR 90 million, in connection with its three-yeararrangement for SDR 217 million. After the initialpurchase of SDR 7.7 million in August 1975, Kenyamade no further purchases under its arrangement forSDR 67.2 million, approved in July 1975, in view ofthe marked improvement in its balance of paymentsand reserve position. The comparatively small use madeso far of the extended Fund facility reflects the relativelyshort period of time that has elapsed since the facilitywas established and the fact that members have beenable to meet a substantial part of their needs for balanceof payments financing from the Fund's other facilities,in particular, the oil facility and the compensatoryfinancing facility.
Buffer Stock FacilityOn July 1, 1976, the Fifth International Tin Agree-
ment providing for the operation of an international tinbuffer stock provisionally entered into effect for a periodof five years. It replaced the Fourth International TinAgreement, which expired on June 30, 1976.
On the basis of their examination, Executive Direc-tors concluded that the terms of the Fifth Agreementwere consistent with the requirements considered appro-priate to international commodity agreements for whichthe Fund's financial assistance may be requested. OnJune 23, 1976, the Executive Directors decided thatthe Fund would meet members' requests for financial
53
©International Monetary Fund. Not for Redistribution

ANNUAL REPORT, 1977
assistance up to the full amount of their compulsorycontributions to the buffer stock to be established underthe new Agreement.15
In view of the improvement of the world price fortin, the manager of the tin buffer stock made no callson participants other than in respect of their initialcompulsory contributions, so that there was no needfor financial assistance from the Fund under this facility.
On April 23, 1973, the Executive Board permittedpurchases under the buffer stock facility in connectionwith members' loans to the International Cocoa Coun-cil, provided that the use of the Fund's resources wassolely for the purpose of the acquisition by the Councilof cocoa stocks, other than stocks involved in diversionto nontraditional uses. In view of the high market pricefor cocoa during the past year, no use has been made sofar of this facility.
Oil FacilityAs noted in last year's Annual Report, the oil facility
was terminated in March 1976;16 final purchases weremade under the facility in the first half of May 1976by 15 members for the equivalent of SDR 437 million.These purchases were financed by borrowings from 7lenders, thereby utilizing the remaining amounts avail-able under the borrowing agreements made in connec-tion with financing transactions under the oil facility.17
Over half of the amount was purchased by 3 countries:SDR 115 million by Finland, SDR 91 million by Tur-key, and SDR 56 million by Yugoslavia. The remainingSDR 174 million was purchased by 12 developingcountries. Total borrowings made in connection withthe oil facility amounted to SDR 6.9 billion.
RepurchasesThe volume of repurchases effected during the fiscal
year 1976/77 was SDR 868 million, almost SDR 100million less than in the previous year. The decline inrepurchases reflected the low level of purchases in1973/74, which had been the lowest in a decade, andalso the fact that members' balance of payments andreserve positions had not improved sufficiently to inducemembers to make advance repurchases on any con-siderable scale. A contributory factor to the low levelof total repurchases was an administrative delay in thedischarge of obligations incurred under Article V, Sec-tion l(b), that lasted until after the end of the fiscalyear. The delay was caused by a change in the Fund's
practices regarding the order in which holdings of cur-rency acquired by the Fund as a result of members'purchases may be reduced. If these delayed repurchaseobligations had been discharged within the fiscal year,the total of repurchases would have risen to overSDR 1.1 billion.
Slightly less than one third of the total of repurchasesmade during the year (SDR 232 million) was repur-chased in accordance with schedules of repurchaseapproved by the Fund that provided in each case forrepurchase within five years from the date of purchase.A total of SDR 199 million was paid in discharge ofobligations incurred under Article V, Section 7(b), ofthe Fund Agreement,18 of which SDR 127 million andSDR 38 million related to obligations incurred as ofApril 30, 1974 and April 30, 1975, respectively. Theremainder (SDR 34 million) was in discharge of obliga-tions incurred as of April 30, 1976. (See Appendix I,Table 1.7.)
The Executive Board agreed to the requests of sevenmembers to schedule their repurchases totaling SDR 286million over periods of up to five years from the dateof purchase.
Three members made repurchases in advance of thelatest date on which these were due. India repurchasedSDR 230 million (26 per cent of the total), of whichSDR 30 million was with respect to a drawing in thefirst credit tranche that it had made in 1974 and thebalance was in respect of India's 1974 oil facility pur-chase. The Fund repaid an equivalent amount to Iran,Saudi Arabia, and Venezuela in respect of loans thathad been used to finance the purchases by India. SouthAfrica repurchased the equivalent of SDR 75 millionwith respect to a purchase under its then currentstand-by arrangement and thereby augmented its draw-ing rights under the arrangement; this repurchase hadthe effect of discharging pro tanto a repurchase obliga-tion incurred under Article V, Section 7(b). Malaysiarepurchased the equivalent of SDR 85.7 million withrespect to its compensatory financing purchase madein 1976.
The Executive Board agreed that four members—Chile, Korea, the Philippines, and Uruguay—couldpostpone the discharge of repurchase obligationsincurred in gold under Article V, Section 7( f t ) . Thesepurchases, which totaled SDR 11 million, were subject
"Executive Board Decision No. 5127-(76/191), adoptedJune 23, 1976 and reproduced in Appendix II.
16 See Annual Report, 1974, pages 52-53; Annual Report,1975, pages 53-54; and Annual Report, 1976, pages 53-54.
17 See Annual Report, 1976, Appendix I, Table 1.16, page 91.
18 Article V, Section 7(¿), provides that, subject to certainlimitations, a member shall repurchase an amount of theFund's holdings of its currency equivalent to one half of anyincrease in the Fund's holdings of its currency that has oc-curred during the Fund's financial year, plus one half of anyincrease, or minus one half of any decrease, in the member'smonetary reserves during the same period, or, if the Fund'sholdings of the member's currency have decreased, one halfof any increase in the member's monetary reserves minus onehalf of the decrease in the Fund's holdings of the member'scurrency.
54
©International Monetary Fund. Not for Redistribution

ACTIVITIES OF THE FUND
to review not later than December 31, 1977, andbrought to SDR 35 million the amount of obligationsincurred in gold that has been postponed since the fiscalyear ended on April 30, 1973. In connection with thesepostponements, payments in SDRs have been made bymembers in amounts equal to their obligations payablein gold.
As noted earlier, the Executive Board endorsed achange in the Fund's practices regarding the attributionof reductions in the Fund's holdings of a member's cur-rency resulting from the discharge of repurchase obliga-tions under Article V, Section l(b), and from sales bythe Fund. Hitherto, reductions resulting from the dis-charge of a repurchase obligation that could not beidentified as being in respect of a particular purchaseand reductions resulting from sales of a member's cur-rency were attributed to the member's purchase carryingthe earliest maturing repurchase commitment. How-ever, if a member made a repurchase in advance of thedate on which its Article V, Section 7(b), repurchaseobligation was established, it was free to attribute theresulting reduction in the Fund's holdings of its currencyto any purchase that it desired. To put all members onan equal footing, and also to take into account mem-bers' desires to execute a choice of the repurchases thatthey might wish to discharge because of the introductionof new facilities for a member's use of the Fund'sresources, which have different periods of use and ratesof charge, the Executive Directors agreed to allow amember to specify the purchase to which it wishes toattribute the reduction in the Fund's holdings of itscurrency resulting from the discharge of an Article V,Section 7(¿>), repurchase obligation or a sale of themember's currency by the Fund.19 If a member's attri-bution of a repurchase is in respect of purchases forwhich the Fund has borrowed and the attribution isdifferent from the original practices then the Fund is toconsult with the lenders to accept the new attribution;otherwise, repayment is to be made in accordance withthe original schedule. If there has been recourse to theGeneral Arrangements to Borrow, the matter is to bebrought back for decision at the Executive Board.
Use of Currencies in Fund Transactions
During the past fiscal year, significant progress wasmade by the Fund in extending the list of usable curren-cies, thereby adding to the Fund's potential liquidity.On April 30, 1977, a total of 101 members had com-pleted arrangements for the use of their currencies inFund transactions when their balance of payments andreserve positions are considered sufficiently strong.
19 See Appendix II, Section K, Attribution of RepurchasesUnder Article V, Section 7(fc) , for the text of the change inpractices of attribution.
Consequently, the Fund was able to increase the numberof currencies in the currency budget during the year.Among the currencies of members in a creditor positionincluded for the first time in the currency budget werethe Colombian peso, Guatemalan quetzal, Luxembourgfranc, Nigerian naira, Paraguayan guaraní, Saudi Ara-bian riyal, and Yemen rial. The Fund also included inthe currency budget some currencies of members in adebtor position, i.e., currencies of which the Fund'sholdings were in excess of 75 per cent of the member'squota. A sale of currency held above that level wouldreduce the member's indebtedness to the Fund; someof the currencies of members in a debtor positionincluded in the currency budget for the first time werethe Cyprus pound, Salvadoran colón, Nicaraguan cór-doba, Papua New Guinea kina, Upper Volta CFAfranc, and Uruguayan new peso.
Notwithstanding the additional currencies that theFund was able to use in sales to members and thereplenishment of its usable currency holdings throughsales of gold for distribution and in connection with goldauctions, the continued heavy use of the Fund'sresources resulted in a further net reduction in its hold-ings of usable currencies. Furthermore, some currenciesthat had previously been included in the currency budgetwere excluded during the year because of a weakeningof these members' reserves and balance of paymentspositions.
On April 30, 1977, the aggregate amount of usablecurrencies was about SDR 4.5 billion, compared withSDR 7.2 billion at the end of the previous fiscal yearand about SDR 10 billion on April 30, 1975. Aboutthree fifths of the decline (SDR 1,521 million) wasaccounted for by a decrease in the Fund's holdings ofU. S. dollars. Nevertheless, the Fund's holdings of U. S.dollars still represented almost 60 per cent of the Fund'sholdings of usable currencies on April 30, 1977. Inaddition, six creditor members' currencies aggregatedSDR 1.9 billion, or 37 per cent of total holdings ofusable currencies. Thus, the Fund's holdings of sevencreditor members' currencies totaled about 90 per centof the currencies available for use at the end of the fiscalyear. Holdings of other usable currencies were low inabsolute amounts and their use was limited by the needto preserve a minimum working balance for the possiblepayment of remuneration.
Over the years, relatively few currencies have madeup the bulk of the Fund's holdings of usable currencies.The recent introduction into the currency budget ofadditional currencies has not substantially altered theposition because the Fund's holdings of these currenciesare not large in relation to those members' reserves. Asa result, the Fund has continued to give relatively moreweight to its absolute holdings of currencies in allocatingamounts for sales rather than of allocating amounts
55
©International Monetary Fund. Not for Redistribution

ANNUAL REPORT, 1977
Table 19. Changes in Members' Super Gold Tranche Positions/ Fiscal Years Ended April 30, 1975-77 "(In millions of SDRs)
Change
Member
AustraliaAustriaBahrainBelgiumBrazil
CanadaColombiaDenmarkEcuadorFinland
FranceGermany, Fed. Rep. ofGuatemalaIndonesiaIran
IraqIrelandJapanKuwaitLuxembourg
MalaysiaMaltaMexicoNetherlandsNigeria
NorwayQatarSaudi ArabiaSouth AfricaSweden
Trinidad and TobagoUnited Arab EmiratesUnited StatesUpper VoltaVenezuela
Total
April 30, 1975
6.471.34.0
358.96.3
28.1——4.0
16.3
78.81,001.5
—5.0—. ,
11.6334.120.6
—7.3—5.3
191.7
—17.58.08.75.29.7
4.071.3
—86.82,365.5
April 30, 1976
0.5122.6
7.0372.0
16.3
44.1—- — .5.0—
345.41,140.9
. ————
13.7514.7
37.4—
7.33.85.3
253.7—
44.310.121.5
—34.4
11.1565.1
—161.93,741.2
April 30, 1977
174.72.2
443.756.6
278.516.88.4——
452.21,093.2
3.6—
20.1
1.037.4
817.839.13.9
9.7—
364.71.5
86.410.037.3
— .90.1
1.79.1
2,049.81.0
216.26,332.3
1975/76
-5.9+51.3+ 3.0
+ 13.1+ 10.0
+ 16.0——+ 1.0
-16.3
+ 266.6+ 139.4
—-5.0• —
+ 2.1+ 180.6+ 16.8
—
+ 3.8
—+ 62.0—
+26.8+2.1
+ 12.8— 5.2
+ 24.7. .
+ 7.1+ 493.8
. —+ 75.1
+ 1,375.7
1976/77
-0.5+ 52.1-4.8
+71.7+40.3
+ 234.4+ 16.8+ 8.4-5.0
—
+ 106.8-47.7+ 3.6
+ 20.1
+ 1.0+23.7
+ 303.1+ 1.7+ 3.9
-7.3+ 5.9-5.3
+ 111.0+ 1.5
+42.1-0.1
+ 15.8—
+55.7
+ 1.7-2.0
+ 1,484.7+ 1.0
+ 54.3+ 2,591.1
1 A member's super gold tranche is the extent to which the Fund's holdings of that member's currency are below 75 per cent ofits quota.
2 This table excludes changes of less than SDR 1 million; as a result, amounts do not add to totals shown.
broadly in proportion to a member's official holdings ofgold and foreign exchange. In general, the Fund allo-cated the amount of currencies to be used in repurchasesbroadly in proportion to a member's reserve position inthe Fund (excluding loan claims), while allocations ofamounts of these currencies to be used in purchaseswere made on a net basis (i.e., after taking into accountrepurchases) in proportion to the Fund's holdings ofcurrencies.
The increase in the number of usable currencies andthe further expansion in the use of the Fund's resourcesled to a greater dispersion and absolute increase inmembers' net creditor positions in the Fund. Table 19shows the changes in these positions since April 30,1975. Excluding borrowings by the Fund, the increasein members' net creditor positions amounted to SDR 2.6billion, double the increase in the preceding fiscal year,reaching SDR 6.3 billion at the end of April 1977, or
nearly triple the amount of net creditor positions out-standing on April 30, 1975.
The decision adopted in August 1976 that enabledparticipants to obtain SDRs from other participants incertain categories of transactions by agreement, ratherthan from the General Account,20 had the effects ofdecreasing the inflow of usable currencies and increasingthe Fund's holdings of SDRs. For example, during theperiod August 1976-April 1977 a total of SDR 153million was obtained in transactions by agreement, mostof which might otherwise have been acquired from theGeneral Account with currencies acceptable to theFund. Further, there was an increase in the GeneralAccount's receipts of SDRs by way of charges paid bymembers that had no need to reconstitute their SDRholdings. As a result of these factors, the holdings of
20 Executive Board Decision No. 5185-(76/128) S, adoptedAugust 25, 1976 and reproduced in Appendix II.
56
©International Monetary Fund. Not for Redistribution

ACTIVITIES OF THE FUND
SDRs by the General Account increased over the fiscalyear by SDR 310.3 million, to SDR 771.1 million.Since further increases in the Fund's holdings of SDRswere anticipated, and in order to conserve the Fund'sholdings of usable currencies, the Executive Directorsdecided in March 1977 21 to include SDRs in the cur-rency budget for sale to members drawing on the Fund.Members obtaining SDRs in this way may hold theSDRs so acquired or use them to acquire currency in atransaction with designation.
Borrowing, Interest, and Repayments by theGeneral Account
Since the end of fiscal year 1973/74, the Fund hasborrowed the equivalent of SDR 8.3 billion, and hasarranged for the financing of a further SDR 1.8 billionin purchases by Italy and the United Kingdom underthe General Arrangements to Borrow and two borrow-ing agreements with the Swiss National Bank. Theamount of borrowing effected since May 1974 is nearly48 per cent of total purchases made during the sameperiod. Of the total, the equivalent of SDR 6.9 billionwas borrowed in connection with financing transactionsunder the oil facility and the remainder, amounting toSDR 1.4 billion, was borrowed under the GeneralArrangements to Borrow in connection with the pur-chases made by the United Kingdom in January andMay 1977 and by Italy in May 1977.
Borrowing for the Oil Facility
As noted in previous Annual Reports, the Fund con-cluded borrowing agreements in 1974, 1975, and 1976with 16 members and Switzerland for a total ofSDR 6,902.5 million to finance transactions under theoil facility. Of this amount, a total of SDR 2,582.8million was borrowed for purchases under the facilityfor 1974 and SDR 4,319.6 million for purchases underthe facility for 1975. Purchases were made for a totalof SDR 2,499.3 million in 1974/75, SDR 3,966.2million in 1975/76, and SDR 436.9 million in May1976, thereby exhausting the total available for borrow-ing.
Loans to the Fund by the creditor members aredenominated in SDRs, with interest payable quarterlyon these loans at a rate of 7 per cent per annum onamounts borrowed for the oil facility for 1974 and arate of 7У4 per cent per annum on the amounts bor-rowed for the oil facility for 1975. The total amount ofinterest paid on oil facility loans in 1976/77 amountedto SDR 474 million, of which SDR 449 million waspaid in U. S. dollars, and the balance, equivalent to
"Executive Board Decision No. 5355-(77/36) G/S,adopted March 15, 1977 and reproduced in Appendix II.
SDR 24.3 million, was paid in four lenders' own cur-rencies.
Repayments of loans made in connection with theoil facility shall be made in eight semiannual install-ments starting three years, and to be completed not laterthan seven years, after the date of transfer of funds,except for loans borrowed from Canada and theDeutsche Bundesbank, which have to be repaid withinfive years after the date of transfer. There are also anumber of circumstances under which the Fund mayrepay in advance of the scheduled repayments. OnApril 30, 1977, the Fund had made advanced repay-ments totaling the equivalent of SDR 200.3 million toOman, Saudi Arabia, Iran, and Venezuela. Theserepayments were made in connection with repurchasesmade by Fiji and India with respect to purchases theyhad made under the 1974 oil facility. In the first twomonths of 1977/78, the Fund repaid a further total ofSDR 85 million to 7 lenders as a result of repurchasesof oil facility purchases made by 5 members. OnJune 30, 1977, the amount of oil facility loans totaledSDR 6,617 million.
General Arrangements to Borrow
As reported in the Annual Report, 1976, the GeneralArrangements to Borrow (GAB), which were estab-lished in 1962, were renewed for a further five yearsfrom October 24, 1975. The Swiss Confederation,which became associated with the GAB in June 1964,also extended its association for the same period of time.The amount of Switzerland's financial assistance toGAB participants is Sw F 865 million (about SDR 300million).
To strengthen the Fund's liquidity, the ExecutiveBoard decided in November 1976, and the ten partici-pants in the GAB formally agreed, to an increase in theamount of Japan's credit arrangement from ¥ 90billion (approximately SDR 265 million) to ¥ 340billion (approximately SDR 1 billion), thereby raisingthe total size of the GAB to approximately SDR 6.2billion. The increase in Japan's credit arrangement isthe first change in any of the amounts of the creditarrangement since the GAB came into effect.
In view of the low level of the Fund's holdings ofusable currencies in 1976 and an anticipated continuedlarge volume of purchases in the months to come, theExecutive Directors decided to finance purchases underthe stand-by arrangements for the United Kingdom andItaly largely through borrowings under the GAB(SDR 2,897.5 million) and under bilateral borrowingsfrom the Swiss National Bank (SDR 337.5 million). Itwas also decided that the balance of the purchasesunder the stand-by arrangements would be financed outof the Fund's own holdings of usable currencies,. How-
57
©International Monetary Fund. Not for Redistribution
ANNUAL REPORT, 1977
ever, the arrangements for the financing of purchasesduring the second year of the stand-by arrangementswill be reviewed in the light of the Fund's liquidity atthe time and of the balance of payments and reserveposition of each participant in the GAB. As a resultof the reviews, the Managing Director may proposealternative arrangements for the financing of furtherpurchases under the stand-by arrangements.
In connection with these transactions, the Fund calledon eight participants to provide in their own currenciesa total equivalent to SDR 1,285 million on threeseparate occasions in January and May 1977 for thepurchases by the United Kingdom and in May 1977 forthe purchase by Italy. Appendix I, Table 1.13 lists theten participants of the GAB, the amount of individualcredit arrangements, and the amounts called as ofJune 30, 1977. No use was made of the amounts avail-able to GAB participants under the association agree-ment with Switzerland.
The rate of interest on the amounts borrowed, includ-ing the transfer charge of 0.5 per cent of the amountborrowed, is the same as that received by the Fund incharges, including the service charge of 0.5 per cent onthe amount purchased, except that the minimum rateof interest should be 4 per cent per annum.
Borrowing from the Swiss National BankDuring the year 1976/77, the Fund also arranged
two loans from the Swiss National Bank in connectionwith financing the purchases by the United Kingdomand Italy, mentioned above. The Fund arranged toborrow, in U. S. dollars, the equivalent of SDR 300million to finance purchases made by the United King-dom and SDR 37.5 million to finance purchases madeby Italy. The provisions of these two loans are similarto the provisions of the GAB, and calls are made onthem at the same time and for amounts that are thesame proportion as the purchase bears to the total of thestand-by arrangement. By June 30, 1977, the Fundhad made calls in connection with these two loansamounting to the equivalent of SDR 125.4 million.
Gold SalesDuring the year the Fund sold, at the official price
of SDR 35 an ounce, 11.73 million fine ounces of gold,equivalent to SDR 411 million, for replenishment of itsholdings of usable currencies. This was the first yearin a four-year period in which it is planned to sell goldtotaling 50 million ounces, half of which is to be soldfor distribution to countries that were members onAugust 31, 1975, and the remainder is to be sold for thebenefit of developing countries.22 About 5.73 millionfine ounces of gold were sold to the market in eight auc-
22 See Annual Report, 1976, pages 54-56.
tions held during the fiscal year on behalf of the TrustFund (and 1.1 million ounces in auctions held in Mayand June 1977), and nearly 6.0 million fine ounces weresold for the purpose of distribution to member countriesin January and February 1977.
(i) Gold Auctions. As noted in last year's AnnualReport, early in May 1976 the Executive Directorsadopted a gold sales program for the first two years ofthe four-year period in which one sixth of the Fund'sgold is to be auctioned. During the two years beginningin June 1976, 12V2 million ounces of gold were to besold in public auctions. The Executive Directors origi-nally decided that these auctions should be conductedat intervals of approximately six weeks and with thesame quantity of gold offered in each auction. Afterthe first six auctions and following a review by theExecutive Directors in November/December 1976 ofthe policies and procedures in the light of the experiencegained, it was decided that for the ensuing periodthrough August 1977 auctions should be held on amonthly basis. Accordingly, the last two auctions inthe fiscal year were held on this basis in March andApril 1977.
Apart from the timing of auctions and the conse-quential adjustments of the amount that it was decidedshould be offered at each sale as a result of theNovember/December review of the gold sales program,the terms and conditions of the auctions remainedessentially unchanged over the year. Modificationswere, however, made in the pricing method, the mini-mum accepted bid, the place of delivery, and the periodallowed for payment.
Regarding the prices that successful bidders haveto pay for gold awarded to them, two systems havebeen employed—the common price and the bid price.After completion of the review of the gold sales programin December 1976, it was announced that the pricingmethod would be expected to remain unchanged for aseries of three successive auctions. In four auctionsthe common price system was employed,23 in whichall bidders pay the same (or common) price; this wasthe highest price bid at which the amount of gold onoffer was sold. In the other auctions held during theyear the bid price method was used, under which eachbidder pays the price actually bid for the gold awardedto him.24
The minimum bid was lowered from 2,000 ounces(five standard bars) in the first auction to 1,200 ounces(three standard bars) in later sales to facilitate partici-
23 In June, July, and December 1976, and in January 1977(and also in June, July, and August 1977).
24 In September and October 1976, and in March and April1977 (and May 1977).
58
©International Monetary Fund. Not for Redistribution

ACTIVITIES OF THE FUND
pation in the auctions and to widen the circle of poten-tial participants. Regarding the place of delivery, it isintended to deliver gold from the Fund's depositoriesroughly in proportion to the distribution of the Fund'sholdings of gold among them. Accordingly, gold wasdelivered in New York in seven of the eight auctionsheld during the year, and in London in one auction;in the following three sales, delivery was made onceeach in New York, Paris, and London.
Participation in the gold auctions was substantial,and the amount of gold bid in each auction far ex-ceeded the amount offered. Oversubscription wasparticularly large in the first five auctions, when bidswere submitted up to 5У2 times the amount of goldon offer. In 1977, bidding declined somewhat andstabilized around 2 to 2У2 times the amount offered.(See Table 20.) Similarly, the number of bids initiallyincreased, but then declined in subsequent sales. The
fall reflected, however, primarily a decline in bids thatwere substantially below prevailing market prices. Inthe April 1977 auction, for example, only 36 per centof the bids were below the average London fixing priceon the day of the auction, compared with 55 per centin the December 1976 auction and 99 per cent in theJune 1976 auction. During the first four auctions, theaverage price realized remained below the currentmarket price while in the last four auctions in the fiscalyear and the May 1977 auction, average proceedsremained above the current market price. In the June1977 auction, the average price realized was againslightly below the market price.
As explained in the last Annual Report, the TrustFund acquires the gold that it sells in auctions frommember countries to which the Fund has sold gold inorder to replenish its holdings of their currencies. Thesesales are made on the understanding that the member
Table 20. Selected Data on Gold Auctions on Behalf of the Trust Fund, June 2, 1976-June 1, 1977
1976
Pricing method
Total bids (thousand ounces)Awards (thousand ounces)
Price range of successful bids(in U.S. dollars)
Average price of successful bidsAverage realized priceCut-off price
Number of bidsNumber of biddersNumber of successful bidsNumber of successful bidders
Place of delivery
Profits (million U.S. dollars)
June 2
Commonprice
2,320.0780.0
126.00-134.00
126.98126.00126.00
220305920
NewYork
67.1
July 14
Commonprice
2,114.0780.0
122.05-126.60
123.02122.05122.05
196235617
NewYork
64.0
Sept. 15
Bidprice
3,662.4780.0
108.76-114.00
109.40109.40108.76
380234114
NewYork
53.8
Oct. 26
Bidprice
4,214.4779.2
116.80-119.05
117.71117.71116.80
383243716
NewYork
60.3
Dec. 8
Commonprice
4,307.2780.0
137.00-150.00
137.89137.00137.00
265253313
London
75.4
Pricing method
Total bids (thousand ounces)Awards (thousand ounces)
Price range of successful bids(in U.S. dollars)
Average price of successful bidsAverage realized priceCut-off price
Number of bidsNumber of biddersNumber of successful bidsNumber of successful bidders
Place of delivery
Profits (million U.S. dollars')
Jan. 26
Commonprice
2,003.2780.0
133.26-142.00
134.43133.26133.26
192214915
NewYork
72.5
March 2
Bidprice
1,632.8524.4
145.55-148.00
146.51146.51145.55
18721147
NewYork
55.6
1977
April 6
Bidprice
1,278.0524.8
148.55-151.00
149.18149.18148.55
136182211
NewYork
57.0
May 4
Bidprice
1,316.4524.8
147.33-150.26
148.02148.02147.33
107173814
NewYork
56.4
June 1
Commonprice
1,014.0524.8
143.32-150.00
144.19144.19143.32
75143513
NewYork
53.3
59
©International Monetary Fund. Not for Redistribution
ANNUAL REPORT, 1977
countries will resell the gold to the Trust Fund at theofficial price. Accordingly, during the fiscal year theFund replenished its holdings of the currencies of tencreditor members against sales of gold under Arti-cle VII, Section 2(ii), of the Fund Agreement (Appen-dix I, Table 1.14). The members purchased the goldwith their respective currencies at the official price ofSDR 35 per fine ounce and resold it simultaneously atthe same price to the Trust Fund against payment ofU. S. dollars. The amount of gold sold in replenishmentwas equal to the amounts sold in public auction by theFund as Trustee for the Trust Fund. Gold was sold onthree occasions each to Belgium, the Federal Republicof Germany, and Japan; on two occasions each toBrazil, the Netherlands, Venezuela, and the UnitedStates; and on one occasion each to Austria, Canada,and Sweden.25
(ii) Distribution. In May 1976 the Fund announced,as part of its gold sales program, that 25 million fineounces of gold would be sold for the purpose of dis-tribution to members in four annual installments, withthe first operation taking place about the middle of the12-month period following the first gold auction inJune 1976. The distribution of gold is to be made toall countries that were members of the Fund on Au-gust 31, 1975 and to Papua New Guinea, for which amembership resolution by the Board of Governors hadbeen adopted on that date but which had not acceptedmembership.
In December 1976, the Executive Directors decidedthat, for operational reasons, gold sales for distributionshould begin on January 10, 1977. Gold should besold directly to all members whose creditor positionswere large enough by an agreed minimum amount topermit the sale against those members' own currencies,that is, the sale of gold would not raise the Fund'sholdings of the member's currency above 75 per centof its quota—and if the creditor's currency was usablein Fund transactions. The distribution to other mem-bers would be carried out indirectly; their share of thegold would be sold to the creditor members whosepositions were large enough to accommodate the addi-tional replenishment with the understanding that thecreditors would resell the gold, at the official price, tothe debtors against convertible currency acceptable tothe creditors. Members could select any of the Fund'sgold depositories for the delivery of gold, except thatmembers in whose territories the Fund's gold deposi-tories are located—France, India, the United Kingdom,and the United States—were expected to take deliveryof their share of the gold at the depository in theirterritory. Gold was to be delivered in whole barsweighing (in terms of fine gold content) not less than a
member's proportionate share in the distribution. Inorder to cover the Fund's administrative expendituresin handling these operations, it was decided to levy ahandling charge of SDR 1 for each 25 fine ounces orpart thereof.
The Executive Directors also decided that a memberrepresenting that it had a balance of payments needcould request postponement of the purchase of its shareof the gold to be distributed until not later than 30 daysafter the amended Articles come into effect, when it willbe able to purchase gold with its own currency. Thebalances above quota so acquired by the Fund would besubject to repurchase not later than two years after thedate of acquisition and they would be subject to the jrates of charge on holdings resulting from purchases inthe credit tranches in effect at the time of the gold sale,provided, however, that the balances will be subjectto a minimum rate of 4 per cent per annum. Thebalances would be excluded when the Fund determineda member's drawing rights under the policies on pur-chases in the credit tranches and under the extendedFund facility.
As mentioned, the sales of gold for distribution beganon January 10, 1977 and the bulk of the transactionshad been completed by the end of the same month. Atotal of 5,998,431.028 fine ounces (SDR 209.95million) was sold to 112 members.26 Of this amount3,497,030.293 fine ounces (SDR 122.4 million) weredistributed directly to 30 members against payment oftheir own currencies. The distribution of gold to 82noncreditor members totaling 2,501,400.735 fine ounceswas arranged indirectly through 12 creditor intermedi-aries,27 broadly in proportion to their creditor positionsafter the sales to them of their own shares in thedistribution, and taking into account members' optionsfor depositories and operational convenience. With theexception of a small amount in French francs, all pay-ments to intermediaries, both for the purchase of goldand for related handling charges, were made withU. S. dollars in an amount of SDR 85.8 million. Oftotal gold sales, 63 transfers were executed at theFederal Reserve Bank of New York, New York, 30 atthe Bank of England, London, 18 at the Banque deFrance, Paris, and one at the Reserve Bank of India,Nagpur.
The Fund agreed to the requests of 14 members forpostponement of their participation in the first phaseof gold distribution. The postponed gold purchasesamounted to 130,299 fine ounces (equivalent to
25 See Appendix I, Table 1.14.
60
26 Arrangements have not been completed with regard todistribution to Cambodia and the Republic of China.
27 Austria, Belgium, Brazil, Canada, France, the FederalRepublic of Germany, Japan, the Netherlands, Norway, Swe-den, the United States, and Venezuela.
©International Monetary Fund. Not for Redistribution
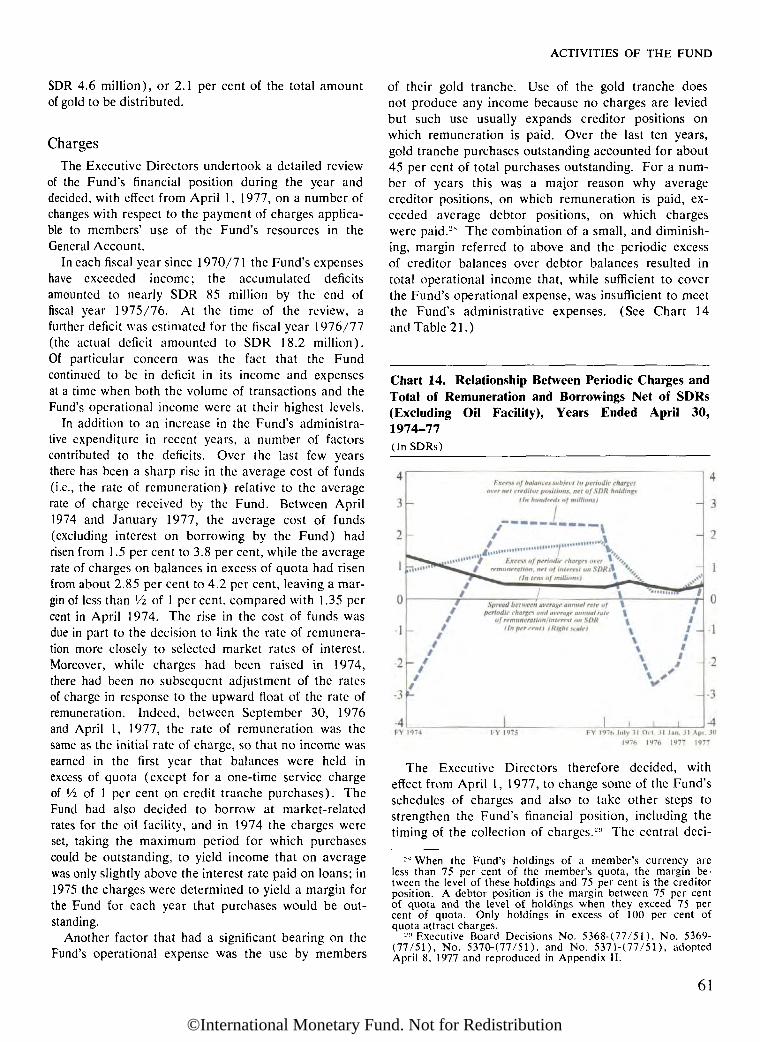
ACTIVITIES OF THE FUND
SDR 4.6 million), or 2.1 per cent of the total amountof gold to be distributed.
Charges
The Executive Directors undertook a detailed reviewof the Fund's financial position during the year anddecided, with effect from April 1, 1977, on a number ofchanges with respect to the payment of charges applica-ble to members' use of the Fund's resources in theGeneral Account.
In each fiscal year since 1970/71 the Fund's expenseshave exceeded income; the accumulated deficitsamounted to nearly SDR 85 million by the end offiscal year 1975/76. At the time of the review, afurther deficit was estimated for the fiscal year 1976/77(the actual deficit amounted to SDR 18.2 million).Of particular concern was the fact that the Fundcontinued to be in deficit in its income and expensesat a time when both the volume of transactions and theFund's operational income were at their highest levels.
In addition to an increase in the Fund's administra-tive expenditure in recent years, a number of factorscontributed to the deficits. Over the last few yearsthere has been a sharp rise in the average cost of funds(i.e., the rate of remuneration) relative to the averagerate of charge received by the Fund. Between April1974 and January 1977, the average cost of funds(excluding interest on borrowing by the Fund) hadrisen from 1.5 per cent to 3.8 per cent, while the averagerate of charges on balances in excess of quota had risenfrom about 2.85 per cent to 4.2 per cent, leaving a mar-gin of less than Ут. of 1 per cent, compared with 1.35 percent in April 1974. The rise in the cost of funds wasdue in part to the decision to link the rate of remunera-tion more closely to selected market rates of interest.Moreover, while charges had been raised in 1974,there had been no subsequent adjustment of the ratesof charge in response to the upward float of the rate ofremuneration. Indeed, between September 30, 1976and April 1, 1977, the rate of remuneration was thesame as the initial rate of charge, so that no income wasearned in the first year that balances were held inexcess of quota (except for a one-time service chargeof Уг of 1 per cent on credit tranche purchases). TheFund had also decided to borrow at market-relatedrates for the oil facility, and in 1974 the charges wereset, taking the maximum period for which purchasescould be outstanding, to yield income that on averagewas only slightly above the interest rate paid on loans; in1975 the charges were determined to yield a margin forthe Fund for each year that purchases would be out-standing.
Another factor that had a significant bearing on theFund's operational expense was the use by members
of their gold tranche. Use of the gold tranche doesnot produce any income because no charges are leviedbut such use usually expands creditor positions onwhich remuneration is paid. Over the last ten years,gold tranche purchases outstanding accounted for about45 per cent of total purchases outstanding. For a num-ber of years this was a major reason why averagecreditor positions, on which remuneration is paid, ex-ceeded average debtor positions, on which chargeswere paid.2s The combination of a small, and diminish-ing, margin referred to above and the periodic excessof creditor balances over debtor balances resulted intotal operational income that, while sufficient to coverthe Fund's operational expense, was insufficient to meetthe Fund's administrative expenses. (See Chart 14and Table 21.)
Chart 14. Relationship Between Periodic Charges andTotal of Remuneration and Borrowings Net of SDRs(Excluding Oil Facility), Years Ended April 30,1974-77(In SDRs)
The Executive Directors therefore decided, witheffect from April 1, 1977, to change some of the Fund'sschedules of charges and also to take other steps tostrengthen the Fund's financial position, including thetiming of the collection of charges.29 The central deci-
28 When the Fund's holdings of a member's currency areless than 75 per cent of the member's quota, the margin be-tween the level of these holdings and 75 per cent is the creditorposition. A debtor position is the margin between 75 per centof quota and the level of holdings when they exceed 75 percent of quota. Only holdings in excess of 100 per cent ofquota attract charges.
29 Executive Board Decisions No. 5368-(77/51), No. 5369-(77/51), No. 5370-(77/51), and No. 5371-(77/51), adoptedApril 8, 1977 and reproduced in Appendix II.
61
©International Monetary Fund. Not for Redistribution
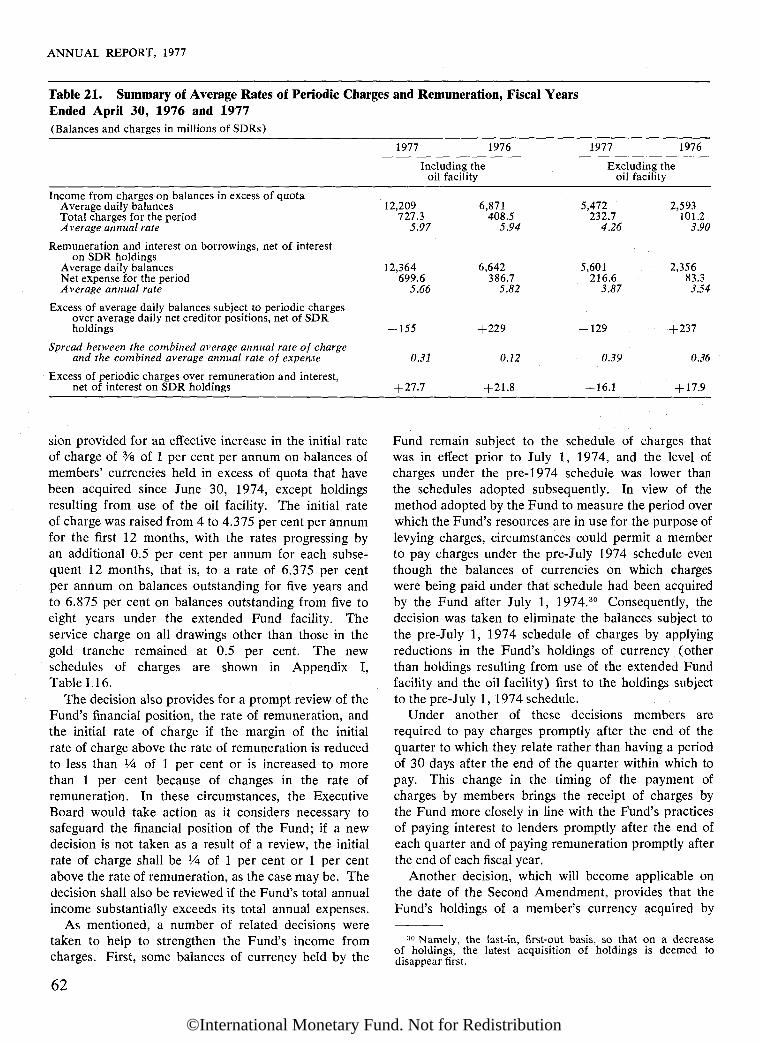
ANNUAL REPORT, 1977
Table 21. Summary of Average Rates of Periodic Charges and Remuneration, Fiscal YearsEnded April 30, 1976 and 1977(Balances and charges in millions of SDKs)
1977 1976
Including theoil facility
Income from charges on balances in excess of quotaAverage daily balancesTotal charges for the periodAverage annual rate
Remuneration and interest on borrowings, net of intereston SDR holdings
Average daily balancesNet expense for the periodAverage annual rate
Excess of average daily balances subject to periodic chargesover average daily net creditor positions, net of SDRholdings
Spread between the combined average annual rate of chargeand the combined average annual rate of expense
Excess of periodic charges over remuneration and interest,net of interest on SDR holdings
12,209727.3
5.97
12,364699.6
5.66
-155
0.31
+ 27.7
6,871408.5
5.94
6,642386.7
5.82
+ 229
0.72
+ 21.8
1977 1976
Excluding theoil facility
5,472232.7
4.26
5,601216.6
5.57
-129
0.39
+ 16.1
2,593101.2
3.90
2,35683.33.54
+ 237
0.36
+ 17.9
sion provided for an effective increase in the initial rateof charge of % of 1 per cent per annum on balances ofmembers' currencies held in excess of quota that havebeen acquired since June 30, 1974, except holdingsresulting from use of the oil facility. The initial rateof charge was raised from 4 to 4.375 per cent per annumfor the first 12 months, with the rates progressing byan additional 0.5 per cent per annum for each subse-quent 12 months, that is, to a rate of 6.375 per centper annum on balances outstanding for five years andto 6.875 per cent on balances outstanding from five toeight years under the extended Fund facility. Theservice charge on all drawings other than those in thegold tranche remained at 0.5 per cent. The newschedules of charges are shown in Appendix I,Table 1.16.
The decision also provides for a prompt review of theFund's financial position, the rate of remuneration, andthe initial rate of charge if the margin of the initialrate of charge above the rate of remuneration is reducedto less than 1A of 1 per cent or is increased to morethan 1 per cent because of changes in the rate ofremuneration. In these circumstances, the ExecutiveBoard would take action as it considers necessary tosafeguard the financial position of the Fund; if a newdecision is not taken as a result of a review, the initialrate of charge shall be !/4 of 1 per cent or 1 per centabove the rate of remuneration, as the case may be. Thedecision shall also be reviewed if the Fund's total annualincome substantially exceeds its total annual expenses.
As mentioned, a number of related decisions weretaken to help to strengthen the Fund's income fromcharges. First, some balances of currency held by the
Fund remain subject to the schedule of charges thatwas in effect prior to July 1, 1974, and the level ofcharges under the pre-1974 schedule was lower thanthe schedules adopted subsequently. In view of themethod adopted by the Fund to measure the period overwhich the Fund's resources are in use for the purpose oflevying charges, circumstances could permit a memberto pay charges under the pre-July 1974 schedule eventhough the balances of currencies on which chargeswere being paid under that schedule had been acquiredby the Fund after July l, 1974.30 Consequently, thedecision was taken to eliminate the balances subject tothe pre-July 1, 1974 schedule of charges by applyingreductions in the Fund's holdings of currency (otherthan holdings resulting from use of the extended Fundfacility and the oil facility) first to the holdings subjectto the pre-July 1, 1974 schedule.
Under another of these decisions members arerequired to pay charges promptly after the end of thequarter to which they relate rather than having a periodof 30 days after the end of the quarter within which topay. This change in the timing of the payment ofcharges by members brings the receipt of charges bythe Fund more closely in line with the Fund's practicesof paying interest to lenders promptly after the end ofeach quarter and of paying remuneration promptly afterthe end of each fiscal year.
Another decision, which will become applicable onthe date of the Second Amendment, provides that theFund's holdings of a member's currency acquired by
30 Namely, the last-in, first-out basis, so that on a decreaseof holdings, the latest acquisition of holdings is deemed todisappear first.
62
©International Monetary Fund. Not for Redistribution
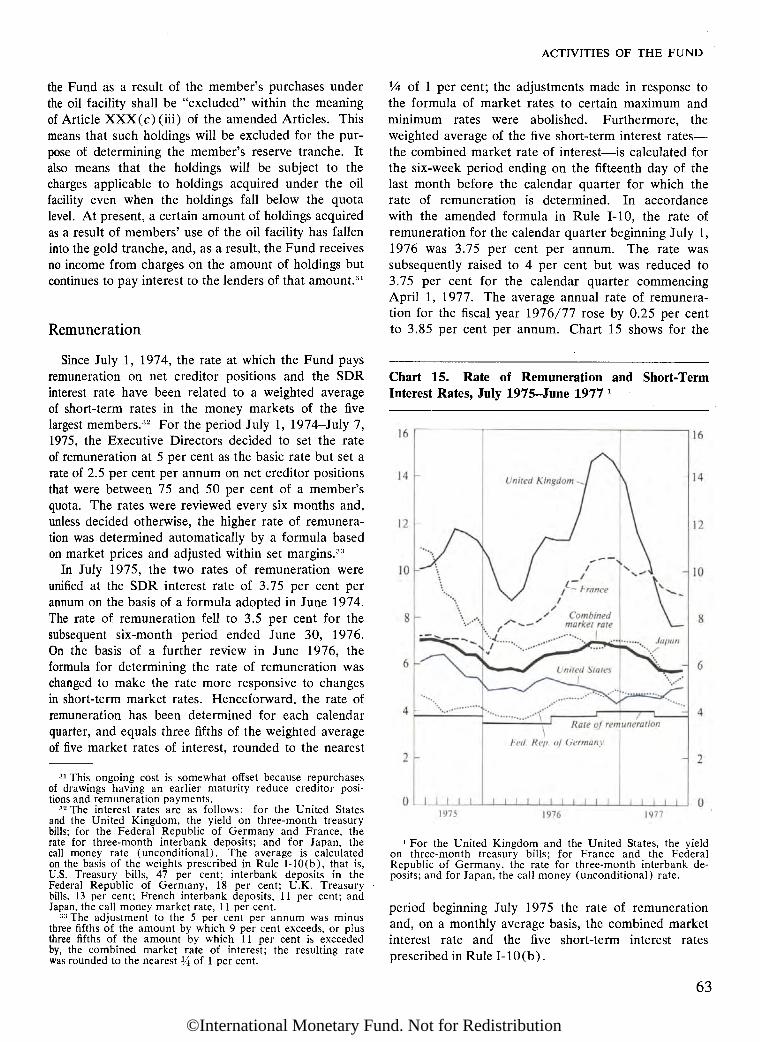
ACTIVITIES OF THE FUND
the Fund as a result of the member's purchases underthe oil facility shall be "excluded" within the meaningof Article XXX(c) (iii) of the amended Articles. Thismeans that such holdings will be excluded for the pur-pose of determining the member's reserve tranche. Italso means that the holdings will be subject to thecharges applicable to holdings acquired under the oilfacility even when the holdings fall below the quotalevel. At present, a certain amount of holdings acquiredas a result of members' use of the oil facility has falleninto the gold tranche, and, as a result, the Fund receivesno income from charges on the amount of holdings butcontinues to pay interest to the lenders of that amount.31
Remuneration
Since July 1, 1974, the rate at which the Fund paysremuneration on net creditor positions and the SDRinterest rate have been related to a weighted averageof short-term rates in the money markets of the fivelargest members.32 For the period July 1, 1974—July 7,1975, the Executive Directors decided to set the rateof remuneration at 5 per cent as the basic rate but set arate of 2.5 per cent per annum on net creditor positionsthat were between 75 and 50 per cent of a member'squota. The rates were reviewed every six months and,unless decided otherwise, the higher rate of remunera-tion was determined automatically by a formula basedon market prices and adjusted within set margins.33
In July 1975, the two rates of remuneration wereunified at the SDR interest rate of 3.75 per cent perannum on the basis of a formula adopted in June 1974.The rate of remuneration fell to 3.5 per cent for thesubsequent six-month period ended June 30, 1976.On the basis of a further review in June 1976, theformula for determining the rate of remuneration waschanged to make the rate more responsive to changesin short-term market rates. Henceforward, the rate ofremuneration has been determined for each calendarquarter, and equals three fifths of the weighted averageof five market rates of interest, rounded to the nearest
31 This ongoing cost is somewhat offset because repurchasesof drawings having an earlier maturity reduce creditor posi-tions and remuneration payments.
32 The interest rates are as follows: for the United Statesand the United Kingdom, the yield on three-month treasurybills; for the Federal Republic of Germany and France, therate for three-month interbank deposits; and for Japan, thecall money rate (unconditional). The average is calculatedon the basis of the weights prescribed in Rule I-10(b), that is,U.S. Treasury bills, 47 per cent; interbank deposits in theFederal Republic of Germany, 18 per cent; U.K. Treasurybills, 13 per cent; French interbank deposits, 11 per cent; andJapan, the call money market rate, 11 per cent.
3:1 The adjustment to the 5 per cent per annum was minusthree fifths of the amount by which 9 per cent exceeds, or plusthree fifths of the amount by which 11 per cent is exceededby, the combined market rate of interest; the resulting ratewas rounded to the nearest J/4 of 1 per cent.
У4 of 1 per cent; the adjustments made in response tothe formula of market rates to certain maximum andminimum rates were abolished. Furthermore, theweighted average of the five short-term interest rates—the combined market rate of interest—is calculated forthe six-week period ending on the fifteenth day of thelast month before the calendar quarter for which therate of remuneration is determined. In accordancewith the amended formula in Rule I-10, the rate ofremuneration for the calendar quarter beginning July 1,1976 was 3.75 per cent per annum. The rate wassubsequently raised to 4 per cent but was reduced to3.75 per cent for the calendar quarter commencingApril 1, 1977. The average annual rate of remunera-tion for the fiscal year 1976/77 rose by 0.25 per centto 3.85 per cent per annum. Chart 15 shows for the
Chart 15. Rate of Remuneration and Short-TermInterest Rates, July 1975-June 1977 1
1 For the United Kingdom and the United States, the yieldon three-month treasury bills; for France and the FederalRepublic of Germany, the rate for three-month interbank de-posits; and for Japan, the call money (unconditional) rate.
period beginning July 1975 the rate of remunerationand, on a monthly average basis, the combined marketinterest rate and the five short-term interest ratesprescribed in Rule I-10(b).
63
©International Monetary Fund. Not for Redistribution
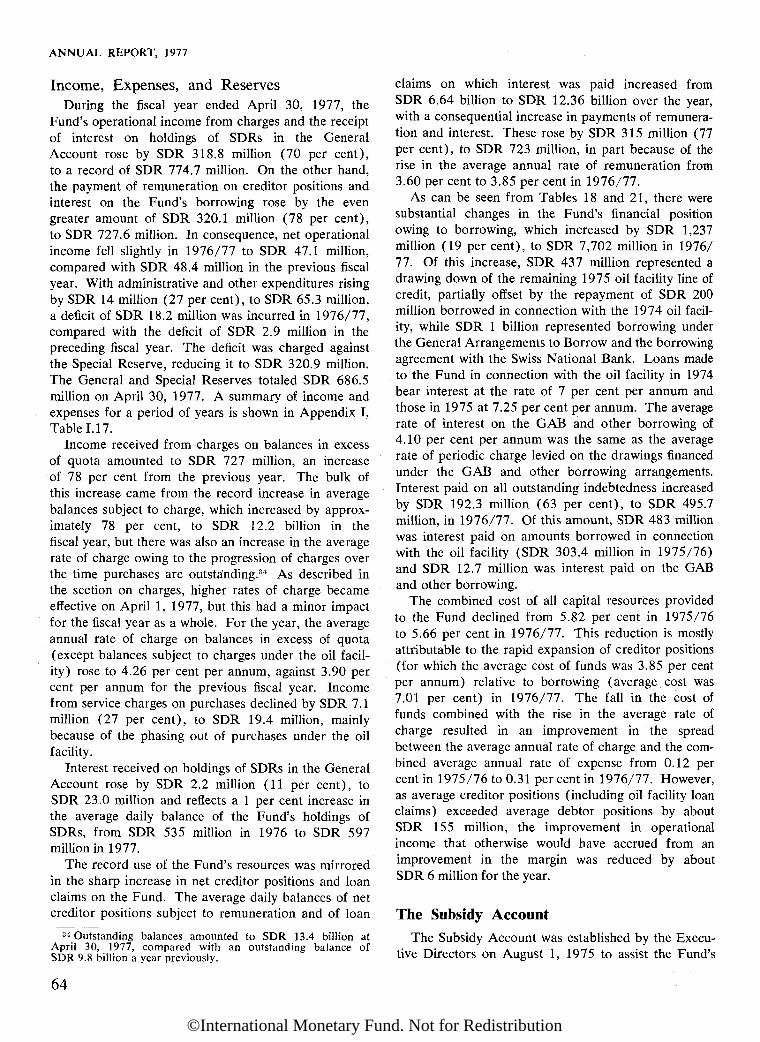
ANNUAL REPORT, 1977
Income, Expenses, and ReservesDuring the fiscal year ended April 30, 1977, the
Fund's operational income from charges and the receiptof interest on holdings of SDRs in the GeneralAccount rose by SDR 318.8 million (70 per cent),to a record of SDR 774.7 million. On the other hand,the payment of remuneration on creditor positions andinterest on the Fund's borrowing rose by the evengreater amount of SDR 320.1 million (78 per cent),to SDR 727.6 million. In consequence, net operationalincome fell slightly in 1976/77 to SDR 47.1 million,compared with SDR 48.4 million in the previous fiscalyear. With administrative and other expenditures risingby SDR 14 million (27 per cent), to SDR 65.3 million,a deficit of SDR 18.2 million was incurred in 1976/77,compared with the deficit of SDR 2.9 million in thepreceding fiscal year. The deficit was charged againstthe Special Reserve, reducing it to SDR 320.9 million.The General and Special Reserves totaled SDR 686.5million on April 30, 1977. A summary of income andexpenses for a period of years is shown in Appendix I,Table 1.17.
Income received from charges on balances in excessof quota amounted to SDR 727 million, an increaseof 78 per cent from the previous year. The bulk ofthis increase came from the record increase in averagebalances subject to charge, which increased by approx-imately 78 per cent, to SDR 12.2 billion in thefiscal year, but there was also an increase in the averagerate of charge owing to the progression of charges overthe time purchases are outstanding.34 As described inthe section on charges, higher rates of charge becameeffective on April 1, 1977, but this had a minor impactfor the fiscal year as a whole. For the year, the averageannual rate of charge on balances in excess of quota(except balances subject to charges under the oil facil-ity) rose to 4.26 per cent per annum, against 3.90 percent per annum for the previous fiscal year. Incomefrom service charges on purchases declined by SDR 7.1million (27 per cent), to SDR 19.4 million, mainlybecause of the phasing out of purchases under the oilfacility.
Interest received on holdings of SDRs in the GeneralAccount rose by SDR 2.2 million (11 per cent), toSDR 23.0 million and reflects a 1 per cent increase inthe average daily balance of the Fund's holdings ofSDRs, from SDR 535 million in 1976 to SDR 597million in 1977.
The record use of the Fund's resources was mirroredin the sharp increase in net creditor positions and loanclaims on the Fund. The average daily balances of netcreditor positions subject to remuneration and of loan
34 Outstanding balances amounted to SDR 13.4 billion atApril 30, 1977, compared with an outstanding balance ofSDR 9.8 billion a year previously.
claims on which interest was paid increased fromSDR 6.64 billion to SDR 12.36 billion over the year,with a consequential increase in payments of remunera-tion and interest. These rose by SDR 315 million (77per cent), to SDR 723 million, in part because of therise in the average annual rate of remuneration from3.60 per cent to 3.85 per cent in 1976/77.
As can be seen from Tables 18 and 21, there weresubstantial changes in the Fund's financial positionowing to borrowing, which increased by SDR 1,237million (19 per cent), to SDR 7,702 million in 1976/77. Of this increase, SDR 437 million represented adrawing down of the remaining 1975 oil facility line ofcredit, partially offset by the repayment of SDR 200million borrowed in connection with the 1974 oil facil-ity, while SDR 1 billion represented borrowing underthe General Arrangements to Borrow and the borrowingagreement with the Swiss National Bank. Loans madeto the Fund in connection with the oil facility in 1974bear interest at the rate of 7 per cent per annum andthose in 1975 at 7.25 per cent per annum. The averagerate of interest on the GAB and other borrowing of4.10 per cent per annum was the same as the averagerate of periodic charge levied on the drawings financedunder the GAB and other borrowing arrangements.Interest paid on all outstanding indebtedness increasedby SDR 192.3 million (63 per cent), to SDR 495.7million, in 1976/77. Of this amount, SDR 483 millionwas interest paid on amounts borrowed in connectionwith the oil facility (SDR 303.4 million in 1975/76)and SDR 12.7 million was interest paid on the GABand other borrowing.
The combined cost of all capital resources providedto the Fund declined from 5.82 per cent in 1975/76to 5.66 per cent in 1976/77. This reduction is mostlyattributable to the rapid expansion of creditor positions(for which the average cost of funds was 3.85 per centper annum) relative to borrowing (average cost was7.01 per cent) in 1976/77. The fall in the cost offunds combined with the rise in the average rate ofcharge resulted in an improvement in the spreadbetween the average annual rate of charge and the com-bined average annual rate of expense from 0.12 percent in 1975/76 to 0.31 per cent in 1976/77. However,as average creditor positions (including oil facility loanclaims) exceeded average debtor positions by aboutSDR 155 million, the improvement in operationalincome that otherwise would have accrued from animprovement in the margin was reduced by aboutSDR 6 million for the year.
The Subsidy AccountThe Subsidy Account was established by the Execu-
tive Directors on August 1, 1975 to assist the Fund's
64
©International Monetary Fund. Not for Redistribution

ACTIVITIES OF THE FUND
most seriously affected (MSA) members to meet thecost of using the oil facility for 1975.35 Of the 39 Fundmembers on the list prepared by the Secretary-Generalof the United Nations as being those countries mostaffected by the increased price of petroleum andpetroleum products, 18 made purchases under the 1975oil facility for a total of SDR 551.04 million. (SeeTable 22.) The annual amount of subsidy paymentsto eligible members is calculated as a percentage perannum of the average daily balances of the Fund'sholdings of currency, in excess of quota, that resultedfrom use of the oil facility for 1975 and that are out-standing during the year.
The Subsidy Account is funded by contributionsfrom the 24 members and Switzerland listed inTable 23. The table also shows that contributions total-ing SDR 160 million are anticipated over the life of theSubsidy Account, and that the contributions from allbut two members had been received by June 30, 1977in the total amount of SDR 66 million. During the
Table 22. Subsidy Account: Total Use ofFacility by Most Seriously Affectedsidy Paid for the Years(In millions of SDRs)
Ended April
TotalUse1975
Country Oil Facility
BangladeshCameroonCentral African EmpireEgyptHaiti
IndiaIvory CoastKenyaMaliMauritania
PakistanSenegalSierra LeoneSri LankaSudan
TanzaniaWestern SamoaYemen, People's
Dem. Rep. ofTotal
40.4711.792.66
31.684.14
201.3410.3527.93
3.995.32
111.019.914.97
34.1318.30
20.610.42
12.02551.03
Members30, 1976
1975 Oiland Sub-and 1977
Subsidy at 5 Per Centfor Year
April 30,1976
0.650.140.050.160.07
7.230.150.670.010.05
2.600.300.030.480.36
0.680.01
0.1813.821
Ended
April 30,1977
2.000.590.131.570.21
10.070.521.390.200.26
5.550.500.251.710.92
1.030.02
0.6027.51 !
1 Purchases began in July 1975 and continued until May1976; differences in amounts reflect larger average daily bal-ances for the fiscal year 1976/77 than for 1975/76.
year, one additional member—Greece—has agreed tocontribute a total of SDR 0.6 million.
Contributions have been received either in U.S.dollars or in the member's own currency with immediateconversion into U.S. dollars. These funds have been
Table 23. Subsidy(In millions of SDKs)
Contributor
AustraliaAustriaBelgiumBrazilCanada
DenmarkFinlandFranceGermany, Fed. Rep. ofGreece
IranItalyJapanLuxembourgNetherlands
New ZealandNorwaySaudi ArabiaSouth AfricaSpain
SwedenSwitzerlandUnited KingdomVenezuelaYugoslavia
Total
Account: Contributions
AnticipatedTotal
Contributions1
5.7002.3005.6001.8509.500
2.2001.600
12.90013.7000.600
6.0008.600
10.3000.1086.000
1.7002.100
40.0001.3503.400
2.8003.285
12.0506.0000.900
160.543
ContributionsReceived as ofJune 30, 1977
1.0702.300
. — .0.9259.500
0.6400.4005.0466.8410.150
3.000
2.2000.1086.000
0.2862.1009.9901.3500.980
1.4003.2854.5093.0000.450
65.5301 In some cases subject to final agreement on amount or
timing, parliamentary approval, and/or certain conditions. Insome cases where contributions are being made in installments,budgetary approval will be required in each year that a con-tribution is to be made. SDR amounts may be subject to smalladjustments owing to exchange rate changes.
invested in U. S. Treasury bills or notes to mature, asfar as possible, on dates appropriate to the paymentsrequirement of the Subsidy Account. As required bythe Executive Board decision establishing the SubsidyAccount,36 the approval of the United States has beenobtained with respect to investments in U. S. dollars.
The objective of the Subsidy Account is to reducethe effective rate of annual charge payable on drawingsunder the 1975 oil facility by about 5 per cent perannum. For the fiscal year ended April 30, 1976, theExecutive Directors decided that the rate of subsidywould be 5 per cent, thus reducing the effective interestcost to recipients of using the 1975 oil facility fromabout 7.71 per cent to 2.71 per cent per annum. Afterreviewing the Subsidy Account for the fiscal year endedApril 30, 1977, the Executive Directors decided tomaintain the subsidy rate at 5 per cent for the fiscalyear 1976/77. The rate of subsidy implies a grantelement of 28 per cent; it involved payments by theSubsidy Account totaling SDR 13.8 million in fiscalyear 1975/76 and SDR 27.5 million in 1976/77. (See
35 See Annual Report, 1976, pages 58-59.
36 Executive Board Decision No. 4773-(75/136), adoptedAugust 1, 1975 and reproduced in Selected Decisions of theInternational Monetary Fund and Selected Documents (EighthIssue, Washington, 1976), pages 81-83.
65
©International Monetary Fund. Not for Redistribution

ANNUAL REPORT, 1977
Table 22.) The decision establishing the SubsidyAccount, including the list of recipients, is to bereviewed annually.
The Trust Fund
As mentioned in last year's Annual Report, onMay 5, 1976, the Executive Directors established aTrust Fund to be administered by the InternationalMonetary Fund.37 The resources of the Trust Fundconsist of gold and currencies sold, donated, or lentto it, income from investments and loans, and the pro-ceeds from repayments of loans. One category ofassets results from the sale of a portion of the Fund'sown gold. Under its authority to replenish its holdingsof needed currencies, the Fund sells gold to certainmembers for their currencies at the official price ofSDR 35 per fine ounce. In accordance with an agreedprocedure, these members then sell the gold, again atthe official price, to the Fund as Trustee for the TrustFund. The gold is sold in auctions, and the profitgoes into the Trust Fund, the bulk of it to be usedfor loans and a portion to be distributed to developingcountries on the basis of the ratio that their quotas onAugust 31, 1975 bore to total quotas on that date.The resources shall be used to provide additionalbalance of payments assistance on concessional termsin support of the efforts of eligible developing membersthat qualify for assistance to carry out programs ofbalance of payments adjustment. There are currently61 developing members that are eligible for suchassistance. The Fund shall review the Instrumentestablishing the Trust Fund, and in particular the listof eligible members, and the criterion of eligibility forinclusion before January 1, 1978.
The Instrument establishing the Trust Fund providesthat the "Trustee shall report on the operation of theTrust in the annual report of the Executive Directorsof the Fund to the Board of Governors of the Fund andshall include in that annual report the report of theaudit committee on the Trust." The operation andadministration of the Trust through the end of April1977 is described below, and the report of the auditcommittee is reproduced in Appendix VIII.
The resources available to the Trust on April 30,1977 represented profits from the eight gold auctionsthat had been held to that date and the income fromthe investment of funds held by the Trust pendingdisbursements. By April 30, 1977, a total of 5.73million fine ounces of gold had been sold, and the
profits realized from these auctions totaled SDR 437.5million. Income on investments through April totaledSDR 9.0 million, of which SDR 5.6 million was accrued.The General Account of the Fund was reimbursedSDR 0.8 million for the expenses of conducting thebusiness of the Trust for the fiscal year 1976/77, includ-ing the administration and handling of the gold auctions.The Trust has not as yet received any voluntary con-tributions or loans. At the end of June 1977, theresources of the Trust Fund totaled SDR 543.34million, including the net proceeds of the auctionsconducted in May and June.
The Executive Directors have decided that, to theextent possible, the Trust shall disburse loans at half-yearly intervals, in January and July of each year. TheExecutive Directors are agreed that the direct distribu-tion of profits to developing members (to be made inproportion to a developing member's quota to totalFund quotas) would be made annually. In view of therelatively small amounts that are likely to be involvedfor each member, such distributions should, whenfeasible, be made to coincide with alternative disburse-ments of loans by the Trust Fund.
The first interim disbursements of Trust Fund loans(for the period July 1, 1976 to June 30, 1978) weremade to 12 of the 61 members that had qualified by theend of January 1977 on the basis of both their need forbalance of payments assistance and suitable programsfor balance of payments adjustment. The amounts oftheir respective interim loan disbursements were asfollows :
BurundiCongo, People's Rep. of theHaitiKenyaLiberiaMoroccoNepalPhilippinesTanzaniaWestern SamoaYemen, People's Dem. Rep. ofZaïre
Total
(In millionsof SDKs)
1.0070.6891.0072.5441.5375.9890.7428.2152.2260.1061.5375.989
31.588
37 The Trust Fund, like the Subsidy Account, is an arrange-ment that falls outside the Fund's own accounts and resources.For a description of the modalities of the Trust Fund and thelist of eligible members, see Annual Report, 1976, pages 60and 111-17.
The total amount available to the Trust for making loansat the time of the first interim disbursement wasSDR 198 million, which consisted of a share (about 70per cent) of the profits realized at the Fund's gold auc-tions during 1976, and of the investment income on theamounts realized at those auctions. The loan for eachmember that qualified for assistance from the TrustFund amounted to 5.3 per cent of its quota on Decem-
66
©International Monetary Fund. Not for Redistribution
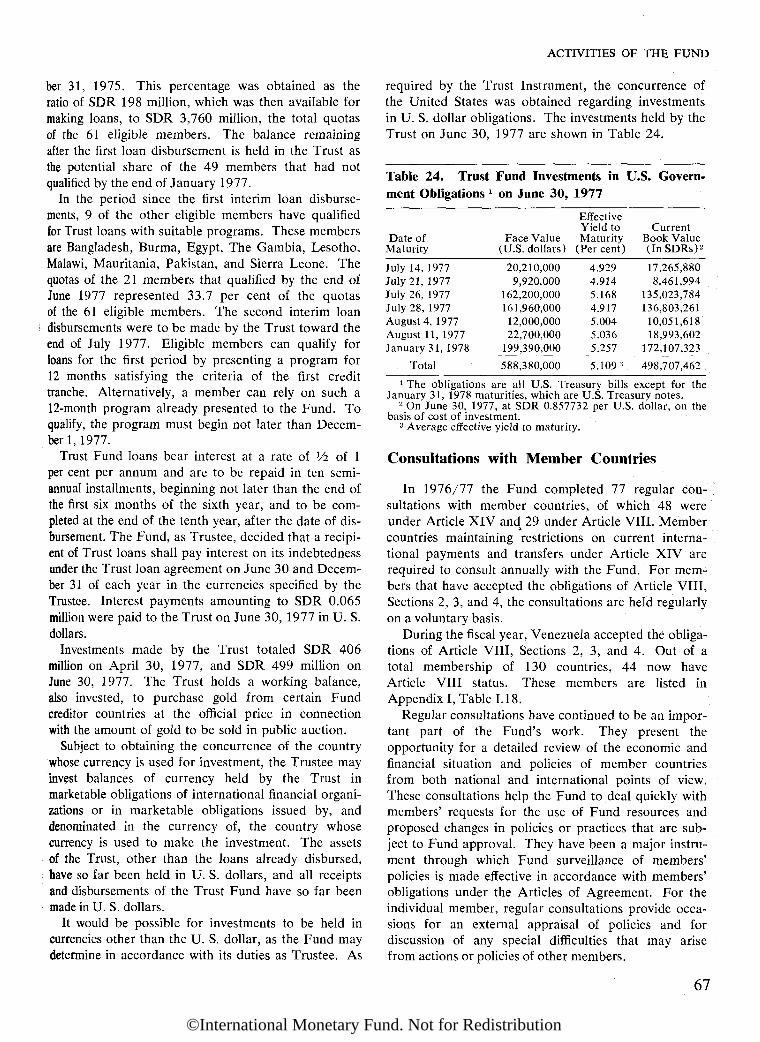
ACTIVITIES OF THE FUND
ber 31, 1975. This percentage was obtained as theratio of SDR 198 million, which was then available formaking loans, to SDR 3,760 million, the total quotasof the 61 eligible members. The balance remainingafter the first loan disbursement is held in the Trust asthe potential share of the 49 members that had notqualified by the end of January 1977.
In the period since the first interim loan disburse-ments, 9 of the other eligible members have qualifiedfor Trust loans with suitable programs. These membersare Bangladesh, Burma, Egypt, The Gambia, Lesotho,Malawi, Mauritania, Pakistan, and Sierra Leone. Thequotas of the 21 members that qualified by the end ofJune 1977 represented 33.7 per cent of the quotasof the 61 eligible members. The second interim loandisbursements were to be made by the Trust toward theend of July 1977. Eligible members can qualify forloans for the first period by presenting a program for12 months satisfying the criteria of the first credittranche. Alternatively, a member can rely on such a12-month program already presented to the Fund. Toqualify, the program must begin not later than Decem-ber 1,1977.
Trust Fund loans bear interest at a rate of Уг of 1per cent per annum and are to be repaid in ten semi-annual installments, beginning not later than the end ofthe first six months of the sixth year, and to be com-pleted at the end of the tenth year, after the date of dis-bursement. The Fund, as Trustee, decided that a recipi-ent of Trust loans shall pay interest on its indebtednessunder the Trust loan agreement on June 30 and Decem-ber 31 of each year in the currencies specified by theTrustee. Interest payments amounting to SDR 0.065million were paid to the Trust on June 30, 1977 in U. S.dollars.
Investments made by the Trust totaled SDR 406million on April 30, 1977, and SDR 499 million onJune 30, 1977. The Trust holds a working balance,also invested, to purchase gold from certain Fundcreditor countries at the official price in connectionwith the amount of gold to be sold in public auction.
Subject to obtaining the concurrence of the countrywhose currency is used for investment, the Trustee mayinvest balances of currency held by the Trust inmarketable obligations of international financial organi-zations or in marketable obligations issued by, anddenominated in the currency of, the country whosecurrency is used to make the investment. The assetsof the Trust, other than the loans already disbursed,have so far been held in U. S. dollars, and all receiptsand disbursements of the Trust Fund have so far beenmade in U. S. dollars.
It would be possible for investments to be held incurrencies other than the U. S. dollar, as the Fund maydetermine in accordance with its duties as Trustee. As
required by the Trust Instrument, the concurrence ofthe United States was obtained regarding investmentsin U. S. dollar obligations. The investments held by theTrust on June 30, 1977 are shown in Table 24.
Table 24. Trust Fund Investments in U.S. Govern-ment Obligations x on June 30, 1977
Date ofMaturity
July 14, 1977July 21, 1977July 26, 1977July 28, 1977August 4, 1977August 11, 1977January 31, 1978
Total
Face Value(U.S. dollars)
20,210,0009,920,000
162,200,000161,960,000
12,000,00022,700,000
199,390,000
588,380,000
EffectiveYield toMaturity
(Per cent)
4.9294.9145.1684.9175.0045.0365.257
5.1093
CurrentBook Value(InSDRs)2
17,265,8808,461,994
135,023,784136,803,261
10,051,61818,993,602
172,107,323
498,707,4621 The obligations are all U.S. Treasury bills except for the
January 31, 1978 maturities, which are U.S. Treasury notes.- On June 30, 1977, at SDR 0.857732 per U.S. dollar, on the
basis of cost of investment.3 Average effective yield to maturity.
Consultations with Member Countries
In 1976/77 the Fund completed 77 regular con-sultations with member countries, of which 48 wereunder Article XIV and 29 under Article VIII. Membercountries maintaining restrictions on current interna-tional payments and transfers under Article XIV arerequired to consult annually with the Fund. For mem-bers that have accepted the obligations of Article VIII,Sections 2, 3, and 4, the consultations are held regularlyon a voluntary basis.
During the fiscal year, Venezuela accepted the obliga-tions of Article VIII, Sections 2, 3, and 4. Out of atotal membership of 130 countries, 44 now haveArticle VIII status. These members are listed inAppendix I, Table 1.18.
Regular consultations have continued to be an impor-tant part of the Fund's work. They present theopportunity for a detailed review of the economic andfinancial situation and policies of member countriesfrom both national and international points of view.These consultations help the Fund to deal quickly withmembers' requests for the use of Fund resources andproposed changes in policies or practices that are sub-ject to Fund approval. They have been a major instru-ment through which Fund surveillance of members'policies is made effective in accordance with members'obligations under the Articles of Agreement. For theindividual member, regular consultations provide occa-sions for an external appraisal of policies and fordiscussion of any special difficulties that may arisefrom actions or policies of other members.
67
©International Monetary Fund. Not for Redistribution
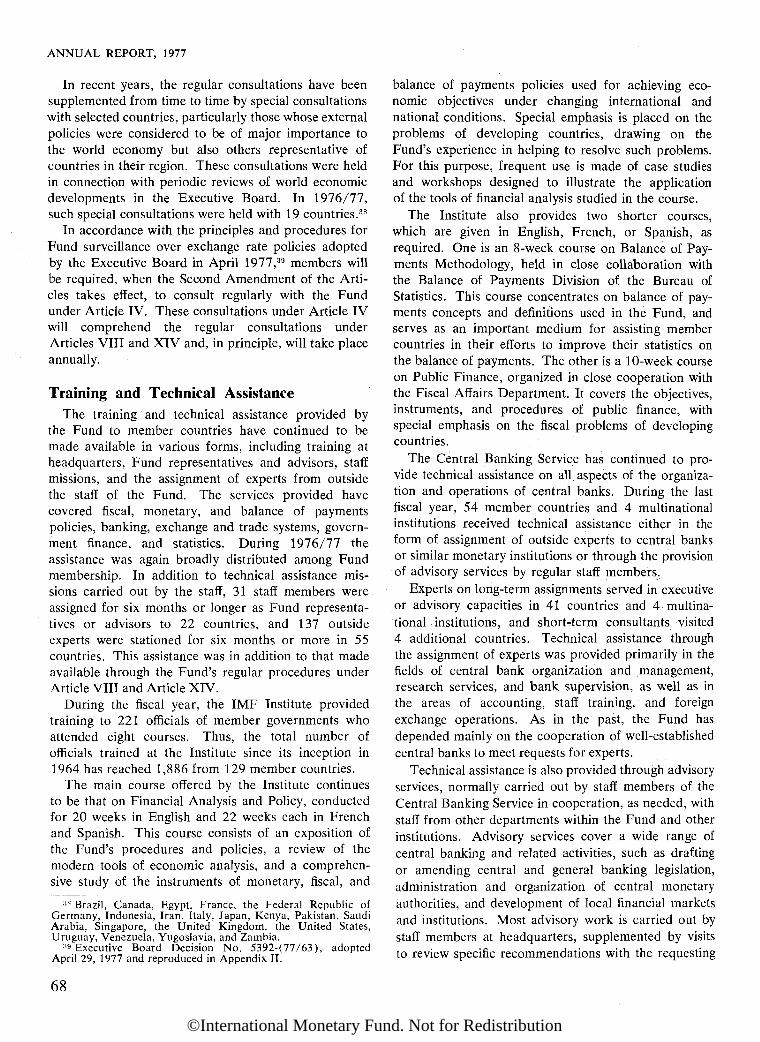
ANNUAL REPORT, 1977
In recent years, the regular consultations have beensupplemented from time to time by special consultationswith selected countries, particularly those whose externalpolicies were considered to be of major importance tothe world economy but also others representative ofcountries in their region. These consultations were heldin connection with periodic reviews of world economicdevelopments in the Executive Board. In 1976/77,such special consultations were held with 19 countries.38
In accordance with the principles and procedures forFund surveillance over exchange rate policies adoptedby the Executive Board in April 1977,39 members willbe required, when the Second Amendment of the Arti-cles takes effect, to consult regularly with the Fundunder Article IV. These consultations under Article IVwill comprehend the regular consultations underArticles VIII and XIV and, in principle, will take placeannually.
Training and Technical AssistanceThe training and technical assistance provided by
the Fund to member countries have continued to bemade available in various forms, including training atheadquarters, Fund representatives and advisors, staffmissions, and the assignment of experts from outsidethe staff of the Fund. The services provided havecovered fiscal, monetary, and balance of paymentspolicies, banking, exchange and trade systems, govern-ment finance, and statistics. During 1976/77 theassistance was again broadly distributed among Fundmembership. In addition to technical assistance mis-sions carried out by the staff, 31 staff members wereassigned for six months or longer as Fund representa-tives or advisors to 22 countries, and 137 outsideexperts were stationed for six months or more in 55countries. This assistance was in addition to that madeavailable through the Fund's regular procedures underArticle VIII and Article XIV.
During the fiscal year, the IMF Institute providedtraining to 221 officials of member governments whoattended eight courses. Thus, the total number ofofficials trained at the Institute since its inception in1964 has reached 1,886 from 129 member countries.
The main course offered by the Institute continuesto be that on Financial Analysis and Policy, conductedfor 20 weeks in English and 22 weeks each in Frenchand Spanish. This course consists of an exposition ofthe Fund's procedures and policies, a review of themodern tools of economic analysis, and a comprehen-sive study of the instruments of monetary, fiscal, and
3R Brazil, Canada, Egypt, France, the Federal Republic ofGermany, Indonesia, Iran, Italy, Japan, Kenya, Pakistan, SaudiArabia, Singapore, the United Kingdom, the United States,Uruguay, Venezuela, Yugoslavia, and Zambia.
S9 Executive Board Decision No. 5392-(77/63), adoptedApril 29, 1977 and reproduced in Appendix II.
balance of payments policies used for achieving eco-nomic objectives under changing international andnational conditions. Special emphasis is placed on theproblems of developing countries, drawing on theFund's experience in helping to resolve such problems.For this purpose, frequent use is made of case studiesand workshops designed to illustrate the applicationof the tools of financial analysis studied in the course.
The Institute also provides two shorter courses,which are given in English, French, or Spanish, asrequired. One is an 8-week course on Balance of Pay-ments Methodology, held in close collaboration withthe Balance of Payments Division of the Bureau ofStatistics. This course concentrates on balance of pay-ments concepts and definitions used in the Fund, andserves as an important medium for assisting membercountries in their efforts to improve their statistics onthe balance of payments. The other is a 10-week courseon Public Finance, organized in close cooperation withthe Fiscal Affairs Department. It covers the objectives,instruments, and procedures of public finance, withspecial emphasis on the fiscal problems of developingcountries.
The Central Banking Service has continued to pro-vide technical assistance on all aspects of the organiza-tion and operations of central banks. During the lastfiscal year, 54 member countries and 4 multinationalinstitutions received technical assistance either in theform of assignment of outside experts to central banksor similar monetary institutions or through the provisionof advisory services by regular staff members.
Experts on long-term assignments served in executiveor advisory capacities in 41 countries and 4 multina-tional institutions, and short-term consultants visited4 additional countries. Technical assistance throughthe assignment of experts was provided primarily in thefields of central bank organization and management,research services, and bank supervision, as well as inthe areas of accounting, staff training, and foreignexchange operations. As in the past, the Fund hasdepended mainly on the cooperation of well-establishedcentral banks to meet requests for experts.
Technical assistance is also provided through advisoryservices, normally carried out by staff members of theCentral Banking Service in cooperation, as needed, withstaff from other departments within the Fund and otherinstitutions. Advisory services cover a wide range ofcentral banking and related activities, such as draftingor amending central and general banking legislation,administration and organization of central monetaryauthorities, and development of local financial marketsand institutions. Most advisory work is carried out bystaff members at headquarters, supplemented by visitsto review specific recommendations with the requesting
68
©International Monetary Fund. Not for Redistribution

ACTIVITIES OF THE FUND
authorities. During the fiscal year 1976/77, advisorymissions visited 14 countries in conjunction with surveysof the financial system, the drafting of legislation, andthe establishment of new central monetary authorities.Where appropriate, other Fund departments participatein the advisory work, especially in the context of legisla-tive assistance in which the Fund's Legal Departmenttakes an active role. On occasion, collaboration withspecialized units of other institutions, particularly theInternational Finance Corporation, is also sought,especially for requests concerning the survey of finan-cial systems and the development of financial mar-kets. Similarly, on occasion, staff members of the Cen-tral Banking Service participate in missions of otherdepartments and organizations.
During 1976/77 the Fiscal Affairs Department pro-vided technical assistance through staff missions, staffassignments in the field, and use of the services ofmembers of the panel of fiscal experts to 33 membercountries, 8 more than in the previous year. Of thecountries served, 5 received assistance for the first time.The principal fields in which assistance was given weretax policy, tax and customs administration, budgetarysystems and procedures, government accounting andauditing, and general financial management. Duringthe year, 41 assignments were undertaken by membersof the fiscal panel, and 25 staff members carried outassignments in the field and at headquarters. At theend of the year, 26 panel members and 1 staff memberwere on long-term assignment in 17 countries. Groupsof advisors were continuing to operate in 2 countries.As in previous years, members of the staff visited anumber of countries to inspect progress and to reviewrequests for further assistance; staff members continuedto be substantially involved at headquarters in support-ing and controlling the work of field experts.
The Bureau of Statistics provided technical assistanceto member countries in the area of statistics for im-proving the assembly of financial and general statisticscontained in existing bulletins of central banks or forestablishing new bulletins. The technical work, whichbrings together the staff expert and national technicianin a cooperative effort, includes discussions with na-tional technicians on the concepts and classificationstandards for the organization of statistics relevant tothe analysis of the monetary and payments problems,and it has helped to promote the use of statistical defini-tions that facilitate intercountry comparison of data. Inimproving the statistical content of central bank bul-letins, the emphasis in the work has been on data oninternational reserves, money and banking, interestrates, prices, production, external trade, governmentfinance, balance of payments, and, where available, thenational accounts.
The Bureau staff's discussions on statistics with na-tional counterparts during visits to countries for pur-poses other than to work on central bank bulletins have,in substance, paralleled the technical work on the sta-tistics for those bulletins. The recent availability of theFund's Draft Manual on Government Finance Statisticsand the distribution to countries of questionnaires forassembly of government finance statistics for a yearbookon these data (the publication of which is projected forthe fiscal year 1977/78) provided opportunities forassisting officials and technicians of ministries and cen-tral banks in understanding and applying the conceptsand classification standards in the Draft Manual to thedetailed data on the transactions of the government andother parts of the public sector. Other technical assist-ance was provided by the Bureau staff while partici-pating in Fund missions.
During the fiscal year, the Bureau's overall technicalassistance activities resulted in visits to 39 countries, inthe establishment of two new central bank bulletins,and in the substantial improvement of the statistics inseveral existing bulletins.
An increasing amount of technical assistance hasbeen provided by the Treasurer's Department both inthe field and at headquarters in response to requests ofmembers and of area organizations. These requests havebeen primarily in the fields of the Fund's financial rela-tionships with members and their reciprocal accountingproblems for transactions and operations in both theGeneral Account and the Special Drawing Account.Staff members in the Treasurer's Department haveeither led or participated in technical missions to pros-pective members in connection with the collection ofdata appropriate to the calculation of quotas and to pro-vide assistance to prospective members in the variousfinancial steps associated with achieving membership.Assistance has also been provided in the field to existingmembers.
Relations with Other InternationalOrganizations
In its international setting, the Fund maintains activecollaboration with other organizations in the monetaryand financial area having related responsibilities and in-terests. Close relations are maintained through staffcontacts, exchange of documents and information, andattendance at meetings from plenary to working partylevels with the United Nations (UN) and its relevantorgans and specialized agencies, the International Bankfor Reconstruction and Development (IBRD), withwhich the Fund has a special relationship, the GeneralAgreement on Tariffs and Trade (GATT), the Organi-
69
©International Monetary Fund. Not for Redistribution
ANNUAL REPORT, 1977
zation for Economic Cooperation and Development(OECD), the Commission of the European Commu-nities (CEC), the Bank for International Settlements(BIS), and the Organization of American States(OAS), particularly its Inter-American Economic andSocial Council and its Permanent Executive Committee(CEPCIES). Regional organizations, including theregional development banks and the UN regional eco-nomic commissions, and other development and financ-ing institutions, as well as ad hoc conferences andseminars on technical matters within the Fund's com-petence, are also focal points for cooperation withregard to common members.
Most of those organizations were represented asobservers at the Annual Meeting of the Fund's Board ofGovernors, held jointly with that of the IBRD and itsaffiliates, in Manila, Philippines, in October 1976, andseveral of them were also represented at meetings ofthe Interim Committee and of the Development Com-mittee, held in Manila in October 1976 and in Wash-ington in April 1977.'°
Primary responsibility for maintaining continuousliaison rests with the Fund's Special Representative tothe United Nations; the European Office in Paris, withrespect to the OECD, CEC, BIS, and the Conferenceon International Economic Cooperation (CIEC, orNorth-South dialogue), for which Fund reports on debtservicing were made available; and the Geneva Officewith respect to the GATT, the United Nations Confer-ence on Trade and Development (UNCTAD) and itsvarious bodies, and other UN agencies and meetings inthat locale. Their activities are supplemented by attend-ance of headquarters staff as occasions require, andfrom time to time by staff resident representatives incertain member countries.
Owing to unexpected developments, the ManagingDirector's annual address to the UN Economic andSocial Council (ECOSOC) was delivered on his behalfby the Special Representative to the UN at the 61stSession, Part I, in Abidjan, Ivory Coast. The DeputyManaging Director addressed the Fourth Session ofUNCTAD in Nairobi, Kenya, in May 1976. Staff rep-resentatives attended sessions of the ECOSOC, theGeneral Assembly, and their subordinate bodies, theSpecial Fund, and the Administrative Committee onCoordination (ACC) and its preparatory and workinggroups. The Managing Director attended variousmonthly meetings of the BIS in Basle and participatedin meetings of the central bank governors of the coun-tries adhering to the arrangements on gold,41 composed
40 The communiqués and announcements issued after themeetings are reproduced in Appendix III.
41 These arrangements were described in the Interim Com-mittee communiqué of August 31, 1975. See Annual Report,1976, pages 120-21.
of the Group of Ten industrial countries, Switzerland,and Portugal. On the invitation of the governors of thecentral banks of the Group of Ten countries andSwitzerland, the Managing Director entered into arrange-ments to monitor a $3 billion medium-term financ-ing facility provided by the BIS, with the support of theparticipating central banks, with respect to U. K. offi-cial sterling balances.
In connection with Fund concerns regarding aid coor-dination and debt renegotiation, staff representativesparticipated in meetings, and in some cases, staff reportswere made available at the request of the subjectcountry, of the Inter-Governmental Group on Indonesia(IGGI), convened by the Netherlands Government;IBRD Consultative Groups on Aid Coordination forEast Africa—Kenya, Korea, the Philippines, the Sudan,and Thailand; the India and the Pakistan Consortia, andthe Aid Groups for Bangladesh, Burma, Nepal, and SriLanka, which were also held under IBRD auspices.Fund staff also participated in debt renegotiation meet-ings held by Zaïre with creditor countries under theaegis of the Paris Club and with private creditor banks.
Commodity problems are followed closely by theFund, particularly with reference to its compensatoryfinancing and buffer stock facilities. Fund staff attendedmeetings of the UNCTAD in connection with its Inte-grated Program for Commodities, including the UNNegotiating Conference on a Common Fund and thepreparatory meetings therefor, the Preparatory Meetingon Copper, and the UN Sugar Conference; the Foodand Agriculture Organization of the United Nations(FAO) meeting of its Committee on Commodity Prob-lems' Intergovernmental Group on Rice; and meetingsof the International Cotton Advisory Committee andthe International Cocoa Council and its StatisticsCommittee.
Long-standing cooperative arrangements with theGATT with respect to its consultations with commonmembers on trade restrictions imposed for balance ofpayments reasons involved staff participation in thoseconsultations and the provision of pertinent documents.Fund representatives also attended the annual sessionof the CONTRACTING PARTIES to the GATT, meetings ofthe Council of Representatives, the Consultative Groupof Eighteen and other GATT bodies, and continued topay close attention to the ongoing multilateral tradenegotiations.
On the technical level, Fund staff participated in theInternational Labor Organization's (ILO) TripartiteWorld Conference on Employment, Income Distributionand Social Progress, held in Geneva, and also attendedsessions of its Governing Body and InternationalLabor Conference; the Conference of Asian Chambersof Commerce and Industry; the 19th Session of the UNStatistical Commission, held in New Delhi, at which
70
©International Monetary Fund. Not for Redistribution

ACTIVITIES OF THE FUND
the Fund's Draft Manual and work on improving anddeveloping government finance statistics were broadlyagreed; the Group of 77 Conference on EconomicCooperation Among Developing Countries, held in Mex-ico City; the general meetings of the International Unionof Credit and Investment Insurers (Berne Union); the10th meeting of the Latin American Banking Federa-tion; the 13th meeting of Central Bank Technicians ofthe American Continent, at which two papers were sub-mitted by Fund staff; and the Conference on ExternalFinancial Policy, sponsored jointly by the OAS and theCentral Bank of Chile. Lecturers were also providedby the Fund to the South-East Asia, New Zealand, andAustralia (SEANZA) central banking course in Teh-ran, and to the Center for Latin American MonetaryStudies (CEMLA) courses in Mexico City and Wash-ington.
As follow-up to the technical assistance provided inconnection with its establishment, a Fund representativeattended the first annual meeting of the Board of Gov-ernors of the Islamic Development Bank. Technicalassistance was also extended to the Organization ofPetroleum Exporting Countries (OPEC) Special Fundin connection with establishing criteria for balance ofpayments support to MSA countries.
Membership, Quotas, and Participation in theSpecial Drawing Account
The Comoros became a member of the Fund on Sep-tember 21, 1976 with a quota of SDR 1.9 million, andGuinea-Bissau became a member on March 24, 1977with a quota of SDR 3.2 million, bringing total member-ship on April 30, 1977 to 130 and aggregate quotas toSDR 29,216.5 million. The Comoros and Guinea-Bissau also became participants in the Special DrawingAccount, bringing the total number of participants to122, with quotas equivalent to 98.9 per cent of the Fundtotal. The eight members of the Fund that are not par-ticipants in the Special Drawing Account are Ethiopia,Kuwait, Lebanon, Libya, Qatar, Saudi Arabia, Singa-pore, and the United Arab Emirates.
The Board of Governors approved terms and condi-tions for the admission of Seychelles to membership inthe Fund on September 7, 1976, and for the admissionof Surinam to membership in the Fund on October 8,1976, with each country given a six-month period foracceptance of membership. Owing to unexpected delays
in the completion of the official action needed formembership, the Executive Directors, at the request ofSeychelles and Surinam, respectively, have extended theperiod during which Seychelles may accept membershipuntil July 5, 1977 42 and the period during which Suri-nam may accept membership until October 6, 1977. Atthe close of the fiscal year, applications for membershipfrom Cape Verde, Maldives, and Sao Tomé and Prin-cipe were under consideration by the Executive Board.
The Sixth and Seventh General Reviews of Quotasare discussed in an earlier section of this chapter.
Executive Directors and Staff
A list of Executive Directors and their voting poweron April 30, 1977 is given in Appendix IV. The changesin membership of the Executive Board during 1976/77are shown in Appendix V.
In the year ended April 30, 1977, there were 111appointments to the Fund's regular staff and 101 separa-tions; the separations included the Secretary of theFund, the Directors of the Administration, African, andWestern Hemisphere Departments and the CentralBanking Service, the Acting Director of the MiddleEastern Department, and the Directors of the Bureauof Language Services and the Office in Geneva. At theend of the fiscal year, the staff numbered 1,373 and wasdrawn from 89 countries. These figures do not includeAdvisors and Assistants to Executive Directors.
Publications
As a memorial to the late J. Marcus Fleming, whohad served as Deputy Director of the Research Depart-ment, the Fund organized a conference on "The NewInternational Monetary System," to which a number ofinternationally distinguished economists were invitedas participants. The seminar was held at the Fund,November 10-12, 1976. The papers delivered at theseminar and selected policy papers by Mr. Fleming arebeing published by the Columbia University Press underthe joint sponsorship of the Fund and Columbia Uni-versity.
The list of publications issued by the Fund in1976/77 is shown in Appendix I, Table I. 19.
42 Seychelles became a member of the Fund on June 30,1977.
71
©International Monetary Fund. Not for Redistribution

This page intentionally left blank
©International Monetary Fund. Not for Redistribution
Appendices
PageI. The Fund in 1976/77 77
List of Tables
1.1. Exchange Rates and Exchange Rate Regimes, June 30, 1977 781.2. Transfers of Special Drawing Rights, January 1, 1970-April 30, 1977 821.3. Summary of Transactions and Operations in Special Drawing Rights,
Fiscal Year Ended April 30, 1977 831.4. Currencies Transferred for Special Drawing Rights, January 1, 1970-
April 30, 1977 861.5. Transfer of Special Drawing Rights by the General Account, Fiscal
Year Ended April 30, 1977 871.6. Purchases of Currencies and Special Drawing Rights from the Fund,
Fiscal Year Ended April 30, 1977 881.7. Repurchases of Currencies from the Fund, Fiscal Year Ended
April 30, 1977 891.8. Fund Stand-By Arrangements for Members, Fiscal Year Ended
April 30, 1977 901.9. Purchases and Repurchases Under the Decision on Compensatory
Financing of Export Fluctuations, February 27, 1963-April 30, 1977 91
1.10. Total Repurchase Obligations Incurred in Accordance withArticle V, Section 7 ( f t ) , and Amounts Payable Forthwith byMembers, as of April 30, 1976 93
1.11. Summary of Members' Purchases and Repurchases, Years EndedApril 30, 1948-77 94
1.12. Summary of Stand-By Arrangements That Became Effective Duringthe Fiscal Years Ended April 30, 1953-77 94
1.13. Status of General Arrangements to Borrow on June 30, 1977 941.14. Currencies Replenished by the Fund in Connection with the First Phase
of Gold Sales Program, Fiscal Year Ended April 30, 1977 951.15. Currencies and Special Drawing Rights Obtained from the Fund by
Members in Purchases for Their Own Currencies; Currencies andSpecial Drawing Rights Used by Members in Repurchases, FiscalYear Ended April 30, 1977 96
1.16. Schedules of Fund Charges 971.17. Income and Expenses, Fiscal Years-Ended April 30, 1960, 1965, 1970,
and 1973-77 981.18. Members That Have Accepted Article VIII, April 30, 1977 991.19. Publications Issued, Fiscal Year Ended April 30, 1977 100
II. Principal Policy Decisions of the Executive Board and Report by theManaging Director 101
73
©International Monetary Fund. Not for Redistribution

APPENDICES
PageA. Buffer Stock Financing Facility: Fifth International Tin Agreement 101B. Subsidy Account: Review of Decision 101
(a) Annual Review and Payment of Subsidy for FiscalYear 1976 101
(b) Annual Review and Payment of Subsidy for FiscalYear 1977 102
C. SDR Reconstitution: Redefinition of Maximum Acquisition 102D. Special Drawing Rights: Transactions by Agreement Between
Participants 103E. Quarterly Review of Rate of Remuneration Under Rule I-10 . . . . 103F. General Arrangements to Borrow: Increase in Amount of Credit
Arrangement for Japan 104G. Sales of Gold 104
(a) Timing of Gold Auctions 104(b) Timing of Sales of Gold for the Purpose of Distribution 104
Option 2 in the Managing Director's Statement with Attach-ment 104
(c) Gold Distribution: Postponement 105H. Transfer of Special Drawing Rights Held in the General Account
to Participants Making Purchases from the Fund 105I. Financial Position of the Fund and Increases in the Fund's Charges 106
I. Application of Rule I-4(c) (ii) : Decreases in Fund's Holdingsof a Currency 106
II. Amendment of Rule I-4(a) : Time for Payment 106III. Amendment of Rule I-4(f)(3)(i) and Rule I-4(g)(4):
Change in Rates of Charge 106IV. Second Amendment, Article XXX(c)(iii): Exclusion of
Purchases Under Oil Facility for Purposes of Definitionof "Reserve Tranche Purchase" 107
J. Surveillance over Exchange Rate Policies 107General Principles 107Principles for the Guidance of Members' Exchange Rate
Policies 108Principles of Fund Surveillance over Exchange Rate Policies 108Procedures for Surveillance 109
K. Attribution of Repurchases Under Article V, Section 7(6) 110L. Allocation of Special Drawing Rights (Article XXIV,
Section 4(c) ) 110Report by the Managing Director to the Board of Governors and
to the Executive Directors 110
III. Press Communiqués and Announcements of the Interim Committeeand the Development Committee 112
Interim Committee of the Board of Governors on the InternationalMonetary System 112
Sixth Meeting, Manila, October 2, 1976 112Seventh Meeting, Manila, October 6, 1976 114Eighth Meeting, Washington, April 29, 1977 114
Joint Ministerial Committee of the Boards of Governors of the Bankand the Fund on the Transfer of Real Resources to DevelopingCountries (Development Committee) 117
Sixth Meeting, Manila, October 3, 1976 117Seventh Meeting, Manila, October 6, 1976 118
74
©International Monetary Fund. Not for Redistribution
APPENDICES
PageIV. Executive Directors and Voting Power on April 30, 1977 120
V. Changes in Membership of Executive Board 123
VI. Administrative Budget 128
VII. Comparative Statement of Income and Expenses 130
VIII. Financial Statements 131Letter of Transmittal 131General Account 132
Report of the External Audit Committee 132Balance Sheet 133Statement of Income and Expenses 134Statement of Reserves 135Statement of Changes in Financial Position 136Notes to the Financial Statements 137
Special Drawing Account 139Report of the External Audit Committee 139Balance Sheet 140Statement of Source and Use of Special Drawing Rights 141
Subsidy Account 142Report of the External Audit Committee 142Statement of Financial Position 143Notes to the Financial Statement 144
Trust Fund 145Report of the External Audit Committee 145Balance Sheet 146Statement of Income and Expenses 147Notes to the Financial Statements 148
Staff Retirement Fund 149Report of the External Audit Committee 149Balance Sheet 150Statement of Changes in Financial Position 151Participants' Account 152Accumulation Account 153Retirement Reserve Account 154Notes to the Financial Statements 155
75
©International Monetary Fund. Not for Redistribution

This page intentionally left blank
©International Monetary Fund. Not for Redistribution

Appendix IThe Fund in 1976/77
The tables in this appendix supplement the information given in Chapter 3 onthe activities of the Fund during the past year. For some aspects of the Fund'soperations, data covering longer periods are included. Apart from Table I.I onexchange rates and exchange rate regimes, Table 1.13 on the status of the GeneralArrangements to Borrow, and Table 1.16 setting out the charges on the use of theFund's resources, the data in the tables do not go beyond April 30, 1977, the endof the Fund's fiscal year.
77
©International Monetary Fund. Not for Redistribution
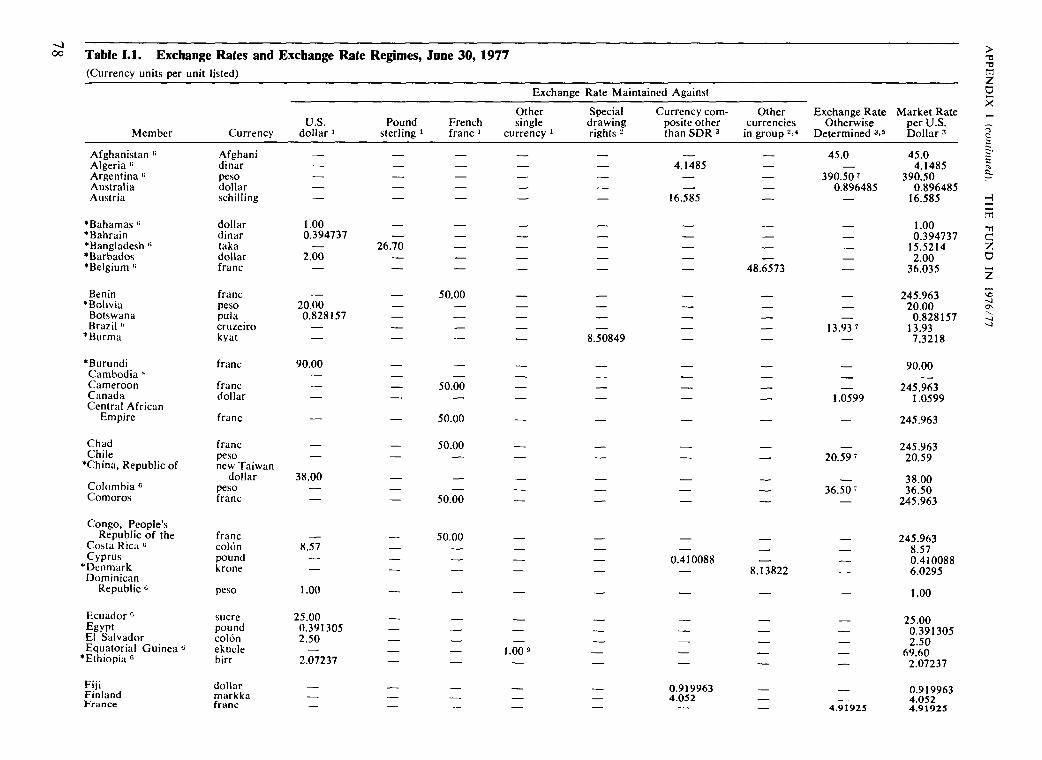
78
Table I.I. Exchange Rates and Exchange Rate Regimes, June 30,1977(Currency units per unit listed)
Member
Afghanistan 6
Algeria 6
Argentina c
AustraliaAustria
*Bahamas °*Bahrain*Bangladesh e
*Barbados*Belgium "
Benin*Bolivia
BotswanaBrazil e
*Burma
*BurundiCambodia 8
CameroonCanadaCentral African
Empire
ChadChile
*China, Republic of
Colombia 6
Comoros
Congo, People'sRepublic of the
Costa Rica °Cyprus
*DenmarkDominican
Republic °
Ecuador °EgyptEl SalvadorEquatorial Guinea e
*Ethiopia 6
FijiFinlandFrance
Currency
Afghanidinarpesodollarschilling
dollardinartakadollarfranc
francpesopulacruzeirokyat
franc
francdollar
franc
francpesonew Taiwan
dollarpesofranc
franccolónpoundkrone
peso
sucrepoundcolónekuelebirr
dollarmarkkafranc
U.S.dollar i
————
1.000.394737
—2.00—
_20.000.828157
——
90.00—
——
—38.00
——
8.57
—
1.00
25.000.3913052.50
2.07237
—
Exchange Rate Maintained Against
Other Special Currency com-Pound French single drawing posite other
sterling * franc a currency г rights 2 than SDR 3
__— — — — 4.1485— — — — —— — ' — — —— — — — 16.585
_ _ _ _ _
— — — —26.70 — — — —
— — — —— — — — —
— 50.00 — — —
— — — 8.50849 —
__ 50.00 — — —
— 50.00 — — —
— 50.00 — — —
_ 50.00 — — —
_ 50.00 — — —
— — — — 0.410088
— • — . — — —
_ _ _ _ _
— — 1.00 9 — —
— — — — 0.919963— — — — 4.052
Other Exchange Ratecurrencies Otherwise
in group 2>4 Determined 3>5
— 45.0
— 390.50 7
— 0.896485— —
48.6573 —
— 13.93 ?
— 1.0599
— —
— 20.59 ?
— 36.50 7
8.13822 —
— —
— —
— —
— 4.91925
Market Rateper U.S.Dollar 3
45.04.1485
390.500.896485
16.585
1.000.394737
15.52142.00
36.035
245.96320.00
0.82815713.937.3218
90.00
245 9631.0599
245.963
245.96320.59
38.0036 50
245.963
245.9638 570^100886.0295
1.00
95 00^j.\j\j0.3913052.50
69.602.07237
0.9199634.0524.91925
AP
PE
ND
IX
I (continued). T
HE
F
UN
D
IN 1976/7:
©International Monetary Fund. Not for Redistribution

GabonGambia, The
*Germany, FederalRepublic of
Ghana s
GreeceGrenada
Guatemala
Guinea °Guinea-Bissau
*Guyana e
HaitiHonduras
IcelandIndiaIndonesia 6
*Iran 6
»Iraq
Ireland 6
»Israel 6
ItalyIvory Coast
»Jamaica s
Japan»Jordan»Kenya
KoreaKuwait
Lao People'sDemocratic Republic
LebanonLesothoLiberia
»Libya
»Luxembourg "MadagascarMalawiMalaysiaMali
MaltaMauritaniaMauritius 6
MexicoMorocco e
»Nepal оО »Netherlands40 New Zealand
francdalasi
deutschemark
cedidrachmaEast
Caribbeandollar
quetzal
sylipesodollargourdelempira
krónarupeerupiahrialdinar
poundpoundlirafrancdollar
yendinarshillingwondinar
kippoundranddollardinar
francfranckwacharinggitfranc
poundouguiyarupeepesodirham
rupeeguilderdollar
— — so.oo —— 4.00 — —
— — — . —1.15385 — — —
— — — ' —
2.70 — — —1.00 — — —
— — — 0.85 «2.55 — — —5.00 — — —2.00 — — —
_____ — __ __
— — — —415.00 — — —— — — —0.296053 — — —
— 1.00 — —— — — —— — — —— — 50.00 —
0.909091 — — —
— — — —— — — —485.00 — — —
200.00 — — —— — —— — — 1.00"
1.00 — — —0.296053 — — —
— — 50.00 —
— — —— — 100.00 —
_ _ _ _.
— — — . .. , —
12.50 — — —
— — — — 245.963— — — - 2.3253
_ — 3.15665 — 2.338— — — — , 1.15385_ — — 37.012 37.012
_ _ — — 2.70_ — — — 1.00
24.6853 — — — 21.2004_ — — — 32.831_ _ — — 2.55_ — — — 5.00_ — — — 2.00
_ — — 194.75 194.75— 8.83619 — — 8.83619_ _ — — 415.00
82.2425 — — — 70.625_ — — — 0.296053
_ _ — — 0.581327_ — — 9.3928 7 9.3928_ — — 884.775 884.775_ — — — 245.963_ — — — 0.909091
_ — — 267.70 267.700.387755 — — — 0.3300009.66 — — — 8.31
_ — — — 485.00— 0.2874 — — 0.2874
_ _ — — 200.00— — — 3.085 3.085_ _ — — 0.869565_ — — — 1.00— — — — 0.296053
_ _ 48.6573 — 36.035_ _ — — 245.963
1.05407 — — — 0.905264— 2.4851 — — 2.4851_ — — — 491.925
— 0.425314 — — 0.425314— 46.17 — — 46.17
7.713759 — — — 6.62479_ — — 22.9949 22.9949— 4.48105 — — 4.48105
— 12.50— — 3.35507 — 2.4725— 1.03306 — — 1.03306
AP
PE
ND
IX
I (continued). T
HE
FU
ND
IN
1976/77
©International Monetary Fund. Not for Redistribution

ooО Table I.I (concluded). Exchange Rates and Exchange Rate Regimes, June 30, 1977
(Currency units per unit listed)
Exchange Rate Maintained Against
Member
NicaraguaNiger
Nigeria*Norway*Oman»Pakistan
Panama
Papua New GuineaParaguay °Peru ePhilippinesPortugal
Qatar i :i
Romania a
*RwandaSaudi Arabia '"Senegal
Seychelles
Sierra LeoneSingapore
*Somalia G
South Africa "
SpainSri Lanka °Sudan (l
Swaziland*Sweden
Syrian Arab Republic*Tanzania*ThailandTogoTrinidad and Tobago
TunisiaTurkey K
*Uganda*United Arab Emirates
United Kingdom G
United StatesUpper VoltaUruguay о
Currency
córdobafranc
nairakronerial Omanirupeebalboa
kinaguaranísolpesoescudo
riyalleufrancriyalfranc
Seychellesrupee
leonedollarshillingrand
pesetarupeepoundlilangenikrona
poundshillingbahtfrancdollar
dinarlirashillingdirhampound
dollarfrancnew peso
Other SpecialU.S. Pound French single drawing
dollar 1 sterling г franc 1 currency J rights 2
7.00 — — — —— — 50.00 — —
0.345395 — — — —9.90 — — — —1.00 — — — —
— — • — 0.882223 12 —126.00 — . — • — —
— — — — 4.7619012.00" — — — —92.84 — — — —
— — — — 4.28255— — 50.00 — —
— 13.33 — — —— 2.00 — — —
6.23270 — — — —0.869565 — — . — —
0.348242 — — — —— — — 1.00" —
3.925 — _ _ _— — — '. ' — 9.66
20.00 — — — _— . — . 50.00 — —
2.40 — — _ _
— — . — — 9.663.94737 _ • _ • _ _
— — 50.00 — —
Currency com- Other Exchange Rateposite other currencies Otherwisethan SDR 3 in group 2>4 Determined s,s
— — —
— — 01651380— 7.15551 —
— — 79.3651 •>— — 7.396
38.625 — —
— — —
2.4644 — —
_ _ 69.607.27821 — —
— 5.91118 —
— . — —
0.426794 — —— — 17.675
— — 0.581327
— — 1.000
— — 4.62 *
Market Rateper U.S.Dollar 3
7.00245.963
0.6513805.3150.3453959.901.00
0.79090126.0079.3651
7.39638.625
3.9559Í12.0092.84
3.53245.963
7.7491.16272.46446.232700.869565
69.607.278210.3482420.8695654.3985
3.9258.29628
20.00245.963
2.40
0.42679417.6758.313083.947370.581327
1.000245.963
4.62
AP
PE
ND
IX
I (continued). T
HE
F
UN
D
IN
1976/77
©International Monetary Fund. Not for Redistribution
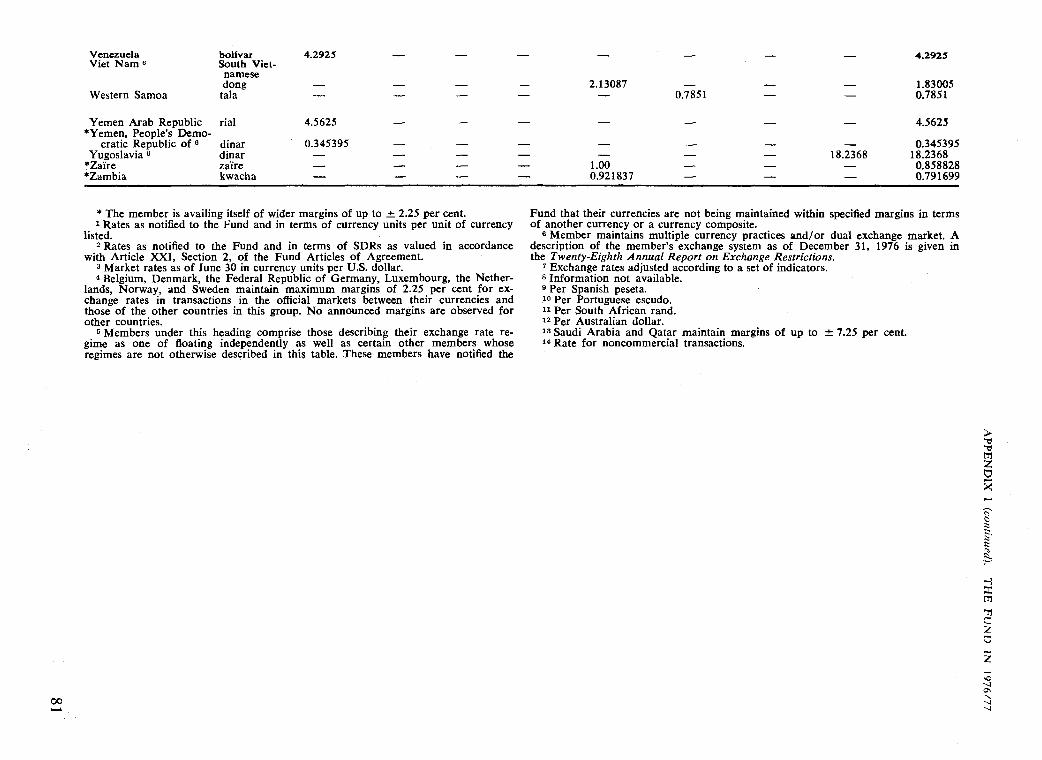
Venezuela bolivarViet Nam 6 South Viet-
namesedong
Western Samoa tala
Yemen Arab Republic rial*Yemen, People's Demo-
cratic Republic of 6 dinarYugoslavia 6 dinar
*Zaïre zaïre*Zambia kwacha
4.2925 — — —
4.5625 — — —
0.345395 — — —
2.13087 —— 0.7851
1.00 —0.921837 —
— — 4.2925
— — 1.83005— — 0.7851
— — 4.5625
_ _ 0.345395— 18.2368 18.2368— — 0.858828_ _ 0.791699
* The member is availing itself of wider margins of up to ± 2.25 per cent.1 Rates as notified to the Fund and in terms of currency units per unit of currency
listed.2 Rates as notified to the Fund and in terms of SDRs as valued in accordance
with Article XXI, Section 2, of the Fund Articles of Agreement.3 Market rates as of June 30 in currency units per U.S. dollar.4 Belgium, Denmark, the Federal Republic of Germany, Luxembourg, the Nether-
lands, Norway, and Sweden maintain maximum margins of 2.25 per cent for ex-change rates in transactions in the official markets between their currencies andthose of the other countries in this group. No announced margins are observed forother countries.
5 Members under this heading comprise those describing their exchange rate re-gime as one of floating independently as well as certain other members whoseregimes are not otherwise described in this table. These members have notified the
Fund that their currencies are not being maintained within specified margins in termsof another currency or a currency composite.
6 Member maintains multiple currency practices and/or dual exchange market. Adescription of the member's exchange system as of December 31, 1976 is given inthe Twenty-Eighth Annual Report on Exchange Restrictions.
7 Exchange rates adjusted according to a set of indicators.8 Information not available.9 Per Spanish peseta.10 Per Portuguese escudo.11 Per South African rand.12 Per Australian dollar.13 Saudi Arabia and Qatar maintain margins of up to ± 7.25 per cent.14 Rate for noncommercial transactions.
81
AP
PE
ND
IX I (continued}.
TH
E
FU
ND
IN
1976/77
©International Monetary Fund. Not for Redistribution

APPENDIX I (continued). THE FUND IN 1976/77
Table 1.2. Transfers of Special Drawing Rights, January 1, 1970-April
(In millions of SDRs)
30, 1977
Jan 1, 1970-Apr. 30, 1970
Transfers betweenparticipants
Transactions withdesignation 155
Transactions withoutdesignation 20
ITS
General AccountTransfers from
participantsRepurchases (net) 183Charges (net) 29Assessments 1Interest received on
General Accountholdings —
213
Transfers toparticipants
Purchases —Reconstitution —Replenishment of
participants'currencies —
Remuneration —Distribution of net
income —Restoration of
participants'holdings l —
Interest on Fundborrowings —
Other 2 _
—Total transfers 388
General Accountholdings at end ofperiod 213
riscal i ears c.nueu лрги ju
1971
348
286
633
35766
1
4
429
——
12318
9
—
—1
151
1,213
490
1972
267
380
647
50130
1
7
540
—46
2115
8
29
——
120
1,307
910
1973
117
303
420
6830
1
10
108
292107
—2
—
—
——
401
929
617
1974
60
996
1,056
2929
1
8
67
7157
—20
—
—
——
185
1,308
499
1975
440
249
688
2492
1
21
ÏÏ8
4117
—6
—
—
——
127
953
510
1976
292
176
468
440354
2
21
817
443404
—10
—
—8
—865
2,150
461
1977
119
317
436
73709
1
23
805
25445
—24
—
- —
——
495
1,736
771
Total
Jan 1 1970-Apr. 30, 1977
1,797
2,727
4,524
1,6751,339
8
95
3,117
7711,277
14496
17
29
81
2,345
9,986
771
1 Under Article XXV, Sections 2(b) (ii) and 7(e).2 Under Article XXVI, Section 5.
82
©International Monetary Fund. Not for Redistribution

Table 1.3. Summary of Transactions and Operations in Special Drawing Rights, Fiscal Year Ended April 30,1977 *(In thousands of SDKs)
oou>
Transactions and Operations
Between participants
Received Bel
TTnlHinoc nn Thrnncrb
Participants April 30, 1976 designation Other Used
AfghanistanAlgeriaArgentinaAustraliaAustria
BangladeshBarbadosBelgiumBeninBolivia
BotswanaBrazilBurmaBurundiCambodia
CameroonCanadaCentral African EmpireChadChile
ColombiaCongo, People's Republic of theCosta RicaCyprusDenmark
Dominican RepublicEcuadorEgyptEl SalvadorEquatorial Guinea
FijiFinlandFranceGabonGambia, The
Germany, Federal Republic ofGhanaGreeceGrenadaGuatemala
GuineaGuyana
5,26043,04843,71040,08395,846
15,6542,767
563,303 165,9444,4456,990
1,568170,734
7,137 1,1243,094
328
9,945478,867 6,308
2,0312,147
46,055 26,514
18,918 5,0002,0613,001 3,7329,799
81,886 8,340
6,220 1,0006,0977,7873,748 2,0001,773
1,32965,020
184,294 35,0004,6191,998 1,500
1,632,668 155,424 142,0395,992 4,832
13,410 7,23956
11,440
2,8533,649
Positions at April 30,
tween participants andhe General Account
Received
80
50,763
9,554
2201,166
1,218
9,989
405
1,000164
23,523940
437,557
500
2,65010,355
77
28318
Used
4331
21,8585,429
12,3821812
112
1,63982
1,64114
560345
27,904
442,3542,572
490
7,633881
12,509
18
2,65413,720
62
372256
Interest,Charges, andAssessment
(Net)
-294+ 101
-3,081-7,238
+724
+ 6351
+9,7761
-226
+ 690-521-136-315
-54+4,578
-101—95
— 271
-1,261— 92
-343— 18+ 38
-326— 192
-1,939-276-36
2-109
-10,505-7
-25
+ 43,714— 846
-1,179+ 3
-18
— 211-124
Holdings
4,61443,14869,53427,41696,570
13,4612,748
407,1234,4456,652
1,567171,644
7,2672,877
14
8,249478,342
1,3701,707
54,383
23,0621,9254,0367,209
90,263
5,4046,070
21,7395,5311,736
1,32652,446
216,3464,612
956
1,689,7689,974
16,10574
11,422
2,5523,287
1977
Holdings asNet per cent of net
cumulative cumulativeallocations allocations
12,75340,290
152,520225,645
76,745
2,769209,346
4,44912,753
1,569152,52020,844
6,5678,517
10,513358,620
4,3654,449
54,654
54,4414,449
11,0168,898
82,764
14,53511,22965,24411,6552,712
1,37861,470
484,9804,7912,331
542,40030,12346,194
11,868
8,3046,780
36.2107.145.612.1
125.8
99.3194.599.952.2
99.9112.534.943.8
0.2
78.5133.431.438.499.5
42.443.336.681.0
109.1
37.254.133.347.564.0
96.385.344.696.341.0
311.533.134.9
96.2
30.748.5
>•oЧЭWZ
X
~s5.S"
iHасгпTIСZо
\D~*JOs\-J-̂ J
©International Monetary Fund. Not for Redistribution

оо•**• Table 1.3 (concluded). Summary of Transactions and Operations in Special Drawing Rights, Fiscal Year Ended April 30, 19771
(In thousands of SDKs)
Transactions and Operations
Between participants
Received
Holdings on ThroughParticipants April 30, 1976 designation Other
HaitiHondurasIceland
IndiaIndonesiaIranIraqIreland
IsraelItalyIvory CoastlamaicaJapan
JordanKenyaKoreaLao People's Democratic RepublicLesotho
LiberiaLuxembourgMadagascarMalawiMalaysia
MaliMaltaMauritaniaMauritiusMexico
MoroccoNepalNetherlandsNew ZealandNicaragua
NigerNigeriaNorwayOmanPakistan
PanamaPapua New GuineaParaguay
1,7993,5244,054
198,516 20,2983,892 2,000
61,322 4,50027,97744,947
4,621 9,971111,649
14,054357 3,000
446,337
7,3781,6253,106 2,000 11,9381,492
496
3,521 367,339
348 1,2504,501
65,714
2,6065,0871,5632,509
85,568 45,802
13,3582,202
531,3475,7364,145 1,000
4,38761,15789,455
74245,080
6,5501,8336,564
Positions at April 30,
Between participants andthe General Account
Used Received
1,500
1,153
6,11111
374
10,000161,128
2,7264,500 13,511
13,904
5,00010,979
135
2,000
250
33759
158186
83,298 182
12
33,000
32,678
7131
Used
9821,1543,348
31,384
2
15,117152,327
2,6992,856
5,22720,668
232
983263
41,237
147
589
5,291
4,287152
21,095825
42,709
1,9081,248
Interest,Charges, andAssessment
(Net)
-196-216-183
-5,296-3,242
+ 35+ 180+ 229
-1,377-8,986
-99-571
+3,108
-9-494-621-114-41
-232-1
-292-28
+ 167
-187+2
— 121-184
-2,781
-1,0703
+ 11,277-2,206
-204
— 3+ 593+ 495
— 2,154
-261+72
1
Holdings
2,1212,1531,676
182,1348,761
65,85628,15845,550
8,098111,465
8,5298,942
463,349
7,369903
6,7341,281
454
3,3257,3392,3234,210
24,894
2,6095,1471,0112,511
40,182
8,0002,058
542,62415,4364,115
4,38461,75089,950
74132,895
4,3811,3696,564
1977
Holdings asNet per cent of net
cumulative cumulativeallocations allocations
6,5678,5177,419
326,22090,15661,89623,21739,213
42,810318,000
14,26817,673
377,400
7,58715,60022,230
4,4491,569
9,5377,3458,7305,085
60,618
7,5425,0884,4497,374
124,170
39,1892,215
236,46069,402
8,943
4,44945,55576,320
74281,639
12,372
6,567
32.325.322.6
55.89.7
106.4121.3116.2
18.935.159.850.6
122.8
97.15.8
30.328.829.0
34.999.926.682.841.1
34.6101.2
22.734.032.4
20.492.9
229.522.246.0
98.5135.6117.999.940.3
35.4
100.0
LL
/9L
61
NI
СШ
ГЫ
НИ
Х
'(рэ
пщщ
оэ)
\ x
idN
Hd
dV
©International Monetary Fund. Not for Redistribution

PeruPhilippines
PortugalRomaniaRwandaSenegalSierra Leone
SomaliaSouth AfricaSpainSri LankaSudan
SwazilandSwedenSyrian Arab RepublicTanzaniaThailand
TogoTrinidad and TobagoTunisiaTurkeyUganda
United KingdomUnited StatesUpper VoltaUruguayVenezuela
Viet NamWestern SamoaYemen Arab RepublicYemen, People's Democratic
Republic ofYugoslavia
ZaïreZambia
Total Participants
General Account
Total1 This table does not include
6,43 1 2,80621,273
6,21314,7212,2292,526 2,7263,645
4,27146,194
116,470 5,00011,6772,258 4,347
943106,995
6,9351,555 3,297
29,583
5,0817,191 1,5009,965
22,802 16,2892,285
675,3112,020,687 40,500
4,425789
125,952
19,742 19,00019
2,129
3,41724,649 2,000 3,450
31,035 8,00014,501 2,900 1,500
8,853,989 118,798 317,017 435,815
460,847
9,314,835 118,798 317,017 435,815
those participants that did not receive allocations andpublic of China, the Comoros, and Guinea-Bissau.
oo
2,18912,409
9,2003,132
205
519
8,9111,100
36
10,141
521
470
6,750
15,342
5,000128
2,422
1,9598,820
503,135
789,402
1,292,537
7,14519,676
9,9517,716
1,8231,018
8,14341,128
7,8406,738
1674,936
994
146
20,4411,861
124,458
12,421
20681
2,13222,250
8,4356,968
789,402
503,135
1,292,537
do not presently hold SDRs.
— 1,374— 1,338
+ 346+528-162-358-181
-89-1,771-1,143
-869-934
-68-12
-395— 343+20
-3-513-184
-1,256-481
-15,004-9,943
— 1-828+ 512
-376—7
— 256-2,155
-459-285
— 23,981
+ 23,981
—
2,90712,667
5,80810,6652,2723,0712,446
4,18236,79979,20011,880
33
875107,019
6,3739,715
28,608
4,9318,6999,782
17,394413
542,5992,051,245
4,4242,883
126,464
5,16058
2,128
3,4515,693
16,10117,468
8,543,742
771,094
9,314,835
These participants are the
40,47951,495
6,56711,4427,845
6,56788,920
126,13533,97824,912
2,712107,02517,03414,32228,542
5,08520,81114,71350,30713,896
1,006,3202,293,980
4,44923,937
112,290
19,758212
2,130
9,87369,291
39,18924,588
9,314,835
9,314,835
Bahamas, Bahrain
7.224.6
34.626.831.2
63.741.462.835.0
0.1
32.2100.037.467.8
100.2
97.041.866.534.63.0
53.989.499.412.0
112.6
26.127.599.9
35.08.2
41.171.0
, the Re-
LL
/9L
61
N1
С
ШГ
Ы
HH
1
'(рэ
пи
ци
оэ)
I X
IdN
3d
dV
©International Monetary Fund. Not for Redistribution
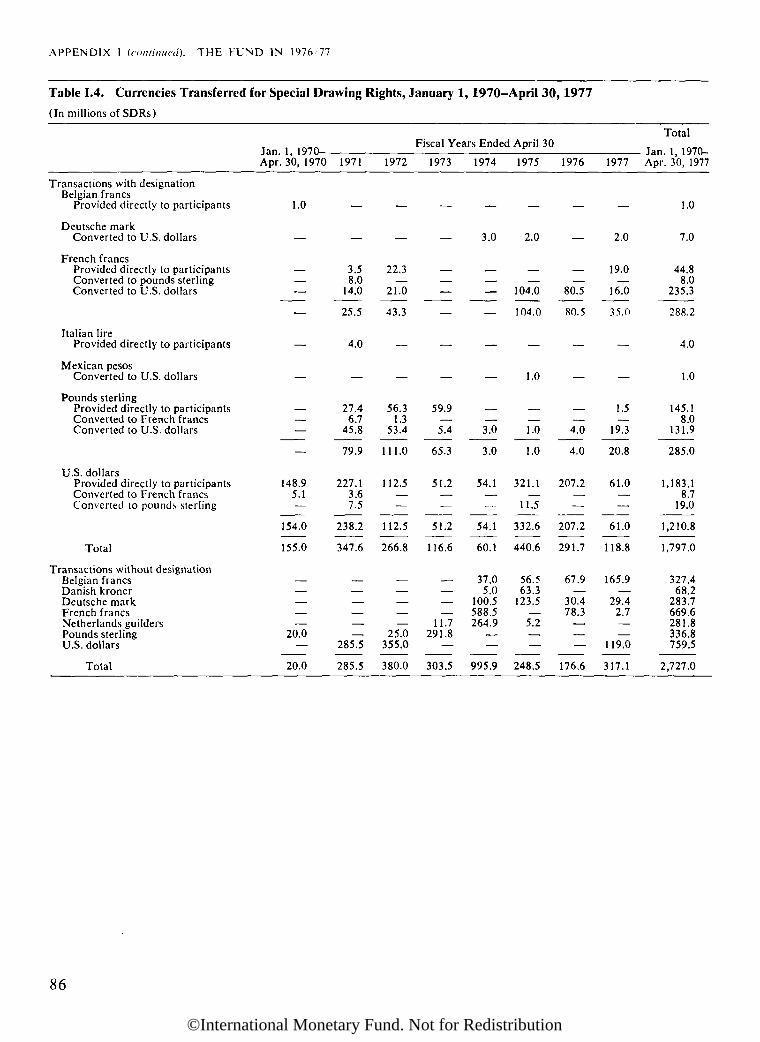
APPENDIX I (continued). THE FUND IN 1976/77
Table 1.4. Currencies Transferred for Special Drawing Rights, January 1, 1970-April 30, 1977
(In millions of SDKs)
Transactions with designationBelgian francs
Provided directly to participants
Deutsche markConverted to U.S. dollars
French francsProvided directly to participantsConverted to pounds sterlingConverted to U.S. dollars
Italian lireProvided directly to participants
Mexican pesosConverted to U.S. dollars
Pounds sterlingProvided directly to participantsConverted to French francsConverted to U.S. dollars
U.S. dollarsProvided directly to participantsConverted to French francsConverted to pounds sterling
Total
Transactions without designationBelgian francsDanish kronerDeutsche markFrench francsNetherlands guildersPounds sterlingU.S. dollars
Total
Jan. 1, 1970--Apr. 30, 1970
1.0
—
—
—
—
—
—
148.95.1
154.0
155.0
20.0
20.0
Fiscal Years Ended April 30
1971
—
3.58.0
14.0
25.5
4.0
27.46.7
45.8
79.9
227.13.67.5
238.2
347.6
285.5
285.5
1972
—
22.3
21.0
43.3
—
56.31.3
53.4
111.0
112.5
112.5
266.8
25.0355.0
380.0
1973
—
—
—__
—
59.9
5.4
65.3
51.2
51.2
116.6
11.7291.8
303.5
1974
3.0
—
—
—
3.0
3.0
54.1
54.1
60.1
37.05.0
100.5588.5264.9
995.9
1975
2.0
104.0
104.0
—
1.0
1.0
1.0
321.1
11.5
332.6
440.6
56.563.3
123.5
5.2
248.5
1976
—
80.5
80.5
—
4.0
4.0
207.2
207.2
291.7
67.9
30.478.3
176.6
1977
2.0
19.0
16.0
35.0
—
.
1.5
19.3
20.8
61.0
61.0
118.8
165.9
29.42.7
119.0
317.1
Total
- Jan. 1, 1970-Apr. 30, 1977
1.0
7.0
44.88.0
235.3
288.2
4.0
1.0
145.18.0
131.9
285.0
1,183.18.7
19.0
1,210.8
1,797.0
327.468.2
283.7669.6281.8336.8759.5
2,727.0
86
©International Monetary Fund. Not for Redistribution

APPENDIX I (continued). THE FUND IN 1976/77
Table 1.5. Transfer of SpecialEnded April 30, 1977
(In thousands of SDKs)
AfghanistanArgentinaBangladeshBrazilBurma
CanadaChileColombiaDominican RepublicEcuador
EgyptEl SalvadorFinlandFranceGambia, The
GhanaGreeceGrenadaGuineaHaiti
IcelandIndonesiaIranIraqIreland
IsraelItalyJamaicaJapanKenya
KoreaLao People's Democratic RepublicMadagascarMalaysiaMali
MaltaMauritaniaMauritiusMexicoNew Zealand
Pakistan .Papua New GuineaParaguayPeruPhilippines
PortugalRomaniaRwandaSouth AfricaSri Lanka
SudanTanzaniaTrinidad and TobagoUgandaUruguay
Viet NamWestern Samoa
Drawing Rights by
Reconstitution
8050,364
— —
1,166
9,989405——
23,523940
——
2,65010,355
2831,500
1,1535,948
———
10,000161,12813,511
—5,000
10,956135
2,000—337-
158186
33,000
32,678
——2,189
12,240
205
8,911
1,10010,141
521470
15,342
5,000128
the General Account,
Payment ofRemuneration
—220
—1,218
———164
—437,419
—
————
16311
374
, ._
13,904—
——250
—59
182—
1
—
—_
106—
—
Fiscal Year
Purchases
——9,500
————1,000
—
—
—500
——76——
————
———
————
„
—
713
—9,2002,995
—
—
Yemen, People's Democratic Republic of 2,422 — —ZaïreZambia
Total
1,8577,299
445,273
—
24.1081
1,500
25,4851 Includes amounts of less than SDR 500 each paid to an additional 15 participants.
87
©International Monetary Fund. Not for Redistribution

APPENDIX I (continued). THE FUND IN 1976/77
Table 1.6. Purchases of Currencies and Special Drawing Rights from the Fund, Fiscal Year Ended April 30, 1977(In millions of SDKs)
MemberPurchasing
ArgentinaAustraliaBahrainBangladeshBarbadosCameroonChadChileCongo, People's Rep.
of theCosta RicaCyprusDominican Rep.EcuadorEgyptFinlandGambia, TheGermany, Fed. Rep. ofGreeceGrenadaGuyanaHaitiIsraelJamaicaKenyaKoreaLao People's Dem. Rep.LiberiaMalaysiaMauritaniaMexicoMoroccoNepalNew ZealandPakistanPanamaPapua New GuineaPeruPhilippinesPortugalRomaniaSierra LeoneSouth AfricaSri LankaSudanTanzaniaThailandTogoTurkeyUnited KingdomViet NamWestern SamoaYemen, People's Dem.
Rep. ofYugoslaviaZaïreZambia
Total
WithinGold
Tranche
—5.00
——
———
2.03*
———17.56
——
1.748.34
——5.00
—————
—4.56
——97.77
—3.11————————
—————
————15.506
—
————
160.61
Within Credit Tranches
Understand-by
arrangements Other 1
159.50 —
— ——21.50 —
— ——— ——
— —— —— —— 15.00
— —— —— —
— —— —0.23 —
7.25 —3.00 —
12.00 —
— —— —9.00 —
— —— —— —— —— 134.12
— —4.50 —
— —— —— ——— —— —— —55.00 —
— —189.00 —
— —— —— 4.70
—— —— —1,700.00 —
— —— —— 5.76
— —40.96 —8.50 —
2,210.43 159.59
Under Decision on
Com-pensatoryfinancing
332.50
20.00 33.50
17.506.50
79.00
6.50
—13.0021.50
—94.00
—3.50
—58.00
—10.00
65.0026.5024.0040.00
3.25
—93.00
—185.00
—50.5099.50 318.0010.0061.50
—58.50
—5.50160.00
15.8026.70
—67.007.50
——31.00
1.00
3
——38.00
1,752.75«
ExtendedFund
facility
_
—
——
——
—————
————
—————
——
——100.00
—————
—90.00
——
———
——
————
—
————
190.00
Oilfacility
—
14.69—
4.28
—
—6.837.97
——11.49
115.11
————
———3.10
————1.93—
18.00
——————55.16
——
———————91.49———
7.4256.1532.5310.79
436.94
TotalPurchases
159.50332.50
5.0056.19
3.5021.786.50
79.00
8.536.83
20.9736.5017.56
105.49115.11
5.248.34
58.000.23
22.253.00
77.0026.5027.1049.003.254.56
93.001.93
516.9018.007.60
50.5099.5018.0010.0061.50
145.1658.5055.00
5.50349.00
15.8026.704.70
67.007.50
91.491,700.00
46.501.00
13.1856.1573.4957.29
4,910.33
Under the Non-Oil Facilities
Currencies
159.50332.50
5.0032.00
3.5017.506.50
79.00
8.53—
13.0035.5017.5694.00
—4.748.34
58.000.15
22.251.50
67.0024.5019.0049.00
3.254.56
93.00
—516.90
7.6050.5089.5018.00
9.2961.5090.0049.3052.015.50
349.0015.8026.70
—67.00
7.50
—1,700.0041.50
0.89
5.76
—40.9639.88
4;404.46
Specialdrawingrights "_
—
9.50—
——
—1.00*———
0.50*
——0.08—
1.50510.0052.0055.005
—
—————
. —
—10.005
—0.71
——9.20
2.99
—
—4.70s
——
—5.0050.11 5
—
——6.62^
68.92
Total
159.50332.50
5.0041.50
3.5017.506.50
79.00
8.53
—13.0036.5017.5694.00
—5.248.34
58.000.23
22.253.00
77.0026.5024.0049.00
3.254.56
93.00
—516.90-_
7.6050.5099.5018.0010.0061.5090.0058.5055.00
5.50349.00
15.8026.70
4.7067.007.50
—1,700.0046.50
1.00
5.76
—40.9646.50
4,473.39
4n accordance with Executive Board Decision No. 102-(52/ll),adopted February 13, 1952. (See Selected Decisions of the InternationalMonetary Fund and Selected Documents (Eighth Issue, Washington, 1976),pages 37-40.)
2 In accordance with Article XXV, Section 7(/), of the Articles ofAgreement.
3 In addition, the following amounts purchased within credit tranchesduring the fiscal year 1975/76 totaHng the equivalent of SDR 39.56 millionwere reclassified as having been made under the compensatory financingdecision: Bangladesh—SDR 19.06 million, Pakistan—SDR 18 million, andthe People's Democratic Republic of Yemen—SDR 2.5 million.
4 In accordance with Executive Board Decision No. 5355-(77/36) G/S,adopted March 15, 1977 and reproduced in Appendix II.
E In accordance with Executive Board Decision No. 3457-(71/121) G/S,as amended. (See Selected Decisions, pages 173-74.)8 Transaction prior to the establishment of an initial par value inaccordance with Executive Board Decision No. 1687-(64/22), adoptedApril 22, 1964. (See Selected Decisions, page 88.)
7 Of which, SDR 1.5 million was purchased in accordance with ExecutiveBoard Decision No. 5355-(77/36) G/S, adopted March 15, 1977 and re-produced in Appendix II. and SDR 5.12 million in accordance with Ex-ecutive Board Decision No. 3457-(71/121) G/S, as amended. (See Selec-ted Decisions, pages 173-74.)
ooOO
©International Monetary Fund. Not for Redistribution
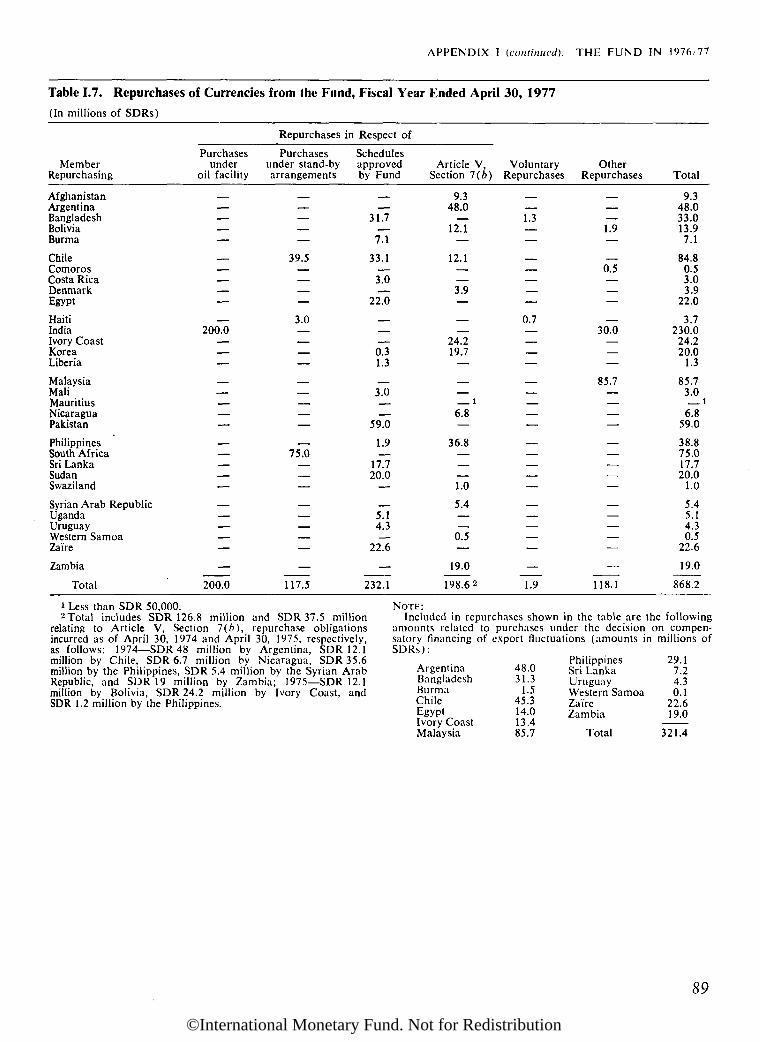
APPENDIX I (continued). THE FUND IN 1976/77
Table 1.7. Repurchases of Currencies from the Fund, Fiscal Year Ended April 30, 1977(In millions of SDKs)
Repurchases in Respect of
MemberRepurchasing
AfghanistanArgentinaBangladeshBoliviaBurma
ChileComorosCosta RicaDenmarkEgypt
HaitiIndiaIvory CoastKoreaLiberia
MalaysiaMaliMauritiusNicaraguaPakistan
PhilippinesSouth AfricaSri LankaSudanSwaziland
Syrian Arab RepublicUgandaUruguayWestern SamoaZaïre
Zambia
Total
Purchasesunder
oil facility
————
————„_
200.0
———
—————
—————————
—200.0
Purchasesunder stand-byarrangements
————
39.5
———
3.0
———
————
75.0
—
————
—
117.5
Schedulesapprovedby Fund
-
—31.7
—7.1
33.1- —3.0
—22.0
—0.31.3
3.0
——59.0
1.9—17.7
20.0
—_ _5.14.3—22.6
—232.1
Article V,Section 7(6)
9.348.0
—12.1—
12.1
——3.9—
24.219.7
—
— i6.8—
36.8——
—1.0
5.4——0.5—
19.0
198.62
VoluntaryRepurchases
—1.3——
———
0.7
———
————
————
—————
—
1.9
OtherRepurchases
——1.9—
0.5———
30.0—
- ——
85.7——————_ — .
————— .——
—
118.1
Total
9.348.033.013.97.1
84.80.53.03.9
22.0
3.7230.024.220.0
1.3
85.73.0
i6.8
59.0
38.875.017.720.0
1.0
5.45.14.30.5
22.6
19.0
868.2
1 Less than SDR 50,000. NOTE:2 Total includes SDR 126.8 million and SDR 37.5 million Included in repurchases shown in the table are the following
relating to Article V, Section l(b), repurchase obligations amounts related to purchases under the decision on compen-incurred as of April 30, 1974 and April 30, 1975, respectively, satory financing of export fluctuations (amounts in millions ofas follows: 1974—SDR 48 million by Argentina, SDR 12.1 SDRs):million by Chile, SDR 6.7 million by Nicaragua, SDR 35.6 Philippines 29.1million by the Philippines, SDR 5.4 million by the Syrian Arab Argentina 48.0 Sri Lanka 7.2Republic, and SDR 19 million by Zambia; 1975—SDR 12.1 Bangladesh 31.3 Uruguay 4.3million by Bolivia, SDR 24.2 million by Ivory Coast, and Burma 1.5 Western Samoa 0.1SDR 1.2 million by the Philippines. chlle 45-3 Zaïre 22.6
Egypt 14.0 Zambia 19.0Ivory Coast 13.4Malaysia 85.7 Total 321.4
89
©International Monetary Fund. Not for Redistribution

APPENDIX I (continued). THE FUND IN 1976/77
Table 1.8. Fund Stand-By Arrangements for Members, Fiscal Year Ended April 30, 1977(In millions of SDKs)
Total Numberof Stand-Bys
Approved Date ofMember for Member Inception
AfghanistanArgentinaBangladeshBurundi
Congo, People'sRep. of the
Costa RicaEgyptFinland
Grenada
Guyana
Haiti
Israel
ItalyKoreaLiberiaNepal
PakistapPanama
PhilippinesPortugal
RomaniaSouth Africa
TanzaniaUnited Kingdom
Uruguay
Western Samoa
Zaïre
Zambia
Total
6827
1633
2
10
16
3
211121
710
131
14
111
8
2
3
2
July 16, 1975Aug. 6, 1976July 28, 1975June 5, 1976
Jan. 1, 1977July 23, 1976Apr. 20, 1977June 4, 1975
Sept. 29, 1975June 30, 1976June 18, 1975June 18, 1976Aug. 1, 1975Aug. 2, 1976Oct. 20, 1976
Apr. 25, 1977Oct. 22, 1975Jan. 14, 1976Feb. 18, 1976
Mar. 9, 1977Nov. 8, 1975Apr. 6, 1977May 31, 1975Apr. 25, 1977
Oct. 3, 1975Jan. 21, 1976Aug. 6, 1976Aug. 21, 1975Dec. 31, 1975Jan. 3, 1977
May 9, 1975Aug. 4, 1976Nov. 12, 1975Jan. 31, 1977Mar. 22, 1976Apr. 25, 1977July 30, 1976
Date ofExpiration
July 15, 1976Aug. 5, 1977July 27, 1976Mar. 31, 1977
Dec. 31, 1977July 22, 1977Apr. 19, 1978June 3, 1976
Sept. 28, 1976 iDec. 31, 1976June 17, 1976June 17, 1977July 31, 1976Aug. 1, 1977Oct. 19, 1977
Dec. 31, 1978June 30, 1976Jan. 13, 1977Feb. 17, 1977
Mar. 8, 1978Nov. 7, 1976Apr. 5, 1978May 30, 1976 2Apr. 24, 1978
Oct. 2, 1976Jan. 20, 1977 3
Aug. 5, 1977Aug. 20, 1976Dec. 30, 1976Jan. 2, 1979
May 8, 1976Aug. 3, 1977Nov. 11, 1976Jan. 30, 1978Mar. 21, 1977Apr. 24, 1978July 29, 1977
AmountApproved1975/76
8.50
62.50
95.00
0.50
5.00
4.75
20.005.004.50
9.00
29.06
95.0080.00
10.50700.00
17.25
0.50
40.96
1,188.02
Amount Not Amount Amount NotPurchased at Approved PurchasedExpiration 1976/77 April 30, 1977
__
95.00
5.00
1.50
11.005.00
—
9.00
—
—10.50
—
12.95
—
—
149.95
260.00
6.50
4.7011.60
125.00
0.23
7.25
6.8829.25
450.00
80.00
11.25
42.40
152.00
3,360.00
25.00
0.59
45.0062.00
4,679.64
100.50
4.7011.60
125.00
—
—
3.8817.25
450.00
80.00
11.25
42.40
38.00
2,360.00
25.00
0.59
45.0053.50
3,368.671 Canceled as of June 30, 1976.2 Canceled as of April 1, 1976.3 Canceled as of August 6, 1976.
90
©International Monetary Fund. Not for Redistribution

APPENDIX I (continued). THE FUND IN 1976/77
Table 1.9. Purchases and Repurchases Under the Decision on Compensatory Financing of Export Fluctuations,February 27, 1963-April 30, 1977 !(In millions of SDKs)
PurchasesMember
AfghanistanArgentina
AustraliaBangladesh
BarbadosBrazilBurma
BurundiCambodia
CameroonCentral African EmpireChadChile
Colombia
Congo, People's Rep. of the
CyprusDominican Republic
Ecuador
Egypt
El SalvadorGambia, TheGhanaGreeceGuatemala
GuineaGuyana
Haiti
Iceland
India
IraqIsraelIvory CoastJamaica
Jordan
KenyaKoreaLao People's Dem. Rep.
Malaysia
MauritaniaMexico
DateJune 5,Mar. 3,Dec. 23,Mar. 30,July 8,Dec. 15,Aug. 2,Aug. 5,Jan. 3,June 7,Nov. 21,Sept. 21,Feb. 1,June 9,Mar. 14,Apr. 18,July 6,Feb. 3,Aug. 2,Dec. 14,Dec. 22,June 9,Mar. 22,Apr. 19,Apr. 19,Feb. 4,Feb. 7,May 3,Dec. 6,Sept. 23,Oct. 15,Oct. 15,Oct. 15,Mar. 18,Aug. 14,June 16,Dec. 16,Mar. 30,Dec. 20,Sept. 13,Feb. 5,Feb. 5,Mar. 26,Mar. 26,Dec. 16,Aug. 11,Dec. 6,Nov. 10,Nov. 26,Mar. 16,Dec. 28,Feb. 19,Nov. 8,Aug. 9,Mar. 22,Mar. 20,Sept. 22,Nov. 10,Nov. 15,Jan. 3,July 26,June 3,Dec. 19,June 9,Aug. 5,Aug. 6,Apr. 2,Nov. 1,Nov. 3,
1968197219751976197619721976219761977196319671971197419701972197319761976197619711972197619671968219682197719771976196619761969219692196319681973197619691977196619761968219682197419741976196719671967196819761967197419672
1976197619741976197619711973197619761975197619761976197619761976
Amount4.80
64.00110.00110.00332.50
62.5019.06220.00
3.5060.00
7.506.50
15.002.506.256.25
17.505.106.50
39.5039.5079.0018.900.952
0.9521.505.00
13.006.60
21.503.5022.75 2
16.0023.0047.0094.00
6.253.50
17.2558.00
3.0023.2526.005.00
10.001.301.003.753.75
11.5090.0062.0017.50265.0026.0013.2513.2513.254.502.85
24.0040.00
3.253.25
90.003.006.50
125.0060.00
Related
Total4.80
64.00—
——39.06—
——60.00
7.506.50
—2.50—————
39.5029.50
18.900.950.95
——
6.60
3.502.75
16.0023.0014.00
6.25
17.25
3.003.25
5.00
1.301.003.753.75
90.0062.0017.50
13.42.
4.502.84
85.74
—
RepurchasesUnder
paragraph (7)of amended
decision
——————
—————
——0.80———
——
——
7.700.950.95
——
3.30
—
——— _
4.30—0.75—
1.60.
—__
0.120.203.753.75
.
80.0062.00
——— .
—
——
—
OutstandingBalance
April 30, 1977
——110.00
110.00332.5023.4419.0620.00
3.50———15.00
6.256.25
17.505.106.50
10.0079.00
—
——1.50
5.0013.00
—21.50————
33.0094.00
3.50
58.00
6.00—10.00
- — . ,'— ; " . " • '
11.50
- .
65.0012.5813.2513.2513.25
0.0124.0040.00
3.253.254.263.006.50
125.0060.00
91
©International Monetary Fund. Not for Redistribution

APPENDIX I (continued). THE FUND IN 1976/77
Table 1.9 (concluded). Purchases and Repurchases Under the Decision on Compensatory Financing of ExportFluctuations, February 27, 1963-April 30, 19771
(In millions of SDKs)
PurchasesMember
MoroccoNew Zealand
Pakistan
Panama
Papua New GuineaPeru
Philippines
Portugal
RomaniaSierra Leone
South AfricaSri Lanka
Sudan
Syrian Arab Republic
TanzaniaThailandTogoTurkey
UgandaUruguay
Viet NamWestern Samoa
Yemen, People's Dem. Rep. ofZaïre
Zambia
DateApr. 8, 1976May 10, 1967July 28, 1975Apr. 28, 1976Dec. 2, 1976Dec. 6, 1976July 6, 19762July 9, 1976Apr. 25, 1977Apr. 28, 1977Dec. 27, 1976Dec. 28, 1976June 16, 1976June 20, 1972May 4, 1976May 18, 1973Apr. 5, 1976July 1, 1976July 2, 1976Apr. 28, 1976Mar. 24, 1976Sept. 23, 1976Nov. 16, 1976Mar. 21, 1967Apr. 17, 1968Jan. 24, 1972 2
Jan. 26, 1972June 22, 1973Feb. 15, 1974Nov. 15, 1976Nov. 16, 1976June 1, 1965Mar. 7, 1975Mar. 10, 1975May 19, 1976Sept. 18, 1967Jan. 25, 1972Apr. 7, 1976Aug. 5, 1976Aug. 2, 1976Nov. 14, 1975Apr. 2, 1976Apr. 9, 1976Feb. 7, 1968May 17, 1972Mar. 31, 1976Jan. 17, 1977Nov. 19, 1975Nov. 1, 1976Feb. 3, 1977May 10, 19762July 5, 1972Mar. 26, 1976Dec. 14, 1971Aug. 7, 1972Aug. 8, 1972Nov. 28, 1975Dec. 1, 1975June 3, 1976Apr. 27, 1977
Amount56.5029.2050.5050.5049.50
1.0018.00272.5022.00
5.002.00
16.0010.0030.7561.5038.7577.5038.5020.0095.00
7.005.50
160.0019.5019.304.702
14.7518.605.906.189.62
11.2516.002.00
26.709.50
12.5021.0067.007.50
37.7537.7520.00
9.5017.2525.9031.000.500.500.502.502
28.2556.5019.0016.003.00
14.005.00
19.0019.00
3,620.36
Related
Total
—29.20——————
———
——30.75—
38.75
——————
—19.5019.304.70
14.752.20
—
11.25
—9.50
12.50——
————9.50
12.923
——0.14—
—28.25—19.00
16.003.00
—
—941. 773
RepurchasesUnder
paragraph (7)of amended
decision
————
————
———————9.69
——————
——
——
——
—— •
—— '
———— _—
5.00——————
——
——
—
—184.86
OutstandingBalance
April 30, 197756.50
—50.5050.5049.50
1.0018.0072.5022.005.002.00
16.0010.00
—61.50
—77.5038.5020.0095.00
7.005.50
160.00
16.405.906.189.62
16.002.00
26.70• - - "• —
—21.0067.007.50
37.7537.7520.00
—
—25.9031.000.360.500.502.50
—56.50
—
—14.005.00
19.0019.00
2,674.261 Before September 1966, purchases were made under Execu-
tive Board Decision No. 1477-(63/8), adopted February 27,1963. Subsequently until December 1975, they were madeunder the decision as amended by Executive Board Deci-sion No. 2192-(66/81), adopted September 20, 1966. Andsince January 1976, they have been under the decision asamended by Executive Board Decision No. 4912-(75/207),
adopted December 24, 1975. (See Selected Decisions of theInternational Monetary Fund and Selected Documents (EighthIssue, Washington, 1976), pages 62-66.)
2 Date and amount of reclassification of previous purchases.3 In addition, Fund sale of Uruguayan new pesos had the
effect of repurchasing the equivalent of SDR 4.33 million.
92
©International Monetary Fund. Not for Redistribution
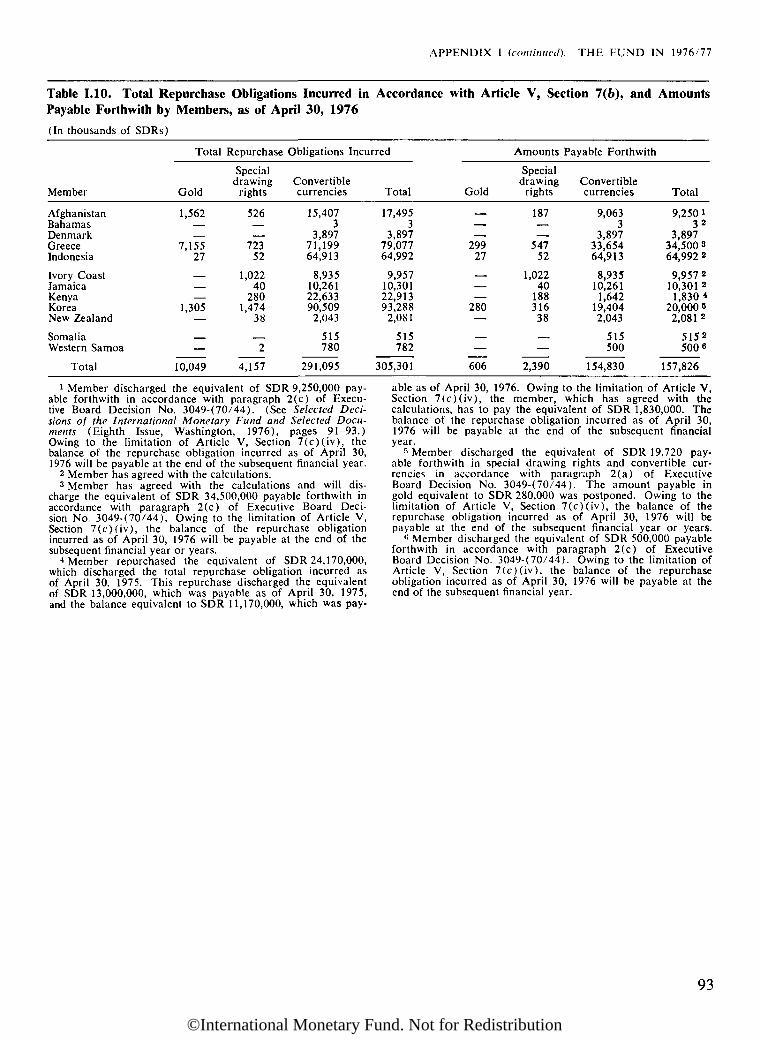
APPENDIX I (continued). THE FUND IN 1976/77
Table 1.10. Total Repurchase Obligations Incurred in Accordance with Article V, Section 7(&), and AmountsPayable Forthwith by Members, as of April 30, 1976
(In thousands of SDRs)
Member
AfghanistanBahamasDenmarkGreeceIndonesia
Ivory CoastJamaicaKenyaKoreaNew Zealand
SomaliaWestern Samoa
Total
Total
Gold
1,562——7,15527
——1,305—
—
10,049
1 Repurchase
Specialdrawing
rights
526—
—72352
1,02240
2801,474
38
2
4,157
Obligations Inc
Convertiblecurrencies
15,4073
3,89771,19964,913
8,93510,26122,63390,509
2,043
515780
291,095
urred
Total
17,4953
3,89779,07764,992
9,95710,30122,91393,288
2,081
515782
305,301
Gold
———29927
———280
—
—606
Amounts P
Specialdrawing
rights
187
——54752
1,02240
18831638
—
2,390
'ayable Forthwit
Convertiblecurrencies
9,0633
3,89733,65464,913
8,93510,261
1,64219,4042,043
515500
154,830
:h
Total
9,250 i32
3,89734,500 364,992 2
9,957 210,301 21,830 4
20,000 52,081 2
5152500«
157,8261 Member discharged the equivalent of SDR 9,250,000 pay-
able forthwith in accordance with paragraph 2(c) of Execu-tive Board Decision No. 3049-(70/44). (See Selected Deci-sions of the International Monetary Fund and Selected Docu-ments (Eighth Issue, Washington, 1976), pages 91-93.)Owing to the limitation of Article V, Section 7(c)(iv), thebalance of the repurchase obligation incurred as of April 30,1976 will be payable at the end of the subsequent financial year.
2 Member has agreed with the calculations.3 Member has agreed with the calculations and will dis-
charge the equivalent of SDR 34,500,000 payable forthwith inaccordance with paragraph 2(c) of Executive Board Deci-sion No. 3049-(70/44). Owing to the limitation of Article V,Section 7(c)(iv), the balance of the repurchase obligationincurred as of April 30, 1976 will be payable at the end of thesubsequent financial year or years.
4 Member repurchased the equivalent of SDR 24,170,000,which discharged the total repurchase obligation incurred asof April 30, 1975. This repurchase discharged the equivalentof SDR 13,000,000, which was payable as of April 30, 1975,and the balance equivalent to SDR 11,170,000, which was pay-
able as of April 30, 1976. Owing to the limitation of Article V,Section 7(c)(iv), the member, which has agreed with thecalculations, has to pay the equivalent of SDR 1,830,000. Thebalance of the repurchase obligation incurred as of April 30,1976 will be payable at the end of the subsequent financialyear.
5 Member discharged the equivalent of SDR 19,720 pay-able forthwith in special drawing rights and convertible cur-rencies in accordance with paragraph 2(a) of ExecutiveBoard Decision No. 3049-(70/44). The amount payable ingold equivalent to SDR 280,000 was postponed. Owing to thelimitation of Article V, Section 7(c)(iv), the balance of therepurchase obligation incurred as of April 30, 1976 will bepayable at the end of the subsequent financial year or years.
6 Member discharged the equivalent of SDR 500,000 payableforthwith in accordance with paragraph 2(c) of ExecutiveBoard Decision No. 3049-(70/44). Owing to the limitation ofArticle V, Section 7(c)(iv), the balance of the repurchaseobligation incurred as of April 30, 1976 will be payable at theend of the subsequent financial year.
93
©International Monetary Fund. Not for Redistribution

APPENDIX I (continued). THE FUND IN 1976/77
Table 1.11. Summary of Members' Purchases andRepurchases, Years Ended April 30, 1948-77(In millions of SDKs)
19481949195019511952
19531954195519561957
19581959196019611962
19631964196519661967
19681969197019711972
19731974197519761977
Total Purchasesby Members
606.04119.4451.8028.0046.25
66.12231.2948.7538.75
1,114.05
665.73263.52165.53577.00
2,243.20
579.97625.90
1,897.442,817.291,061.28
1,348.252,838.852,995.651,167.412,028.49
1,175.431,057.725,102.456,591.424,910.33
Total Repurchasesby Members
__
—24.2119.0936.58
184.96145.11276.28271.6675.04
86.81537.32522.41658.60
1,260.00
807.25380.41516.97406.00340.12
1,115.511,542.331,670.691,656.863,122.33
540.30672.49518.08960.10868.19
Table 1.12. Summary of Stand-By Arrangements ThatBecame Effective During the Fiscal Years EndedApril 30,1953-77!
(In millions of SDKs)
Number Amount
19531954195519561957
19581959196019611962
19631964196519661967
19681969197019711972
19731974197519761977
22229
1115141524
1919242425
3226231813
1315141819
55.0062.5040.0047.50
1,162.28
1,043.781,056.63363.88459.88
1,633.13
1,531.102,159.852,159.05575.35591.15
2,352.36541.15
2,381.28501.70313.75
321.851,394.00389.75
1,188.024,679.64
Total 398 27,004.58
Total 42,463.351 19,215.692
1 Includes renewals and extensions for one year or less, exceptthe renewals each six months of the stand-by arrangement forBelgium granted in June 1952 until that member purchased thefull amount of the equivalent of SDR 50 million in April 1957.
1 Includes purchases that raised the level of the Fund's hold-ings of the drawing members' currencies to no more than75 per cent of quota. These purchases are not subject torepurchase.
2 Includes repurchases that reduced the Fund's holdings ofmembers' currencies below the amounts originally paid onsubscription account and repurchases of members' currenciespaid in settlement of charges. Excludes sales of currencies ofmembers held by the Fund in excess of 75 per cent of quota,as a result of previous purchases, and adjustments dueprimarily to settlement of accounts with countries that havewithdrawn from the Fund; these sales and adjustments havethe effect of repurchase.
Table 1.13. Status of General Arrangements to Borrowon June 30, 1977(In millions of SDR equivalents)
ParticipantsMaximum Amounts
of Credit ArrangementsFund
IndebtednessBelgium 178.9Canada 175.2Deutsche Bundesbank 1,462.1France 473.4Italy 333.6
Japan 1,077.3Netherlands 250.0Sveriges Riksbank 100.5United Kingdom 528.3United States 1,715.5
Total 6,294.8
25.029.7
388.832.0
275.854.211.3
467.71,284.6
94
©International Monetary Fund. Not for Redistribution
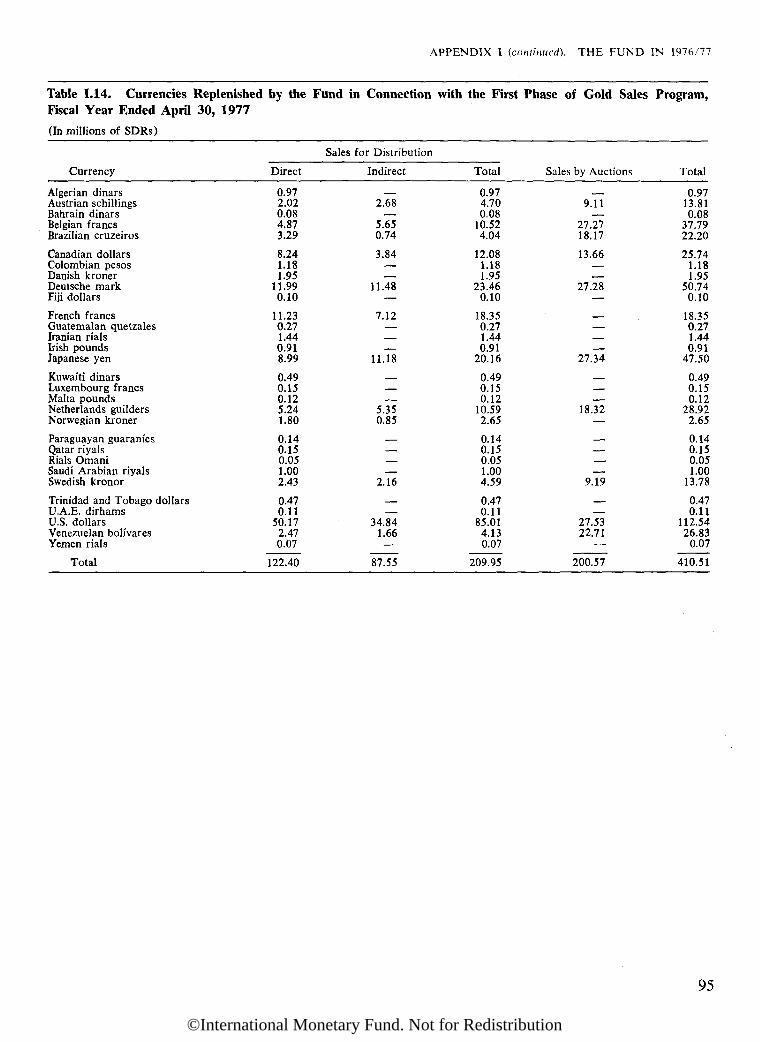
APPENDIX I (continued). THE FUND IN 1976/77
Table 1.14. Currencies Replenished by the Fund in Connection with the First Phase of Gold Sales Program,Fiscal Year Ended April 30, 1977
(In millions of SDRs)
Sales for Distribution
Currency
Algerian dinarsAustrian schillingsBahrain dinarsBelgian francsBrazilian cruzeiros
Canadian dollarsColombian pesosDanish kronerDeutsche markFiji dollars
French francsGuatemalan quetzalesIranian rialsIrish poundsJapanese yen
Kuwaiti dinarsLuxembourg francsMalta poundsNetherlands guildersNorwegian kroner
Paraguayan guaraníesQatar riyalsRials OmaniSaudi Arabian riyalsSwedish kroner
Trinidad and Tobago dollarsU.A.E. dirhamsU.S. dollarsVenezuelan bolívaresYemen rials
Total
Direct
0.972.020.084.873.29
8.241.181.95
11.990.10
11.230.271.440.918.99
0.490.150.125.241.80
0.140.150.051.002.43
0.470.11
50.172.470.07
122.40
Indirect
2.68
—5.650.74
3.84——11.48
—7.12
11.18
——5.350.85
———2.16
34.841.66—
87.55
Total
0.974.700.08
10.524.04
12.081.181.95
23.460.10
18.350.271.440.91
20.16
0.490.150.12
10.592.65
0.140.150.051.004.59
0.470.11
85.014.130.07
209.95
Sales by Auctions
9.11
—27.2718.17
13.66——27.28
—
27.34
——18.32
—
———9.19
—27.5322.71
—
200.57
Total
0.9713.810.08
37.7922.20
25.741.181.95
50.740.10
18.350.271.440.91
47.50
0.490.150.12
28.922.65
0.140.150.051.00
13.78
0.470.11
112.5426.83
0.07
410.51
95
©International Monetary Fund. Not for Redistribution
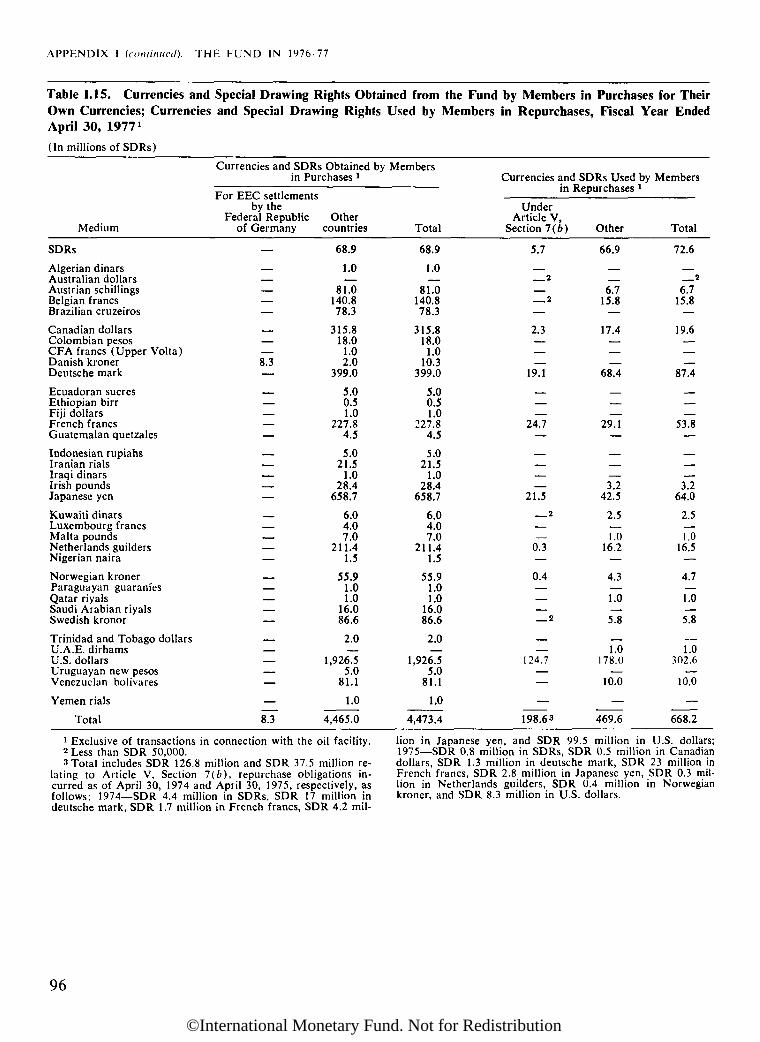
APPENDIX I (continued). THE FUND IN 1976/77
Table 1.15. Currencies and Special Drawing Rights Obtained from the Fund by Members in Purchases for TheirOwn Currencies; Currencies and Special Drawing Rights Used by Members in Repurchases, Fiscal Year EndedApril 30, 1977 !
(In millions of SDRs)
Medium
SDRs
Algerian dinarsAustralian dollarsAustrian schillingsBelgian francsBrazilian cruzeiros
Canadian dollarsColombian pesosCFA francs (Upper Volta)Danish kronerDeutsche mark
Ecuadoran sucresEthiopian birrFiji dollarsFrench francsGuatemalan quetzales
Indonesian rupiahsIranian rialsIraqi dinarsIrish poundsJapanese yen
Kuwaiti dinarsLuxembourg francsMalta poundsNetherlands guildersNigerian naira
Norwegian kronerParaguayan guaraníesQatar riyalsSaudi Arabian riyalsSwedish kroner
Trinidad and Tobago dollarsU.A.E. dirhamsU.S. dollarsUruguayan new pesosVenezuelan bolívares
Yemen rials
Total
Currencies and SDRs Obtained byin Purchases 1
For EEC settlementsby the
Federal Republic Otherof Germany countries
— 68.9
— 1.0— —— 81.0— 140.8— 78.3
— 315.8— 18.0— 1.08.3 2.0— 399.0
— 5.0— 0.5— 1.0— 227.8— 4.5
— 5.0— 21.5— 1.0— 28.4— 658.7
— 6.0— 4.0— 7.0— 211.4— 1.5
— 55.9— 1.0— 1.0— 16.0— 86.6
— 2.0— —— 1,926.5— 5.0— 81.1
— 1.0
8.3 4,465.0
Members
Total
68.9
1.0
—81.0140.878.3
315.818.01.0
10.3399.0
5.00.51.0
227.84.5
5.021.5
1.028.4
658.7
6.04.07.0
211.41.5
55.91.01.0
16.086.6
2.0—1,926.55.0
81.1
1.0
4,473.4
Currencies and SDRs Used by Membersin Repurchases l
UnderArticle V,
Section 7(¿»)
5.7
2
2
2.3———19.1
——24.7
—
———21.5
2
0.3—0.4
——— 2
124.7——
—198.63
Other
66.9
—6.715.8
—17.4
——. —
68.4
——29.1—
——3.2
42.5
2.5
—1.016.2
—
4.3
—1.0
—5.8_
1.0178.0
—10.0
—469.6
Total
72.6
2
6.715.8
—
19.6
———87.4
——53.8
—
——3.2
64.0
2.5
—1.016.5
—4.7—1.0
—5.8
1.0302.6
—10.0_
668.21 Exclusive of transactions in connection with the oil facility.2 Less than SDR 50,000.3 Total includes SDR 126.8 million and SDR 37.5 million re-
lating to Article V, Section 7(e), repurchase obligations in-curred as of April 30, 1974 and April 30, 1975, respectively, asfollows: 1974—SDR 4.4 million in SDRs, SDR 17 million indeutsche mark, SDR 1.7 million in French francs, SDR 4.2 mil-
lion in Japanese yen, and SDR 99.5 million in U.S. dollars;1975—SDR 0.8 million in SDRs, SDR 0.5 million in Canadiandollars, SDR 1.3 million in deutsche mark, SDR 23 million inFrench francs, SDR 2.8 million in Japanese yen, SDR 0.3 mil-lion in Netherlands guilders, SDR 0.4 million in Norwegiankroner, and SDR 8.3 million in U.S. dollars.
96
©International Monetary Fund. Not for Redistribution

APPENDIX I (continued). THE FUND IN 1976/77
Table 1.16. Schedules of Fund Charges
CHARGES ON TRANSACTIONS EFFECTED FROM JULY 1, 1974
Charges in per cent per annum ] payable on holdings in
CHARGES ON TRANSACTIONS EFFECTED UNDER THE EX-TENDED FUND FACILITY
^Л^СОЗ \JL y£UULO., L\JL ptl l\J U SI.aicu. v_,iiai gcs ill pel wciu pel annum payauic uu iiwiuniga 111excess of auota. for neriod stated:
Prcviou0 Current
Service charge 0.5 0.5
Up to 1 year1 to 2 years2 to 3 years3 to 4 years4 to 5 years
CHARGES ON TRANSACTIONSFACILITY FOR 1974
4.0 4.3754.5 4.8755.0 5.3755.5 " 5.875 26.0 6.375
EFFECTED UNDER THE OIL
Charges in per cent per annum г payable on holdings inexcess of quota, for period
Service charge
Up to 1 year1 to 2 years2 to 3 years3 to 4 years4 to 5 years5 to 6 years6 to 7 years
stated:
0.5
6.8756.8756.8757.000 2
7.1257.1257.125
Service charge
Up to 1 year1 to 2 years2 to 3 years3 to 4 years4 to 5 years5 to 6 years6 to 7 years7 to 8 years
Previous
0.5
4.04.55.05.56.0 2
6.56.56.5
CHARGES ON TRANSACTIONS EFFECTEDFACILITY FOR 1975
Current
0.5
4.3754.8755.3755.8756.375 2
6.8756.8756.875
UNDER THE OIL
Charges in per cent per annum ^ payable on holdings inexcess of quota for period stated:
Service charge
Up to 1 year1 to 2 years2 to 3 years3 to 4 years4 to 5 years5 to 6 years6 to 7 years
0.5
7.6257.6257.6257.750 2
7.8757.8757.875
CHARGES ON TRANSACTIONS EFFECTED FROM MAY 1, 1963AND UP TO JUNE 30
Charges in per centportion of holdings
More thanBut not more than
Service charge
0 to 3 months3 to 6 monthsVi to 1 year1 to \Уг yearsll/2 to 2 years2 to 2l/2 years2Vi to 3 years3 to 3]/2 yearsЗУ2 to 4 years4 to 4У2 years
, 1974
per annum *in excess of
050
0.5
0.02.02.02.02.53.03.54.0 2
4.55.0
for period stated and forquota by (per cent)
50 100100
0.5 0.5
0.0 0.02.0 2.02.0 2.52.5 3.03.0 3.53.5 4.0 2
4.0 2 4.54.5 5.05.0
1 Except for service charge, which is payable once per trans-action and is stated as a per cent of the amount of the trans-action.
2 Point at which the Fund and the member consult.
97
©International Monetary Fund. Not for Redistribution

APPENDIX I (continued). THE FUND IN 1976/77
Table 1.17. Income and Expenses, Fiscal Years Ended April 30, 1960, 1965, 1970, and 1973-77 '
(In millions of SDRs)
Operational income from regular facilitiesService and stand-by charges, etc.Charges on balances in excess of quotasInterest on holdings of special drawing rights
Total operational income from regularfacilities 2
RemunerationInterest on borrowing under the
General Arrangements to Borrow andbilateral arrangements 3
Transfer charges under theGeneral Arrangements to Borrow andbilateral arrangements
Total operational expenses
Net operational income fromregular facilities
Operational income from the oil facilityService chargesPeriodic charges
Deduct: interest expense
Net operational income fromthe oil facility
Total net operational incomeNet administrative expensesFixed property expenses
Total expenses
Net income or expenses ( — ) '•'•
I960
4.116.9
21.0
—
—
21.0
21.06.70.2
6.9
+ 14.1
1965
11.835.9
47.7
2.6
2.0
4.6
43.1
—
43.113.04.6
17.6
+ 25.5
1970
13.0124.7
0.4
138.1
27.2
16.7
2.4
46.3
91.8
91.827.7
6.5
34.2
+ 57.6
1973
3.228.210.2
41.6
29.3
29.3
12.2
—
12.238.8
-4.8
34.0
— 21.7
1974
2.528.27.8
38.5
27.2
27.2
11.2
—
11.242.6
5.9
48.4
-37.2
1975
8.556.421.1
86.0
62.4
62.4
23.6
12.568.0
80.569.2
11.3
34.944.9
-0.3
44.6
-9.7
1976
6.8101.220.8
128.8
104.1
104.1
24.7
19.8307.3
327.1303.4
23.7
48.452.2
-0.9
51.3
-2.9
1977
22.2232.7
23.0
277.9
226.9
12.7
5.0
244.6
33.3
2.2494.6
496.8483.0
13.8
47.165.3
65.3
-18.21 Totals may not add to figures shown, owing to rounding.2 Excludes income from investments transferred to the Special
Reserve until February 15, 1972.3 Net income or expense for each year was transferred to the
General Reserve until 1971 and to the Special Reserve for theperiod 1973-77, except for the fiscal year 1970, when SDR 17.5million was distributed to members under Article XII, Sec-tions 6(a) and (6), of the Fund Agreement.
98
©International Monetary Fund. Not for Redistribution

APPENDIX I (continued). THE FUND IN 1976/77
Table 1.18. Members That Have Accepted Article VIII,April 30,1977
99
Member
ArgentinaAustraliaAustriaBahamasBahrain
BelgiumBoliviaCanadaCosta RicaDenmark
Dominican RepublicEcuadorEl SalvadorFijiFrance
Germany, Fed. Rep. ofGuatemalaGuyanaHaitiHonduras
IrelandItalyJamaicaJapanKuwait
LuxembourgMalaysiaMexicoNetherlandsNicaragua
NorwayOmanPanamaPapua New GuineaPeru
QatarSaudi ArabiaSingaporeSouth AfricaSweden
United Arab EmiratesUnited KingdomUnited StatesVenezuela
Effective Dateof Acceptance
May 14, 1968July 1, 1965August 1, 1962December 5, 1973March 20, 1973
February 15, 1961June 5, 1967March 25, 1952February 1, 1965May 1, 1967
August 1, 1953August 31, 1970November 6, 1946August 4, 1972February 15, 1961
February 15, 1961January 27, 1947December 27, 1966December 22, 1953July 1, 1950
February 15, 1961February 15, 1961February 22, 1963April 1, 1964April 5, 1963
February 15, 1961November 11, 1968November 12, 1946February 15, 1961July 20, 1964
May 11, 1967June 19, 1974November 26, 1946December 4, 1975February 15, 1961
June 4, 1973March 22, 1961November 9, 1968September 15, 1973February 15, 1961
February 13, 1974February 15, 1961December 10, 1946July 1, 1976
©International Monetary Fund. Not for Redistribution

APPENDIX I (concluded). THE FUND IN 1976/77
Table 1.19. Publications Issued, Fiscal Year Ended April 30, 1977
100
Reports and Other Documents
Annual Report of the Executive Directors for the Fiscal YearEnded April 30, 1976(English, French, German, and Spanish). Free
Summary Proceedings of the Thirty-First Annual Meeting ofthe Board of Governors and Supplement: Proposed SecondAmendment to the Articles of Agreement of the InternationalMonetary Fund Free
Twenty -Seventh Annual Report on Exchange RestrictionsFree
Subscription Publications
Balance of Payments YearbookVolume 27, 1967-74 (clothbound). US$6.00Volume 28, data through 1976 (monthly loose-leaf tables and
annual bound volume). US$20.00 (binder availablefor US$4.50)
Direction of TradeMonthly, with annual supplement.US$10.00 a year
International Financial StatisticsMonthly (English, French, and Spanish).US$20.00 a year
Staff PapersThree times a year. US$6.00 a year
University libraries, faculty members, and students mayobtain the four subscription publications listed above at thereduced rates of US$12.00 for all four publications, orUS$5.00 for International Financial Statistics and US$3.00each for the other publications.
For users of Fund publications that have access to a com-
puter, tape subscriptions to International Financial Statistics,Direction of Trade, and the Balance of Payments Yearbookare available at US$1,000.00 a year each. This price includesthe book version of the publication. The price to universitiesis US$300.00 a year for each subscription.
Books
The International Monetary Fund, 1966-1971: The SystemUnder StressVolume I: Narrative; Volume II: DocumentsUS$15.00 the setVol. I, US$11.00; Vol. II, US$6.00
The Monetary Approach to the Balance of Payments: A Collec-tion of Research Papers by Members of the Staff of the Inter-national Monetary FundUS$4.00
Pamphlet Series
No. 19 Floating Currencies, Gold, and SDKs: Some RecentLegal DevelopmentsBy Joseph Gold (English and Spanish). Free
Other
Finance and DevelopmentIssued jointly with IBRD; quarterly (English, French, German,and Spanish. A selection of articles is published quarterly inArabic and annually in Portuguese). Free
IMF SurveyTwice monthly but only once in December (English, French,and Spanish). Private firms and individuals are charged fordelivery.
©International Monetary Fund. Not for Redistribution

Appendix IIPrincipal Policy Decisions of theExecutive Board and Reportby the Managing Director
A. Buffer Stock Financing Facility: Fifth International Tin Agreement
1. The Fund, having considered the text of the Fifth International Tin Agree-ment, as adopted by the United Nations Tin Conference on June 21, 1975, findsthat the terms of this Agreement relating to the international tin buffer stock to beestablished under the Agreement are consistent with the principles referred to inExecutive Board Decision No. 2772-(69/47) of June 25, 1969.
2. In view of (1) above, the Fund will meet, subject to the provisions ofExecutive Board Decision No. 2772-(69/47) as amended by Executive BoardDecision No. 4913-(75/207),1 a member's requests for purchases in connectionwith the financing by the member of its compulsory contributions to the bufferstock established under the Fifth International Tin Agreement.
3. The Fund decides that any contribution made in the form of tin metal underArticle 21 of the Agreement shall be regarded as equivalent to a contribution incash, valued at the floor price prevailing when the contribution is called up. Anytransfer of metal from the buffer stock to a member will be treated as a distributionin currency, valued at the floor price prevailing when the transfer is made.
4. The staff will keep the Executive Directors informed on the operation of thebuffer stock and other developments in connection with the Fifth International TinAgreement by reports that will be made at least once a year, and the Fund maymake such review of this decision as is appropriate in the light of these reports.
Decision No. 5127-(76/91)June 23,1976
B. Subsidy Account: Review of Decision
(a) Annual Review and Payment of Subsidy for Fiscal Year 1976
1. For the fiscal year ended April 30, 1976, a subsidy shall be paid to eachmember listed in Table 1 of EBS/76/271 at the rate of 5 per cent per annum ofthe average daily balances of the currency of the member held by the Fund inexcess of quota outstanding under Executive Board Decision No. 4634-(75/47) 2
during the year.2. The payments shall be made in U.S. dollars based on the U.S. dollar/SDR
exchange rate on July 19, 1976.3. The payments shall be deemed to be made first from income earned from
the investment of the contributions to the Subsidy Account and thereafter fromthe contributions.
4. No charge shall be levied for the services rendered by the Fund in theoperation of the Subsidy Account for the fiscal year ended April 30, 1976.
1 Selected Decisions of theInternational Monetary Fundand Selected Documents(Eighth Issue, Washington,1976), pages 66-67.
2 See Annual Report, 1975,page 94.
101
©International Monetary Fund. Not for Redistribution

APPENDIX II (continued). P R I N C I P A L POLICY DECISIONS AND REPORT
5. The next review of Executive Board Decision No. 4773-(75/136)3 shall beconducted in May 1977.
Decision No. 5144-(76/102) SAJuly 12,1976
(b) Annual Review and Payment of Subsidy for Fiscal Year 1977
In concluding their second review of Executive Board Decision No. 4773-(75/136)4 August 1, 1975, the Executive Directors adopt the following decision:
1. For the fiscal year ended April 30, 1977, a subsidy shall be paid to eachmember listed in Table 1 of EBS/77/164 at the rate of 5 per cent per annum onthe average daily balances of the currency of the member held by the Fund inexcess of quota outstanding under Executive Board Decision No. 4634-(75/47)5
during the year.2. The payment shall be made in U.S. dollars on June 16, 1977 based on the
U.S. dollar/SDR exchange rate determined three working days prior to payment.3. No charge shall be levied for the services rendered by the Fund in the ad-
ministration and operation of the Subsidy Account for the fiscal year endedApril 30, 1977.
4. The next review of Executive Board Decision No. 4773-(75/136) shallbe conducted in May 1978.
Decision No. 5425-(77/79) SAMay 27, 1977
C. SDR Reconstitution: Redefinition of Maximum Acquisition
1. Paragraph 2 of the Executive Board Decision No. 3457-(71/121) G/S, asamended,0 is hereby further amended to read as follows:
Pursuant to Article XXV, Section 2(b)(ii), the Fund prescribes that a par-ticipant may obtain special drawing rights from another participant in a transac-tion with that other participant that would promote reconstitution underArticle XXV, Section 6(a), and Schedule G, paragraph l(a). The maximumamount that may be obtained in that way shall be the sum of (i) the singleamount most recently notified to the participant under Rule P-3 or calculatedfor acquisition in the final month of a reconstitution period, taking into accountthe proposed date of acquisition, and (ii) the total amount of any charges to bepaid to the General Account and repurchase obligations in special drawingrights to be discharged by the participant prior to the next calculation underRule P-2. These maximum amounts will be reduced by any net acquisition ofspecial drawing rights other than by way of allocation subsequent to the datethe calculation is made.
2. Rule P-6 of the Fund's Rules and Regulations is modified to read as follows:
A participant may receive special drawing rights in a transaction prescribedby the Fund to promote reconstitution by the participant in a total amount equalto the amount it would need to obtain in accordance with the calculations underRule P-2, increased by the amount of any charges to be paid, or repurchaseobligations in special drawing rights to be discharged, by the participant to theGeneral Account during the month following the calculation under Rule P-2. Tothe extent that a participant may receive special drawing rights in a transactionunder any prescription, in accordance with this Rule, the Fund shall providespecial drawing rights held in the General Account to the participant at its
3 See Annual Report, 1976,pages 98-99.
4 Ibid.5 See Annual Report, 1975,
page 94.6 Selected Decisions of the
International Monetary Fundand Selected Documents(Eighth Issue, Washington,1976), pages 173-74.
102
©International Monetary Fund. Not for Redistribution

APPENDIX II (continued). PRINCIPAL POLICY DECISIONS AND REPORT
request for gold or currency acceptable to the Fund. A participant shall consultthe Managing Director before making a request under this Rule.
Decision No. 5167-(76/120) G/SAugust 2,1976
D. Special Drawing Rights: Transactions by Agreement Between Participants
1. Pursuant to Article XXV, Section 2(b)(ii), the Fund prescribes that par-ticipants may engage in transactions by agreement that bring the holdings of bothparticipants closer to their net cumulative allocations and under Article XXV,Section 3(c), prescribes that the users of SDRs in these transactions shall beexempt from the requirement of need set out in Article XXV, Section 3 (a).
2. Under Article XXV, Section 3(c), the Fund prescribes that the user ofSDRs in a transaction by agreement between participants to promote reconstitutionpursuant to Executive Board Decision No. 3457-(71/121) G/S, adopted Decem-ber 3, 1971, as amended,7 shall be exempt from the requirement of need set out inArticle XXV, Section 3 (a).
Decision No. 5185-(76/128) SAugust 25, 1976
E. Quarterly Review of Rate of Remuneration Under Rule 1-10
In accordance with the formula in Rule I-10, the rate of remuneration for thecalendar quarter beginning on October 1, 1976 shall be 4 per cent per annum.
Decision No. 5208-(76/141)September 17,1976
In accordance with the formula in Rule I-10, the rate of remuneration for thecalendar quarter beginning on January 1, 1977 shall be 4 per cent per annum.
Decision No. 5294-(76/168)December 22,1976
In accordance with the formula in Rule 1-10, the rate of remuneration for thecalendar quarter beginning on April 1, 1977 shall be 3.75 per cent per annum.
Decision No. 5358-(77/40)March 22,1977
In accordance with the formula in Rule I-10, the rate of remuneration for thecalendar quarter beginning July 1, 1977 shall be 3.50 per cent per annum.
Decision No. 5455-(77/92)June 29, 1977
7 Selected Decisions of theInternational Monetary Fundand Selected Documents(Eighth Issue, Washington,1976), pages 173-74.
103
©International Monetary Fund. Not for Redistribution
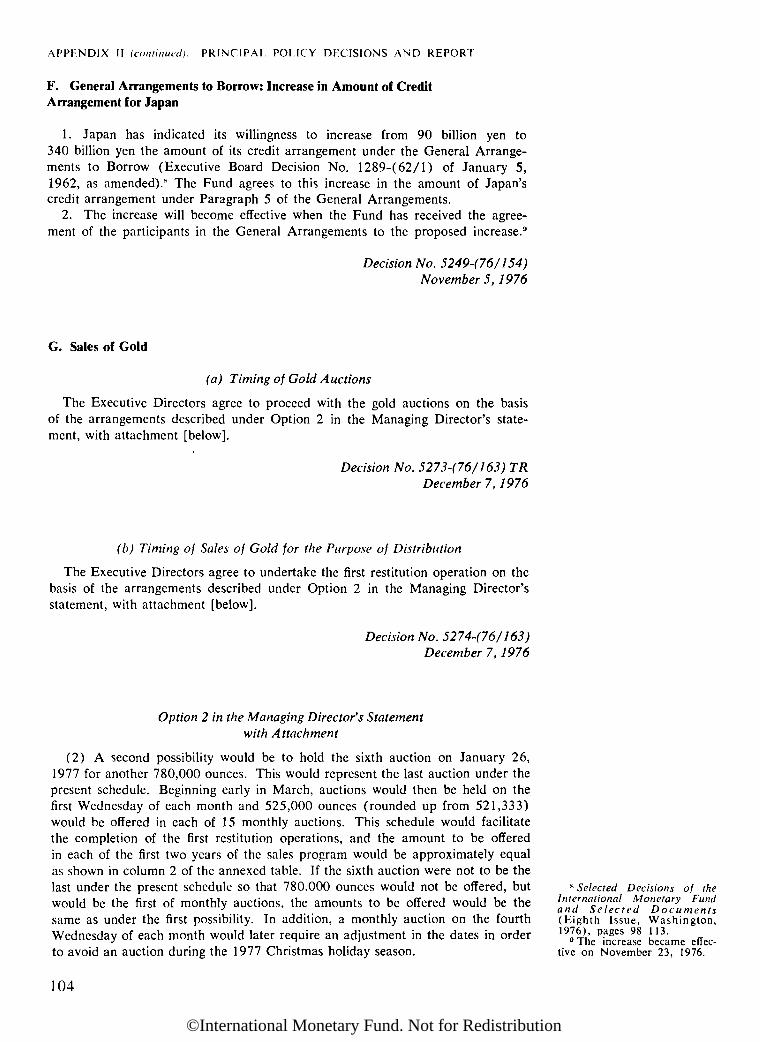
APPENDIX II (continued). PRINCIPAL POLICY DECISIONS AND REPORT
F. General Arrangements to Borrow: Increase in Amount of CreditArrangement for Japan
1. Japan has indicated its willingness to increase from 90 billion yen to340 billion yen the amount of its credit arrangement under the General Arrange-ments to Borrow (Executive Board Decision No. 1289-(62/l) of January 5,1962, as amended).8 The Fund agrees to this increase in the amount of Japan'scredit arrangement under Paragraph 5 of the General Arrangements.
2. The increase will become effective when the Fund has received the agree-ment of the participants in the General Arrangements to the proposed increase.9
Decision No. 5249-(76/154)November 5,1976
G. Sales of Gold
(a) Timing of Gold Auctions
The Executive Directors agree to proceed with the gold auctions on the basisof the arrangements described under Option 2 in the Managing Director's state-ment, with attachment [below].
Decision No. 5273-(76/163) TRDecember 7,1976
(b) Timing of Sales of Gold for the Purpose of Distribution
The Executive Directors agree to undertake the first restitution operation on thebasis of the arrangements described under Option 2 in the Managing Director'sstatement, with attachment [below].
Decision No. 5274-(76/163)December 7,1976
Option 2 in the Managing Director's Statementwith Attachment
(2) A second possibility would be to hold the sixth auction on January 26,1977 for another 780,000 ounces. This would represent the last auction under thepresent schedule. Beginning early in March, auctions would then be held on thefirst Wednesday of each month and 525,000 ounces (rounded up from 521,333)would be offered in each of 15 monthly auctions. This schedule would facilitatethe completion of the first restitution operations, and the amount to be offeredin each of the first two years of the sales program would be approximately equalas shown in column 2 of the annexed table. If the sixth auction were not to be thelast under the present schedule so that 780,000 ounces would not be offered, butwould be the first of monthly auctions, the amounts to be offered would be thesame as under the first possibility. In addition, a monthly auction on the fourthWednesday of each month would later require an adjustment in the dates in orderto avoid an auction during the 1977 Christmas holiday season.
8 Selected Decisions of theInternational Monetary Fundand Selected Documents(Eighth Issue, Washington,1976), pages 98-113.
9 The increase became effec-tive on November 23, 1976.
104
©International Monetary Fund. Not for Redistribution
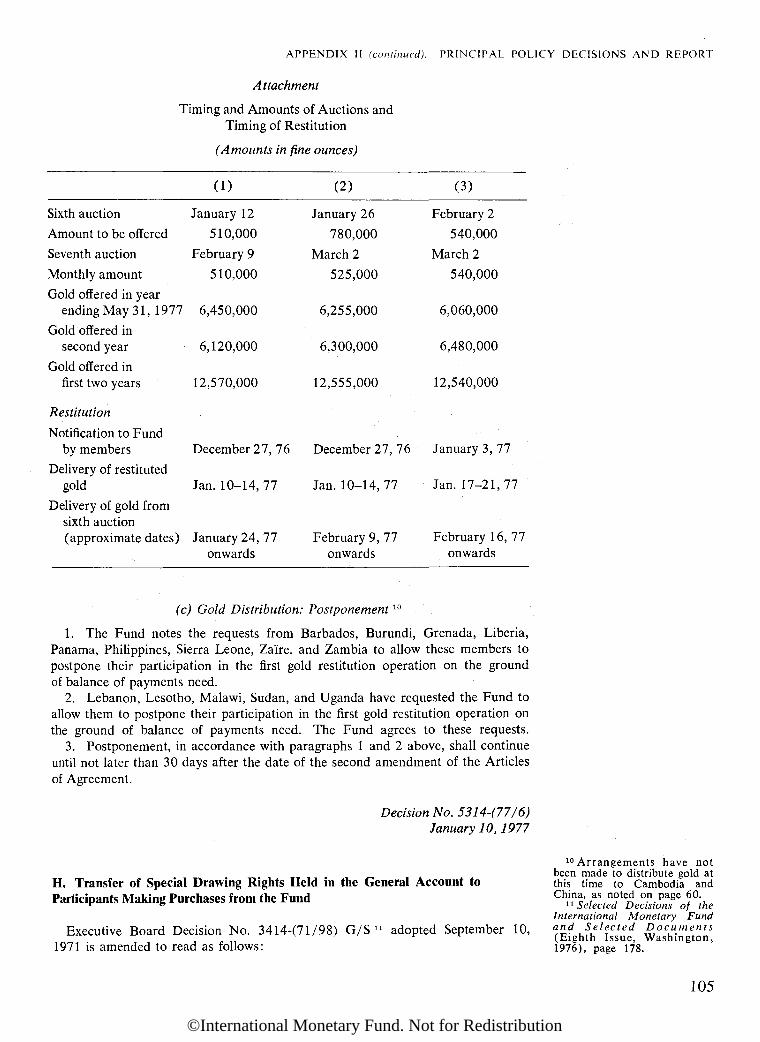
APPENDIX I I (continued). P R I N C I P A L POLICY DECISIONS AND REPORT
Attachment
Timing and Amounts of Auctions andTiming of Restitution
(Amounts in fine ounces)
Sixth auction
Amount to be offered
Seventh auction
Monthly amount
Gold offered in yearending May 31, 1977
Gold offered insecond year
Gold offered infirst two years
Restitution
Notification to Fundby members
Delivery of restitutedgold
Delivery of gold fromsixth auction(approximate dates)
(1)
January 12
510,000
February 9
510,000
6,450,000
6,120,000
12,570,000
December 27, 7i
Jan. 10-14, 77
January 24, 77onwards
(2)
January 26
780,000
March 2
525,000
6,255,000
6,300,000
12,555,000
6 December 27, 7'
Jan. 10-14,77
February 9, 77onwards
(3)
February 2
540,000March 2
540,000
6,060,000
6,480,000
12,540,000
6 January 3, 77
Jan. 11 '-21, 77
February 16, 77onwards
(c) Gold Distribution: Postponement w
1. The Fund notes the requests from Barbados, Burundi, Grenada, Liberia,Panama, Philippines, Sierra Leone, Zaïre, and Zambia to allow these members topostpone their participation in the first gold restitution operation on the groundof balance of payments need.
2. Lebanon, Lesotho, Malawi, Sudan, and Uganda have requested the Fund toallow them to postpone their participation in the first gold restitution operation onthe ground of balance of payments need. The Fund agrees to these requests.
3. Postponement, in accordance with paragraphs 1 and 2 above, shall continueuntil not later than 30 days after the date of the second amendment of the Articlesof Agreement.
Decision No. 5314-(77/6)January 10,1977
H. Transfer of Special Drawing Rights Held in the General Account toParticipants Making Purchases from the Fund
Executive Board Decision No. 3414-(71/98) G/S u adopted September 10,1971 is amended to read as follows:
10 Arrangements have notbeen made to distribute gold atthis time to Cambodia andChina, as noted on page 60.11 Selected Decisions of theInternational Monetary Fundand Selected Documents(Eighth Issue, Washington,1976), page 178.
105
©International Monetary Fund. Not for Redistribution
APPENDIX II (continued). PRINCIPAL POLICY DECISIONS AND REPORT
When a member which is a participant in the Special Drawing Account con-sults in accordance with the Executive Board Decision No. 1371-(62/36),12
adopted July 20, 1962, on Currencies to Be Drawn and to Be Used in Repur-chases, the Managing Director may propose that the participant request thepurchase of special drawing rights not in excess of the amount which he shallindicate.
Decision No. 5355-(77/36) G/SMarch 15,1977
I. Financial Position of the Fund and Increases in the Fund's Charges
/. Application of Rule I-4(c)(ii): Decreases inFund's Holdings of a Currency
For the purpose of applying Rule I-4(c)(ii), decreases in the Fund's holdingsof a currency that do not reduce balances subject to Rule I-4(f) (3) (ii), (iii), or(iv) shall reduce balances subject to Rule I-4(f) (3) (i) after balances subject toRule I-4(f) (2) have been eliminated.
Decision No. 5368-(77/51)April 8, 1977, deemed effective April 1, 1977
II. Amendment of Rule I-4(a): Time for Payment
The second sentence of Rule 1-4(a) shall be made to read as follows:These charges shall be payable promptly after the end of the quarter to which
they relate.
Decision No. 5369-(77/51)April 8, 1977, deemed effective April 1, 1977
III. A mendment of Rule l-4(f)(3)(i) and Rule I-4(g)(4):Change in Rates of Charge
1. Rule I-4(f) (3) (i) shall be amended as follows:The charge to be levied on each segment that is in excess of 100 per centof quota and is not subject to (ii) below shall be 4% per cent per annum forthe first 12 months; if the margin of the initial rate of charge above the rateof remuneration is reduced to less than Ул of 1 per cent or increased to morethan 1 per cent because of changes in the rate of remuneration pursuant toRule 1-9, the Executive Board will promptly review the Fund's financialposition, the rate of remuneration and the initial rate of charge and take suchaction as it considers necessary to safeguard the financial position of theFund. If a new decision is not taken as a result of this review on the rates ofcharge or on the rate of remuneration, the initial rate of charge shall be Ул of1 per cent or 1 per cent above the rate of remuneration, as the case may be.The initial rate of charge shall rise by an additional Уг per cent per annumfor each additional twelve months. This decision shall be reviewed if theFund's total annual income substantially exceeded its total annual expenses.
2. In Rule I-4(g)(4) the words "6.5 per cent" shall be replaced by the words"the initial rate of charge under (f) (3) (i) above plus 2.5 per cent" and the words
12 Selected Decisions of theInternational Monetary Fundand Selected Documents(Eighth Issue, Washington,1976), pages 56-62.
106
©International Monetary Fund. Not for Redistribution

APPENDIX If (continued). PRINCIPAL POLICY DECISIONS AND REPORT
"7 per cent" shall be replaced by "the initial rate of charge under (f) (3) (i) aboveplus 3 per cent."
Decision No. 5370-(77/51)April 8, 1977, deemed effective April 1, 1977
IV. Second Amendment, Article XXX(c)(ni): Exclusion ofPurchases Under Oil Facility for Purposes of
Definition of "Reserve Tranche Purchase"
With effect on the date of the second amendment of the Articles of Agreement,the Fund's holdings of currencies acquired in purchases under Executive BoardDecision No. 4241-(74/67),13 June 13, 1974, and Executive Board DecisionNo. 4634-C75/47),14 April 4, 1975, shall be excluded pursuant to Article XXX(c)(iii) for the purpose of the definition of "reserve tranche purchase."
Decision No. 5371-(77/51)April 8, 1977, deemed effective April 1, 1977
J. Surveillance over Exchange Rate Policies
1. The Executive Board has discussed the implementation of Article IV of theproposed second amendment of the Articles of Agreement and has approved thedocument entitled "Surveillance over Exchange Rate Policies" [below]. The Fundshall act in accordance with this document when the second amendment becomeseffective. In the period before that date the Fund shall continue to conduct con-sultations in accordance with present procedures and decisions.
2. The Fund shall review the document entitled "Surveillance over ExchangeRate Policies" at intervals of two years and at such other times as considerationof it is placed on the agenda of the Executive Board.
Decision No. 5392-(77/63)April 29,1977
Surveillance over Exchange Rate Policies
General Principles
Article IV, Section 3(a), provides that "The Fund shall oversee the internationalmonetary system in order to ensure its effective operation, and shall oversee thecompliance of each member with its obligations under Section 1 of this Article."Article IV, Section 3(f t ) , provides that in order to fulfill its functions under 3(a),"the Fund shall exercise firm surveillance over the exchange rate policies ofmembers, and shall adopt specific principles for the guidance of all members withrespect to those policies." Article IV, Section 3(b), also provides that "Theprinciples adopted by the Fund shall be consistent with cooperative arrangementsby which members maintain the value of their currencies in relation to the valueof the currency or currencies of other members, as well as with other exchangearrangements of a member's choice consistent with the purposes of the Fund andSection 1 of this Article. These principles shall respect the domestic social andpolitical policies of members, and in applying these principles the Fund shall paydue regard to thev circumstances of members." In addition, Article IV, Sec-
13 Selected Decisions of theInternational Monetary Fundand Selected Documents(Eighth Issue, Washington,1976), pages 70-74.
^Ibid., pages 76-78.
107
©International Monetary Fund. Not for Redistribution
APPENDIX II (continued). P R I N C I P A L POLICY DECISIONS AND REPORT
tion 3(b), requires that "Each member shall provide the Fund with the informationnecessary for such surveillance, and, when requested by the Fund, shall consultwith it on the member's exchange rate policies."
The principles and procedures set out below, which apply to all members what-ever their exchange arrangements and whatever their balance of payments position,are adopted by the Fund in order to perform its functions under Section 3(b).They are not necessarily comprehensive and are subject to reconsideration in thelight of experience. They do not deal directly with the Fund's responsibilitiesreferred to in Section 3(a), although it is recognized that there is a close relation-ship between domestic and international economic policies. This relationship isemphasized in Article IV which includes the following provision : "Recognizing . . .that a principal objective [of the international monetary system] is the continuingdevelopment of the orderly underlying conditions that are necessary for financialand economic stability, each member undertakes to collaborate with the Fund andother members to assure orderly exchange arrangements and to promote a stablesystem of exchange rates."
Principles for the Guidance of Members' Exchange Rate Policies
A. A member shall avoid manipulating exchange rates or the internationalmonetary system in order to prevent effective balance of payments adjustment orto gain an unfair competitive advantage over other members.
B. A member should intervene in the exchange market if necessary to counterdisorderly conditions which may be characterized inter alia by disruptive short-term movements in the exchange value of its currency.
C. Members should take into account in their intervention policies the interestsof other members, including those of the countries in whose currencies theyintervene.
Principles of Fund Surveillance over Exchange Rate Policies
1. The surveillance of exchange rate policies shall be adapted to the needs ofinternational adjustment as they develop. The functioning of the internationaladjustment process shall be kept under review by the Executive Board and InterimCommittee and the assessment of its operation shall be taken into account in theimplementation of the principles set forth below.
2. In its surveillance of the observance by members of the principles set forthabove, the Fund shall consider the following developments as among those whichmight indicate the need for discussion with a member:
(i) protracted large-scale intervention in one direction in the exchangemarket;
(ii) an unsustainable level of official or quasi-official borrowing, or excessiveand prolonged short-term official or quasi-official lending, for balance of paymentspurposes;
(iii) (a) the introduction, substantial intensification, or prolonged mainte-nance, for balance of payments purposes, of restrictions on, orincentives for, current transactions or payments, or
(b) the introduction or substantial modification for balance of pay-ments purposes of restrictions on, or incentives for, the inflow oroutflow of capital;
(iv) the pursuit, for balance of payments purposes, of monetary and otherdomestic financial policies that provide abnormal encouragement or discourage-ment to capital flows; and
108
©International Monetary Fund. Not for Redistribution
APPENDIX II (continued). PRINCIPAL POLICY DECISIONS AND REPORT
(v) behavior of the exchange rate that appears to be unrelated to under-lying economic and financial conditions including factors affecting competitivenessand long-term capital movements.
3. The Fund's appraisal of a member's exchange rate policies shall be basedon an evaluation of the developments in the member's balance of payments againstthe background of its reserve position and its external indebtedness. This appraisalshall be made within the framework of a comprehensive analysis of the generaleconomic situation and economic policy strategy of the member, and shall recog-nize that domestic as well as external policies can contribute to timely adjustmentof the balance of payments. The appraisal shall take into account the extent towhich the policies of the member, including its exchange rate policies, serve theobjectives of the continuing development of the orderly underlying conditions thatare necessary for financial stability, the promotion of sustained sound economicgrowth, and reasonable levels of employment.
Procedures for Surveillance
I. Each member shall notify the Fund in appropriate detail within thirty daysafter the Second Amendment becomes effective of the exchange arrangements itintends to apply in fulfillment of its obligations under Article IV, Section 1. Eachmember shall also notify the Fund promptly of any changes in its exchangearrangements.
II. Members shall consult with the Fund regularly under Article IV. The con-sultations under Article IV shall comprehend the regular consultations underArticles VIII and XIV. In principle such consultations shall take place annually,and shall include consideration of the observance by members of the principlesset forth above as well as of a member's obligations under Article IV, Section 1.Not later than three months after the termination of discussions between themember and the staff, the Executive Board shall reach conclusions and therebycomplete the consultation under Article IV.
III. Broad developments in exchange rates will be reviewed periodically bythe Executive Board, inter alia in discussions of the international adjustmentprocess within the framework of the World Economic Outleok. The Fund willcontinue to conduct special consultations in preparing for these discussions.
IV. The Managing Director shall maintain close contact with members inconnection with their exchange arrangements and exchange policies, and will beprepared to discuss on the initiative of a member important changes that it con-templates in its exchange arrangements or its exchange rate policies.
V. If, in the interval between Article IV consultations, the Managing Director,taking into account any views that may have been expressed by other members,considers that a member's exchange rate policies may not be in accord with theexchange rate principles, he shall raise the matter informally and confidentiallywith the member, and shall conclude promptly whether there is a question of theobservance of the principles. If he concludes that there is such a question, he shallinitiate and conduct on a confidential basis a discussion with the member underArticle IV, Section 3(/>) . As soon as possible after the completion of such adiscussion, and in any event not later than four months after its initiation, theManaging Director shall report to the Executive Board on the results of the dis-cussion. If, however, the Managing Director is satisfied that the principles arebeing observed, he shall informally advise all Executive Directors, and the staffshall report on the discussion in the context of the next Article IV consultation;but the Managing Director shall not place the matter on the agenda of the Execu-tive Board unless the member requests that this procedure be followed.
VI. The Executive Directors shall review annually the general implementationof the Fund's surveillance over members' exchange rate policies.
109
©International Monetary Fund. Not for Redistribution
APPENDIX II (continued). PRINCIPAL POLICY DECISIONS AND REPORT
K. Attribution of Repurchases Under Article V, Section 7(6)
The Executive Directors endorsed the following conclusions, effectiveMarch 23, 1977:
(i) the [present] practice . . . should be modified to allow a member incurringa repurchase obligation under Article V, Section l(b), and a memberwith outstanding purchases whose currency is sold to another membermaking use of the Fund's resources, to specify the undertaking it wishesconsidered discharged; and
(ii) if such a specification is made and the specified purchase has been financedby borrowed funds, the Fund would propose to the lender or lenders thatthey accept repayment in accordance with the specification instead of theoriginal practices of attribution. No repayment that departed from applica-tion of the original practices of attribution would be made if the lenderobjected to it.
L. Allocation of Special Drawing Rights (Article XXIV, Section 4(c))
Report by the Managing Director to theBoard of Governors and to the
Executive Directors
Article XXIV, Section l(a), of the present Articles15 provides that "In all itsdecisions with respect to the allocation and cancellation of special drawing rightsthe Fund shall seek to meet the long-term global need, as and when it arises, tosupplement existing reserve assets in such manner as will promote the attainmentof its purposes and will avoid economic stagnation and deflation as well as excessdemand and inflation in the world." Decisions to allocate or to cancel SDKs aremade by the Board of Governors on the basis of proposals of the Managing Direc-tor, concurred in by the Executive Directors. Before making any proposal, "theManaging Director, after having satisfied himself that it will be consistent with theprovisions of Section l(a) of this Article, shall conduct such consultations as willenable him to ascertain that there is broad support among participants for theproposal."16 Article XXIV, Section 4(c), of the present Articles provides thatnot later than six months before the end of each basic period the Managing Di-rector shall either make such a proposal or report to the Board of Governors andto the Executive Board that "there is no proposal which he considers to be con-sistent with the provisions of Section 1 of this Article that has broad supportamong participants."
The present basic period, which is the second one, began as an "empty" periodon January 1, 1973 in the absence of a proposal by the Managing Director andwill terminate at the end of this calendar year. I now wish to report that at thepresent time I am not in a position to make a proposal with respect to the next(third) basic period, which starts on January 1, 1978.
The possibility of an SDR allocation was not discussed by the Executive Boardbetween 1973 and 1977, and major changes occurred in the international monetarysystem during that period. Indeed, such changes began to take place immediatelyfollowing the first allocation. A figure of approximately SDR 9.5 billion hadbeen agreed for the basic period of three years, 1970-72. This amount was ex-pected to be approximately equal to the gap between the anticipated growth ofreserve needs (of perhaps SDR 4-5 billion a year) and the predicted increase inthe supply of reserves other than SDRs (some SDR 1-1.5 billion a year). Duringthe period, however, there was a dramatic shift in the trend of reserve increases.In the three years 1967-69, members' reserves had risen by about SDR 6 billion.
15 The references in this re-port to Article XXIV are tothe present Articles. Some ofthe events mentioned in thisreport might occur after theProposed Second Amendmenthas become effective. It shouldbe noted, therefore, that Ar-ticle XXIV, Sections l ( a ) a n d4 ( a ) , ( b ) , and ( c ) , will be-come A r t i c l e XVII I , Sec-tions l(a) and 4 ( a ) , ( b ) , and(c), respectively, of the amend-ed Articles.
«Ar t i c l e XXIV, Sec-tions 4(a) and ( b ) .
110
©International Monetary Fund. Not for Redistribution
APPENDIX II (concluded). PRINCIPAL POLICY DECISIONS AND REPORT
But in 1970-72 they rose by about SDR 68 billion (about SDR 15 billion in1970, SDR 30 billion in 1971, and SDR 23 billion in 1972) with less than SDR 9billion of this total coming from the SDR allocation.
When it came time to consider an allocation for the second basic period, therewas considerable support for a further allocation over a short basic period of twoyears. Some members favored an annual figure roughly the same as in the firstbasic period, others were prepared to accept an amount approximately half thissize, and some did not see the need for any allocation. On June 26, 1972, justover six months before the beginning of the second basic period, the ManagingDirector reported that he was unable to find sufficient support for an allocationproposal but indicated that he would continue his consultations. These consulta-tions, in the second half of 1972, led to the conclusion that there was not broadsupport for any proposal, and the Managing Director ceased his consultationsafter the very large increase in foreign exchange reserves (about US$20 billion)that took place in the first quarter of 1973.
Major changes have occurred and are occurring in the international monetarysystem, and the question of an SDR allocation should be considered in relationto these continuing developments. In my view, some important issues still remainopen, and the request of the Interim Committee that the Executive Directors givethe subject further study provides an opportunity to see whether these questionscan be resolved within the near future. From the consideration that has beengiven to the question of an SDR allocation in recent weeks, I would judge it un-likely that I shall be able to make a proposal before January 1, 1978. Thus, it maybe expected that the third basic period will start as an empty period.
Active consideration of the issues involved is being planned for the monthsahead. In their communiqué of April 29 the Interim Committee reached thefollowing conclusions:
The Committee also considered the question whether a further allocationof SDRs would be advisable at the present time. The Committee noted that theExecutive Directors have been discussing this question and agreed to requestthem to give further consideration to all aspects of this matter and to report tothe Committee at its first meeting in 1978.
The Committee also agreed to request the Executive Directors to reviewthe characteristics and uses of the SDR so as to promote the purposes of theFund, including the objective of making the SDR the principal reserve assetin the international monetary system.
I should note that I can make a proposal at any time during the third basicperiod when I am satisfied that the requisite conditions of Article XXIV, Sec-tion 4(b), are fulfilled, and indeed am obliged to do so by Article XXIV, Sec-tion 4(c). If the outstanding questions can be resolved, I will submit a proposal foran SDR allocation as soon as I am satisfied that one can be made that will be con-sistent with the requirements of the Articles, or, if such a proposal cannot be made,I will report to the Board of Governors and the Executive Board at an appropriatetime.
June 29, 1977
111
©International Monetary Fund. Not for Redistribution

Appendix IIIPress Communiquesand Announcements ofthe Interim Committee andthe Development Committee
Interim Committee of the Board of Governorson the International Monetary System
Press Communiqué, Sixth Meeting, Manila, October 2,1976
1. The Interim Committee of the Board of Governors of the InternationalMonetary Fund held its sixth meeting in Manila, the Philippines, on October 2,1976 under the chairmanship of Mr. Willy De Clercq, Minister of Finance of Bel-gium. Mr. H. Johannes Witteveen, Managing Director of the Fund, participatedin the meeting. The following observers attended during the Committee's discus-sions: G. D. Arsenis, Director, New York Office, UNCTAD; Henri Konan Bédié,Chairman, Development Committee; Wilhelm Haferkamp, Vice-Président inCharge of Economic and Financial Affairs, CEC; René Larre, General Manager,BIS; E. van Lennep, Secretary-General, OECD; F. Leutwiler, President, NationalBank of Swit/erland; Olivier Long, Director-General, GATT; and Robert S.McNamara, President, IBRD.
2. The Committee discussed the world economic outlook and the functioningof the international adjustment process.
The Committee welcomed the economic recovery that has been under way forthe last year; it expressed continued concern, however, about persistently highlevels of unemployment and high rates of inflation in many countries. The Com-mittee believes that in present circumstances the restoration of a reasonable degreeof price stability will be necessary to establish the basis for sustained economicgrowth and the reduction of unemployment. Accordingly, the Committee is ofthe view that policies in the industrial countries at the present time should givepriority to the reduction of price and cost inflation. This would require fiscal andmonetary policies in these countries that would provide effective control over theexpansion of aggregate demand in a manner compatible with this objective, evenwhere price and incomes policies are in effect.
The Committee further agreed that, given the constraint under which demandmanagement policies in the industrial countries must operate, special efforts,including the reduction in the barriers to trade in the negotiations now under way,to improve market access to the exports of developing countries and to increasethe flow of development assistance would be indicated.
With respect to the international adjustment process, the Committee reachedthe following conclusions:
(a) As a result of the recovery in the world economy, exports are rising inmany countries and the international environment has become much more favorablefor the adjustment of external payments positions. The Committee believes that
112
©International Monetary Fund. Not for Redistribution

APPENDIX III (continued). COMMUNIQUES AND ANNOUNCEMENTS
such adjustment, which should be symmetrical as between deficit and surpluscountries, is now both urgent and opportune.
(b) To this end, deficit countries should arrange their domestic policies so asto restrain domestic demand and to permit the shift of resources to the externalsector, to the extent necessary to bring the deficit on current account in line witha sustainable flow of capital imports and aid.
(c) Industrial countries in strong payments positions should ensure continuedadequate expansion in domestic demand, within the limits set by effective anti-inflationary policies.
(d) Exchange rates should be allowed to play their proper role in the adjust-ment process.
(e) In the context of the use of the Fund's resources, adjustment by deficitcountries can be promoted by a larger use of the credit tranches and the extendedFund facility.
3. The Committee noted that, in accordance with the agreement incorporatedin the provisions of the Proposed Second Amendment, the Fund will have theobligation to exercise firm surveillance over the exchange rate policies of members.The Executive Directors should consider how this function is to be exercised andshould report to the Committee on this subject.
4. The Committee noted the section of the Annual Report of the ExecutiveDirectors dealing with developments in international liquidity. In accordance withits terms of reference the Committee requested the Executive Directors to keepail aspects of international liquidity under review and to report to it at a latermeeting.
5. The Committee reviewed, on the basis of a report by the Executive Directors,the financial activities of the Fund, including developments in the Fund's policieson the use of its resources and in the liquidity of the Fund. The Committee notedthe unprecedented expansion in the use of the Fund's resources by members inorder to finance their balance of payments deficits and agreed that, even if allreasonable efforts toward adjustment were made, there might still be a need for alarge use of the Fund's resources in the near future. The Committee shared theview of the Executive Directors that greater emphasis should be placed on theadjustment by members of imbalances in their payments positions and that the useof the Fund's resources should present the Fund with the opportunity to promotethe use by members of the kind of adjustment measures that are most conduciveto the interest of all. The Committee noted the actions taken by the ExecutiveDirectors with regard to the Trust Fund and welcomed their intention to keep thecompensatory financing and buffer stock facilities under review.
6. The Committee endorsed the conclusions of the Executive Directors on thestate of the Fund's liquidity. The Committee urged that, pursuant to the Resolutionon Quota Increases adopted by the Board of Governors last March, all membersthat have not yet done so should make the necessary arrangements for the use oftheir currencies in the operations and transactions of the Fund in accordance withits policies. It was agreed that the Fund's liquidity should be kept under closereview. The Committee stressed the fact that prompt adoption of the ProposedSecond Amendment of the Articles and the subsequent completion of the stepsnecessary for quota increases under the Sixth General Review would provide themost effective way of improving the liquidity of the Fund.
7. The Committee noted that the Executive Directors will initiate in the nearfuture the Seventh General Review of Quotas so that it can be concluded, asplanned, in February 1978.
8. The Committee noted the report of the Executive Directors regarding theprogress made by members in connection with their acceptance of the ProposedSecond Amendment of the Fund's Articles. In view of the importance that the
113
©International Monetary Fund. Not for Redistribution

APPENDIX III (continued). COMMUNIQUES AND ANNOUNCEMENTS
entry into force of the amended Articles will have for the functioning of the inter-national monetary system, the Committee urged all members that had not yetnotified the Fund of their acceptance of the Second Amendment to complete assoon as possible the arrangements that would permit them to take this action.
9. The Committee agreed to hold its eighth meeting in Washington, D.C.,on April 18 and 19, 1977.
Announcement, Seventh Meeting, Manila, October 6,1976
The Interim Committee at its seventh meeting today in Manila selectedMr. Willy De Clercq, Minister of Finance of Belgium, to continue as its Chairmanfor a new term, following upon the election of Executive Directors of the Inter-national Monetary Fund which took place on October 5, 1976.
The Committee also decided that its eighth meeting previously announced forApril 18 and 19, 1977 is now to be held on April 28 and 29, 1977 in Wash-ington, D.C.
Press Communiqué, Eighth Meeting, Washington, April 29,1977
1. The Interim Committee of the Board of Governors of the InternationalMonetary Fund held its eighth meeting in Washington, D.C., on April 28-29,1977 under the chairmanship of Mr. Willy De Clercq, Minister of Finance ofBelgium. Mr. H. Johannes Witteveen, Managing Director of the Fund, participatedin the meeting. The following observers attended during the Committee's dis-cussions: Mr. G. D. Arsenis, Director, New York Office, UNCTAD; Mr. MahjoobA. Hassanain, Chief, Economics Department, OPEC; Mr. Pierre Languetin,General Manager, National Bank of Switzerland; Mr. René Larre, General Mana-ger, BIS; Mr. Emile van Lennep, Secretary-General, OECD; Mr. Olivier Long,Director-General, GATT; Mr. Robert S. McNamara, President, IBRD; Mr. Fran-çois-Xavier Ortoli, Vice-Président, CEC; and Mr. Cesar E. A. Virata, Chairman,Development Committee.
2. The Committee discussed the world economic outlook and the functioningof the international adjustment process.
The Committee noted the expansion of activity that has taken place in the worldeconomy over the past year and welcomed the improvement in economic outlookduring recent months following cessation of the "pause" in the industrial countries.The Committee expressed concern, however, about the persistence of high levelsof unemployment, especially among young people, and high levels of inflation inmany countries.
I. On the broad question of the economic policy options and priorities ofmember countries, the Committee agreed on the following conclusions:
(a) Policies of demand management in most countries must emphasize theneed to deal with problems of inflation and the balance of payments. Thesepolicies are being guided by the conviction that measures to combat inflation and,where necessary, to strengthen the external position are not only necessary inpresent circumstances but also will make for a better record over time in terms ofeconomic growth and employment.
(b) At the same time, special efforts should be made to improve market accessfor the exports of the developing countries and to increase the flow of officialdevelopment assistance. Any tendencies toward protectionist trade policies cannotbe considered acceptable from an international point of view and should bestrongly resisted; indeed, increased attention should be paid to the need to reducethe existing restrictions on trade. Success in the current negotiations in Genevawould make an important contribution to this end.
II. The Committee drew the following conclusions from its review of the inter-national adjustment process:
114
©International Monetary Fund. Not for Redistribution

APPENDIX III (continued). COMMUNIQUES AND ANNOUNCEMENTS
(a) The needs for adjustment remain large and, as experience shows, delaysin dealing with them can be very costly. It will take international cooperation, anddetermined action by surplus as well as deficit countries, to make continuingprogress with respect to adjustment. An encouraging development is that anumber of countries, both large and small, developed and developing, have adoptedprograms to strengthen their external positions, often in the context of stand-byarrangements approved by the Fund.
(b) Strategies of adjustment must include emphasis on conservation of energy,on elimination of domestic sources of inflation, particularly in the deficit countries,and on improvement in cost-price relationships among countries. It is importantthat industrial countries in relatively strong payments positions should ensurecontinued adequate expansion of domestic demand, within prudent limits. More-over, these countries, as well as other countries in strong payments positions, shouldpromote increased flows of long-term capital exports.
(c) Given the persistence of large payments imbalances, important demandsfor the Fund's resources can be expected to materialize. The Committee foundgood grounds for believing that expansion of the Fund's role as a financial inter-mediary could contribute significantly to promotion of international adjustmentand to maintenance of confidence in the continued expansion of the world economyand in the effective functioning of the international financial system.
3. The Committee reviewed the developments in international liquidity and inthe financial activities and resources of the Fund. In this connection, it had thebenefit of a report of the Managing Director summarizing the discussions that theExecutive Directors have had to date on these subjects. As a result of this review,the Committee reached the following conclusions:
The Committee recognized that there was an urgent need for a supplementaryarrangement of a temporary nature that would enable the Fund to expand itsfinancial assistance to those of its members that in the next several years will facepayments imbalances that are large in relation to their economies.
The Committee agreed that some of the main features of this supplementaryarrangement would be as follows :
(i) The Fund would establish substantial lines of credit in order to be able toassist members to meet their needs for supplementary assistance.
(ii) Access to assistance under the supplementary arrangement should be avail-able to all members and should be subject to adequate conditionality, and suchassistance should normally be provided on the basis of a stand-by arrangementcovering a period longer than one year.
(iii) The Fund should pay interest on amounts borrowed under the lines ofcredit at market-related interest rates, and charges by the Fund for the use bymembers of resources borrowed by it under these lines of credit should be basedon these rates. The possibility of a subsidy related to the rates of charge thatwould be payable by low-income countries should be explored.
(iv) The claims of lenders under the supplementary arrangement should beappropriately liquid.
The Committee welcomed the willingness of a number of countries in a positionto lend to the Fund to collaborate with it on arrangements for supplementary creditand urged the Managing Director to complete, as soon as possible, his discussionswith potential lenders on terms and conditions and amounts. It further requestedthe Executive Directors to take the necessary steps for making such an arrangementoperative as soon as possible.
4. The Committee considered the main issues relating to the Seventh GeneralReview of Quotas. It was agreed that, in view of the expansion of members'international transactions and the need for the Fund to be able to give balanceof payments assistance to members on a larger scale than would be available on
• the basis of quotas under the Sixth General Review, there should be an adequate
115
©International Monetary Fund. Not for Redistribution
APPENDIX III (continued). COMMUNIQUES AND ANNOUNCEMENTS
increase in the total of quotas pursuant to the Seventh General Review. On thequestion of distribution of quotas, one view was that in order to conclude theSeventh Review at an early date, increases should be equiproportional to the quotasthat will result from the Sixth General Review. Another view, however, was thata few special adjustments should be made for those members whose quotas areseriously out of line with their relative positions in the world economy, and inthis connection some emphasis should be placed on increases that would strengthenthe Fund's liquidity. The Committee urged the Executive Directors to pursue theirwork and to prepare a report, together with draft recommendations to the Boardof Governors, on increases in the quotas of members under the Seventh GeneralReview for consideration by the Committee at its next meeting.
5. The Committee also considered the question whether a further allocationof SDRs would be advisable at the present time. The Committee noted that theExecutive Directors have been discussing this question and agreed to request themto give further consideration to all aspects of this matter and to report to theCommittee at its first meeting in 1978.
The Committee also agreed to request the Executive Directors to review thecharacteristics and uses of the SDR so as to promote the purposes of the Fund,including the objective of making the SDR the principal reserve asset in the inter-national monetary system.
6. Although the Committee discussed the proposals for supplementary credit,the Seventh Quota Review and any allocation of SDRs separately as indicatedabove, members of the Committee attached importance to the interrelationshipsamong them and particularly to the overall effect of the decisions as a whole.
7. The Committee noted with satisfaction the work of the Executive Directorson the implementation of Article IV of the Proposed Amendment of the Articlesof Agreement, and welcomed the consensus reached by them on the principlesand procedures for the guidance of members and for the exercise of surveillanceby the Fund over the exchange rate policies of members in the period after theSecond Amendment has become effective. The Committee endorsed these prin-ciples and procedures, and agreed that they will make an important contributionto the effective functioning of the international monetary system in the future.
8. The Committee noted that so far no more than twenty-four members ofthe Fund having about 32 per cent of the total voting power have notified theFund of their acceptances of the Proposed Second Amendment of the Fund'sArticles and that very few members have given their formal consents to increasesin their quotas under the Sixth General Review of Quotas. The Committeeexpressed its concern at this delay and urged all members that have not yetaccepted the Proposed Second Amendment to complete as soon as possible thearrangements that would enable them to take this action and to increase theirquotas under the Sixth General Review.
9. The Committee agreed to hold its ninth meeting in Washington on Sep-tember 24, 1977.
116
©International Monetary Fund. Not for Redistribution
APPENDIX III (continued). COMMUNIQUES AND ANNOUNCEMENTS
Joint Ministerial Committee of the Boards of Governorsof the Bank and the Fund on the Transfer of Real Resourcesto Developing Countries (Development Committee)
Press Communiqué, Sixth Meeting, Manila, October 3,1976
1. The Development Committee (the Joint Ministerial Committee of the Boardsof Governors of the Bank and the Fund on the Transfer of Real Resources toDeveloping Countries) held its sixth meeting in Manila on October 3, 1976, underthe chairmanship of Mr. Henri Konan Bédié, Minister of Economy and Financefor the Ivory Coast. Mr. Robert S. McNamara, President of the World Bank,Mr. H. Johannes Witteveen, Managing Director of the International MonetaryFund and Mr. M. M. Ahmad, Acting Executive Secretary, took part in the meetingwhich was also attended by representatives from a number of international andregional organizations and Switzerland as observers.
2. The Committee approved for presentation to the Boards of Governors ofthe Fund and the World Bank its second annual report covering the periodJuly 1975 to June 1976.
3. The Committee considered the program of its future work in the light ofthe situation and prospects of developing countries. The analyses presented to itby the staffs of the IMF and the World Bank showed that the current accountdeficit of non-oil developing countries had declined somewhat but was still expectedto be running at a high annual rate of about US$32-33 billion in 1976 and thefirst half of 1977. These estimates did not suggest that a significant relief fromcurrent difficulties would be forthcoming in the early part of 1977. Many develop-ing countries, especially the middle-income countries, borrowed heavily to maintainthe flow of imports and to avoid undue interruption of their development programs,leading to an increase in their external debt and debt service payments. The low-income countries have had little or no growth in per capita income since 1970 andtheir level of imports fell by some 20 per cent below those of the late 1960s.Official aid to them has been inadequate. To assist the developing countries intheir adjustment process and to help them achieve a higher rate of growth, thelow-income countries would require additional concessional assistance and themiddle-income countries would need increased flows from both official and privatesources. To be effective, these in turn would require a greater emphasis upondomestic policies attuned toward the necessary internal adjustment processes andtoward employment creation.
4. The Committee reaffirmed its strong support for the timely and satisfactorycompletion of the Fifth Replenishment of IDA so as to permit a substantial increasein IDA resources which, in the opinion of many members, should be in real terms,and to maintain continuity of its operations beyond June 1977. The Committeealso agreed that it was important that the lending programs of the internationallending institutions remain adequate to help meet the capital requirements of thedeveloping countries. They asked the Boards of these institutions to review theadequacy of their capital resources for this purpose and, where such capital isinadequate, to review the issues prerequisite to consideration of augmenting suchcapital.
5. The Committee, with due regard to the functions of the Boards of the IMF,the World Bank, and other international institutions, desired to focus attentionon the resources situation of the international development finance institutions, onthe volume, terms and distribution of official flows, and on the role of adjustmentin the development process. The Committee agreed to establish a Working Groupwhich would, initially, consider the study of the International Resources Bankrequested of the World Bank. In addition, the group could be assigned other
117
©International Monetary Fund. Not for Redistribution

APPENDIX III (continued). COMMUNIQUES AND ANNOUNCEMENTS
specific matters, including the volume, terms and distribution of official flows. TheWorking Group will present its conclusions and recommendations for the con-sideration of the Committee.
6. The Committee received a further interim report from the Working Groupon Access to Capital Markets. It was agreed that capital market countries wouldendeavor, as far as their balance of payments situation permitted, to move pro-gressively toward greater liberalization of capital movements, in particular capitaloutflows. In the meanwhile, when regulations governing capital outflows are main-tained for unavoidable reasons,
—governments of capital market countries would afford favorable treatment, asamong foreign borrowers, to developing country borrowers with regard topermissions to make an issue or place in the issue calendar;
—those capital market countries which currently maintain quantitative limitson the amount of foreign issues in their markets would endeavor to keepdeveloping country borrowers outside these limits, at least up to specifiedamounts;
—since the Eurobond market presents potential opportunities for developingcountries to raise finance, countries whose currencies are in strong demand,and which maintain restrictions on international issues denominated in theircurrencies, would endeavor to give favorable treatment, as among foreignborrowers, to developing country borrowers.
The Committee noted a number of recommendations in the report that considera-tion be given to the removal of legal and administrative barriers so far as isconsistent with investors' protection and urged capital market countries to givethem earnest consideration.
7. The Committee recognized the need to reinforce and expand technicalassistance activities in the field of access to capital markets, noted the bilateralprograms already in the field, recognized the need to coordinate the implementationof present and future available services, and recommended that attention be givenby the Board of IFC to the possibility of IFC expanding its activities.
8. The Committee stressed the importance of co-financing by international andregional development banks as a means of augmenting private capital flows tosome developing countries, noted the progress being made in this regard and urgedthat these arrangements be further expanded.
9. The Committee noted with satisfaction that the Working Group had con-sidered the subject of multilateral guarantees and the proposal for an internationalinvestment trust and asked that it continue its studies on these subjects. The Com-mittee also agreed that the Working Group should present to the Committee at itsnext meeting concrete recommendations for improving the various reporting sys-tems on international financial stocks and flows.
10. The Committee agreed to meet again on October 6 in Manila and alsotentatively to meet on April 17, 1977, in Washington, D.C., the time of the nextmeeting of the Interim Committee.
11. The Committee expressed its deep appreciation to the Government of theRepublic of the Philippines for its warm hospitality and for the excellent facilitiesprovided to the Committee for the conduct of its meetings.
Announcement, Seventh Meeting, Manila, October 6,1976
At its seventh meeting in Manila on October 6, 1976, the Development Com-mittee selected the Honorable Cesar E.A. Virata, Secretary of Finance of thePhilippines, as Chairman and appointed Sir Richard King, K.C.B., M.C., of theUnited Kingdom, as Executive Secretary. Sir Richard is currently PermanentSecretary of the Ministry of Overseas Development.
118
©International Monetary Fund. Not for Redistribution
APPENDIX III (concluded). COMMUNIQUES AND ANNOUNCEMENTS
At its eighth meeting in Washington, the Development Committee decided notto issue a Press Communiqué. It decided that the ninth meeting would take placein Washington on September 25, 1977.
119
©International Monetary Fund. Not for Redistribution
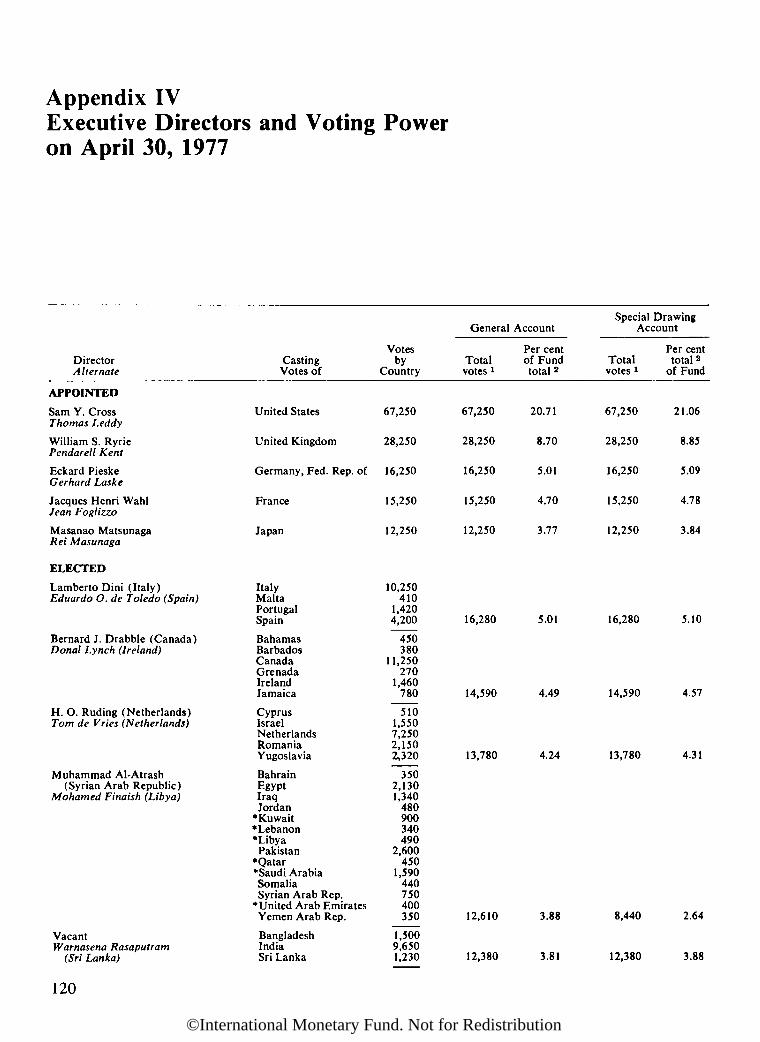
Appendix IVExecutive Directors and Voting Poweron April 30, 1977
DirectorAlternate
APPOINTED
Sam Y. CrossThomas Leddy
William S. RyriePendarell Kent
Eckard PieskeGerhard Laske
Jacques Henri WahlJean Foglizzo
Masanao MatsunagaRei Masunaga
ELECTED
Lamberto Dini (Italy)Eduardo O. de Toledo (Spain)
Bernard J. Drabble (Canada)Donal Lynch (Ireland)
H. O. Ruding (Netherlands)Tom de Vries (Netherlands)
Muhammad Al-Atrash(Syrian Arab Republic)
Mohamed Finaish (Libya)
VacantWarnasena Rasaputram
(Sri Lanka)
CastingVotes of
United States
United Kingdom
Germany, Fed. Rep. of
France
Japan
ItalyMaltaPortugalSpain
BahamasBarbadosCanadaGrenadaIrelandJamaica
CyprusIsraelNetherlandsRomaniaYugoslavia
BahrainEgyptIraqJordan
*Kuwait"•Lebanon»LibyaPakistan
»Qatar»Saudi ArabiaSomaliaSyrian Arab Rep.
»United Arab EmiratesYemen Arab Rep.
BangladeshIndiaSri Lanka
Votesby
Country
67,250
28,250
16,250
15,250
12,250
10,250410
1,4204,200
450380
11,250270
1,460780
5101,5507,2502,1502i,320
3502,1301,340
480900340490
2,600450
1,590440750400350
1,5009,6501,230
Special DrawingGeneral Account Account
Per cent Per centTotal of Fund Total total 2votes 1 total 2 votes * of Fund
67,250 20.71 67,250 21.06
28,250 8.70 28,250 8.85
16,250 5.01 16,250 5.09
15,250 4.70 15,250 4.78
12,250 3.77 12,250 3.84
16,280 5.01 16,280 5.10
14,590 4.49 14,590 4.57
13,780 4.24 13,780 4.31
12,610 3.88 8,440 2.64
12,380 3.81 12,380 3.88
120
©International Monetary Fund. Not for Redistribution
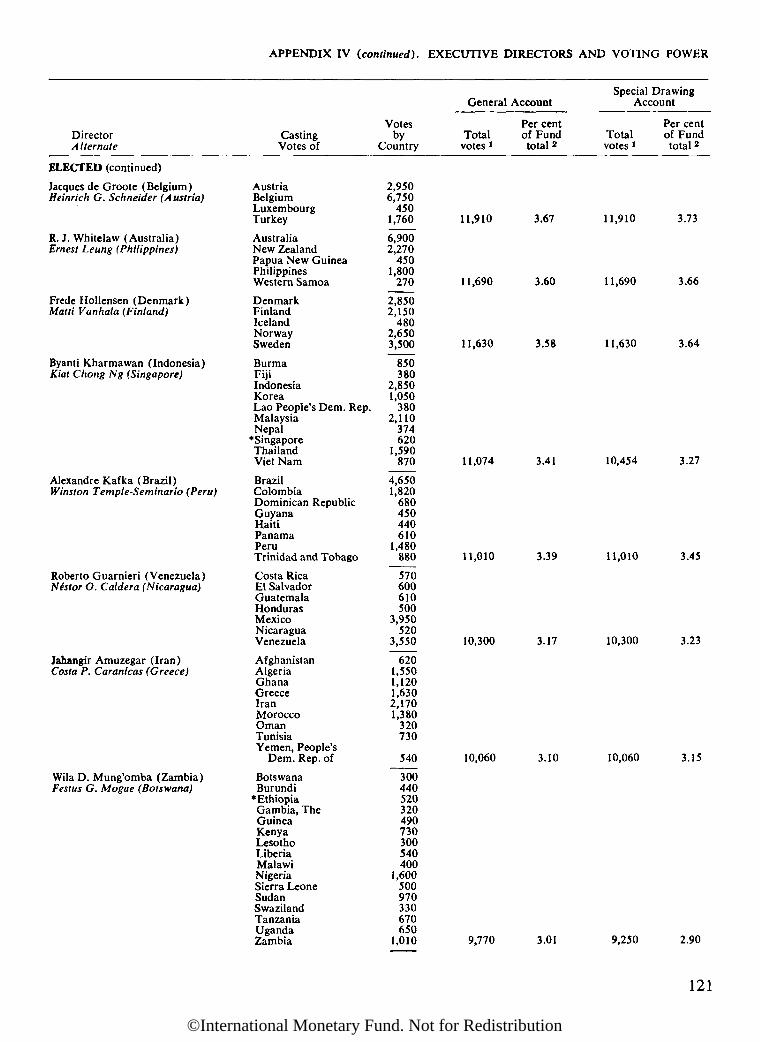
APPENDIX IV (continued). EXECUTIVE DIRECTORS AND VOTING POWER
DirectorAltérnale
ELECTED (continued)
Jacques de Groóte (Belgium)Heinrich G. Schneider (Austria)
R. J. Whitelaw (Australia)Ernest Leung (Philippines)
Frede Hollensen (Denmark)Matti Vanhala (Finland)
Byanti Kharmawan (Indonesia)Kiat Chong Ng (Singapore)
Alexandre Kafka (Brazil)Winston Temple-Seminario (Peru)
Roberto Guarnieri (Venezuela)Néstor O. Caldera (Nicaragua)
Jahangir Amuzegar (Iran)Costa P. Coránicas (Greece)
Wila D. Mung'omba (Zambia)Festus G. Mogae (Botswana)
CastingVotes of
AustriaBelgiumLuxembourgTurkey
AustraliaNew ZealandPapua New GuineaPhilippinesWestern Samoa
DenmarkFinlandIcelandNorwaySweden
BurmaFijiIndonesiaKoreaLao People's Dem. Rep.MalaysiaNepal
»SingaporeThailandViet Nam
BrazilColombiaDominican RepublicGuyanaHaitiPanamaPeruTrinidad and Tobago
Costa RicaEl SalvadorGuatemalaHondurasMexicoNicaraguaVenezuela
AfghanistanAlgeriaGhanaGreeceIranMoroccoOmanTunisiaYemen, People's
Dem. Rep. of
BotswanaBurundi
»EthiopiaGambia, TheGuineaKenyaLesothoLiberiaMalawiNigeriaSierra LeoneSudanSwazilandTanzaniaUgandaZambia
General Account
Votes Per centby Total of Fund
Country votes 1 total 2
2,9506,750
4501,760 11,910 3.67
6,9002,270
4501,800
270 11,690 3.60
2,8502,150
4802,6503,500 11,630 3.58
850380
2,8501,050
3802,110
374620
1,590870 11,074 3.41
4,6501,820
680450440610
1,480880 11,010 3.39
570600610500
3,950520
3,550 10,300 3.17
6201,5501,1201,6302,1701,380
320730
540 10,060 3.10
300440520320490730300540400
1,600500970330670650
1,010 9,770 3.01
Special DrawingAccount
Per centTotal of Fundvotes ! total 2
11,910 3.73
11,690 3.66
11,630 3.64
10,454 3.27
11,010 3.45
10,300 3.23
10,060 3.15
9,250 2.90
121
©International Monetary Fund. Not for Redistribution

APPENDIX IV (concluded). EXECUTIVE DIRECTORS AND VOTING POWER
DirectorAlternate
CastingVotes of
Votesby
Country
General
Totalvotes !
Account
Per centof Fundtotal 2
Special DrawingAccount
Totalvotes 1
Per centof Fundtotal 2
ELECTED (concluded)
Dante Simone (Argentina)Alfredo Crespo (Ecuador)
Samuel Nana-Sinkam (Cameroon)Victor Alipui (Togo)
ArgentinaBoliviaChileEcuadorParaguayUruguay
BeninCameroonCentral African EmpireChadCongo, People's Rep.
of theEquatorial GuineaGabonIvory CoastMadagascarMaliMauritaniaMauritiusNigerRwandaSenegalTogoUpper VoltaZaïre
4,650620
1,830580440940
380600380380
380330400770510470380470380440590400380
1,380
9,060 2.79 9,060 2.84
9,020 2.78 9,020 2.82
314,4143 96.S42 309,1043 96.79 2
* Not a participant in the Special Drawing Account.1 Voting power varies on certain matters pertaining to the
General Account with use of the Fund's resources in thatAccount. In voting on matters relating exclusively to the SpecialDrawing Account, only the number of votes allotted to mem-bers which are participants may be cast.
2 Percentages of total votes of members in the GeneralAccount (324,665) and total votes of participants in the SpecialDrawing Account (319,355), respectively. The sum of the
individual percentages may differ from the percentages of thetotals because of rounding.
3 This total does not include the votes of Cambodia, Comoros,China, and South Africa, which did not participate in the 1976Regular Election of Executive Directors, and of Guinea-Bissau,which became a member after that election. The combinedvotes of the five members total 10,251 votes—3.16 per cent ofthose in the General Account and 3.21 per cent of those in theSpecial Drawing Account, respectively.
122
©International Monetary Fund. Not for Redistribution

Appendix VChanges in Membershipof Executive Board
Changes in the membership of the Executive Board between May 1, 1976 andApril 30, 1977 were as follows:
Peter J. Bull (United Kingdom) resigned as Alternate Executive Director toWilliam S. Ryrie (United Kingdom), effective May 2, 1976.
Pendarell Kent (United Kingdom) was appointed Alternate Executive Directorto William S. Ryrie (United Kingdom), effective May 3, 1976.
W.M. Tilakaratna (Sri Lanka) resigned as Alternate Executive Director toS. Jagannathan (India), effective June 30, 1976.
Warnasena Rasaputram (Sri Lanka) was appointed Alternate Executive Direc-tor to S. Jagannathan (India), effective July 1, 1976. He was appointed AlternateExecutive Director to M.G. Kaul (India), effective November 1, 1976.
Francesco Palamenghi-Crispi (Italy) resigned as Executive Director for Italy,Malta, Portugal, and Spain, effective July 5, 1976.
J.B. Zulu (Zambia) resigned as Alternate Executive Director to Horace R.Monday, Jr., effective July 5, 1976.
Lamberto Dini (Italy) was elected Executive Director by Italy, Malta, Portugal,and Spain, effective July 6, 1976. He was re-elected, effective November 1, 1976.
Eduardo O. de Toledo (Spain), formerly Alternate Executive Director toFrancesco Palamenghi-Crispi (Italy), was appointed Alternate Executive Directorto Lamberto Dini (Italy), effective July 6, 1976, and was reappointed, effectiveNovember 1, 1976.
Roberto Gavaldá (Argentina) resigned as Executive Director for Argentina,Bolivia, Chile, Ecuador, Paraguay, and Uruguay, effective July 15, 1976.
Mikio Wakatsuki (Japan) resigned as Alternate Executive Director to KaichiKawaguchi (Japan), effective July 19, 1976.
Rei Masunaga (Japan) was appointed Alternate Executive Director to KaichiKawaguchi (Japan), effective July 20, 1976. He was appointed Alternative Execu-tive Director to Masanao Matsunaga (Japan), effective November 1, 1976.
Dante Simone (Argentina) was elected Executive Director by Argentina,Bolivia, Chile, Ecuador, Paraguay, and Uruguay, effective July 20, 1976. He wasre-elected, effective November 1, 1976.
Santiago Sevilla (Ecuador), formerly Alternate Executive Director to RobertoGavaldá (Argentina), was appointed Alternate Executive Director to DanteSimone (Argentina), effective July 20, 1976. He was reappointed, effectiveNovember 1, 1976. He resigned, effective December 31, 1976.
Wila D. Mung'omba (Zambia) was appointed Alternate Executive Director toHorace R. Monday, Jr., effective October 4, 1976. He was elected Executive
123
©International Monetary Fund. Not for Redistribution

APPENDIX V (continued). CHANGES IN MEMBERSHIP OF EXECUTIVE BOARD
Director by Botswana, Burundi, Ethiopia, The Gambia, Guinea, Kenya, Lesotho,Liberia, Malawi, Nigeria, Sierra Leone, the Sudan, Swaziland, Tanzania, Uganda,and Zambia, effective November 1, 1976.
Tom de Vries (Netherlands) was reappointed Alternate Executive Director toPieter Lieftinck (Netherlands), effective October 30, 1976. He was appointedAlternate Executive Director to И.О. Ruding (Netherlands), effective January 1,1977.
Per Âsbrink (Sweden) completed his term of service as Executive Director forDenmark, Finland, Iceland, Norway, and Sweden, effective October 31, 1976.
R.S. Deane (New Zealand) completed his term of service as Alternate ExecutiveDirector to R.J. Whitelaw (Australia), effective October 31, 1976.
Nazih Ahmed Deif (Egypt) completed his term of service as Executive Directorfor Bahrain, Egypt, Iraq, Jordan, Kuwait, Lebanon, Libya, Pakistan, Qatar, SaudiArabia, Somalia, the Syrian Arab Republic, the United Arab Emirates, and theYemen Arab Republic, effective October 31, 1976.
S. Jagannathan (India) completed his term of service as Executive Directorfor Bangladesh, India, and Sri Lanka, effective October 31, 1976.
Kaichi Kawaguchi (Japan) resigned as Executive Director for Japan, effectiveOctober 31, 1976.
Sein Maung (Burma) completed his term of service as Alternate ExecutiveDirector to Byanti Kharmawan (Indonesia), effective October 31, 1976.
Horace R. Monday, Jr. (The Gambia) completed his term of service as Execu-tive Director for Botswana, Burundi, Ethiopia, The Gambia, Guinea, Kenya,Lesotho, Liberia, Malawi, Nigeria, Sierra Leone, the Sudan, Swaziland, Tanzania,Trinidad and Tobago, Uganda, and Zambia, effective October 31, 1976.
Francisco Suárez (Mexico) completed his term of service as Executive Directorfor Costa Rica, El Salvador, Guatemala, Honduras, Mexico, Nicaragua, andVenezuela, effective October 31, 1976.
Antoine W. Yaméogo (Upper Volta) completed his term of service as ExecutiveDirector for Benin, Cameroon, the Central African Empire, Chad, the People'sRepublic of the Congo, Equatorial Guinea, Gabon, Ivory Coast, Madagascar,Mali, Mauritania, Mauritius, Niger, Rwanda, Senegal, Togo, Upper Volta, andZaïre, effective October 31, 1976.
Muhammad Al-Atrash (Syrian Arab Republic) was elected Executive Directorby Bahrain, Egypt, Iraq, Jordan, Kuwait, Lebanon, Libya, Pakistan, Qatar, SaudiArabia, Somalia, the Syrian Arab Republic, the United Arab Emirates, and theYemen Arab Republic, effective November 1, 1976.
Mohamed Finaish (Libya), formerly Alternate Executive Director to NazihAhmed Deif (Egypt), was appointed Alternate Executive Director to MuhammadAl-Atrash (Syrian Arab Republic), effective November 1, 1976.
Jahangir Amuzegar (Iran) was re-elected Executive Director by Afghanistan,Algeria, Ghana, Greece, Iran, Morocco, Oman, Tunisia, and the People's Demo-cratic Republic of Yemen, effective November 1, 1976.
Costa P. Caranicas (Greece) was reappointed Alternate Executive Director toJahangir Amuzegar (Iran), effective November 1, 1976.
Jacques de Groóte (Belgium) was re-elected Executive Director by Austria,Belgium, Luxembourg, and Turkey, effective November 1, 1976.
Heinrich G. Schneider (Austria) was reappointed Alternate Executive Directorto Jacques de Groóte (Belgium), effective November 1, 1976.
124
©International Monetary Fund. Not for Redistribution

APPENDIX V (continued). CHANGES IN MEMBERSHIP OF EXECUTIVE BOARD
Bernard J. Drabble (Canada), formerly Executive Director for the Bahamas,Barbados, Canada, Ireland, and Jamaica, was elected Executive Director by theBahamas, Barbados, Canada, Grenada, Ireland, and Jamaica, effective Novem-ber 1,1976.
Donal Lynch (Ireland) was reappointed Alternate Executive Director toBernard J. Drabble (Canada), effective November 1, 1976.
Roberto Guarnieri (Venezuela), formerly Alternate Executive Director toFrancisco Suárez (Mexico), was elected Executive Director by Costa Rica, ElSalvador, Guatemala, Honduras, Mexico, Nicaragua, and Venezuela, effectiveNovember 1, 1976.
Néstor O. Caldera (Nicaragua) was appointed Alternate Executive Director toRoberto Guarnieri (Venezuela), effective November 1, 1976.
Frede Hollensen (Denmark) was elected Executive Director by Denmark,Finland, Iceland, Norway, and Sweden, effective November 1, 1976.
J0rn H. Kjaer (Denmark), formerly Alternate Executive Director to PerAsbrink (Sweden), was appointed Alternate Executive Director to FredeHollensen (Denmark), effective November 1, 1976. He resigned, effective Feb-ruary 28, 1977.
Alexandre Kafka (Brazil), formerly Executive Director for Brazil, Colombia,the Dominican Republic, Guyana, Haiti, Panama, and Peru, was elected ExecutiveDirector by Brazil, Colombia, the Dominican Republic, Guyana, Haiti, Panama,Peru, and Trinidad and Tobago, effective November 1, 1976.
M.G. Kaul (India) was elected Executive Director by Bangladesh, India, andSri Lanka, effective November 1, 1976. He died on March 14, 1977.
Byanti Kharmawan (Indonesia), formerly Executive Director for Burma,Cambodia, Fiji, Indonesia, Korea, Lao People's Democratic Republic, Malaysia,Nepal, Singapore, Thailand, and Viet Nam, was elected Executive Director byBurma, Fiji, Indonesia, Korea, Lao People's Democratic Republic, Malaysia,Nepal, Singapore, Thailand, and Viet Nam, effective November 1, 1976.
Kiat Chong Ng (Singapore) was appointed Alternate Executive Director toByanti Kharmawan (Indonesia), effective November 1, 1976.
Pieter Lieftinck (Netherlands) was re-elected Executive Director by Cyprus,Israel, the Netherlands, Romania, and Yugoslavia, effective November 1, 1976.He resigned, effective December 31, 1976.
Masanao Matsunaga (Japan) was appointed Executive Director by Japan,effective November 1, 1976.
Festus G. Mogae (Botswana) was appointed Alternate Executive Director toWila D. Mung'omba (Zambia), effective November 1, 1976.
Samuel Nana-Sinkam (Cameroon), formerly Alternate Executive Director toAntoine W. Yaméogo (Upper Volta), was elected Executive Director by Benin,Cameroon, the Central African Empire, Chad, the People's Republic of the Congo,Equatorial Guinea, Gabon, Ivory Coast, Madagascar, Mali, Mauritania, Mauritius,Niger, Rwanda, Senegal, Togo, Upper Volta, and Zaïre, effective November 1,1976.
RJ. Whitelaw (Australia), formerly Executive Director for Australia, NewZealand, the Philippines, and Western Samoa, was elected Executive Director byAustralia, New Zealand, Papua New Guinea, the Philippines, and Western Samoa,effective November 1, 1976.
Ernest Leung (Philippines) was appointed Alternate Executive Director toR.J. Whitelaw (Australia), effective November 1, 1976.
125
©International Monetary Fund. Not for Redistribution
APPENDIX V (continued). CHANGES IN MEMBERSHIP OF EXECUTIVE BOARD
H.O. Ruding (Netherlands) was elected Executive Director by Cyprus, Israel,the Netherlands, Romania, and Yugoslavia, effective January 1, 1977.
Victor Alipui (Togo) was appointed Alternate Executive Director to SamuelNana-Sinkam (Cameroon), effective January 19, 1977.
Alfredo Crespo (Ecuador) was appointed Alternate Executive Director toDante Simone (Argentina), effective January 21, 1977.
Matti Vanhala (Finland) was appointed Alternate Executive Director to FredeHollensen (Denmark), effective March 1, 1977.
126
©International Monetary Fund. Not for Redistribution

APPENDIX V (concluded). CHANGES IN MEMBERSHIP OF EXECUTIVE BOARD
The following served at certain times during 1976/77 as Temporary AlternateExecutive Directors to the Executive Directors indicated:
Temporary AlternateExecutive Director
KadhimAl-Eyd (Iraq)Victor Alipui (Togo)
Valéry D. Amiel (Israel)
Samuel Arancibia (Chile)
Eimar Avillez (Brazil)Matthias Berger (Germany, Fed. Rep. of)Dominique Berthet (France)Jean-Marc Bisson (Canada)Inga Björk-Klevby (Sweden)Christian Bouchard (Gabon)Ian M. Cobbold (United Kingdom)Juan Maria Cock Londoño (Colombia)
James K.E. Cole (Sierra Leone)
Roger De Beckker (Belgium)
K.L. Deshpande (India)
Anne Doizé (Belgium)Bernd Goos (Germany, Fed. Rep. of)Guillermo Heyden Q. (Costa Rica)Fouad K. Hussein (Egypt)Trond M. Johansen (Norway)Ahmad Karimi (Iran)Reza Khonsary (Iran)
Haruhiko Kuroda (Japan)
Carl J. Lohmann (United States)Abdul Malek (Malaysia)Yves Jean Marie Mersch (Luxembourg)Alan G. Morris (Australia)Hicham Mutewalli (Syrian Arab Republic)Alan B. Nymark (Canada)F.L. Osunsade (Nigeria)
Chike C. Ozumba (Nigeria)
S.K. Panya (Lao People's Dem. Rep.)Markku Pietinen (Finland)
Emilio Sacerdoti (Italy)
Sharad P. Upasani (India)
Luis Felipe Vilches (Mexico)
Mohamed A. Wasfy (Egypt)Paul Zimmer (Luxembourg)
A.G. Zoccali (Argentina)
Executive Director for whomTemporary Alternate Served
Muhammad Al-Atrash (Syrian Arab Republic)Samuel Nana-Sinkam (Cameroon)Pieter Lieftinck (Netherlands)И.О. Ruding (Netherlands)Roberto Gavaldá (Argentina)Dante Simone (Argentina)Alexandre Kafka (Brazil)Eckard Pieske (Germany, Fed. Rep. of)Jacques Henri Wahl (France)Bernard J. Drabble (Canada)Frede Hollensen (Denmark)Samuel Nana-Sinkam (Cameroon)William S. Ryrie (United Kingdom)Alexandre Kafka (Brazil)Horace R. Monday, Jr. (The Gambia)Wila D. Mung'omba (Zambia)Jacques de Groóte (Belgium)S. Jagannathan (India)M.G. Kaul (India)Jacques de Groóte (Belgium)Eckard Pieske (Germany, Fed. Rep. of)Francisco Suárez (Mexico)Nazih Ahmed Deif (Egypt)Frede Hollensen (Denmark)Jahangir Amuzegar (Iran)Jahangir Amuzegar (Iran)Kaichi Kawaguchi (Japan)Masanao Matsunaga (Japan)Sam Y. Cross (United States)Byanti Kharmawan (Indonesia)Jacques de Groóte (Belgium)R.J. Whitelaw (Australia)Muhammad Al-Atrash (Syrian Arab Republic)Bernard J. Drabble (Canada)Wila D. Mung'omba (Zambia)Horace R. Monday, Jr. (The Gambia)Wila D. Mung'omba (Zambia)Byanti Kharmawan (Indonesia)PerÂsbrink (Sweden)Francesco Palamenghi-Crispi (Italy)Lamberto Dini (Italy)S. Jagannathan (India)M.G. Kaul (India)Francisco 'Suárez (Mexico)Roberto Guarnieri (Venezuela)Nazih Ahmed Deif (Egypt)Jacques de Groóte (Belgium)Roberto Gavaldá (Argentina)Dante. Simone. ( Aroentinal
127
©International Monetary Fund. Not for Redistribution

Appendix VIAdministrative Budget
Letter of Transmittal
August 2, 1977
Dear Mr. Chairman:
The administrative budget of the Fund approved by the Executive Board for thefiscal year ending April 30, 1978 is presented herewith, in accordance with Sec-tion 20 of the By-Laws. The presentation also shows actual expenses for the pasttwo fiscal years.
I should like to point out that it is of course impossible to predict whether theamounts budgeted will, in fact, meet the requirements of the Fund's program. Theamounts shown are estimates of requirements on the basis of the expected level ofactivities. Should contingencies arise or present plans change materially, the man-agement would recommend appropriate amendments to the Executive Board.
Yours sincerely,/s/
H. JOHANNES WITTEVEENChairman of the Executive Board
Chairman of the Board of GovernorsInternational Monetary Fund
128
©International Monetary Fund. Not for Redistribution
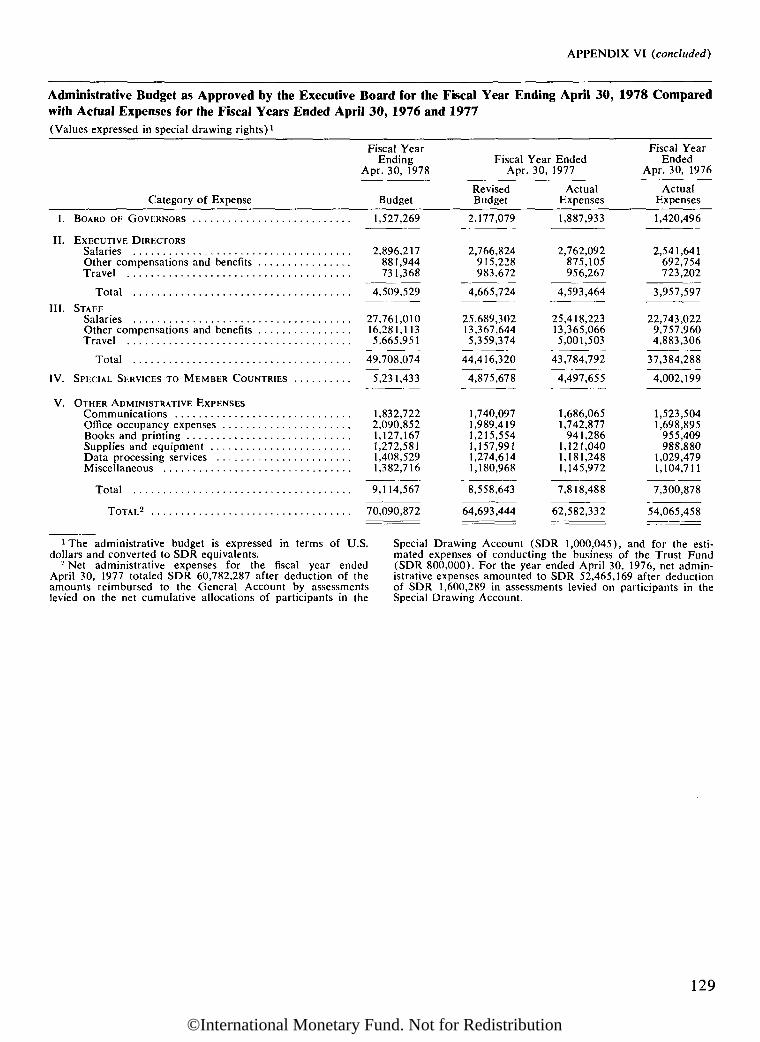
APPENDIX VI (concluded)
Administrative Budget as Approved by the Executive Board for the Fiscal Year Ending April 30, 1978 Comparedwith Actual Expenses for the Fiscal Years Ended April 30,1976 and 1977(Values expressed in special drawing rights)1
I
II.
III.
W
V.
Category of Expense
BOARD OF GOVERNORS
EXECUTIVE DIRECTORSSalariesOther compensations and benefitsTravel
Total
STAFFSalariesOther compensations and benefitsTravel
Total . . . .
SPECIAL SERVICES то MEMBER COUNTRIES
OTHER ADMINISTRATIVE EXPENSESCommunications . . .Office occupancy expensesBooks and printingSupplies and equipmentData processing services . .Miscellaneous
Total
TOTAL2
Fiscal YearEnding
Apr. 30, 1978
Budget
1,527 269
2,896,217881,944731,368
4,509,529
27,761,01016,281,1135,665,951
49,708 074
5,231,433
1,832,7222,090,8521,127,1671,272,5811,408,5291,382,716
9,114,567
70,090,872
Fiscal "VApr.
RevisedBudget
2,177,079
2,766,824915,228983,672
4,665,724
25,689,30213,367,6445,359,374
44,416,320
4,875,678
1,740,0971,989,4191,215,5541,157,9911,274,6141,180,968
8,558,643
64,693,444
rear Ended30, 1977
ActualExpenses
1,887,933
2,762,092875,105956,267
4,593,464
25,418,22313,365,0665,001,503
43,784,792
4,497,655
1,686,0651,742,877
941,2861,121,0401,181,2481,145,972
7,818,488
62,582,332
Fiscal YearEnded
Apr. 30, 1976
ActualExpenses
1,420,496
2,541,641692,754723,202
3,957,597
22,743,0229,757,9604,883,306
37,384,288
4,002,199
1,523 5041,698,895
955,409988 880
1,029 4791 104711
7 300 878
54 065 458
1 The administrative budget is expressed in terms of U.S.dollars and converted to SDR equivalents.
2 Net administrative expenses for the fiscal year endedApril 30, 1977 totaled SDR 60,782,287 after deduction of theamounts reimbursed to the General Account by assessmentslevied on the net cumulative allocations of participants in the
Special Drawing Account (SDR 1,000,045), and for the esti-mated expenses of conducting the business of the Trust Fund(SDR 800,000). For the year ended April 30, 1976, net admin-istrative expenses amounted to SDR 52,465,169 after deductionof SDR 1,600,289 in assessments levied on participants in theSpecial Drawing Account.
129
©International Monetary Fund. Not for Redistribution
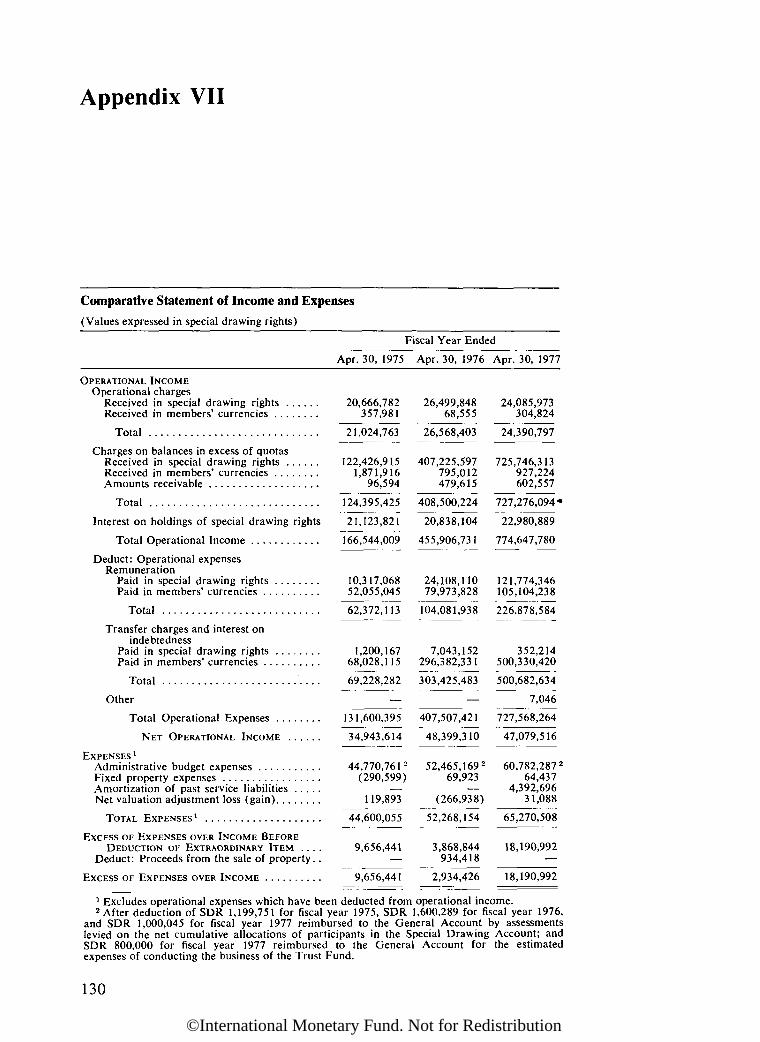
Appendix VII
Comparative Statement of Income and Expenses
(Values expressed in special drawing rights)
Fiscal Year Ended
OPERATIONAL INCOMEOperational charges
Received in special drawing rights .Received in members' currencies
Total
Charges on balances in excess of quotasReceived in special drawing rights . . .Received in members' currenciesAmounts receivable
Total
Interest on holdings of special drawing rights
Total Operational Income
Deduct: Operational expensesRemuneration
Paid in special drawing rightsPaid in members' currencies
Total . . .
Transfer charges and interest onindebtedness
Paid in special drawing rights . .Paid in members' currencies .. .
Total
Other
Total Operational Expenses
NET OPERATIONAL INCOME
EXPENSES1
Administrative budget expenses . .Fixed property expensesAmortization of past service liabilitiesNet valuation adjustment loss (gain)
TOTAL EXPENSES1
EXCESS OF EXPENSES OVER INCOME BEFOREDEDUCTION OF EXTRAORDINARY ITEM . . . .
Deduct: Proceeds from the sale of property. .
EXCESS OF EXPENSES OVER INCOME
Apr. 30, 1975
20,666,782357,981
21,024,763
122,426,9151,871,916
96,594
124,395,425
21,123,821
166,544,009
10,317,06852,055,045
62,372,113
1,200,16768,028,115
69,228,282
—
131,600,395
34,943,614
44,770,7 '61 2
(290,599)
119,893
44,600,055
9,656,441
9,656,441
Apr. 30, 1976
26,499,84868,555
26,568,403
407,225,597795,012479,615
408,500,224
20,838,104
455,906,731
24,108,11079,973,828
104,081,938
7,043,152296,382,331
303,425,483
—
407,507,421
48,399,310
52,465,169 2
69,923
(266,938)
52,268,154
3,868,844934,418
2,934,426
Apr. 30, 1977
24,085,973304,824
24,390,797
725,746,313927,224602,557
727,276,094«
22,980,889
774,647,780
121,774,346105,104,238
226,878,584
352,214500,330,420
500,682,634
7,046
727,568,264
47,079,516
60,782,287 2
64,4374,392,696
31,088
65,270,508
18,190,992
18,190,992
1 Excludes operational expenses which have been deducted from operational income.2 After deduction of SDR 1,199,751 for fiscal year 1975, SDR 1,600,289 for fiscal year 1976,
and SDR 1,000,045 for fiscal year 1977 reimbursed to the General Account by assessmentslevied on the net cumulative allocations of participants in the Special Drawing Account; andSDR 800,000 for fiscal year 1977 reimbursed to the General Account for the estimatedexpenses of conducting the business of the Trust Fund.
130
©International Monetary Fund. Not for Redistribution
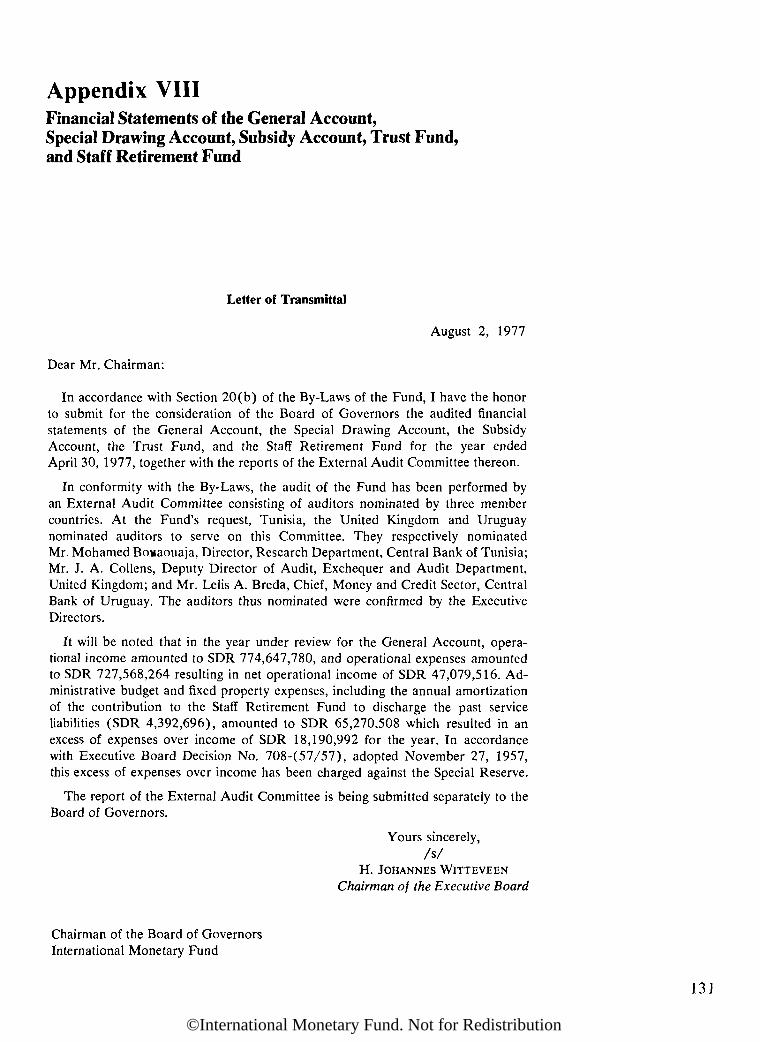
Appendix VIIIFinancial Statements of the General Account,Special Drawing Account, Subsidy Account, Trust Fund,and Staff Retirement Fund
Letter of Transmittal
August 2, 1977
Dear Mr. Chairman:
In accordance with Section 20(b) of the By-Laws of the Fund, I have the honorto submit for the consideration of the Board of Governors the audited financialstatements of the General Account, the Special Drawing Account, the SubsidyAccount, the Trust Fund, and the Staff Retirement Fund for the year endedApril 30, 1977, together with the reports of the External Audit Committee thereon.
In conformity with the By-Laws, the audit of the Fund has been performed byan External Audit Committee consisting of auditors nominated by three membercountries. At the Fund's request, Tunisia, the United Kingdom and Uruguaynominated auditors to serve on this Committee. They respectively nominatedMr. Mohamed Boiiaouaja, Director, Research Department, Central Bank of Tunisia;Mr. J. A. Collens, Deputy Director of Audit, Exchequer and Audit Department,United Kingdom; and Mr. Lelis A. Breda, Chief, Money and Credit Sector, CentralBank of Uruguay. The auditors thus nominated were confirmed by the ExecutiveDirectors.
It will be noted that in the year under review for the General Account, opera-tional income amounted to SDR 774,647,780, and operational expenses amountedto SDR 727,568,264 resulting in net operational income of SDR 47,079,516. Ad-ministrative budget and fixed property expenses, including the annual amortizationof the contribution to the Staff Retirement Fund to discharge the past serviceliabilities (SDR 4,392,696), amounted to SDR 65,270,508 which resulted in anexcess of expenses over income of SDR 18,190,992 for the year. In accordancewith Executive Board Decision No. 708-(57/57), adopted November 27, 1957,this excess of expenses over income has been charged against the Special Reserve.
The report of the External Audit Committee is being submitted separately to theBoard of Governors.
Yours sincerely,/s/
H. JOHANNES WITTEVEENChairman of the Executive Board
Chairman of the Board of GovernorsInternational Monetary Fund
131
©International Monetary Fund. Not for Redistribution
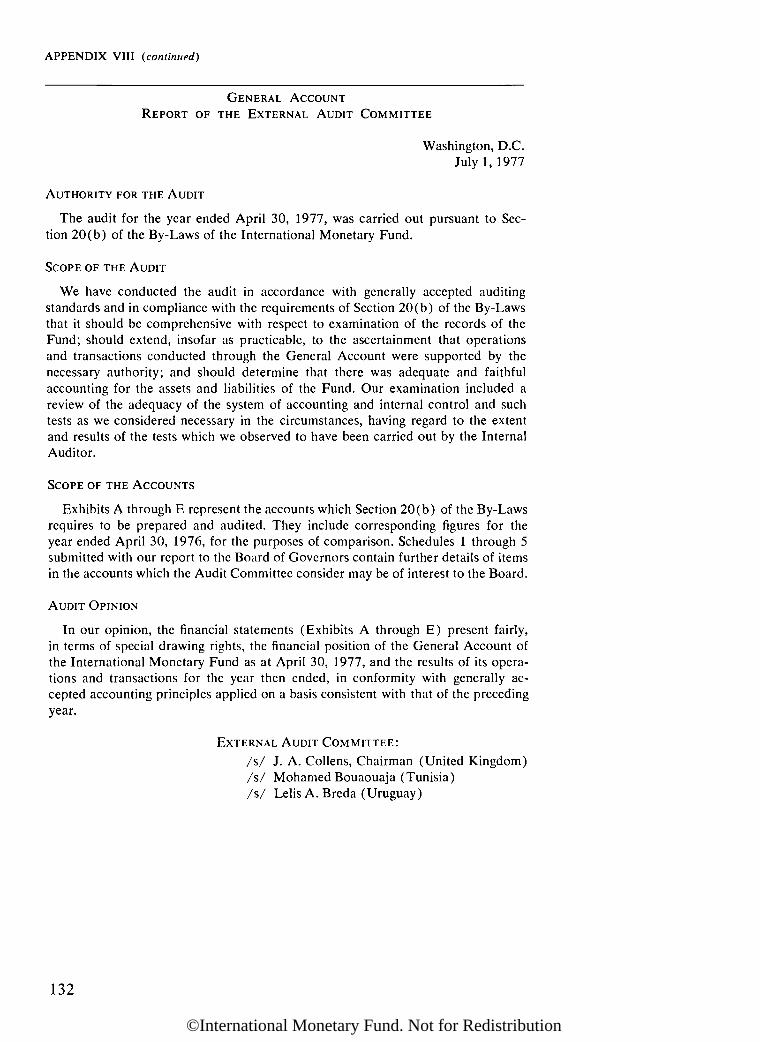
APPENDIX VIII (continued)
GENERAL ACCOUNTREPORT OF THE EXTERNAL AUDIT COMMITTEE
Washington, D.C.July 1, 1977
AUTHORITY FOR THE AUDIT
The audit for the year ended April 30, 1977, was carried out pursuant to Sec-tion 20(b) of the By-Laws of the International Monetary Fund.
SCOPE OF THE AUDIT
We have conducted the audit in accordance with generally accepted auditingstandards and in compliance with the requirements of Section 20(b) of the By-Lawsthat it should be comprehensive with respect to examination of the records of theFund; should extend, insofar as practicable, to the ascertainment that operationsand transactions conducted through the General Account were supported by thenecessary authority; and should determine that there was adequate and faithfulaccounting for the assets and liabilities of the Fund. Our examination included areview of the adequacy of the system of accounting and internal control and suchtests as we considered necessary in the circumstances, having regard to the extentand results of the tests which we observed to have been carried out by the InternalAuditor.
SCOPE OF THE ACCOUNTS
Exhibits A through E represent the accounts which Section 20 (b) of the By-Lawsrequires to be prepared and audited. They include corresponding figures for theyear ended April 30, 1976, for the purposes of comparison. Schedules 1 through 5submitted with our report to the Board of Governors contain further details of itemsin the accounts which the Audit Committee consider may be of interest to the Board.
AUDIT OPINION
In our opinion, the financial statements (Exhibits A through E) present fairly,in terms of special drawing rights, the financial position of the General Account ofthe International Monetary Fund as at April 30, 1977, and the results of its opera-tions and transactions for the year then ended, in conformity with generally ac-cepted accounting principles applied on a basis consistent with that of the precedingyear.
EXTERNAL AUDIT COMMITTEE:/s/ J. A. Collens, Chairman (United Kingdom)/s/ Mohamed Bouaouaja (Tunisia)/s/ Lelis A. Breda (Uruguay)
132
©International Monetary Fund. Not for Redistribution

APPENDIX VIII (continued)
EXHIBIT A
INTERNATIONAL MONETARY FUND
GENERAL ACCOUNT(Note 1 )
BALANCE SHEETas at April 30, 1977
Amounts expressed in special drawing rights
(Note 2)
1977 1976
ASSETS
GOLD WITH DEPOSITORIES (Note 3) 4,959,027,070 5,369,539,548
SPECIAL DRAWING RIGHTS 771,093,672 460,846,614
CURRENCIES AND SECURITIES (Notes 4 and 5)With depositories
Currencies 13,968,013,201 11,796,561,246Securities 16,247,600,890 16,288,819,875
30,215,614,091 28,085,381,121
Add: Net valuation adjustment receivable 1,795,286,779 2,491,464,005
32,010,900,870 30,576,845,126SUBSCRIPTIONS то CAPITAL—RECEIVABLE
(Balances of initial quotas—not due) 23,547,180 46,694,339
CHARGES RECEIVABLE FROM MEMBERS 195,065,337 140,470,388
OTHER ASSETS (Notes 2 and 7) 17,501,208 4,019,249
TOTAL ASSETS 37,977,135,337 36,598,415,264
CAPITAL, RESERVES, AND LIABILITIES
CAPITALSubscriptions of Members 29,216,500,000 29,211,400,000
RESERVES (Exhibit С and Note 8) 686,484,417 704,675,409
INDEBTEDNESS (Note 6)Oil facility 6,702,087,635 6,465,147,635General Arrangements to Borrow and other borrowing 1,000,000,000 7,702,087,635
REMUNERATION PAYABLE то MEMBERS 226,878,584 104,081,938
INTEREST PAYABLE ON INDEBTEDNESS 126,806,443 107,807,354
OTHER LIABILITIES (Note 7) 18,378,258 5,302,928
TOTAL CAPITAL, RESERVES, AND LIABILITIES 37,977,135,337 36,598,415,264
The notes in Exhibit E are an integral part of the financial statements.
/s/ R. J. FAMILTONActing Treasurer
/s/ H. JOHANNES WITTEVEENManaging Director
133
©International Monetary Fund. Not for Redistribution

APPENDIX VIII (continued)
EXHIBIT В
INTERNATIONAL MONETARY FUND
GENERAL ACCOUNTSTATEMENT OF INCOME AND EXPENSES
for the year ended April 30, 1977Amounts expressed in special drawing rights
(Note 2)
1977 1976OPERATIONAL INCOME:
Charges on balances in excess of quotasInterest on holdings of special drawing rights . .Service chargesOther operational income
Total operational income
Deduct operational expensesRemuneration . . . . ... . . . . . . .Interest on indebtednessOther operational expenses
Total operational expensesNET OPERATIONAL INCOME
EXPENSES:Administrative budget expenses:
Board of Governors ... . . . . . . .
Executive Directors:SalariesOther compensations and benefits (Note 7) ....Travel
Total Executive Directors . . ...Staff:
SalariesOther compensations and benefits (Note 7)Travel
Total staffSpecial services to member countriesOther:
CommunicationsOffice occupancy expenses . . .Books and printingSupplies and equipment (Note 2) . .Data processing services . . .Miscellaneous
Total otherTotal administrative budget expensesDeduct: Assessments levied on participants for
estimated expenses of operating theSpecial Drawing Account . .
Reimbursement for the expensesof conducting the business of theTrust Fund
Total deductionsNet administrative budget expenses
Fixed property expenses (Note 2) . . . .Amortization of employer's contribution to the Staff Retirement
Fund to discharge past service liabilities (Note 7)Net valuation adjustment (gain) loss on administrative
balances not subject to maintenance of valueTOTAL EXPENSES
Deduct realized gain from the sale of propertyNET EXPENSES
EXCESS OF EXPENSES OVER INCOME (Exhibit C)
2,762,092875,105956,267
25,418,22313,365,0665,001,503
1,686,0651,742,877
941,2861,121,0401,181,2481,145,972
1,000,045
800,000
727,276,09422,980,88923,748,562
642,235
226,878,584495,682,633
5,007,047
1,887,933
4,593,464
43,784,7924,497,655
7,818,48862,582,332
1,800,04560,782,287
64,437
4,392,696
31,08865,270,508
408,500,22420,838,10426,336,528
231,875
774,647,780 455,906,731
104,081,938303,425,483
727,568,264 407,507,421
47,079,516 48,399,310
1,420,496
2,541,641692,754723,202
3,957,597
22,743,0229,757,9604,883,306
37,384,2884,002,199
1,523,5041,698,895
955,409988,880
1,029,4791,104,7117,300,878
54,065,458
1,600289
1,600,28952,465,169
69,923
(266,938)52,268,154
934,41865,270,508 51,333,73618,190,992 2,934,426
The notes in Exhibit E are an integral part of the financial statements.
134
©International Monetary Fund. Not for Redistribution
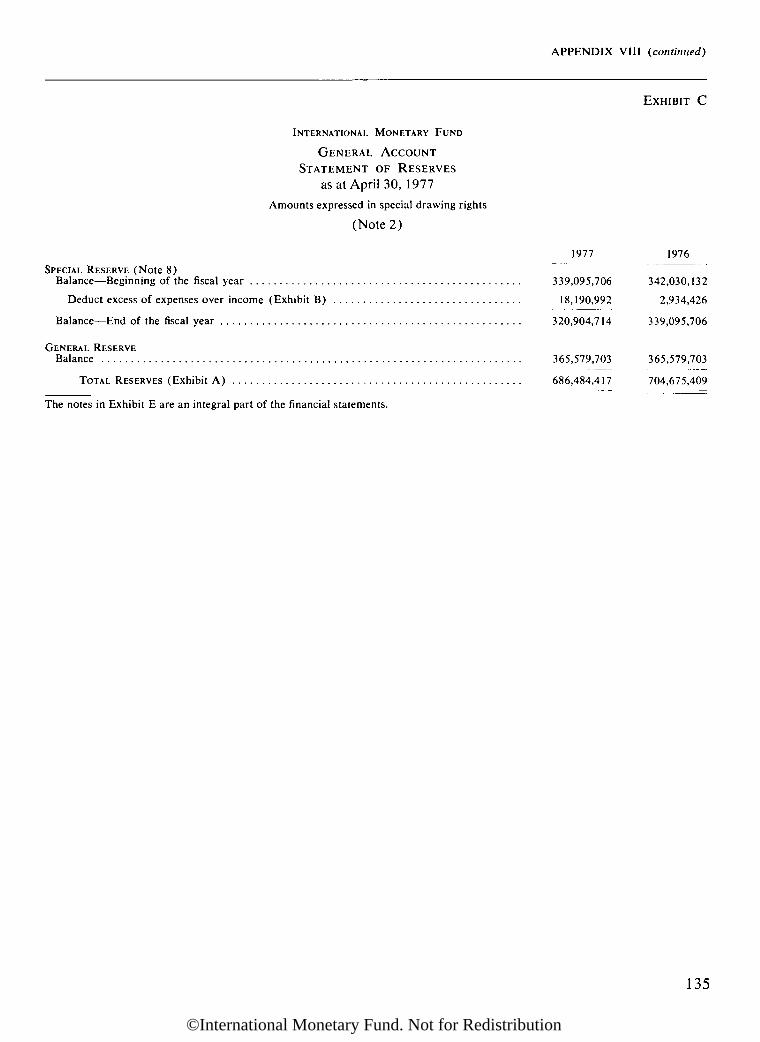
APPENDIX VIII (continued)
EXHIBIT С
INTERNATIONAL MONETARY FUND
GENERAL ACCOUNTSTATEMENT OF RESERVES
as at April 30, 1977
Amounts expressed in special drawing rights
(Note 2)
1977 1976SPECIAL RESERVE (Note 8)
Balance—Beginning of the fiscal year 339,095,706 342,030,132
Deduct excess of expenses over income (Exhibit B) 18,190,992 2,934,426
Balance—End of the fiscal year 320,904,714 339,095,706
GENERAL RESERVEBalance 365,579,703 365,579,703
TOTAL RESERVES (Exhibit A) 686,484,417 704,675,409
The notes in Exhibit E are an integral part of the financial statements.
135
©International Monetary Fund. Not for Redistribution

APPENDIX VIII (continued)
EXHIBIT D
INTERNATIONAL MONETARY FUND
GENERAL ACCOUNTSTATEMENT OF CHANGES IN FINANCIAL POSITION
for the year ended April 30, 1977Amounts expressed in special drawing rights
(Note 2)
Resources were applied to:
Net increase in use of the gold tranche and in currency holdings in excess of members' quotas 3,996,874,572
Increase in holdings of special drawing rights 310,247,058
Increase in currency holdings from subscription payments 28,247,159
Excess of expenses over income 18,190,992
4,353,559,781
Resources were provided by:
Increase in net creditor positions 2,591,065,987
Borrowing:
General Arrangements to Borrow and Swiss National Bank 1,000,000,000
Oil facility 436,940,000
Less: Repayment of borrowing under 1974 oil facility 200,000,000 236,940,000 1,236,940,000
Sales of gold 410,512,478
Increase in the excess of other liabilities over other assets 109,941,316
Quotas of new members 5,100,000
4,353,559,781
The notes in Exhibit E are an integral part of the financial statements.
136
©International Monetary Fund. Not for Redistribution

APPENDIX VIII (continued)
EXHIBIT E
INTERNATIONAL MONETARY FUND
GENERAL ACCOUNTNOTES то THE FINANCIAL STATEMENTS
for the year ended April 30, 1977
Note 1—General Account
All operations and transactions on the account of the Inter-national Monetary Fund (the Fund) are conducted through theGeneral Account. Assets held in the General Account comprisegold, currencies of the Fund's member countries, and specialdrawing rights (SDRs). The Fund's resources in the GeneralAccount are made available to members in accordance with theFund's policies either in the form of currencies or SDRs, whichmembers purchase against the payment of their own currencies.The amount of such use is related to a member's quota in theFund. In addition to purchases under the Fund's regular facil-ities, members may use the Fund's resources under the extendedFund facility (to support corrective policies over two to threeyears), the compensatory financing facility (to assist membersexperiencing fluctuations in receipts from exports of primaryproducts), the buffer stock financing facility, and the oil facility(for balance of payments problems caused by increases in thecosts of petroleum and petroleum products). Use of all theFund's facilities is dependent on members having a balance ofpayments need.
In addition to transactions with currencies (including borrow-ing by the Fund), the purchase or sale of gold by the Fund, thereceipt of SDRs in payment of charges and in repurchases bymembers and the use of SDRs by the Fund take place throughthe General Account.
Note 2—Accounting Practices
Unit of A ccount
The accounts of the General Account are expressed in termsof the special drawing right. The currency value of the SDR isdetermined by a standard basket of the currencies of sixteenmembers and the gold value is 0.888671 gram of fine gold.Members' currencies and securities are converted into equiva-lent amounts of SDRs on the basis of representative rates ofexchange determined in accordance with decisions of the Boardof Executive Directors. Gold held by the General Account isvalued on the basis that one unit of special drawing rights isequivalent to 0.888671 gram of fine gold.
Property, Furniture, and Equipment
The Fund charges as an expense of each accounting periodthe total costs incurred for fixed property, furniture, and equip-ment. As at April 30, 1977, the net balance of the Fund'sproperty accounts, at cost, which had been charged to expenses,amounted to SDR 63,235,813 (SDR 62,813,188 at April 30,1976).
Income and Expenses
The Fund maintains its books of account on the accrual basisand accordingly follows a policy of recognizing income as it isearned and recording expenses as they are incurred.
Note 3—Gold with Depositories
The accounts do not include gold held under earmark formembers which was equivalent to SDR 333,104 at both April 30,1977 and April 30, 1976.
Note 4—Currencies and Securities with Depositories
Securities issued by members to the Fund comprise non-negotiable and noninterest-bearing securities, payable to theFund on demand. Each member has the option to substitutesecurities for that amount of the member's currency held bythe Fund which is in excess of !4 of 1 per cent of the member'squota.
In order to maintain the value of the Fund's currency hold-ings, a holding is revalued whenever the member's currency isused by the Fund in a transaction with another member, or forsuch other purposes as the Fund may decide. All currencyholdings are revalued as at April 30 each year. An accountreceivable or an account payable is established for the amountof currency payable by or to a member, the balance of which isincluded in the Fund's currency holdings. At April 30, 1977,amounts receivable amounted to SDR 1,872,688,403 andamounts payable to SDR 77,401,624.
Note 5—Operational Transactions
During the year ended April 30, 1977, members' purchasesamounted to SDR 4,910 million of which SDR 160 millionwas in the gold tranche, SDR 2,370 million was under theFund's regular facilities, SDR 1,753 million was under thecompensatory financing facility, SDR 437 million was underthe oil facility and SDR 190 million was under the extendedFund facility. Over the same period, repurchases by memberstotaled SDR 868 million, of which SDR 200 million related tothe oil facility.
As at April 30, 1977, total outstanding purchases of membersamounted to SDR 16,068 million, of which SDR 2,626 millionrepresented purchases in the gold tranche not subject to Fundcharges and SDR 6,702 million represented purchases under theoil facility, which were subject to separate schedules of charges.Currency holdings in excess of members' quotas which are sub-ject to Fund charges were SDR 13,442 million and total creditorpositions of members on which the Fund pays remunerationamounted to SDR 6,332 million.
Members incur certain obligations to the Fund with the use ofFund resources from the General Account. One member has notfulfilled financial obligations to repurchase a part of the Fund'sholdings of the member's currency, to pay Fund charges on cur-rency balances in excess of the member's quota and to submitinformation on monetary reserves. Normal means of com-munication are not available between the Fund and the member.The Fund has this situation under continuing review.
Note 6—Indebtedness
Oil Facility
The Fund has entered into borrowing agreements with variousmembers and Switzerland, or institutions within their territories,under which these lenders agreed to provide the Fund withspecified currencies to finance purchases of currencies from theFund by other members under the oil facility. The outstandingborrowings carry interest rates of 7 per cent for amounts calledunder the 1974 borrowing agreements and 7î4 per cent foramounts called under the 1975 borrowing agreements. Any calls
137
©International Monetary Fund. Not for Redistribution
APPENDIX VIII (continued)
EXHIBIT E
made by the Fund under these agreements are repayable overseven years except that calls made under the borrowing agree-ments with Canada and the Deutsche Bundesbank are repayableover five years.
General Arrangements to Borrow (GAB)
Ten members, or institutions within their territories, haveadhered to the General Arrangements to Borrow under whichthe Fund may borrow their currencies up to specified amounts.These arrangements first became effective from October 24,1962 and have been renewed until October 23, 1980. The Fundpays a transfer charge of one-half of one per cent on amountsborrowed under these arrangements and, in addition, pays inter-est at the rates at which the Fund levies charges on the holdingsof currencies resulting from purchases financed from borrowingunder the GAB. Any calls made by the Fund under the GABare repayable within five years.
Other
The Swiss National Bank has entered into a borrowing agree-ment with the Fund under which it has agreed to lend to theFund U.S. dollars equivalent to SDR 300 million for exchangetransactions under a stand-by arrangement. The other terms andconditions of this borrowing are similar to those of the GeneralArrangements to Borrow.
Note 7—Other Compensations and Benefits
The Fund pays various allowances to or on behalf of Execu-tive Directors and staff including the employer's contribution tothe Staff Retirement Plan. All contributions to the Plan and allother assets, liabilities and income of the Plan are held sepa-rately and can be used only for the benefit of the participants inthe Plan and their beneficiaries. The funding of the Plan is
based upon a percentage of salaries paid, and the employercontributes that part of the costs and expenses of the Plan notprovided by the contributions of the participants.
In August 1976 certain improvements in the benefits pro-visions of the Plan and changes in the rate of contribution andfunding arrangements were approved effective from September 1,1976. A payment equivalent to SDR 19,032,422 was made fromthe General Account to the Staff Retirement Fund on Septem-ber 1, 1976. Of this amount, SDR 17,570,796 was to dischargethe past service liabilities resulting from the improved benefitsand changes in funding arrangements and is being chargedagainst income over a period of four years. Accordingly,SDR 4,392,696 was charged against income in the year endedApril 30, 1977; the balance of SDR 13,178,100 is included as adeferred charge in other assets. The balance of the paymentmade on September 1, 1976, namely SDR 1,461,626, was tofund part of the accumulated experience losses of the Plan asdetermined by the actuary engaged by the Pension Committee.Experience gains and losses are amortized over a period of15 years and at April 30, 1977 unamortized experience lossesamounted to SDR 18.4 million.
Contributions by the employer to the Staff Retirement Fundfor the year ended April 30, 1977 amounted to SDR 6,854,196,including the amortization of experience losses of the Plan, butexcluding the payment for past service liabilities.
Note 8—Special Reserve
Income from investments in U.S. Government securities wasplaced to the Special Reserve from November 1, 1957 untilFebruary 15, 1972 when the investment program was termi-nated. The Articles of Agreement provide that any administra-tive deficit for any fiscal year must be written off first againstthis reserve. Transfers may be made from this reserve to theGeneral Reserve.
138
©International Monetary Fund. Not for Redistribution

APPENDIX VIII (continued)
SPECIAL DRAWING ACCOUNTREPORT OF THE EXTERNAL AUDIT COMMITTEE
Washington, D.C.July 1, 1977
AUTHORITY FOR THE AUDIT
The audit for the year ended April 30, 1977, was carried out pursuant to Sec-tion 20 (b) of the By-Laws of the International Monetary Fund.
SCOPE OF THE AUDIT
We have conducted the audit in accordance with generally accepted auditingstandards and in compliance with the requirements of Section 20(b) of the By-Lawsthat it should be comprehensive with respect to examination of financial records;should extend, insofar as practicable, to the ascertainment that operations andtransactions conducted through the Special Drawing Account were supported bythe necessary authority; and should determine that there was adequate and faithfulaccounting for special drawing rights. Our examination included a review of theadequacy of the system of accounting and internal control and such tests as weconsidered necessary in the circumstances, having regard to the extent and resultsof the tests which we observed to have been carried out by the Internal Auditor.
SCOPE OF THE ACCOUNTS
Exhibits A and В represent the statements which Section 20(b) of the By-Lawsrequires to be prepared and audited in respect of the Special Drawing Account.Exhibit A includes corresponding figures for the year ended April 30, 1976, for thepurposes of comparison. Schedules 1 through 3 submitted with our report to theBoard of Governors contain further details from the accounting records for specialdrawing rights which the Audit Committee consider may be of interest to the Board.
AUDIT OPINION
In our opinion, the statements (Exhibits A and B) of the Special DrawingAccount of the International Monetary Fund present fairly the allocation and hold-ings of special drawing rights as at April 30, 1977, and properly reflect the opera-tions and transactions in this account for the year then ended.
EXTERNAL AUDIT COMMITTEE :
/s/ J. A. Collens, Chairman (United Kingdom)/s/ Mohamed Bouaouaja (Tunisia)/s/ Lelis A. Breda (Uruguay)
139
©International Monetary Fund. Not for Redistribution

APPENDIX VIII (continued)
EXHIBIT A
INTERNATIONAL MONETARY FUND
SPECIAL DRAWING ACCOUNTBALANCE SHEET
as at April 30, 1977Amounts expressed in special drawing rights
1977 1976
ALLOCATIONS
Net cumulative allocations of special drawing rights to participants (Note 1) 9,314,835,400 9,314,835,400
HOLDINGS
Holdings of special drawing rights (Note 2 and Exhibit B)
ParticipantsHoldings above allocations:
AllocationsReceived (net)
2,468,666,0001,997,028,292
Total holdings above allocations
Holdings below allocations:AllocationsUsed (net)
6,846,169,4002,768,121,964
Total holdings below allocations
Total holdings by participants
General Account Holdings
4,465,694,292
4,078,047,436
8,543,741,728
771,093,672
9,314,835,400
2,449,904,0002,070,327,850
4,520,231,850
6,864,931,4002,531,174,464
4,333,756,936
8,853,988,786
460,846,614
9,314,835,400
NOTES:
1. Under Articles XXX and XXXI of the Fund Agreement,which cover termination of participation in and the liquidationof the Special Drawing Account, respectively, a participant hasan obligation to pay to the Fund an amount equal to its netcumulative allocation of special drawing rights and any otheramounts that may be due and payable because of participationin the Special Drawing Account. The Fund also has an obliga-tion to redeem special drawing rights in accordance with theseArticles.
2. Special drawing rights allocated by the Fund do not con-stitute claims by holders against the Fund to provide currency,except as prescribed by the provisions of Articles XXX andXXXI relating to the termination of participation and liquida-tion. Participants may use their special drawing rights to obtaincurrency in accordance with the provisions of Article XXV,and under Section 5 of this Article they are entitled to requestthe Fund's assistance in the form of designation of participantsto provide currency in exchange for special drawing rights. Theobligation of a participant to provide currency for special draw-ing rights does not extend beyond the point at which its holdings
of special drawing rights in excess of its net cumulative alloca-tion are equal to twice its net cumulative allocation or suchhigher limit as may be agreed between a participant and theFund. A participant may, however, provide currency in excessof the obligatory limit or any agreed higher limit.
Other Note
Under the provisions of Article XXV of the Fund Agree-ment, participants that have used allocations received incurcertain obligations in regard to the reconstitution of their hold-ings of SDRs; participants are required to maintain averagedailv holdings over the most recent of the five-year periodsending in calendar quarters, of not less than 30 per cent of theaverage of their daily net cumulative allocations over the sameperiods. One participant has not fulfilled the reconstitutionrequirements for the five-year periods ending on December 31,1975 and subsequent calendar quarters. The normal means ofcommunication between the Fund and the participant are notavailable. The Fund has the participant's situation under review.
/s/ R. J. FAMILTONActing Treasurer
/s/ H. JOHANNES WITTEVEENManaging Director
140
©International Monetary Fund. Not for Redistribution
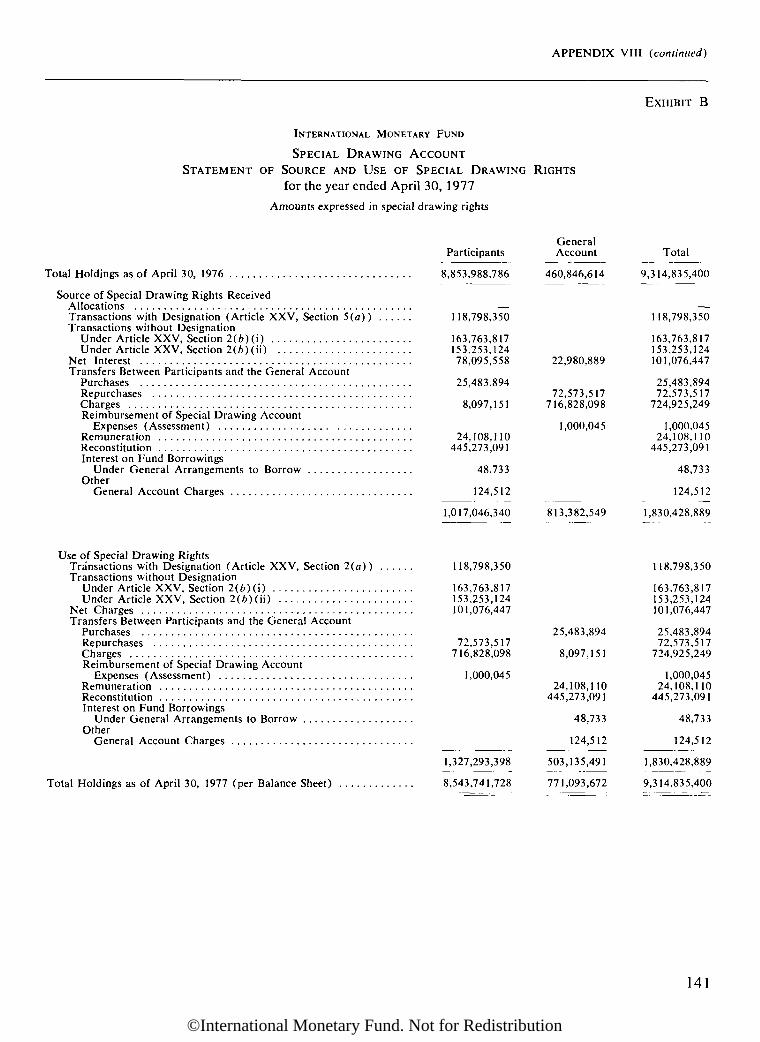
APPENDIX VIII (continued)
INTERNATIONAL MONETARY FUND
SPECIAL DRAWING ACCOUNTSTATEMENT OF SOURCE AND USE OF SPECIAL DRAWING RIGHTS
for the year ended April 30, 1977Amounts expressed in special drawing rights
EXHIBIT В
Participants
Total Holdings as of April 30, 1976 8,853,988,786
Source of Special Drawing Rights ReceivedAllocations —Transactions with Designation (Article XXV, Section 5(a)) 118,798,350Transactions without Designation
Under Article XXV, Section 2(6) (i) 163,763,817Under Article XXV, Section 2(6) (ii) 153,253,124
Net Interest 78,095,558Transfers Between Participants and the General Account
Purchases 25,483,894RepurchasesCharges 8,097,151Reimbursement of Special Drawing Account
Expenses (Assessment)Remuneration 24,108,110Reconstitution 445,273,091Interest on Fund Borrowings
Under General Arrangements to Borrow 48,733Other
General Account Charges 124,512
1,017,046,340
Use of Special Drawing RightsTransactions with Designation (Article XXV, Section 2(a)) 118,798,350Transactions without Designation
Under Article XXV, Section 2(b) (i) 163,763,817Under Article XXV, Section 2(6) (ii) 153,253,124
Net Charges 101,076,447Transfers Between Participants and the General Account
PurchasesRepurchases 72,573,517Charges 716,828,098Reimbursement of Special Drawing Account
Expenses (Assessment) 1,000,045RemunerationReconstitutionInterest on Fund Borrowings
Under General Arrangements to BorrowOther
General Account Charges
1,327,293,398
Total Holdings as of April 30, 1977 (per Balance Sheet) 8,543,741,728
GeneralAccount
460,846,614
Total
22,980,889
72,573,517716,828,098
1,000,045
813,382,549
25,483,894
8,097,151
24,108,110445,273,091
48,733
124,512
503,135,491
771,093,672
9,314,835,400
118,798,350
163,763,817153,253,124101,076,447
25,483,89472,573,517
724,925,249
1,000,04524,108,110
445,273,091
48,733
124,512
1,830,428,889
118,798,350
163,763,817153,253,124101,076,447
25,483,89472,573,517
724,925,249
1,000,04524,108,110
445,273,091
48,733
124,512
1,830,428,889
9,314,835,400
141
©International Monetary Fund. Not for Redistribution

APPENDIX VIII (continued)
SUBSIDY ACCOUNTREPORT OF THE EXTERNAL AUDIT COMMITTEE
Washington, D.C.July 1, 1977
AUTHORITY FOR THE AUDIT
The audit for the year ended April 30, 1977, was carried out pursuant toExecutive Board Decision No. 4773-(75/136) of August 1, 1975, and Sec-tion 20(b) of the By-Laws of the International Monetary Fund.
SCOPE OF THE AUDIT
We have conducted the audit in accordance with generally accepted auditingstandards and in compliance with the general requirements of Section 20(b) of theBy-Laws that it should be comprehensive with respect to the examination of records;should extend, insofar as practicable, to the ascertainment that operations andtransactions were supported by the necessary authority; and should determine thatthere was adequate and faithful accounting for the relevant assets and liabilities.Our examination included a review of the adequacy of the system of accounting andinternal control and such tests as we considered necessary in the circumstances,having regard to the extent and results of the tests which we observed to have beencarried out by the Internal Auditor.
SCOPE OF THE ACCOUNTS
Exhibits A and В represent the accounts required to be audited under ExecutiveBoard Decision No. 4773-(75/136). Exhibit A includes corresponding figures forthe year ended April 30, 1976, for the purposes of comparison. Schedules 1 through3 submitted with our report to the Board of Governors contain further details fromthe accounting records which the Audit Committee consider may be of interest tothe Board.
AUDIT OPINION
In our opinion, the financial statements (Exhibits A and B) present fairly, interms of special drawing rights, the financial position of the Subsidy Account admin-istered by the International Monetary Fund as at April 30, 1977, and properlyreflect the transactions in this Account for the year then ended.
EXTERNAL AUDIT COMMITTEE :
/s/ J. A. Collens, Chairman (United Kingdom)/s/ Mohamed Bouaouaja (Tunisia)/s/ Lelis A. Breda (Uruguay)
142
©International Monetary Fund. Not for Redistribution
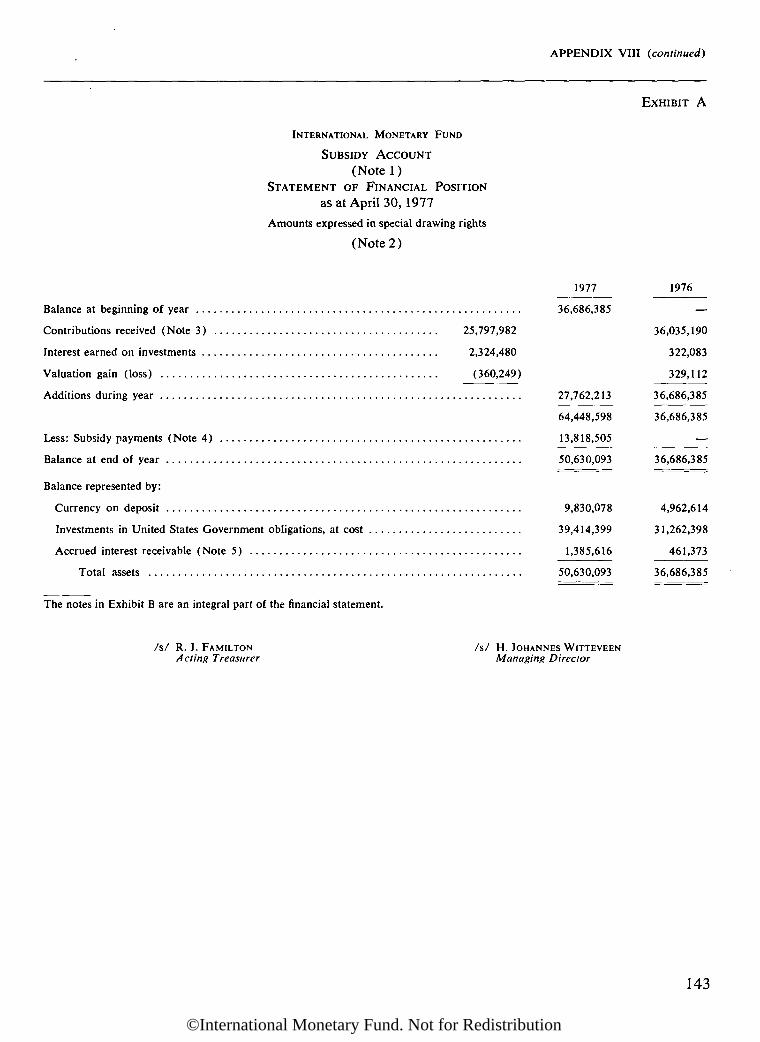
APPENDIX VIII (continued)
INTERNATIONAL MONETARY FUND
SUBSIDY ACCOUNT(Notel)
STATEMENT OF FINANCIAL POSITIONas at April 30, 1977
Amounts expressed in special drawing rights
(Note 2)
Balance at beginning of year ...
Contributions received (Note 3)
Interest earned on investments ..
Valuation gain (loss)
Additions during year
25,797,982
2,324,480
(360,249)
Less: Subsidy payments (Note 4)
Balance at end of year
Balance represented by:
Currency on deposit
Investments in United States Government obligations, at cost
Accrued interest receivable (Note 5)
Total assets
1977
36,686,385
27,762,213
64,448,598
13,818,505
50,630,093
9,830,078
39,414,399
1,385,616
50,630,093
EXHIBIT A
1976
36,035,190
322,083
329,112
36,686,385
36,686,385
36,686,385
4,962,614
31,262,398
461,373
36,686,385
The notes in Exhibit В are an integral part of the financial statement.
/s/ R. J. HAMILTONActing Treasurer
/s/ H. JOHANNES WITTEVEENManaging Director
143
©International Monetary Fund. Not for Redistribution

APPENDIX VIII (continued)
EXHIBIT В
INTERNATIONAL MONETARY FUND
SUBSIDY ACCOUNTNOTES то THE FINANCIAL STATEMENT
for the year ended April 30, 1977
Notel
The Subsidy Account was established by the Fund to assistthe most seriously affected (MSA) members to meet the interestcost of using resources made available through the Fund's oilfacility for 1975.
Note 2
The accounts of the Subsidy Account are expressed in termsof the SDR, the currency value of which is determined by astandard basket of the currencies of sixteen members.
against the SDR at the time of receipt. Cumulative contribu-tions to the Subsidy Account at April 30, 1977 amounted toSDR 61,833,172.
Note 4
The rate of subsidy for the fiscal year ended April 30, 1976was set by the Fund at five per cent per annum of the averagedaily balances of the Fund's holdings of recipient members'currencies in excess of quotas under the 1975 oil facility duringthat year. Subsidy payments were made in U.S. dollars basedon the SDR/US$ rate on July 19, 1976.
Note3
Currency contributions to the Subsidy Account are convertedto equivalent amounts of SDKs on the basis of exchange rates
NoteS
Includes accrued interest purchased amounting to SDR 27,419at April 30, 1977 (SDR 145,926 at April 30, 1976).
144
©International Monetary Fund. Not for Redistribution

APPENDIX VIH (continued)
TRUST FUNDREPORT OF THE EXTERNAL AUDIT COMMITTEE
Washington, D.C.July 1,1977
AUTHORITY FOR THE AUDIT
The audit for the period May 5, 1976 through April 30, 1977 was carried outpursuant to Executive Board Decision No. 5069-(76/72) of May 5, 1976 andSection 20(b) of the By-Laws of the International Monetary Fund.
SCOPE OF THE AUDIT
We have conducted the audit in accordance with generally accepted auditingstandards and in compliance with the general requirements of Section 20 (b) of theBy-Laws that it should be comprehensive with respect to the examination of records;should extend, insofar as practicable, to the ascertainment that operations andtransactions were supported by the necessary authority; and should determine thatthere was adequate and faithful accounting for the relevant assets and liabilities.Our examination included a review of the adequacy of the system of accounting andinternal control and such tests as we considered necessary in the circumstances,having regard to the extent and results of the tests which we observed to have beencarried out by the Internal Auditor.
SCOPE OF THE ACCOUNTS
Exhibits A through С represent the accounts required to be audited underExecutive Board Decision No. 5069-(76/72). Schedules 1 and 2 submitted withour report to the Board of Governors contain further details from the accountingrecords which the Audit Committee consider may be of interest to the Board.
AUDIT OPINION
In our opinion, the financial statements (Exhibits A through C) present fairly,in terms of special drawing rights, the financial position of the Trust Fund admin-istered by the International Monetary Fund as at April 30, 1977, and its incomeand expenses for the period May 5, 1976 through April 30, 1977, in conformitywith generally accepted accounting principles.
EXTERNAL AUDIT COMMITTEE:
/s/ J. A. Collens, Chairman (United Kingdom)/s/ Mohamed Bouaouaja (Tunisia)/s/ Lelis A. Breda (Uruguay)
145
©International Monetary Fund. Not for Redistribution

APPENDIX VIII (continued)
EXHIBIT A
INTERNATIONAL MONETARY FUND
TRUST FUND(Notel)
BALANCE SHEETas at April 30, 1977
Amounts expressed in special drawing rights
(Note 2)
ASSETS
Currency on deposit
Gold (Note 3)
Investments
Loans (Note 4)
Accrued interest on investments
Accrued interest on loans
Total Assets
102,875
17,643,481
406,201,501
31,588,000
5,632,632
40,357
461,208,846
LIABILITY AND TRUST RESOURCES
Liability—Obligation to deliver gold (Note 3)
Trust resources (Exhibit B)
Liability and Trust Resources
64,712,969
396,495,877
461,208,846
The notes in Exhibit С are an integral part of the financial statements.
/s/ R. I. FAMILTONActing Treasurer
/s/ H. JOHANNES WITTEVEENManaging Director
146
©International Monetary Fund. Not for Redistribution

APPENDIX VIII (continued)
EXHIBIT В
INTERNATIONAL MONETARY FUND
TRUST FUNDSTATEMENT OF INCOME AND EXPENSES
for the period May 5, 1976 through April 30, 1977
Amounts expressed in special drawing rights
(Note 2)
Income:
Net proceeds realized from the sale of gold:
Gross amounts received 573,389,314
Less cost of gold 182,924,530
390,464,784
Investment income 8,970,133
Interest income on loans 40,357
399,475,274
Expenses:
Administrative expenses (Note 2) :
Staff salaries and benefits and other services 723,983
Gold weighing and handling charges 54,273
Data processing services 9,859
Communications 5,807
Other 6,078
Total administrative expenses 800,000
Income less administrative expenses 398,675,274
Exchange valuation loss 2,179,397
Net income 396,495,877
The notes in Exhibit С are an integral part of the financial statements.
147
©International Monetary Fund. Not for Redistribution
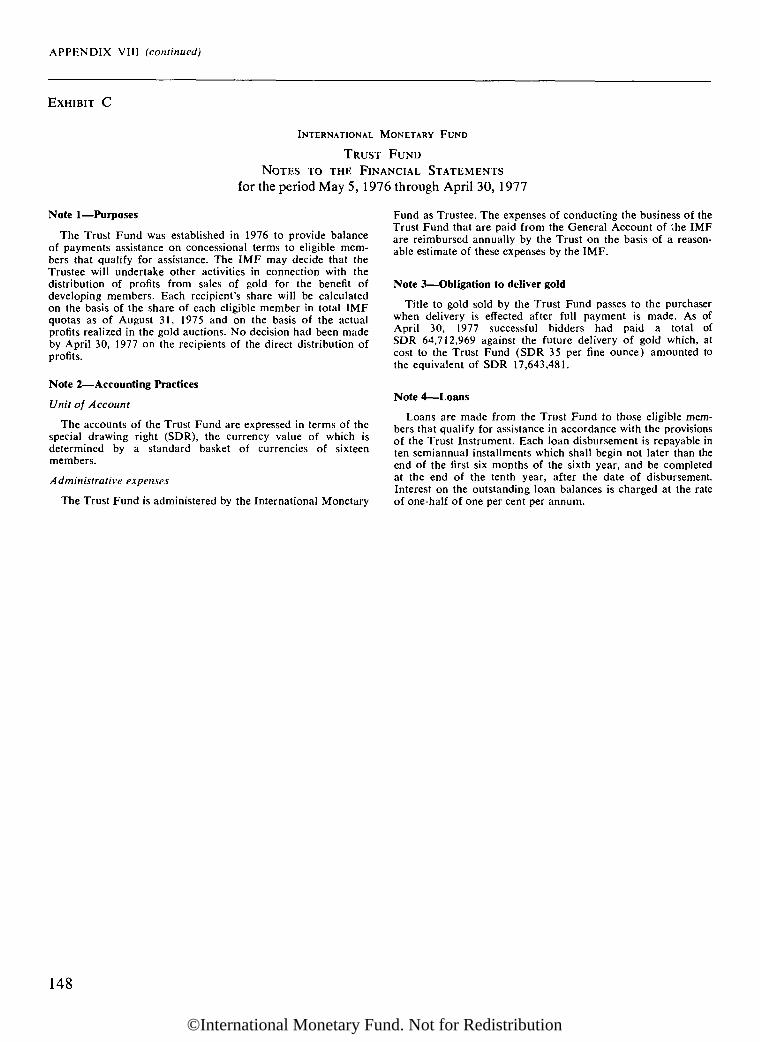
APPENDIX VIII (continued)
EXHIBIT С
INTERNATIONAL MONETARY FUND
TRUST FUNDNOTES то THE FINANCIAL STATEMENTS
for the period May 5, 1976 through April 30, 1977
Note 1—Purposes
The Trust Fund was established in 1976 to provide balanceof payments assistance on concessional terms to eligible mem-bers that qualify for assistance. The IMF may decide that theTrustee will undertake other activities in connection with thedistribution of profits from sales of gold for the benefit ofdeveloping members. Each recipient's share will be calculatedon the basis of the share of each eligible member in total IMFquotas as of August 31, 1975 and on the basis of the actualprofits realized in the gold auctions. No decision had been madeby April 30, 1977 on the recipients of the direct distribution ofprofits.
Note 2—Accounting Practices
Unit of Account
The accounts of the Trust Fund are expressed in terms of thespecial drawing right (SDR), the currency value of which isdetermined by a standard basket of currencies of sixteenmembers.
Administrative expenses
The Trust Fund is administered by the International Monetary
Fund as Trustee. The expenses of conducting the business of theTrust Fund that are paid from the General Account of ihe IMFare reimbursed annually by the Trust on the basis of a reason-able estimate of these expenses by the IMF.
Note 3—Obligation to deliver gold
Title to gold sold by the Trust Fund passes to the purchaserwhen delivery is effected after full payment is made. As ofApril 30, 1977 successful bidders had paid a total ofSDR 64,712,969 against the future delivery of gold which, atcost to the Trust Fund (SDR 35 per fine ounce) amounted tothe equivalent of SDR 17,643,481.
Note 4—Loans
Loans are made from the Trust Fund to those eligible mem-bers that qualify for assistance in accordance with the provisionsof the Trust Instrument. Each loan disbursement is repayable inten semiannual installments which shall begin not later than theend of the first six months of the sixth year, and be completedat the end of the tenth year, after the date of disbursement.Interest on the outstanding loan balances is charged at the rateof one-half of one per cent per annum.
148
©International Monetary Fund. Not for Redistribution

APPENDIX VIII (continued)
STAFF RETIREMENT FUNDREPORT OF THE EXTERNAL AUDIT COMMITTEE
Washington, D.C.July 1, 1977
AUTHORITY FOR THE AUDIT
The audit of the Staff Retirement Fund of the International Monetary Fund forthe year ended April 30, 1977, was carried out pursuant to and in accordance withthe requirements of Section 20 (b) of the By-Laws of the International MonetaryFund. All assets and income of the Staff Retirement Fund, in accordance withArticle 9, Section 1, of the Staff Retirement Plan, are the property of the Inter-national Monetary Fund and are held and administered by it separately from itsother property and assets.
SCOPE OF THE AUDIT
We have conducted the audit in accordance with generally accepted auditingstandards and in compliance with the general requirements of Section 20(b) of theBy-Laws that it should be comprehensive with respect to the examination of records;should extend, insofar as practicable, to the ascertainment that operations andtransactions were supported by the necessary authority; and should determine thatthere was adequate and faithful accounting for the relevant assets and liabilities.Our examination included a review of the adequacy of the system of accounting andinternal control and such tests as we considered necessary in the circumstances,having regard to the extent and results of the tests which we observed to have beencarried out by the Internal Auditor. In the course of our audit, reference was madeto the Articles of the Staff Retirement Plan and to the decisions of the Pension,Administration, and Investment Committees created under the Plan.
SCOPE OF THE ACCOUNTS
Exhibits A through F represent the accounts required to be prepared and audited.Exhibits A and В include corresponding figures for the year ended April 30, 1976,for the purposes of comparison. Schedules 1 through 5 to Exhibit A and Sched-ules 1 and 2 to Exhibit В submitted with our report to the Board of Governorscontain further details of items in the accounts which the Audit Committee considermay be of interest to the Board.
AUDIT OPINION
In our opinion, the financial statements (Exhibits A through F) present fairly,in terms of U.S. dollars, the financial position of the Staff Retirement Fund of theInternational Monetary Fund as at April 30, 1977, and the changes in its financialposition for the year then ended, in conformity with generally accepted accountingprinciples applied on a basis consistent with that of the preceding year.
EXTERNAL AUDIT COMMITTEE:
/s/ J. A. Collens, Chairman (United Kingdom)/s/ Mohamed Bouaouaja (Tunisia)/s/ Lelis A. Breda (Uruguay)
149
©International Monetary Fund. Not for Redistribution

APPENDIX VIII (continued)
EXHIBIT A
INTERNATIONAL MONETARY FUND
STAFF RETIREMENT FUNDBALANCE SHEET
as at April 30, 1977Amounts expressed in U.S. dollars
1977
ASSETS
CASH AT BANKS 14,3 87
INVESTMENTS
BondsAmortized cost (market value $33,319,714 in 1977,
$21,303,299 in 1976)Notes insured by U.S. Government 13,077,206International development banks 5,792,442Corporate 11,449,910Commercial paper 300,000Certificates of deposit 2,530,000Repurchase agreements 1,546,000
Total amortized cost 34,695,558Add: Net realized losses 2,227,889Funds originally invested 36,923,447Deduct: Amortized net realized losses 1,112,659
Adjusted book value of bonds 35,810,788
StocksCost (market value $61,875,670 in 1977, $47,022,017 in 1976) .. 67,036,485Deduct: Net realized gains 2,732,481
Funds originally invested 64,304,004Recognized appreciation/(depreciation) (29,000)
Adjusted book value of stocks 64,275,004
Total investments at adjusted book value 100,085,792
ACCRUED INTEREST ON BONDS, ACCRUED CONTRIBUTIONSRECEIVABLE, AND MISCELLANEOUS ACCOUNTS RECEIVABLE 797,134
TOTAL ASSETS 100,897,313
LIABILITIES AND RESERVES
PARTICIPANTS' ACCOUNT (Exhibit C) 18,221,825ACCUMULATION ACCOUNT (Exhibit D) 51,964,342RETIREMENT RESERVE ACCOUNT (Exhibit E) 30,602,589ACCOUNTS PAYABLE 108,557
TOTAL LIABILITIES AND RESERVES 100,897,313
1976
78,174
5,615,8865,768,549
10,406,672119,000
1,405,000
23,315,1072,226,348
25,541,455889,872
24,651,583
45,781,0471,820,362
43,960,685373,000
44,333,685
68,985,268
582,515
69,645,957
16,017,19132,498,40421,075,410
54,952
69,645,957
The notes in Exhibit F are an integral part of the financial statements.
/s/ R. J. FAMILTONActing Treasurer
/s/ H. JOHANNES WITTEVEENManaging Director
150
©International Monetary Fund. Not for Redistribution
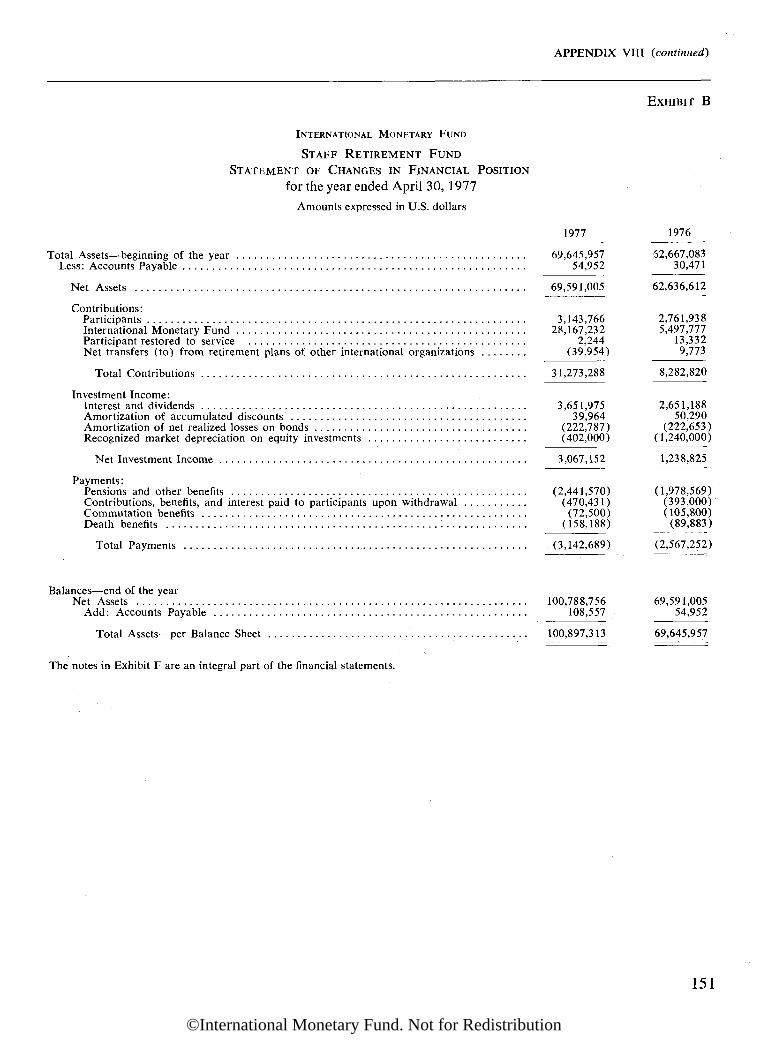
APPENDIX VIII (continued)
INTERNATIONAL MONETARY FUND
STAFF RETIREMENT FUNDSTATEMENT OF CHANGES IN FINANCIAL POSITION
for the year ended April 30, 1977Amounts expressed in U.S. dollars
1977
Total Assets—beginning of the year 69,645,957Less: Accounts Payable 54,952
Net Assets 69,591,005
Contributions:Participants 3,143,766International Monetary Fund 28,167,232Participant restored to service 2,244Net transfers (to) from retirement plans of other international organizations (39,954)
Total Contributions 31,273,288
Investment Income:Interest and dividends 3,651,975Amortization of accumulated discounts 39,964Amortization of net realized losses on bonds (222,787)Recognized market depreciation on equity investments (402,000)
Net Investment Income 3,067,152
Payments:Pensions and other benefits (2,441,570)Contributions, benefits, and interest paid to participants upon withdrawal (470,431)Commutation benefits (72,500)Death benefits (158,188)
Total Payments (3,142,689)
Balances—end of the yearNet Assets 100,788,756
Add: Accounts Payable 108,557
Total Assets—per Balance Sheet 100,897,313
EXHIBIT В
1976
52,667,08330,471
62,636,612
2,761,9385,497,777
13,3329,773
8,282,820
2,651,18850,290
(222,653)(1,240,000)
1,238,825
(1,978,569)(393,000)(105,800)
(89,883)
(2,567,252)
69,591,00554,952
69,645,957
The notes in Exhibit F are an integral part of the financial statements.
151
©International Monetary Fund. Not for Redistribution

APPENDIX VIII (continued)
EXHIBIT С
Balance, April 30, 1976 (per Balance Sheet)
Add:
Participants' contributionsParticipating serviceAdditional voluntary
STAFF RETIREMENT FUNDPARTICIPANTS' ACCOUNT
for the year ended April 30,1977
Amounts expressed in U.S. dollars
Contributions and interest refunded by participant restored to serviceTransfers from retirement plans of the
International Bank for Reconstruction and DevelopmentUnited NationsInter-American Development Bank
Interest credited to participants
3,132,61611,150
10,8522,136
957
16,017,191
3,143,766
1,867
13,945
849,457 4,009,035
Deduct:
Refunds upon withdrawal of participantsAccumulated contributionsAdditional voluntary contributions . . .
Refunds upon death of participantsTransfers to Retirement Reserve AccountTransfers to retirement plans of the
International Bank for Reconstruction and DevelopmentUnited Nations
349,02210,523
10,37816,219
359,545
45,7171,372,542
26,597
Balance, April 30, 1977 (per Balance Sheet)
1,804,401
18,221,825
The notes in Exhibit F are an integral part of the financial statements.
152
©International Monetary Fund. Not for Redistribution

APPENDIX VIII (continued)
EXHIBIT D
STAFF RETIREMENT FUNDACCUMULATION ACCOUNT
for the year ended April 30, 1977Amounts expressed in U.S. dollars
Balance, April 30, 1976 (per Balance Sheet) 32,498,404
Add:
Contributions of the International Monetary FundParticipating service 6,265,232Prior service 21,902,000 28,167,232
Income from investmentsBonds
Interest 2,124,473Amortization of premium and accumulation of discount (net) . . 39,964Amortization of net realized losses (222,787) 1,941,650
StocksDividends received 1,527,501Recognized depreciation (402,000) 1,125,501 3,067,151
Benefits and interest refunded by participant restored to service . . . . 377Transfers from retirement plans of the
International Bank for Reconstruction and Development 21,828United Nations 4,303Inter-American Dsvelopment Bank 1,603 27,734 31,262,494
Deduct:
Withdrawal benefits 110,886Payments upon death of participants 77,942Transfers to retirement plans of the
International Bank for Reconstruction and Development 20,741United Nations 34,294 55,035
Transfers to Retirement Reserve Account 9,370,635Interest transferred to
Participants' Account 849,457Retirement Reserve Account 1,332,601 2,182,058 11,796,556
Balance, April 30, 1977 (per Balance Sheet) 51,964,342
The notes in Exhibit F are an integral part of the financial statements.
153
©International Monetary Fund. Not for Redistribution

APPENDIX VIII (continued)
EXHIBIT E
STAFF RETIREMENT FUNDRETIREMENT RESERVE ACCOUNTfor the year ended April 30, 1977
Amounts expressed in U.S. dollars
Balance, April 30, 1976 21,075,410
Add:
Transfers fromParticipants' Account 1,372,542Accumulation Account 9,370,635 10,743,177
Interest credited 1,332,601 12,075,778
Deduct:
Pension payments toRetired participants 2,089,080Beneficiaries of deceased participants 234,898Disabled retired participants and their children 103,094 2,427,072
Pension commutation payments 72,500Payments upon death of retired participants 34,529Payments to retired participants upon surrender of pension rights 14,498 2,548,599
Balance, April 30, 1977 (per Balance Sheet) 30,602,589
The notes in Exhibit F are an integral part of the financial statements.
154
©International Monetary Fund. Not for Redistribution
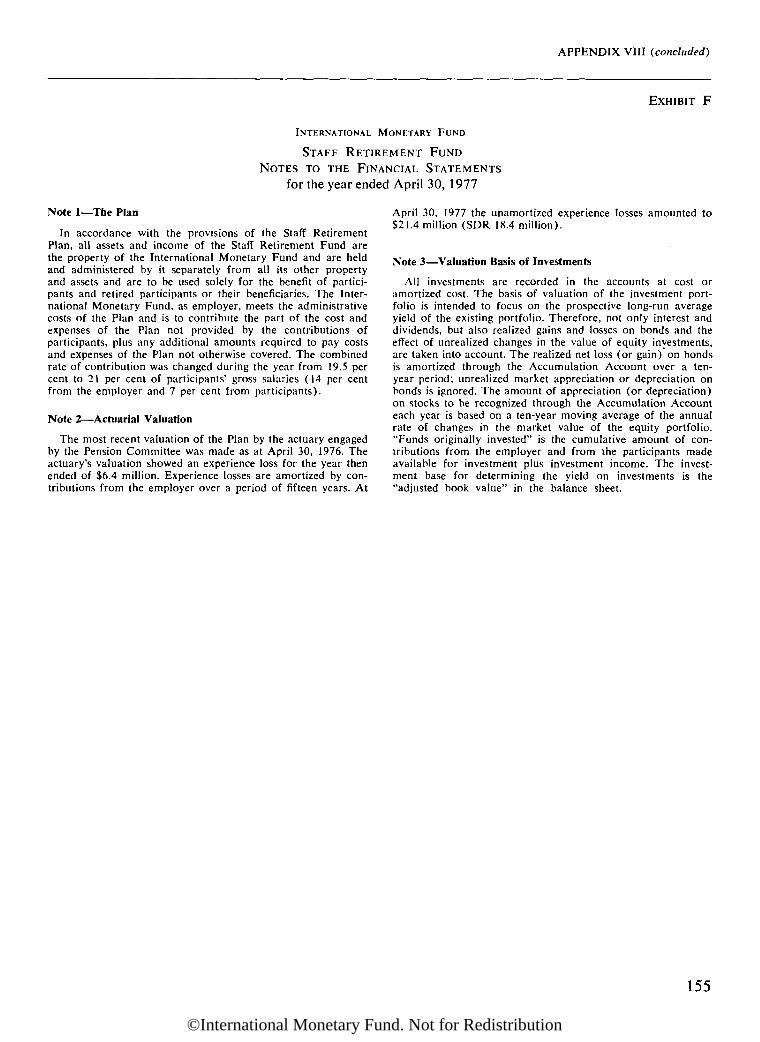
APPENDIX VIII (concluded)
EXHIBIT F
INTERNATIONAL MONETARY FUND
STAFF RETIREMENT FUNDNOTES то THE FINANCIAL STATEMENTS
for the year ended April 30, 1977
Note 1—The Plan
In accordance with the provisions of the Staff RetirementPlan, all assets and income of the Staff Retirement Fund arethe property of the International Monetary Fund and are heldand administered by it separately from all its other propertyand assets and are to be used solely for the benefit of partici-pants and retired participants or their beneficiaries. The Inter-national Monetary Fund, as employer, meets the administrativecosts of the Plan and is to contribute the part of the cost andexpenses of the Plan not provided by the contributions ofparticipants, plus any additional amounts required to pay costsand expenses of the Plan not otherwise covered. The combinedrate of contribution was changed during the year from 19.5 percent to 21 per cent of participants' gross salaries (14 per centfrom the employer and 7 per cent from participants).
Note 2—Actuarial Valuation
The most recent valuation of the Plan by the actuary engagedby the Pension Committee was made as at April 30, 1976. Theactuary's valuation showed an experience loss for the year thenended of $6.4 million. Experience losses are amortized by con-tributions from the employer over a period of fifteen years. At
April 30, 1977 the unamortized experience losses amounted to$21.4 million (SDR 18.4 million).
Note 3—Valuation Basis of Investments
All investments are recorded in the accounts at cost oramortized cost. The basis of valuation of the investment port-folio is intended to focus on the prospective long-run averageyield of the existing portfolio. Therefore, not only interest anddividends, but also realized gains and losses on bonds and theeffect of unrealized changes in the value of equity investments,are taken into account. The realized net loss (or gain) on bondsis amortized through the Accumulation Account over a ten-year period; unrealized market appreciation or depreciation onbonds is ignored. The amount of appreciation (or depreciation)on stocks to be recognized through the Accumulation Accounteach year is based on a ten-year moving average of the annualrate of changes in the market value of the equity portfolio."Funds originally invested" is the cumulative amount of con-tributions from the employer and from the participants madeavailable for investment plus investment income. The invest-ment base for determining the yield on investments is the"adjusted book value" in the balance sheet.
155
©International Monetary Fund. Not for Redistribution

This page intentionally left blank
©International Monetary Fund. Not for Redistribution

Index
An asterisk (*) denotes a table; a dagger (t) denotes a chart; fn. denotes a footnote.
AFGHANISTANExchange rate, 78*Purchases and repurchases from Fund,
89*, 91*, 93*SDKs, 83*, 87*Stand-by arrangement with Fund, 90*
AFRICAAdjustment process, 23Balance of payments, 15*, 22Debt and debt service, 23Economic policy, 8Output, 7*Prices, 8*
ALGERIAExchange rate, 78*SDKs, 83*
ARGENTINAExchange rate, 78*Purchases and repurchases from Fund,
52, 88*, 89*, 91*SDKs, 83*, 87*Stand-by arrangement with Fund, 90*
ARTICLES OF AGREEMENTAmendment, 25,45, 68, 113-14, 116Article VIII, members accepting obli-
gations of, 99*
ASIAAdjustment process, 22Balance of payments, 15*, 22Economic policy, 8Output, 7*Prices, 8*
ATTRIBUTION OF REPURCHASES, 55, 110AUSTRALIA
Balance of payments, 20Contribution to Subsidy Account, 65*Exchange rate, 26, 78*International reserves, 42*Output, 7*Prices, 8*Purchases from Fund, 53, 88*, 91*SDKs, 83*Super gold tranche position in Fund,
56*
AUSTRIABalance of payments, 16Contributions to: Subsidy Account,
65*; Trust Fund, 60Exchange rate, 78*Intermediary in gold distribution, 60
(fn.)International reserves, 42*SDKs, 83*Super gold tranche position in Fund,
56*
BAHAMASExchange rate, 78*Repurchases from Fund, 93*
BAHRAINExchange rate, 78 *Purchases from Fund, 52, 88*Super gold tranche position in Fund,
56*BALANCE OF PAYMENTS
Current account global structure, 13*Developments, 12-18Industrial countries, 14, 15*, 16-18,
331Primary producing countries, 13, 14,
19-20, 20-24Summary, 15*, 16*
BANGLADESHExchange rate, 78*Purchases and repurchases from Fund,
65*, 67, 88*, 89*, 91*SDRs, 83*, 87*Stand-by arrangement with Fund, 90*
BANK FOR INTERNATIONAL SETTLEMENTS(BIS)
Holder of SDRs, 50BARBADOS
Exchange rate, 78*Gold distribution, 105Purchases from Fund, 88*, 91*SDRs, 83*
BELGIUMContributions to: Subsidy Account,
65*; Trust Fund, 60Exchange rate, 29t, 78*General Arrangements to Borrow, 94*Intermediary in gold distribution, 60
(fn.)International reserves, 42*SDRs, 48, 49*, 83*Super gold tranche position in Fund,
56*
BENINExchange rate, 78*SDRs, 83*
BOARD OF GOVERNORSInterim Committee on the International
Monetary System (Interim Commit-tee), 12, 41, 45, 48, 111; announce-ment and communiqués, 112-16
loint Ministerial Committee of theBank and the Fund on the Transferof Real Resources to DevelopingCountries (Development Commit-tee), 45; announcement and com-muniqué, 117-18
BOLIVIAExchange rate, 78*Repurchases from Fund, 89*SDRs, 83*
BOTSWANAExchange rate, 78*SDRs, 83*
BRAZILContributions to: Subsidy Account,
65*; Trust Fund, 60Exchange rate, 78*Intermediary in gold distribution, 60
(fn.)Purchases and repurchases from Fund,
91*Special consultations with Fund, 68
(fn.)SDRs, 83*, 87*Super gold tranche position in Fund,
56*BUDGET OF FUND, 128-29BUFFER STOCK FINANCING BY FUND, 511,
53-54, 101BURMA
Exchange rate, 78*Purchases and repurchases from Fund,
67, 89*, 91*SDRs, 49*, 83*, 87*
BURUNDIExchange rate, 78*Gold distribution, 105Purchases and repurchases from Fund,
66,91*SDRs, 83*Stand-by arrangement with Fund, 90*
BY-LAWS, RULES AND REGULATIONS, 38,45-46
CAMBODIAExchange rate, 78*Gold distribution, 60(fn.)Purchases from Fund, 91*SDRs, 49, 83*
CAMEROONExchange rate, 78*Purchases from Fund, 65*, 88*, 91*SDRs, 83*
CANADABalance of payments, 16, 17, 33tContributions to: Subsidy Account,
65*; Trust Fund, 60Economic policies, 6, 32, 35Exchange rate, 18t, 25, 26, 28, 291,
31t, 33t, 78*
157
©International Monetary Fund. Not for Redistribution

INDEX
CANADA (continued)General Arrangements to Borrow, 94*Interest rate, 19tIntermediary in gold distribution, 60
(fn.)International reserves, 42*Oil facility in Fund, 57Output, 2, 3*, 41Prices, 3*,4t, 30, 31t, 33tSpecial consultations with Fund, 68
(fn.)SDRs, 49*, 83*, 87*Super gold tranche position in Fund,
56*CAPE VERDE
Application for membership in Fund,71
CAPITAL MARKETS, 21, 23, 38-39, 40-41,118
CENTRAL AFRICAN EMPIREExchange rate, 78*Purchases from Fund, 65*, 91*SDRs, 83*
CHADExchange rate, 78*Purchases from Fund, 88*, 91*SDRs, 83*
CHILEExchange rate, 78*Purchases and repurchases from Fund,
54-55, 88*, 89*, 91*SDRs, 49*, 83*, 87*
CHINA, REPUBLIC OFExchange rate, 78*Gold distribution, 60(fn.)
COLOMBIAExchange rate, 78*Purchases and repurchases from Fund,
91*SDRs, 48*, 83*, 87*Super gold tranche position in Fund,
56*
COMOROSExchange rate, 78*Membership in Fund, 71Participation in Special Drawing Ac-
count, 71Repurchases from Fund, 89*
COMPENSATORY FINANCING BY FUND, 45,50, 51t, 53, 88*, 91*
CONGO, PEOPLE'S REPUBLIC OF THEExchange rate, 78*Purchases from Fund, 66, 88*, 91*SDRs, 83*Stand-by arrangement with Fund, 90*
CONSULTATIONS WITH FUND MEMBERS,67-68; special, 68
COSTA RICAExchange rate, 78*Purchases and repurchases from Fund,
88*, 89*SDRs, 49*, 83*Stand-by arrangement with Fund, 90*
CYPRUSExchange rate, 78*Purchases from Fund, 88*, 91*SDRs, 83*
DENMARKBalance of payments, 16, 32Contribution to Subsidy Account, 65*Exchange rate, 78*International reserves, 42*Repurchases from Fund, 89*, 93*
SDRs, 49*, 83*Super gold tranche position in Fund,
56*
DEVELOPMENT COMMITTEESee BOARD OF GOVERNORS
DOMINICAN REPUBLICExchange rate, 78*Purchases and repurchases from Fund,
88*, 91*SDRs, 48*, 83*, 87*
ECUADORExchange rate, 78*Purchases and repurchases from Fund,
51 (fn.), 88*, 91*SDRs, 83*, 87*Super gold tranche position in Fund,
56*
EGYPTExchange rate, 78*Purchases and repurchases from Fund,
53,65*, 67, 88*, 89*, 91*Special consultations with Fund,
68(fn.)SDRs, 83*, 87*Stand-by arrangement with Fund, 90*
EL SALVADORExchange rate, 78*Purchases and repurchases from Fund,
91*SDRs, 49*, 83*, 87*
EQUATORIAL GUINEAExchange rate, 78*SDRs, 83*
ETHIOPIAExchange rate, 78*
EXCHANGE RATESEffective rates, 18, 31t, 33t, 34tEuropean common margins arrange-
ment ("snake"), 18-19, 25, 26, 28Forward market, 28, 29ÍIndustrial countries, 18-19List as of June 30, 1977, 78*-81*Practices, 25-27Relationship with: inflation rates, 19;
prices, 28, 30Role in balance of payments adjust-
ment, 26-27, 28, 30, 32, 35Surveillance, 45, 46, 107-109, 116Terms of trade, effect on, 32, 34, 35Uncertainty, 27-28, 291"Vicious circle," 35See also individual countries
EXECUTIVE BOARD DECISIONSAttribution of repurchases, 110Buffer stock financing facility, 101GAB credit arrangement for Japan,
104Gold sales, 104-105Increase in Fund's charges, 106-107Rates of remuneration under
Rule I-10, 103SDR reconstitution, 102-103SDR transactions by agreement be-
tween participants, 103Subsidy Account, review, 101-102Surveillance over exchange rate poli-
cies, 107-109Transfer of SDRs to participants mak-
ing purchases from Fund, 105-106
EXECUTIVE DIRECTORSChanges in membership, 123-37List and voting power, 120-22
EXTENDED FUND FACILITY, 51t, 53, 88*,97*
FIJIExchange rate, 78*Repurchases from Fund, 57SDRs, 83*
FINANCIAL STATEMENTS OF FUND, 131-55
FINLANDBalance of payments, 20Contribution to Subsidy Account, 65*Exchange rate, 26, 78*Purchases from Fund, 54, 88*SDRs, 83*, 87*Stand-by arrangement with Fund, 90*Super gold tranche position in Fund,
56*
FOREIGN EXCHANGE RESERVESSee INTERNATIONAL RESERVES
FRANCEBalance of payments, 16, 32, 331Capital movements, 6Contribution to Subsidy Account, 65*Economic policies, 2, 6, 16-17, 32Exchange rate, 26, 29t, 31t, 33t, 34t,
78*General Arrangements to Borrow, 94*Gold depository, 60Interest rates, 19t, 63t, 63(fn.)Intermediary in gold distribution, 60
(fn.)International reserves, 42*Official claims in French francs, 43*,
44*Output, 2, 3*, 41Prices, 3*, 4t, 30, 31t, 33tSpecial consultations with Fund, 68
(fn.)SDRs, 48*, 83*, 87*Super gold tranche position in Fund,
56*Terms of trade, 34t
GABONExchange rate, 79*SDRs, 83*
GAMBIA, THEExchange rate, 79*Purchases from Fund, 67, 88*, 91*SDRs, 48*, 83*. 87*
GENERAL ACCOUNT TRANSACTIONSCharges, 45, 49, 61-62, 63, 64, 97*,
98*, 106-107; payment in SDRs, 47,50, 56-57
Holdings of: gold, 51*; SDRs, 47, 51*,56-57, 64, 82*; usable currencies,51*
Purchases by members, 40, 47, 50-51,52, 82*, 87*, 88*, 91*, 96*; sum-mary of, 94*
Remuneration paid to members, 61,62, 63, 82*, 98*, 103
Replenishment of currencies, 95*Repurchase obligations of members,
93*Repurchases by members, 47, 49, 50-
51, 54-55, 82*, 89*, 91*, 94*, 96*;attribution of, 55, 110
Super gold tranche positions of mem-bers, 56*
Use of currencies, 55-56GENERAL ARRANGEMENTS то BORROW,
45, 57-58, 94*, 98*, 104Borrowing by Fund, 49, 51*, 52, 57, 64
GERMANY, FEDERAL REPUBLIC OFBalance of payments, 16*, 17, 32, 33tContributions to: Subsidy Account,
65*; Trust Fund, 60Economic policy, 1, 5-6, 12, 19, 32Exchange rate, 18-19, 29t, 31t, 33t,
34t,79*
158
©International Monetary Fund. Not for Redistribution
INDEX
General Arrangements to Borrow, 94*Interest rate, 19t, 63t, 63(fn.)Intermediary in gold distribution, 60
(fn.)International reserves, 42*Official claims in deutsche mark, 43*,
44*Oil facility in Fund, 57Output, 2, 3*, 4tPrices, 3-4, 30, 311, 331Purchases from Fund, 52, 88*, 96*Special consultations with Fund, 68
(fn.)SDKs, 48, 49, 83*Super gold tranche position in Fund,
56*Terms of trade, 34t
GHANAExchange rate, 79*Purchases and repurchases from Fund,
91*SDKs, 49*, 83*, 87*
GOLDHoldings, 36, 37, 38*, 39, 43*, 44*Payments to Fund, 93*Role in system, 36Sales by Fund: for distribution, 51*,
58, 60-61, 66, 95*, 104-105; in auc-tions, 51*, 58-59, 66, 95*, 104-105
GREECEContribution to Subsidy Account, 65Exchange rate, 26, 79*Purchases and repurchases from Fund,
88*, 91*, 93*SDKs, 49*, 83*, 87*
GRENADAExchange rate, 79*Gold distribution, 105Purchases from Fund, 88*SDKs, 83*, 87*Stand-by arrangement with Fund, 90*
GUATEMALAExchange rate, 79*Purchases and repurchases from Fund,
91*SDKs, 83*Super gold tranche position in Fund,
56*
GUINEAExchange rate, 79*Purchases from Fund, 91 *SDKs, 83*, 87*
GUINEA-BISSAUExchange rate, 79*Membership in Fund, 71Participation in Special Drawing Ac-
count, 71
GUYANAExchange rate, 79*Purchases and repurchases from Fund,
88*, 91*SDRs, 83*Stand-by arrangement with Fund, 90*
HAITIExchange rate, 79*Purchases and repurchases from Fund,
65*, 66, 88*, 89*, 91*SDRs, 84*, 87*Stand-by arrangement with Fund, 90*
HONDURASExchange rate, 79*SDRs, 84*
ICELANDExchange rate, 26, 79*Purchases and repurchases from Fund,
91*SDRs, 84*, 87*
INCOME AND EXPENSES OF FUND, 61-62,64, 98*, 130*
Review of financial position, 45, 51-52, 106-107
INCOMES POLICY, 5, 35
INDIAExchange rate, 79*Gold depository, 60Purchases and repurchases from Fund,
54, 57, 65*, 89*, 91*SDRs, 48, 84*
INDONESIAExchange rate, 79*Repurchases from Fund, 93*Special consultations with Fund, 68
(fn.)SDRs, 48*, 84*, 87*Super gold tranche position in Fund,
56*
INDUSTRIAL COUNTRIESBalance of payments, 13, 14-18, 30, 32Economic activity and policies, 1-6Exchange rates, 18-19, 28Interest rates, 19tInternational reserves, 37-38, 42*, 44*Prices, 3_, 41Private investment, 2SDR holdings, 47-48Trade, 9-11Unemployment, 4-5Sec also individual countries
INTERIM COMMITTEESee BOARD OF GOVERNORS
INTERNATIONAL ADJUSTMENT PROCESS,12-24,25,30, 112-13, 114-15
INTERNATIONAL ORGANIZATIONSFund relations with, 69-71
INTERNATIONAL RESERVESAdequacy, 38-41Borrowed from capital markets, 39, 40Composition, 38-39, 39-40, 43*, 44*Distribution, 37t, 42*Eurocurrency holdings, 39, 43 *, 44*Foreign exchange holdings, 36-37,
38*, 43*, 44*Gold holdings, 36, 37, 38*, 39, 43*,
44*Industrial countries, 37-38Official holdings, 39Primary producing countries, 21, 37-38Reserve positions in Fund, 36, 37, 38*,
39,40,43*, 44*SDRs, 36, 37, 38*, 39, 43*, 44*Valuation, 35-36
IRANExchange rate, 26, 79*Contribution to Subsidy Account, 65*Loan repayment by Fund, 54Oil facility in Fund, 57Special consultations with Fund, 68
(fn.)SDRs, 48*, 84*, 87*Super gold tranche position in Fund,
56*IRAQ
Exchange rate, 79*Purchases and repurchases from Fund,
91*SDRs, 84*, 87*Super gold tranche position in Fund,
56*
IRELANDExchange rate, 79*SDRs, 84*, 87*Super gold tranche position in Fund,
56*ISRAEL
Exchange rate, 79*Purchases from Fund, 88*, 91*SDRs, 49*, 84*, 87*Stand-by arrangement with Fund, 90*
ITALYBalance of payments, 16, 32, 331Capital movements, 6Contribution to Subsidy Account, 65*Economic policies, 2, 6, 32Exchange rate, 18, 31t, 33t, 79*General Arrangements to Borrow, 94*Interest rate, 19tInternational reserves, 42*Output, 2, 3*, 4tPrices, 3, 4t, 30, 31t, 33tPurchases from Fund, 52, 57, 58Special consultations with Fund, 68
(fn.)SDRs, 84*, 87*Stand-by arrangement with Fund, 52,
90*IVORY COAST
Exchange rate, 79*Purchases from Fund, 65*, 89*, 91*,
93*SDRs, 49*, 84*
JAMAICAExchange rate, 79*Purchases and repurchases from Fund,
53, 88*, 91*, 93*SDRs, 48*, 49*, 84*, 87*
IAPANBalance of payments, 16*, 17, 33tContributions to: Subsidy Account,
65*; Trust Fund, 60Economic activity and policies, 1, 2,
3*, 4t, 5-6, 12, 32Exchange rate, 17, 18, 26, 28, 291, 30,
31t, 33t, 34t, 79*General Arrangements to Borrow, 57,
94*, 104Interest rate, 19t, 631, 63(fn.)Intermediary in gold distribution, 60
(fn.)International reserves, 42*Prices, 3-4, 30, 31t, 33tSpecial consultations with Fund, 68
(fn.)SDRs, 84*, 87*Super gold tranche position in Fund,
56*Terms of trade, 34t
JORDANExchange rate, 79*Purchases and repurchases from Fund,
91*SDRs, 84*
KENYAExchange rate, 79*Purchases and repurchases from Fund,
53,65*, 66, 88*, 91*, 93*Special consultations with Fund, 68
(fn.)SDRs, 84*, 87*
KOREAExchange rate, 79*Purchases and repurchases from Fund,
54-55, 88*, 89*, 91*, 93*SDRs, 48*, 49*, 84*, 87*Stand-by arrangement with Fund, 90*
159
©International Monetary Fund. Not for Redistribution
INDEX
KUWAITExchange rate, 79*Super gold tranche position in Fund,
56*
LAO PEOPLE'S DEMOCRATIC REPUBLICExchange rate, 79*Purchases from Fund, 88*, 91*SDKs, 84*, 87*
LATIN AMERICA AND CARIBBEANBalance of payments, 15*, 22-23Debt and debt service, 23Economic policies, 8Output, 7*Prices, 8*
LEBANONExchange rate, 79*Gold distribution, 105
LESOTHOExchange rate, 79*Gold distribution, 105Purchases from Fund, 67SDKs, 84*
LIBERIAExchange rate, 79*Gold distribution, 105Purchases and repurchases from Fund,
66, 88*, 89*SDKs, 49*, 84*Stand-by arrangement with Fund, 90*
LIBYAExchange rate, 79*
LUXEMBOURGContribution to Subsidy Account, 65*Exchange rate, 79*International reserves, 42*SDKs, 84*Super gold tranche position in Fund,
56*
MADAGASCARExchange rate, 79*SDKs, 49*, 84*, 87*
MALAWIExchange rate, 79*Gold distribution, 105Purchases from Fund, 67SDKs, 84*
MALAYSIAExchange rate, 26, 79*Purchases and repurchases from Fund,
53, 54, 88*, 89*, 91*SDRs, 84*, 87*Super gold tranche position in Fund,
56*MALDIVES
Application for membership in Fund,71
MALIExchange rate, 79*Purchases and repurchases from Fund,
65*, 89*SDRs, 84*, 87*
MALTAExchange rate, 79*SDRs, 84*, 87*Super gold tranche position in Fund,
56*MANAGING DIRECTOR'S REPORT ON ALLO-
CATION OF SDRs, 48, 110-11MAURITANIA
Exchange rate, 79*Purchases from Fund, 65*, 67, 88*,
91*SDRs, 84*, 87*
MAURITIUSExchange rate, 79*Repurchases from Fund, 89*SDRs, 84*, 87*
MEMBERSHIP IN FUND, 71MEXICO
Exchange rate, 26, 79*Purchases from Fund, 53, 88*, 91*SDRs, 48, 49*, 84*, 87*Super gold tranche position in Fund,
56*MIDDLE EAST
Balance of payments, 15*, 22, 23-24Economic policies, 8-9Output, 7*Prices, 8*
MOROCCOExchange rate, 79*Purchases from Fund, 66, 88*, 92*SDRs, 84*
NEPALExchange rate, 79*Purchases from Fund, 66, 88*SDRs, 84*Stand-by arrangement with Fund, 90*
NETHERLANDSBalance of payments, 17Contributions to: Subsidy Account,
65*; Trust Fund, 60Exchange rate, 28, 29t, 79*General Arrangements to Borrow, 94*Intermediary in gold distribution, 60
(fn.)International reserves, 42*SDRs, 84*Super gold tranche position in Fund,
56*NEW ZEALAND
Balance of payments, 20Contribution to Subsidy Account, 65*Exchange rate, 26, 79*International reserves, 42*Output, 7*Prices, 8*Purchases and repurchases from Fund,
53, 88*, 92*, 93*SDRs, 84*, 87*
NICARAGUAExchange rate, 80*Repurchases from Fund, 89*SDRs, 48*, 84*
NIGERExchange rate, 80*SDRs, 84*
NIGERIAExchange rate, 26, 80*SDRs, 84*Super gold tranche position in Fund,
56*NORWAY
Balance of payments, 16, 17, 32Contribution to Subsidy Account, 65*Exchange rate, 80*Intermediary in gold distribution, 60
(fn.)International reserves, 42*SDRs, 84*Super gold tranche position in Fund,
56*
OIL FACILITY IN FUNDBorrowing by Fund, 51*, 52, 54, 57, 64Charges, 97*, 98*Interest payments, 98*Use of, 51t, 54, 65*, 88*
OMANExchange rate, 80*Oil facility in Fund, 57SDRs, 84*
PAKISTANExchange rate, 80*Purchases and repurchases from Fund,
65*, 67, 88*, 89*, 92*Special consultations with Fund, 68
(fn.)SDRs, 84*, 87*Stand-by arrangement with Fund, 90*
PANAMAExchange rate, 80*Gold distribution, 105Purchases from Fund, 88*, 92*SDRs, 84*Stand-by arrangement with Fund, 90*
PAPUA NEW GUINEAExchange rate, 80*Gold distribution, 60Purchases from Fund, 88*, 92*SDRs, 84*, 87*
PARAGUAYExchange rate, 80*SDRs, 84*, 87*
PERUExchange rate, 80*Purchases and repurchases from Fund,
88*, 92*SDRs, 49*, 85*, 87*
PHILIPPINESExchange rate, 80*Gold distribution, 105Purchases and repurchases from Fund,
53, 54-55,66, 88*, 89*, 92*SDRs, 85*, 87*Stand-by arrangement with Fund, 90*
PORTUGALEconomic policy, 20Exchange rate, 26, 80*Purchases from Fund, 88*, 92*SDRs, 85*, 87*Stand-by arrangement with Fund, 90*
PRICES, 28-29, 30, 31t, 33t; and foreigntrade, 10, 11
PRIMARY PRODUCING COUNTRIESMajor oil exporters
Balance of payments, 12, 13, 14, 15*Economic activity and policies, 6, 7*International adjustment process, 24International reserves, 37-38, 42*,
44*Placement of financial surpluses, 13,
14Prices, 6, 8*SDR holdings, 47-48Trade, 9-10, 11
More developed areasBalance of payments, 13, 15*, 19-20Economic activity and policies, 1,
6-7Foreign exchange reserves, 37-38,
42*, 44*International adjustment process, 24Prices, 6-7, 8*Purchases from Fund, 52SDR holdings, 47-48Trade, 9, 10, 11
Non-oil developing countriesBalance of payments, 13, 15*, 20-24Capital and aid flows, 20, 21*Debt and debt service, 21, 221, 231Economic activity and policies, 1,
7-8, 117Inflation rate, 7-8
160
©International Monetary Fund. Not for Redistribution
INDEX
International adjustment process, 24International reserves, 21, 37, 42*,
44*Prices, 8*SDR holdings, 47-48Trade, 7, 9, 10, И
PUBLICATIONS OF FUND, 71, 100*
QATARExchange rate, 80*Super gold tranche position in Fund,
56*QUOTAS OF FUND MEMBERS
General Reviews, 41, 45, 46-47, 115-16; ratio to imports, 40
ROMANIAExchange rate, 80*Purchases from Fund, 88*, 92*SDKs, 85*, 87*Stand-by arrangement with Fund, 90*
RWANDAExchange rate, 80*SDRs, 85*, 87*
SAO TOMÉ AND PRINCIPEApplication for membership in Fund,
71
SAUDI ARABIAContribution to Subsidy Account, 65*Exchange rate, 26, 80*Oil facility in Fund, 54, 57Special consultations with Fund, 68
(fn.)Super gold tranche position in Fund,
56*SENEGAL
Exchange rate, 80*Purchases from Fund, 65*SDRs, 49*, 85*
SEYCHELLESExchange rate, 80*Membership in Fund, 71(fn.)
SIERRA LEONEExchange rate, 80*Gold distribution, 105Purchases from Fund, 65*, 67, 88*,
92*SDRs, 85*
SINGAPOREExchange rate, 26, 80*Special consultations with Fund, 68
(fn.)SOMALIA
Exchange rate, 80*Repurchases from Fund, 93 *SDRs, 85*
SOUTH AFRICABalance of payments, 20Contribution to Subsidy Account, 65*Exchange rate, 26, 80*International reserves, 42*Output, 7*Prices, 8*Purchases and repurchases from Fund,
52, 53,54, 88*, 89*, 92*SDRs, 85*, 87*Stand-by arrangement with Fund, 52,
90*Super gold tranche position in Fund,
56*SPAIN
Contribution to Subsidy Account, 65*Exchange rate, 26, 80*SDRs, 48*, 85*
SPECIAL DRAWING ACCOUNTOperations, 47-50Participants, 71See also SPECIAL DRAWING RIGHTS
SPECIAL DRAWING RIGHTSAllocation, 39-40, 41, 45, 48, 49, 83*-
85*, 116; report by Managing Di-rector, 48, 110-11
BIS as holder, 50Currencies transferred for, 86*Holdings: by General Account, 49, 56-
57, 82*; by participants, 83*-85*Interest, charges, and assessments, 49,
82*-85*, 98*Interest rate on, 50Purchases by members, 49, 82*, 87*,
88*, 96*Reconstitution of participants' hold-
ings, 47, 49-50, 82*, 87*, 102-103Remuneration paid to members, 49, 50,
82*, 87*, 98*, 103Replenishment of participants' curren-
cies, use in, 82*Repurchases by members, use in, 93*,
96*Restoration of participants' holdings,
82*Transactions and operations, summary
of, 83*-85*Transfers: by agreement, 47, 48-49,
49-50, 56, 103; to and from GeneralAccount, 47, 49-50, 82*-85*, 87*,105-106; total, 82*; with designa-tion, 47, 48, 49, 83*-86*
Valuation, 50SRI LANKA
Exchange rate, 80*Purchases and repurchases from Fund,
65*, 88*, 89*, 92*SDRs, 85*, 87*
STAFF OF FUND, 71STAND-BY ARRANGEMENTS FOR FUND
MEMBERS, 45, 52, 88*, 90*; sum-mary, 94*
SUBSIDY ACCOUNT, 64-66, 101-102SUDAN
Exchange rate, 80*Gold distribution, 105Purchases and repurchases from Fund,
65*, 88*, 89*, 92*SDRs, 49*, 85*, 87*
SUPPLEMENTARY CREDIT FACILITY, 24,35,41,45,47, 115
SURINAMApplication for membership in Fund,
71SWAZILAND
Exchange rate, 80*Repurchases from Fund, 89*SDRs, 85*
SWEDENBalance of payments, 16, 19, 32Contributions to: Subsidy Account,
65*; Trust Fund, 60Exchange rate, 80*General Arrangements to Borrow, 94*Intermediary in gold distribution, 60
(fn.)International reserves, 42*SDRs, 85*Super gold tranche position in Fund,
56*SWITZERLAND
Balance of payments, 17, 32, 331Borrowing by Fund, 51, 52, 57, 58, 64Contribution to Subsidy Account, 65*Economic policies, 32
Exchange rate, 29t, 31t, 33t, 34tGeneral Arrangements to Borrow 57,
58International reserves, 42*Prices, 30, 31t,33tTerms of trade, 34t
SYRIAN ARAB REPUBLICExchange rate, 80*Purchases and repurchases from Fund,
52, 89*, 92*SDRs, 85*
TANZANIAExchange rate, 80*Purchases from Fund, 66, 65*, 88*,
92*SDRs, 49*, 85*, 87*Stand-by arrangement with Fund, 90*
TECHNICAL ASSISTANCE AND TRAINING BYFUND, 68-69
THAILANDExchange rate, 80*Purchases from Fund, 88*, 92*SDRs, 85*
TOGOExchange rate, 80*Purchases from Fund, 88*, 92*SDRs, 85*
TRINIDAD AND TOBAGOExchange rate, 80*SDRs, 48*, 85*, 87*Super gold tranche position in Fund,
56*TRUST FUND, 45, 66-67
Disbursements, 66, 67Gold: auctions, 59*, 66; sales for dis-
tribution, 58, 59-60, 66Investments, 67Members eligible for assistance, 66
TUNISIAExchange rate, 80*SDRs, 85*
TURKEYExchange rate, 80*Purchases from Fund, 54, 88*, 92*SDRs, 49*, 85*
UGANDAExchange rate, 80*Gold distribution, 105Purchases and repurchases from Fund,
89*, 92*SDRs, 85*, 87*
UNITED ARAB EMIRATESExchange rate, 80*Super gold tranche position in Fund,
56*
UNITED KINGDOMBalance of payments, 16-17, 32, 33tCapital movements, 6, 32Contribution to Subsidy Account, 65*Economic policies, 2, 6, 32Exchange rate, 18, 25, 28, 29t, 31t,
33t, 80*General Arrangements to Borrow, 94*Gold depository, 60Interest rates, 19t, 631, 63(fn.)International reserves, 42*Official claims in sterling, 43*, 44*Output, 2, 3*, 41Prices, 3, 4t, 30, 31t, 33tPurchases and repurchases from Fund,
49, 52, 57, 58, 88*Special consultations with Fund, 68
(fn.)SDRs, 85*
161
©International Monetary Fund. Not for Redistribution

INDEX
UNITED KINGDOM (continued)Stand-by arrangement with Fund, 52,
90*UNITED STATES
Balance of payments, 16*, 17-18, 33t,39
Capital flows, 17-18Contribution to Trust Fund, 60Economic activity and policies, 1, 2,
3*, 4t, 5-6, 12, 19, 32, 35Exchange rate, 18, 28, 31t, 33t, 80*General Arrangements to Borrow, 94*Gold depository, 60Interest rate, 19t, 631, 63(fn.)Intermediary in gold distribution, 60
(fn.)International reserves, 42*Official claims in dollars, 36, 37, 39,
44*Prices, 3-4, 30, 31t, 33tSpecial consultations with Fund, 68
(fn.)SDRs, 48, 85*Subsidy Account investment, 65Super gold tranche position in Fund,
56*Trust Fund investment, 67
UPPER VOLTAExchange rate, 80*SDRs, 85*Super gold tranche position in Fund,
56*URUGUAY
Exchange rate, 80*Purchases and repurchases from Fund,
54-55, 89*, 92*
Special consultations with Fund, 68(fn.)
SDRs, 85*, 87*Stand-by arrangement with Fund, 90*
VENEZUELAAcceptance of Article VIII, 67Contributions to: Subsidy Account,
65*; Trust Fund, 60Exchange rate, 81 *Intermediary in gold distribution, 60
(fn.)Oil facility in Fund, 54, 57Special consultations with Fund, 68
(fn.)SDRs, 85*Super gold tranche position in Fund,
56*
VIET NAMExchange rate, 81*Purchases from Fund, 88*, 92*SDRs, 48*, 85*, 87*
WAGE INDEXATION, 35
WESTERN SAMOAExchange rate, 81*Purchases and repurchases from Fund,
65*, 66, 88*, 89*, 92*, 93*SDRs, 85*, 87*Stand-by arrangement with Fund, 90*
WORLD TRADE, 2, 9-11
YEMEN ARAB REPUBLICExchange rate, 81*SDRs, 85*
YEMEN, PEOPLE'S DEMOCRATIC REPUBLICOF
Exchange rate, 81*Purchases from Fund, 65*, 66, 88*,
92*SDRs, 85*, 87*
YUGOSLAVIAContribution to Subsidy Account, 65*Exchange rate, 26, 81*Purchases from Fund, 54, 88*Special consultations with Fund, 68
(fn.)SDRs, 48*, 49*, 85*
ZAÏREExchange rate, 81*Gold distribution, 105Purchases and repurchases from Fund,
52, 66, 88*, 89*, 92*SDRs, 48*, 85*, 87*Stand-by arrangement with Fund, 90*
ZAMBIAExchange rate, 81*Gold distribution, 105Purchases and repurchases from Fund,
53, 88*, 89*, 92*Special consultations with Fund, 68
(fn.)SDRs, 48*, 49*, 85*, 87*Stand-by arrangement with Fund, 90*
162
©International Monetary Fund. Not for Redistribution