international monetary fund washington, d.c.and industry secretary favila, socioeconomic planning...
TRANSCRIPT
© 2007 International Monetary Fund February 2007 IMF Country Report No. 07/62
January 5, 2007 January 19, 2007 January 29, 2001 November 17, 2006 2006 January 29, 2001 Philippines: 2006 Article IV Consultation—Staff Report; Public Information Notice on the Executive Board Discussion; and Statements by the Authorities of the Philippines Under Article IV of the IMF’s Articles of Agreement, the IMF holds bilateral discussions with members, usually every year. In the context of the 2006 Article IV consultation with the Philippines, the following documents have been released and are included in this package: • the staff report for the 2006 Article IV consultation, prepared by a staff team of the IMF,
following discussions that ended on November 17, 2006, with the officials of the Philippines on economic developments and policies. Based on information available at the time of these discussions, the staff report was completed on January 5, 2007. The views expressed in the staff report are those of the staff team and do not necessarily reflect the views of the Executive Board of the IMF;
• a Public Information Notice (PIN) summarizing the views of the Executive Board as expressed during its January 19, 2007 discussion of the staff report that concluded the Article IV consultation; and
• statements by the authorities of the Philippines.
The policy of publication of staff reports and other documents allows for the deletion of market-sensitive information. To assist the IMF in evaluating the publication policy, reader comments are invited and may be sent by e-mail to [email protected].
Copies of this report are available to the public from
International Monetary Fund • Publication Services 700 19th Street, N.W. • Washington, D.C. 20431
Telephone: (202) 623-7430 • Telefax: (202) 623-7201 E-mail: [email protected] • Internet: http://www.imf.org
Price: $18.00 a copy
International Monetary Fund
Washington, D.C.


INTERNATIONAL MONETARY FUND
PHILIPPINES
Staff Report for the 2006 Article IV Consultation
Prepared by the Staff Representatives for the 2006 Consultation with the Philippines
Approved by Masahiko Takeda and Michael Hadjimichael
January 5, 2007
• Dates: November 6-17, 2006.
• Team: Messrs. Gordon (Head), Brooks, Singh, and Ms. Fujita (all APD), Mr. Seshadri (PDR), Ms. Zakharova (FAD), Mr. Podpiera (MCM), and Mr. Baqir (Resident Representative). Mr. Newhouse (FAD) and Mrs. Mañalac (OED) also participated in the discussions.
• Philippines Representatives: Included Finance Secretary Teves, Bangko Sentral ng Pilipinas (BSP) Governor Tetangco, Budget and Management Secretary Andaya, Energy Secretary Lotilla, Trade and Industry Secretary Favila, Socioeconomic Planning Secretary Neri, House Speaker de Venecia, academics, financial market participants, and business, trade union and NGO representatives.
• Previous PPM Discussions: Executive Directors’ views and comments at the Mid-2006 PPM discussions can be found on http://www.imf.org/np/sec/pn/2006/pn06114.htm.
• Statistical Base: Data provision for surveillance purposes is adequate overall, but shortcomings remain in certain areas. With STA assistance, the authorities have made progress in improving the nonfinancial public sector debt and balance of payments data.
• Exchange Rate: Market determined with the BSP intervening to smooth volatility and strategically build reserves.
• Exchange System: Article VIII, Sections 2, 3 and 4. Exchange system is free of restrictions on the making of payments and transfers for current international transactions.
• PPM: On December 29, 2006, the Philippines repaid early its outstanding obligations to the Fund amounting to $220 million. The repayment triggered the end of PPM, four months ahead of schedule.
2
Contents Page
Glossary of Abbreviations and Terms ..................................................................................... 3 Executive Summary.... .............................................................................................................. 4 I. Introduction...................................................................................................................5 II. Recent Economic Developments ..................................................................................6 III. Outlook and Risks.........................................................................................................9 IV. Report on the Discussions...........................................................................................10 A. Dealing with Continued Strong Foreign Exchange Inflows ..................................10 B. Ensuring that Fiscal Reforms Continue and Are Sustainable ................................12 C. Strengthening the Structural and Financial Sector Foundations for Higher Medium-Term Growth...........................................................................................14 V. Staff Appraisal ............................................................................................................19 Boxes 1. The Appreciation of the Peso and Competitiveness ...................................................21 2. Banking Sector Reforms .............................................................................................22 Figures 1. External Developments, 2001-06................................................................................23 2. Domestic Developments, 1999-2006..........................................................................24 3. Fiscal Sector, 1998-2006.. ..........................................................................................25 4. Banking Sector, 1998-2006.. ......................................................................................26 Tables 1. Selected Economic Indicators, 2002–07.....................................................................27 2. National Government Cash Accounts, 2002–07.........................................................28 3. Balance of Payments, 2002–07...................................................................................29 4. Monetary Survey, 2002–06.........................................................................................30 5. Medium-Term Outlook, 2004-11 (Currently Identified Measures Scenario).............31 6. Medium-Term Outlook, 2004–11 (Additional Reforms Scenario) ............................32 7. Banking Sector Indicators, 2001–06...........................................................................33 8. Indicators of External Vulnerability, 2001–06 ...........................................................34 Appendix I. Debt Sustainability Analysis.......................................................................................35 Annexes I. Fund Relations ............................................................................................................40 II. Relations with the World Bank Group........................................................................43 III. Relations with the Asian Development Bank .............................................................46 IV. Statistical Issues ..........................................................................................................48
3
GLOSSARY OF ABBREVIATIONS AND TERMS
AML/CFT ............Anti-Money Laundering/Combating Financing of Terrorism BIR.......................Bureau of Internal Revenue BOC .....................Bureau of Customs BOL......................Board of Liquidators BPO......................Business Process Outsourcing BSP ......................Bangko Sentral ng Pilipinas ERC......................Energy Regulatory Commission EVAT...................Expanded Value-Added Tax FATF....................Financial Action Task Force Gencos..................NPC’s generation assets GFCF....................Gross Fixed Capital Formation GSIS.....................Government Service Insurance System GOCC ..................Government-Owned and Controlled Corporation IFRS .....................International Financial Reporting Standards IRRs ....................Implementing Rules and Regulations MOU ....................Memorandum of Understanding MTPDP ................Medium-Term Philippine Development Plan NCCTs ................Non-Cooperative Countries or Territories NDF......................Nondeliverable Forwards NFA......................National Food Authority NFPS....................Nonfinancial Public Sector NG........................National Government NPA......................Nonperforming Asset NPC......................National Power Corporation NPL......................Nonperforming Loans NSO......................National Statistics Office OFW.....................Overseas Filipino Worker PCA......................Prompt Corrective Action PDIC ....................Philippine Deposit Insurance Corporation PPM......................Post-Program Monitoring SEC ......................Securities and Exchange Commission SPV ......................Special Purpose Vehicle SSI........................Social Security Institution SSS.......................Social Security System TI..........................Transparency International Transco.................National Transmission Corporation TSC .....................Transition Supply Contract WESM..................Wholesale Electricity Spot Market y/y ........................Year-on-year
4
EXECUTIVE SUMMARY
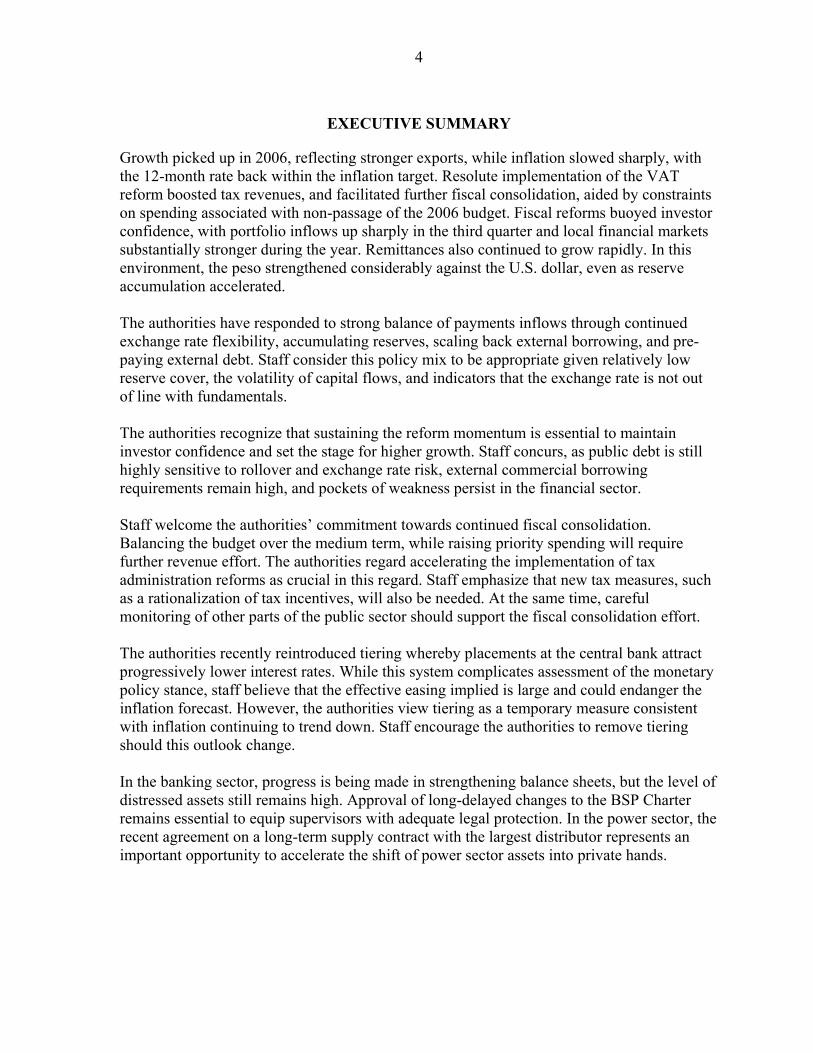
Growth picked up in 2006, reflecting stronger exports, while inflation slowed sharply, with the 12-month rate back within the inflation target. Resolute implementation of the VAT reform boosted tax revenues, and facilitated further fiscal consolidation, aided by constraints on spending associated with non-passage of the 2006 budget. Fiscal reforms buoyed investor confidence, with portfolio inflows up sharply in the third quarter and local financial markets substantially stronger during the year. Remittances also continued to grow rapidly. In this environment, the peso strengthened considerably against the U.S. dollar, even as reserve accumulation accelerated. The authorities have responded to strong balance of payments inflows through continued exchange rate flexibility, accumulating reserves, scaling back external borrowing, and pre-paying external debt. Staff consider this policy mix to be appropriate given relatively low reserve cover, the volatility of capital flows, and indicators that the exchange rate is not out of line with fundamentals. The authorities recognize that sustaining the reform momentum is essential to maintain investor confidence and set the stage for higher growth. Staff concurs, as public debt is still highly sensitive to rollover and exchange rate risk, external commercial borrowing requirements remain high, and pockets of weakness persist in the financial sector. Staff welcome the authorities’ commitment towards continued fiscal consolidation. Balancing the budget over the medium term, while raising priority spending will require further revenue effort. The authorities regard accelerating the implementation of tax administration reforms as crucial in this regard. Staff emphasize that new tax measures, such as a rationalization of tax incentives, will also be needed. At the same time, careful monitoring of other parts of the public sector should support the fiscal consolidation effort. The authorities recently reintroduced tiering whereby placements at the central bank attract progressively lower interest rates. While this system complicates assessment of the monetary policy stance, staff believe that the effective easing implied is large and could endanger the inflation forecast. However, the authorities view tiering as a temporary measure consistent with inflation continuing to trend down. Staff encourage the authorities to remove tiering should this outlook change. In the banking sector, progress is being made in strengthening balance sheets, but the level of distressed assets still remains high. Approval of long-delayed changes to the BSP Charter remains essential to equip supervisors with adequate legal protection. In the power sector, the recent agreement on a long-term supply contract with the largest distributor represents an important opportunity to accelerate the shift of power sector assets into private hands.

5
I. Introduction
1. Financial markets have rewarded the rapid pace of fiscal consolidation. The large reduction in the national government deficit in 2004 and 2005 was achieved primarily through expenditure compression. However, full implementation of the VAT reform in early 2006 broadened the national government’s adjustment effort to the revenue side, and tax administration has proved sufficient to ensure that collections have risen as programmed. The progress with fiscal consolidation has contributed to a surge in investor confidence that has led to a dramatic fall in the local currency risk premium (Chart 1).
2. However, the reform momentum needs to be sustained. Uncertainty over the future direction of U.S. monetary policy in May-June 2006 quickly spilled over into local markets (Chart 2), as it did in other emerging markets. This episode is a reminder that, with public debt and external commercial borrowing requirements still high, the Philippines is still vulnerable. Local markets would likely be hard hit by a renewed rise in global risk aversion, particularly if this were to coincide with signs of fiscal slippage in the run-up to the May 2007 elections. The reform momentum will also need to be sustained for there to be positive growth spillovers, which are needed to step up the pace of poverty reduction (nearly 50 percent of the population live on less than $2 a day) and build popular support for reforms.
Chart 2. The Philippine Peso and the VIX Index 1/
(Jan. 2 - Dec. 15, 2006)
47
48
49
50
51
52
53
54
1/2/
2006
2/2/
2006
3/2/
2006
4/2/
2006
5/2/
2006
6/2/
2006
7/2/
2006
8/2/
2006
9/2/
2006
10/2
/200
6
11/2
/200
6
12/2
/200
60
5
10
15
20
25
30PHP/USD (left axis)
VIX Index (right axis)
1/ The VIX index is a forward-looking measure of market uncertainty based on S&P 500 index options. Values above 30 generally indicate substantial uncertainty, while values below 20 suggest a lack thereof.
Source: Bloomberg LP.
Chart 1. Uncovered Interest Parity Risk Premia 1/(Apr. 2003 - Nov. 2006, in percent)
-2
0
2
4
6
8
10
12
14
16
18
Apr
-03
Jul-0
3
Oct
-03
Jan-
04
Apr
-04
Jul-0
4
Oct
-04
Jan-
05
Apr
-05
Jul-0
5
Oct
-05
Jan-
06
Apr
-06
Jul-0
6
Oct
-06
PhilippinesIndonesiaThailandMalaysia
1/ Defined as the interest differential on one year treasury bills vis-à-vis the U.S. less the 12 month ahead Consensus Economics forecast of the change in the exchange rate.
Sources: CEIC Data Company Ltd; Consensus Economics; and staff calculations.
6
II. RECENT ECONOMIC DEVELOPMENTS
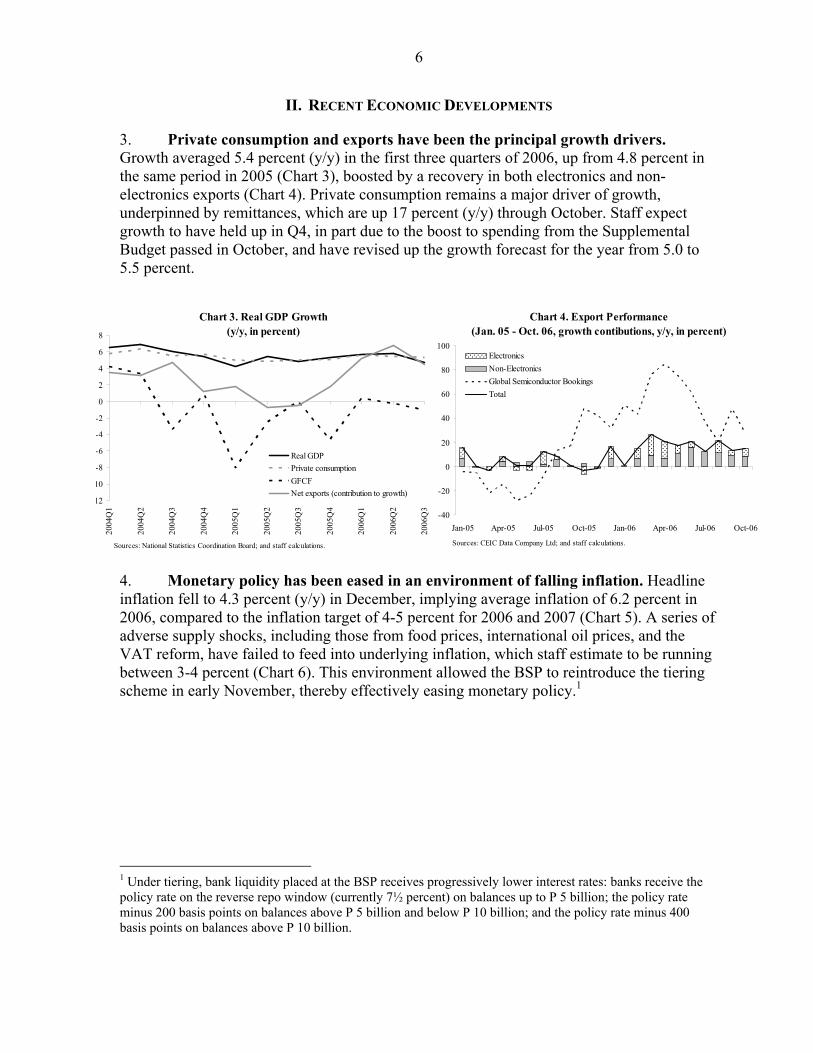
3. Private consumption and exports have been the principal growth drivers. Growth averaged 5.4 percent (y/y) in the first three quarters of 2006, up from 4.8 percent in the same period in 2005 (Chart 3), boosted by a recovery in both electronics and non-electronics exports (Chart 4). Private consumption remains a major driver of growth, underpinned by remittances, which are up 17 percent (y/y) through October. Staff expect growth to have held up in Q4, in part due to the boost to spending from the Supplemental Budget passed in October, and have revised up the growth forecast for the year from 5.0 to 5.5 percent.
4. Monetary policy has been eased in an environment of falling inflation. Headline inflation fell to 4.3 percent (y/y) in December, implying average inflation of 6.2 percent in 2006, compared to the inflation target of 4-5 percent for 2006 and 2007 (Chart 5). A series of adverse supply shocks, including those from food prices, international oil prices, and the VAT reform, have failed to feed into underlying inflation, which staff estimate to be running between 3-4 percent (Chart 6). This environment allowed the BSP to reintroduce the tiering scheme in early November, thereby effectively easing monetary policy.1
1 Under tiering, bank liquidity placed at the BSP receives progressively lower interest rates: banks receive the policy rate on the reverse repo window (currently 7½ percent) on balances up to P 5 billion; the policy rate minus 200 basis points on balances above P 5 billion and below P 10 billion; and the policy rate minus 400 basis points on balances above P 10 billion.
Chart 3. Real GDP Growth(y/y, in percent)
12
10
-8
-6
-4
-2
0
2
4
6
8
2004
Q1
2004
Q2
2004
Q3
2004
Q4
2005
Q1
2005
Q2
2005
Q3
2005
Q4
2006
Q1
2006
Q2
2006
Q3
Real GDPPrivate consumptionGFCFNet exports (contribution to growth)
Sources: National Statistics Coordination Board; and staff calculations.
Chart 4. Export Performance(Jan. 05 - Oct. 06, growth contibutions, y/y, in percent)
-40
-20
0
20
40
60
80
100
Jan-05 Apr-05 Jul-05 Oct-05 Jan-06 Apr-06 Jul-06 Oct-06
ElectronicsNon-ElectronicsGlobal Semiconductor BookingsTotal
Sources: CEIC Data Company Ltd; and staff calculations.

7
Chart 5. Headline Inflation(Jan. 2005 - Dec. 2006, in percent)
0
2
4
6
8
10
12
14
16
18
2005M1 2005M5 2005M9 2006M1 2006M5 2006M9
m/m (saar)
y/y
Sources: BSP; and IMF staff calculations.
5. The national government deficit looks likely to have undershot the 2006 target, and further consolidation is planned for 2007. Revenues grew by over 20 percent in January-October (y/y) due to successful implementation of the VAT reform, and there are also possible signs that collection efficiency is improving (Chart 7). Meanwhile, despite large needs, spending growth was slow reflecting the failure of Congress to pass the 2006 budget. Against this background, staff expect the national government deficit to have shrunk further in 2006 and to be significantly below the target of 2 percent of GDP. A similar fall is expected for the non-financial public sector (NFPS) deficit, reflecting consolidation at the national government level, continued improved performance of the social security institutions, and expenditure savings by the National Power Corporation (NPC) (Text Table 1). The 2007 budget programs a further reduction in the national government deficit to 0.9 percent of GDP and a large increase in priority infrastructure and social spending, on the basis of assumed strong revenue growth.
6. There have been strong inflows of foreign exchange. Remittances have continued to grow strongly and the balance of payments received additional support in the second half of 2006 from weaker oil prices. There has been a pick-up in FDI (cumulative net inflows
Chart 6. Measures of Core Inflation(Jan. 2005 - Nov. 2006, m/m saar, in percent)
0
2
4
6
8
10
12
14
2005M1 2005M5 2005M9 2006M1 2006M5 2006M9
Core
Trimmed Mean
Weighted Median
Sources: BSP; and IMF staff calculations.
Chart 7. Contributions to Increase in Tax Revenues(Jan-Oct. 2006 over Jan-Oct. 2005, in billions of Peso)
-20
-10
0
10
20
30
40
50
60
70
Growth oftax base
VAT Reform Higher oilprices
Lowerinterest rates
Reduction inoil tariff
Exchangerate
appreciation
Other
Sources: Philippine authorities; and IMF staff calculations.
2003 2004 2005 2006
NFPS 5.6 5.0 2.1 0.9NG (IMF definition) 4.9 4.2 3.0 1.9SSIs -0.4 -0.5 -0.9 -0.9LGUs -0.4 -0.3 -0.4 -0.3GOCCs (incl. NPC) 1.5 1.8 0.4 0.4Other -0.1 -0.1 0.0 -0.2
Memorandum items:NG (auth. Definition) 4.6 3.8 2.7 1.5
Sources: Philippine authorities; and Fund staff calculations.
1/ Staff's projections.
Text Table 1. Sectoral Breakdown of the NFPS Deficit, 2003-06
(In percent of GDP)
Key: NG - National Government; SSIs - Social Security Institutions; LGUs - Local Government Units; GOCCs - Government Owned and/or Controlled Corporations; NPC -National Power Corporation.
8
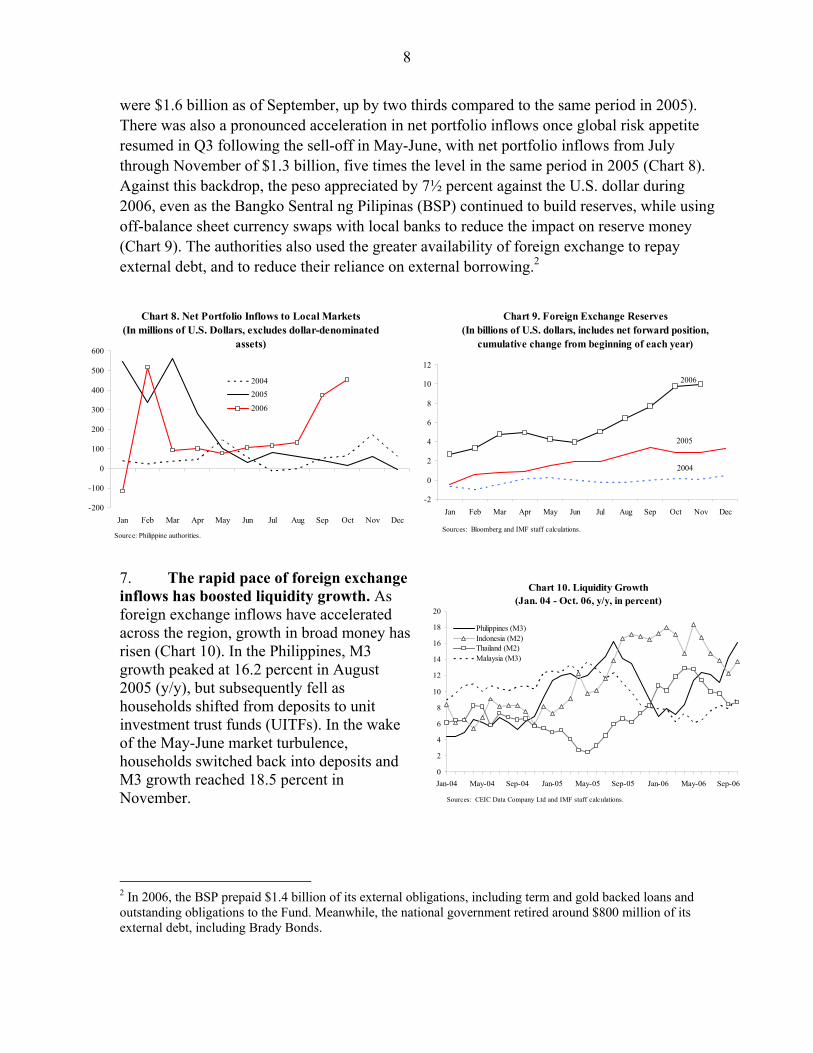
were $1.6 billion as of September, up by two thirds compared to the same period in 2005). There was also a pronounced acceleration in net portfolio inflows once global risk appetite resumed in Q3 following the sell-off in May-June, with net portfolio inflows from July through November of $1.3 billion, five times the level in the same period in 2005 (Chart 8). Against this backdrop, the peso appreciated by 7½ percent against the U.S. dollar during 2006, even as the Bangko Sentral ng Pilipinas (BSP) continued to build reserves, while using off-balance sheet currency swaps with local banks to reduce the impact on reserve money (Chart 9). The authorities also used the greater availability of foreign exchange to repay external debt, and to reduce their reliance on external borrowing.2
7. The rapid pace of foreign exchange inflows has boosted liquidity growth. As foreign exchange inflows have accelerated across the region, growth in broad money has risen (Chart 10). In the Philippines, M3 growth peaked at 16.2 percent in August 2005 (y/y), but subsequently fell as households shifted from deposits to unit investment trust funds (UITFs). In the wake of the May-June market turbulence, households switched back into deposits and M3 growth reached 18.5 percent in November.
2 In 2006, the BSP prepaid $1.4 billion of its external obligations, including term and gold backed loans and outstanding obligations to the Fund. Meanwhile, the national government retired around $800 million of its external debt, including Brady Bonds.
Chart 8. Net Portfolio Inflows to Local Markets(In millions of U.S. Dollars, excludes dollar-denominated
assets)
-200
-100
0
100
200
300
400
500
600
Jan Feb Mar Apr May Jun Jul Aug Sep Oct Nov Dec
20042005
2006
Source: Philippine authorities.
Chart 9. Foreign Exchange Reserves
(In billions of U.S. dollars, includes net forward position, cumulative change from beginning of each year)
2004
2005
2006
-2
0
2
4
6
8
10
12
Jan Feb Mar Apr May Jun Jul Aug Sep Oct Nov Dec
Sources: Bloomberg and IMF staff calculations.
Chart 10. Liquidity Growth(Jan. 04 - Oct. 06, y/y, in percent)
0
2
4
6
8
10
12
14
16
18
20
Jan-04 May-04 Sep-04 Jan-05 May-05 Sep-05 Jan-06 May-06 Sep-06
Sources: CEIC Data Company Ltd and IMF staff calculations.
Philippines (M3)Indonesia (M2)Thailand (M2)Malaysia (M3)
9
Chart 11. Rollover and Exchange Risk in Public Debt(In percent of GDP, end-2005)
0
10
20
30
40
50
60
70
80
90
00
Philippines India Thailand Indonesia Malaysia Korea China
Source: IMF staff calculations.
0
10
20
30
40
50
60
70
80
90
10Debt to GDPRollover exposed debt to GDPExchange rate risk debt to GDP
III. Outlook and Risks
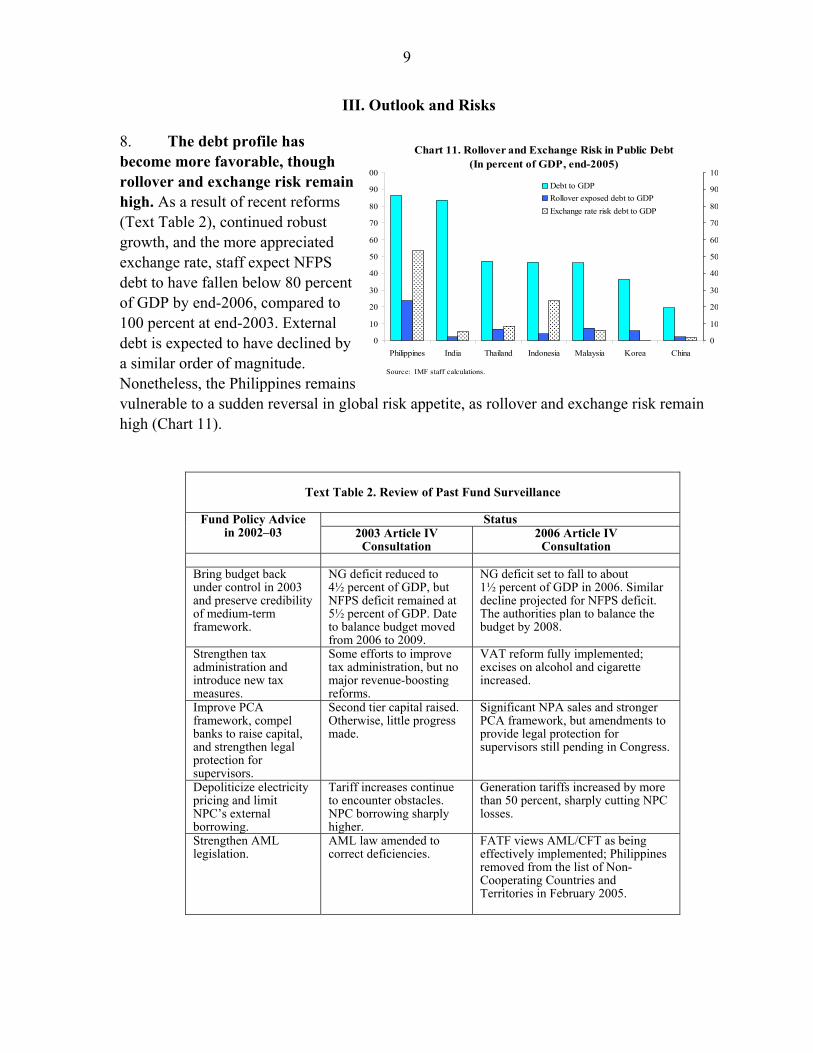
8. The debt profile has become more favorable, though rollover and exchange risk remain high. As a result of recent reforms (Text Table 2), continued robust growth, and the more appreciated exchange rate, staff expect NFPS debt to have fallen below 80 percent of GDP by end-2006, compared to 100 percent at end-2003. External debt is expected to have declined by a similar order of magnitude. Nonetheless, the Philippines remains vulnerable to a sudden reversal in global risk appetite, as rollover and exchange risk remain high (Chart 11).
Text Table 2. Review of Past Fund Surveillance
Status Fund Policy Advice in 2002–03 2003 Article IV
Consultation 2006 Article IV
Consultation Bring budget back under control in 2003 and preserve credibility of medium-term framework.
NG deficit reduced to 4½ percent of GDP, but NFPS deficit remained at 5½ percent of GDP. Date to balance budget moved from 2006 to 2009.
NG deficit set to fall to about 1½ percent of GDP in 2006. Similar decline projected for NFPS deficit. The authorities plan to balance the budget by 2008.
Strengthen tax administration and introduce new tax measures.
Some efforts to improve tax administration, but no major revenue-boosting reforms.
VAT reform fully implemented; excises on alcohol and cigarette increased.
Improve PCA framework, compel banks to raise capital, and strengthen legal protection for supervisors.
Second tier capital raised. Otherwise, little progress made.
Significant NPA sales and stronger PCA framework, but amendments to provide legal protection for supervisors still pending in Congress.
Depoliticize electricity pricing and limit NPC’s external borrowing.
Tariff increases continue to encounter obstacles. NPC borrowing sharply higher.
Generation tariffs increased by more than 50 percent, sharply cutting NPC losses.
Strengthen AML legislation.
AML law amended to correct deficiencies.
FATF views AML/CFT as being effectively implemented; Philippines removed from the list of Non-Cooperating Countries and Territories in February 2005.

10
9. A loss of reform momentum would have negative economic implications over the medium term. The baseline scenario (Currently Identified Measures Scenario, Table 5) assumes that the national government meets its 2007 deficit target of 1 percent of GDP. However, staff assume that it does so by spending less than the budgeted amounts, reflecting likely slower-than-expected revenue growth and little chance of new tax measures ahead of the elections. Even though containing expenditure will be challenging in an election year, staff consider this to be the most likely scenario were revenues to underperform. Should there continue to be no additional revenue measures over the medium term, the NFPS deficit would settle at 2 percent of GDP, while public investment would increase only modestly. In this environment, staff expect growth to rise to 5.8 percent in 2007 and remain at that level over the medium term.
10. The outlook would be much more favorable were there to be further progress with reforms. An additional revenue effort would allow the authorities to meet the 2007 deficit target without compressing expenditure, and to eliminate the NFPS deficit altogether over the medium term while substantially increasing infrastructure investment (Additional Reforms Scenario, Table 6). Combined with improvements in the business climate, this scenario would create an environment conducive to higher investment and the outlook for growth would be even brighter. Under both scenarios, public debt would decline significantly, but would still remain sizable by 2011 (Appendix I).
IV. Report on the Discussions
11. Against this background, the discussions focused on several policy challenges facing the authorities: (a) dealing with continued strong foreign exchange inflows; (b) ensuring that fiscal reforms continue and are sustainable; (c) strengthening the structural and financial sector foundations for higher medium-term growth.
A. Dealing with Continued Strong Foreign Exchange Inflows
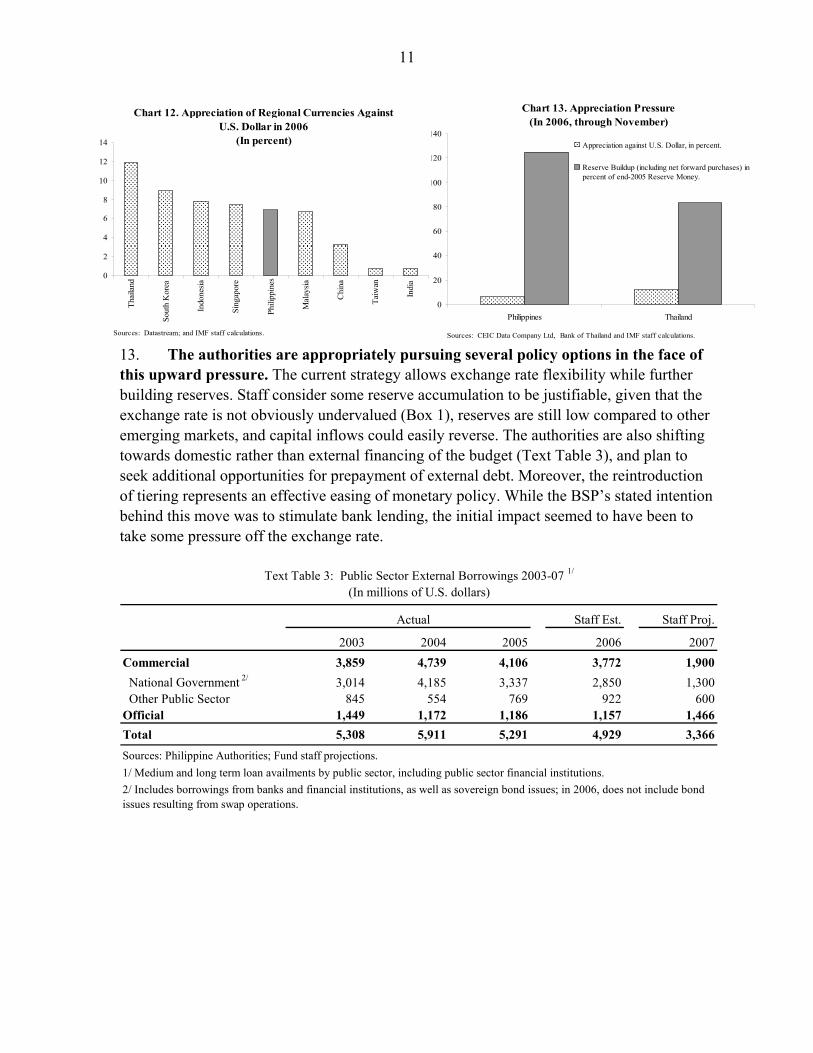
12. There has been strong upward pressure on the exchange rate. By one metric—appreciation against the U.S. dollar—upward pressure on the Peso has been relatively modest (Chart 12). However, factoring in reserve accumulation, including off-balance sheet currency swaps, upward pressure has been much higher. Chart 13 shows that overall appreciation pressure on the Peso has been comparable to that experienced by the Thai Baht, the strongest performer in the region against the U.S. dollar in 2006.3
3 The measures taken by the Thai authorities in December to curb portfolio inflows had no adverse effects on Philippine markets, with market participants deriving reassurance from BSP statements that no similar measures were being considered.
11
13. The authorities are appropriately pursuing several policy options in the face of this upward pressure. The current strategy allows exchange rate flexibility while further building reserves. Staff consider some reserve accumulation to be justifiable, given that the exchange rate is not obviously undervalued (Box 1), reserves are still low compared to other emerging markets, and capital inflows could easily reverse. The authorities are also shifting towards domestic rather than external financing of the budget (Text Table 3), and plan to seek additional opportunities for prepayment of external debt. Moreover, the reintroduction of tiering represents an effective easing of monetary policy. While the BSP’s stated intention behind this move was to stimulate bank lending, the initial impact seemed to have been to take some pressure off the exchange rate.
Staff Est. Staff Proj.
2003 2004 2005 2006 2007Commercial 3,859 4,739 4,106 3,772 1,900 National Government 2/ 3,014 4,185 3,337 2,850 1,300 Other Public Sector 845 554 769 922 600Official 1,449 1,172 1,186 1,157 1,466Total 5,308 5,911 5,291 4,929 3,366
2/ Includes borrowings from banks and financial institutions, as well as sovereign bond issues; in 2006, does not include bond issues resulting from swap operations.
Actual
Text Table 3: Public Sector External Borrowings 2003-07 1/
1/ Medium and long term loan availments by public sector, including public sector financial institutions. Sources: Philippine Authorities; Fund staff projections.
(In millions of U.S. dollars)
Chart 12. Appreciation of Regional Currencies Against U.S. Dollar in 2006
(In percent)
0
2
4
6
8
10
12
14Th
aila
nd
Sout
h K
orea
Indo
nesia
Sing
apor
e
Phili
ppin
es
Mal
aysia
Chi
na
Taiw
an
Indi
a
Sources: Datastream; and IMF staff calculations.
Chart 13. Appreciation Pressure(In 2006, through November)
0
20
40
60
80
100
120
140
Philippines Thailand
Sources: CEIC Data Company Ltd, Bank of Thailand and IMF staff calculations.
Appreciation against U.S. Dollar, in percent.
Reserve Buildup (including net forward purchases) inpercent of end-2005 Reserve Money.

12
14. The re-introduction of tiering represents an easing of monetary policy. While the deceleration in underlying inflation has created room for some easing, staff noted that the effective relaxation implied by tiering is large. Initial staff calculations pointed to a 200 basis point cut in effective terms, although part of this was subsequently unwound (Chart 14).4 Nonetheless, so large an easing could endanger the inflation forecast if maintained. Staff argued that a rapid removal of tiering would be warranted if the inflation outlook were to become less favorable, in the event of a rise in global risk aversion or should there be renewed hikes in international oil prices. The authorities responded that tiering has in recent experience been a temporary measure. They were in any case keeping a close watch on incipient inflationary pressures and stood ready to take policy action if necessary.
B. Ensuring that Fiscal Reforms Continue and Are Sustainable
15. The authorities deserve considerable credit for recent fiscal reforms. Following the sizable fiscal adjustment in 2004 and 2005, the authorities have fully implemented the VAT reform. As a result, tax revenues are expected to rise by 1.3 percent of GDP in 2006. Staff noted that the success of the VAT reform reflected resolute implementation and well-targeted mitigating measures.5 In addition, in November the authorities removed a provision in the VAT reform bill that limits the input credit to 70 percent of the output VAT paid by businesses whose input VAT exceeds their output VAT. Staff welcomed this move, as this provision discriminated against some businesses and likely resulted in tax cascading.
4 In general, tiering complicates assessment of the policy stance. Private sector estimates of the effective easing have ranged between 50 and 300 basis points. The reintroduction of the system also led to a rise in bond market volatility (Chart 15).
5 A Selected Issues Paper assesses the distributional impact of the VAT reform.
Chart 15. Term Spread Over 91-Day T-Bill(Oct. 2 - Dec. 14, 2006, in percent)
0
0.5
1
1.5
2
2.5
10/2 10/9 10/16 10/23 10/30 11/6 11/13 11/20 11/27 12/4 12/11Sources: CEIC Data Company Ltd; and staff calculations.
1 year3 year5 year10 year
Chart 14. Effective RRP and Interbank and FX Swap Rates
(Oct. 1 - Dec. 15, 2006, in percent)
5.0
5.5
6.0
6.5
7.0
7.5
8.0
8.5
10/2 10/9 10/16 10/23 10/30 11/6 11/13 11/20 11/27 12/4 12/11
Introduction of tiering
1 Week Interbank Rate
1 Week Swap Rate
Sources: Bloomberg LP; and IMF staff calculations.
13
16. Achieving the 2007 deficit target may require new tax measures. Meeting the 2007 budget’s twin objectives of further consolidation and higher priority spending will require national government revenue to grow by 15 percent, above projected nominal GDP growth of 10 percent. Staff noted that meeting this revenue goal will be challenging, particularly given the difficulty of passing new tax measures before the May 2007 elections. Cutting expenditure to meet the deficit target, on the other hand, would undermine the goal of raising infrastructure and social spending. Staff therefore inquired whether a slightly less ambitious deficit target might be appropriate for 2007 providing that the overall downward direction in the deficit could be maintained. The authorities, however, argued that any relaxation in the deficit target might be misinterpreted as an attempt to increase spending ahead of the elections. In addition, they noted that setting ambitious revenue targets would help provide incentives to boost collection efficiency.
17. Over the medium term, balancing the budget will require new tax measures. An additional tax effort of about 2½ percent of GDP is needed over the medium term to achieve the authorities’ goals of balancing the budget and augmenting priority spending. Although improvements in tax administration can help partially close this gap, staff proposed reducing tax incentives and raising and indexing excises to inflation as potential revenue raisers. In this regard, staff suggested that early announcement of tax measures for the 2008 budget would help to convey the authorities’ commitment to continued fiscal consolidation. The authorities responded that Congressional support for new measures was contingent on fully collecting revenues from the VAT reform. As a result, they argued for keeping the immediate focus on establishing a credible tax collection record.
18. Accelerating tax administration reform is therefore critical. Initial steps have been taken in some areas, including towards developing an anti-tax evasion program and cleaning the taxpayer register at the Bureau of Internal Revenue (BIR). Progress in other areas will be assisted by early approval of the World Bank tax administration loan that is expected to provide a framework for financial and technical support from other donors. While waiting for donor mobilization, staff urged the BIR to accelerate the pace of work on cleaning the taxpayer register, auditing tax arrears, and drafting industry-based audit manuals. The authorities agreed with these priorities.
19. Reforms are on track in other areas. Civil service reform is proceeding and most government agencies are expected to submit their rationalization plans by year-end. Reforms at the Social Security System (SSS) have included an increase in the contribution rate, better policing of delinquent contributors, and an information campaign to attract new members. These changes have extended the date at which the SSS is projected to run out of resources until 2031, while allowing benefits to be increased by 10 percent, the first hike since 2003. The authorities have also taken initial steps to better monitor public enterprises. A comprehensive review of the operations of the National Food Authority is underway and is expected to lay the foundation for setting monitorable performance targets. Staff emphasized that this should be the eventual goal for other important government-owned and controlled corporations (GOCCs). The authorities indicated that performance reviews are also ongoing for 20 other government agencies with a view to improving efficiency of their operations.

14
C. Strengthening the Structural and Financial Sector Foundations for Higher Medium-Term Growth
20. Staff expect medium-term growth to rise reflecting a more favorable investment outlook. Even though investment remains anemic, several factors point to higher investment growth ahead: (i) remittances are increasingly being channeled into real estate investment; (ii) profits in the non-financial corporate sector have increased sharply; (iii) the financial sector has reduced its non-performing assets; and (iv) the finances of NPC have improved.
(i) remittances:
21. The surge in remittances is driven by global trends, a rise in the number of overseas workers, and a shift to higher skill jobs. Remittance growth has accelerated in recent years, in line with other countries (Chart 16). Factors driving this growth include the rise in the number of overseas workers, in particular in the Middle East where high oil prices have boosted demand, and the fact that skilled workers now account for a greater share of overseas workers (Text Table 4).
22. Remittances are being channeled into housing and construction. Major property developers increasingly market directly to overseas workers, and market analysts estimate remittances used for home purchases in the last 12 months at about $3 billion. Together with the rise in the emerging business process outsourcing (BPO) industry, this has helped to rejuvenate the property market. The authorities and staff agreed that the recent shift of remittances from consumption to investment was a promising development and may help promote a broader recovery in investment.6
6 A Selected Issues Paper examines the relationship between the rapid growth of the services sector and the level of investment.
Chart 16. Remittance Inflows
(In U.S. dollars, 2000=100)
50
100
150
200
1995 1997 1999 2001 2003 2005
PhilippinesGlobal 1/
Sources: CEIC Data Company Ltd; and staff calculations.
1/ Includes India, Mexico, Egypt, Turkey, Russia, Brazil, Pakistan, and Thailand.
1993 2004
Professional and technical workers 25.3 33.2Administrative and managerial workers 0.1 0.2Clerical workers 1.6 1.9Sales workers 1.0 1.4Service workers 34.9 40.2Agricultural workers 0.7 0.2Production workers 36.4 22.4
Source: Philippines Overseas Employment Administration.
1/ Excludes immigrants or legal permanent residents abroad whose stay do not depend on work contracts.
Text Table 4. Overseas Foreign Workers by Occupation 1/(In percent Share)
15
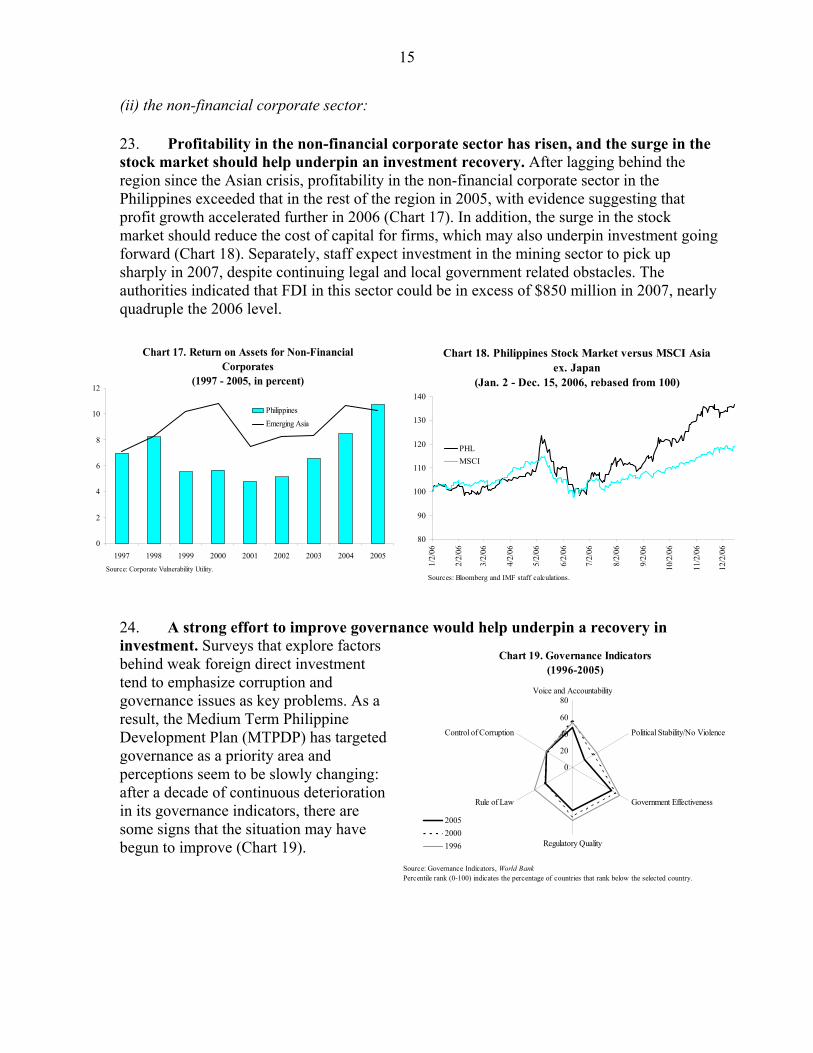
(ii) the non-financial corporate sector: 23. Profitability in the non-financial corporate sector has risen, and the surge in the stock market should help underpin an investment recovery. After lagging behind the region since the Asian crisis, profitability in the non-financial corporate sector in the Philippines exceeded that in the rest of the region in 2005, with evidence suggesting that profit growth accelerated further in 2006 (Chart 17). In addition, the surge in the stock market should reduce the cost of capital for firms, which may also underpin investment going forward (Chart 18). Separately, staff expect investment in the mining sector to pick up sharply in 2007, despite continuing legal and local government related obstacles. The authorities indicated that FDI in this sector could be in excess of $850 million in 2007, nearly quadruple the 2006 level.
24. A strong effort to improve governance would help underpin a recovery in investment. Surveys that explore factors behind weak foreign direct investment tend to emphasize corruption and governance issues as key problems. As a result, the Medium Term Philippine Development Plan (MTPDP) has targeted governance as a priority area and perceptions seem to be slowly changing: after a decade of continuous deterioration in its governance indicators, there are some signs that the situation may have begun to improve (Chart 19).
Chart 19. Governance Indicators(1996-2005)
0
20
40
60
80Voice and Accountability
Political Stability/No Violence
Government Effectiveness
Regulatory Quality
Rule of Law
Control of Corruption
200520001996
Source: Governance Indicators, World BankPercentile rank (0-100) indicates the percentage of countries that rank below the selected country.
Chart 17. Return on Assets for Non-Financial Corporates
(1997 - 2005, in percent)
0
2
4
6
8
10
12
1997 1998 1999 2000 2001 2002 2003 2004 2005
PhilippinesEmerging Asia
Source: Corporate Vulnerability Utility.
Chart 18. Philippines Stock Market versus MSCI Asia ex. Japan
(Jan. 2 - Dec. 15, 2006, rebased from 100)
80
90
100
110
120
130
140
1/2/
06
2/2/
06
3/2/
06
4/2/
06
5/2/
06
6/2/
06
7/2/
06
8/2/
06
9/2/
06
10/2
/06
11/2
/06
12/2
/06
Sources: Bloomberg and IMF staff calculations.
PHLMSCI

16
(iii) the financial sector: 25. Solving the distressed assets problem will be necessary if the banking system is to contribute to the investment revival. The authorities have taken a number of steps since the 2001 FSAP to strengthen the regulatory and supervisory framework. However, progress in resolving non-performing assets (NPAs) has been relatively slow, a result of the fiscal situation constraining the possible use of public money, and bank supervisors being hindered in executing their duties by a lack of legal protection. In this environment, the level of NPAs in the banking system has remained high and bank capital has grown only slowly (Chart 20). This situation leaves the banking system vulnerable. Moreover, in a regional comparison, slower progress in resolving nonperforming loans has been associated with lower investment growth (Chart 21).
26. Banks working to strengthen their balance sheets have likely contributed to slow loan growth. Staff noted that weaker banks may have become less inclined to lend in their effort to meet tighter prudential requirements (Chart 22). The authorities responded that slow credit growth could also be attributed to weak credit demand. Indeed, staff estimates show that cyclical factors could have accounted for about a third of the explained variation in bank lending in recent years.7 As an additional explanation, the authorities also pointed to greater financial disintermediation, as larger corporations increasingly tapped alternative sources of financing. Lending
7 A Selected Issues Paper provides further details.
Chart 20. Distressed Assets and Bank Capital(1998 - 2006Q2, in billions of Pesos)
0
50
100
150
200
250
300
350
400
450
500
1998 1999 2000 2001 2002 2003 2004 2005 2006Q2
Restructured loansNet ROPOAsNet NPLs and deferred lossesCapital stock
Source: BSP, Philippines Central Bank.
Chart 21. Non Performing Loans and Investment Nexus (Average 1998-2002 vs. Average 2004-05, in percent)
Korea
Philippines
IndonesiaThailand
-10
-50
510
15
2025
3035
40
0 20 40 60 80 100 120 140 160
Investment Growth
Red
uctio
n in
NPL
s
Sources: CEIC Data Company Ltd; and staff calculations.
Chart 22. Loan Growth by Fitch Ratings 1/
(In percent, y/y)
-20
-15
-10
-5
0
5
10
15
20
Mar-05 Jun-05 Sep-05 Dec-05 Mar-06 Jun-06
C D E
Sources: CEIC Data Company Ltd; Fitch Ratings; and staff calculations.
1/ C denotes an adequate bank with one or more troublesome aspects; D denotes a bank which has weaknesses of internal and/or external origin; and E denotes a bank with very serious problems.

17
to households, by contrast, has grown rapidly, albeit from a small base, supported by a pick-up in residential real estate, automobile, and credit card financing.8
27. The stock of nonperforming assets remains large. The resolution of NPAs has moved ahead, spurred by the Special Purpose Vehicle (SPV) framework that was in effect from 2003 to 2005 (Box 2). Nonetheless, progress has been relatively slow, with some important banks still burdened by large stocks of NPAs, consisting of nonperforming loans (NPLs) and repossessed assets, mainly real estate (ROPOAs). Staff argued that since ROPOAs are likely to be overvalued, these banks appeared effectively undercapitalized.9 In response, the authorities noted that the recent tightening of supervision was forcing banks to accelerate the clean up of their balance sheets. The implementation of new accounting standards (IFRS) with stricter valuation requirements, combined with the gradual phasing in of Basel II was increasing the capitalization needs of banks and inducing weaker ones to raise capital or merge with other banks. There were also encouraging signs that the new Prompt Corrective Action (PCA) framework, which provides a time bound setting to deal with problem banks, was helping to strengthen enforcement.
28. Additional efforts are needed to fortify bank balance sheets. The authorities expected the disposal of NPAs to accelerate with the prospect of higher risk weighting under Basel II and the recent extension of the SPV law through April 2008. Staff suggested that if this acceleration does not occur, a further tightening of regulatory requirements on NPAs should be considered. Where needed, the authorities intended to provide regulatory relief strictly within the parameters of the new PCA framework and agreed with the staff that close monitoring of the implementation of the agreed MOUs would ensure that the reform momentum did not stall. There was a common view that current positive market sentiment and the improved performance of the economy should permit banks to raise a substantial amount of new capital.
29. Legislative action should also help strengthen the financial system and lay the foundation for healthy lending growth. The authorities agreed that bank supervision would be significantly fortified by amendments to the BSP Charter that would provide legal protection for bank supervisors, and allow them to increase pressure on banks to raise capital and facilitate prompt closure of problem banks. These amendments, however, remained stuck in Congress and, with elections approaching, the near-term prospects for passage were poor. The authorities were more positive about an early adoption of the Credit Information Systems Act that would foster greater transparency in the market and improve credit access.
8 The delinquency rates in household lending have been high in comparison with other countries, reflecting in part the early phase of the product development cycle. Margins have been generally sufficient to cover the credit risk. Adoption of the Credit Information Systems Act currently tabled in Congress should help banks improve credit risk management. 9 While the value of ROPOAs may rise over time with a general increase in real estate prices, time also erodes their value due to depreciation, neglect, and the presence of squatters (who obtain certain rights after a period of time). Also, many properties reported on banks’ balance sheets have unresolved titling and other legal issues that may prove costly to overcome once banks attempt to dispose of these assets.
18
30. The authorities intend to speed up capital market development. An action plan to further develop capital markets has been finalized and several initiatives are ongoing to improve the operations of the trust industry following a sell-off in May-June 2006. The authorities have also used debt swaps to develop strong benchmark issues along the sovereign yield curve.10 Various legislative initiatives pending in Congress are also expected to facilitate capital market development, including the Personal Equity and Retirement Account bill, the Pre-Need Code, and amendments to the Investment Company Act.
(iv) the power sector:
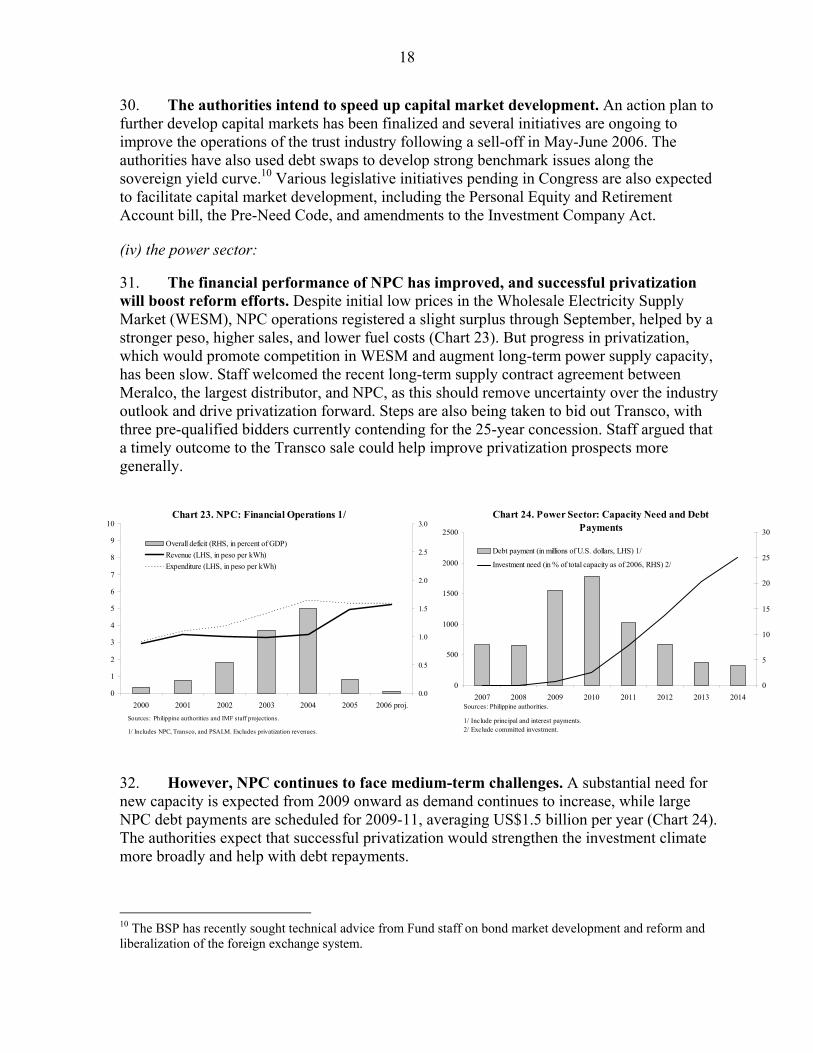
31. The financial performance of NPC has improved, and successful privatization will boost reform efforts. Despite initial low prices in the Wholesale Electricity Supply Market (WESM), NPC operations registered a slight surplus through September, helped by a stronger peso, higher sales, and lower fuel costs (Chart 23). But progress in privatization, which would promote competition in WESM and augment long-term power supply capacity, has been slow. Staff welcomed the recent long-term supply contract agreement between Meralco, the largest distributor, and NPC, as this should remove uncertainty over the industry outlook and drive privatization forward. Steps are also being taken to bid out Transco, with three pre-qualified bidders currently contending for the 25-year concession. Staff argued that a timely outcome to the Transco sale could help improve privatization prospects more generally.
32. However, NPC continues to face medium-term challenges. A substantial need for new capacity is expected from 2009 onward as demand continues to increase, while large NPC debt payments are scheduled for 2009-11, averaging US$1.5 billion per year (Chart 24). The authorities expect that successful privatization would strengthen the investment climate more broadly and help with debt repayments.
10 The BSP has recently sought technical advice from Fund staff on bond market development and reform and liberalization of the foreign exchange system.
Chart 23. NPC: Financial Operations 1/
0
1
2
3
4
5
6
7
8
9
10
2000 2001 2002 2003 2004 2005 2006 proj.Sources: Philippine authorities and IMF staff projections.
1/ Includes NPC, Transco, and PSALM. Excludes privatization revenues.
0.0
0.5
1.0
1.5
2.0
2.5
3.0
Overall deficit (RHS, in percent of GDP)Revenue (LHS, in peso per kWh)Expenditure (LHS, in peso per kWh)
Chart 24. Power Sector: Capacity Need and Debt Payments
0
500
1000
1500
2000
2500
2007 2008 2009 2010 2011 2012 2013 2014Sources: Philippine authorities.
1/ Include principal and interest payments. 2/ Exclude committed investment.
0
5
10
15
20
25
30
Debt payment (in millions of U.S. dollars, LHS) 1/
Investment need (in % of total capacity as of 2006, RHS) 2/
19
V. Staff Appraisal
33. Significant fiscal reforms have lifted financial markets and economic performance has been strong. The authorities deserve considerable credit for the sizable fiscal adjustment that has been achieved in the past few years. Markets have taken note. Sovereign spreads have fallen, the peso has rallied, and the stock market has boomed. Reserves have risen to new highs, and rating agencies have revised their outlooks from negative to stable. Meanwhile, growth has remained robust and there has been a welcome decline in inflation.
34. Nonetheless, vulnerabilities remain high, underscoring the need to sustain the reform momentum. With public debt highly sensitive to rollover and exchange rate risk and external commercial borrowing requirements still large, Philippine markets would be hard hit by a sudden rise in global risk aversion. In addition, pockets of weakness remain in the financial sector. Sustaining the reform momentum is therefore critical. Continued reforms will also help promote positive growth spillovers that are necessary to make substantive inroads into reducing poverty.
35. The current mix of strategies to deal with the upward pressure on the exchange rate is appropriate. The exchange rate does not appear out of line with fundamentals, reserve cover remains low compared to other emerging markets, and, as evidenced by the market sell-off in May, capital inflows can quickly reverse. Some further intervention to build reserves therefore seems justified. Nonetheless, there should also be continued emphasis on exchange rate flexibility going forward. Meanwhile, the authorities are appropriately shifting towards domestic rather than external financing and seeking additional opportunities for prepayment of external debt.
36. Care should be taken to ensure that monetary policy has not become too easy. The reduction in inflation justifies easier monetary policy and the authorities have recently reintroduced tiering. Although assessing the monetary policy stance is more complicated when easing occurs through tiering rather than cuts in the policy rate, the effective relaxation appears to be large and could endanger the inflation forecast. Nonetheless, the authorities view tiering as a temporary measure consistent with inflation continuing to trend down. Staff encourage the authorities to remove tiering were this outlook to change.
37. Fiscal performance continues to be strong. Tax collections are up sharply due to the VAT reform. Important efforts are also being made to improve tax administration, though it is too early for positive effects on collection to be clearly visible. Non-passage of the 2006 budget has constrained spending, notwithstanding the Supplemental Budget. The national government deficit is expected to have fallen by a further 1.2 percentage points of GDP in 2006, with a similar decline expected for the NFPS deficit, reflecting continued strong performance of the social security institutions, and expenditure savings by NPC.
38. Looking ahead, balancing the budget while increasing priority spending will require further revenue effort. Continued expenditure compression is neither desirable nor sustainable. Accelerating the implementation of tax administration reforms is therefore crucial. New tax measures, such as a rationalization of tax incentives, will likely also be needed. At the same time, careful monitoring of other parts of the public sector will be necessary to support the fiscal consolidation effort. In this context, the turn around in NPC’s

20
finances needs to be sustained, and performance targets should be put in place for other important GOCCs.
39. Further steps are needed to strengthen the banking sector. While progress has been made in the disposal of NPLs, the stock of ROPOAs remains large and concentrated. The disposal of NPAs is expected to accelerate with the prospect of tighter prudential requirements, the extension of the SPV framework, and implementation of Basel II. If not, the authorities should consider a further tightening of regulatory requirements on NPAs. While recent consolidation in the banking sector and efforts by banks to raise new capital are welcome, the BSP should maintain pressure on banks to raise capital. Any regulatory relief provided to banks should be tied closely to the new PCA framework.
40. Long-delayed changes to the BSP Charter remain essential. Congress continues to show little interest in passing BSP Charter amendments that would strengthen legal protection for supervisors and increase their leverage over problem banks. The authorities should continue to press for passage of these amendments so as to allow efforts being made to strengthen the regulatory framework to become fully effective.
41. Capital market development is appropriately a priority. The authorities are promoting the development of domestic capital markets through their public debt management. Legislative initiatives, including bills to create credit information bureaus and promote retirement saving vehicles, are complementing this effort.
42. Power sector privatization should be accelerated. The recent agreement on a long-term supply contract between NPC and Meralco should help reduce uncertainty that has hampered privatization, and should be seized as an opportunity to shift power sector assets into private hands.
43. Data provision for surveillance purposes is adequate overall, although staff analysis continues to be affected by certain deficiencies in the data. Staff welcomes the authorities’ efforts to address these shortcomings, particularly those in the balance of payments data.
44. The exit from PPM is appropriate given the progress that has been made with reforms. The recent ending of PPM is a welcome sign of the gains made in strengthening the fiscal and external positions. Staff looks forward to maintaining close relations with the authorities as part of regular Article IV surveillance in the post PPM era.
45. It is recommended that the next Article IV Consultation with the Philippines be held on the standard 12-month cycle.

21
Figure 1. Evolution of Exchange Rates in Emerging Asia(Sep. 2005 - Sep. 2006, in percent, + appreciation)
-10
-5
0
5
10
15
20
25
30
Indo
nesia
Phili
ppin
es
Thai
land
Kor
ea
Sing
apor
e
Mal
aysia
Chi
na
Taiw
an P
OC
Hon
g K
ong
SAR In
dia
U.S. DollarREER
Figure 2. Actual and Equilibrium REER(1990 - 2006, index = 100 in 1995)
60
65
70
75
80
85
90
95
100
105
110
1990 1991 1992 1993 1994 1995 1996 1997 1998 1999 2000 2001 2002 2003 2004 2005 2006
ActualEquilibrium
Box 1. The Appreciation of the Peso and Competitiveness
The appreciation of the Peso has given rise to concern over a loss of competitiveness. In the year through September, the Peso rose 10.3 percent versus the U.S. dollar, and strengthened 14.8 percent in real effective terms. This appreciation is in common with other regional currencies, but also reflects country-specific factors, such as continued strong growth in remittances, a rebound in exports, and a marked improvement in sentiment following fiscal reforms. The strengthening of the Peso has caused concern to mount in the Philippines about a possible loss of competitiveness. However, according to CGER estimates, the recent appreciation has brought the Peso in line with fundamentals. Following the Asian crisis, the real effective exchange rate (REER) has been steadily below its equilibrium value, based on the augmented PPP approach developed as part of CGER. Since 2004, the appreciation of the Peso has closed this gap, and has brought the REER in line with fundamentals, including productivity differentials, the terms of trade, and net foreign assets. Thus, in terms of the CGER measure, the recent appreciation of the Peso corrects a misalignment, rather than creates one. Moreover, the appreciation of the peso has coincided with an export recovery. Export growth through October of this year averaged 16.4 percent (y/y), compared with 3.3 percent in 2005. This recovery has been driven to a large extent by non-electronics exports, consistent with the view that the recent appreciation has not harmed competitiveness to date.

22
Box 2. Banking Sector Reforms The FSAP carried out in 2001 had identified a number of problems in the Philippine banking sector. High levels of nonperforming assets (NPAs) had seriously affected the health of the sector, reduced capital adequacy, and constrained credit to the private sector. There was a need to strengthen the supervisory framework, especially to deal with the conglomerate structure of the corporate sector. The prompt corrective action (PCA) regime also needed to be reinforced. Since then, a number of reforms have been carried out. Initiatives to deal with NPAs: • The Special Purpose Vehicle (SPV) law, introduced in 2002, provides regulatory and tax
advantages to banks disposing of their NPAs. Sales of P 100 billion of NPAs (one fifth of the stock) have been concluded. The framework (that expired in April 2005) was extended in March 2006 for another two years.
Regulatory and supervisory framework: • Prudential regulations governing lending to related interests (DOSRI) were expanded in March
2004 to include subsidiaries and affiliates. Exposure limits have also been introduced, as well as stiffer penalties for noncompliance. In parallel, a consolidated supervisory framework has been phased in.
• A new PCA framework was adopted in February 2006, allowing banking supervisors to intervene before a significant decline in capital occurs and introducing specific sanctions if banks do not comply with their capital restoration plan.
• The BSP is gradually phasing in Basel II and adopting risk-based supervision for the country’s commercial banks. In February 2005, an additional 25 percent was assigned to the risk weighting on NPLs (bringing it to 125 percent). On July 1, 2007, banks will be required to implement the standardized approach for credit and operational risks. In particular, risk weightings for NPAs will be increased to 150 percent, a capital charge equivalent to 15 percent of operating revenue will be introduced to cover operational risk, and a 100 percent weighting on Philippines external sovereign bonds (ROPs) will be phased in over three years.
Financial transparency: • From end-2005, the financial statements of banks have to be prepared in line with the
International Financial Reporting Standards, which imply more rigorous valuation requirements. Although banks will be allowed to defer recognition of losses from their NPA sales under the SPV framework, their audited financial statements will be subject to a qualified opinion.
• A new set of rules and standards have been issued to clarify the role of internal and external audit functions (in November 2005 and February 2005, respectively).
23
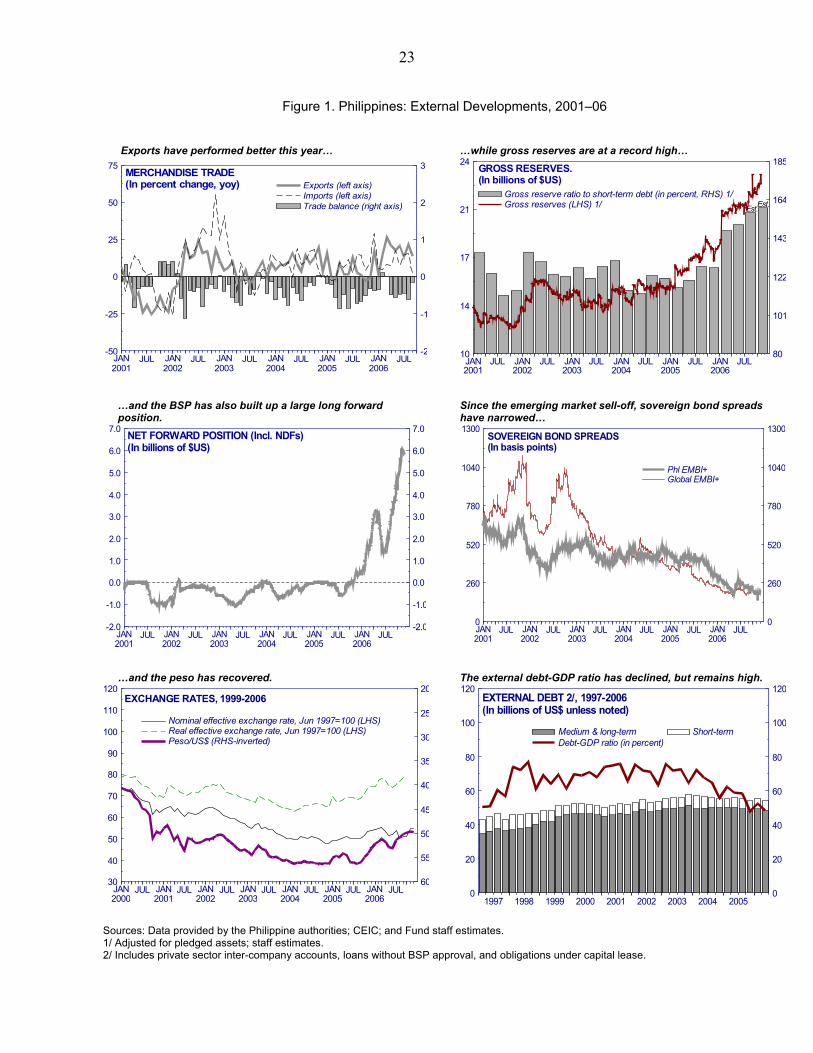
Figure 1. Philippines: External Developments, 2001–06
Exports have performed better this year… …while gross reserves are at a record high…
JULJANJULJANJULJANJULJANJULJANJULJAN200620052004200320022001
75
50
25
0
-25
-50
3
2
1
0
-1
-2
MERCHANDISE TRADE(In percent change, yoy) Exports (left axis)
Imports (left axis)Trade balance (right axis)
JULJANJULJANJULJANJULJANJULJANJULJAN200620052004200320022001
24
21
17
14
10
185
164
143
122
101
80
GROSS RESERVES.(In billions of $US)
Est.Est.Gross reserves (LHS) 1/Gross reserve ratio to short-term debt (in percent, RHS) 1/
…and the BSP has also built up a large long forward position.
Since the emerging market sell-off, sovereign bond spreads have narrowed…
JULJANJULJANJULJANJULJANJULJANJULJAN200620052004200320022001
7.0
6.0
5.0
4.0
3.0
2.0
1.0
0.0
-1.0
-2.0
7.0
6.0
5.0
4.0
3.0
2.0
1.0
0.0
-1.0
-2.0
NET FORWARD POSITION (Incl. NDFs)(In billions of $US)
JULJANJULJANJULJANJULJANJULJANJULJAN
200620052004200320022001
1300
1040
780
520
260
0
1300
1040
780
520
260
0
SOVEREIGN BOND SPREADS(In basis points)
Global EMBI+Phl EMBI+
…and the peso has recovered.
The external debt-GDP ratio has declined, but remains high.
JULJANJULJANJULJANJULJANJULJANJULJANJULJAN2006200520042003200220012000
120
110
100
90
80
70
60
50
40
30 60
55
50
45
40
35
30
25
20EXCHANGE RATES, 1999-2006
Nominal effective exchange rate, Jun 1997=100 (LHS)Real effective exchange rate, Jun 1997=100 (LHS)Peso/US$ (RHS-inverted)
200520042003200220012000199919981997
120
100
80
60
40
20
0
120
100
80
60
40
20
0
EXTERNAL DEBT 2/, 1997-2006(In billions of US$ unless noted)
Medium & long-term Short-termDebt-GDP ratio (in percent)
Sources: Data provided by the Philippine authorities; CEIC; and Fund staff estimates. 1/ Adjusted for pledged assets; staff estimates. 2/ Includes private sector inter-company accounts, loans without BSP approval, and obligations under capital lease.

24
Figure 2. Philippines: Domestic Developments, 1999–2006
GDP growth averaged 5.4 percent (y/y) through Q3… …mainly supported by services.
IIIIIIIIIIIIIIIIIIIIIIIIIIIIIIII20062005200420032002200120001999
15
10
5
0
-5
15
10
5
0
-5
REAL GDP GROWTH
Y/Y percent changeQ/Q seasonally adjusted, annualized
IIIIIIIIIIIIIIIIIIIIIIIIIIIIIIII20062005200420032002200120001999
15
10
5
0
-5
15
10
5
0
-5
PRODUCTION GROWTH BY SECTOR(In percent change, y/y)
IndustryAgricultureServices
Real private sector credit continues to decline... ...even as the stock market powers ahead.
IIIIIIIIIIIIIIIIIIIIIIIIIIIIIIII20062005200420032002200120001999
120
115
110
105
100
95
90
85
80
75
120
115
110
105
100
95
90
85
80
75
REAL PRIVATE SECTOR CREDIT (Dec 1999=100)
IIIIIIIIIIIIIIIIIIIIIIIIIIIIIIII
20062005200420032002200120001999
4000
3000
2000
1000
0
4000
3000
2000
1000
0
STOCK MARKET INDEX
CompositeComposite (in US$, Jan 1992=1000)
Inflation has declined back to target…
...while short-term yields continue to be below the policy rate.
IIIIIIIIIIIIIIIIIIIIIIIIIIIIIIII20062005200420032002200120001999
12
10
7
5
2
0
12
10
7
5
2
0
INFLATION(In percent change, y/y)
HeadlineCore (official measure)
IIIIIIIIIIIIIIIIIIIIIIIIIIIIIIII20062005200420032002200120001999
20
15
10
5
0
20
15
10
5
0
INTEREST RATES
Overnight reverse repo (policy) rate91-day T-bill rate (primary market)
Sources: Data provided by the Philippine authorities; CEIC; and Fund staff estimates.

25
Figure 3. Philippines: Fiscal Sector, 1998–2006
The national government deficit has been cut sharply. The tax revenue decline has started to reverse…
2006200520042003200220012000199919980
-2
-4
-6
-8
0
-2
-4
-6
-8NATIONAL GOVERNMENT BALANCE 1/(In percent of GDP)
Proj.
200620052004200320022001200019991998
25
20
15
10
5
0
25
20
15
10
5
0
NATIONAL GOVERNMENT REVENUE(In percent of GDP) Proj.
Income and Profits VATExcise Trade & OtherNon-tax Revenue
…but primary expenditure continues to be compressed.
Public sector debt is trending down from high levels.
200620052004200320022001200019991998
14
12
10
8
6
4
2
0
14
12
10
8
6
4
2
0
NATIONAL GOVERNMENT EXPENDITURE(In percent of GDP) Proj.
Non-interest currentInterestCapital and net lending
200620052004200320022001
140
120
100
80
60
40
20
0
140
120
100
80
60
40
20
0
NONFINANCIAL PUBLIC SECTOR DEBT, 2001-06(In percent of GDP)
Proj.
Source: Data provided by the Philippine authorities; and Fund staff estimates and projections. 1/ Fund staff definition. Excludes privatization receipts of the national government and includes operations of the Central Bank-Board of Liquidators.
26
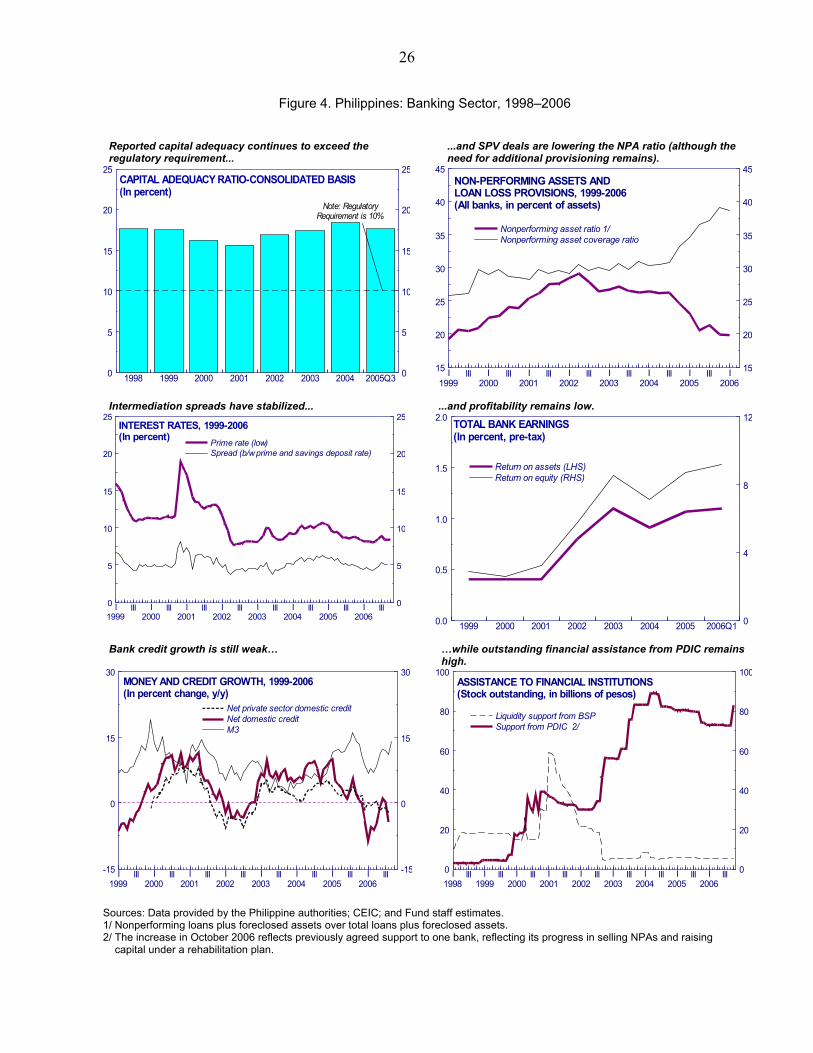
Figure 4. Philippines: Banking Sector, 1998–2006
Reported capital adequacy continues to exceed the regulatory requirement...
...and SPV deals are lowering the NPA ratio (although the need for additional provisioning remains).
2005Q32004200320022001200019991998
25
20
15
10
5
0
25
20
15
10
5
0
CAPITAL ADEQUACY RATIO-CONSOLIDATED BASIS(In percent)
Note: RegulatoryRequirement is 10%
IIIIIIIIIIIIIIIIIIIIIIIIIIIII20062005200420032002200120001999
45
40
35
30
25
20
15
45
40
35
30
25
20
15
NON-PERFORMING ASSETS ANDLOAN LOSS PROVISIONS, 1999-2006(All banks, in percent of assets)
Nonperforming asset ratio 1/Nonperforming asset coverage ratio
Intermediation spreads have stabilized...
...and profitability remains low.
IIIIIIIIIIIIIIIIIIIIIIIIIIIIIIII20062005200420032002200120001999
25
20
15
10
5
0
25
20
15
10
5
0
INTEREST RATES, 1999-2006(In percent)
Prime rate (low)Spread (b/w prime and savings deposit rate)
2006Q12005200420032002200120001999
2.0
1.5
1.0
0.5
0.0
12
8
4
0
TOTAL BANK EARNINGS(In percent, pre-tax)
Return on assets (LHS)Return on equity (RHS)
Bank credit growth is still weak…
…while outstanding financial assistance from PDIC remains high.
IIIIIIIIIIIIIIIIIIIIIIIIIIIIIIII20062005200420032002200120001999
30
15
0
-15
30
15
0
-15
MONEY AND CREDIT GROWTH, 1999-2006(In percent change, y/y)
M3Net domestic creditNet private sector domestic credit
IIIIIIIIIIIIIIIIIIIIIIIIIIIIIIIIIIII
200620052004200320022001200019991998
100
80
60
40
20
0
100
80
60
40
20
0
ASSISTANCE TO FINANCIAL INSTITUTIONS(Stock outstanding, in billions of pesos)
Support from PDIC 2/Liquidity support from BSP
Sources: Data provided by the Philippine authorities; CEIC; and Fund staff estimates. 1/ Nonperforming loans plus foreclosed assets over total loans plus foreclosed assets. 2/ The increase in October 2006 reflects previously agreed support to one bank, reflecting its progress in selling NPAs and raising capital under a rehabilitation plan.
27
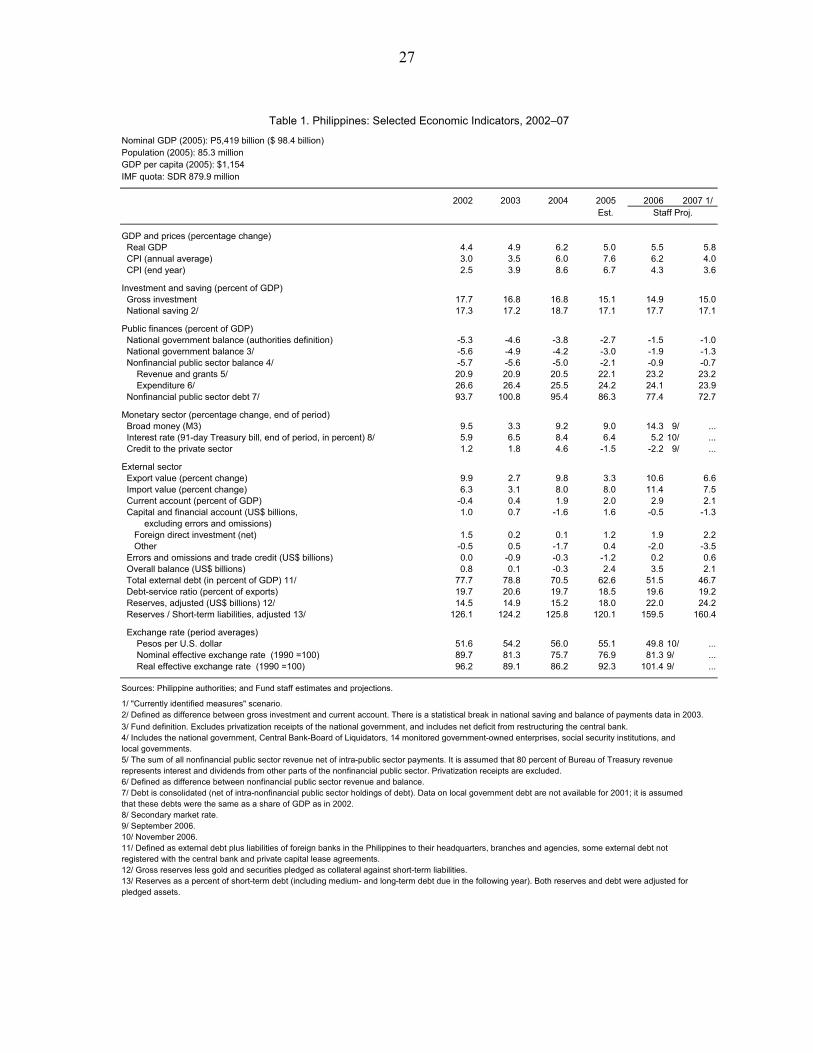
Nominal GDP (2005): P5,419 billion ($ 98.4 billion)Population (2005): 85.3 millionGDP per capita (2005): $1,154IMF quota: SDR 879.9 million
2002 2003 2004 2005 2006 2007 1/Est.
GDP and prices (percentage change) Real GDP 4.4 4.9 6.2 5.0 5.5 5.8 CPI (annual average) 3.0 3.5 6.0 7.6 6.2 4.0 CPI (end year) 2.5 3.9 8.6 6.7 4.3 3.6
Investment and saving (percent of GDP) Gross investment 17.7 16.8 16.8 15.1 14.9 15.0 National saving 2/ 17.3 17.2 18.7 17.1 17.7 17.1
Public finances (percent of GDP) National government balance (authorities definition) -5.3 -4.6 -3.8 -2.7 -1.5 -1.0 National government balance 3/ -5.6 -4.9 -4.2 -3.0 -1.9 -1.3 Nonfinancial public sector balance 4/ -5.7 -5.6 -5.0 -2.1 -0.9 -0.7 Revenue and grants 5/ 20.9 20.9 20.5 22.1 23.2 23.2 Expenditure 6/ 26.6 26.4 25.5 24.2 24.1 23.9 Nonfinancial public sector debt 7/ 93.7 100.8 95.4 86.3 77.4 72.7
Monetary sector (percentage change, end of period) Broad money (M3) 9.5 3.3 9.2 9.0 14.3 9/ ... Interest rate (91-day Treasury bill, end of period, in percent) 8/ 5.9 6.5 8.4 6.4 5.2 10/ ... Credit to the private sector 1.2 1.8 4.6 -1.5 -2.2 9/ ...
External sector Export value (percent change) 9.9 2.7 9.8 3.3 10.6 6.6 Import value (percent change) 6.3 3.1 8.0 8.0 11.4 7.5 Current account (percent of GDP) -0.4 0.4 1.9 2.0 2.9 2.1 Capital and financial account (US$ billions, 1.0 0.7 -1.6 1.6 -0.5 -1.3 excluding errors and omissions) Foreign direct investment (net) 1.5 0.2 0.1 1.2 1.9 2.2 Other -0.5 0.5 -1.7 0.4 -2.0 -3.5 Errors and omissions and trade credit (US$ billions) 0.0 -0.9 -0.3 -1.2 0.2 0.6 Overall balance (US$ billions) 0.8 0.1 -0.3 2.4 3.5 2.1Total external debt (in percent of GDP) 11/ 77.7 78.8 70.5 62.6 51.5 46.7
Debt-service ratio (percent of exports) 19.7 20.6 19.7 18.5 19.6 19.2 Reserves, adjusted (US$ billions) 12/ 14.5 14.9 15.2 18.0 22.0 24.2 Reserves / Short-term liabilities, adjusted 13/ 126.1 124.2 125.8 120.1 159.5 160.4
Exchange rate (period averages) Pesos per U.S. dollar 51.6 54.2 56.0 55.1 49.8 10/ ... Nominal effective exchange rate (1990 =100) 89.7 81.3 75.7 76.9 81.3 9/ ... Real effective exchange rate (1990 =100) 96.2 89.1 86.2 92.3 101.4 9/ ...
Sources: Philippine authorities; and Fund staff estimates and projections.
1/ "Currently identified measures" scenario.2/ Defined as difference between gross investment and current account. There is a statistical break in national saving and balance of payments data in 2003.3/ Fund definition. Excludes privatization receipts of the national government, and includes net deficit from restructuring the central bank.4/ Includes the national government, Central Bank-Board of Liquidators, 14 monitored government-owned enterprises, social security institutions, and local governments.5/ The sum of all nonfinancial public sector revenue net of intra-public sector payments. It is assumed that 80 percent of Bureau of Treasury revenue represents interest and dividends from other parts of the nonfinancial public sector. Privatization receipts are excluded.6/ Defined as difference between nonfinancial public sector revenue and balance. 7/ Debt is consolidated (net of intra-nonfinancial public sector holdings of debt). Data on local government debt are not available for 2001; it is assumed that these debts were the same as a share of GDP as in 2002.8/ Secondary market rate. 9/ September 2006.10/ November 2006.11/ Defined as external debt plus liabilities of foreign banks in the Philippines to their headquarters, branches and agencies, some external debt not registered with the central bank and private capital lease agreements. 12/ Gross reserves less gold and securities pledged as collateral against short-term liabilities.13/ Reserves as a percent of short-term debt (including medium- and long-term debt due in the following year). Both reserves and debt were adjusted for pledged assets.
Staff Proj.
Table 1. Philippines: Selected Economic Indicators, 2002–07

28
Table 2. Philippines: National Government Cash Accounts, 2002-2007(In percent of GDP; unless otherwise noted)
2002 2003 2004 2005Prel. Proposed Staff Proposed StaffEst. Budget Proj. Budget Proj. 1/
Revenue and grants 14.7 14.9 14.6 15.1 16.2 16.0 16.7 16.0Tax revenue 12.8 12.8 12.5 13.0 14.6 14.3 15.3 14.3
Net Income and Profits 5.7 5.6 5.7 6.0 ... 6.1 ... 6.2Excises 1.7 1.6 1.6 1.4 ... 1.1 ... 1.2VAT 2.9 3.1 2.9 2.9 ... 4.3 ... 4.3Tariffs 0.9 1.0 1.0 1.1 ... 1.1 ... 1.1Other 2/ 1.6 1.4 1.3 1.7 ... 1.7 ... 1.7
Nontax revenue 1.8 2.1 2.1 2.0 1.6 1.7 1.3 1.7Of which : Central Bank-Board of Liquidators 0.1 0.1 0.1 0.0 ... 0.0 ... 0.0Of which : Recovery of Marcos wealth ... ... 0.2 0.0 ... 0.0 ... 0.0
Expenditure and net lending 20.3 19.8 18.8 18.1 18.6 17.9 17.9 17.2Current expenditures 17.1 17.1 15.9 15.6 15.8 15.4 15.1 14.7
Personnel services 6.7 6.4 5.8 5.5 5.5 5.5 5.6 5.6Maintenance and operations 2.1 1.8 1.7 1.6 1.8 1.6 1.9 1.6Allotments to local government units 2.8 2.7 2.3 2.3 2.2 2.2 2.2 2.3Subsidies 0.1 0.3 0.1 0.1 0.1 0.2 0.1 0.1Tax expenditure 0.3 0.3 0.1 0.4 ... 0.2 0.2 0.2Interest 5.1 5.6 5.7 5.8 6.0 5.6 5.1 4.8
National government 4.7 5.2 5.4 5.5 5.7 5.3 4.7 4.5Central Bank-Board of Liquidators 0.4 0.4 0.4 0.3 0.4 0.4 0.3 0.3
Capital and equity expenditure 3/ 3.1 2.6 2.7 2.4 2.7 2.4 2.7 2.4Net lending 0.1 0.1 0.1 0.0 0.1 0.1 0.1 0.1
Balance -5.6 -4.9 -4.2 -3.0 -2.4 -1.9 -1.3 -1.3On the authorities' presentation 4/ -5.3 -4.6 -3.8 -2.7 -2.1 -1.5 -0.9 -1.0
Financing 5.6 4.9 4.2 3.0 2.4 1.9 1.3 1.3Net external financing 2.8 3.3 1.7 1.7 1.7 0.5 0.9 0.9Net domestic financing 2.9 1.6 2.5 1.3 0.7 1.4 0.4 0.4
Memorandum Items:Nonfinancial public sector balance 5/ -5.7 -5.6 -5.0 -2.1 … -0.9 … -0.7Consolidated public sector balance 5/ -5.6 -5.2 -4.8 -1.8 … -0.7 … -0.5Primary national government balance -0.6 0.7 1.6 2.8 3.6 3.7 3.8 3.6National government debt 6/ 66.5 71.4 69.9 63.1 … 58.4 … 54.9
(percent of NG revenues) 453.6 480.1 479.2 419.4 … 365.1 … 343.9Nonfinancial public sector debt 7/ 93.7 100.8 95.4 86.3 … 77.4 … 72.7
(percent of NFPS revenues) 448.1 483.0 465.1 390.3 … 333.9 … 313.3National government gross financing requirements 8/ 23.2 23.6 24.4 21.2 … 22.0 … 17.1GDP (in billions of pesos) 3,964 4,316 4,859 5,419 5,999 6,014 6,713 6,613
Sources: Philippine authorities; and Fund staff projections.
1/ "Currently-identified measures" scenario assumes no new tax measures starting in 2007, but higher capital spending from 2008.2/ Includes other percentage taxes, documentary stamp tax, and non-cash collections. These collections are also reflected as tax expenditures under current expenditures.3/ Excludes purchase of NPC securities and other onlending; includes capital transfers to LGUs. May exceed public investment in years when capital transfers to LGUs exceed their reported capital spending.4/ Includes privatization receipts as revenue and excludes the operations of the Central Bank-Board of Liquidators (CB-BOL).5/ Excludes privatization receipts from revenue.6/ Consolidated (net of national government debt held by the sinking fund) and excludes contingent/guaranteed debt.7/ Nonfinancial public sector includes the national government, CB-BOL, 14 monitored government-owned enterprises, social security institutions, and local governments. Debt is consolidated (net of intra-nonfinancial public sector holdings of debt). Data on local government debt are not available for 2001; it is assumed that these debts were the same as a share of GDP as in 2002.8/ Defined as the deficit, plus amortization of medium- and long-term debt, plus the stock of short-term debt at the end of the last period, plus market financing on behalf of NPC.
2006 2007
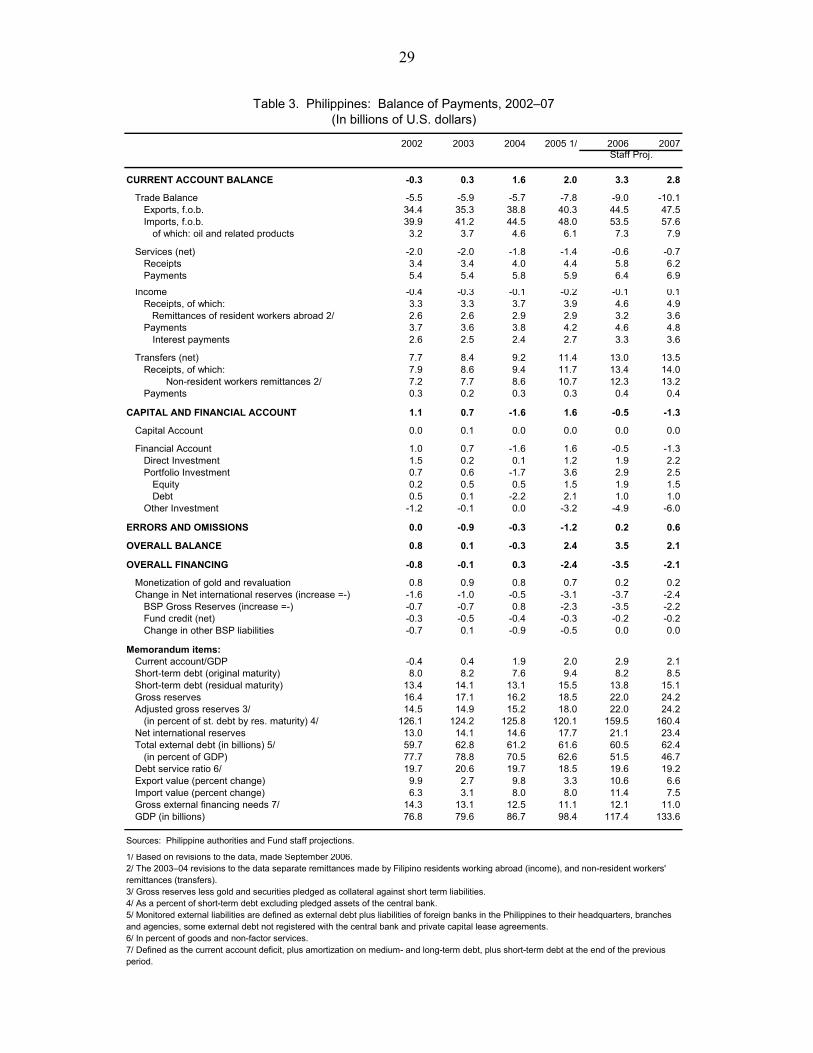
29
Table 3. Philippines: Balance of Payments, 2002–07(In billions of U.S. dollars)
2002 2003 2004 2005 1/ 2006 2007
CURRENT ACCOUNT BALANCE -0.3 0.3 1.6 2.0 3.3 2.8
Trade Balance -5.5 -5.9 -5.7 -7.8 -9.0 -10.1Exports, f.o.b. 34.4 35.3 38.8 40.3 44.5 47.5Imports, f.o.b. 39.9 41.2 44.5 48.0 53.5 57.6
of which: oil and related products 3.2 3.7 4.6 6.1 7.3 7.9
Services (net) -2.0 -2.0 -1.8 -1.4 -0.6 -0.7Receipts 3.4 3.4 4.0 4.4 5.8 6.2Payments 5.4 5.4 5.8 5.9 6.4 6.9
Income -0.4 -0.3 -0.1 -0.2 -0.1 0.1Receipts, of which: 3.3 3.3 3.7 3.9 4.6 4.9 Remittances of resident workers abroad 2/ 2.6 2.6 2.9 2.9 3.2 3.6Payments 3.7 3.6 3.8 4.2 4.6 4.8
Interest payments 2.6 2.5 2.4 2.7 3.3 3.6
Transfers (net) 7.7 8.4 9.2 11.4 13.0 13.5Receipts, of which: 7.9 8.6 9.4 11.7 13.4 14.0
Non-resident workers remittances 2/ 7.2 7.7 8.6 10.7 12.3 13.2Payments 0.3 0.2 0.3 0.3 0.4 0.4
CAPITAL AND FINANCIAL ACCOUNT 1.1 0.7 -1.6 1.6 -0.5 -1.3
Capital Account 0.0 0.1 0.0 0.0 0.0 0.0
Financial Account 1.0 0.7 -1.6 1.6 -0.5 -1.3Direct Investment 1.5 0.2 0.1 1.2 1.9 2.2Portfolio Investment 0.7 0.6 -1.7 3.6 2.9 2.5
Equity 0.2 0.5 0.5 1.5 1.9 1.5Debt 0.5 0.1 -2.2 2.1 1.0 1.0
Other Investment -1.2 -0.1 0.0 -3.2 -4.9 -6.0
ERRORS AND OMISSIONS 0.0 -0.9 -0.3 -1.2 0.2 0.6
OVERALL BALANCE 0.8 0.1 -0.3 2.4 3.5 2.1
OVERALL FINANCING -0.8 -0.1 0.3 -2.4 -3.5 -2.1
Monetization of gold and revaluation 0.8 0.9 0.8 0.7 0.2 0.2Change in Net international reserves (increase =-) -1.6 -1.0 -0.5 -3.1 -3.7 -2.4
BSP Gross Reserves (increase =-) -0.7 -0.7 0.8 -2.3 -3.5 -2.2Fund credit (net) -0.3 -0.5 -0.4 -0.3 -0.2 -0.2Change in other BSP liabilities -0.7 0.1 -0.9 -0.5 0.0 0.0
Memorandum items:Current account/GDP -0.4 0.4 1.9 2.0 2.9 2.1Short-term debt (original maturity) 8.0 8.2 7.6 9.4 8.2 8.5Short-term debt (residual maturity) 13.4 14.1 13.1 15.5 13.8 15.1Gross reserves 16.4 17.1 16.2 18.5 22.0 24.2Adjusted gross reserves 3/ 14.5 14.9 15.2 18.0 22.0 24.2
(in percent of st. debt by res. maturity) 4/ 126.1 124.2 125.8 120.1 159.5 160.4Net international reserves 13.0 14.1 14.6 17.7 21.1 23.4Total external debt (in billions) 5/ 59.7 62.8 61.2 61.6 60.5 62.4
(in percent of GDP) 77.7 78.8 70.5 62.6 51.5 46.7Debt service ratio 6/ 19.7 20.6 19.7 18.5 19.6 19.2Export value (percent change) 9.9 2.7 9.8 3.3 10.6 6.6Import value (percent change) 6.3 3.1 8.0 8.0 11.4 7.5Gross external financing needs 7/ 14.3 13.1 12.5 11.1 12.1 11.0GDP (in billions) 76.8 79.6 86.7 98.4 117.4 133.6
Sources: Philippine authorities and Fund staff projections.
1/ Based on revisions to the data, made September 2006.2/ The 2003–04 revisions to the data separate remittances made by Filipino residents working abroad (income), and non-resident workers' remittances (transfers).3/ Gross reserves less gold and securities pledged as collateral against short term liabilities.4/ As a percent of short-term debt excluding pledged assets of the central bank.5/ Monitored external liabilities are defined as external debt plus liabilities of foreign banks in the Philippines to their headquarters, branches and agencies, some external debt not registered with the central bank and private capital lease agreements.6/ In percent of goods and non-factor services.7/ Defined as the current account deficit, plus amortization on medium- and long-term debt, plus short-term debt at the end of the previous period.
Staff Proj.

30
2002 2003 2004Dec. Dec. Dec. Dec. Mar. Jun. Sep.
Net foreign assets 551 673 727 961 1,102 1,239 1,295 Central bank 547 637 690 846 938 1,013 1,000 Net international reserves 693 782 820 937 1,024 1,091 1,072 Medium and long-term foreign liabilities 146 145 130 91 86 78 72 Deposit money banks 4 37 37 115 164 226 295
Net domestic assets 1,799 1,801 1,985 1,925 1,779 1,863 1,854 Net domestic credit 2,207 2,314 2,533 2,428 2,292 2,434 2,397 Public sector credit 727 807 956 875 765 898 875 National Government 590 620 764 652 536 665 648 Credits 749 807 923 852 797 915 889 Foreign exchange receivables 7 7 15 18 17 4 4 Treasury IMF Accounts -50 -58 -65 -66 -66 -60 -60 Deposits -117 -137 -109 -152 -213 -194 -185 Local government and others 132 184 191 222 229 233 227 Claims on CB-BOL 1/ 6 4 1 0 0 0 0 Private sector credit 1,480 1,507 1,577 1,553 1,526 1,536 1,522 Other items net -408 -513 -548 -503 -513 -571 -543
Total liquidity 2,351 2,474 2,711 2,886 2,882 3,102 3,149 M4 2,298 2,401 2,649 2,814 2,801 3,031 3,063 M3 (peso liquidity) 1,670 1,725 1,884 2,053 2,058 2,212 2,254 Foreign currency deposits, residents 628 676 766 762 744 818 809 Other liabilities 53 73 62 72 80 71 86
Net foreign assets 36.0 22.1 7.9 32.3 31.4 31.7 35.5Net domestic assets 2.3 0.1 10.2 -3.0 -7.4 0.5 0.1 Net domestic credit 4.8 4.8 9.5 -4.1 -6.1 1.1 -0.5 Public sector 12.8 11.0 18.5 -8.5 -16.4 5.0 2.6 Private sector 1.2 1.8 4.6 -1.5 0.0 -1.0 -2.2M4 8.9 4.5 10.3 6.2 4.1 11.1 11.7M3 9.5 3.3 9.2 9.0 7.1 12.3 14.3
Memorandum items: Gross domestic credit from deposit money banks 2,151 2,322 2,558 2,527 2,445 2,581 2,479 Private sector 1,470 1,498 1,566 1,543 1,516 1,526 1,512 (12-month percent change) 1.3 1.9 4.6 -1.5 0.0 -1.1 -2.2 Public sector 681 824 992 985 929 1,056 967 (In percent of total gross credit) 31.6 35.5 38.8 39.0 38.0 40.9 39
Net foreign assets 10.4 12.1 12.8 18.1 21.5 23.1 25.7 Central bank 10.3 11.5 12.1 15.9 18.3 18.9 19.9 Deposit money banks 0.1 0.7 0.7 2.2 3.2 4.2 5.8
Foreign currency deposits residents 11.8 12.2 13.1 14.4 14.5 15.4 16.1
Dollar-denominated credit to residents 9.9 9.7 11.2 10.0 10.1 10.9 10.4 Public sector 4.8 6.4 6.7 6.1 6.2 6.8 6.3 Private sector 5.2 3.3 4.5 3.9 3.9 4.1 4.1
Dollar denominated credit / dollar deposits 84.2 79.7 85.7 69.7 69.8 70.8 64.4 Dollar denominated credit to public sector / dollar deposits 40.4 52.6 51.2 42.5 42.9 44.3 38.9
Exchange rate (peso per dollar; end-period) 53.1 55.6 56.3 53.1 51.3 53.6 50.4
Sources: Philippine authorities; CEIC, and Fund staff estimates.
1/ The Central Bank-Board of Liquidators was established in 1993 to absorb the debts of the old central bank.
(In percent; unless otherwise indicated)
Table 4. Philippines: Monetary Survey, 2002–06
(12-month percent change)
(In billions of pesos)
(In billions of U.S. dollars)
2005
(In billions of pesos; unless otherwise indicated)
2006
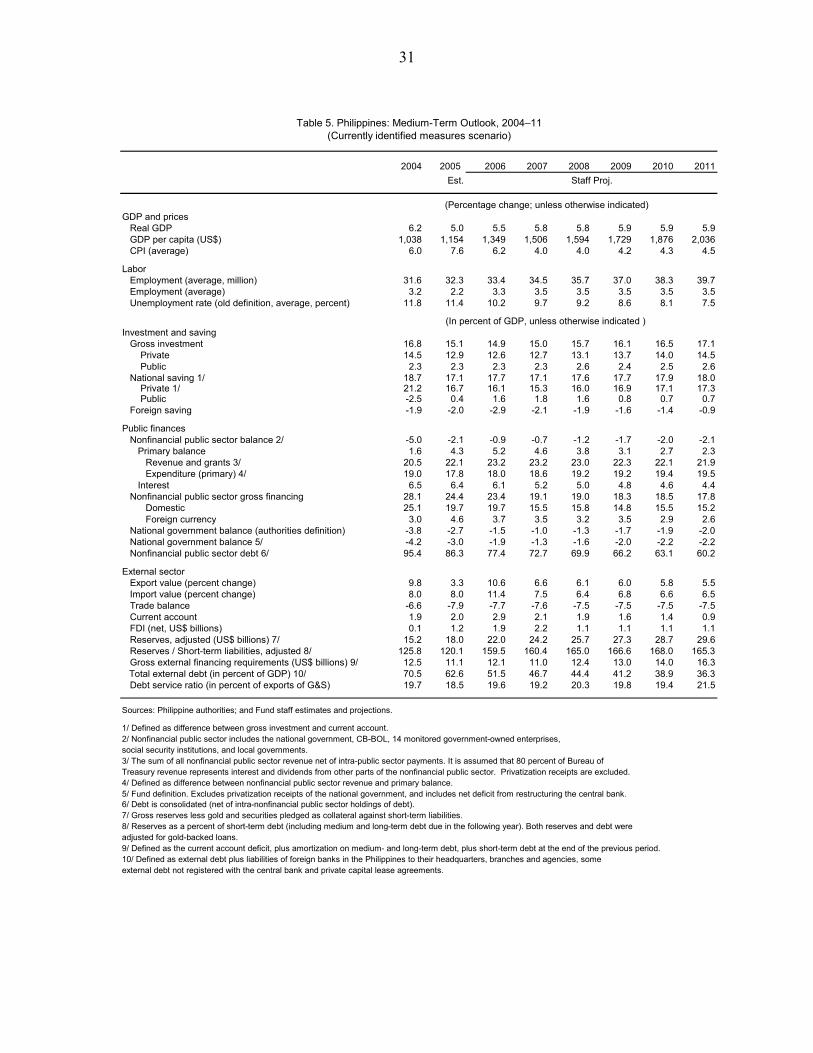
31
Table 5. Philippines: Medium-Term Outlook, 2004–11
(Currently identified measures scenario)
2004 2005 2006 2007 2008 2009 2010 2011Est. Staff Proj.
(Percentage change; unless otherwise indicated)GDP and prices Real GDP 6.2 5.0 5.5 5.8 5.8 5.9 5.9 5.9 GDP per capita (US$) 1,038 1,154 1,349 1,506 1,594 1,729 1,876 2,036 CPI (average) 6.0 7.6 6.2 4.0 4.0 4.2 4.3 4.5
Labor Employment (average, million) 31.6 32.3 33.4 34.5 35.7 37.0 38.3 39.7 Employment (average) 3.2 2.2 3.3 3.5 3.5 3.5 3.5 3.5 Unemployment rate (old definition, average, percent) 11.8 11.4 10.2 9.7 9.2 8.6 8.1 7.5
(In percent of GDP, unless otherwise indicated ) Investment and saving Gross investment 16.8 15.1 14.9 15.0 15.7 16.1 16.5 17.1 Private 14.5 12.9 12.6 12.7 13.1 13.7 14.0 14.5 Public 2.3 2.3 2.3 2.3 2.6 2.4 2.5 2.6 National saving 1/ 18.7 17.1 17.7 17.1 17.6 17.7 17.9 18.0 Private 1/ 21.2 16.7 16.1 15.3 16.0 16.9 17.1 17.3 Public -2.5 0.4 1.6 1.8 1.6 0.8 0.7 0.7 Foreign saving -1.9 -2.0 -2.9 -2.1 -1.9 -1.6 -1.4 -0.9
Public finances Nonfinancial public sector balance 2/ -5.0 -2.1 -0.9 -0.7 -1.2 -1.7 -2.0 -2.1 Primary balance 1.6 4.3 5.2 4.6 3.8 3.1 2.7 2.3 Revenue and grants 3/ 20.5 22.1 23.2 23.2 23.0 22.3 22.1 21.9 Expenditure (primary) 4/ 19.0 17.8 18.0 18.6 19.2 19.2 19.4 19.5 Interest 6.5 6.4 6.1 5.2 5.0 4.8 4.6 4.4 Nonfinancial public sector gross financing 28.1 24.4 23.4 19.1 19.0 18.3 18.5 17.8 Domestic 25.1 19.7 19.7 15.5 15.8 14.8 15.5 15.2 Foreign currency 3.0 4.6 3.7 3.5 3.2 3.5 2.9 2.6 National government balance (authorities definition) -3.8 -2.7 -1.5 -1.0 -1.3 -1.7 -1.9 -2.0 National government balance 5/ -4.2 -3.0 -1.9 -1.3 -1.6 -2.0 -2.2 -2.2 Nonfinancial public sector debt 6/ 95.4 86.3 77.4 72.7 69.9 66.2 63.1 60.2
External sector Export value (percent change) 9.8 3.3 10.6 6.6 6.1 6.0 5.8 5.5 Import value (percent change) 8.0 8.0 11.4 7.5 6.4 6.8 6.6 6.5 Trade balance -6.6 -7.9 -7.7 -7.6 -7.5 -7.5 -7.5 -7.5 Current account 1.9 2.0 2.9 2.1 1.9 1.6 1.4 0.9 FDI (net, US$ billions) 0.1 1.2 1.9 2.2 1.1 1.1 1.1 1.1 Reserves, adjusted (US$ billions) 7/ 15.2 18.0 22.0 24.2 25.7 27.3 28.7 29.6 Reserves / Short-term liabilities, adjusted 8/ 125.8 120.1 159.5 160.4 165.0 166.6 168.0 165.3 Gross external financing requirements (US$ billions) 9/ 12.5 11.1 12.1 11.0 12.4 13.0 14.0 16.3
Total external debt (in percent of GDP) 10/ 70.5 62.6 51.5 46.7 44.4 41.2 38.9 36.3 Debt service ratio (in percent of exports of G&S) 19.7 18.5 19.6 19.2 20.3 19.8 19.4 21.5
Sources: Philippine authorities; and Fund staff estimates and projections.
1/ Defined as difference between gross investment and current account. 2/ Nonfinancial public sector includes the national government, CB-BOL, 14 monitored government-owned enterprises, social security institutions, and local governments.3/ The sum of all nonfinancial public sector revenue net of intra-public sector payments. It is assumed that 80 percent of Bureau of Treasury revenue represents interest and dividends from other parts of the nonfinancial public sector. Privatization receipts are excluded.4/ Defined as difference between nonfinancial public sector revenue and primary balance.5/ Fund definition. Excludes privatization receipts of the national government, and includes net deficit from restructuring the central bank.6/ Debt is consolidated (net of intra-nonfinancial public sector holdings of debt).7/ Gross reserves less gold and securities pledged as collateral against short-term liabilities.8/ Reserves as a percent of short-term debt (including medium and long-term debt due in the following year). Both reserves and debt wereadjusted for gold-backed loans.9/ Defined as the current account deficit, plus amortization on medium- and long-term debt, plus short-term debt at the end of the previous period.10/ Defined as external debt plus liabilities of foreign banks in the Philippines to their headquarters, branches and agencies, some external debt not registered with the central bank and private capital lease agreements.
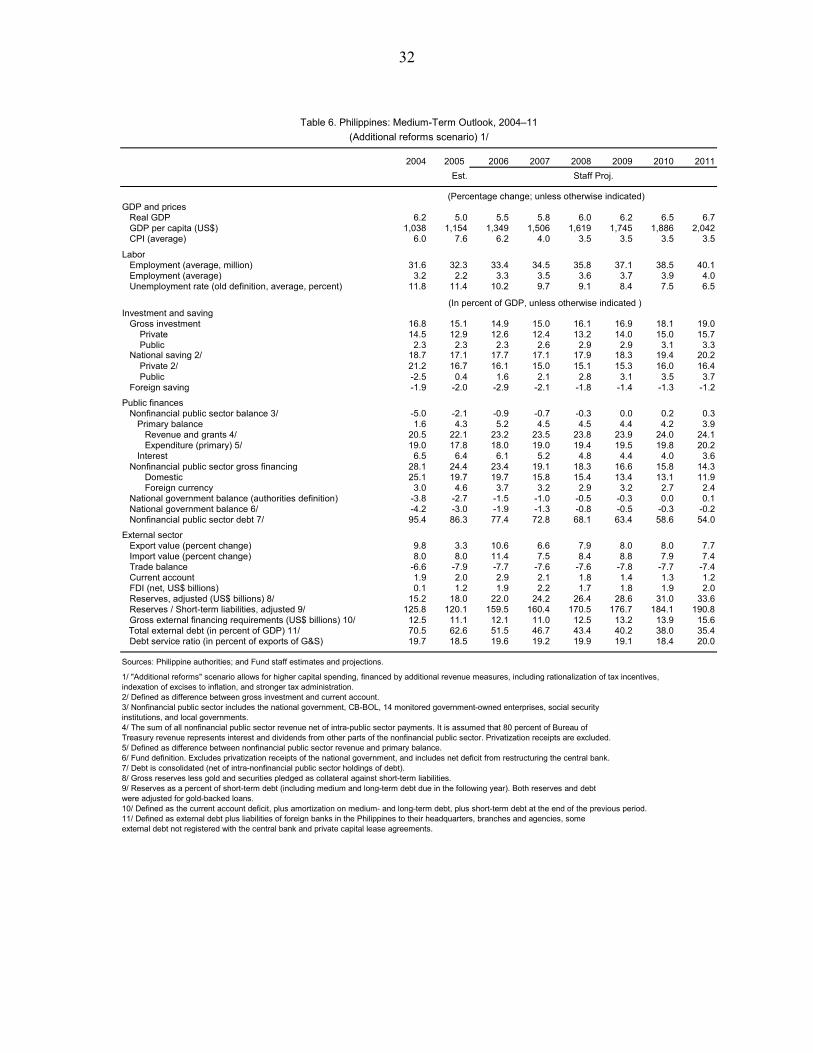
32
Table 6. Philippines: Medium-Term Outlook, 2004–11
(Additional reforms scenario) 1/
2004 2005 2006 2007 2008 2009 2010 2011Est. Staff Proj.
(Percentage change; unless otherwise indicated)GDP and prices Real GDP 6.2 5.0 5.5 5.8 6.0 6.2 6.5 6.7 GDP per capita (US$) 1,038 1,154 1,349 1,506 1,619 1,745 1,886 2,042 CPI (average) 6.0 7.6 6.2 4.0 3.5 3.5 3.5 3.5
Labor Employment (average, million) 31.6 32.3 33.4 34.5 35.8 37.1 38.5 40.1 Employment (average) 3.2 2.2 3.3 3.5 3.6 3.7 3.9 4.0 Unemployment rate (old definition, average, percent) 11.8 11.4 10.2 9.7 9.1 8.4 7.5 6.5
(In percent of GDP, unless otherwise indicated ) Investment and saving Gross investment 16.8 15.1 14.9 15.0 16.1 16.9 18.1 19.0 Private 14.5 12.9 12.6 12.4 13.2 14.0 15.0 15.7 Public 2.3 2.3 2.3 2.6 2.9 2.9 3.1 3.3 National saving 2/ 18.7 17.1 17.7 17.1 17.9 18.3 19.4 20.2 Private 2/ 21.2 16.7 16.1 15.0 15.1 15.3 16.0 16.4 Public -2.5 0.4 1.6 2.1 2.8 3.1 3.5 3.7 Foreign saving -1.9 -2.0 -2.9 -2.1 -1.8 -1.4 -1.3 -1.2
Public finances Nonfinancial public sector balance 3/ -5.0 -2.1 -0.9 -0.7 -0.3 0.0 0.2 0.3 Primary balance 1.6 4.3 5.2 4.5 4.5 4.4 4.2 3.9 Revenue and grants 4/ 20.5 22.1 23.2 23.5 23.8 23.9 24.0 24.1 Expenditure (primary) 5/ 19.0 17.8 18.0 19.0 19.4 19.5 19.8 20.2 Interest 6.5 6.4 6.1 5.2 4.8 4.4 4.0 3.6 Nonfinancial public sector gross financing 28.1 24.4 23.4 19.1 18.3 16.6 15.8 14.3 Domestic 25.1 19.7 19.7 15.8 15.4 13.4 13.1 11.9 Foreign currency 3.0 4.6 3.7 3.2 2.9 3.2 2.7 2.4 National government balance (authorities definition) -3.8 -2.7 -1.5 -1.0 -0.5 -0.3 0.0 0.1 National government balance 6/ -4.2 -3.0 -1.9 -1.3 -0.8 -0.5 -0.3 -0.2 Nonfinancial public sector debt 7/ 95.4 86.3 77.4 72.8 68.1 63.4 58.6 54.0
External sector Export value (percent change) 9.8 3.3 10.6 6.6 7.9 8.0 8.0 7.7 Import value (percent change) 8.0 8.0 11.4 7.5 8.4 8.8 7.9 7.4 Trade balance -6.6 -7.9 -7.7 -7.6 -7.6 -7.8 -7.7 -7.4 Current account 1.9 2.0 2.9 2.1 1.8 1.4 1.3 1.2 FDI (net, US$ billions) 0.1 1.2 1.9 2.2 1.7 1.8 1.9 2.0 Reserves, adjusted (US$ billions) 8/ 15.2 18.0 22.0 24.2 26.4 28.6 31.0 33.6 Reserves / Short-term liabilities, adjusted 9/ 125.8 120.1 159.5 160.4 170.5 176.7 184.1 190.8 Gross external financing requirements (US$ billions) 10/ 12.5 11.1 12.1 11.0 12.5 13.2 13.9 15.6
Total external debt (in percent of GDP) 11/ 70.5 62.6 51.5 46.7 43.4 40.2 38.0 35.4 Debt service ratio (in percent of exports of G&S) 19.7 18.5 19.6 19.2 19.9 19.1 18.4 20.0
Sources: Philippine authorities; and Fund staff estimates and projections.
1/ "Additional reforms" scenario allows for higher capital spending, financed by additional revenue measures, including rationalization of tax incentives, indexation of excises to inflation, and stronger tax administration. 2/ Defined as difference between gross investment and current account. 3/ Nonfinancial public sector includes the national government, CB-BOL, 14 monitored government-owned enterprises, social security institutions, and local governments.4/ The sum of all nonfinancial public sector revenue net of intra-public sector payments. It is assumed that 80 percent of Bureau of Treasury revenue represents interest and dividends from other parts of the nonfinancial public sector. Privatization receipts are excluded.5/ Defined as difference between nonfinancial public sector revenue and primary balance.6/ Fund definition. Excludes privatization receipts of the national government, and includes net deficit from restructuring the central bank.7/ Debt is consolidated (net of intra-nonfinancial public sector holdings of debt). 8/ Gross reserves less gold and securities pledged as collateral against short-term liabilities.9/ Reserves as a percent of short-term debt (including medium and long-term debt due in the following year). Both reserves and debt were adjusted for gold-backed loans.10/ Defined as the current account deficit, plus amortization on medium- and long-term debt, plus short-term debt at the end of the previous period.11/ Defined as external debt plus liabilities of foreign banks in the Philippines to their headquarters, branches and agencies, some external debt not registered with the central bank and private capital lease agreements.

33
2001 2002 2003 2004 2005Q1 Q2
Prel.
Capital adequacy
Total capital accounts to total assets 13.6 13.4 13.1 12.6 12.0 12.5 11.5Net worth-to-risk assets ratio 15.8 16.7 16.7 16.5 18.2 18.0 16.2Capital adequacy ratio (solo basis) 14.5 15.5 16.0 17.4 16.4 ... ...Capital adequacy ratio (consolidated basis) 15.6 16.9 17.4 18.4 17.6 ... ...
Asset quality 1/
NPL ratio 2/ 19.0 16.6 16.1 14.4 10.0 10.0 9.2NPA ratio 3/ 27.7 26.5 26.1 24.7 19.7 19.9 18.6Distressed asset ratio 4/ 31.7 31.0 30.9 28.6 23.2 23.4 22.0NPL coverage ratio 5/ 45.3 50.2 51.5 58.0 72.9 73.3 76.1NPA coverage ratio 6/ 29.6 30.1 30.9 33.2 38.3 38.7 39.2Net NPL to total capital 7/ 37.7 28.9 27.4 21.0 9.4 8.9 7.9Net NPA to total capital 8/ 78.9 73.3 72.4 65.4 47.6 45.9 45.3
Profitability
Net interest income to average earning assets 3.8 3.8 3.7 4.2 4.6 4.5 4.4Return on assets 0.4 0.8 1.1 0.9 1.1 1.1 1.1Return on equity 3.2 5.8 8.5 7.1 8.7 9.3 9.3Cost-to-income ratio 9/ 80.7 71.4 68.9 69.8 67.3 66.7 68.1
Liquidity
Liquid assets to total assets 30.0 32.3 32.3 36.6 36.4 35.2 37.8
Sensitivity to market risk
Net forex position to total capital 10/ ... ... 8.5 6.3 7.4 8.9 6.1
Sources: Philippine authorities; and Fund staff calculations.
1/ Change in series in 2002, largely due to new NPL definition.2/ Nonperforming loans (NPL) over total loan portfolio excluding interbank loans (TL).3/ NPL plus "real and other properties owned or acquired" (ROPOA) over TL plus ROPOA. 4/ NPL plus ROPOA plus current restructured loans over TL plus ROPOA. Starting July 2004, performing restructured loans was used.5/ Loan loss reserves over NPLs. 6/ Allowances for probable losses on NPAs over NPAs.7/ NPL minus loan loss reserves over capital. 8/ NPA minus allowances for probable loss on NPAs over capital. 9/ Operating expenses (net of bad debts and provisions) to total operating income.10/ Incorporates capital charges for market risk, implemented in 2003.
2006
Table 7. Philippines: Banking Sector Indicators, 2001–2006(End of year; unless otherwise indicated)

34
Table 8. Philippines: Indicators of External Vulnerability, 2001–06 1/(In percent of GDP; unless otherwise indicated)
2001 2002 2003 2004 2005 2006Proj.
External indicators (including external liquidity):Gross international reserves, adjusted (in billions U.S. dollars) 2/ 13.3 14.5 14.9 15.2 18.0 22.0Short-term debt (original maturity, in billions U.S. dollars) 9.1 8.0 8.2 7.6 9.4 8.2Amortization of medium and long-term debt (in billions U.S. dollars) 4.9 5.4 5.9 5.4 6.0 5.6Net FDI inflows (in billions of U.S. dollars) 0.3 1.5 0.2 0.1 1.2 1.9FX deposits residents (in billions of U.S. dollars) 11.4 11.8 12.2 13.1 14.4 16.1 3/Total gross external debt 81.6 77.7 78.8 70.5 62.6 51.5
Public sector indicators:Overall balance -4.9 -5.7 -5.6 -5.0 -2.1 -0.9Primary balance 1.3 0.1 0.7 1.6 4.3 5.2Nonfinancial public sector debt (NFPSD) 87.4 93.7 100.8 95.4 86.3 77.4NFPSD denominated in FX or linked to the exchange rate (in percent of NFPSD) 65.8 65.9 67.8 65.9 60.9 57.3Short-term general government debt (original maturity, in percent of NFPSD) 17.5 14.1 14.5 15.4 16.6 17.6Average effective interest rate of government debt (in percent) 7.1 6.2 6.3 6.9 7.4 7.8Amortization of total debt 22.3 21.6 23.2 23.1 22.3 22.5
Sources: Philippine authorities; and Fund staff estimates and projections.
1/ Includes estimates of non-monitored debt stock.2/ Gross reserves less gold and securities pledged as collateral against short-term liabilities.3/ As of September, 2006.

35
APPENDIX I. PHILIPPINES: DEBT SUSTAINABILITY ANALYSIS The sustainability of the Philippines’ public sector debt depends on the degree to which current reforms can be sustained and further reforms implemented: • Currently identified measures. The “currently identified measures” scenario
(Table 5) is considered the baseline for the Debt Sustainability Analysis (Table A1). This scenario assumes that the recent fiscal gains are sustained, but no new measures are introduced over the medium term. In this scenario, the nonfinancial public sector (NFPS) debt will decline, but will remain high at over 60 percent of GDP in 2011. The scenario assumes average real GDP growth of 5.8 percent over 2006-11 and a gradual deterioration of the primary surplus. While the debt dynamics are favorable overall, they remain vulnerable to shocks, especially to the exchange rate and, to a lesser extent, growth.
• Additional reforms. Under staff’s recommended scenario (Table 6), reforms are assumed to continue after 2006, including full implementation of tax administration reform, indexation of excises to inflation, and a revenue-positive rationalization of tax incentives. In such a world, public sector debt would be placed on a steeper downward path. This scenario assumes that primary surpluses will remain high, improving the debt dynamics both directly and indirectly, with improved confidence and higher private sector investment raising real GDP growth to 6½ percent.
The reduction in external vulnerabilities is largely driven by the extent to which the National Government reduces its dependence on external financing. In the “currently-identified measures” scenario, external debt is envisaged to fall to about 36 percent of GDP by 2011. As the stress tests show, the external debt trajectory is most sensitive to a sharp one-time nominal depreciation in the exchange rate (for example, if there were a shock similar to the period in 2000-2001). Furthermore, if: (1) the current account reverts to a deficit (for example, due to a strong shock to global growth that slows export growth and remittances), and/or (2) the economy experiences a growth shock stronger than the standard stress tests envisage, the external debt dynamics would look considerably less favorable.
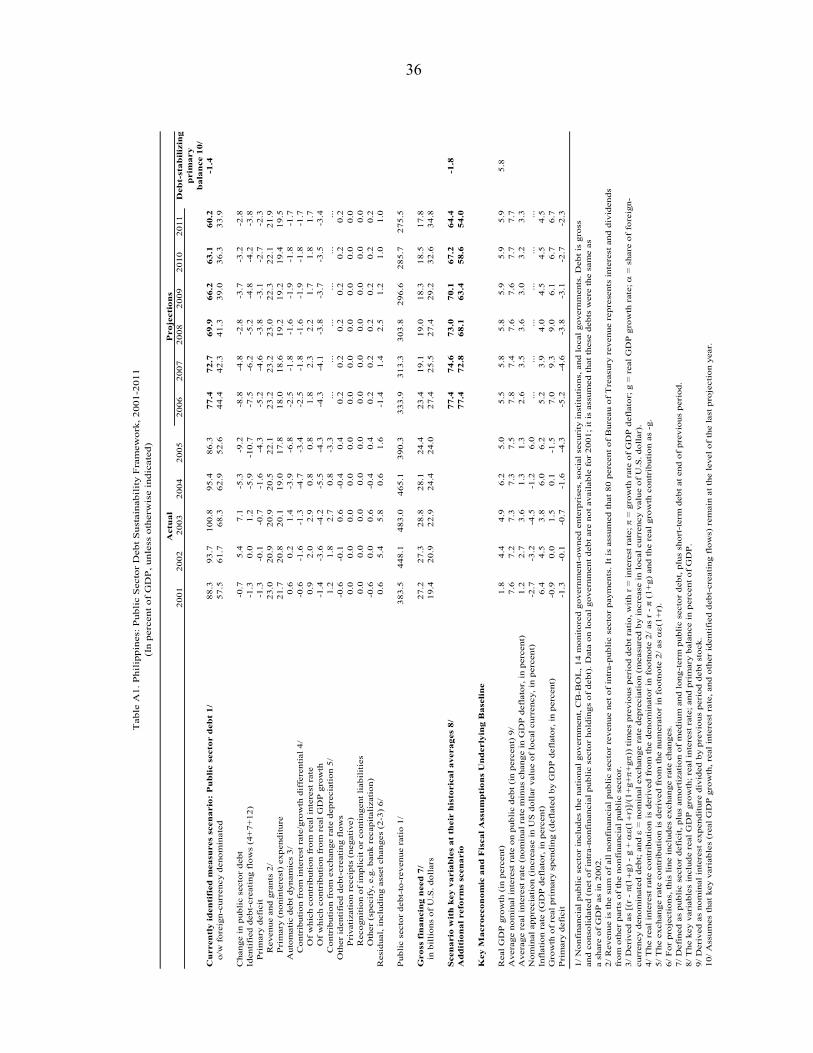
36
Pro
ject
ion
s20
0120
0220
0320
0420
0520
0620
0720
0820
0920
1020
11D
ebt-
stab
iliz
ing
pri
mar
yb
alan
ce 1
0/C
urr
entl
y id
enti
fied
mea
sure
s sc
enar
io:
Pu
bli
c se
ctor
deb
t 1/
88.3
93.7
100.
895
.486
.377
.472
.769
.966
.263
.160
.2-1
.4o/
w f
orei
gn-c
urre
ncy
deno
min
ated
57.5
61.7
68.3
62.9
52.6
44.4
42.3
41.3
39.0
36.3
33.9
Cha
nge
in p
ubli
c se
ctor
deb
t-0
.75.
47.
1-5
.3-9
.2-8
.8-4
.8-2
.8-3
.7-3
.2-2
.8Id
enti
fied
deb
t-cr
eati
ng f
low
s (4
+7+
12)
-1.3
0.0
1.2
-5.9
-10.
7-7
.5-6
.2-5
.2-4
.8-4
.2-3
.8P
rim
ary
defi
cit
-1.3
-0.1
-0.7
-1.6
-4.3
-5.2
-4.6
-3.8
-3.1
-2.7
-2.3
Rev
enue
and
gra
nts
2/23
.020
.920
.920
.522
.123
.223
.223
.022
.322
.121
.9P
rim
ary
(non
inte
rest
) ex
pend
itur
e21
.720
.820
.119
.017
.818
.018
.619
.219
.219
.419
.5A
utom
atic
deb
t dyn
amic
s 3/
0.6
0.2
1.4
-3.9
-6.8
-2.5
-1.8
-1.6
-1.9
-1.8
-1.7
Con
trib
utio
n fr
om in
tere
st r
ate/
grow
th d
iffe
rent
ial 4
/-0
.6-1
.6-1
.3-4
.7-3
.4-2
.5-1
.8-1
.6-1
.9-1
.8-1
.7O
f w
hich
con
trib
utio
n fr
om r
eal i
nter
est r
ate
0.9
2.0
2.9
0.8
0.8
1.8
2.3
2.2
1.7
1.8
1.7
Of
whi
ch c
ontr
ibut
ion
from
rea
l G
DP
gro
wth
-1.4
-3.6
-4.2
-5.5
-4.3
-4.3
-4.1
-3.8
-3.7
-3.5
-3.4
Con
trib
utio
n fr
om e
xcha
nge
rate
dep
reci
atio
n 5/
1.2
1.8
2.7
0.8
-3.3
......
......
......
Oth
er id
enti
fied
deb
t-cr
eati
ng f
low
s-0
.6-0
.10.
6-0
.40.
40.
20.
20.
20.
20.
20.
2P
riva
tiza
tion
rec
eipt
s (n
egat
ive)
0.0
0.0
0.0
0.0
0.0
0.0
0.0
0.0
0.0
0.0
0.0
Rec
ogni
tion
of
impl
icit
or
cont
inge
nt li
abil
itie
s0.
00.
00.
00.
00.
00.
00.
00.
00.
00.
00.
0O
ther
(sp
ecif
y, e
.g. b
ank
reca
pita
liza
tion
)-0
.60.
00.
6-0
.40.
40.
20.
20.
20.
20.
20.
2R
esid
ual,
incl
udin
g as
set c
hang
es (
2-3)
6/
0.6
5.4
5.8
0.6
1.6
-1.4
1.4
2.5
1.2
1.0
1.0
Pub
lic
sect
or d
ebt-
to-r
even
ue r
atio
1/
383.
544
8.1
483.
046
5.1
390.
333
3.9
313.
330
3.8
296.
628
5.7
275.
5
Gro
ss f
inan
cin
g n
eed
7/
27.2
27.3
28.8
28.1
24.4
23.4
19.1
19.0
18.3
18.5
17.8
in b
illi
ons
of U
.S. d
olla
rs19
.420
.922
.924
.424
.027
.425
.527
.429
.232
.634
.8
Sce
nar
io w
ith
ke y
var
iab
les
at t
hei
r h
isto
rica
l ave
rage
s 8/
77.4
74.6
73.0
70.1
67.2
64.4
-1.8
Ad
dit
ion
al r
efor
ms
scen
ario
77.4
72.8
68.1
63.4
58.6
54.0
Key
Mac
roec
onom
ic a
nd
Fis
cal A
ssu
mp
tion
s U
nd
erly
ing
Bas
elin
e
Rea
l GD
P g
row
th (
in p
erce
nt)
1.8
4.4
4.9
6.2
5.0
5.5
5.8
5.8
5.9
5.9
5.9
5.8
Ave
rage
nom
inal
inte
rest
rat
e on
pub
lic
debt
(in
per
cent
) 9/
7.6
7.2
7.3
7.3
7.5
7.8
7.4
7.6
7.6
7.7
7.7
Ave
rage
rea
l int
eres
t rat
e (n
omin
al r
ate
min
us c
hang
e in
GD
P d
efla
tor,
in
perc
ent)
1.2
2.7
3.6
1.3
1.3
2.6
3.5
3.6
3.0
3.2
3.3
Nom
inal
app
reci
atio
n (i
ncre
ase
in U
S d
olla
r va
lue
of lo
cal
curr
ency
, in
perc
ent)
-2.7
-3.2
-4.5
-1.2
6.0
......
......
......
Infl
atio
n ra
te (
GD
P d
efla
tor,
in p
erce
nt)
6.4
4.5
3.8
6.0
6.2
5.2
3.9
4.0
4.5
4.5
4.5
Gro
wth
of
real
pri
mar
y sp
endi
ng (
defl
ated
by
GD
P d
efla
tor,
in p
erce
nt)
-0.9
0.0
1.5
0.1
-1.5
7.0
9.3
9.0
6.1
6.7
6.7
Pri
mar
y de
fici
t-1
.3-0
.1-0
.7-1
.6-4
.3-5
.2-4
.6-3
.8-3
.1-2
.7-2
.3
1/ N
onfi
nanc
ial p
ubli
c se
ctor
incl
udes
the
nati
onal
gov
ernm
ent,
CB
-BO
L, 1
4 m
onit
ored
gov
ernm
ent-
owne
d en
terp
rise
s, s
ocia
l sec
urit
y in
stit
utio
ns, a
nd lo
cal g
over
nmen
ts. D
ebt i
s gr
oss
and
cons
olid
ated
(ne
t of
intr
a-no
nfin
anci
al p
ubli
c se
ctor
hol
ding
s of
deb
t). D
ata
on lo
cal g
over
nmen
t deb
t are
not
ava
ilab
le f
or 2
001;
it is
ass
umed
that
thes
e de
bts
wer
e th
e sa
me
as
a sh
are
of G
DP
as
in 2
002.
2/ R
even
ue is
the
sum
of
all n
onfi
nanc
ial p
ubli
c se
ctor
rev
enue
net
of
intr
a-pu
blic
sec
tor
paym
ents
. It i
s as
sum
ed th
at 8
0 pe
rcen
t of
Bur
eau
of T
reas
ury
reve
nue
repr
esen
ts in
tere
st a
nd d
ivid
ends
fr
om o
ther
par
ts o
f th
e no
nfin
anci
al p
ubli
c se
ctor
.3/
Der
ived
as
[(r
- π
(1+
g ) -
g +
αε(
1+
r )]/
(1+
g+π
+g π
)) ti
mes
pre
viou
s pe
riod
deb
t rat
io, w
ith
r =
inte
rest
rat
e; π
= g
row
th r
ate
of G
DP
def
lato
r; g
= r
eal G
DP
gro
wth
rat
e; α
= s
hare
of
fore
ign-
curr
ency
den
omin
ated
deb
t; a
nd ε
= n
omin
al e
xcha
nge
rate
dep
reci
atio
n (m
easu
red
by in
crea
se in
loca
l cur
renc
y va
lue
of U
.S. d
olla
r).
4/ T
he r
eal i
nter
est r
ate
cont
ribu
tion
is d
eriv
ed f
rom
the
deno
min
ator
in f
ootn
ote
2/ a
s r
- π
(1+
g) a
nd th
e re
al g
row
th c
ontr
ibut
ion
as -
g.5/
The
exc
hang
e ra
te c
ontr
ibut
ion
is d
eriv
ed f
rom
the
num
erat
or in
foo
tnot
e 2/
as
αε(
1+r)
. 6/
For
pro
ject
ions
, thi
s li
ne in
clud
es e
xcha
nge
rate
cha
nges
.7/
Def
ined
as
publ
ic s
ecto
r de
fici
t, pl
us a
mor
tiza
tion
of
med
ium
and
lon
g-te
rm p
ubli
c se
ctor
deb
t, p
lus
shor
t-te
rm d
ebt a
t end
of
prev
ious
per
iod.
8/
The
key
var
iabl
es in
clud
e re
al G
DP
gro
wth
; rea
l int
eres
t rat
e; a
nd p
rim
ary
bala
nce
in p
erce
nt o
f G
DP
.9/
Der
ived
as
nom
inal
inte
rest
exp
endi
ture
div
ided
by
prev
ious
per
iod
debt
sto
ck.
10/ A
ssum
es th
at k
ey v
aria
bles
(re
al G
DP
gro
wth
, rea
l int
eres
t rat
e, a
nd o
ther
iden
tifi
ed d
ebt-
crea
ting
flo
ws)
rem
ain
at th
e le
vel o
f th
e la
st p
roje
ctio
n ye
ar.
Act
ual
Tab
le A
1. P
hili
ppin
es: P
ubli
c S
ecto
r D
ebt S
usta
inab
ilit
y F
ram
ewor
k, 2
001-
2011
(In
perc
ent o
f G
DP
, unl
ess
othe
rwis
e in
dica
ted)

37
Growth shock (in percent per year)
67
Growth shock
6055
60
65
70
75
80
85
90
95
100
105
2001 2003 2005 2007 2009 2011
Currently-identified Reforms
64
PB shock
6055
60
65
70
75
80
85
90
95
100
105
2001 2003 2005 2007 2009 2011
Currently-identified Reforms
Interest rate shock (in percent)
63
i-rate shock
60
55
60
65
70
75
80
85
90
95
100
105
2001 2003 2005 2007 2009 2011
Currently-identified Reforms
Figure A1. Philippines: Public Debt Sustainability: Bound Tests 1/ (Public debt in percent of GDP)
Sources: International Monetary Fund, Country desk data, and staff estimates.1/ Shaded areas represent actual data. Individual shocks are permanent one-half standard deviation shocks. Figures in the boxes represent average projections for the respective variables in the "Currently identified Reforms" scenario and scenario being presented. Ten-year historical average for the variable is also shown.2/ Permanent 1/4 standard deviation shocks applied to real interest rate, growth rate, and primary balance.3/ One-time real depreciation of 30 percent and 10 percent of GDP shock to contingent liabilities occur in 2006, with real depreciation defined as nominal depreciation (measured by percentage fall in dollar value of local currency) minus domestic inflation (based on GDP deflator).
"Currently-identified Reforms" and historical scenarios
Historical
64
Currently-identified Reforms
6055
60
65
70
75
80
85
90
95
100
105
2001 2003 2005 2007 2009 201115
20
25
30
35
40
Combined shock 2/
65
Combined shock
6055
60
65
70
75
80
85
90
95
100
105
2001 2003 2005 2007 2009 2011
Currently-identified Reforms
30 % depreciation
119
60
contingent liabilities
shock
69
55
60
65
70
75
80
85
90
95
100
105
2001 2003 2005 2007 2009 2011
Currently-identified Reforms
Real depreciation and contingent liabilities shocks
Gross financing need under baseline (right scale)
Primary balance shock (in percent of GDP)
Baseline: 3.3Scenario: 4.2Historical 1.1
Baseline: 3.3Scenario: 2.5Historical 2.0
Baseline: 5.9Scenario: 4.8
Historical 4.2

38
Pro
ject
ions
2001
2002
2003
2004
2005
2006
2007
2008
2009
2010
2011
Deb
t-st
abili
zin g
non-
inte
rest
cu
rren
t acc
ount
6/
1C
urre
ntl y
iden
tifi
ed m
easu
res:
Ext
erna
l deb
t81
.677
.778
.870
.562
.651
.546
.744
.441
.238
.936
.3-1
.5
2C
hang
e in
ext
erna
l deb
t6.
0-3
.91.
1-9
.3-7
.0-1
1.1
-4.8
-2.3
-3.2
-2.3
-2.6
3Id
entif
ied
exte
rnal
deb
t-cre
atin
g flo
ws
(4+8
+9)
6.8
-7.7
-3.9
-9.0
-12.
7-8
.6-7
.6-5
.8-5
.2-4
.7-4
.04
Cur
rent
acc
ount
def
icit,
exc
ludi
ng in
tere
st p
aym
ents
-1.6
-2.8
-3.6
-4.8
-5.3
-6.1
-5.6
-5.3
-4.9
-4.4
-4.2
5D
efic
it in
bal
ance
of g
oods
and
ser
vice
s12
.09.
89.
88.
69.
38.
28.
07.
87.
57.
27.
26
Exp
orts
48.3
49.3
48.6
49.4
45.4
42.9
40.2
39.7
38.0
36.5
34.8
7Im
port
s 60
.359
.158
.458
.054
.851
.048
.347
.545
.543
.742
.08
Net
non
-deb
t cre
atin
g ca
pita
l inf
low
s (n
egat
ive)
-0.7
-2.2
-0.8
-0.7
-2.5
-2.9
-2.8
-1.4
-1.2
-1.2
-1.1
9A
utom
atic
deb
t dyn
amic
s 1/
9.0
-2.7
0.5
-3.5
-5.0
0.4
0.9
1.0
0.9
0.9
1.2
10C
ontr
ibut
ion
from
nom
inal
inte
rest
rate
4.0
3.3
3.2
2.9
3.3
3.3
3.5
3.5
3.3
3.1
3.3
11C
ontr
ibut
ion
from
real
GD
P gr
owth
-1
.4-3
.4-3
.7-4
.5-3
.0-2
.9-2
.6-2
.5-2
.4-2
.2-2
.112
Con
trib
utio
n fr
om p
rice
and
exc
hang
e ra
te c
hang
es 2
/ 6.
4-2
.60.
9-2
.0-5
.2...
......
......
...13
Res
idua
l, in
cl. c
hang
e in
gro
ss fo
reig
n as
sets
(2-3
) 3/
-0.7
3.8
5.1
-0.3
5.8
-2.5
2.8
3.5
2.0
2.4
1.5
Ext
erna
l deb
t-to
-exp
orts
ratio
(in
perc
ent)
169.
115
7.8
162.
114
0.8
137.
712
0.2
116.
311
1.9
108.
410
6.5
104.
4
Gro
ss e
xter
nal f
inan
cing
nee
d (i
n bi
llion
s of
US
dolla
rs) 4
/13
.814
.313
.112
.511
.112
.111
.012
.413
.014
.016
.3in
per
cent
of G
DP
19.4
18.7
16.5
14.4
11.6
10.3
8.2
8.6
8.1
7.9
8.3
Scen
ario
wit
h ke
y va
riab
les
at th
eir
hist
oric
al a
vera
ges
5/51
.552
.952
.251
.351
.149
.8-1
.3A
ddit
iona
l ref
orm
s sc
enar
io51
.546
.743
.440
.238
.035
.4
Key
Mac
roec
onom
ic A
ssum
ptio
ns U
nder
lyin
g B
asel
ine
Rea
l GD
P gr
owth
(in
perc
ent)
1.8
4.4
4.9
6.2
5.0
5.5
5.8
5.8
5.9
5.9
5.9
GD
P de
flat
or in
US
dolla
rs (c
hang
e in
per
cent
)-7
.83.
3-1
.22.
58.
113
.17.
62.
04.
54.
54.
5N
omin
al e
xter
nal i
nter
est r
ate
(in
perc
ent)
5.0
4.3
4.3
4.1
5.4
6.2
7.8
8.1
8.2
8.3
9.4
Gro
wth
of e
xpor
ts o
f G&
S (U
S do
llar t
erm
s, in
per
cent
)-1
6.7
10.0
2.4
10.6
4.4
12.5
6.8
6.6
6.0
6.3
5.5
Gro
wth
of i
mpo
rts
of G
&S
(US
dolla
r ter
ms,
in p
erce
nt)
7.7
5.7
2.6
8.1
7.1
11.1
7.6
6.3
6.0
6.3
6.2
Cur
rent
acc
ount
bal
ance
, exc
ludi
ng in
tere
st p
aym
ents
1.
62.
83.
64.
85.
36.
15.
65.
34.
94.
44.
2N
et n
on-d
ebt c
reat
ing
capi
tal i
nflo
ws
0.7
2.2
0.8
0.7
2.5
2.9
2.8
1.4
1.2
1.2
1.1
1/ D
eriv
ed a
s [r
- g
- ρ(1
+g) +
εα
(1+r
)]/(
1+g+
ρ+g ρ
) tim
es p
revi
ous
peri
od d
ebt s
tock
, with
r =
nom
inal
eff
ectiv
e in
tere
st ra
te o
n ex
tern
al d
ebt;
ρ =
chan
ge in
dom
estic
GD
P de
flato
r in
US
dolla
r ter
ms,
g =
real
GD
P gr
owth
rate
, ε
= no
min
al a
ppre
ciat
ion
(inc
reas
e in
dol
lar v
alue
of d
omes
tic c
urre
ncy)
, and
α =
sha
re o
f dom
estic
-cur
renc
y de
nom
inat
ed d
ebt i
n to
tal e
xter
nal d
ebt.
2/ T
he c
ontr
ibut
ion
from
pri
ce a
nd e
xcha
nge
rate
cha
nges
is d
efin
ed a
s [-
ρ(1+
g ) +
εα
(1+r
)]/(
1+g+
ρ+g ρ
) tim
es p
revi
ous
peri
od d
ebt s
tock
. ρ in
crea
ses
with
an
appr
ecia
ting
dom
estic
cur
renc
y ( ε
> 0
) and
risi
ng
infla
tion
(bas
ed o
n G
DP
defla
tor)
.3/
For
pro
ject
ion,
line
incl
udes
the
impa
ct o
f pri
ce a
nd e
xcha
nge
rate
cha
nges
.4/
Def
ined
as
curr
ent a
ccou
nt d
efic
it, p
lus
amor
tizat
ion
on m
ediu
m- a
nd lo
ng-t
erm
deb
t, pl
us s
hort
-ter
m d
ebt a
t end
of p
revi
ous
peri
od.
5/ T
he k
ey v
aria
bles
incl
ude
real
GD
P gr
owth
; nom
inal
inte
rest
rate
; dol
lar d
efla
tor g
row
th; a
nd b
oth
non-
inte
rest
cur
rent
acc
ount
and
non
-deb
t inf
low
s in
per
cent
of G
DP.
6/ L
ong-
run,
con
stan
t bal
ance
that
sta
biliz
es th
e de
bt ra
tio a
ssum
ing
that
key
var
iabl
es (r
eal G
DP
grow
th, n
omin
al in
tere
st ra
te, d
olla
r def
lato
r gro
wth
, and
non
-deb
t inf
low
s in
per
cent
of G
DP)
rem
ain
at
thei
r lev
els
of th
e la
st p
roje
ctio
n ye
ar.
Act
ual
Tab
le A
2. P
hilip
pine
s: E
xter
nal D
ebt S
usta
inab
ility
Fra
mew
ork,
200
1-20
11(I
n pe
rcen
t of G
DP,
unl
ess
othe
rwis
e in
dica
ted)

39
Interest rate shock (in percent)
37
i-rate shock
36
Currently identified measures
35
40
45
50
55
60
65
70
75
80
85
2001 2002 2003 2004 2005 2006 2007 2008 2009 2010 2011
Figure A2. Philippines: External Debt Sustainability: Bound Tests 1/(External debt in percent of GDP)
Sources: International Monetary Fund, Country desk data, and staff estimates.1/ Shaded areas represent actual data. Individual shocks are permanent one-half standard deviation shocks. Figures in the boxes represent average projections for the respective variables in the "Currently identified measures" scenario being presented. Ten-year historical average for the variable is also shown. 2/ Permanent 1/4 standard deviation shocks applied to real interest rate, growth rate, and current account balance.3/ One-time real depreciation of 30 percent occurs in 2006.
Currently identified measures and historical scenarios
Historical
50
Currently identified measures
36
303540455055606570758085
2001 2003 2005 2007 2009 20115
10
15
20
49CA shock
36Currently identified measures
35
40
45
50
55
60
65
70
75
80
85
2001 2002 2003 2004 2005 2006 2007 2008 2009 2010 2011
Combined shock 2/
44
Combined shock
36
Currently identified measures35
40
45
50
55
60
65
70
75
80
85
2001 2003 2005 2007 2009 2011
Real depreciation shock 3/
7030 %
depreciation
36Currently identified measures35
40
45
50
55
60
65
70
75
80
85
2001 2002 2003 2004 2005 2006 2007 2008 2009 2010 2011
Gross financing need under baseline (right scale)
Non-interest current account shock (in percent of GDP)Growth shock (in percent per year)
39
Growth shock
36
Currently identified measures35
40
45
50
55
60
65
70
75
80
85
2001 2003 2005 2007 2009 2011
Baseline: 5.9Scenario: 4.8Historical: 4.2
Baseline:Scenario:Historical:
8.38.64.9
Baseline: 4.9Scenario: 2.4Historical: 4.5

40
I. PHILIPPINES: FUND RELATIONS
(As of December 31, 2006) I. Membership Status: Joined: December 27, 1945; Article VIII II. General Resources Account: SDR Million % Quota Quota 879.90 100.00 Fund holdings of currency 792.37 90.05 Reserve position in Fund 87.55 9.95 III. SDR Department: SDR Million % Allocation Net cumulative allocation 116.60 100.00 Holdings 1.55 1.33 IV. Outstanding Purchases and Loans: None V. Financial Arrangements: Approval Expiration Amount Approved Amount Drawn Type Date Date (SDR Million) (SDR Million)
Stand-by 04/01/1998 12/31/2000 1,020.79 783.23 EFF 06/24/1994 03/31/1998 791.20 791.20 Stand-by 02/20/1991 03/31/1993 334.20 334.20
Post-program monitoring ended following the advance repurchase made by the Philippines on December 29, 2006.
VI. Projected Obligations to Fund: SDR Million; based on existing use of resources
and present holdings of SDRs:
Forthcoming 2007 2008 2009 2010Principal ... ... ... ...Charges/Interest 5.95 4.70 4.69 4.69Total 5.95 4.70 4.69 4.69
VII. Exchange Arrangement:
The exchange arrangement is classified as an independent float. The value of the Philippine peso is determined in the interbank foreign exchange market; the Bangko Sentral intervenes in the spot and forward markets in order to smooth undue short-term fluctuations in the exchange rate and to strategically build reserves.

41
VIII. Article IV Consultation:
The Philippines is on the standard 12-month cycle. The 2005 Article IV Consultation was discussed by the Executive Board on February 13, 2006. At that time, Directors commended the authorities for steadying the economic ship after the political turbulence in mid-2005 and for regaining momentum on their reform agenda – as evidenced by the sharp reduction in power sector losses and the full implementation of the landmark VAT reform law. They welcomed the large reduction in the public sector fiscal deficit in 2005. These policies have helped to turn around investor sentiment, boost market confidence, and strengthen the peso.
IX. FSAP and ROSC Participation: MCM: The Philippines’ FSAP was conducted during the fourth quarter of 2001; FSAP missions visited Manila in October and November–December 2001. The final version of the report was discussed with the authorities in June 2002. The associated FSSA was discussed by the Executive Board together with the Article IV staff report in September 2002. FAD: Discussions on fiscal transparency were held in Manila in September 2001. The ROSC report was discussed by the Executive Board in September 2002 together with the Article IV staff report, and published in October 2002. The update to the ROSC report was published in June 2004. STA: ROSC Data Module mission was conducted in September 2003, and the report was published in August 2004. X. Technical Assistance: An MCM resident banking supervision advisor has been stationed in Manila since May 2003, to assist the BSP in the implementation of a new supervisory model. An MCM mission visited Manila in February 2005 to review the payment systems, central bank accounting, and government bond market development. An MCM mission took place in July 2006 to review the regulation and infrastructure of the domestic debt market. Another MCM visited Manila in November 2006 to advise on liberalization of the foreign exchange market. An STA peripatetic mission visited Manila in July–August 2003, January–February 2004, and February–March 2005 to provide technical assistance in balance of payments and international investment position statistics and in implementing the recommendations made by the ROSC Data Module mission. An STA mission took place in March-April 2006 to assist the authorities in compiling and disseminating government finance statistics in accordance with GFSM 2001. An FAD mission to provide a briefing to the new tax commissioner took place in April–May 2001. An FAD mission reviewed VAT and excise administration in December 2001. An

42
FAD staff member participated in the July 2004 PPM mission to evaluate and advice on tax measures. An FAD mission visited Manila in November-December 2005 to provide assistance in the areas of tax and customs administration and another mission was fielded in March 2006 to reach agreement with the authorities on the priorities of the BIR reform agenda. An FAD tax administration advisor visited Manila in June-July 2006, the first in a program of 8 or 9 visits to help the Tax Reform Administration Group to implement the reform agenda. An LEG legal expert visited Manila to discuss anti-money laundering initiatives in March 2002. XI. Resident Representative: A Resident Representative has been stationed in Manila since January 1984. Mr. Reza Baqir assumed the post of Resident Representative in July 2005. XII. Fourth Amendment to the Articles of Agreement: The authorities have formally communicated to the Fund their acceptance of the Fourth Amendment, which was ratified by the Upper House of Parliament (Senate) in August 2001.
43
II. PHILIPPINES: RELATIONS WITH THE WORLD BANK GROUP
A. World Bank Lending and Non-Lending Activities
Since the World Bank started operations in the Philippines, it has committed approximately $12 billion under IBRD loans and $239 million under IDA credits (less cancellations). As of December 31, 2006, the current Philippines portfolio consisted of 24 projects, amounting to $1.7 billion with an undisbursed balance of $1,084.02 million. During FY06, the Bank approved three loans for a total of $410 million: National Program Support for Basic Education ($200 million), National Program Support for Health ($110 million), and Support for Strategic Local Development and Investment ($100 million). In FY07, a Development Policy Loan ($250 million) was approved on December 21, 2006. Based on net commitments and by sector, the current portfolio can be broken down as follows: infrastructure ($499 million, 30 percent); human development ($426 million, 25 percent); rural development ($351 million, 21 percent); social development ($100 million, 6 percent); environment ($35 million, 2 percent); and governance and economic management ($272 million, 16 percent). The overarching objective of the Bank’s Country Assistance Strategy (CAS) for the Philippines is to improve the lives of Filipinos through sustainable economic growth and greater social inclusion. Fiscal stability and public institutions that serve the common good are critical to these objectives. The strategy supports “Islands of Good Governance” in those government agencies, local governments, and dynamic sectors in the Philippines that demonstrate how improved accountability and service delivery will lead to better economic and social outcomes. The CAS seeks to align Bank lending more closely with the government’s own investment priorities, within the existing national budget, implying a shift away from financing discrete projects toward programmatic engagement. The approach also encourages local government units to pursue and finance their own priorities and to foster a better partnership with the national government. The CAS sets forth a lending program of up to $1.8 billion for the FY06-08 period. The actual lending level will be determined by progress on fiscal reforms and country demand. Reflecting significant progress on the fiscal reform program, the First Development Policy Loan (DPL) to the Philippines was approved by the Board on December 21, 2006, following an eight-year hiatus in policy-based lending. An important aspect of Bank support to the Philippines is in the form of non-lending activities. These activities focus on six themes emphasized by the Bank’s current assistance strategy: fiscal reform; growth and the investment climate; social development and inclusion, social protection, and poverty; governance, political economy reform, and anti-corruption; local government units, municipal finance, and fiscal decentralization; and meeting infrastructure needs. Recent examples of non-lending outputs include a Development Policy Review, Environment Monitor on Coastal and Marine Resource Management, Rural Development Sector Strategic Priorities, an Investment Climate Assessment; and a report on Meeting Infrastructure Challenges.
44
In addition to analytical work, the Bank also provides technical assistance to the Philippines, frequently supported by trust funds such as the Institutional Development Fund (IDF) and the Bank-managed ASEM Trust Fund.1 Also, technical assistance funded by the Policy and Human Resource Development (PHRD) Grant Facility helps the client prepare lending operations. In recent years, trust funds have supported studies, project preparation, capacity building and technical assistance in such areas as: pension reform, international competitiveness, banking supervision, procurement reform, financial management capacity, corporate governance, community managed agrarian reform, public sector strengthening, poverty mapping, and rural power. The Bank has an extensive outreach program in the Philippines to promote knowledge sharing. Currently there are ten Knowledge for Development Centers (KDCs) around the country that make available Bank publications and development literature either through on-line access or through hard copies. The Bank has also partnered with the Asian Institute of Management (AIM) to create a Global Distance Learning Network that offers distance learning sessions for a broad national, regional, and international audience. In addition, the Bank also maintains an external country website (www.worldbank.org.ph).
A. Consultative Group
The Philippine Development Forum (PDF), formerly called the Consultative Group (CG), is next scheduled to convene in March 2007 in the Philippines. The Bank will co-chair the meeting with the Philippine Government. An innovation to the development partner collaboration has been the formation of six working groups focused on: MDGs and social progress; growth and investment climate; economic and fiscal reforms; governance and anti-corruption; sustainable rural development; and decentralization and local government. In addition, a Mindanao working group which was already in place was subsumed under the PDF umbrella. These working groups each meet regularly throughout the year (in the Philippines) to discuss key issues and reform measures related to their relevant topics.
1 Asia-Europe Meeting–The European Union’s Asian crisis response fund, created in April 1998; intended to help eligible East Asian countries, including the Philippines, to recover from the regional financial crisis. The trust fund has supported activities both in the financial/corporate and social sectors.
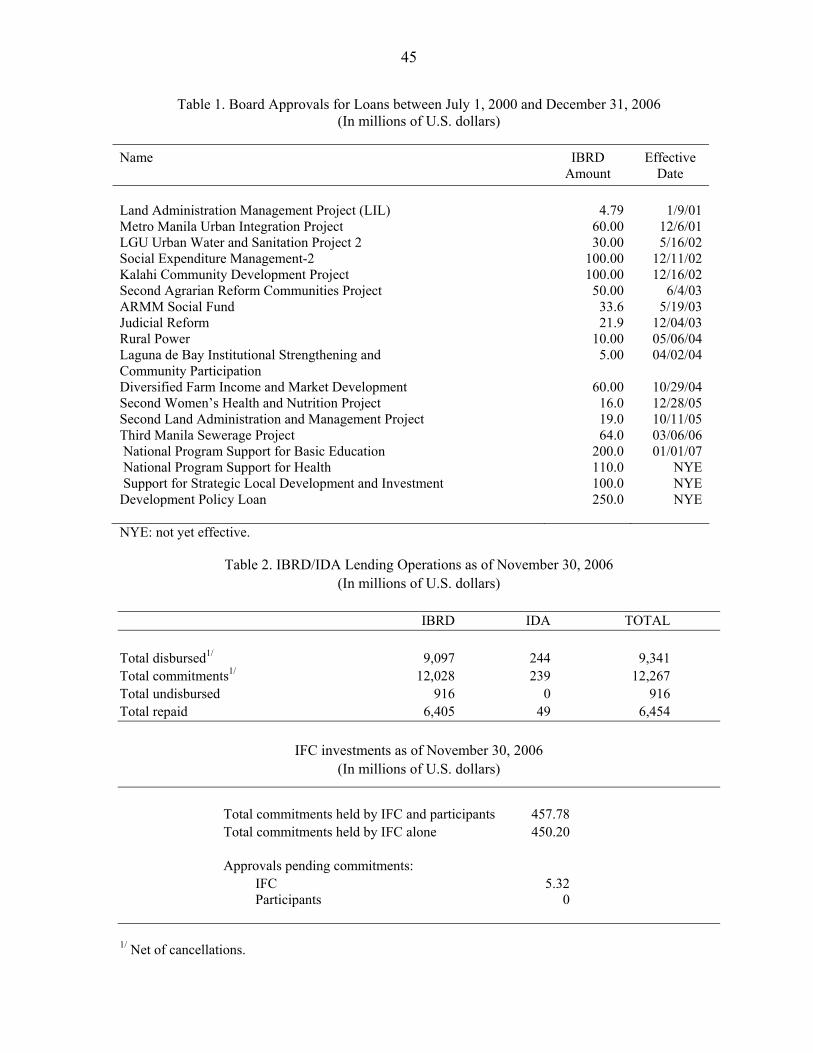
45
Table 1. Board Approvals for Loans between July 1, 2000 and December 31, 2006 (In millions of U.S. dollars)
Name IBRD
Amount Effective
Date Land Administration Management Project (LIL) Metro Manila Urban Integration Project LGU Urban Water and Sanitation Project 2 Social Expenditure Management-2 Kalahi Community Development Project Second Agrarian Reform Communities Project ARMM Social Fund Judicial Reform Rural Power Laguna de Bay Institutional Strengthening and Community Participation Diversified Farm Income and Market Development Second Women’s Health and Nutrition Project Second Land Administration and Management Project Third Manila Sewerage Project National Program Support for Basic Education National Program Support for Health Support for Strategic Local Development and Investment Development Policy Loan
4.79
60.00 30.00
100.00 100.00 50.00
33.6 21.9
10.00 5.00
60.00
16.0 19.0 64.0
200.0 110.0 100.0 250.0
1/9/01
12/6/01 5/16/02
12/11/02 12/16/02
6/4/03 5/19/03
12/04/03 05/06/04 04/02/04
10/29/04 12/28/05 10/11/05 03/06/06 01/01/07
NYE NYE NYE
NYE: not yet effective.
Table 2. IBRD/IDA Lending Operations as of November 30, 2006 (In millions of U.S. dollars)
IBRD IDA TOTAL Total disbursed1/ 9,097 244 9,341 Total commitments1/ 12,028 239 12,267 Total undisbursed 916 0 916 Total repaid 6,405 49 6,454
IFC investments as of November 30, 2006 (In millions of U.S. dollars)
Total commitments held by IFC and participants 457.78 Total commitments held by IFC alone 450.20
Approvals pending commitments: IFC 5.32 Participants 0
1/ Net of cancellations.
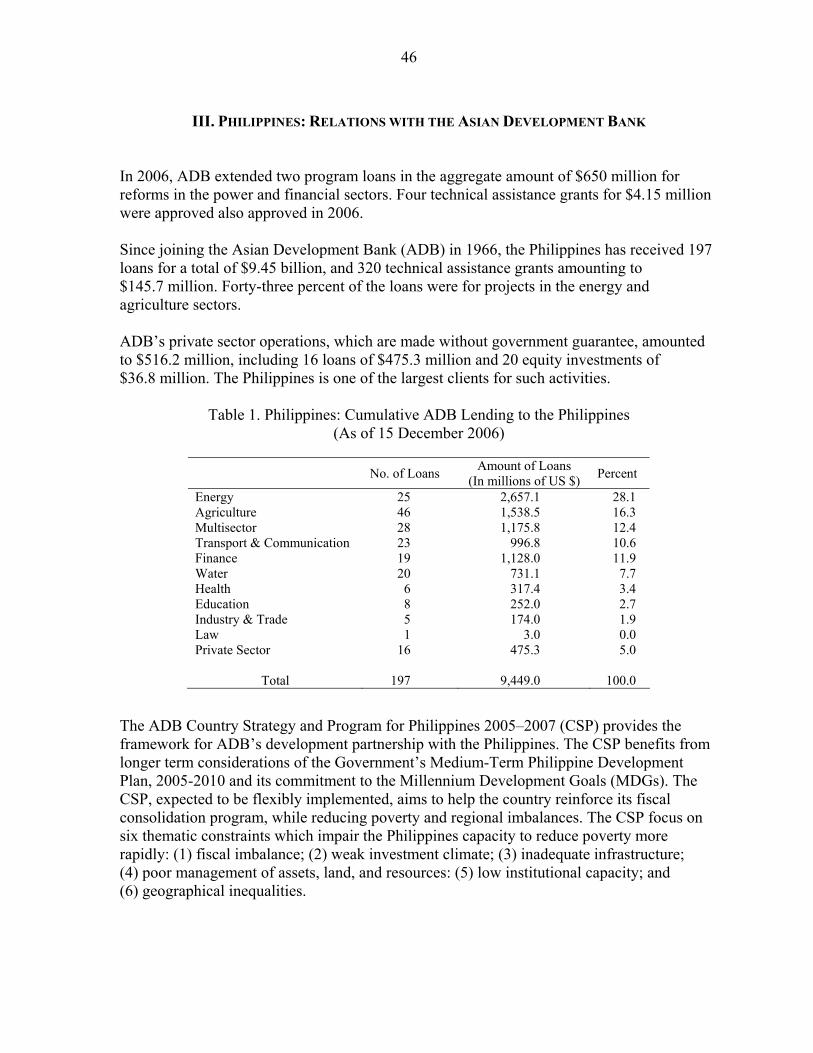
46
III. PHILIPPINES: RELATIONS WITH THE ASIAN DEVELOPMENT BANK
In 2006, ADB extended two program loans in the aggregate amount of $650 million for reforms in the power and financial sectors. Four technical assistance grants for $4.15 million were approved also approved in 2006. Since joining the Asian Development Bank (ADB) in 1966, the Philippines has received 197 loans for a total of $9.45 billion, and 320 technical assistance grants amounting to $145.7 million. Forty-three percent of the loans were for projects in the energy and agriculture sectors. ADB’s private sector operations, which are made without government guarantee, amounted to $516.2 million, including 16 loans of $475.3 million and 20 equity investments of $36.8 million. The Philippines is one of the largest clients for such activities.
Table 1. Philippines: Cumulative ADB Lending to the Philippines
(As of 15 December 2006)
No. of Loans Amount of Loans (In millions of US $) Percent
Energy 25 2,657.1 28.1 Agriculture 46 1,538.5 16.3 Multisector 28 1,175.8 12.4 Transport & Communication 23 996.8 10.6 Finance 19 1,128.0 11.9 Water 20 731.1 7.7 Health 6 317.4 3.4 Education 8 252.0 2.7 Industry & Trade 5 174.0 1.9 Law 1 3.0 0.0 Private Sector 16 475.3 5.0
Total 197 9,449.0 100.0
The ADB Country Strategy and Program for Philippines 2005–2007 (CSP) provides the framework for ADB’s development partnership with the Philippines. The CSP benefits from longer term considerations of the Government’s Medium-Term Philippine Development Plan, 2005-2010 and its commitment to the Millennium Development Goals (MDGs). The CSP, expected to be flexibly implemented, aims to help the country reinforce its fiscal consolidation program, while reducing poverty and regional imbalances. The CSP focus on six thematic constraints which impair the Philippines capacity to reduce poverty more rapidly: (1) fiscal imbalance; (2) weak investment climate; (3) inadequate infrastructure; (4) poor management of assets, land, and resources: (5) low institutional capacity; and (6) geographical inequalities.
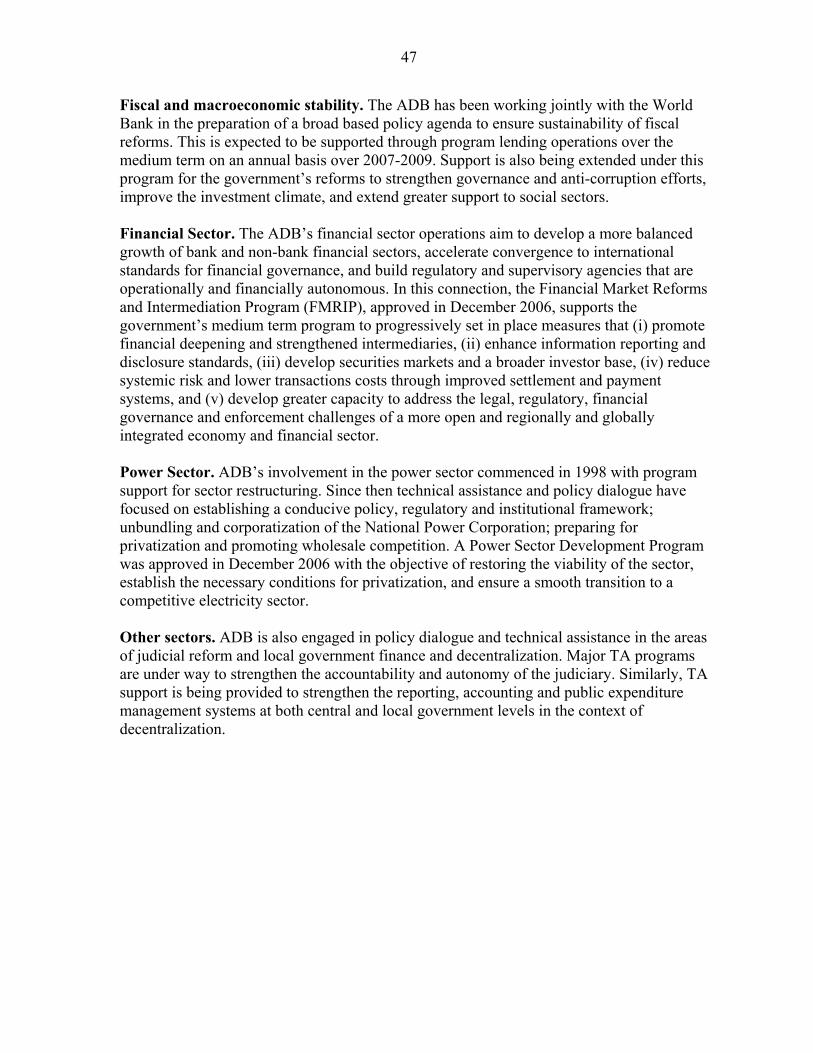
47
Fiscal and macroeconomic stability. The ADB has been working jointly with the World Bank in the preparation of a broad based policy agenda to ensure sustainability of fiscal reforms. This is expected to be supported through program lending operations over the medium term on an annual basis over 2007-2009. Support is also being extended under this program for the government’s reforms to strengthen governance and anti-corruption efforts, improve the investment climate, and extend greater support to social sectors. Financial Sector. The ADB’s financial sector operations aim to develop a more balanced growth of bank and non-bank financial sectors, accelerate convergence to international standards for financial governance, and build regulatory and supervisory agencies that are operationally and financially autonomous. In this connection, the Financial Market Reforms and Intermediation Program (FMRIP), approved in December 2006, supports the government’s medium term program to progressively set in place measures that (i) promote financial deepening and strengthened intermediaries, (ii) enhance information reporting and disclosure standards, (iii) develop securities markets and a broader investor base, (iv) reduce systemic risk and lower transactions costs through improved settlement and payment systems, and (v) develop greater capacity to address the legal, regulatory, financial governance and enforcement challenges of a more open and regionally and globally integrated economy and financial sector. Power Sector. ADB’s involvement in the power sector commenced in 1998 with program support for sector restructuring. Since then technical assistance and policy dialogue have focused on establishing a conducive policy, regulatory and institutional framework; unbundling and corporatization of the National Power Corporation; preparing for privatization and promoting wholesale competition. A Power Sector Development Program was approved in December 2006 with the objective of restoring the viability of the sector, establish the necessary conditions for privatization, and ensure a smooth transition to a competitive electricity sector. Other sectors. ADB is also engaged in policy dialogue and technical assistance in the areas of judicial reform and local government finance and decentralization. Major TA programs are under way to strengthen the accountability and autonomy of the judiciary. Similarly, TA support is being provided to strengthen the reporting, accounting and public expenditure management systems at both central and local government levels in the context of decentralization.
48
IV. PHILIPPINES: STATISTICAL ISSUES While data provision for surveillance purposes is adequate overall, shortcomings remain in certain areas. The Report on the Observance of Standards and Codes (ROSC)—Data Module, a Response by the Authorities, and a Detailed Assessment Using the Data Quality Assessment Framework (DQAF) were published on the IMF website in August 2004. The ROSC identified the national accounts and balance of payments statistics as needing particular attention. The Philippines subscribed to the Special Data Dissemination Standards (SDDS) in August 1996 and its metadata are posted on the Dissemination Standards Bulletin Board (DSBB).
A. National Accounts
Despite the authorities’ efforts to improve quality, weaknesses remain in the national accounts. These include large discrepancies in GDP estimates between the expenditure and production sides (the official GDP estimates), with consequent differences in estimates of GDP growth. The data ROSC identified a number of causes for these problems.1 • Deaths and births of establishments are not adequately captured. This gap is of
growing importance given the rapid structural change in the economy in recent years, with a large number of new establishments, in particular in the electronics and information technology industries.
• Compilation relies on an outdated benchmark year and fixed input-output ratios.
Estimates are derived by extrapolation of the 1988 benchmark year using fixed input-output ratios. For example, GDP statistics for the electronic sector suggest that value added remained at 10 percent of exports over the past years in spite of industry evidence that the domestic component of exports has been rising sharply.2
• Statistical techniques in estimating GDP at constant prices are inadequate. For most
activities, not all components of the production accounts are compiled, instead only value added is estimated. Value added at current prices is calculated by extrapolating the benchmark year value with an indicator for the value of output; data in constant prices are estimated using a price deflator for output. In addition, the national accounts constant price estimates for merchandise exports and imports are constructed by multiplying 1985 values by quantity data (weights) from the foreign trade statistics for current years. Because of this inappropriate method, implicit deflators for electric machinery products appear high compared with developments in world market prices.
1 Currently, the authorities are compiling new national accounts series based on the 1993 SNA guidelines. 2 Industry representatives indicate that the domestic component has increased significantly, to around 30 percent in recent years.
49
The consumer price index (CPI) has been compiled since February 2004 using weights based on the 2000 Family Income and Expenditures (FIES) survey. A notable change was that the weight given to food, beverages and tobacco (FBT) group decreased to 50 percent in 2000 from 55 percent in 1994, the previous weight reference year.
B. Balance of Payments
Steps have been taken to improve the quality of the balance of payments. The Fund has fielded several technical assistance missions since 1995, including the assignment of a peripatetic advisor in 2003. In 2005, Bangko Sentral ng Pilipinas created a new Department of Economic Statistics, with one of its units to concentrate on compiling, analyzing, and publishing the balance of payments and the international investment position. There has been important progress since 2004, including a significant improvement in the measurement of imports to correct an underestimation of imports of electronic goods on a consignment basis, improvements in the classification and recording of remittances, the introduction of a new methodology for measuring trade credits, and progress in the direct investment survey. Major revisions to the 2003-04 accounts were made in March 2005 and work to backtrack the series to 1999 was completed in the first quarter of 2006. Data for external debt and reserves are generally of good quality, although the data ROSC mission identified scope for improvement. The revisions to imports have narrowed the gap between national trade data and those of partner countries on a net basis. An interagency task force on import statistics was established in July 2002 to improve the measurement of activity in the electronics sector, which accounts for about 43 percent of trade flows. Results of surveys covering electronics sector raw material imports confirmed that imports were routinely underestimated in reports to the NSO. Import figures have therefore been revised substantially, back to 2000.3 As a result, the estimated trade balance for 2001 changed from a surplus of 3.8 percent of GDP to a deficit of 8.8 percent of GDP. A comparison of the revised figures with trade data of partner countries suggests that the revised trade balances of 2001–02 are reasonably well measured. However, substantial differences remain with partner country data on gross flows of exports and imports, with the latter about 15 percent higher than the corresponding national data. The BSP is continuing research on the factors behind discrepancies in data related to trade in processed goods, such as electronics and textiles. Challenges remain for addressing certain compilation issues. Since deregulation in the early 1990s, international transactions have increasingly flowed through nontraditional channels that are not adequately covered by the statistical reporting system. The Foreign Currency Deposit Units (FCDUs), which account for about 70–75 percent of foreign exchange settlements, are exempt from reporting requirements because of strict secrecy banking rules. Steps have been taken to measure cross-border transactions that skirt the
3 Data from 1996–99 have not been revised and remain underestimated.
50
domestic banking system, such as flows through inter-company accounts.4 Enterprise surveys, for example, have been introduced. But, these are conducted on a voluntary basis and will take time to implement fully. Unless modifications are made to secrecy rules associated with FCDU accounts to facilitate the collection of data for statistical purposes, compilers of the balance of payments will continue to face challenges in securing adequate source data.
C. Monetary Accounts Compilation of monetary statistics largely conforms to the Fund’s methodology, although there is scope for improvement. The authorities have recently made progress in implementing some of the recommendations of the data ROSC. They have introduced the Depository Corporations Survey, which now includes operations of thrift and rural banks. They have also introduced uniform procedures for converting foreign currency denominated accounts to local currency in the monetary aggregates. However, weakness remain, including in the treatment of non-operational banks, valuation of securities, and treatment of accrued interest. In October 2004, STA introduced standardized report forms (SRFs) for reporting monetary statistics to the IMF and requested that countries submit test data by January 2005. However, BSP has yet to submit the data to STA.
D. Fiscal Data While the Philippines meets the requirements of fiscal transparency in many important respects, the fiscal and data ROSCs found areas that require strengthening. An important problem is that the budget is presented on an obligations basis, while the deficit is reported on a cash basis, complicating comparisons of budgets and outcomes. In addition, for levels of the public sector beyond the budgetary central (national) government, consolidated fiscal outturns for items other than the fiscal balance are generally unavailable. The August 2004 GFS mission addressed shortcomings in the reconciliation of debt stocks and financing flows and advised on improving the consolidation of debt data for the public sector (and its subsectors). This has allowed publication of revised nonfinancial public sector debt data since early 2005. The discrepancy between stocks and flows was further investigated during a follow-up mission in April 2006. It was established that the problems with reconciliation result from differences in time of recording and inconsistency in the coverage and classification of some transactions related to debt guarantees and assumed debt. The authorities agreed to compare the coverage of data in the two debt recording systems, standardize the classifications of these transactions, and improve the recording of debt transactions according to international best practice. The introduction of a standardized chart of accounts, and the electronic New Government Accounting System (NGAS) has facilitated the compilation of annual financial statements for all the levels of the public sector. The accounting system allows for the compilation of accrual based accounts and also provides for the compilation of a 4 According to recent household surveys, typically about 30 percent of remittances of Overseas Filipino Workers were not channeled through the banking system, suggesting that remittances may have been underestimated by about US$3 billion (3.8 percent of GDP) in 2002.

51
statement of cash flows. These statements become available six months after the end of a reference period. In addition, the mission worked with the authorities to revise classifications in the chart of accounts, in order to allow for the consolidation of data for the nonfinancial public sector as a whole. Also, it recommended separating the market and non-market activities of the government-owned-and-controlled-corporations, so that consolidated data for the general government sector could be compiled. Annual data covering only the budgetary central government are reported for publication in the GFSY, and monthly budgetary central government data are published in the IFS. A dedicated unit in Department of Finance was created to compile government finance statistics in accordance with GFSM 2001 framework.

52
PHILIPPINES: TABLE OF COMMON INDICATORS REQUIRED FOR SURVEILLANCE
(As of December 13, 2006)
Memo Items: Date of Latest
Observation
Date
Received
Frequency of
Data6
Frequency of
Reporting6
Frequency of
Publication6
Data Quality – Methodological
Soundness7
Data Quality – Accuracy and Reliability8
Exchange Rates Dec 13/06 Dec.13/06 D D D
International Reserve Assets and Reserve Liabilities of the Monetary Authorities1
Dec 5/06 Dec. 5/06 D D M
Reserve/Base Money Dec. 4/06 Dec.10/06 D W W O, LO, LO, LNO LO, O, O, O, LO
Broad Money Oct./06 Nov. 29/06 M M M
Central Bank Balance Sheet Sept./06 Nov./06 M M M
Consolidated Balance Sheet of the Banking System
June/06 Nov./06 Q Q Q
Interest Rates2 Dec. 13/06 Dec. 13/06 D D D
Consumer Price Index Nov./06 Dec. 5/06 M M M O, O, O, O O, LO, O, LO, LO
Revenue, Expenditure, Balance and Composition of Financing3 – General Government4
Q2/06 Jul. 25/06 Q Q Q LO, LO, O, O LO, LO, LO, LO, LO
Revenue, Expenditure, Balance and Composition of Financing3– Central Government
Oct./06 Nov.17/06 M M M
Stocks of Central Government and Central Government-Guaranteed Debt5
Q3/06 Nov. 17/06 Q Q Q
External Current Account Balance Q2/06 Sep.26/06 Q Q Q O, LO, LO, LO LNO, LO, O, LO, LO
Exports and Imports of Goods and Services
Q2/06 Sep.26/06 Q Q Q
GDP/GNP Q3/06 Nov. 29/06 Q Q Q LO, LO, O, LO LNO, LNO, O, LO, O
Gross External Debt Q2/06 Oct.5/06 Q Q Q
1 Includes reserve assets pledged or otherwise encumbered as well as net derivative positions. 2 Both market-based and officially determined, including discount rates, money market rates, rates on treasury bills, notes and bonds. 3 Foreign, domestic bank, and domestic nonbank financing. 4 The general government consists of the central government (budgetary funds, extra budgetary funds, and social security funds) and state and local governments. 5 Including currency and maturity composition. 6 Daily (D), Weekly (W), Monthly (M), Quarterly (Q), Annually (A), Irregular (I); Not Available (NA). 7 Reflects the assessment provided in the data ROSC or the Substantive Update (published on August 25, 2004, and based on the findings of the mission that took place during September 1–16, 2003) for the dataset corresponding to the variable in each row. The assessment indicates whether international standards concerning concepts and definitions, scope, classification/sectorization, and basis for recording are fully observed (O), largely observed (LO), largely not observed (LNO), or not observed (NO). 8 Same as footnote 8, except referring to international standards concerning source data, statistical techniques, assessment and validation of source data, assessment and validation of intermediate data and statistical outputs, and revision studies.

Public Information Notice (PIN) No. 07/14 FOR IMMEDIATE RELEASE February 7, 2007
IMF Executive Board Concludes the 2006 Article IV Consultation with the Philippines
On January 19, 2007, the Executive Board of the International Monetary Fund (IMF) concluded the 2006 Article IV Consultation with the Philippines based on the information available through that date.1 Background Impressive fiscal reforms in an environment of sustained growth and declining inflation have strengthened market confidence in the Philippines. A large reduction in the national government deficit was achieved in 2004 and 2005, primarily through expenditure compression. Full implementation of the VAT reform in early 2006 broadened the national government’s adjustment effort to the revenue side, and tax administration has proved sufficient to ensure that collections have risen as programmed. The economy is expected to have expanded by 5.5 percent in 2006, faster than the 5.0 percent previously projected. Private consumption has continued to be the main driver, underpinned by rapid growth in remittances. Inflation has continued to moderate with headline inflation in December falling within the Bangko Sentral ng Pilipinas (BSP) inflation target of 4-5 percent for 2006. The national government deficit is projected to have shrunk further in 2006 and to be significantly below the target of 2 percent of GDP. With revenue collection broadly on target, the faster-than-expected pace of adjustment stems from the failure of Congress to pass the 2006 Budget; as a result, the 2005 Budget was re-enacted which constrained spending. A similar fall is expected for the non-financial public sector deficit, reflecting consolidation at the national government level, continued improved performance of the social security institutions, and expenditure savings by the National Power Corporation. 1 Under Article IV of the IMF's Articles of Agreement, the IMF holds bilateral discussions with members, usually every year. A staff team visits the country, collects economic and financial information, and discusses with officials the country's economic developments and policies. On return to headquarters, the staff prepares a report, which forms the basis for discussion by the Executive Board. At the conclusion of the discussion, the Managing Director, as Chairman of the Board, summarizes the views of Executive Directors, and this summary is transmitted to the country's authorities.
International Monetary Fund 700 19th Street, NW Washington, D. C. 20431 USA

2 Remittances have continued to grow strongly and the balance of payments received additional support in the second half of 2006 from weaker oil prices. There has also been a pick-up in foreign direct investment and a pronounced acceleration in net portfolio inflows. Against this backdrop, the peso has appreciated against the U.S. dollar, even as the BSP has continued to build reserves. The authorities have also used the greater availability of foreign exchange to prepay external debt, including to the IMF, and are shifting towards reduced reliance on external borrowing. The key challenge for the Philippine authorities going forward is to sustain the reform momentum, which will help maintain the confidence of markets and insure against market volatility. On current policies, growth is expected to increase to 5.8 percent in 2007, but could be higher over the medium term on the back of additional reforms that put public debt on a more sustainable downward path and boost investor confidence and investment. The main downside risks to the outlook are a renewed surge in oil prices, a slowdown in the global economy, and a sudden reversal in global risk appetite. Executive Board Assessment Executive Directors commended the Philippine authorities for the substantial further strengthening of macroeconomic performance in 2006. Growth rebounded, inflation slowed markedly, and significant progress with fiscal consolidation boosted market confidence, reflected in higher capital inflows and a buildup in foreign reserves. Given this progress, Directors welcomed the early repayment by the Philippines of its outstanding obligations to the IMF, which triggered the exit from Post-Program Monitoring (PPM) at end-2006. Directors underscored the need to sustain the reform momentum. Although the economy’s resilience has improved, there are still vulnerabilities. Public debt remains sensitive to rollover and exchange rate risks and external commercial borrowing requirements, while declining, are still significant. As recognized by the authorities, a sudden rise in global risk aversion could also affect the Philippines, unless confidence is sustained through further reforms. Continued reforms are also necessary to boost investment and growth and accelerate progress in reducing poverty. Directors congratulated the authorities on their strong and disciplined fiscal performance, and supported their commitment to sustain consolidation. They welcomed the marked increase in tax collections in 2006 due to the VAT reform, but regretted that the non-passage of the 2006 budget had constrained spending. Directors regarded continued expenditure compression as neither desirable nor sustainable given the country’s sizeable social and infrastructure needs. Looking ahead, they considered that balancing the budget, while increasing priority spending, will require accelerating the implementation of tax administration reforms, as well as new tax measures, such as a rationalization of tax incentives. Directors also saw careful monitoring of other ongoing public sector reforms as essential to support fiscal consolidation. Directors pointed to the recent agreement on a long-term supply contract between the National Power Corporation and the largest power distributor as providing a welcome opportunity to accelerate privatization in the power sector. They saw an efficient energy sector, together with decisive improvements in governance as set forth in the Medium-

3 Term Philippine Development Plan, as key elements of a better business and investment climate. Directors considered the current policy mix to deal with upward pressure on the exchange rate to be broadly appropriate. Going forward, they urged continued exchange rate flexibility, even though some further reserve accumulation might be justified, given that the exchange rate does not appear to be misaligned and capital inflows could quickly reverse. In addition, Directors supported the authorities’ efforts to shift towards domestic financing and to prepay external debt. Directors welcomed the authorities’ success in containing inflation, which had created room for some monetary policy easing, and noted their continued vigilant monitoring of inflationary pressures. In this regard, many Directors cautioned that while tiering was introduced as a targeted and temporary approach to encourage credit growth, its re-introduction created uncertainties about the monetary policy stance and corresponded to a significant effective easing that could render the inflation outlook less favorable. These Directors encouraged the authorities to remove tiering, in particular should the currently benign inflation outlook deteriorate. Some Directors, however, saw tiering as an appropriate instrument to help address the low level of bank lending. Directors called for further steps to strengthen the banking sector. While encouraging progress has been made in disposing of non-performing assets (NPAs), Directors observed that the stock of repossessed real estate assets remains large and that solving this problem will be key to allowing the banking sector to contribute to the investment recovery. They urged the authorities to tighten regulatory requirements on NPAs further if disposals do not accelerate. Directors welcomed the recent consolidation in the banking sector and efforts by banks to raise new capital, but encouraged the BSP to maintain pressures on banks to raise new capital, while ensuring that any regulatory relief is applied within the new framework. Directors urged the authorities to continue to press for the passage of the long-delayed changes to the BSP Charter to strengthen legal protection for supervisors and increase their leverage over problem-banks as necessary conditions for a fully effective regulatory framework. Directors commended the authorities for promoting the development of domestic capital markets through their public debt management. They observed that legislative initiatives, including bills to create credit information bureaus and promote retirement saving vehicles, would usefully complement this effort.
Public Information Notices (PINs) are issued, (i) at the request of a member country, following the conclusion of the Article IV consultation for countries seeking to make known the views of the IMF to the public. This action is intended to strengthen IMF surveillance over the economic policies of member countries by increasing the transparency of the IMF's assessment of these policies; and (ii) following policy discussions in the Executive Board at the decision of the Board.
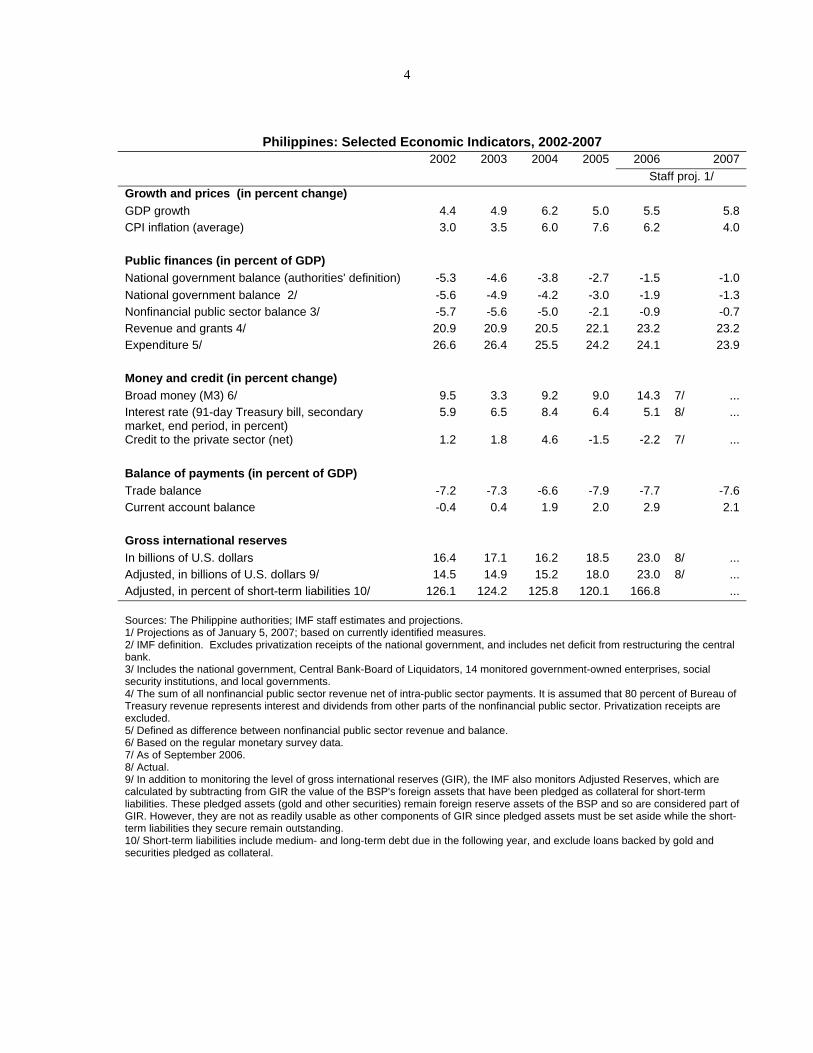
4
Philippines: Selected Economic Indicators, 2002-2007 2002 2003 2004 2005 2006 2007 Staff proj. 1/
Growth and prices (in percent change) GDP growth 4.4 4.9 6.2 5.0 5.5 5.8 CPI inflation (average) 3.0 3.5 6.0 7.6 6.2 4.0
Public finances (in percent of GDP) National government balance (authorities' definition) -5.3 -4.6 -3.8 -2.7 -1.5 -1.0 National government balance 2/ -5.6 -4.9 -4.2 -3.0 -1.9 -1.3 Nonfinancial public sector balance 3/ -5.7 -5.6 -5.0 -2.1 -0.9 -0.7 Revenue and grants 4/ 20.9 20.9 20.5 22.1 23.2 23.2 Expenditure 5/ 26.6 26.4 25.5 24.2 24.1 23.9
Money and credit (in percent change) Broad money (M3) 6/ 9.5 3.3 9.2 9.0 14.3 7/ ... Interest rate (91-day Treasury bill, secondary market, end period, in percent)
5.9 6.5 8.4 6.4 5.1 8/ ...
Credit to the private sector (net) 1.2 1.8 4.6 -1.5 -2.2 7/ ...
Balance of payments (in percent of GDP) Trade balance -7.2 -7.3 -6.6 -7.9 -7.7 -7.6 Current account balance -0.4 0.4 1.9 2.0 2.9 2.1
Gross international reserves In billions of U.S. dollars 16.4 17.1 16.2 18.5 23.0 8/ ... Adjusted, in billions of U.S. dollars 9/ 14.5 14.9 15.2 18.0 23.0 8/ ... Adjusted, in percent of short-term liabilities 10/ 126.1 124.2 125.8 120.1 166.8 ...
Sources: The Philippine authorities; IMF staff estimates and projections. 1/ Projections as of January 5, 2007; based on currently identified measures. 2/ IMF definition. Excludes privatization receipts of the national government, and includes net deficit from restructuring the central bank. 3/ Includes the national government, Central Bank-Board of Liquidators, 14 monitored government-owned enterprises, social security institutions, and local governments. 4/ The sum of all nonfinancial public sector revenue net of intra-public sector payments. It is assumed that 80 percent of Bureau of Treasury revenue represents interest and dividends from other parts of the nonfinancial public sector. Privatization receipts are excluded. 5/ Defined as difference between nonfinancial public sector revenue and balance. 6/ Based on the regular monetary survey data. 7/ As of September 2006. 8/ Actual. 9/ In addition to monitoring the level of gross international reserves (GIR), the IMF also monitors Adjusted Reserves, which are calculated by subtracting from GIR the value of the BSP's foreign assets that have been pledged as collateral for short-term liabilities. These pledged assets (gold and other securities) remain foreign reserve assets of the BSP and so are considered part of GIR. However, they are not as readily usable as other components of GIR since pledged assets must be set aside while the short-term liabilities they secure remain outstanding. 10/ Short-term liabilities include medium- and long-term debt due in the following year, and exclude loans backed by gold and securities pledged as collateral.

Statement by the Bangko Sentral ng Pilipinas Right of Reply Document
The authorities consider the 2006 Staff Report to be a concise account of the developments in the Philippine economy and the policies that have been taken to bring the economy to a higher growth path. The Authorities would like to complement the Staff Report by issuing this statement so that developments can be better appreciated in light of their proper context.
The Staff Report states that Philippine markets would be hard hit by a sudden rise in global risk aversion. It should be clarified that an adverse change in market sentiment would impact all economies, and not only the Philippines. With debt dynamics having improved considerably, the external payments position showing considerable strengthening, and the pace of fiscal consolidation accelerating, the Philippine economy is in fact better able to respond more flexibly to the moods and swings of international capital markets.
The authorities consider it important that the objective of the tiering system is properly discussed in the Staff Report. Tiering—which was reintroduced in early November 2006—applies to banks’ placements with the BSP. Its objective is to encourage banks to perform their financial intermediation function by lending their excess funds instead of placing the same with the BSP. The Staff Report states that while the BSP’s stated intention behind the tiering was to promote bank lending, the initial impact seemed to have been to take some pressure off the exchange rate. This statement could suggest that the expressed intention is not the true intention. It is important to underscore that any impact on the exchange rate was not directly intended and was only a consequence of banks’ portfolio management actions. The Staff Report also states that tiering complicates the assessment of the policy stance. On the contrary, the impact of tiering is well understood by market participants, i.e., the banks, since they are able to determine the effective impact on their respective placements.
Finally, the staff enjoins the authorities to ensure that monetary policy has not become too easy. Surely, the monetary authorities will not allow monetary policy to be either too easy or too tight. They are firmly committed to prudent monetary policy and will employ all the instruments they have at their disposal to pre-emptively guard against inflation risks and to safeguard price stability.

Statement by Richard Murray, Executive Director for the Philippines
and Wilhelmina Mañalac, Alternate Executive Director January 19, 2007
Key Points ● The Philippines heavily focused on achieving sound public finance, an appropriate
monetary policy, a more resilient banking system, and structural reforms. ● The strong resolve to forge ahead shored up confidence in the economy which
achieved record performances in spite of external and internal shocks that occurred during the year. The Philippines managed to grow by an average of 5.4 percent for the first three quarters of 2006, with the whole year growth estimate slightly higher at 5.5 percent. Inflation has declined; the budget deficit has been dramatically reduced; reserves have reached historic levels; the exchange rate has significantly appreciated; and the stock market has remained bullish with the index at year-end recorded at its highest level since 1997.
● Sustaining macroeconomic stability and shifting growth to a higher level require
continued implementation of structural reforms. High on the agenda of the authorities are measures to further improve the fiscal, power and banking sectors. Likewise, enhancing governance practices to improve the business environment is a major feature of the reform program.
The Philippine economy reached a milestone on December 29, 2006 as it marked the independence of the country from Fund financial support after 45 years of availing itself of various Fund lending facilities. The ability to repay early reflects a stronger macroeconomy resulting from the use of prudent monetary and fiscal policies and pushing through with required reforms. Turning to the Article IV report, our authorities welcome the comprehensive review by staff as well as the productive exchange of views which paved the way for a candid assessment of the country’s economic performance and policy considerations, as well as the challenges that lie ahead. In particular, the selected issues paper substantiates that the policy moves taken by the authorities were well-advised and provides further information that could guide future decisions. The Philippine authorities are particularly appreciative of the staff advice enriched by exposure to a wide range of policy experiences.
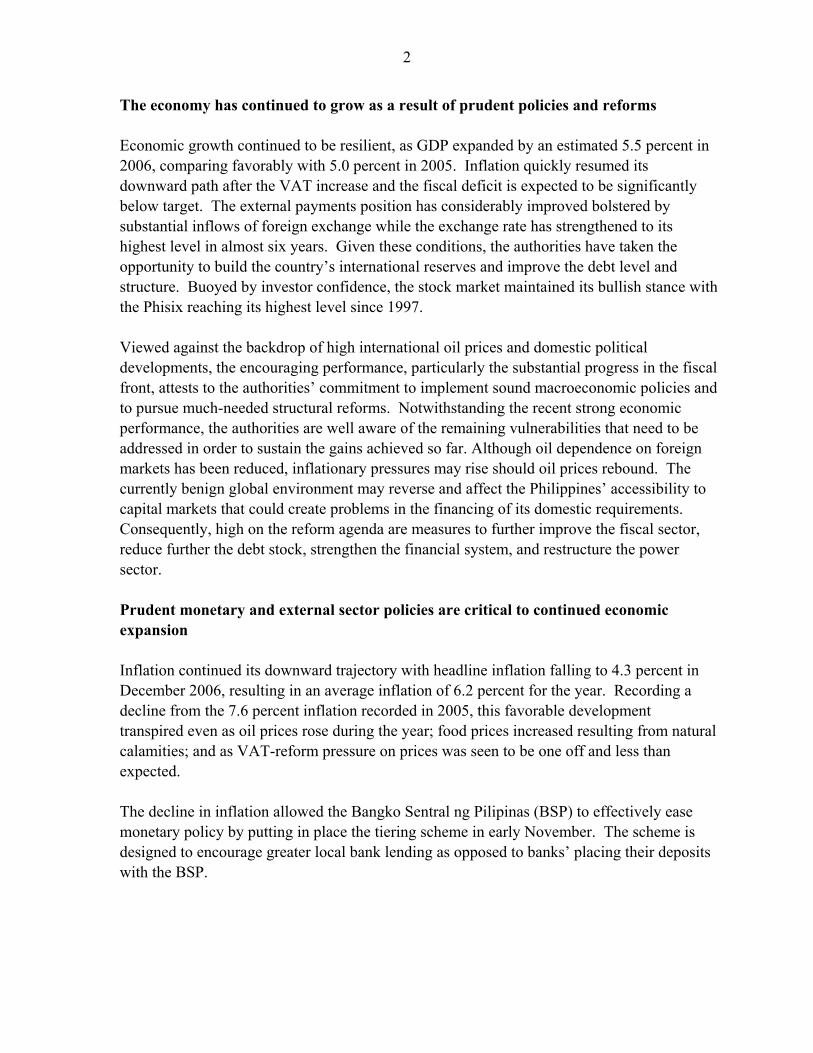
2
The economy has continued to grow as a result of prudent policies and reforms Economic growth continued to be resilient, as GDP expanded by an estimated 5.5 percent in 2006, comparing favorably with 5.0 percent in 2005. Inflation quickly resumed its downward path after the VAT increase and the fiscal deficit is expected to be significantly below target. The external payments position has considerably improved bolstered by substantial inflows of foreign exchange while the exchange rate has strengthened to its highest level in almost six years. Given these conditions, the authorities have taken the opportunity to build the country’s international reserves and improve the debt level and structure. Buoyed by investor confidence, the stock market maintained its bullish stance with the Phisix reaching its highest level since 1997. Viewed against the backdrop of high international oil prices and domestic political developments, the encouraging performance, particularly the substantial progress in the fiscal front, attests to the authorities’ commitment to implement sound macroeconomic policies and to pursue much-needed structural reforms. Notwithstanding the recent strong economic performance, the authorities are well aware of the remaining vulnerabilities that need to be addressed in order to sustain the gains achieved so far. Although oil dependence on foreign markets has been reduced, inflationary pressures may rise should oil prices rebound. The currently benign global environment may reverse and affect the Philippines’ accessibility to capital markets that could create problems in the financing of its domestic requirements. Consequently, high on the reform agenda are measures to further improve the fiscal sector, reduce further the debt stock, strengthen the financial system, and restructure the power sector. Prudent monetary and external sector policies are critical to continued economic expansion Inflation continued its downward trajectory with headline inflation falling to 4.3 percent in December 2006, resulting in an average inflation of 6.2 percent for the year. Recording a decline from the 7.6 percent inflation recorded in 2005, this favorable development transpired even as oil prices rose during the year; food prices increased resulting from natural calamities; and as VAT-reform pressure on prices was seen to be one off and less than expected. The decline in inflation allowed the Bangko Sentral ng Pilipinas (BSP) to effectively ease monetary policy by putting in place the tiering scheme in early November. The scheme is designed to encourage greater local bank lending as opposed to banks’ placing their deposits with the BSP.

3
The external sector dramatically improved, buoyed by robust remittances and strong exports, despite the 8.3 percent appreciation of the peso at the P49.03/$1 average closing rate for 2006. International reserves posted a record high at year-end, as the authorities took advantage of the favorable external environment. At approximately $23 billion, the level of reserves easily exceeded the target of $21 billion for the year. Assessed against international benchmarks, the reserve level can adequately finance 4.4 months of imports of goods and services and equivalent to 4.0 times the country’s short-term external debt based on original maturity and 2.3 times based on residual maturity. Likewise, the authorities took the opportunity to retire some of its debt, including the Brady Bonds, as well as obligations to the Fund resulting in the improvement of the country’s debt structure. The latter resulted in the Philippines’ early completion of its Post-Program Monitoring. Fiscal policy reforms continue, aimed at achieving earlier fiscal consolidation Commitment to fiscal reforms led to a better-than-programmed National Government (NG) deficit. Preliminary full year estimates of the NG deficit-to-GDP indicate a 1.03 percentage ratio, substantially surpassing the target, due to a significant increase in revenues; reduced spending considering the impasse over the 2006 budget and the delayed passage of the supplemental budget which constrained the government’s ability to implement expenditure plans; and savings in interest payments resulting from lower interest rates and volume of issuances as well as the prepayment of debt. A similar improvement was reflected in the financial position of other public sector entities leading to an improved consolidated public sector deficit. Revenues increased significantly as a result of the successful implementation of the VAT reform. Together with improvements in tax administration, the tax effort improved to an estimated 14.3 percent of GDP, which compares favorably with 13.0 percent of GDP in 2005. Measures undertaken by the authorities have been successful in cushioning the impact of the tax increase on the lower income strata of the population, as indicated by staff findings discussed in the selected issues paper. In particular, results of staff analysis based on the 2003 Family Income and Expenditure Survey suggest that the reform had a modest effect on household budgets, with the lower income households bearing a smaller share of the tax burden relative to income. A more efficient tax administration is crucial to increased revenue. Towards this end, steps taken by the authorities include cleaning the tax register and instituting a comprehensive computerization program at the Bureau of Internal Revenue (BIR) and developing an anti-tax evasion program. To implement reform in other areas, the authorities have sought the
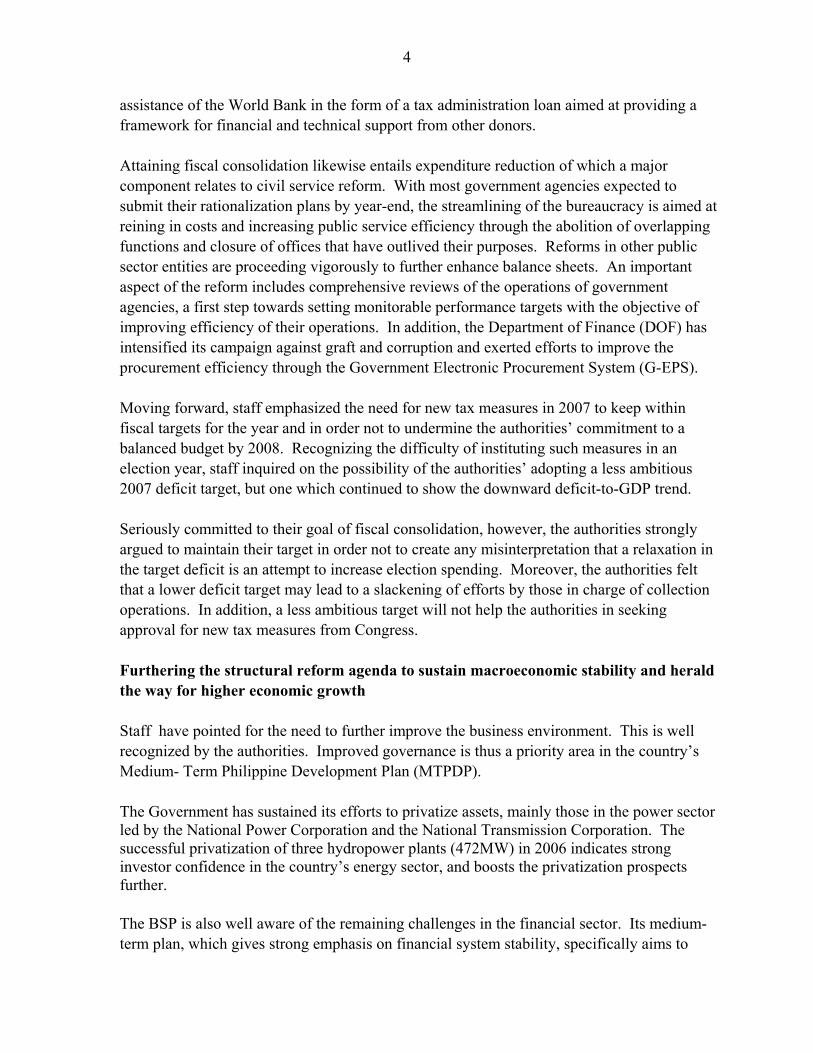
4
assistance of the World Bank in the form of a tax administration loan aimed at providing a framework for financial and technical support from other donors. Attaining fiscal consolidation likewise entails expenditure reduction of which a major component relates to civil service reform. With most government agencies expected to submit their rationalization plans by year-end, the streamlining of the bureaucracy is aimed at reining in costs and increasing public service efficiency through the abolition of overlapping functions and closure of offices that have outlived their purposes. Reforms in other public sector entities are proceeding vigorously to further enhance balance sheets. An important aspect of the reform includes comprehensive reviews of the operations of government agencies, a first step towards setting monitorable performance targets with the objective of improving efficiency of their operations. In addition, the Department of Finance (DOF) has intensified its campaign against graft and corruption and exerted efforts to improve the procurement efficiency through the Government Electronic Procurement System (G-EPS). Moving forward, staff emphasized the need for new tax measures in 2007 to keep within fiscal targets for the year and in order not to undermine the authorities’ commitment to a balanced budget by 2008. Recognizing the difficulty of instituting such measures in an election year, staff inquired on the possibility of the authorities’ adopting a less ambitious 2007 deficit target, but one which continued to show the downward deficit-to-GDP trend. Seriously committed to their goal of fiscal consolidation, however, the authorities strongly argued to maintain their target in order not to create any misinterpretation that a relaxation in the target deficit is an attempt to increase election spending. Moreover, the authorities felt that a lower deficit target may lead to a slackening of efforts by those in charge of collection operations. In addition, a less ambitious target will not help the authorities in seeking approval for new tax measures from Congress. Furthering the structural reform agenda to sustain macroeconomic stability and herald the way for higher economic growth Staff have pointed for the need to further improve the business environment. This is well recognized by the authorities. Improved governance is thus a priority area in the country’s Medium- Term Philippine Development Plan (MTPDP). The Government has sustained its efforts to privatize assets, mainly those in the power sector led by the National Power Corporation and the National Transmission Corporation. The successful privatization of three hydropower plants (472MW) in 2006 indicates strong investor confidence in the country’s energy sector, and boosts the privatization prospects further. The BSP is also well aware of the remaining challenges in the financial sector. Its medium-term plan, which gives strong emphasis on financial system stability, specifically aims to
5
develop a stronger, more efficient and less vulnerable banking system that can effectively meet the requirements of the country’s medium-term economic development program, and to foster the development of the broader financial system through a more accelerated development of the domestic capital market. To meet these twin objectives, the BSP employed a four-point strategy, under which broad initiatives include the acceleration of the adoption of risk-based supervision technology; promotion of corporate governance reform and strengthening of market discipline through better financial transparency more specifically through the adoption of the International Financial Reporting Standards (IFRS); advancement of capital market initiatives; and further improvement in the regulatory framework and its implementation, through alignment with Basel and other international standards. It has worked closely with Congress to ensure passage of legislation that addressed the high level of nonperforming assets in the financial system. It is continuing to push for amendments to the Central Bank Act to strengthen its supervisory and regulatory powers, including by providing legal protection for bank supervisors and facilitating closure of problem banks. Meanwhile, the BSP’s Monetary Board approved a liability insurance scheme for its officers and bank examiners which offers financial safeguard to BSP officials faced with lawsuits for any act committed in relation to the performance of their duties. Concluding Remarks Our authorities are strongly aware of the importance of maintaining consistency and discipline in macroeconomic policy and pursuing additional reform measures. More importantly, they are aware of the need to initiate these additional reforms promptly. Cognizant of the risks that may lie ahead, the authorities are determined more than ever to pursue what remains to be done and to see the realization of the plans mapped out in the MTPDP. Developments particularly in the first half of the year when the elections are scheduled to take place, will be a crucial test of the administration’s will to continue moving ahead. The Philippines’ early repayment of its outstanding financial obligations to the Fund has triggered the country’s exit from its post-program monitoring, four months earlier than the scheduled termination. While this ends the country’s financial dependence on Fund resources, our authorities intend to maintain a close working relationship with the Fund, particularly through the regular productive exchange of views during Article IV consultations, and Fund support to enhance technical capabilities and data systems.