international poverty comparisons on unit · pdf fileinternational poverty comparisons on unit...
TRANSCRIPT

INTERNATIONAL POVERTY COMPARISONSON UNIT RECORD DATA OF DEVELOPING AND
DEVELOPED COUNTRIES*
by
Geoffrey Lancaster Ranjan RaySchool of Economics School of Economics
University of Tasmania University of TasmaniaGPO Box 252-85 GPO Box 252-85
Hobart Tasmania 7001 Hobart Tasmania 7001Australia Australia
Tel: +61 (0)3 6226 2285 Tel: +61 (0)3 6226 2275Fax: +61 (0)3 6226 7587 Fax: +61 (0)3 6226 7587
Email: [email protected] Email: [email protected]
Written: November 1999
* Financial support provided by the Australian Research Council is, gratefully, acknowledged.

Abstract
Cross country poverty comparisons on unit records have, rarely, involved bothdeveloping and developed countries. The present study attempts to fill this gap by comparingpoverty across fourteen nations with diverse economic and demographic characteristics and atvastly different stages of economic development. The study contains evidence on (a) crosscountry variation in the equivalence scales estimated in the presence of both household sizeeconomies and adult/child relativities, (b) impact of demographic adjustment of the povertyline, that incorporate household size and composition changes, on the poverty rates, and (c)sensitivity of the poverty estimates and their rankings to the ‘relative’ versus ‘absolute’ viewof poverty. The study finds that country rankings based on per capita GNP bear very littleresemblance with that based on the aggregate poverty rates. The latter hide substantialvariation in the poverty estimates across different household types.
JEL Classifications:
C81, D63, I32, J18, O57
Keywords:
Equivalence Scales, Absolute and Relative Poverty, Economies of Household Size, Poverty Line
1
1. INTRODUCTION
With the forthcoming World Development Report, 2000/2001, focussing on ‘Poverty
and Development’, the subject is back on the main agenda of the World Bank and other
multilateral agencies. The increasing availability, in recent years, of high quality micro
expenditure data sets, in their original unit record form, has made possible meaningful cross
country comparisons of poverty. Such comparisons are useful in keeping the poverty
dimensions of a particular country in an international perspective. However, they also raise
the issue of sensitivity of the poverty estimates and the poverty rankings to the poverty line
used in making the comparisons. Broadly, two approaches have been used in the construction
of poverty lines in cross national poverty comparisons. These are based on (a) the concept of
“relative poverty” which sets the poverty line at a constant fraction of the median of the
country sample, and (b) the concept of “absolute poverty” which sets country specific poverty
lines based on the “subsistence expenditure” in the country concerned and denominated in
that country’s currency. If such information is not available for a particular country, the PPP
based local currency equivalent of per capita US $1 a day has been used.
Not surprisingly, there exists a large literature on cross national poverty comparisons.
Example include Buhmann, et al (1988), Ravallion, et al (1991), Hanratty and Blank (1990)
and Blackburn (1998). Of these, while the study by Ravallion, et al (1991) deals only with
developing countries, the others are restricted to developed countries. The present study
extends these poverty comparisons to include simultaneously both developing and developed
countries. The data sets involve countries spanning a wider range in the spectrum of economic
development than considered in most previous studies. We build on our earlier study
[Lancaster, et al (1999a)] and extend it in, principally, three respects. First, we augment the
earlier data sets by including, in the poverty comparisons, three additional countries at
opposite ends of the spectrum of economic development. Second, unlike before, we calculate
2
and report the poverty estimates under both the “relative” and the “absolute” view of poverty,
and examine the sensitivity of the poverty rankings between them. In constructing poverty
lines, based on the “absolute” view of subsistence expenditure, we depart from the
conventional use of the US$1 (per capita) a day figure in case of several countries, and base
the poverty calculations on the local currency denominated poverty lines. Third, instead of
assuming identical equivalence scales across countries in adjusting for differences in family
size and composition in the poverty calculations, we estimate equivalence scales separately
for each of the fourteen countries considered in this study. In doing so, we depart from the
framework of Lanjouw and Ravallion (1995), Dreze and Srinivasan (1997), Lancaster, et al
(1999a, 1999b) in allowing for the simultaneous presence of adult/child relativities and
economies of household size in the estimation of the equivalence scales. As we report later,
the equivalence scales vary widely across countries, consistent with the evidence of Phipps
and Garner (1994) and Lancaster, et al (1999b).
To focus our minds more concretely on the principal features of this study, let us list
below the substantive questions that we seek to answer.
1) Is there much variation across countries in the estimated equivalence scales?
2) How do the poverty estimates and the poverty rankings of countries vary between the‘per capita’ case which assigns identical weights to adults and children, and one wherenon identical needs between them are recognised via use of the estimated equivalencescales?
3) How do the poverty estimates and the poverty rankings of countries vary acrosshousehold types that differ in their size and composition?
4) Are the cross national poverty comparisons sensitive to the ‘relative’ or ‘absolute’view of poverty that one adopts in setting the poverty line?
The remainder of this paper is as follows. Section 2 describes the empirical
methodology including the poverty line demographic adjustment needed to incorporate the
economies of household size and adult/child relativities via the estimated equivalence scales.
The data is described and its principal features are discussed in Section 3. Section 4 contains
the results. We end on the concluding note of Section 5.
3
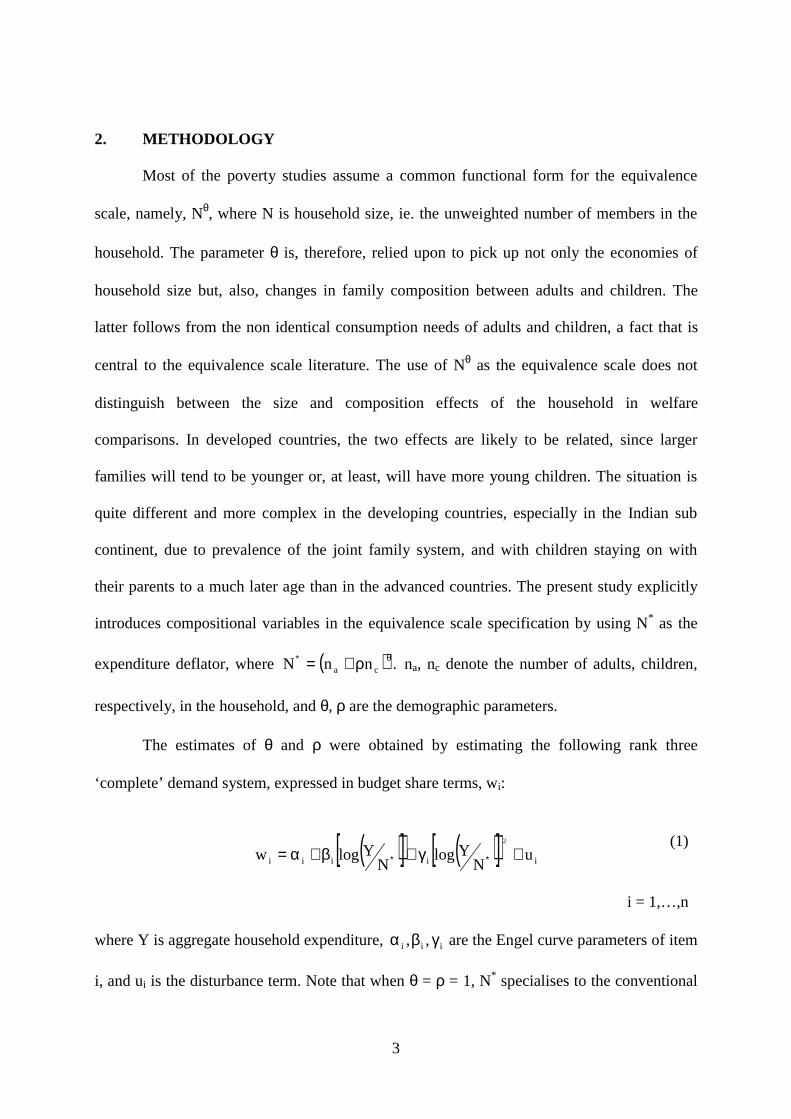
2. METHODOLOGY
Most of the poverty studies assume a common functional form for the equivalence
scale, namely, Nθ, where N is household size, ie. the unweighted number of members in the
household. The parameter θ is, therefore, relied upon to pick up not only the economies of
household size but, also, changes in family composition between adults and children. The
latter follows from the non identical consumption needs of adults and children, a fact that is
central to the equivalence scale literature. The use of Nθ as the equivalence scale does not
distinguish between the size and composition effects of the household in welfare
comparisons. In developed countries, the two effects are likely to be related, since larger
families will tend to be younger or, at least, will have more young children. The situation is
quite different and more complex in the developing countries, especially in the Indian sub
continent, due to prevalence of the joint family system, and with children staying on with
their parents to a much later age than in the advanced countries. The present study explicitly
introduces compositional variables in the equivalence scale specification by using N* as the
expenditure deflator, where ( ) .nnN caθ∗ ρ+= na, nc denote the number of adults, children,
respectively, in the household, and θ, ρ are the demographic parameters.
The estimates of θ and ρ were obtained by estimating the following rank three
‘complete’ demand system, expressed in budget share terms, wi:
( )[ ] ( )[ ] i
iiii uN
YlogN
Ylogw2
+γ+β+α= ∗∗
(1)
i = 1,…,n
where Y is aggregate household expenditure, iii ,, γβα are the Engel curve parameters of item
i, and ui is the disturbance term. Note that when θ = ρ = 1, N* specialises to the conventional

4
treatment of household size as simply the number of members in the household. The
equivalence scale parameters (θ,ρ) were estimated for each of the fourteen countries,
considered here, on a five item disaggregation of consumer expenditure, namely, Food,
Medical Items, Clothing, Fuel and Power, and Others. For reasons of space, we report later
only the estimates of the overall equivalence scales for each country, not those of the scale
parameters (θ,ρ). It is, however, worth reporting that, in nearly all the country cases, the
estimates of θ and ρ were well determined, and that the restrictions θ = 1, ρ = 1 were
individually and jointly rejected almost everywhere.
Using the estimates of θ, ρ for each country, the demographically adjusted poverty
lines were obtained by multiplying the per capita poverty line, PL, by N*. In other words, a
household with na adults and nc children is considered ‘poor’ if its aggregate expenditure is
less than ( ) .nnPL caθρ+
3. DATA DESCRIPTION
Table 1 contains a list of the fourteen countries that provided the data base for this
study. The data sets for Pakistan, Tanzania, South Africa, Jamaica, Russia, Bulgaria, Ghana
and Peru came from the Living Standards Measurement Study (LSMS) of the World Bank.1
The Indian data was taken from the fiftieth round (1993/94) of the National Sample Survey
(NSS) for the whole country involving separate and comprehensive coverage of rural and
urban areas. The Philippine data came from the Family Income and Expenditure Survey
(FIES) conducted by the Philippines National Statistics Office from February 1988 to January
1989. The Thai data came from the 1988 Socio Economic Survey (SES) conducted by the
National Statistics Office of Thailand from February, 1988 to January, 1989. The Australian
data came from the 1993-94 Household Expenditure Survey (HES) published by the
1 See Grosh and Glewwe (1995) for a general description of the LSMS data sets.
5
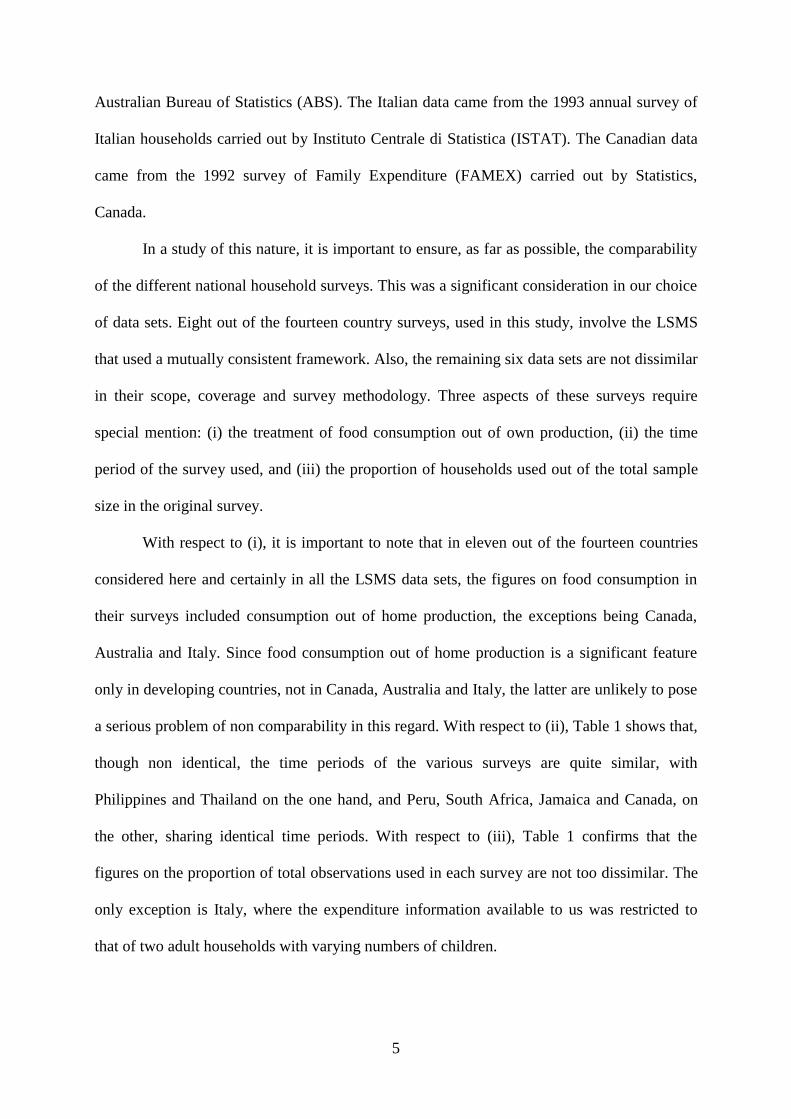
Australian Bureau of Statistics (ABS). The Italian data came from the 1993 annual survey of
Italian households carried out by Instituto Centrale di Statistica (ISTAT). The Canadian data
came from the 1992 survey of Family Expenditure (FAMEX) carried out by Statistics,
Canada.
In a study of this nature, it is important to ensure, as far as possible, the comparability
of the different national household surveys. This was a significant consideration in our choice
of data sets. Eight out of the fourteen country surveys, used in this study, involve the LSMS
that used a mutually consistent framework. Also, the remaining six data sets are not dissimilar
in their scope, coverage and survey methodology. Three aspects of these surveys require
special mention: (i) the treatment of food consumption out of own production, (ii) the time
period of the survey used, and (iii) the proportion of households used out of the total sample
size in the original survey.
With respect to (i), it is important to note that in eleven out of the fourteen countries
considered here and certainly in all the LSMS data sets, the figures on food consumption in
their surveys included consumption out of home production, the exceptions being Canada,
Australia and Italy. Since food consumption out of home production is a significant feature
only in developing countries, not in Canada, Australia and Italy, the latter are unlikely to pose
a serious problem of non comparability in this regard. With respect to (ii), Table 1 shows that,
though non identical, the time periods of the various surveys are quite similar, with
Philippines and Thailand on the one hand, and Peru, South Africa, Jamaica and Canada, on
the other, sharing identical time periods. With respect to (iii), Table 1 confirms that the
figures on the proportion of total observations used in each survey are not too dissimilar. The
only exception is Italy, where the expenditure information available to us was restricted to
that of two adult households with varying numbers of children.

6
Table 2 contains the sample means of the key variables of interest for the fourteen
countries. We arranged the countries in decreasing order of magnitude of their per capita
GNP. The population and per capita GNP figures show that the chosen countries span a wide
range in the spectrum of economic development. On per capita GNP, Canada is the richest
country, Tanzania the poorest in our sample. In terms of population, Jamaica is the smallest
country with only two million people, a population level that is less than 0.25% of India’s
population of 884 million people. In terms of geographical coverage, these fourteen countries
span virtually every corner of the globe, from North America (Canada) and South America
(Peru, Jamaica) through Europe (Italy, Bulgaria, Russia) and Africa (South Africa, Tanzania
and Ghana), then South Asia (India, Pakistan) and South East Asia (Thailand and
Philippines), and, finally, to Australia.
Table 2, also, contains information on the mean number of adults and children in the
various country samples. Pakistan has the highest number of both adults and children per
household, a feature that reflects both the prevalence of the joint family system in South Asia
and religious/cultural practices that inhibit implementation of birth control. The affluent
countries, especially Canada, register smaller sized households, in both the number of adults
and children, than the poorer countries. It is interesting to note that the African countries,
Tanzania and Ghana, have more children than adults in their “average household” in sharp
contrast to that in the Asian countries. Tables 1, 2 confirm that the chosen countries span a
wide range in terms of their geographical location, economic advancement and demographic
characteristics.
While the “relative poverty” rates were based on use of half the sample median of the
distribution of per adult equivalent expenditures as the poverty line2, the “absolute poverty”
rates required prior calculation of country specific poverty lines from available information on
2 This practice is quite widespread in the poverty literature – see Buhmann, et al (1988), Coulter, et al (1992),and Blackburn (1998) for examples of studies which use half median as the poverty line.

7
subsistence expenditures. In case of the developed countries in our sample, namely, Canada
and Italy, the poverty line was set at the per capita figure of $5479 (in 1985 US dollars) used
in the Blackburn (1998) study. The Australian poverty line was set at the figure originally
fixed by the Henderson poverty inquiry for the September quarter, 1973 and updated to the
time period of the ABS Household Expenditure Survey by the Melbourne Institute of Applied
Economic and Social Research. The South African poverty line was fixed at Rand 237.00 per
month, a figure that has been used recently in Carter and May (1999). The Indian poverty line
was obtained from State specific information on subsistence expenditures contained in Dubey
and Gangopadhyay (1998). The Philippine poverty line was constructed from information on
subsistence expenditure published by the National Statistics Office (NSO). The Jamaican
poverty line was based on information contained in Ezemenari and Subbarao (1999, p.16). In
the absence of exact or approximate information on subsistence expenditure in the other
countries, the conventional figure of US$1 per capita per day, in 1985 international prices and
converted into local currency using PPP rates, was used to set poverty lines in Ghana,
Tanzania, Pakistan, Peru and Thailand.
4. RESULTS
Table 3 reports the estimated equivalence scales for the different household types in
the various countries, obtained using full information maximum likelihood estimation of the
complete demand system [equation (1)]. As we faced convergence problems in our demand
estimation on the Bulgarian data, we used the Russian equivalence scales in the poverty
calculations for Bulgaria. Table 3 shows wide variation in the estimated equivalence scales,
thus, suggesting that child costs3 do vary widely across countries, a fact that needs to be
recognised in the poverty calculations. A child cost varies between the low of 20% of an adult
3 See, however, Pollak and Wales (1979) for difficulties with this interpretation.

8
in Russia and the high of 78% in Peru. The affluent countries, especially Canada, have lower
equivalence scales than the others, especially Peru and Philippines, which are at the other end
of the development spectrum.
Table 4 presents the ‘relative poverty’ rates calculated, using the head count measure,
under (a) per capita consumption, ie. assuming identical weights for the adult and the child
( )1=θ=ρ , and (b) demographic adjustment for differences in household composition using
the country specific equivalence scale estimates reported in Table 3. The figures in
parenthesis indicate the poverty rankings of the countries in the alternative cases. Table 4,
also, reports the household poverty rates for selected household types. Note, incidentally, that
the countries in Table 4 have been arranged in decreasing order of their per capita GNP in
1992 $.
The following features are worth noting.
(i) The adjustments for household composition changes via use of the estimatedequivalence scales, generally, leads to a decline in the household poverty rates, withthe magnitude of revision varying between countries. The notable exceptions areRussia and Bulgaria which witness an increase in the poverty rates on the introductionof non identical weights between adults and children. However, the poverty rankingsappear quite insensitive to the use of equivalence scales.
(ii) The aggregate poverty rates hide substantial variation in the poverty estimates andtheir rankings between different household types. The countries do not, however,reveal a consistent picture in regard to the nature of this variation. Single adulthouseholds, generally, display greater poverty than two adult households. The additionof children to two adult households leads to a sharp fall in the poverty rates in India,Bulgaria and Russia. Not all countries share this experience, however, with, forexample, South Africa going in the opposite direction. Consequently, India, Bulgariaand Russia improve their poverty rankings on the addition of children to thehousehold. In contrast, South Africa slips down the poverty ladder quite sharply as wemove from single adult and childless couple households to those with two or morechildren. The South African experience seems quite unique in this regard. Onepossible explanation lies in the fact that the majority blacks, who are relativelydeprived and have larger households4, dominate the latter demographic categories,unlike the former. Consequently, increasing household size leads to a sharp increase inpoverty in South Africa and a rapid deterioration in its poverty ranking. The highsensitivity of the poverty estimates and poverty rankings to household size andcomposition underlines the need for a disaggregated analysis, since the aggregatepoverty rates may yield a misleading picture on poverty.
4 See Ray (1999, Table 2) for more detailed evidence on the issue of household size and poverty in South Africa.

9
(iii) The picture on “relative poverty”, depicted in Table 4, reflects the inequality in a givensociety. Consequently, India, Pakistan and Bulgaria register lower poverty than isimplied by their per capita GNP. In contrast, South Africa, notwithstanding itsaffluence, registers one of the highest poverty rates – a consequence of it being one ofthe most unequal countries in the world [see World Development Report (1994)]. Thesame comment applies to another unequal but affluent country Australia, whichregisters much higher poverty rates than India and Pakistan.
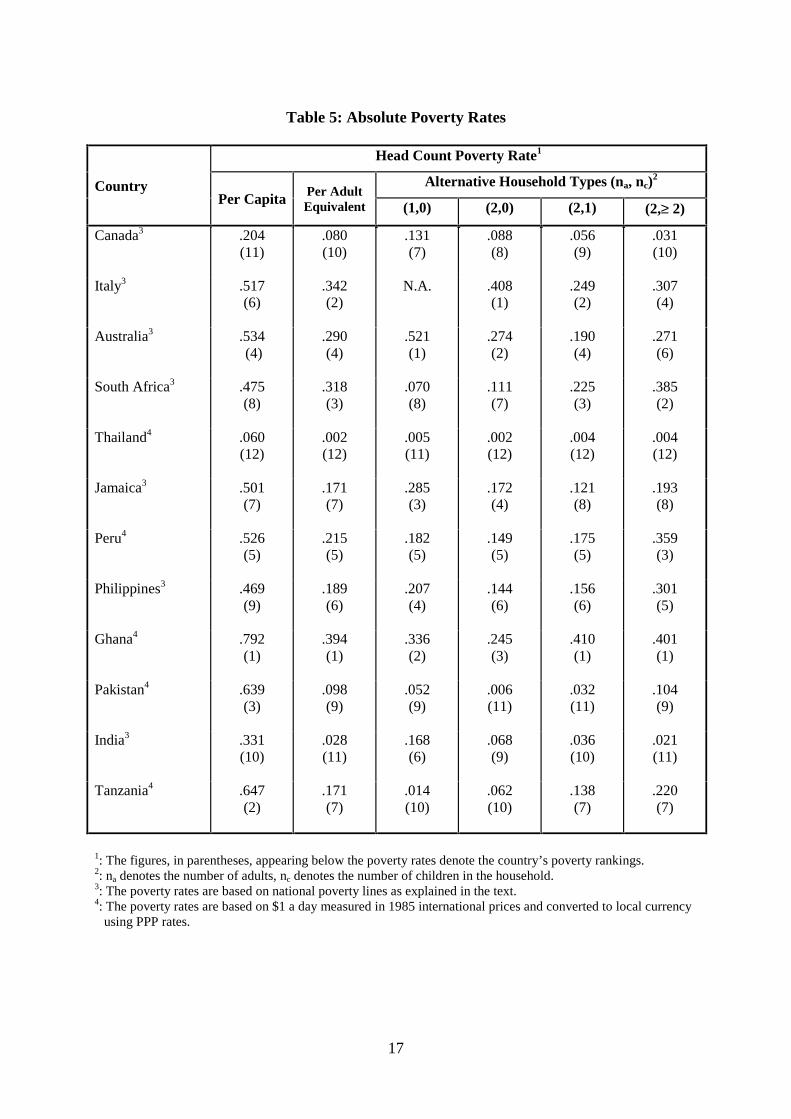
Let us now turn to the absolute poverty rates presented in Table 5. This table also
provides evidence on the variation of the absolute poverty rates with household composition.
As we mentioned earlier, we did not calculate the absolute poverty rates for Bulgaria or
Russia due to insufficient information for calculating local currency denominated subsistence
expenditure in these countries. The following features of Table 5 are worth noting.
i) A comparison of the “per capita” and the “per adult equivalent” poverty rates showsthat the demographic adjustments to the poverty line to incorporate household size andcomposition changes lead to a sharp reduction in the absolute poverty rates in allcountries. It is interesting to note from a comparison of Tables 4 and 5 that thedemographic adjustment leads to a much sharper reduction in the absolute povertyrates than in the relative poverty rates. For example, use of the estimated countryspecific equivalence scales has little impact on the relative poverty rates in the affluentcountries, Canada, Italy and Australia (see Table 4), but leads to a sharp reduction inthe absolute poverty rates in these countries (see Table 5). The magnitude of revisionvaries so widely in Table 5 that several countries witness a large change in theirpoverty rankings. For example, while Pakistan with its large household size (see Table2) improves its poverty rankings, Italy worsens her poverty rankings on the use of theestimated equivalence scales to demographically adjust the poverty lines. In general,there is a tendency for the more affluent countries with smaller household sizes, to slipin the poverty rankings due to their inability to take advantage of economies ofhousehold size and/or lower consumption needs of children vis a vis adults.
ii) As in case of the relative poverty rates, the single adult households generally displayhigher absolute poverty rates than two adult households. Australia stands out in thisrespect since its single adult households register the highest poverty rate among thegroup of countries considered in this exercise. At the other end of the demographicspectrum, namely, for two adult households with two or more children, South Africaregisters one of the highest absolute poverty rates, consistent with the evidencecontained in Table 4, and the explanation provided earlier. In contrast, India andPakistan do quite well in these larger household categories.
iii) There appears to be very little association between a country’s overall affluence, asreflected in its per capita GNP, and its poverty estimates and rankings. For example,India and Pakistan do much better, Australia does much worse than is implied by theirper capita GNP figures (see Table 2). The expenditure based poverty rates for Canada,Italy and Australia, reported in Table 5, are in line with the income based poverty ratesfor these countries presented in Blackburn (1998, Table 6). Further confidence in theexpenditure data sets, used here, stems from the fact that the poverty rates for the
10
developing countries, reported in Table 5, compare favourably with those presented inthe 1999 World Development Indicators (see Table 2.7), published by The WorldBank. From a policy viewpoint, it is important to note from Table 5 the high level of“absolute” poverty that exists in the high income countries, Italy, Australia and SouthAfrica. Canada, on one extreme, and Ghana on the other are the only countries whosepoverty estimates and poverty rankings are consistent with their overall affluence andstate of economic development.
Table 6 compares the relative and absolute poverty rates, under alternative values of
α, the “poverty aversion” parameter in the poverty measure due to Foster, Greer and
Thorbecke (1984). The absolute poverty rates generally exceed the relative poverty rates, the
significant exceptions being Thailand and India. The estimates and country rankings are quite
sensitive between the relative and absolute poverty rates. This is reflected in the estimated
magnitudes of rank correlation, presented in Table 6, which are significantly different form
unity at the one percent significance level.
Unlike the nutritionally determined poverty lines used for some developing countries
in this study, namely, Jamaica, Philippines and India, there is an element of arbitrariness in
the conventional figure of $1 a day that we have used for others. Table 7 provides evidence on
the sensitivity of the poverty estimates to variation in the poverty line by presenting the
corresponding poverty rates under $1.5, $2 (in 1985 international prices) a day. The rankings
display only a limited amount of sensitivity to the poverty line. Thailand and Ghana are at the
opposite extremes in the poverty rankings, regardless of the dollar figure used as the poverty
line. Moreover, unlike in Table 4 or Table 5, which include a larger group of countries with a
wider range of affluence, expenditure and demographic characteristics, Table 7 displays
hardly any sensitivity in the poverty rankings between the “per capita” and the “per adult
equivalent” expenditure based poverty estimates. In other words, notwithstanding the sharp
fall in the poverty estimates due to incorporation of household size economies and adult/child
relativities, the poverty rankings hardly change among this narrower and, demographically,
more homogeneous group of developing countries. The Philippines estimates show that the
11
$1.5 a day poverty line yields poverty rates that are not far from comparable figures (see
Table 5) obtained using the nutritionally determined poverty line based on minimum calorie
needs as determined by the Philippines National Statistics Office.
5. CONCLUSION
With the increasing availability of high quality micro data sets across a range of
developing and developed countries, the literature on cross country poverty comparisons has
expanded quite rapidly in recent years. Most of these poverty comparisons have either
focussed exclusively on developing countries [eg. Ravallion, et al (1991)] or on developed
countries [eg. Blackburn (1998)]. There exists, however, only limited evidence on poverty
comparisons involving both developing and developed countries, especially on unit record
expenditure data sets. With uneven growth and development in the last couple of decades
both within and between countries, and with some developing countries recording growth
rates that are much higher than in the developed countries, the traditional distinction between
“rich” and “poor” countries has now lost much of its earlier significance. While large sections
of the population in the rich countries live in destitution and poverty, many in the less
developed countries enjoy levels of affluence that are inconsistent with their residence in
‘poor’ countries.
This has prompted the need to expand the earlier cross country investigations of
poverty to cover a wider range of countries in the spectrum of economic development and
with vastly different demographic characteristics. That was one of the principal motivations
of this study. An earlier attempt was made in Lancaster, Ray and Valenzuela (1999a). The
present study extends the earlier exercise in, principally, three respects:
i) it uses an augmented collection of countries and their unit records covering a widerrange of affluence and demographic characteristics;

12
ii) unlike before, it bases the poverty comparisons on a set of country specificequivalence scales that are estimated within a framework that simultaneously allowsboth household size economies and adult/child relativities in the estimation; and
iii) it investigates the sensitivity of the poverty estimates between the “relative” and“absolute” view of poverty.
Neither (ii) nor (iii) has been attempted before over such an economically and
demographically diverse group of countries. With large number of households in the
developed countries experiencing lower living standards than the affluent elite in the
developing countries, the issue of ‘relative’ versus ‘absolute’ poverty has taken on a special
policy significance in cross country poverty comparisons.
The principal results can be summarised as follows:
i) The equivalence scales vary widely, though not systematically, across countries. Thisreflects cross country differences in the adult/child relativities, and, also, largevariation in the estimated economies of household size. The equivalence scaleliterature has, usually, not distinguished between the two. The present results point tothe need to allow both in the estimation of the equivalence scales that are subsequentlyused in the poverty calculations.
ii) The incorporation of household composition changes in the poverty calculations, viause of the estimated equivalence scales, generally, leads to a decline in the householdpoverty rates from the “per capita” case which assumes identical weights for adultsand children and absence of household size economies. The magnitude of thedownward revision is much larger in case of the “absolute poverty” rates than for the“relative poverty” rates. There is a tendency for the more affluent countries withsmaller sized households to slip in the absolute poverty rankings due to their inabilityto take advantage of household size economies and/or lower consumption needs ofchildren vis a vis adults.
iii) There is not much association between the per capita GNP and poverty rankings of thevarious countries. For example, Australia and Italy have poverty rates which areinconsistent with their status as “rich” countries. In case of single adult households,Australia has the highest “absolute” poverty rate among the group of countriesconsidered in this study. Note, incidentally, that the Australian poverty estimates areremarkably similar between the Henderson poverty line used here and those obtainedby using the poverty line employed in case of the other developed countries (Canada,Italy). South Africa has one of the highest poverty rates, in both “absolute” and“relative” sense of poverty, in case of two adult households with two or more children.The aggregate poverty rates hide wide variation in the poverty estimates acrossdifferent household types.
iv) The “absolute” poverty rates generally exceed the “relative poverty” rates in mostcountries. The magnitude of revision varies widely between the countries and,consequently, the rank correlation magnitudes establish sensitivity of the povertyrankings to the “relative” or “absolute” view one takes of poverty.

13
Cross country comparisons of poverty, especially of “absolute” poverty, suffer from
the arbitrariness involved in setting poverty lines. The present study is no exception, our task
not made any easier by the complete lack of any information on poverty lines in many
developing countries. We have attempted to improve over earlier attempts by using local
currency denominated poverty lines for countries where such information is available, as in
the case of India, Jamaica, South Africa, Australia and Philippines. In case of other
developing countries, where no such information was available, we investigated the
robustness of our findings by experimenting with alternative poverty lines. What our
experience does underline, however, is the need to embark on an international project aimed
at providing local currency denominated poverty lines based on a common definition of
“subsistence” expenditure. Such information will provide a valuable basis for extending the
present study to involve a still wider group of developing and developed countries.

14
Table 1: Relevant Details of Unit Records Used
TotalSample Size
Total Estimating Sampleof HouseholdsCountry Title/Source of Unit Record
Year ofSurvey
(no. of H’holds) No. %India National Sample Survey of Rural India (NSSO) 1993/1994 68,102 61,835 91%
Philippines Family Income and Expenditure Survey, NSO (Phil) 1988/1989 18,500 14,006 76%
Thailand Socio Economic Survey, NSO (Thld) 1988/1989 11,500 10,940 95%
Pakistan Living Standards Measurement Study, WB 1991 4,793 4,793 100%
Italy Annual Expenditure Survey, ISTAT 1993 35,000 16,383 47%
Australia Household Expenditure Survey, ABS 1993/1994 7,225 7,218 99%
Canada Family Expenditure Survey, Statistics Canada 1992 9,492 9,488 99%
Tanzania Living Standards Measurement Study, WB 1993/1994 5,184 4,940 95%
Peru Living Standards Measurement Study, WB 1994 3,624 3,621 99%
South Africa Living Standards Measurement Study, WB 1994 8.848 8,777 99%
Jamaica Living Standards Measurement Study, WB 1994 1,943 1,940 99%
Russia Living Standards Measurement Study, WB 1996 3,555 3,555 100%
Ghana Living Standards Measurement Study, WB 1989 3,157 3,155 99%
Bulgaria Living Standards Measurement Study, WB 1995 2,468 2,468 100%
Note: NSO – National Statistics OfficeISTAT – Instituto Centrale di StatisticaNSSO – National Sample Survey OrganisationABS – Australia Bureau of StatisticsWB – World Bank

15
Table 2: Sample Means of Key Variables
Country Total Population(1000s)
Per Capita GNP(1992$)
Number ofAdults
Number ofChildren
Canada 27400 20710 2.04 0.62
Italy 57809 20460 2.00 0.88
Australia 17483 17260 1.94 0.74
South Africa 39766 2670 2.80 2.13
Russia 148000 2510 2.10 0.72
Thailand 57992 1840 2.47 1.42
Jamaica 2376 1340 2.25 1.54
Bulgaria 8500 1330 2.37 0.47
Peru 22370 950 3.00 2.33
Philippines 64259 770 3.21 2.09
Ghana 15800 450 2.15 2.52
Pakistan 119000 420 3.69 3.83
India 884000 310 3.29 1.89
Tanzania 25000 110 2.69 3.02
Note: The figures for total population and per capita GNP are taken from the 1994 World Development Report.
Table 3: Equivalence Scales
Household Composition (na, nc)1
Country(1,0) (1,1) (1,2) (1,3) (1,4) (2,1) (2,2) (2,3) (2,4)
Canada 1.0 1.23 1.44 1.64 1.83 1.83 2.02 2.19 2.37
Italy 1.0 1.26 1.53 1.79 2.06 2.26 2.53 2.79 3.06
Australia 1.0 1.35 1.66 1.95 2.22 1.93 2.20 2.46 2.71
South Africa 1.0 1.77 2.39 2.93 3.42 2.22 2.78 3.29 3.76
Russia 1.0 1.20 1.44 1.72 2.06 1.36 1.63 1.96 2.34
Thailand 1.0 1.41 1.75 2.05 2.33 1.84 2.13 2.40 2.65
Jamaica 1.0 1.55 1.87 2.11 2.31 1.69 1.97 2.19 2.38
Bulgaria 1.0 1.20 1.44 1.72 2.06 1.36 1.63 1.96 2.34
Peru 1.0 1.78 2.24 2.59 2.89 1.95 2.36 2.69 2.98
Philippines 1.0 1.70 2.26 2.75 3.18 2.13 2.63 3.08 3.49
Ghana 1.0 1.55 1.86 2.10 2.29 1.68 1.96 2.17 2.35
Pakistan 1.0 1.42 1.73 1.99 2.22 1.71 1.97 2.20 2.41
India 1.0 1.33 1.62 1.89 2.13 1.82 2.06 2.30 2.51
Tanzania 1.0 1.51 1.82 2.05 2.24 1.66 1.93 2.14 2.321: na denotes the number of adults, nc denotes the number of children in the household.

16
Table 4: Relative Poverty Rates
Head Count Poverty Rate1
Alternative Household Types (na, nc)2
CountryPer Capita Per Adult
Equivalent (1,0) (2,0) (2,1) (2,≥ 2)
Canada 0.071(13)
0.072(13)
0.107(10)
0.088(11)
0.049(12)
0.029(13)
Italy 0.077(11)
0.075(12)
N.A. 0.113(5)
0.032(13)
0.045(12)
Australia 0.106(9)
0.104(10)
0.209(6)
0.099(8)
0.051(11)
0.056(10)
South Africa 0.264(1)
0.235(1)
0.040(12)
0.065(13)
0.144(3)
0.303(2)
Russia 0.197(3)
0.224(2)
0.501(1)
0.281(1)
0.100(6)
0.072(9)
Thailand 0.184(4)
0.154(4)
0.083(11)
0.095(10)
0.161(1)
0.198(4)
Jamaica 0.166(5)
0.148(5)
0.255(5)
0.147(3)
0.113(5)
0.169(6)
Bulgaria 0.074(12)
0.122(8)
0.366(2)
0.111(6)
0.007(14)
0.005(14)
Peru 0.201(2)
0.201(3)
0.182(7)
0.149(2)
0.160(2)
0.336(1)
Philippines 0.141(8)
0.129(7)
0.160(8)
0.098(9)
0.097(7)
0.209(3)
Ghana 0.148(7)
0.121(9)
0.133(9)
0.068(12)
0.095(9)
0.103(8)
Pakistan 0.105(10)
0.095(11)
0.276(3)
0.102(7)
0.129(4)
0.120(7)
India 0.056(14)
0.062(14)
0.271(4)
0.141(4)
0.089(10)
0.055(11)
Tanzania 0.158(6)
0.134(6)
0.000(13)
0.047(14)
0.095(8)
0.175(5)
1: The figures, in parentheses, appearing below the poverty rates denote the country’s poverty rankings.2: na denotes the number of adults, nc denotes the number of children in the household.
17
Table 5: Absolute Poverty Rates
Head Count Poverty Rate1
Alternative Household Types (na, nc)2
CountryPer Capita Per Adult
Equivalent (1,0) (2,0) (2,1) (2,≥ 2)
Canada3 .204(11)
.080(10)
.131(7)
.088(8)
.056(9)
.031(10)
Italy3 .517(6)
.342(2)
N.A. .408(1)
.249(2)
.307(4)
Australia3 .534 (4)
.290(4)
.521(1)
.274(2)
.190(4)
.271(6)
South Africa3 .475(8)
.318(3)
.070(8)
.111(7)
.225(3)
.385(2)
Thailand4 .060(12)
.002(12)
.005(11)
.002(12)
.004(12)
.004(12)
Jamaica3 .501(7)
.171(7)
.285(3)
.172(4)
.121(8)
.193(8)
Peru4 .526(5)
.215(5)
.182(5)
.149(5)
.175(5)
.359(3)
Philippines3 .469(9)
.189(6)
.207(4)
.144(6)
.156(6)
.301(5)
Ghana4 .792(1)
.394(1)
.336(2)
.245(3)
.410(1)
.401(1)
Pakistan4 .639(3)
.098(9)
.052(9)
.006(11)
.032(11)
.104(9)
India3 .331(10)
.028(11)
.168(6)
.068(9)
.036(10)
.021(11)
Tanzania4 .647(2)
.171(7)
.014(10)
.062(10)
.138(7)
.220(7)
1: The figures, in parentheses, appearing below the poverty rates denote the country’s poverty rankings.2: na denotes the number of adults, nc denotes the number of children in the household.3: The poverty rates are based on national poverty lines as explained in the text.4: The poverty rates are based on $1 a day measured in 1985 international prices and converted to local currency
using PPP rates.

18
Table 6: Comparison of Relative and Absolute Poverty Rates1
(Per Adult Equivalent)
α = 02 α = 1 α = 2Country
Relative3 Absolute3 Relative3 Absolute3 Relative3 Absolute3
Canada 0.072(11)
.080(10)
.011(11)
.014(10)
.003(12)
.004(10)
Italy 0.075(10)
.342(2)
.014(10)
.087(3)
.004(10)
.032(4)
Australia 0.104 (8)
.290(4)
.024(8)
.080(4)
.008(8)
.032(3)
South Africa 0.235(1)
.318(3)
.079(1)
.118(2)
.037(1)
.059(1)
Thailand 0.154(3)
.002(12)
.035(4)
.000(12)
.012(4)
.000(12)
Jamaica 0.148(4)
.171(8)
.047(3)
.053(6)
.021(3)
.024(6)
Peru 0.201(2)
.215(5)
.062(2)
.067(5)
.027(2)
.030(5)
Philippines 0.129(6)
.189(6)
.028(7)
.044(7)
.009(6)
.016(7)
Ghana 0.121(7)
.394(1)
.030(5)
.123(1)
.012(4)
.054(2)
Pakistan 0.095(9)
.098(9)
.022(9)
.023(9)
.008(8)
.009(9)
India 0.062(12)
.028(11)
.011(11)
.005(11)
.004(10)
.002(11)
Tanzania 0.134(5)
.171(7)
.030(5)
.040(8)
.009(6)
.014(8)
Rank Correlation
(Standard Error)-.080(.300)
-.15(.300)
-.14(.300)
1: The poverty rates are calculated using the poverty measure due to Foster, Greer and Thorbecke (1984) with αdenoting “poverty aversion”.
2: These (α = 0) coincide with the head count poverty rates.3: The figures in brackets, appearing below the poverty rates, denote the poverty rankings.

19
Table 7: Absolute Poverty Rates (Head Count) of Selected Countries1
Under Alternative International Poverty Lines
$1 a day $1.5 a day $2 a day
CountryPer Capita Per Adult
Equivalent Per Capita Per AdultEquivalent Per Capita Per Adult
Equivalent
Thailand .060(6)
.002(6)
.187(6)
.021(6)
.314(6)
.068(6)
Peru .526(4)
.215(2)
.711(4)
.384(2)
.824(4)
.517(3)
Philippines .257(5)
.053(5)
.480(5)
.196(5)
.627(5)
.354(5)
Ghana .792(1)
.394(1)
.901(1)
.681(1)
.951(1)
.841(1)
Pakistan .639(3)
.098(4)
.794(3)
.300(4)
.864(3)
.486(4)
Tanzania .647(2)
.171(3)
.814(2)
.376(3)
.892(2)
.543(2)
1: The figures, in parentheses, appearing below the poverty rates denote the country’s poverty rankings.
20
REFERENCES
Blackburn, M.L. (1998), “The Sensitivity of International Poverty Comparisons”, Review ofIncome and Wealth, 44(4), 449-472.
Buhmann, B., Rainwater, L., Schmaus, G. and T. Smeeding (1988), “Equivalence Scales,Well-Being, Inequality and Poverty: Sensitivity Estimates Across Ten CountriesUsing the Luxembourg Income Study (LIS) Database”, Review of Income and Wealth,94, 115-142.
Carter, M.R. and J. May (1999), “Poverty, Livelihood and Class in Rural South Africa”,World Development, 27(1), 1-20.
Coulter, F.A.E., Cowell, F.A. and S.P. Jenkins (1992), “Equivalence Scale Relativities andthe Extent of Inequality and Poverty”, Economic Journal, 102, 1067-82.
Dreze, J. and P.V. Srinivasan (1997), “Widowhood and Poverty in Rural India: SomeInferences from Household Survey Data”, Journal of Development Economics, 54(2),217-234.
Dubey, A. and S. Gangopadhyay (1998), “Counting the Poor: Where are the Poor in India?”,Sarvekshana, Analytical Report Number 1, Department of Statistics, Government ofIndia, New Delhi.
Ezemenari, K. and K. Subbarao (1999), “Jamaica’s Food Stamp Program: Impacts on Povertyand Welfare”, Policy Research Working Paper, No. 2207, The World Bank,Washington, D.C.
Foster, J., Greer, J. and E. Thorbecke (1984), “A Class of Decomposable Poverty Measures”,Econometrica, 52, 761-766.
Grosh, M. and P. Glewwe (1995), “A Guide to Living Standards Measurement Study Surveysand their Data Sets”, LSMS Working Paper, No. 120, The World Bank, Washington,D.C.
Hanratty, M. and R. Blank (1990), “Down and Out in North America: Recent Trends inPoverty Rates in the US and Canada”, Quarterly Journal of Economics, 57, 233-254.
Lancaster, G., Ray, R. and M.R. Valenzuela (1999a), “A Cross Country Study of HouseholdPoverty and Inequality on Unit Record Household Budget Data”, EconomicDevelopment and Cultural Change, 48(1), 177-208.
Lancaster, G., Ray, R. and M.R. Valenzuela (1999b), “A Cross Country Study of EquivalenceScales and Expenditure Inequality on Unit Record Household Budget Data”,forthcoming in Review of Income and Wealth.
Lanjouw, P. and M. Ravallion (1995), “Poverty and Household Size”, Economic Journal,105, 1415-1434.
Phipps, S. and T.I. Garner (1994), “Are Equivalence Scales the Same for the United Statesand Canada?”, Review of Income and Wealth, 40(1), 1-17.
Pollak, R.A. and T.J. Wales (1979), “Welfare Comparisons and Equivalence Scales”,American Economic Review, 69, 216-221.
Ravallion, M., Datt, G. and D. van de Walle (1991), “Quantifying Absolute Poverty in theDeveloping World”, Review of Income and Wealth, 37(4), 345-361.
Ray, R. (1999), “Poverty and Expenditure Pattern of Households in Pakistan and SouthAfrica: A Comparative Study”, forthcoming in Journal of International Development.
World Development Report (1994), Infrastructure for Development, Oxford University Press.