international recommendations for energy statistics · international recommendations for energy...
TRANSCRIPT

United Nations
Intern
ation
al Reco
mm
end
ation
s for E
nerg
y Statistics
International Recommendations for Energy Statistics (IRES)
United NationsNew York, 2018
Department of Economic and Social AffairsStatistics Division
ST/ESA/STAT/SER.M/93
Statistical Papers Series M No. 93

ii
Department of Economic and Social AffairsThe Department of Economic and Social Affairs of the United Nations Secretariat is a vital interface between global policies in the economic, social and environmental spheres and national action. The Department works in three main interlinked areas: (i) it compiles, generates and analyses a wide range of economic, social and environmental data and information on which States Members of the United Nations draw to review common problems and to take stock of policy options; (ii) it facilitates the negotiations of Member States in many intergovernmental bodies on joint courses of action to address ongoing or emerging global challenges; and (iii) it advises interested Governments on the ways and means of translating policy frameworks developed in United Nations conferences and summits into programmes at the country level and, through technical assistance, helps build national capacities.
NoteThe designations used and the presentation of material in this publication do not imply the expression of any opinion whatsoever on the part of the Secretariat of the United Nations concerning the legal status of any country, territory, city or area, or of its authorities, or concerning the delimitation of its frontiers or boundaries.
The term “country” as used in this publication also refers, as appropriate, to territories or areas.
Symbols of United Nations documents are composed of capital letters combined with figures. Mention of such a symbol indicates a reference to a United Nations document.
ST/ESA/STAT/SER.M/93 United Nations Publication Sales No. E.14.XVII.11 ISBN: 978-92-1-161584-5 eISBN: 978-92-1-056520-2
Copyright © United Nations, 2017 All rights reserved
iii
Contents
Page
Preface . . . . . . . . . . . . . . . . . . . . . . . . . . . . . . . . . . . . . . . . . . . . . . . . . . . . . . . . . . . . . . . . . . vii
Acknowledgements . . . . . . . . . . . . . . . . . . . . . . . . . . . . . . . . . . . . . . . . . . . . . . . . . . . . . . . . ix
List of abbreviations and acronyms . . . . . . . . . . . . . . . . . . . . . . . . . . . . . . . . . . . . . . . . . . . . xi
Chapter I. Introduction . . . . . . . . . . . . . . . . . . . . . . . . . . . . . . . . . . . . . . . . . . . . . . . . . . . . 1
A. Background . . . . . . . . . . . . . . . . . . . . . . . . . . . . . . . . . . . . . . . . . . . . . . . . . . . . 2B. Purpose of the international recommendations for energy statistics . . . . . . . . . . 3C. Users and uses of energy statistics . . . . . . . . . . . . . . . . . . . . . . . . . . . . . . . . . . . . 6D. IRES development process . . . . . . . . . . . . . . . . . . . . . . . . . . . . . . . . . . . . . . . . . 8E. Structure of IRES . . . . . . . . . . . . . . . . . . . . . . . . . . . . . . . . . . . . . . . . . . . . . . . 8F. Summary of recommendations . . . . . . . . . . . . . . . . . . . . . . . . . . . . . . . . . . . . . . 10G. Implementation and revision policy . . . . . . . . . . . . . . . . . . . . . . . . . . . . . . . . . . 15
Chapter II. Scope of energy statistics. . . . . . . . . . . . . . . . . . . . . . . . . . . . . . . . . . . . . . . . . . 17
A. Energy and energy statistics . . . . . . . . . . . . . . . . . . . . . . . . . . . . . . . . . . . . . . . . 17B. Basic concepts and boundary issues: an overview . . . . . . . . . . . . . . . . . . . . . . . 18
Chapter III. Standard International Energy Product Classification . . . . . . . . . . . . . . . . . . . . 21
A. Introduction . . . . . . . . . . . . . . . . . . . . . . . . . . . . . . . . . . . . . . . . . . . . . . . . . . . . 21B. Purpose and scope of SIEC. . . . . . . . . . . . . . . . . . . . . . . . . . . . . . . . . . . . . . . . . 21C. Classification criteria and coding system . . . . . . . . . . . . . . . . . . . . . . . . . . . . . . 23
Coding system . . . . . . . . . . . . . . . . . . . . . . . . . . . . . . . . . . . . . . . . . . . . . . . . . . 23D. Definitions of energy products . . . . . . . . . . . . . . . . . . . . . . . . . . . . . . . . . . . . . . 27
Chapter IV. Measurement units and conversion factors. . . . . . . . . . . . . . . . . . . . . . . . . . . . 41
A. Introduction . . . . . . . . . . . . . . . . . . . . . . . . . . . . . . . . . . . . . . . . . . . . . . . . . . . . 41B. Measurement units . . . . . . . . . . . . . . . . . . . . . . . . . . . . . . . . . . . . . . . . . . . . . . . 41
1. Original units . . . . . . . . . . . . . . . . . . . . . . . . . . . . . . . . . . . . . . . . . . . . . . . 422. Common units . . . . . . . . . . . . . . . . . . . . . . . . . . . . . . . . . . . . . . . . . . . . . . 45
C. Calorific values . . . . . . . . . . . . . . . . . . . . . . . . . . . . . . . . . . . . . . . . . . . . . . . . . . 451. Gross and net calorific/heating values . . . . . . . . . . . . . . . . . . . . . . . . . . . . . 452. Default vs. specific calorific values. . . . . . . . . . . . . . . . . . . . . . . . . . . . . . . . 463. How to calculate average calorific values . . . . . . . . . . . . . . . . . . . . . . . . . . . 474. Default calorific values . . . . . . . . . . . . . . . . . . . . . . . . . . . . . . . . . . . . . . . . 485. Units recommended for dissemination . . . . . . . . . . . . . . . . . . . . . . . . . . . . 54
Chapter V. Energy flows . . . . . . . . . . . . . . . . . . . . . . . . . . . . . . . . . . . . . . . . . . . . . . . . . . . . 55
A. Introduction . . . . . . . . . . . . . . . . . . . . . . . . . . . . . . . . . . . . . . . . . . . . . . . . . . . . 55B. Concept of energy flows . . . . . . . . . . . . . . . . . . . . . . . . . . . . . . . . . . . . . . . . . . . 55
International Recommendations for Energy Statistics (IRES)iv
C. Definition of main energy flows . . . . . . . . . . . . . . . . . . . . . . . . . . . . . . . . . . . . . 56D. Energy industries . . . . . . . . . . . . . . . . . . . . . . . . . . . . . . . . . . . . . . . . . . . . . . . . 58
1. Electricity and heat . . . . . . . . . . . . . . . . . . . . . . . . . . . . . . . . . . . . . . . . . . . 612. Transformation processes . . . . . . . . . . . . . . . . . . . . . . . . . . . . . . . . . . . . . . 63
E. Other energy producers . . . . . . . . . . . . . . . . . . . . . . . . . . . . . . . . . . . . . . . . . . . 64F. Energy consumers and energy uses . . . . . . . . . . . . . . . . . . . . . . . . . . . . . . . . . . . 65
1. Energy consumers . . . . . . . . . . . . . . . . . . . . . . . . . . . . . . . . . . . . . . . . . . . . 652. Cross-classification of uses and users of energy . . . . . . . . . . . . . . . . . . . . . . 66
Chapter VI. Statistical units and data items . . . . . . . . . . . . . . . . . . . . . . . . . . . . . . . . . . . . . 71
A. Introduction . . . . . . . . . . . . . . . . . . . . . . . . . . . . . . . . . . . . . . . . . . . . . . . . . . . . 71B. Statistical units . . . . . . . . . . . . . . . . . . . . . . . . . . . . . . . . . . . . . . . . . . . . . . . . . . 71
1. Statistical units and their definitions. . . . . . . . . . . . . . . . . . . . . . . . . . . . . . 712. An illustrative example . . . . . . . . . . . . . . . . . . . . . . . . . . . . . . . . . . . . . . . . 733. Statistical units for energy statistics. . . . . . . . . . . . . . . . . . . . . . . . . . . . . . . 75
C. Reference list of data items . . . . . . . . . . . . . . . . . . . . . . . . . . . . . . . . . . . . . . . . . 751. Characteristics of statistical units . . . . . . . . . . . . . . . . . . . . . . . . . . . . . . . . 752. Data items on energy flows and stock levels . . . . . . . . . . . . . . . . . . . . . . . . 783. Data items on production, storage and transmission capacity . . . . . . . . . . . 814. Data items for assessment of economic performance. . . . . . . . . . . . . . . . . . 835. Data items on mineral and energy resources . . . . . . . . . . . . . . . . . . . . . . . . 85
Chapter VII. Data collection and compilation . . . . . . . . . . . . . . . . . . . . . . . . . . . . . . . . . . . . 87
A. Legal framework . . . . . . . . . . . . . . . . . . . . . . . . . . . . . . . . . . . . . . . . . . . . . . . . . 87B. Institutional arrangements . . . . . . . . . . . . . . . . . . . . . . . . . . . . . . . . . . . . . . . . . 88C. Data collection strategies . . . . . . . . . . . . . . . . . . . . . . . . . . . . . . . . . . . . . . . . . . 89
1. Scope and coverage of data collection . . . . . . . . . . . . . . . . . . . . . . . . . . . . . 892. Organization of data collection . . . . . . . . . . . . . . . . . . . . . . . . . . . . . . . . . . 92
D. Data sources . . . . . . . . . . . . . . . . . . . . . . . . . . . . . . . . . . . . . . . . . . . . . . . . . . . . 931. Statistical data sources. . . . . . . . . . . . . . . . . . . . . . . . . . . . . . . . . . . . . . . . . 932. Administrative data sources. . . . . . . . . . . . . . . . . . . . . . . . . . . . . . . . . . . . . 96
E. Data compilation methods . . . . . . . . . . . . . . . . . . . . . . . . . . . . . . . . . . . . . . . . . 97
Chapter VIII. Energy balances . . . . . . . . . . . . . . . . . . . . . . . . . . . . . . . . . . . . . . . . . . . . . . . . . 101
A. Introduction . . . . . . . . . . . . . . . . . . . . . . . . . . . . . . . . . . . . . . . . . . . . . . . . . . . . 101B. Scope and general principles of energy balance compilation . . . . . . . . . . . . . . . . 102C. Structure of energy balance: an overview . . . . . . . . . . . . . . . . . . . . . . . . . . . . . . 104
1. Top block—energy supply. . . . . . . . . . . . . . . . . . . . . . . . . . . . . . . . . . . . . . 1052. Middle block—transfers, transformation, use and losses. . . . . . . . . . . . . . . 1063. Bottom block—final consumption . . . . . . . . . . . . . . . . . . . . . . . . . . . . . . . 1074. Statistical difference . . . . . . . . . . . . . . . . . . . . . . . . . . . . . . . . . . . . . . . . . . 109
D. Templates of detailed and aggregated energy balances . . . . . . . . . . . . . . . . . . . . 109E. Data reconciliation and estimation of missing data . . . . . . . . . . . . . . . . . . . . . . 112
1. Accuracy requirements . . . . . . . . . . . . . . . . . . . . . . . . . . . . . . . . . . . . . . . . 1122. Estimation of missing data . . . . . . . . . . . . . . . . . . . . . . . . . . . . . . . . . . . . . 1123. Reconciliation . . . . . . . . . . . . . . . . . . . . . . . . . . . . . . . . . . . . . . . . . . . . . . . 112
F. Commodity balances . . . . . . . . . . . . . . . . . . . . . . . . . . . . . . . . . . . . . . . . . . . . . 113
Page
v
Chapter IX. Data quality assurance and metadata . . . . . . . . . . . . . . . . . . . . . . . . . . . . . . . . 115
A. Introduction . . . . . . . . . . . . . . . . . . . . . . . . . . . . . . . . . . . . . . . . . . . . . . . . . . . . 115B. Data quality, quality assurance and quality assurance frameworks. . . . . . . . . . . 115
1. Data quality . . . . . . . . . . . . . . . . . . . . . . . . . . . . . . . . . . . . . . . . . . . . . . . . 1152. Quality assurance . . . . . . . . . . . . . . . . . . . . . . . . . . . . . . . . . . . . . . . . . . . . 1153. Data quality assurance frameworks . . . . . . . . . . . . . . . . . . . . . . . . . . . . . . 1164. Obectives, uses and benefits of quality assurance frameworks. . . . . . . . . . . 1185. Dimensions of quality . . . . . . . . . . . . . . . . . . . . . . . . . . . . . . . . . . . . . . . . . 1186. Interconnectedness and trade-offs . . . . . . . . . . . . . . . . . . . . . . . . . . . . . . . . 120
C. Measuring and reporting on the quality of statistical outputs. . . . . . . . . . . . . . . 1211. Quality measures and indicators . . . . . . . . . . . . . . . . . . . . . . . . . . . . . . . . . 1212. Examples and selection of quality measures and indicators . . . . . . . . . . . . 1223. Quality reports . . . . . . . . . . . . . . . . . . . . . . . . . . . . . . . . . . . . . . . . . . . . . . 1224. Quality reviews . . . . . . . . . . . . . . . . . . . . . . . . . . . . . . . . . . . . . . . . . . . . . . 124
D. Metadata on energy statistics . . . . . . . . . . . . . . . . . . . . . . . . . . . . . . . . . . . . . . . 125
Chapter X. Dissemination . . . . . . . . . . . . . . . . . . . . . . . . . . . . . . . . . . . . . . . . . . . . . . . . . . 129
A. Importance of energy statistics dissemination. . . . . . . . . . . . . . . . . . . . . . . . . . . 129B. Data dissemination and statistical confidentiality . . . . . . . . . . . . . . . . . . . . . . . 130C. Reference period and dissemination timetable . . . . . . . . . . . . . . . . . . . . . . . . . . 132D. Data revision. . . . . . . . . . . . . . . . . . . . . . . . . . . . . . . . . . . . . . . . . . . . . . . . . . . . 133E. Dissemination formats . . . . . . . . . . . . . . . . . . . . . . . . . . . . . . . . . . . . . . . . . . . . 134F. International reporting . . . . . . . . . . . . . . . . . . . . . . . . . . . . . . . . . . . . . . . . . . . . 134
Chapter XI. Uses of basic energy statistics and balances . . . . . . . . . . . . . . . . . . . . . . . . . . . 135
A. Introduction . . . . . . . . . . . . . . . . . . . . . . . . . . . . . . . . . . . . . . . . . . . . . . . . . . . . 135B. The System of Environmental-Economic Accounting for Energy . . . . . . . . . . . . 135
1. Main differences between energy balances and energy accounts . . . . . . . . . 1362. Adjustments for the compilation of energy accounts . . . . . . . . . . . . . . . . . . 138
C. Energy indicators . . . . . . . . . . . . . . . . . . . . . . . . . . . . . . . . . . . . . . . . . . . . . . . . 139D. Greenhouse gas emissions . . . . . . . . . . . . . . . . . . . . . . . . . . . . . . . . . . . . . . . . . . 141
1. Climate change and GHG emissions . . . . . . . . . . . . . . . . . . . . . . . . . . . . . 1412. IPCC guidelines for estimating GHG emissions. . . . . . . . . . . . . . . . . . . . . 1423. Energy emissions and energy statistics . . . . . . . . . . . . . . . . . . . . . . . . . . . . 143
Annex A. Primary and secondary products; renewables and non-renewables . . . . . . . . 145
Annex B. Additional tables on conversion factors, calorific values and measurement units . . . . . . . . . . . . . . . . . . . . . . . . . . . . . . . . . . . . . . . . . . . 149
References . . . . . . . . . . . . . . . . . . . . . . . . . . . . . . . . . . . . . . . . . . . . . . . . . . . . . . . . . . . . . . . 153
Page
International Recommendations for Energy Statistics (IRES)vi
TABLES
1.1 Summary of the main recommendations and encouragements contained in IRES. . . . . . . . . . . . . . . . . . . . . . . . . . . . . . . . . . . . . . . . . . . . . . . . . . . . . . . . . . 11
3.1 Standard International Energy Product Classification (SIEC) . . . . . . . . . . . . . . 244.1 Default net calorific values for energy products . . . . . . . . . . . . . . . . . . . . . . . . . 484.2 Influence of moisture content on net calorific values of standard fuelwood
(wood with one per cent ash content) . . . . . . . . . . . . . . . . . . . . . . . . . . . . . . . . . 524.3 Conversion table for fuelwood (wood with 25 per cent moisture content) . . . . . 524.4 Recommended units for dissemination. . . . . . . . . . . . . . . . . . . . . . . . . . . . . . . . 545.1 Energy industries with reference to the relevant ISIC category. . . . . . . . . . . . . . 595.2 Main activity producers and autoproducers of electricity and heat . . . . . . . . . . . 625.3 Main categories of energy consumers . . . . . . . . . . . . . . . . . . . . . . . . . . . . . . . . . 665.4 Mode of transport. . . . . . . . . . . . . . . . . . . . . . . . . . . . . . . . . . . . . . . . . . . . . . . . 686.1 Mineral and energy resources relevant for energy56 . . . . . . . . . . . . . . . . . . . . . . 856.2 Categorization of mineral and energy resources relevant for energy . . . . . . . . . . 858.1 Template of a detailed energy balance. . . . . . . . . . . . . . . . . . . . . . . . . . . . . . . . . 1108.2 Template of an aggregated energy balance . . . . . . . . . . . . . . . . . . . . . . . . . . . . . 11111.1 Energy Indicators linked to the social dimension . . . . . . . . . . . . . . . . . . . . . . . . 13911.2 Energy Indicators linked to the economic dimension . . . . . . . . . . . . . . . . . . . . . 14011.3 Energy Indicators linked to the environmental dimension . . . . . . . . . . . . . . . . . 141
FIGURES5.1 Diagram of the main energy flows . . . . . . . . . . . . . . . . . . . . . . . . . . . . . . . . . . . 56
5.2 Cross classification of uses and users of energy . . . . . . . . . . . . . . . . . . . . . . . . . . 67
6.1 Example of a large oil corporation . . . . . . . . . . . . . . . . . . . . . . . . . . . . . . . . . . . 74
8.1 Uses of energy and their presentation in an energy balance . . . . . . . . . . . . . . . . 109
BoXES
1.1 The United Nations Fundamental Principles of Official Statistics . . . . . . . . . . . 44.1 International System of Units . . . . . . . . . . . . . . . . . . . . . . . . . . . . . . . . . . . . . . . 415.1 Principal, secondary and ancillary activities . . . . . . . . . . . . . . . . . . . . . . . . . . . . 599.1 Template for a Generic National Quality Assurance Framework (NQAF) . . . . . 1179.2 Selected Indicators for Measuring the Quality of Energy Statistics . . . . . . . . . . 1239.3 Metadata items for statistical releases . . . . . . . . . . . . . . . . . . . . . . . . . . . . . . . . . 12711.1 Methods for the estimation of GHG emissions from fossil fuel combustion . . . 143
vii
Preface
The International Recommendations for Energy Statistics (IRES) provide a comprehensive methodological framework for the collection, compilation and dissemination of energy sta-tistics in all countries irrespective of the level of development of their statistical system. In particular, IRES provides of a set of internationally agreed recommendations covering all aspects of the statistical production process, from the institutional and legal framework, basic concepts, definitions and classifications to data sources, data compilation strategies, energy balances, data quality issues and statistical dissemination.
IRES was prepared in response to the request of the United Nations Statistical Com-mission, at its thirty-seventh session (7–10 March, 2006), to review the United Nations manuals on energy statistics, develop energy statistics as part of official statistics, harmonize energy definitions and compilation methodologies and develop international standards in energy statistics.
The preparation of IRES was carried out by the United Nations Statistics Division (UNSD) in close cooperation with the Oslo Group on Energy Statistics and the Intersecre-tariat Working Group on Energy Statistics (InterEnerStat).
A major milestone of IRES is the Standard International Energy Product Classifica-tion (SIEC), which is the first standard classification for energy products. It has been built on a set of internationally harmonized definitions of energy products developed by InterEnerStat as mandated by the United Nations Statistical Commission. The adoption of SIEC as an international standard classification for energy products represents a significant step forward for energy statistics at the international level. SIEC not only provides a unified set of product definitions, but also uses a standard coding scheme and a common hierarchy of categories, and provides links to other internationally agreed product classifications, such as the Central Product Classification (CPC) and the Harmonized Commodity Description and Coding System (HS). In addition to its use within traditional forms of energy statistics, such as energy balances, SIEC may also serve in frameworks that aim to combine energy statistics with other statistical domains, such as energy accounts used within the field of environmental-economic accounting.
The present document has undergone an extensive preparation process that included consultations with experts, two rounds of worldwide consultation and a final review by the Expert Group on Energy Statistics. The United Nations Statistical Commission, at its forty-second session (22–25 February 2011), adopted IRES as a statistical standard and encouraged its implementation in all countries. The Commission also supported the work of UNSD on the Energy Statistics Compilers Manual to provide additional practical guidelines in the col-lection and compilation of energy statistics.

ix
Acknowledgements
The International Recommendations for Energy Statistics have been prepared by the United Nations Statistics Division in close collaboration with the Oslo Group on Energy Statistics and the Intersecretariat Working Group on Energy Statistics. The process also involved other experts who provided advice on specific topics, countries and international/regional organiza-tions participating through two rounds of global consultation, and the participants of the Expert Group on Energy Statistics, who reviewed the document prior to its submission to the Statistical Commission.
Members of the Oslo Group on Energy Statistics who contributed to the draft-ing and review of the document include: Mr. G. Brown (Australia), Mr. W. Bitterman (Austria), Mr. Y. Yusifov (Azerbaijan), Mr. J. Lacroix (Canada), Mr. A. Kohut (Can-ada), Mr. A. A. Zarnaghi (Denmark), Mr. T. Olsen (Denmark), Mr. P. K. Ray (India), Ms. G. S. Rathore (India), Mr. M. Howley (Ireland), Mr. C. R. López-Pérez (Mexico), Mr. H. Pouwelse (Netherlands), Mr. A. Tostensen (Norway), Ms. K. Kolshus (Norway), Mr. O. Ljones (Norway), Ms. J. E. W. Toutain (Norway), Mr. S. Peryt (Poland), Mr. A. Gon-charov (Russia), Mr. J. Subramoney (South Africa), Mr. P. Westin (Sweden), Mr. I. MacLeay (United Kingdom), Mr. P. Kilcoyne (United States), Mr. A. Gritsevskyi (International Atomic Energy Agency), Mr. J. Y. Garnier (International Energy Agency), Ms. K. Treanton (Inter-national Energy Agency), Mr. P. Loesoenen (Eurostat) and Mr. R. Mertens (Eurostat).
UNSD is grateful to Mr. Ljones and Mr. Garnier for leading the Oslo Group and the Intersecretriat Working Group on Energy Statistics, respectively, and their contribution to the preparation of IRES.
The preparation of IRES was undertaken under the supervision and guidance of Mr. V. Markhonko (UNSD) and concluded under the overall supervision of Mr. R. Becker (UNSD). Mr. Markhonko, Ms. I. Di Matteo, Mr. L. Souza, Mr. O. Andersen, Mr. A. Black-burn and Mr. Becker were involved in the drafting of the text at various stages of the drafting process.

xi
List of abbreviations and acronyms
API American Petroleum Institute
BPM6 Balance of Payments and International Investment Position Manual
Btu British thermal unit
CHP Combined Heat and Power
CPC Central Product Classification
DQAF Data Quality Assessment Framework
EEA European Environmental Agency
ESCM Energy Statistics Compilers Manual
Eurostat Statistical Office of the European Communities
GCV Gross Calorific Value
GDP Gross Domestic Product
GHG Greenhouse Gas
GTL Gas-to-Liquids
GWh Gigawatt-hour
HS Harmonized Commodity Description and Coding System
IEA International Energy Agency
InterEnerStat Intersecretariat Working Group on Energy Statistics
IPCC Intergovernmental Panel on Climate Change
IRES International Recommendations for Energy Statistics
ISIC International Standard Industrial Classification of All Economic Activities
LNG Liquefied Natural Gas
LPG Liquefied Petroleum Gas
kWh Kilowatt-hour
NQAF National Quality Assurance Framework
NCV Net Calorific Value
NGL Natural Gas Liquid
OECD Organisation for Economic Co-operation and Development
SBP Special Boiling Point
SDMX Statistical Data and Metadata Exchange
SEEA System of Environmental-Economic Accounting
SEEA-Energy System of Environmental-Economic Accounting for Energy
SI Systèmes International d’Unités
SIEC Standard International Energy Product Classification
SIMS Single Integrated Metadata Structure
SNA System of National Accounts
TES Total Energy Supply
Tce Ton of coal equivalent
Toe Ton of oil equivalent
UN United Nations
UNFC United Nations Framework Classification for Fossil Energy and Mineral Reserves and Resources
UNFCCC United Nations Framework Convention on Climate Change
UNSD United Nations Statistics Division
VAT Value added tax
1
Chapter I
Introduction
1.1. Energy is fundamental for socio-economic development. The availability of and access to energy and energy sources are particularly essential to poverty reduction and fur-ther improvements in standards of living.1 At the same time, with the constantly increasing demand for energy, there are growing concerns about the sustainability and reliability of current production and consumption patterns and the impact of the use of fossil fuel on the environment.
1.2. Under these circumstances reliable and timely monitoring of the supply and use of energy becomes indispensable for sound decision-making. However, such monitoring is pos-sible only if high-quality energy statistics are systematically compiled and effectively dissemi-nated. This, in turn, requires the availability of internationally agreed standards and other necessary guidance to ensure cross-country data comparability and the existence of adequate mechanisms for data dissemination to policymakers, both at national and international lev-els, as well as to society in general. In this context, an overarching goal of the International Recommendations for Energy Statistics (IRES) is to provide such standards and guidance to national compilers covering relevant concepts and definitions, classifications, data sources, data compilation methods, institutional arrangements, data quality assurance, metadata and dissemination policies.
1.3. The target audience. IRES is a multipurpose document intended to address the needs of various user groups. Its target audience, which is quite diverse, comprises:
(a) Compilers of national energy statistics, irrespective of whether they are located in national statistical offices, energy ministries (agencies), other governmental institutions or other agencies, who, by the application of the provided recom-mendations, can collectively strengthen national programmes of energy statistics as an integral part of official statistics and produce data that meet the challenges of our time;
(b) Compilers of other statistics who will have in IRES an authoritative source of information on internationally agreed standards with respect to energy statistics and on which basis the cooperation with energy statisticians should be pursued in order to improve the overall quality of official statistics;
(c) Policymakers whom IRES will help to better assess the strategic importance of energy statistics, the complexity of the issues energy statistics face and to appreci-ate the need for allocation of the necessary resources for producing such statistics;
(d) International and regional organizations dealing with energy-related issues, which will appreciate IRES as the reference document of global importance on which they can base their work;
(e) Research institutions and energy analysts that might use IRES to better assess the quality of available data and provide valuable feedback to energy statistics compilers; and;
1 See, for example, Johannesburg Plan of Implementation (JPOI), paragraph 9(g). Available from www.un.org/esa/sustdev /documents/WSSD_POI_PD /English/WSSD_PlanImpl.pdf.
International Recommendations for Energy Statistics (IRES)2
( f ) The general public, which will find in IRES a wealth of information essential for better understanding energy statistics and for formulating sound judgements regarding various energy policy issues.
A. Background1.4. Due to the critical role energy plays in socio-economic development, the availability of high-quality energy statistics has always been a matter of concern for the statistical com-munity. Since its inception the United Nations Statistical Commission has discussed issues relevant to energy statistics as part of economic statistics. In the aftermath of the energy crisis of the early 1970s, the Commission put energy statistics on its agenda as a separate item and requested a special report on energy statistics to be prepared and presented to it for discussion.
1.5. Accordingly, the report of the United Nations Secretary-General was prepared and submitted to the Commission at its nineteenth session in 1976.2 The Commission welcomed the report and agreed that the development of a system of integrated energy statistics should have high priority in the Commission’s programme of work. It agreed on the use of energy balances as the key instrument in the coordination of work on energy statistics and the pro-vision of data in a suitable form for understanding and analysing the role of energy in the economy. The Commission also recommended the preparation of a standard international classification for energy statistics as part of the global system of integrated energy statistics and considered such a classification an essential element for the further development and harmonization of energy statistics at the international level.
1.6. Following the Commission’s recommendations, the United Nations Statistics Divi-sion (UNSD) prepared a detailed report on basic concepts and methods relevant to energy sta-tistics. The Commission, at its twentieth session in 1979, appreciated the report and decided that it should be made available for circulation to national and international statistical offices, as well as to other relevant agencies. In response to this decision, UNSD issued in 1982 the Concepts and Methods in Energy Statistics, with Special Reference to Energy Accounts and Bal-ances: A Technical Report.3 At its twenty-fourth session in 1987, the Commission again dis-cussed energy statistics and recommended that a handbook on conversion factors and units of measurement for use in energy statistics be published as well. Implementing this recom-mendation, UNSD issued later in 1987 another technical report entitled Energy Statistics: Definitions, Units of Measure and Conversion Factors.4 These two documents have played a major role in the development of energy statistics both at the national and international levels.
1.7. As countries were gaining experience with the compilation of energy statistics, and various regions developed specific data needs, it became necessary to produce additional guid-ance. In 1991, UNSD published Energy Statistics: A Manual for Developing Countries,5 and in 2004 the International Energy Agency (IEA) and the Statistical Office of the European Com-munities (Eurostat) published their Energy Statistics Manual 6 to assist member countries of the Organisation for Economic Co-operation and Development (OECD) and the European Union (EU) in compiling their joint energy statistics questionnaire and to provide related guidance. Both manuals were welcome complements to the earlier United Nations publica-tions. The OECD/IEA/Eurostat manual contains the most recent background information and clarifications of some difficult conceptual issues.
1.8. In view of mounting evidence that energy statistics still have serious shortcomings in terms of data availability and international comparability, the Commission at its thirty-sixth session in 2005 undertook a programme review based on a report prepared by Statistics Norway (see E/CN.3/2005/3). During its deliberations, the Commission recognized the need for developing energy statistics as part of official statistics and for revising the existing recom-mendations for energy statistics.
2 Towards a System of Integrated Energy Statistics, Report of the Secretary-General to the nine-teenth session of the Statistical Commission, E/CN.3/476, 15 March 1976.
3 Concepts And Methods In Energy Statistics, With Special Reference To Energy Accounts And Balances: A Technical Report, Studies in Methods, Series F, No. 29, United Nations, New York, 1982.
4 Energy Statistics: Definitions, Units of Measure and Conversion Factors, Studies in Methods, Series F, No. 44, United Nations, New York, 1987.
5 Energy Statistics: A Manual for Developing Countries, Studies in Methods, Series F, No. 56, United Nations, New York, 1991.
6 Energy Statistics Manual, OECD/IEA/EUROSTAT, Paris, 2004.
3Introduction 3
1.9. As part of the follow-up actions to the Commission’s decisions, UNSD convened an ad hoc expert group on energy statistics (New York, 23–25 May 2005), which recommended that further work on energy statistics should be carried out by two complementary working groups—a city group and an inter-secretariat working group. The city group’s task was to con-tribute to the development of improved methods and international standards for national offi-cial energy statistics, and the inter-secretariat working group was requested to enhance inter-agency coordination, particularly in the harmonization of the definitions of energy products. The detailed terms of reference of both groups were approved by the Commission’s Bureau.7
1.10. The Commission, at its thirty-seventh session in 2006, commended the progress made and supported the establishment and mandate of the Oslo Group on Energy Statistics, convened by Statistics Norway, and the Intersecretariat Working Group on Energy Statistics (InterEnerStat), convened by IEA,8 and requested proper coordination mechanisms between them. The present publication is the result of a close cooperation between UNSD, the Oslo Group on Energy Statistics and InterEnerStat. While the Oslo Group on Energy Statistics concentrated on the development of an overall conceptual framework for IRES, as well as data compilation and dissemination strategies, InterEnerStat focused on the harmonization of definitions of energy products and energy flows (see chapters III and V for details.).
1.11. Parallel with IRES, the System of Environmental Economic Accounting (SEEA), includ-ing SEEA-Energy, was prepared. These forthcoming publications will provide guidance for environmental and energy accounts consisting of agreed concepts, definitions, classifica-tions and inter-related tables and accounts. The SEEA-Energy accounting standards will be developed on the basis of IRES (e.g., using data items provided in IRES, its classification of energy products and definition of energy flows). Thus, IRES and SEEA-Energy are viewed as two complementary, coordinated documents, and the relationship between them is further elaborated in chapter XI.
1.12. The present document, adopted as a statistical standard by the Commission at its forty-second session in February 2011, provides the internationally agreed standard for energy statistics.
B. Purpose of the international recommendations for energy statistics
1.13. The main purpose of IRES is to strengthen energy statistics as part of official statistics by providing recommendations on concepts and definitions, classifications, data sources, data compilation methods, institutional arrangements, approaches to data quality assessment, metadata and dissemination policies. Developing energy statistics in compliance with IRES will make these statistics more consistent with other fields of economic statistics, such as standard international classifications of activities and products,9 as well as with the recom-mendations for other economic statistics (e.g., the International Recommendations for Indus-trial Statistics, United Nations (2009b)).
1.14. In addition, IRES will serve as a reference document in support of the maintenance and development of national energy statistics programmes. It will provide a common yet flex-ible framework for the collection, compilation, analysis and dissemination of energy statistics that meet the demands of the user community and are policy-relevant, timely, reliable and internationally comparable. This framework can be utilized by all countries, irrespective of the level of development of their statistical systems, as the basis for further improving existing energy statistics programmes or establishing such programmes.
7 See Report of the Secretary-General on Energy Statistics to the thirty-seventh session of the Commission, E/CN.3/2006/10.
8 The IEA undertook an initiative to organize a group consisting of various regional and special-ized agencies active in energy statistics in 2004. Such a group, known as InterEnerStat, was established in 2005 and acts as the Intersecretariat Work-ing Group on Energy Statistics reporting to the Commission.
9 This includes the International Standard Industrial Classification of All Economic Activities (ISIC), the Central Product Classification (CPC) and the Harmonized Com-modity Description and Coding System (HS).
International Recommendations for Energy Statistics (IRES)4
1.15. While all countries are expected to comply with IRES definitions and classifications to the extent possible and practical, to follow the recommendations regarding data collection and compilation, to maintain the highest possible data quality and to follow data dissemin-ation principles, they have flexibility in defining the scope of their own energy statistics pro-grammes, developing their data collection strategies and establishing appropriate institutional arrangements that reflect country policy, circumstances, and resource availability.
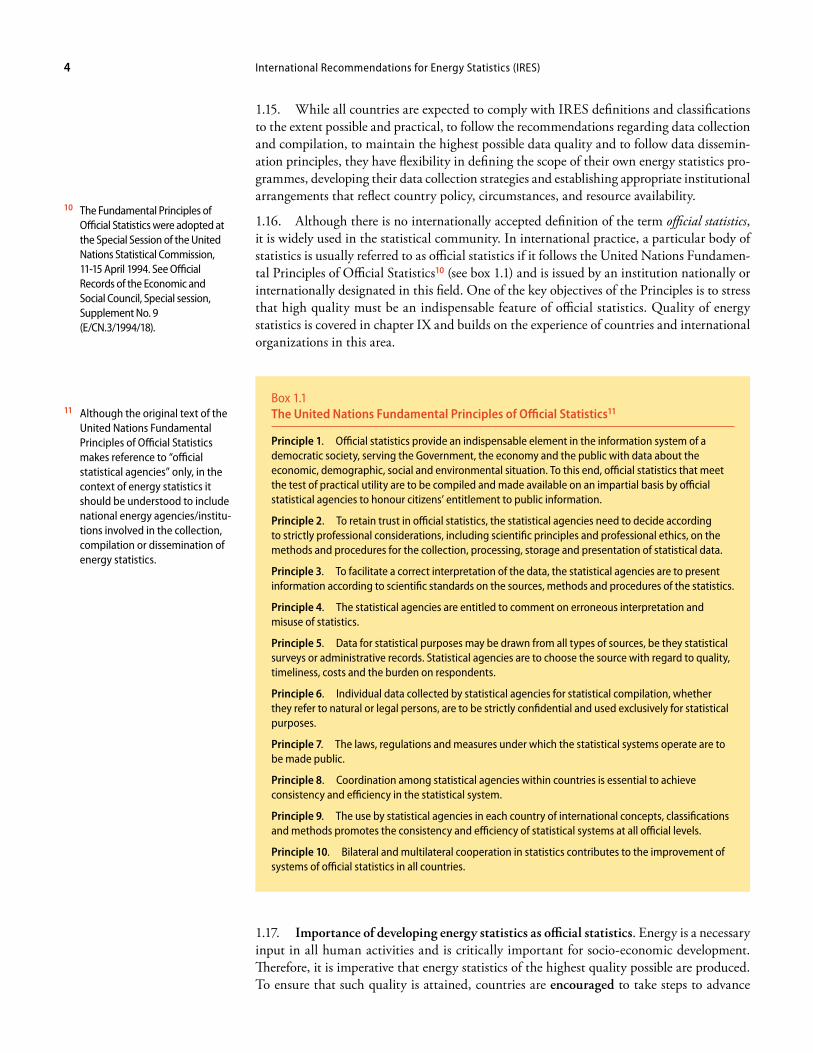
1.16. Although there is no internationally accepted definition of the term official statistics, it is widely used in the statistical community. In international practice, a particular body of statistics is usually referred to as official statistics if it follows the United Nations Fundamen-tal Principles of Official Statistics10 (see box 1.1) and is issued by an institution nationally or internationally designated in this field. One of the key objectives of the Principles is to stress that high quality must be an indispensable feature of official statistics. Quality of energy statistics is covered in chapter IX and builds on the experience of countries and international organizations in this area.
1.17. Importance of developing energy statistics as official statistics. Energy is a necessary input in all human activities and is critically important for socio-economic development. Therefore, it is imperative that energy statistics of the highest quality possible are produced. To ensure that such quality is attained, countries are encouraged to take steps to advance
10 The Fundamental Principles of Official Statistics were adopted at the Special Session of the United Nations Statistical Commission, 11-15 April 1994. See Official Records of the Economic and Social Council, Special session, Supplement No. 9 (E/CN.3/1994/18).
11 Although the original text of the United Nations Fundamental Principles of Official Statistics makes reference to “official statistical agencies” only, in the context of energy statistics it should be understood to include national energy agencies/institu-tions involved in the collection, compilation or dissemination of energy statistics.
Box 1.1The United Nations Fundamental Principles of official Statistics11
Principle 1. Official statistics provide an indispensable element in the information system of a democratic society, serving the Government, the economy and the public with data about the economic, demographic, social and environmental situation. To this end, official statistics that meet the test of practical utility are to be compiled and made available on an impartial basis by official statistical agencies to honour citizens’ entitlement to public information.
Principle 2. To retain trust in official statistics, the statistical agencies need to decide according to strictly professional considerations, including scientific principles and professional ethics, on the methods and procedures for the collection, processing, storage and presentation of statistical data.
Principle 3. To facilitate a correct interpretation of the data, the statistical agencies are to present information according to scientific standards on the sources, methods and procedures of the statistics.
Principle 4. The statistical agencies are entitled to comment on erroneous interpretation and misuse of statistics.
Principle 5. Data for statistical purposes may be drawn from all types of sources, be they statistical surveys or administrative records. Statistical agencies are to choose the source with regard to quality, timeliness, costs and the burden on respondents.
Principle 6. Individual data collected by statistical agencies for statistical compilation, whether they refer to natural or legal persons, are to be strictly confidential and used exclusively for statistical purposes.
Principle 7. The laws, regulations and measures under which the statistical systems operate are to be made public.
Principle 8. Coordination among statistical agencies within countries is essential to achieve consistency and efficiency in the statistical system.
Principle 9. The use by statistical agencies in each country of international concepts, classifications and methods promotes the consistency and efficiency of statistical systems at all official levels.
Principle 10. Bilateral and multilateral cooperation in statistics contributes to the improvement of systems of official statistics in all countries.

5Introduction 5
from the collection of selected data items used primarily for internal purposes by various spe-cialized energy agencies to the establishment of an integrated system of multipurpose energy statistics as a part of their official statistics in the context of the United Nations Fundamental Principles of Official Statistics and on the basis of appropriate institutional arrangements. It is recognized that in many countries and regions such integrated systems have been estab-lished12 and efforts are being made to further improve them, while a significant number of other countries are at the initial stages of this process.
1.18. Developing energy statistics as official statistics will be beneficial in a number of ways, including: (i) strengthening the legal basis in order to guarantee confidentiality of data providers and protection against data misuse; (ii) improving international comparability by promoting the implementation of international standards and concepts; and (iii) fostering transparency in the compilation and dissemination of statistics.
1.19. Actions to be taken to strengthen energy statistics as official statistics. Developing energy statistics as part of countries’ official statistics is a long-term goal that requires careful planning for development and implementation. Actions leading towards this goal should be taken both at the international and national levels.
1.20. At the international level, the strengthening of official energy statistics would be achieved by developing the current international recommendations for energy statistics and carrying out the respective implementation programmes. The implementation programme includes, for instance, the preparation of the Energy Statistics Compilers Manual (ESCM) and other technical reports to ensure sharing of good practices and improvements in data quality. It is recommended that international organizations play an active role in IRES implementation and assist countries in developing energy statistics work programmes as part of their national official statistics through, for example, the preparation of training materials and organizing regular training programmes, including regional workshops, and assisting countries in the sharing of expertise gained in this process.
1.21. At the national level, further improvements in the legal framework and streamlining of the institutional arrangements are needed. Certain issues, such as confidentiality, can be a challenge, since there may be strong tendencies towards market concentration and market liberalization on the supply side for specific energy products, creating a conflict between the confidentiality requirement and demand for data. Some guidance in this respect is provided in Chapters VII and X.
1.22. More efforts are required at the national level to raise the user confidence in energy statistics, including making the processes of data compilation and dissemination fully trans-parent. It is recommended that official energy statistics be treated as a public good and the agencies responsible for their dissemination ensure that the public has convenient access to those statistics.
1.23. Specific needs addressed in the current version. The international recommendations for energy statistics have not been reviewed as a whole since the 1980s and need to be revised and updated to:
(a) Take into account and provide recommendations on the statistical treatment of new developments in energy production and consumption. Examples include the increased complexity of energy markets (including their liberalization), the appearance of new energy sources and technologies13 and the need for data to assess the sustainability and efficiency of energy supply and consumption, which were not sufficiently taken into account in the previous recommendations;
(b) Provide recommendations on topics not explicitly addressed in existing United Nations publications, such as data compilation strategies, data quality, metadata
12 One of the most recent examples of such efforts is the adoption of the EU directive on energy statis-tics, Regulation (EC) No. 1099/2008 of the European Parliament and of the Council of 22 October 2008 on energy statistics.
13 For example, in the 1960s there was almost no electricity produced from nuclear energy; more recently wind and solar energy have started to draw attention; biofuels have been quickly increasing in relevance and the future might see the fast development of hydrogen and fuel cells. As a consequence, there is an obvious need for statistics and statisticians to fol-low, if not to anticipate the fast evolution of the energy market.
International Recommendations for Energy Statistics (IRES)6
and data dissemination, as well as on the institutional arrangements needed for effective compilation of official energy statistics;
(c) Provide definitions of data items recommended for collection, identify a range of appropriate data sources and data compilation methods in order to assist coun-tries in the formulation of their data compilation strategies in the context of the increased complexity of energy markets in rapidly globalizing economies and heightened confidentiality concerns;
(d) Promote an integrated approach to energy statistics, in particular to improve harmonization with other standard international classifications of activities and products, as well as to take into account the new recommendations in related areas (e.g., in the International Recommendations for Industrial Statistics, 2008, the forthcoming SEEA-Energy and the United Nations Framework Classification for Energy and Mineral Resources);
(e) Recognize that, depending on a country’s circumstances, the responsibility for the compilation and dissemination of official energy statistics may be vested in national statistical offices, ministries of energy or other specialized agencies. Regardless of where this responsibility lies, the agency contributing to official energy statistics should be committed to adhering to the statistical standards of quality;
( f ) Promote uniformity in the international reporting of energy data required for dealing with global challenges such as sustainable development, energy security or climate change, and for meeting other international needs, including improve-ment in coverage and quality of the United Nations energy statistics database and energy databases of other international and regional organizations.
C. Users and uses of energy statistics1.24. Energy statistics are a specialized field of statistics whose scope has been evolving over time and broadly covers (i) extraction, production, transformation, distribution, stor-age, trade and final consumption of energy products and (ii) the main characteristics and activities of the energy industries (see chapter II for details). Energy statistics are seen as a multipurpose body of data. Therefore, in the preparation of international recommendations for these statistics the needs of the various user groups were taken into account. The main user groups and their needs are briefly described below.
1.25. Energy policy makers. Policy makers use energy statistics for the formulation of energy strategies and for monitoring their implementation. In this context, energy statistics are required, inter alia, for the following:
(a) Formulation of energy policies and monitoring their impact on the economy. The formulation of energy policies and the monitoring of their impact on the economy are critically important for countries, as energy availability directly affects production, imports, exports and investment, all of which have a signifi-cant impact on a country’s economy. Detailed and high-quality energy statistics provide policy makers with the information needed to make informed decisions and evaluate possible trade-offs. For example, in the context of global price shocks in commodities, such as oil and gas, policy makers may want to monitor the impact of national subsidy programmes for those fuels. In other situations, poli-cies on whether certain energy products can be better used for food or used as fuel may be examined;
7Introduction 7
(b) Monitoring of national energy security. For the assessment of national energy security, detailed statistics on energy supply, transformation, demand and stock levels are indispensable. Data on production, trade, consumption, stock levels and stock changes are politically sensitive, as problems with energy supply may be perceived as a threat to national independence, especially if national energy sources do not meet energy demand;
(c) Planning of energy industries’ development and promotion of energy-conserving technological processes. A basic prerequisite for such strategic planning is the availability of systematic and detailed data covering the range of primary and secondary energy products, as well as their flow from production to final con-sumption. This would allow for assessment of the economic efficiency of various energy production processes and energy consumption, and for building econo-metric models for forecasting and planning future investments in the various energy industries and in energy conserving technological processes;
(d) Environmental policy, especially greenhouse gas emission inventories, and environmental statistics. There is a growing concern about the environmental effects caused by emissions of greenhouse gases and other air pollutants from the use of energy, especially from the use of fossil fuels. Enabling energy statistics to meet the demand from environment statistics, especially concerning the emission of greenhouse gases, must be one of the top priorities.
1.26. Business community. The availability of detailed energy statistics is critical for the business community in general and for energy industries in particular, for evaluating various business options, assessing opportunities for new investments and analysing the energy mar-ket. Basic energy statistics have to be relevant for those experts who follow energy markets, as in many countries changes in energy markets and energy prices will have a strong effect on the economic situation.
1.27. Compilers and users of national accounts. In most systems of official statistics, national accounts play a crucial role as they give the national picture of the economic situ-ation and trends, covering all production sectors, including energy, and all uses of goods and services. Basic economic statistics, including energy statistics, are needed to meet the demands of the national accounts.
1.28. Compilers of the System of Environmental-Economic Accounting for Energy (SEEA-Energy). The SEEA-Energy expands the conventional national accounts to better describe the extraction of energy from the environment, the use and supply of energy products within the economy and the flows from the economy to the environment. Energy statistics are the basis for the compilation of the SEEA-Energy, which organizes and integrates them in a common framework together with economic statistics, thus providing additional information relevant to the formulation and monitoring of energy policy.
1.29. International organizations. As international organizations were tasked with moni-toring global developments, including those related to energy and the environment, they need energy statistics to carry out their activities. Therefore, international reporting obligations are an important factor to be taken into account in developing energy statistics.
1.30. General public. The general public benefits from the availability of timely energy statistics for evaluating the energy and environmental situation in order to make informed judgements about the various options for energy policy. For example, information on energy consumption, its costs, prices, and market trends will contribute to the public debate about efficiency, sustainability and the economy.
International Recommendations for Energy Statistics (IRES)8
D. IRES development process 1.31. The revision process included the preparation of an annotated outline of IRES for worldwide consultation with countries and international organizations on its scope and con-tent, the holding of an International Workshop on Energy Statistics (Mexico, 2–5 December 2008) to provide an opportunity for developing countries to express their concerns and discuss possible solutions, the preparation of the draft recommendations and their review by the fourth and fifth meetings of the Oslo Group, a worldwide consultation on the provisional draft of IRES, as well as review and endorsement of the draft IRES by the second meeting of the United Nations Expert Group on Energy Statistics (New York, 2–5 November 2010).
1.32. The Oslo Group, with Statistics Norway serving as its secretariat, and InterEnerStat, chaired by the IEA, were the key content providers to IRES in accordance with the mandates given to them by the Commission. The London Group and the United Nations Expert Group on International Economic and Social Classifications were consulted in the process as well.
1.33. UNSD coordinated and organized worldwide consultations, provided substantive inputs on various topics and was responsible for consolidating and editing various successive versions of the draft IRES.
1.34. Guiding principles for the development of IRES. The Oslo Group agreed on the following principles to guide the preparation of IRES:
(a) The needs of major user groups should be considered as a starting point and be taken into account, to the maximum extent possible, to ensure that the data com-piled according to the new recommendations are policy relevant, meet the needs of the energy community (both producers and users) and provide a solid founda-tion for the integration of energy statistics into a broader accounting framework;
(b) The development should be conducted in close consultation with both national statistical offices and national energy agencies, as well as with the relevant inter-national and supranational organizations;
(c) While providing recommendations on data items and their definitions, care should be taken so that: (i) necessary data sources are generally available in coun-tries to compile such data; (ii) the collection of such data items does not create a significant additional reporting burden; and (iii) the collection procedures can be implemented by most countries to ensure improved cross-country comparability;
(d) The development should be seen in the context of promoting an integrated approach in the national statistical system, which requires, to the extent pos-sible, the use of harmonized concepts and classifications and standardized data compilation methods in order to achieve maximum efficiency and minimize the reporting burden;
(e) Additional guidance on more practical/technical matters to assist countries in the implementation of IRES should be provided in the forthcoming ESCM. Dur-ing the revision process, the Oslo Group will decide on what will be covered in ESCM and to what extent.
E. Structure of IRES 1.35. The IRES is structured in accordance with its objectives and contains eleven chapters and three annexes. The content of each chapter is briefly described below.
9Introduction 9
1.36. Chapter I. Introduction. This chapter provides background information, formulates the objectives of IRES, describes its target audience and outlines its content. It is emphasized that the main objective of IRES is to provide a firm foundation for the long-term develop-ment of energy statistics as part of official statistics based on the United Nations Fundamental Principles of Official Statistics. The chapter stresses the importance of energy statistics for sound decision- and policymaking, and identifies major user groups and their needs.
1.37. Chapter II. Scope of energy statistics. The purpose of this chapter is to define the scope and coverage of energy statistics. The chapter recommends treating energy statistics as a complete system to understand energy stocks and flows, energy infrastructure, performance of the energy industries and the availability of energy resources. The scope of energy statistics is defined in terms of energy products, energy flows, the reference territory, energy industries, energy consumers, energy resources and reserves.
1.38. Chapter III. Standard International Energy Product Classification. This chapter introduces the Standard International Energy Product Classification (SIEC), which organ-izes the internationally agreed definitions of energy products into a hierarchical classifica-tion system, reflects the relationships between them and provides a coding system for use in data collection and data processing. The chapter describes the SIEC classification scheme and its relationships with the Harmonized Commodity Description and Coding System 2007 (HS 2007) and the Central Product Classification Version 2 (CPC Ver. 2). A supplementary characterization of SIEC products as primary and secondary products and renewable and non-renewable products is provided in annex A.
1.39. Chapter IV. Measurement units and conversion factors. This chapter describes physi-cal units of measurement for the different products, recommends common units of measure-ment, and provides recommendations on the calculation and reporting of calorific values. In the absence of specific calorific values, default calorific values are presented.
1.40. Chapter V. Energy flows. This chapter contains a general overview of the process through which energy products appear on national territory, and are traded and consumed within a country. It provides definitions of energy flows such as energy production, trans-formation, non-energy use, final energy consumption, etc. The chapter describes the main groups of economic units relevant to energy statistics (e.g., energy industries, other energy producers and energy consumers), and provides necessary information to facilitate the under-standing of the data items presented in chapter VI.
1.41. Chapter VI. Statistical units and data items. This chapter contains recommenda-tions on the statistical units (and their characteristics) and the reference list of data items for collection. The list covers: characteristics of statistical units; data items on energy stock and flows; data items on production and storage capacity; data items for the assessment of eco-nomic performance; and data items on reserves of mineral and energy resources. This chapter provides a basis for the subsequent chapters on data collection and compilation (chapter VII), as well as the construction of energy balances (chapter VIII). While chapter V provides gen-eral definitions of flows, chapter VI explains possible exceptions and details to be taken into account for specific products in the definition of particular data items.
1.42. Chapter VII. Data collection and compilation. This chapter reviews the different elements for the production of high-quality energy statistics. The importance and principles of an effective institutional and legal framework are emphasized and promoted. The chapter provides an overview of the data collection strategies and focuses on the main types of data sources (e.g., surveys, administrative data, etc.) and key elements of the data compilation methods. Details on more practical aspect of data collection/compilation, such as the estima-tion methods and imputation, are deferred to the ESCM.

International Recommendations for Energy Statistics (IRES)10
1.43. Chapter VIII. Energy balances. This chapter describes the importance of energy balances for making informed policy decisions and their role in organizing energy statistics in a coherent system. It contains recommendations on the compilation of balances based on concepts, definitions, classifications and data items described in the previous chapters. The chapter covers the presentation of energy supply, transformation and consumption, as well as other flows in the format of an energy balance.
1.44. Chapter IX. Data quality assurance and metadata. This chapter describes the main dimensions of energy data quality and provides recommendations on how to set up a national energy data quality framework, including development and use of indicators of quality and data quality reporting. The importance of metadata availability for ensuring a high quality of energy statistics is stressed as well.
1.45. Chapter X. Dissemination. This chapter formulates recommendations on energy statistics dissemination mechanisms, addressing data confidentiality, data access, release schedules, data revisions, dissemination formats and reporting to international/regional organizations.
1.46. Chapter XI. Uses of basic energy statistics and balances. This chapter provides some examples of important uses of energy statistics and balances. The use of energy statistics and energy balances for the compilation of energy accounts of SEEA-Energy is discussed, including a brief elaboration of conceptual differences. This chapter also presents examples of energy indicators linked to the social, economic and environmental dimensions and to the compilation of statistics on greenhouse gas (GHG) emissions.
1.47. IRES contains two annexes that provide: (i) the characterization of SIEC products as primary and secondary products, as well as renewable and non-renewable products; and (ii) tables on conversion factors, calorific values and measurement units. A bibliography is also provided.
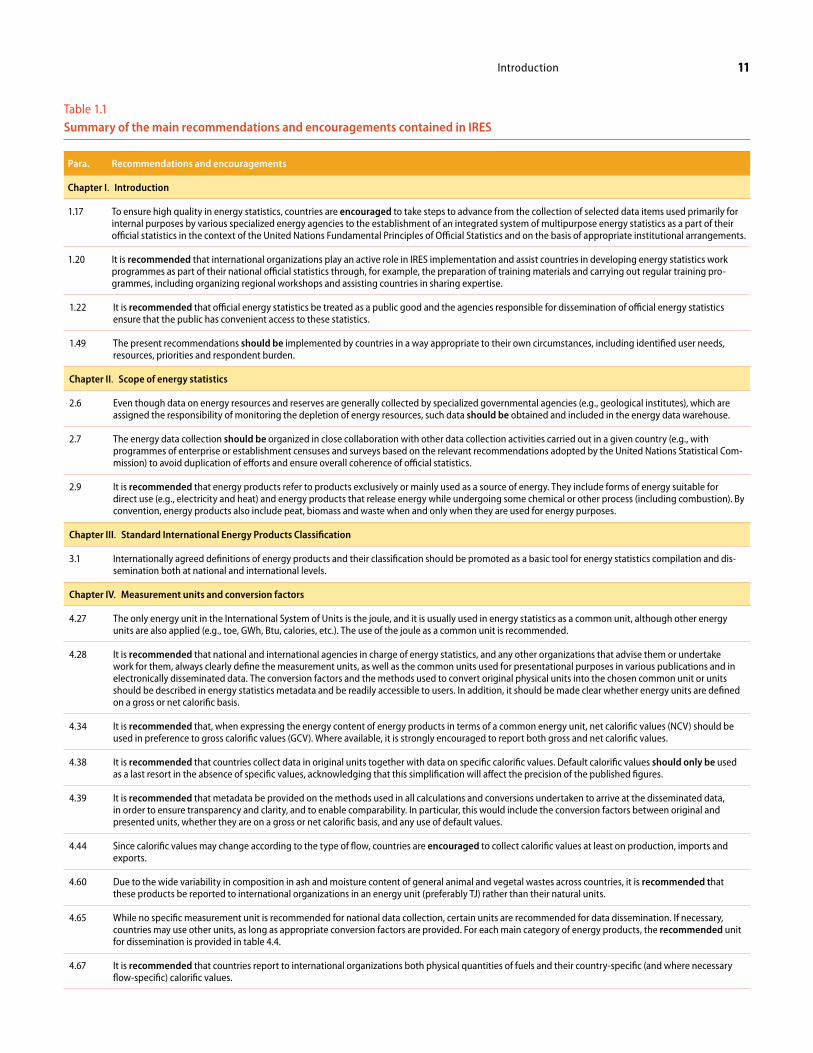
F. Summary of recommendations1.48. IRES contains numerous recommendations and encouragements on various issues relevant to the collection, compilation and dissemination of energy statistics. The table on the following pages is intended to assist the reader by highlighting the main recommenda-tions and encouragements. It should be noted, however, that, in many cases, the correct interpretation of a particular recommendation or encouragement requires familiarity with the full IRES text.
11Introduction 11
Table 1.1Summary of the main recommendations and encouragements contained in IRES
Para. Recommendations and encouragements
Chapter I. Introduction
1.17 To ensure high quality in energy statistics, countries are encouraged to take steps to advance from the collection of selected data items used primarily for internal purposes by various specialized energy agencies to the establishment of an integrated system of multipurpose energy statistics as a part of their official statistics in the context of the United Nations Fundamental Principles of Official Statistics and on the basis of appropriate institutional arrangements.
1.20 It is recommended that international organizations play an active role in IRES implementation and assist countries in developing energy statistics work programmes as part of their national official statistics through, for example, the preparation of training materials and carrying out regular training pro-grammes, including organizing regional workshops and assisting countries in sharing expertise.
1.22 It is recommended that official energy statistics be treated as a public good and the agencies responsible for dissemination of official energy statistics ensure that the public has convenient access to these statistics.
1.49 The present recommendations should be implemented by countries in a way appropriate to their own circumstances, including identified user needs, resources, priorities and respondent burden.
Chapter II. Scope of energy statistics
2.6 Even though data on energy resources and reserves are generally collected by specialized governmental agencies (e.g., geological institutes), which are assigned the responsibility of monitoring the depletion of energy resources, such data should be obtained and included in the energy data warehouse.
2.7 The energy data collection should be organized in close collaboration with other data collection activities carried out in a given country (e.g., with programmes of enterprise or establishment censuses and surveys based on the relevant recommendations adopted by the United Nations Statistical Com-mission) to avoid duplication of efforts and ensure overall coherence of official statistics.
2.9 It is recommended that energy products refer to products exclusively or mainly used as a source of energy. They include forms of energy suitable for direct use (e.g., electricity and heat) and energy products that release energy while undergoing some chemical or other process (including combustion). By convention, energy products also include peat, biomass and waste when and only when they are used for energy purposes.
Chapter III. Standard International Energy Products Classification
3.1 Internationally agreed definitions of energy products and their classification should be promoted as a basic tool for energy statistics compilation and dis-semination both at national and international levels.
Chapter IV. Measurement units and conversion factors
4.27 The only energy unit in the International System of Units is the joule, and it is usually used in energy statistics as a common unit, although other energy units are also applied (e.g., toe, GWh, Btu, calories, etc.). The use of the joule as a common unit is recommended.
4.28 It is recommended that national and international agencies in charge of energy statistics, and any other organizations that advise them or undertake work for them, always clearly define the measurement units, as well as the common units used for presentational purposes in various publications and in electronically disseminated data. The conversion factors and the methods used to convert original physical units into the chosen common unit or units should be described in energy statistics metadata and be readily accessible to users. In addition, it should be made clear whether energy units are defined on a gross or net calorific basis.
4.34 It is recommended that, when expressing the energy content of energy products in terms of a common energy unit, net calorific values (NCV) should be used in preference to gross calorific values (GCV). Where available, it is strongly encouraged to report both gross and net calorific values.
4.38 It is recommended that countries collect data in original units together with data on specific calorific values. Default calorific values should only be used as a last resort in the absence of specific values, acknowledging that this simplification will affect the precision of the published figures.
4.39 It is recommended that metadata be provided on the methods used in all calculations and conversions undertaken to arrive at the disseminated data, in order to ensure transparency and clarity, and to enable comparability. In particular, this would include the conversion factors between original and presented units, whether they are on a gross or net calorific basis, and any use of default values.
4.44 Since calorific values may change according to the type of flow, countries are encouraged to collect calorific values at least on production, imports and exports.
4.60 Due to the wide variability in composition in ash and moisture content of general animal and vegetal wastes across countries, it is recommended that these products be reported to international organizations in an energy unit (preferably TJ) rather than their natural units.
4.65 While no specific measurement unit is recommended for national data collection, certain units are recommended for data dissemination. If necessary, countries may use other units, as long as appropriate conversion factors are provided. For each main category of energy products, the recommended unit for dissemination is provided in table 4.4.
4.67 It is recommended that countries report to international organizations both physical quantities of fuels and their country-specific (and where necessary flow-specific) calorific values.
International Recommendations for Energy Statistics (IRES)12
Para. Recommendations and encouragements
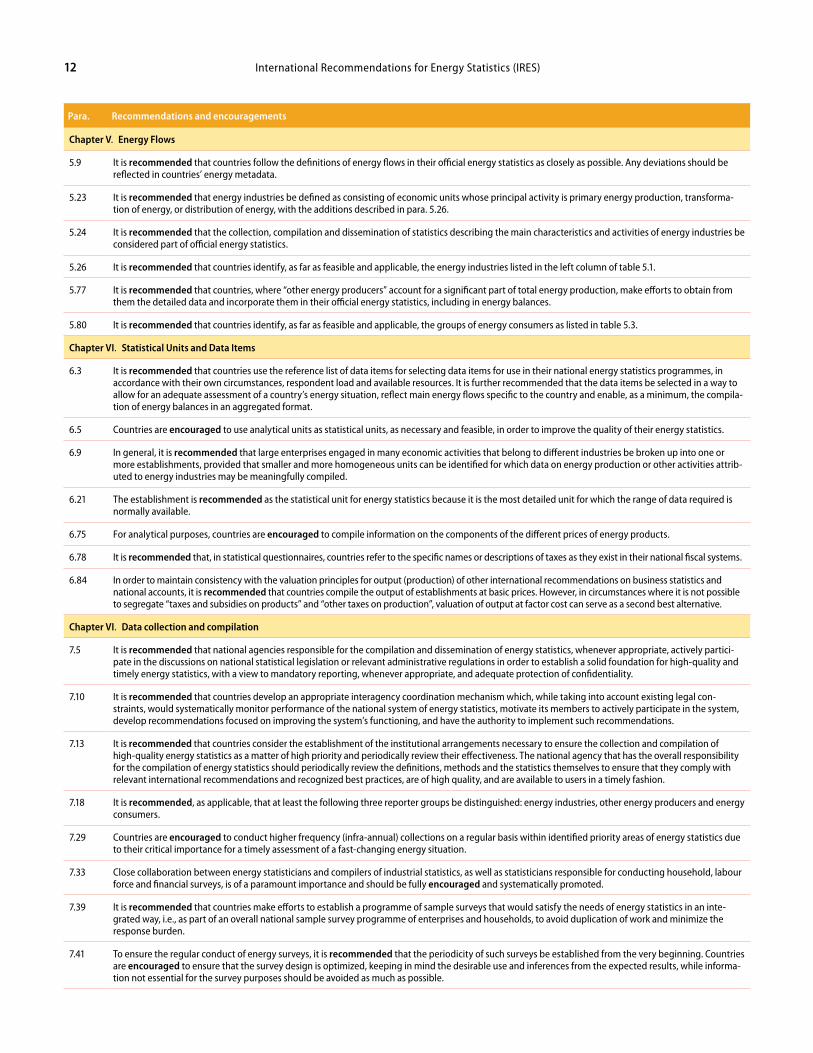
Chapter V. Energy Flows
5.9 It is recommended that countries follow the definitions of energy flows in their official energy statistics as closely as possible. Any deviations should be reflected in countries’ energy metadata.
5.23 It is recommended that energy industries be defined as consisting of economic units whose principal activity is primary energy production, transforma-tion of energy, or distribution of energy, with the additions described in para. 5.26.
5.24 It is recommended that the collection, compilation and dissemination of statistics describing the main characteristics and activities of energy industries be considered part of official energy statistics.
5.26 It is recommended that countries identify, as far as feasible and applicable, the energy industries listed in the left column of table 5.1.
5.77 It is recommended that countries, where “other energy producers” account for a significant part of total energy production, make efforts to obtain from them the detailed data and incorporate them in their official energy statistics, including in energy balances.
5.80 It is recommended that countries identify, as far as feasible and applicable, the groups of energy consumers as listed in table 5.3.
Chapter VI. Statistical Units and Data Items
6.3 It is recommended that countries use the reference list of data items for selecting data items for use in their national energy statistics programmes, in accordance with their own circumstances, respondent load and available resources. It is further recommended that the data items be selected in a way to allow for an adequate assessment of a country’s energy situation, reflect main energy flows specific to the country and enable, as a minimum, the compila-tion of energy balances in an aggregated format.
6.5 Countries are encouraged to use analytical units as statistical units, as necessary and feasible, in order to improve the quality of their energy statistics.
6.9 In general, it is recommended that large enterprises engaged in many economic activities that belong to different industries be broken up into one or more establishments, provided that smaller and more homogeneous units can be identified for which data on energy production or other activities attrib-uted to energy industries may be meaningfully compiled.
6.21 The establishment is recommended as the statistical unit for energy statistics because it is the most detailed unit for which the range of data required is normally available.
6.75 For analytical purposes, countries are encouraged to compile information on the components of the different prices of energy products.
6.78 It is recommended that, in statistical questionnaires, countries refer to the specific names or descriptions of taxes as they exist in their national fiscal systems.
6.84 In order to maintain consistency with the valuation principles for output (production) of other international recommendations on business statistics and national accounts, it is recommended that countries compile the output of establishments at basic prices. However, in circumstances where it is not possible to segregate “taxes and subsidies on products” and “other taxes on production”, valuation of output at factor cost can serve as a second best alternative.
Chapter VI. Data collection and compilation
7.5 It is recommended that national agencies responsible for the compilation and dissemination of energy statistics, whenever appropriate, actively partici-pate in the discussions on national statistical legislation or relevant administrative regulations in order to establish a solid foundation for high-quality and timely energy statistics, with a view to mandatory reporting, whenever appropriate, and adequate protection of confidentiality.
7.10 It is recommended that countries develop an appropriate interagency coordination mechanism which, while taking into account existing legal con-straints, would systematically monitor performance of the national system of energy statistics, motivate its members to actively participate in the system, develop recommendations focused on improving the system’s functioning, and have the authority to implement such recommendations.
7.13 It is recommended that countries consider the establishment of the institutional arrangements necessary to ensure the collection and compilation of high-quality energy statistics as a matter of high priority and periodically review their effectiveness. The national agency that has the overall responsibility for the compilation of energy statistics should periodically review the definitions, methods and the statistics themselves to ensure that they comply with relevant international recommendations and recognized best practices, are of high quality, and are available to users in a timely fashion.
7.18 It is recommended, as applicable, that at least the following three reporter groups be distinguished: energy industries, other energy producers and energy consumers.
7.29 Countries are encouraged to conduct higher frequency (infra-annual) collections on a regular basis within identified priority areas of energy statistics due to their critical importance for a timely assessment of a fast-changing energy situation.
7.33 Close collaboration between energy statisticians and compilers of industrial statistics, as well as statisticians responsible for conducting household, labour force and financial surveys, is of a paramount importance and should be fully encouraged and systematically promoted.
7.39 It is recommended that countries make efforts to establish a programme of sample surveys that would satisfy the needs of energy statistics in an inte-grated way, i.e., as part of an overall national sample survey programme of enterprises and households, to avoid duplication of work and minimize the response burden.
7.41 To ensure the regular conduct of energy surveys, it is recommended that the periodicity of such surveys be established from the very beginning. Countries are encouraged to ensure that the survey design is optimized, keeping in mind the desirable use and inferences from the expected results, while informa-tion not essential for the survey purposes should be avoided as much as possible.
13Introduction 13
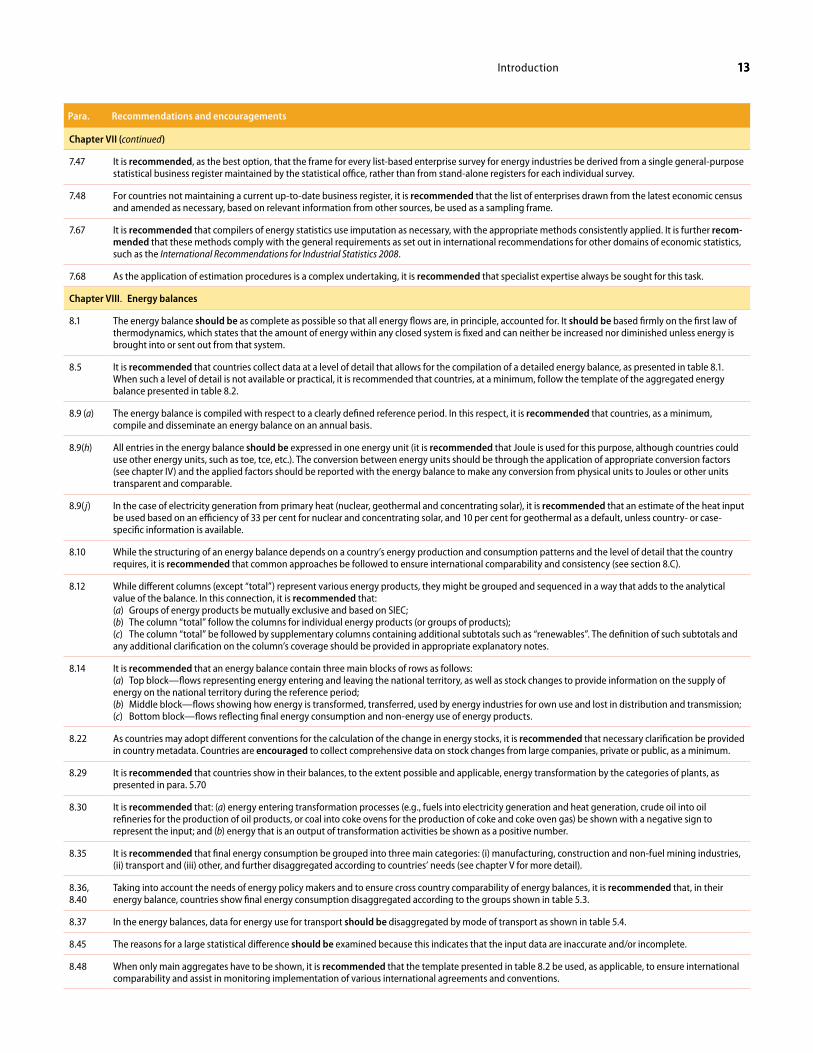
Para. Recommendations and encouragements
Chapter VII (continued)
7.47 It is recommended, as the best option, that the frame for every list-based enterprise survey for energy industries be derived from a single general-purpose statistical business register maintained by the statistical office, rather than from stand-alone registers for each individual survey.
7.48 For countries not maintaining a current up-to-date business register, it is recommended that the list of enterprises drawn from the latest economic census and amended as necessary, based on relevant information from other sources, be used as a sampling frame.
7.67 It is recommended that compilers of energy statistics use imputation as necessary, with the appropriate methods consistently applied. It is further recom-mended that these methods comply with the general requirements as set out in international recommendations for other domains of economic statistics, such as the International Recommendations for Industrial Statistics 2008.
7.68 As the application of estimation procedures is a complex undertaking, it is recommended that specialist expertise always be sought for this task.
Chapter VIII. Energy balances
8.1 The energy balance should be as complete as possible so that all energy flows are, in principle, accounted for. It should be based firmly on the first law of thermodynamics, which states that the amount of energy within any closed system is fixed and can neither be increased nor diminished unless energy is brought into or sent out from that system.
8.5 It is recommended that countries collect data at a level of detail that allows for the compilation of a detailed energy balance, as presented in table 8.1. When such a level of detail is not available or practical, it is recommended that countries, at a minimum, follow the template of the aggregated energy balance presented in table 8.2.
8.9 (a) The energy balance is compiled with respect to a clearly defined reference period. In this respect, it is recommended that countries, as a minimum, compile and disseminate an energy balance on an annual basis.
8.9(h) All entries in the energy balance should be expressed in one energy unit (it is recommended that Joule is used for this purpose, although countries could use other energy units, such as toe, tce, etc.). The conversion between energy units should be through the application of appropriate conversion factors (see chapter IV) and the applied factors should be reported with the energy balance to make any conversion from physical units to Joules or other units transparent and comparable.
8.9( j) In the case of electricity generation from primary heat (nuclear, geothermal and concentrating solar), it is recommended that an estimate of the heat input be used based on an efficiency of 33 per cent for nuclear and concentrating solar, and 10 per cent for geothermal as a default, unless country- or case-specific information is available.
8.10 While the structuring of an energy balance depends on a country’s energy production and consumption patterns and the level of detail that the country requires, it is recommended that common approaches be followed to ensure international comparability and consistency (see section 8.C).
8.12 While different columns (except “total”) represent various energy products, they might be grouped and sequenced in a way that adds to the analytical value of the balance. In this connection, it is recommended that: (a) Groups of energy products be mutually exclusive and based on SIEC;(b) The column “total” follow the columns for individual energy products (or groups of products);(c) The column “total” be followed by supplementary columns containing additional subtotals such as “renewables”. The definition of such subtotals and any additional clarification on the column’s coverage should be provided in appropriate explanatory notes.
8.14 It is recommended that an energy balance contain three main blocks of rows as follows: (a) Top block—flows representing energy entering and leaving the national territory, as well as stock changes to provide information on the supply of energy on the national territory during the reference period;(b) Middle block—flows showing how energy is transformed, transferred, used by energy industries for own use and lost in distribution and transmission;(c) Bottom block—flows reflecting final energy consumption and non-energy use of energy products.
8.22 As countries may adopt different conventions for the calculation of the change in energy stocks, it is recommended that necessary clarification be provided in country metadata. Countries are encouraged to collect comprehensive data on stock changes from large companies, private or public, as a minimum.
8.29 It is recommended that countries show in their balances, to the extent possible and applicable, energy transformation by the categories of plants, as presented in para. 5.70
8.30 It is recommended that: (a) energy entering transformation processes (e.g., fuels into electricity generation and heat generation, crude oil into oil refineries for the production of oil products, or coal into coke ovens for the production of coke and coke oven gas) be shown with a negative sign to represent the input; and (b) energy that is an output of transformation activities be shown as a positive number.
8.35 It is recommended that final energy consumption be grouped into three main categories: (i) manufacturing, construction and non-fuel mining industries, (ii) transport and (iii) other, and further disaggregated according to countries’ needs (see chapter V for more detail).
8.36, 8.40
Taking into account the needs of energy policy makers and to ensure cross country comparability of energy balances, it is recommended that, in their energy balance, countries show final energy consumption disaggregated according to the groups shown in table 5.3.
8.37 In the energy balances, data for energy use for transport should be disaggregated by mode of transport as shown in table 5.4.
8.45 The reasons for a large statistical difference should be examined because this indicates that the input data are inaccurate and/or incomplete.
8.48 When only main aggregates have to be shown, it is recommended that the template presented in table 8.2 be used, as applicable, to ensure international comparability and assist in monitoring implementation of various international agreements and conventions.
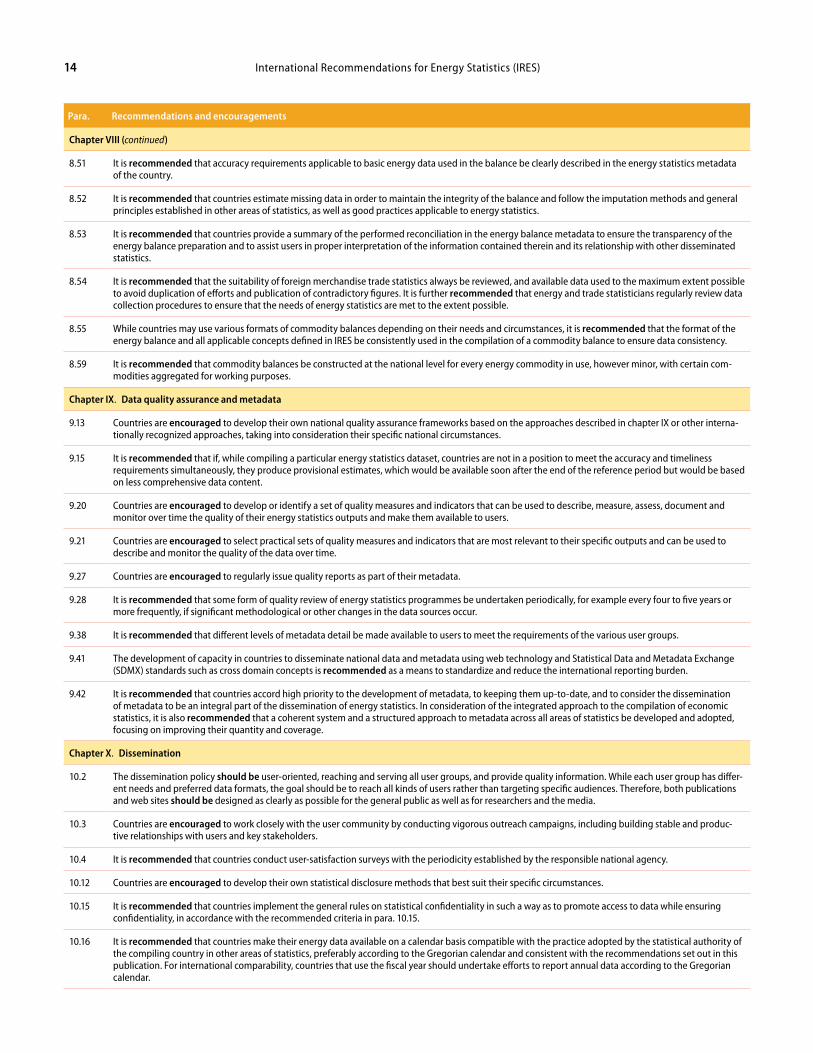
International Recommendations for Energy Statistics (IRES)14
Para. Recommendations and encouragements
Chapter VIII (continued)
8.51 It is recommended that accuracy requirements applicable to basic energy data used in the balance be clearly described in the energy statistics metadata of the country.
8.52 It is recommended that countries estimate missing data in order to maintain the integrity of the balance and follow the imputation methods and general principles established in other areas of statistics, as well as good practices applicable to energy statistics.
8.53 It is recommended that countries provide a summary of the performed reconciliation in the energy balance metadata to ensure the transparency of the energy balance preparation and to assist users in proper interpretation of the information contained therein and its relationship with other disseminated statistics.
8.54 It is recommended that the suitability of foreign merchandise trade statistics always be reviewed, and available data used to the maximum extent possible to avoid duplication of efforts and publication of contradictory figures. It is further recommended that energy and trade statisticians regularly review data collection procedures to ensure that the needs of energy statistics are met to the extent possible.
8.55 While countries may use various formats of commodity balances depending on their needs and circumstances, it is recommended that the format of the energy balance and all applicable concepts defined in IRES be consistently used in the compilation of a commodity balance to ensure data consistency.
8.59 It is recommended that commodity balances be constructed at the national level for every energy commodity in use, however minor, with certain com-modities aggregated for working purposes.
Chapter IX. Data quality assurance and metadata
9.13 Countries are encouraged to develop their own national quality assurance frameworks based on the approaches described in chapter IX or other interna-tionally recognized approaches, taking into consideration their specific national circumstances.
9.15 It is recommended that if, while compiling a particular energy statistics dataset, countries are not in a position to meet the accuracy and timeliness requirements simultaneously, they produce provisional estimates, which would be available soon after the end of the reference period but would be based on less comprehensive data content.
9.20 Countries are encouraged to develop or identify a set of quality measures and indicators that can be used to describe, measure, assess, document and monitor over time the quality of their energy statistics outputs and make them available to users.
9.21 Countries are encouraged to select practical sets of quality measures and indicators that are most relevant to their specific outputs and can be used to describe and monitor the quality of the data over time.
9.27 Countries are encouraged to regularly issue quality reports as part of their metadata.
9.28 It is recommended that some form of quality review of energy statistics programmes be undertaken periodically, for example every four to five years or more frequently, if significant methodological or other changes in the data sources occur.
9.38 It is recommended that different levels of metadata detail be made available to users to meet the requirements of the various user groups.
9.41 The development of capacity in countries to disseminate national data and metadata using web technology and Statistical Data and Metadata Exchange (SDMX) standards such as cross domain concepts is recommended as a means to standardize and reduce the international reporting burden.
9.42 It is recommended that countries accord high priority to the development of metadata, to keeping them up-to-date, and to consider the dissemination of metadata to be an integral part of the dissemination of energy statistics. In consideration of the integrated approach to the compilation of economic statistics, it is also recommended that a coherent system and a structured approach to metadata across all areas of statistics be developed and adopted, focusing on improving their quantity and coverage.
Chapter X. Dissemination
10.2 The dissemination policy should be user-oriented, reaching and serving all user groups, and provide quality information. While each user group has differ-ent needs and preferred data formats, the goal should be to reach all kinds of users rather than targeting specific audiences. Therefore, both publications and web sites should be designed as clearly as possible for the general public as well as for researchers and the media.
10.3 Countries are encouraged to work closely with the user community by conducting vigorous outreach campaigns, including building stable and produc-tive relationships with users and key stakeholders.
10.4 It is recommended that countries conduct user-satisfaction surveys with the periodicity established by the responsible national agency.
10.12 Countries are encouraged to develop their own statistical disclosure methods that best suit their specific circumstances.
10.15 It is recommended that countries implement the general rules on statistical confidentiality in such a way as to promote access to data while ensuring confidentiality, in accordance with the recommended criteria in para. 10.15.
10.16 It is recommended that countries make their energy data available on a calendar basis compatible with the practice adopted by the statistical authority of the compiling country in other areas of statistics, preferably according to the Gregorian calendar and consistent with the recommendations set out in this publication. For international comparability, countries that use the fiscal year should undertake efforts to report annual data according to the Gregorian calendar.

15Introduction 15
Para. Recommendations and encouragements
Chapter X (continued)
10.17 It is recommended that countries announce in advance the precise dates on which various series of energy statistics will be released. This advance release schedule should be posted at the beginning of each year on the website of the national agency responsible for the dissemination of the official energy statistics.
10.19 Taking into account both the policy needs and prevailing data compilation practices, countries are encouraged to:(a) Release their monthly data within two calendar months after the end of the reference month, at least at the most aggregated level;(b) Release their quarterly data within three calendar months after the end of the reference quarter; and(c) Release their annual data within fifteen calendar months after the end of the reference year.
10.20 The early release of provisional estimates within one calendar month for monthly data on specific flows and products and within nine to twelve calendar months for annual data is encouraged.
10.22 Provisional data should be revised when new and more accurate information becomes available. Such practice is recommended if countries can ensure consistency between provisional and final data.
10.24 With respect to routine revisions, it is recommended that countries develop a revision policy that is synchronized with the release calendar. It is recom-mended that these revisions be subject to prior notification to users to explain why revisions are necessary and to provide information on their possible impact on the released outputs.
10.25 Countries are encouraged to develop a revision policy for energy statistics that is carefully managed and well-coordinated with other areas of statistics.
10.26 It is recommended that energy statistics be made available electronically, but countries are encouraged to choose the dissemination format that best suits their users’ needs.
10.27 Countries are encouraged to harmonize their data with international standards, follow the recommendations provided in chapter IX on data quality assur-ance and metadata for energy statistics, and develop and disseminate metadata in accordance with the recommendations provided.
10.28 It is recommended that countries disseminate their energy statistics internationally as soon as they become available to national users and without any additional restrictions. To ensure a speedy and accurate data transfer to international and regional organizations, it is recommended that countries use SDMX format in the exchange and sharing of their data.
Chapter XI. Uses of basic energy statistics and balances
11.28 Due to differences between basic energy statistics/energy balances and energy accounts, countries are encouraged to clearly document and make available the methods used for the reallocation and adjustment of data provided by basic energy statistics and balances to energy accounts.
11.33 The list of indicators presented in chapter XI is not exhaustive. Countries are encouraged to develop the list of relevant indicators according to their policy concerns and data availability.
11.34 For greenhouse gas emissions, countries are encouraged to make additional efforts to verify the compiled data and make any necessary adjustments in order to ensure that the calculated emissions are internationally comparable.
G. Implementation and revision policy1.49. The present recommendations should be implemented by countries in a way appro-priate to their own circumstances, including identified user needs, resources, priorities and respondent burden. Additional guidance on more practical/technical matters (e.g., good prac-tices, country case studies, etc.) relevant to the implementation of IRES will be provided in the ESCM, which is envisaged to be updated more frequently than IRES.
1.50. Recommendations and encouragements. For the purposes of IRES, the term “recom-mended” refers to a standard with which countries should comply, while the term “encour-aged” indicates a desirable practice that is not part of the standard as such. With respect to issues that might be relevant to compilers and users of energy statistics but that are not explicitly covered in IRES, countries are encouraged to develop their own treatments and clearly document them in their metadata.
1.51. The IRES updating process is foreseen as a recurrent and well-organized procedure. While preparation of editorial amendments and clarifications beyond dispute is the respon-sibility of UNSD, any substantive changes in IRES will be discussed with countries and relevant working groups before being endorsed by the United Nations Expert Group on Energy Statistics and submitted to the United Nations Statistical Commission for adoption.

17
Chapter II
Scope of energy statistics
A. Energy and energy statistics 2.1. Energy and its forms. Energy, as generally understood in physics, is the capacity of a physical system to do work. Energy exists in different forms, such as light, heat and motion, but they can all be put into two categories: potential energy (e.g., the energy “stored” in mat-ter) and kinetic energy (the energy of motion). Examples of potential energy are chemical energy (energy stored in the bonds of atoms and molecules), water stored in a reservoir at a height (the potential energy stored is released when the water is allowed to fall/flow through a turbine) and nuclear energy (energy stored in the nucleus of an atom). Examples of kinetic energy are wind and falling water. When wind is blowing, it contains kinetic energy. Simi-larly, when the potential energy of a reservoir of water is released it becomes kinetic energy, which is then captured in a turbine.
2.2. Energy in the statistical context. Not all energy is an object of statistical observa-tion. Energy existing in nature and not having a direct impact on society is not measured and monitored as part of energy statistics; however, national practices in this respect might differ. In order to assist countries in making their energy statistics more policy relevant and internationally comparable, this chapter provides recommendations on the scope of energy statistics by describing which kinds of energy are to be statistically observed and discusses related concepts and boundary issues. In this connection, it should be noted that the term “energy statistics” is widely used, not only by energy statisticians, but also by compilers of other statistics, policy makers and research institutions. Its meaning, as understood by differ-ent groups, varies from a rather narrow interpretation focusing on production and consump-tion of a few main energy products to broader versions covering basic energy statistics, energy balances and energy accounts.
2.3. Scope of energy statistics in IRES. The recommendations contained in this pub-lication are focused on basic energy statistics and energy balances. The basic energy statis-tics refer to statistics on energy stocks and flows, energy infrastructure, performance of the energy industries, and the availability of energy resources within the national territory of a given country during a reference period. Energy balances are an accounting framework for the compilation and reconciliation of data on all energy products entering, exiting and used within that territory. IRES provides a brief description of some of the uses of the basic energy statistics and energy balances, such as the compilation of environmental-economic accounts, energy indicators and greenhouse gas emissions, and identifies, wherever necessary, the main conceptual differences.
2.4. IRES promotes a multipurpose approach to energy statistics, in particular by empha-sizing the idea of an energy data warehouse as an efficient way of meeting the data needs of energy policy makers and energy analysts, as well as of compilers of energy accounts and national accounts. Such an energy data warehouse may provide convenient access to data on energy stocks and flows, as well as to selected statistics on energy producers and users (e.g., on energy infrastructure, employment and capital formation), selected data about the energy
International Recommendations for Energy Statistics (IRES)18
market (e.g., energy prices), statistics on reserves of mineral and energy resources, etc. It is recognized that additional data might be needed to respond to specific policy concerns and/or analytical questions. Countries may wish to identify such items and collect them according to their priorities and available resources.
2.5. Energy prices. IRES acknowledges the importance of the availability of reliable data on energy prices and their movements (e.g., import and export prices of energy products, consumer prices and their respective indices, etc.), as they are vital for monitoring energy markets and developing effective energy policies.
2.6. Mineral and energy resources. Energy resources refer to “all non-renewable energy resources of both inorganic and organic origins discovered in the earth’s crust in solid, liq-uid and gaseous form.”14 Energy reserves are part of the resources that, based on technical, economic and other relevant (e.g., environmental) considerations, could be recovered and for which extraction is justified to some extent. The exact definition of reserves depends on the kind of resources in focus. Even though data on energy resources and reserves are gen-erally collected by specialized governmental agencies (e.g., geological institutes), which are assigned the responsibility of monitoring the depletion of energy resources, such data should be obtained and included in the energy data warehouse.
2.7. Further elaboration of the scope of basic energy statistics is provided in the reference list of data items presented in chapter VI. It contains all items desirable for the compilation and dissemination of such statistics and serves as a reference list for countries to select the relevant data items for national compilation, taking into account their needs, priorities and resources. Given the interlinkages with other statistical domains (such as industrial and trade statistics), the concepts presented in IRES are, to the extent possible, harmonized with those of other statistical domains. It should be emphasized that the actual energy data collection should be organized in close collaboration with other data collection activities carried out in a given country (e.g., with programmes of enterprise or establishment censuses and surveys based on the relevant recommendations adopted by the United Nations Statistical Commis-sion, such as the International Recommendations for Industrial Statistics 2008 (UN 2009b), the International Recommendations for Distributive Trade Statistics 2008 (UN 2009a), or the International Merchandise Trade Statistics, Rev. 2 (UN 1998)), to avoid duplication of efforts and ensure overall coherence of official statistics.
B. Basic concepts and boundary issues: an overview 2.8. Energy statistics is a specialized statistical domain with a long history of usage of specific concepts and related terminology firmly incorporated in data compilation and dis-semination and widely accepted by the main users of energy statistics. In some cases, the terms used in energy statistics have different meaning in other statistical areas, such as in national accounts (see para. 5.16 for the example of “stocks”). In all cases in which such a situation exists, the differences in the term’s meaning will be acknowledged and explained.
2.9. Energy products. The term products is understood in the same way as in economic statistics where it refers to all goods and services that are the result of production.15 Energy products are a subset of products. As a general guideline, it is recommended that energy products refer to products exclusively or mainly used as a source of energy. They include forms of energy suitable for direct use (e.g., electricity and heat) and energy products that release energy while undergoing some chemical or other process (including combustion). By convention, energy products also include peat, biomass and waste when and only when they are used for energy purposes (see chapter III for details and classification of energy products).
14 ECE (2004) United Nations Framework Classification for Fossil Energy and Mineral Resources, pg. 1, available from www.unece .org/fileadmin/DAM/energy/se /pdfs/UNFC/UNFCemr.pdf.
15 See SNA 2008, para. 6.24 for a general definition of production and para. 5.10 of this publica-tion for a definition of energy production.
19Scope of energy statistics 19
2.10. Since a number of energy products are transformed into other kinds of energy prod-ucts prior to their consumption, a distinction is made between primary and secondary energy products. This distinction is necessary for various analytical purposes, including for avoid-ing the double-counting of energy production in cross-fuel tabulations, such as energy bal-ances. Energy products can be obtained from both renewable (e.g., solar, biomass, etc.) and non-renewable sources (e.g., coal, crude oil, etc.). It is important for both energy planning and environmental concerns to distinguish between renewable and non-renewable energy products, as well as to distinguish “infinite” renewable sources such as solar from cyclical renewable sources such as biomass. For definitions and additional information on primary, secondary, renewable and non-renewable energy products, see chapter V and annex A.
2.11. Boundary of energy products. The description of the boundary of the universe of energy products is not always straightforward. For example, corncobs can be: (1) combusted directly to produce heat; (2) used in the production of ethanol as a biofuel, (3) consumed as food, or (4) thrown away as waste. To assist countries in the delineation of energy products, IRES presents the SIEC, as well as the definitions of such products (see chapter III). Accord-ing to the scope of SIEC, corncobs, as such, are considered energy products for the purpose of energy statistics only in case (1) above, that is when they are combusted directly to produce heat (c.f. paragraph 3.10). In all other cases, they either do not fall within the boundary of energy statistics (when used as a source of food), or they enter the boundary of energy statistics as a different product (e.g. ethanol).
2.12. Energy flows. In general, energy flows describe the various activities of economic actors undertaken on the national territory of a compiling country, such as production of energy products, their import, export and use. It is crucial that official energy statistics estab-lish a broad understanding of the totality of energy flows and their impact on society and the environment. Chapter V of IRES presents energy flows in more detail.
2.13. Production boundary. As a general guideline, the energy production boundary includes the production of energy products by any economic unit, including households, whether or not the production is: (i) their principal, secondary or ancillary activity; and/or (ii) carried out for sale or delivery to other economic units or for own use. The definition of energy production and related concepts is provided in chapter V.
2.14. Reference territory. In general, the term “reference territory” defines the geographical scope of the statistics compiled and the criteria for allocating selected statistics to a particular territory. Energy statistics have historically responded, among others, to the policy concerns of the physical availability of energy and its uses within the territory of a country. Thus, the criteria for allocating certain statistics to the country follow the physical location of the units involved. The reference territory used in energy statistics and energy balances is the national territory and is defined as the geographic territory under the effective economic control of the national government. It comprises:
(a) The land area;
(b) Airspace;
(c) Territorial waters, including areas over which jurisdiction is exercised through fishing rights and rights to fuels or minerals.
2.15. In a maritime territory, the economic territory includes islands that belong to the territory. The national territory also includes any free trade zones, bonded warehouses or factories operated by enterprises under customs control within the areas described above. By convention, the territorial enclaves of other countries (e.g., embassies, consulates, military bases, scientific stations, etc.) are treated as part of the national territory where they are physically located.16
16 The latter differs from the treat-ment in national accounts (see SNA 2008, para. 4.11).
International Recommendations for Energy Statistics (IRES)20
2.16. The definition of reference territory recommended for energy statistics largely approxi-mates the economic territory of a country as used in economic statistics (see Balance of Pay-ments and International Investment Position Manual, para. 4.5 and SNA 2008, para. 4.11). However, it should be noted that the concept of economic territory in economic statistics (including in energy accounts) is used in conjunction with the concept of the residence of the economic unit, which is the determining factor in the allocation of the statistics to the economic territory.
2.17. Energy industries. Many countries publish indicators describing the activity of their energy industries. However, individual country practices in defining the boundary of the energy industries and the set of main indicators used to describe their activities may differ significantly. For example, units considered to be part of energy industries may engage in activities that are not related to energy. Even though these activities are not the main focus of energy statistics, they are addressed by some of the data items described in chapter VI. To improve international comparability of energy statistics, specific recommendations on the definition of energy industries are provided in chapter V.
2.18. Energy production outside the energy industries. It should be stressed that energy can be produced not only by energy industries but also by enterprises or establishments engaged in energy production as a secondary or ancillary activity. For example, aluminium producers may have their own power plant producing electricity primarily for internal con-sumption. A sugar cane processing plant may use the remains after juice extraction from the sugar cane (bagasse) as a fuel for heating. Similarly, waste materials (e.g., tires) can be inciner-ated with heat recovery at installations designed for the disposal of mixed wastes or co-fired with other fuels. In order to have a complete picture of the supply and demand of energy in a country, it is important that data on the production of energy outside the energy industries are also collected and included in total energy production.
2.19. Energy uses and energy consumers. Energy products can be used for various pur-poses (e.g., as an input in the production of secondary energy products or for final consump-tion) and by different user groups (e.g., various industries and households). The statistics on energy consumption are of great importance for setting energy policy and for assessing the efficiency of energy use, its environmental impact and others. The different types of energy consumers may be grouped into various categories as necessary for analytical purposes. Uses of energy products and user groups are further described in chapter V.
21
Chapter III
Standard International Energy Product Classification
A. Introduction3.1. In order to ensure cross-country and temporal comparability of energy statistics, as well as their comparability with other statistics, it is of paramount importance to have internationally agreed definitions of energy products and their classification. Such definitions and classification should be promoted as a basic tool for energy statistics compilation and dissemination both at national and international levels.
3.2. This chapter presents the list of internationally agreed definitions of energy products and the Standard International Energy Product Classification (SIEC), which arranges them in the structure of a statistical classification. The chapter contains a description of the pur-pose and scope of SIEC, and presents the classification criteria and the classification itself. In addition, correspondences between SIEC and other international product classifications, such as the Harmonized Commodity Description and Coding System (HS) and the Central Product Classification (CPC) are provided. These correspondences facilitate the integration of energy statistics with other economic statistics, thereby increasing their analytical value.
3.3. The correspondence with the HS is particularly useful as all international transac-tions in energy products are defined in terms of HS. Many energy products are widely traded internationally and energy companies are familiar with HS or its national equivalents. The correspondence with HS is expected to facilitate data collection, as the documentation that energy importing/exporting companies provide for customs purposes includes the relevant HS codes. The CPC aggregates the HS headings into product groupings which are of par-ticular interest for economic statistics and for various users.
3.4. The correspondence with HS and CPC presented in the chapter is indicative in the sense that the HS and CPC categories are often broader in scope and may contain more ele-ments than the corresponding SIEC category.17 However, in the case of national or regional adaptations of the HS (such as the European Combined Nomenclature), the correspond-ences may be more precise. This applies in particular to the categories for refined petroleum products.
B. Purpose and scope of SIEC3.5. The main purpose of SIEC is to serve as a basis for developing or revising national classification schemes for energy products so as to make them compatible with international standards and, consequently, to ensure significantly improved cross-country comparability of energy data. SIEC is intended to be a multipurpose classification, meaning that individual SIEC products and aggregates are defined to be suitable for the production of energy statistics under different country circumstances and are relevant for the presentation and analysis of energy data in various policy and analytical contexts. In this connection, it is recognized
17 In table 3.1, this is indicated with an asterisk next to the relevant link.
International Recommendations for Energy Statistics (IRES)22
that SIEC should be periodically reviewed and revised as necessary to reflect changes in the patterns of energy production and consumption.
3.6. SIEC is designed to support the collection of data from data reporters and will: (i) facilitate and standardize the compilation and processing of energy data by providing a uniform and hierarchical coding system; (ii) ensure international comparability of dis-seminated national data; and (iii) facilitate the linking of data on stocks and flows of energy products with data on international trade in energy products and other economic statistics.
3.7. SIEC aims to cover all products necessary to provide a comprehensive picture of the production, transformation and consumption of energy throughout an economy. Thus the scope of SIEC consists of the following:18
(a) Fuels 19 that are produced/generated by an economic unit (including households), and are used or might be used as sources of energy; and
(b) Electricity that is generated by an economic unit (including households), and heat generated and sold to third parties by an economic unit.
3.8. In order to define the scope of SIEC more precisely, the fuel coverage is further explained below.
(i) All fossil fuels 20 are within the scope of SIEC whether or not they are used for energy purposes, but an exception is made for peat used for non-energy purposes, which should be excluded.
(ii) Products derived from fossil fuels are always within the scope of SIEC when used (or intended to be used) for energy purposes, i.e. as fuels.
(iii) Products derived from fossil fuels used (or intended to be used) for non-energy purposes are within the scope only if they are the output of energy industries (e.g. refineries, gas plants or coal mining, coal manufacturing industries). They are included because they explain how much an apparent supply of energy is used for other purposes and allow for a complete assessment of the industries involved.
3.9. One example of products in category (iii) mentioned above are lubricants produced during the refining of crude oil. Even though they are ordinarily used for non-energy pur-poses, their production and consumption are recorded in energy statistics as this allows for the monitoring of the different products obtained from the refinery intake of crude oil and the assessment of the part of crude oil used for non-energy purposes. This is of relevance to energy planners, provided that the consumption of these products is explicitly identified as non-energy use. On the other hand, plastics, even if derived from a fossil fuel such as crude oil, are not considered within the scope of SIEC as they are not an output of the refinery but are obtained by further processing of refinery products by other industries.
3.10. Some fuels such as waste,21 agricultural crops or other biomass are not of fossil origin. Such products are within the scope of SIEC only when used for energy purposes. Thus, the inclusion of these products in total energy production depends on their use, i.e. it is derived from demand-side information.
3.11. In IRES, the term energy product is defined as any product covered by the scope of SIEC, as formulated above.
3.12. It should be noted that, while SIEC provides definitions for all energy products, the scope of individual applications of energy statistics may cover just a subset of SIEC. For example, while SIEC includes nuclear fuels in the scope of energy products, they are not used in energy balances.
18 SIEC does not cover underground deposits of energy resources, i.e. “non-renewable energy resources of both inorganic and organic origin discovered in the earth’s crust in solid, liquid and gaseous form”. A classification of underground mineral and energy resources is expected to be provided in the forthcom-ing SEEA-Energy (as part of the general SEEA classification of “natural resources”), based on the definitions and classification of the United Nations Framework Classification for Fossil Energy and Mineral Reserves and Resources (UNFC).
19 The term fuel refers to energy sources, whether primary or sec-ondary, that must be subjected to combustion or fission in order to release for use the energy stored up in them.
20 For the purposes of the discus-sion on the scope of SIEC, fossil fuels refer to coal, peat, oil and natural gas, even though the inclusion of peat in fossil fuels is not universally accepted.
21 Although, strictly speaking, part of waste can have a fossil origin, this part has already been accounted for as used (often for non-energy purposes), thus it is treated together with other fuels of non-fossil origin to avoid imbalances in the energy flows.
23Standard International Energy Product Classification 23
C. Classification criteria and coding system
3.13. The SIEC categories are designed to be exhaustive and mutually exclusive, so that any product within the general scope would belong to only one SIEC category for any given application.22 At the highest level, SIEC provides ten sections for different fuels, electricity and heat. The eight fuel categories represent broad fuel types distinguished by their origin and characteristics, covering coal, peat and peat products, oil shale/oil sands, natural gas, oil, biofuels, waste, nuclear fuels and other fuels. Where applicable, these fuel categories are further disaggregated by physical characteristics (e.g. brown coal vs. hard coal) and stage of processing. In the latter case, in each section the unprocessed products appear first (in order of the coding system), followed by processed products. For some of the fuel categories, reference to the use is made since the specifications of the product make it fit for certain types of use (e.g., kerosene and its disaggregation into kerosene-type jet fuel and other kerosene).
3.14. Some products in SIEC, although physically similar, may be considered as different products due to different origin or intended use. For instance, several of the included gases may contain similar chemical components, but originate from different processes. This is the case for the categories natural gas and landfill gas, both of which consist mainly of methane, but differ in their source and method of production. Likewise, natural gas liquids and liquefied petroleum gas both contain propane, but the latter category refers to a mix of gases that only contains propane and butane, whereas the former category represents a less refined mix of gases. Another example is the category feedstocks, which may consist of energy products that can be found in other categories (e.g., naphtha) but are characterized by the fact of being destined for a particular use.
3.15. The top-level categories representing electricity and heat are not further disaggre-gated in the classification. Unlike fuels, these products are not physical substances that can easily be distinguished by origin, composition or intended purpose. Electricity and heat can be produced through different processes, such as direct conversion of the energy in solar radiation, falling water or release through combustion of fuels. The distinction between different production processes is important for energy statistics and may be obtained by disaggregating information on the production side (see chapter V for more details).
3.16. The distinctions between primary and secondary energy products, as well as between renewable and non-renewable energy products, are not explicit classification criteria in SIEC, although in many cases a complete detailed SIEC category can clearly be assigned to one set. The list of products considered primary or secondary and renewable or non-renewable is given in annex A.
Coding system
3.17. The SIEC hierarchy consists of four levels referred to as sections (the first level), divi-sions (the second level), groups (the third level), and classes (the fourth level). The coding system consists of a four-digit numerical code, with the first digit referring to the section, the first two digits to the division, and so on. Thus, all four digits, taken together, designate a particular class of the classification.
3.18. The hierarchy groups basic categories into higher-level aggregations according to the criteria described above. The purpose is to provide a set of levels, with each level being used to provide statistical information that is analytically useful.
22 In some cases, demands for ener-gy statistics require a different treatment for energy products. One such example would be the classification of certain chemical compounds as individual oil products in terms of production, but as refinery feedstocks in terms of inputs used. However, in both applications the treatment is unambiguous and the energy balances include a mechanism to match these different flows. See also para. 3.14.
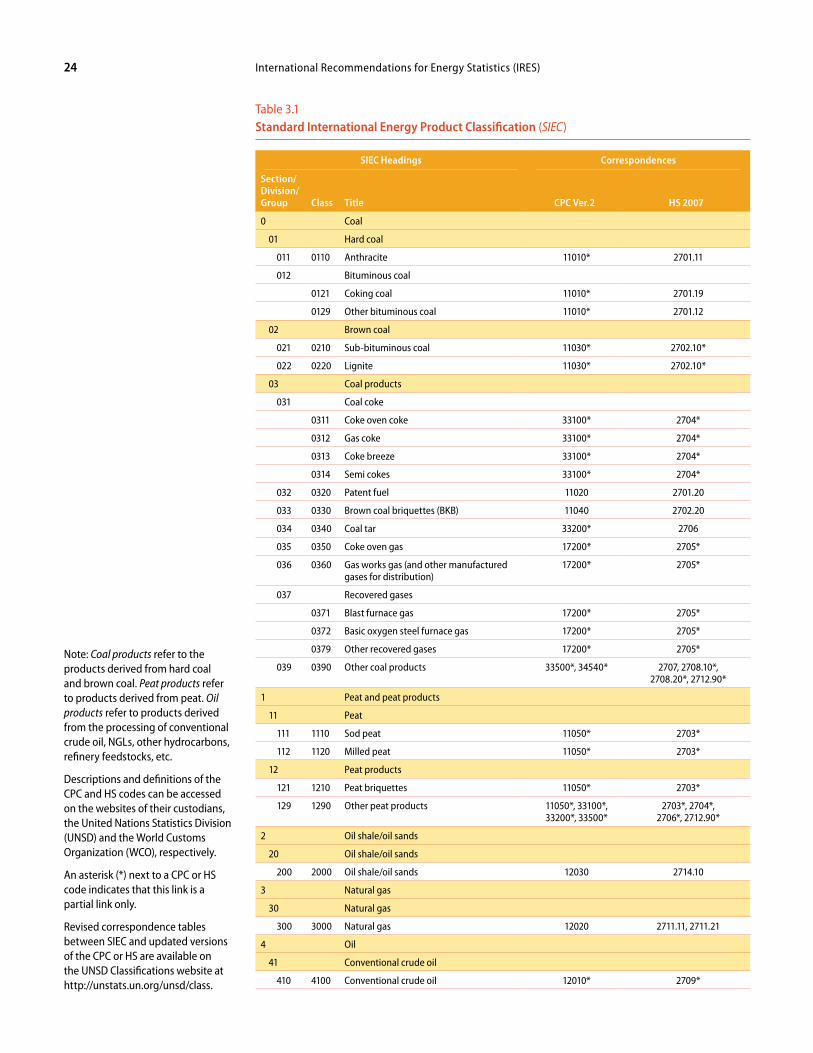
International Recommendations for Energy Statistics (IRES)24
Table 3.1Standard International Energy Product Classification (SIEC)
SIEC Headings Correspondences
Section/Division/Group Class Title CPC Ver.2 HS 2007
0 Coal
01 Hard coal
011 0110 Anthracite 11010* 2701.11
012 Bituminous coal
0121 Coking coal 11010* 2701.19
0129 Other bituminous coal 11010* 2701.12
02 Brown coal
021 0210 Sub-bituminous coal 11030* 2702.10*
022 0220 Lignite 11030* 2702.10*
03 Coal products
031 Coal coke
0311 Coke oven coke 33100* 2704*
0312 Gas coke 33100* 2704*
0313 Coke breeze 33100* 2704*
0314 Semi cokes 33100* 2704*
032 0320 Patent fuel 11020 2701.20
033 0330 Brown coal briquettes (BKB) 11040 2702.20
034 0340 Coal tar 33200* 2706
035 0350 Coke oven gas 17200* 2705*
036 0360 Gas works gas (and other manufactured gases for distribution)
17200* 2705*
037 Recovered gases
0371 Blast furnace gas 17200* 2705*
0372 Basic oxygen steel furnace gas 17200* 2705*
0379 Other recovered gases 17200* 2705*
039 0390 Other coal products 33500*, 34540* 2707, 2708.10*, 2708.20*, 2712.90*
1 Peat and peat products
11 Peat
111 1110 Sod peat 11050* 2703*
112 1120 Milled peat 11050* 2703*
12 Peat products
121 1210 Peat briquettes 11050* 2703*
129 1290 Other peat products 11050*, 33100*, 33200*, 33500*
2703*, 2704*, 2706*, 2712.90*
2 Oil shale/oil sands
20 Oil shale/oil sands
200 2000 Oil shale/oil sands 12030 2714.10
3 Natural gas
30 Natural gas
300 3000 Natural gas 12020 2711.11, 2711.21
4 Oil
41 Conventional crude oil
410 4100 Conventional crude oil 12010* 2709*
Note: Coal products refer to the products derived from hard coal and brown coal. Peat products refer to products derived from peat. Oil products refer to products derived from the processing of conventional crude oil, NGLs, other hydrocarbons, refinery feedstocks, etc.
Descriptions and definitions of the CPC and HS codes can be accessed on the websites of their custodians, the United Nations Statistics Division (UNSD) and the World Customs Organization (WCO), respectively.
An asterisk (*) next to a CPC or HS code indicates that this link is a partial link only.
Revised correspondence tables between SIEC and updated versions of the CPC or HS are available on the UNSD Classifications website at http://unstats.un.org/unsd/class.
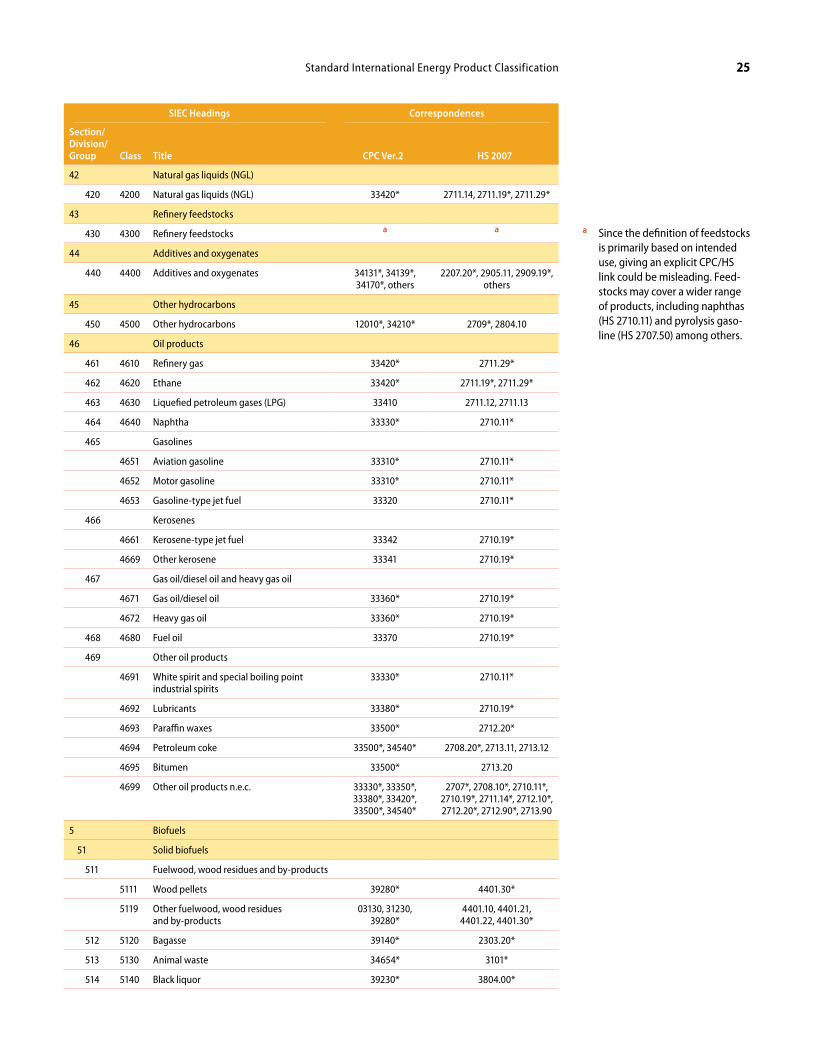
25Standard International Energy Product Classification 25
SIEC Headings Correspondences
Section/Division/Group Class Title CPC Ver.2 HS 2007
42 Natural gas liquids (NGL)
420 4200 Natural gas liquids (NGL) 33420* 2711.14, 2711.19*, 2711.29*
43 Refinery feedstocks
430 4300 Refinery feedstocks a a
44 Additives and oxygenates
440 4400 Additives and oxygenates 34131*, 34139*, 34170*, others
2207.20*, 2905.11, 2909.19*, others
45 Other hydrocarbons
450 4500 Other hydrocarbons 12010*, 34210* 2709*, 2804.10
46 Oil products
461 4610 Refinery gas 33420* 2711.29*
462 4620 Ethane 33420* 2711.19*, 2711.29*
463 4630 Liquefied petroleum gases (LPG) 33410 2711.12, 2711.13
464 4640 Naphtha 33330* 2710.11*
465 Gasolines
4651 Aviation gasoline 33310* 2710.11*
4652 Motor gasoline 33310* 2710.11*
4653 Gasoline-type jet fuel 33320 2710.11*
466 Kerosenes
4661 Kerosene-type jet fuel 33342 2710.19*
4669 Other kerosene 33341 2710.19*
467 Gas oil/diesel oil and heavy gas oil
4671 Gas oil/diesel oil 33360* 2710.19*
4672 Heavy gas oil 33360* 2710.19*
468 4680 Fuel oil 33370 2710.19*
469 Other oil products
4691 White spirit and special boiling point industrial spirits
33330* 2710.11*
4692 Lubricants 33380* 2710.19*
4693 Paraffin waxes 33500* 2712.20*
4694 Petroleum coke 33500*, 34540* 2708.20*, 2713.11, 2713.12
4695 Bitumen 33500* 2713.20
4699 Other oil products n.e.c. 33330*, 33350*, 33380*, 33420*, 33500*, 34540*
2707*, 2708.10*, 2710.11*, 2710.19*, 2711.14*, 2712.10*, 2712.20*, 2712.90*, 2713.90
5 Biofuels
51 Solid biofuels
511 Fuelwood, wood residues and by-products
5111 Wood pellets 39280* 4401.30*
5119 Other fuelwood, wood residues and by-products
03130, 31230, 39280*
4401.10, 4401.21, 4401.22, 4401.30*
512 5120 Bagasse 39140* 2303.20*
513 5130 Animal waste 34654* 3101*
514 5140 Black liquor 39230* 3804.00*
a Since the definition of feedstocks is primarily based on intended use, giving an explicit CPC/HS link could be misleading. Feed-stocks may cover a wider range of products, including naphthas (HS 2710.11) and pyrolysis gaso-line (HS 2707.50) among others.
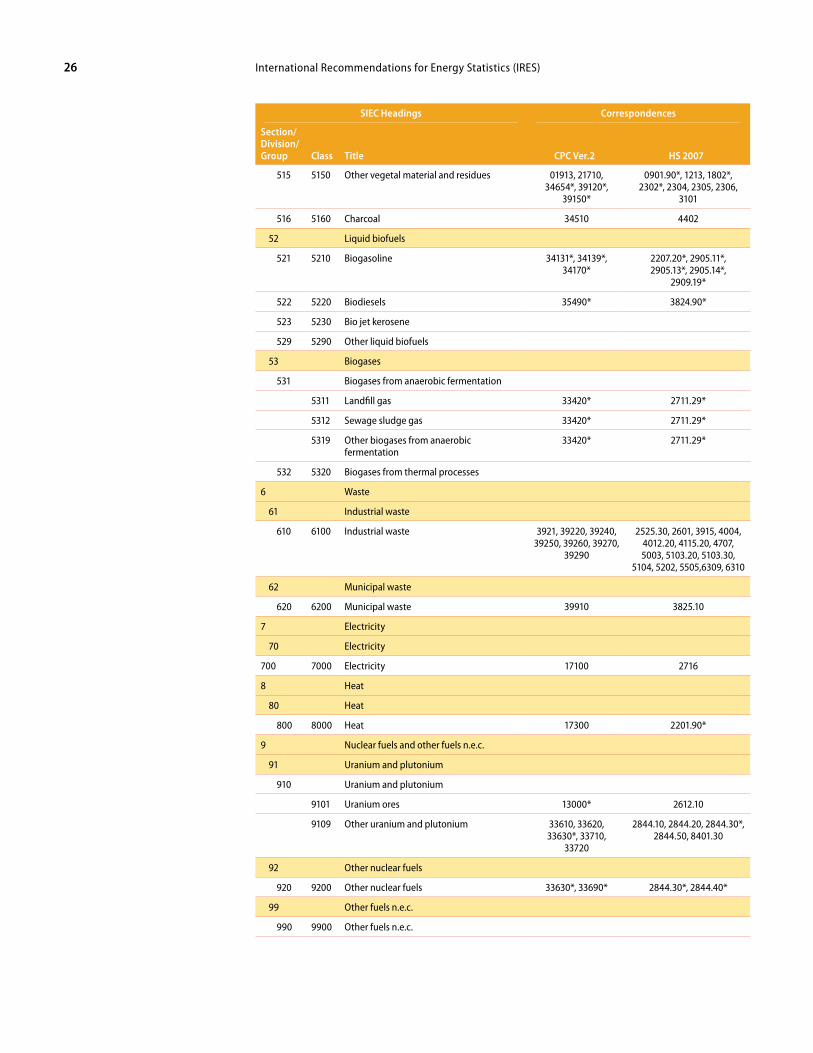
International Recommendations for Energy Statistics (IRES)26
SIEC Headings Correspondences
Section/Division/Group Class Title CPC Ver.2 HS 2007
515 5150 Other vegetal material and residues 01913, 21710, 34654*, 39120*,
39150*
0901.90*, 1213, 1802*, 2302*, 2304, 2305, 2306,
3101
516 5160 Charcoal 34510 4402
52 Liquid biofuels
521 5210 Biogasoline 34131*, 34139*, 34170*
2207.20*, 2905.11*, 2905.13*, 2905.14*,
2909.19*
522 5220 Biodiesels 35490* 3824.90*
523 5230 Bio jet kerosene
529 5290 Other liquid biofuels
53 Biogases
531 Biogases from anaerobic fermentation
5311 Landfill gas 33420* 2711.29*
5312 Sewage sludge gas 33420* 2711.29*
5319 Other biogases from anaerobic fermentation
33420* 2711.29*
532 5320 Biogases from thermal processes
6 Waste
61 Industrial waste
610 6100 Industrial waste 3921, 39220, 39240, 39250, 39260, 39270,
39290
2525.30, 2601, 3915, 4004, 4012.20, 4115.20, 4707, 5003, 5103.20, 5103.30,
5104, 5202, 5505,6309, 6310
62 Municipal waste
620 6200 Municipal waste 39910 3825.10
7 Electricity
70 Electricity
700 7000 Electricity 17100 2716
8 Heat
80 Heat
800 8000 Heat 17300 2201.90*
9 Nuclear fuels and other fuels n.e.c.
91 Uranium and plutonium
910 Uranium and plutonium
9101 Uranium ores 13000* 2612.10
9109 Other uranium and plutonium 33610, 33620, 33630*, 33710,
33720
2844.10, 2844.20, 2844.30*, 2844.50, 8401.30
92 Other nuclear fuels
920 9200 Other nuclear fuels 33630*, 33690* 2844.30*, 2844.40*
99 Other fuels n.e.c.
990 9900 Other fuels n.e.c.
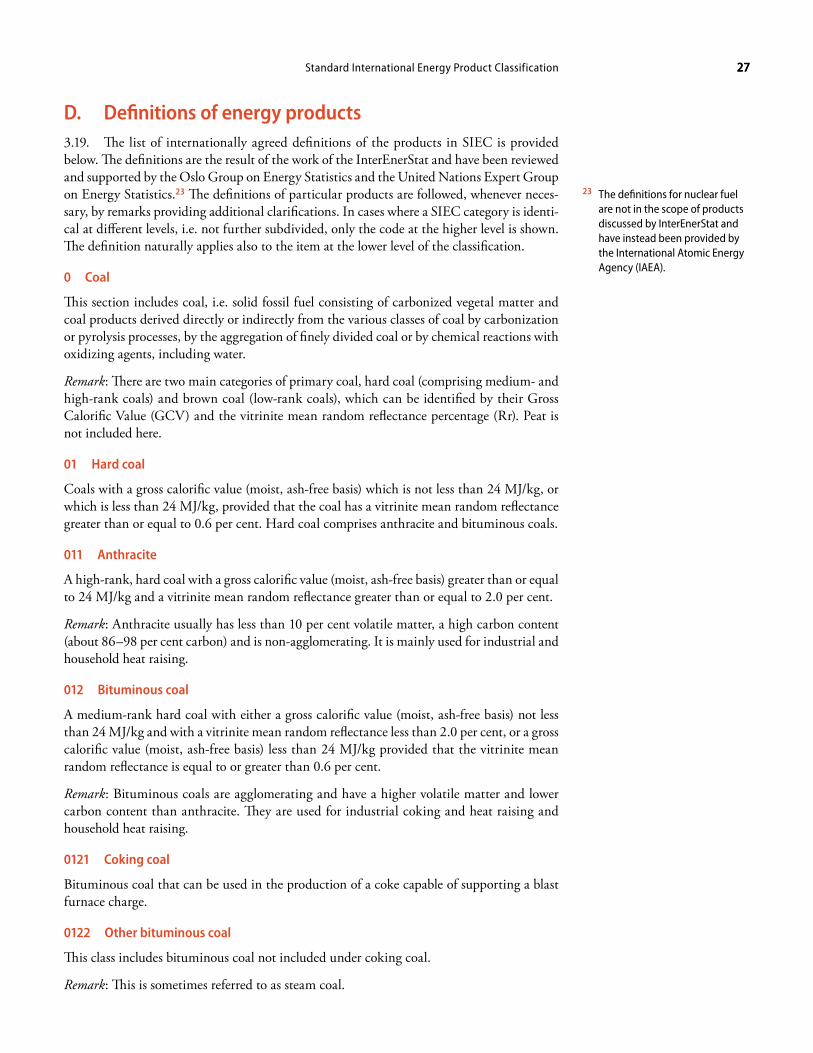
27Standard International Energy Product Classification 27
D. Definitions of energy products3.19. The list of internationally agreed definitions of the products in SIEC is provided below. The definitions are the result of the work of the InterEnerStat and have been reviewed and supported by the Oslo Group on Energy Statistics and the United Nations Expert Group on Energy Statistics.23 The definitions of particular products are followed, whenever neces-sary, by remarks providing additional clarifications. In cases where a SIEC category is identi-cal at different levels, i.e. not further subdivided, only the code at the higher level is shown. The definition naturally applies also to the item at the lower level of the classification.
0 Coal
This section includes coal, i.e. solid fossil fuel consisting of carbonized vegetal matter and coal products derived directly or indirectly from the various classes of coal by carbonization or pyrolysis processes, by the aggregation of finely divided coal or by chemical reactions with oxidizing agents, including water.
Remark: There are two main categories of primary coal, hard coal (comprising medium- and high-rank coals) and brown coal (low-rank coals), which can be identified by their Gross Calorific Value (GCV) and the vitrinite mean random reflectance percentage (Rr). Peat is not included here.
01 Hard coal
Coals with a gross calorific value (moist, ash-free basis) which is not less than 24 MJ/kg, or which is less than 24 MJ/kg, provided that the coal has a vitrinite mean random reflectance greater than or equal to 0.6 per cent. Hard coal comprises anthracite and bituminous coals.
011 Anthracite
A high-rank, hard coal with a gross calorific value (moist, ash-free basis) greater than or equal to 24 MJ/kg and a vitrinite mean random reflectance greater than or equal to 2.0 per cent.
Remark: Anthracite usually has less than 10 per cent volatile matter, a high carbon content (about 86–98 per cent carbon) and is non-agglomerating. It is mainly used for industrial and household heat raising.
012 Bituminous coal
A medium-rank hard coal with either a gross calorific value (moist, ash-free basis) not less than 24 MJ/kg and with a vitrinite mean random reflectance less than 2.0 per cent, or a gross calorific value (moist, ash-free basis) less than 24 MJ/kg provided that the vitrinite mean random reflectance is equal to or greater than 0.6 per cent.
Remark: Bituminous coals are agglomerating and have a higher volatile matter and lower carbon content than anthracite. They are used for industrial coking and heat raising and household heat raising.
0121 Coking coal
Bituminous coal that can be used in the production of a coke capable of supporting a blast furnace charge.
0122 other bituminous coal
This class includes bituminous coal not included under coking coal.
Remark: This is sometimes referred to as steam coal.
23 The definitions for nuclear fuel are not in the scope of products discussed by InterEnerStat and have instead been provided by the International Atomic Energy Agency (IAEA).
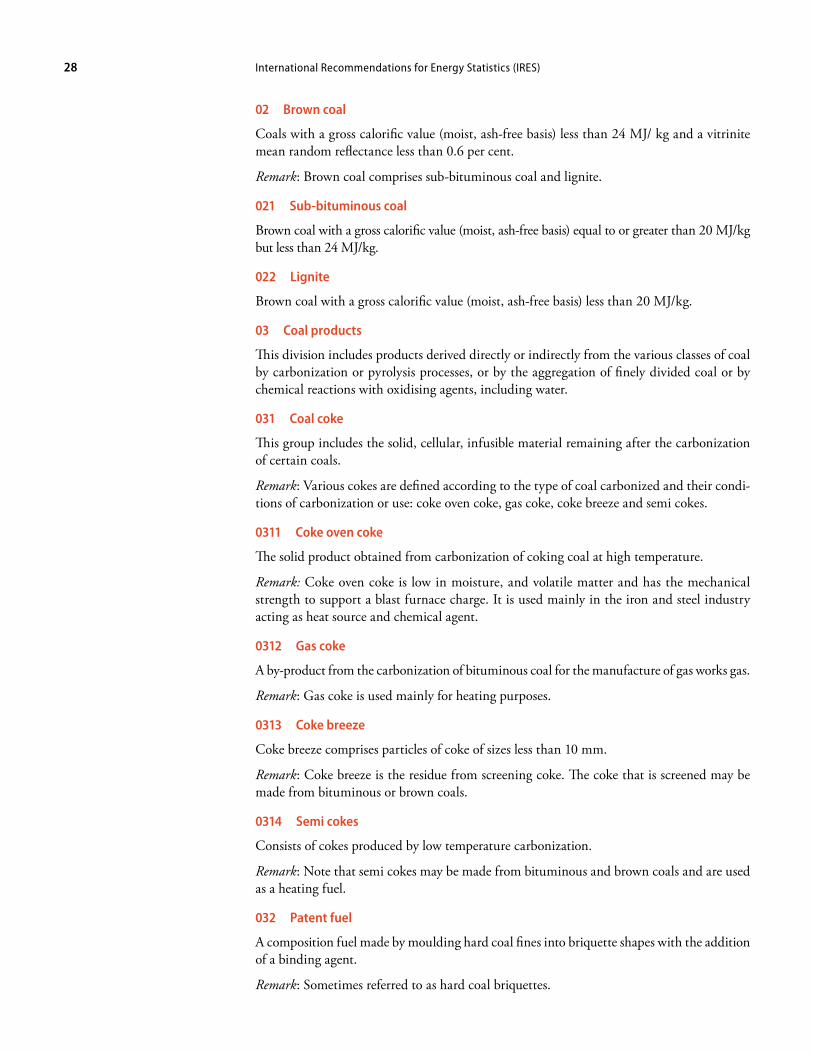
International Recommendations for Energy Statistics (IRES)28
02 Brown coal
Coals with a gross calorific value (moist, ash-free basis) less than 24 MJ/ kg and a vitrinite mean random reflectance less than 0.6 per cent.
Remark: Brown coal comprises sub-bituminous coal and lignite.
021 Sub-bituminous coal
Brown coal with a gross calorific value (moist, ash-free basis) equal to or greater than 20 MJ/kg but less than 24 MJ/kg.
022 Lignite
Brown coal with a gross calorific value (moist, ash-free basis) less than 20 MJ/kg.
03 Coal products
This division includes products derived directly or indirectly from the various classes of coal by carbonization or pyrolysis processes, or by the aggregation of finely divided coal or by chemical reactions with oxidising agents, including water.
031 Coal coke
This group includes the solid, cellular, infusible material remaining after the carbonization of certain coals.
Remark: Various cokes are defined according to the type of coal carbonized and their condi-tions of carbonization or use: coke oven coke, gas coke, coke breeze and semi cokes.
0311 Coke oven coke
The solid product obtained from carbonization of coking coal at high temperature.
Remark: Coke oven coke is low in moisture, and volatile matter and has the mechanical strength to support a blast furnace charge. It is used mainly in the iron and steel industry acting as heat source and chemical agent.
0312 Gas coke
A by-product from the carbonization of bituminous coal for the manufacture of gas works gas.
Remark: Gas coke is used mainly for heating purposes.
0313 Coke breeze
Coke breeze comprises particles of coke of sizes less than 10 mm.
Remark: Coke breeze is the residue from screening coke. The coke that is screened may be made from bituminous or brown coals.
0314 Semi cokes
Consists of cokes produced by low temperature carbonization.
Remark: Note that semi cokes may be made from bituminous and brown coals and are used as a heating fuel.
032 Patent fuel
A composition fuel made by moulding hard coal fines into briquette shapes with the addition of a binding agent.
Remark: Sometimes referred to as hard coal briquettes.

29Standard International Energy Product Classification 29
033 Brown coal briquettes (BKB)
A composition fuel made of brown coal produced by briquetting under high pressure with or without the addition of a binding agent.
Remark: Either sub-bituminous coal or lignite may be used, including dried lignite fines and dust.
034 Coal tar
The liquid by-product of the carbonization of coal in coke ovens.
Remark: Coal tar may be separated by distillation into several liquid products that may be used for pharmaceutical or wood preservative purposes.
035 Coke oven gas
A gas produced from coke ovens during the manufacture of coke oven coke.
036 Gas works gas (and other manufactured gases for distribution)
This group includes gases obtained from the carbonization or gasification of carbonaceous material of fossil or biomass origins in gas works. The gases comprise: (a) gases obtained from carbonization or gasification of coals, cokes, biomass or waste; and (b) substitute natural gas (a methane-rich gas) made from synthesis gas.
Remark: Synthesis gas is a mixture of mainly hydrogen and carbon monoxide obtained by cracking hydrocarbons with high temperature steam. The hydrocarbons may be taken from fossil fuels, biofuels or wastes.
037 Recovered gases
Combustible gases of solid carbonaceous origin recovered from manufacturing and chemical processes of which the principal purpose is other than the production of fuel. This includes gases containing carbon monoxide resulting from the partial oxidation of (a) carbon present as coke acting as a reductant in the process, (b) carbon anodes, or (c) carbon dissolved in iron.
Remark: Recovered gases may also be referred to as waste or off gases.
0371 Blast furnace gas
The by-product gas of blast furnace operation consisting mainly of nitrogen, carbon dioxide and carbon monoxide.
Remark: The gas is recovered as it leaves the furnace. Its calorific value arises mainly from the carbon monoxide produced by the partial combustion of coke and other carbon bearing products in the blast furnace. It is used to heat blast air and as a fuel in the iron and steel industry. It may also be used by other nearby industrial plants. Note that where carbonized biomass (e.g., charcoal or animal meal) is used in blast furnaces, part of the carbon supply may be considered renewable.
0372 Basic oxygen steel furnace gas
The by-product gas of the production of steel in a basic oxygen furnace. The gas is recovered as it leaves the furnace.
Remark: The concentration of carbon monoxide in this gas is higher than that in blast furnace gas. The gas is also known as converter gas, LD gas or BOSF gas.

International Recommendations for Energy Statistics (IRES)30
0373 other recovered gases
Combustible gases of solid carbonaceous origin recovered from manufacturing and chemical processes not elsewhere defined.
Remark: Examples of fuel gas production from metals and chemicals processing are in the production of zinc, tin, lead, ferroalloys, phosphorus and silicon carbide.
039 other coal products
This group includes coal products not elsewhere classified in section 0.
1 Peat and peat products
This section comprises peat, a solid formed from the partial decomposition of dead vegetation under conditions of high humidity and limited air access (initial stage of coalification) and any products derived from it.
11 Peat
A solid formed from the partial decomposition of dead vegetation under conditions of high humidity and limited air access (initial stage of coalification). It is available in two forms for use as a fuel: sod peat and milled peat.
Remark: Milled peat is also made into briquettes for fuel use. Peat is not considered a renew-able resource as its regeneration period is long.
111 Sod peat
Slabs of peat, cut by hand or machine, and dried in the air.
112 Milled peat
Granulated peat produced by special machines.
Remark: Milled peat is used in power stations or for briquette manufacture.
12 Peat products
This division includes products such as peat briquettes derived directly or indirectly from sod peat and milled peat.
121 Peat briquettes
A fuel comprising of small blocks of dried, highly compressed peat made without a binding agent.
Remark: Used mainly as a household fuel.
129 other peat products
Peat products not elsewhere specified such as peat pellets.
2 oil shale/oil sands
A sedimentary rock that contains organic matter in the form of kerogen. Kerogen is a waxy hydrocarbon-rich material regarded as a precursor of petroleum.
Remark: Oil shale may be burned directly or processed by heating to extract shale oil. While oil shale is classified here, the oils extracted from oil shale and oil sands are included in SIEC division 45 (Other hydrocarbons).

31Standard International Energy Product Classification 31
3 Natural gas
A mixture of gaseous hydrocarbons, primarily methane, but generally also including ethane, propane and higher hydrocarbons in much smaller amounts and some non-combustible gases such as nitrogen and carbon dioxide.
Remark: The majority of natural gas is separated from both non-associated gas originating from fields producing hydrocarbons only in gaseous form, and associated gas produced in association with crude oil.
The separation process produces natural gas by removing or reducing the hydrocarbons other than methane to levels that are acceptable in the marketable gas. The natural gas liquids (NGL) removed in the process are distributed separately.
Natural gas also includes methane recovered from coal mines (colliery gas) or from coal seams (coal seam gas) and shale gas. When distributed it may also contain methane from anaerobic fermentation or the methanation of biomass.
Natural gas may be liquefied (LNG) by reducing its temperature in order to simplify stor-age and transportation when production sites are remote from centers of consumption and pipeline transportation is not economically practicable.
4 oil
Liquid hydrocarbons of fossil origins comprising (i) crude oil; (ii) liquids extracted from natural gas (NGL); (iii) fully or partly processed products from the refining of crude oil, and (iv) functionally similar liquid hydrocarbons and organic chemicals from vegetal or animal origins.
41 Conventional crude oil
A mineral oil of fossil origin extracted by conventional means from underground reservoirs, and comprising liquid or near-liquid hydrocarbons and associated impurities such as sulphur and metals.
Remark: Conventional crude oil exists in the liquid phase under normal surface temperature and pressure, and usually flows to the surface under the pressure of the reservoir. This is termed conventional extraction. Crude oil includes condensate from condensate fields and field or lease condensate extracted with the crude oil.
The various crude oils may be classified according to their sulphur content (sweet or sour) and API gravity (heavy or light). There are no rigorous specifications for the classifications, but a heavy crude oil may be assumed to have an API gravity of less than 20° and a sweet crude oil may be assumed to have less than 0.5 per cent sulphur content.
42 Natural gas liquids (NGL)
Natural gas liquids are a mixture of ethane, propane, butane (normal and iso), (iso)pentane and a few higher alkanes collectively referred to as pentanes plus.
Remark: NGL are produced in association with oil or natural gas. They are removed in field facilities or gas separation plants before sale of the gas. All of the components of NGL except ethane are either liquid at the surface or are liquefied for disposal.
The definition given above is the most commonly used. However, there is some use of terms based on the vapour pressure of the components that are liquid at the surface or can be easily liquefied. The three resulting groups are in order of increasing vapour pressure: condensates, natural gasoline and liquefied petroleum gas.
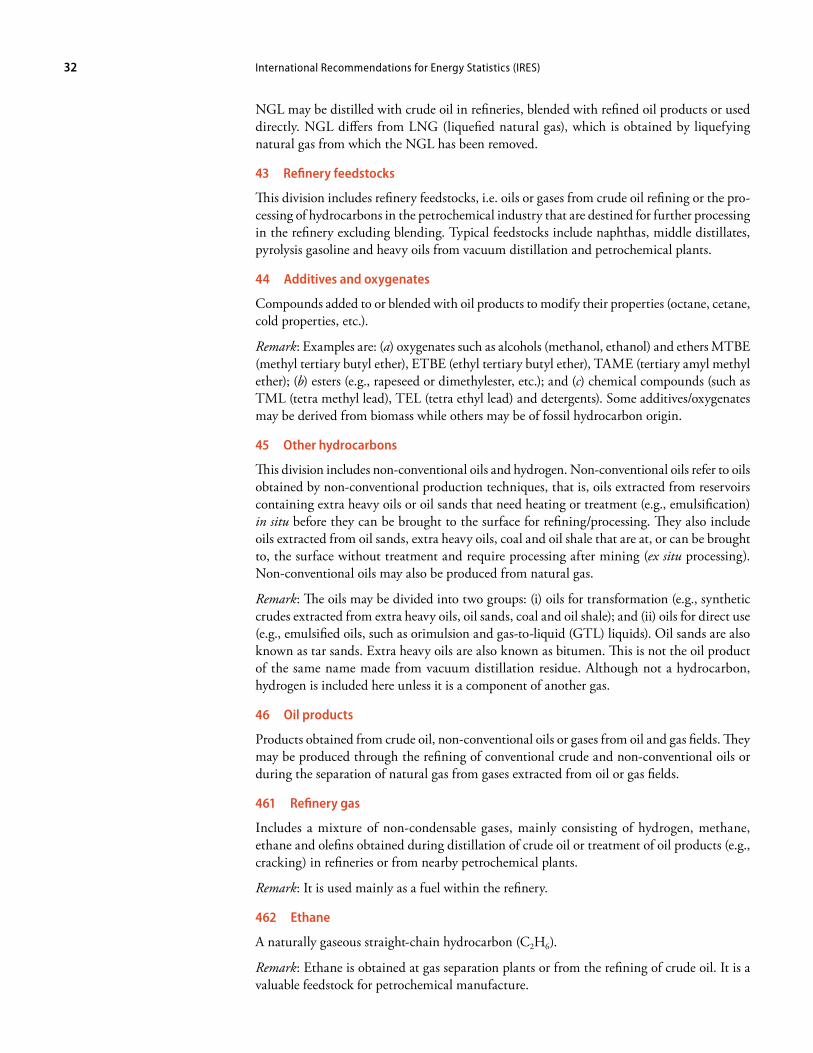
International Recommendations for Energy Statistics (IRES)32
NGL may be distilled with crude oil in refineries, blended with refined oil products or used directly. NGL differs from LNG (liquefied natural gas), which is obtained by liquefying natural gas from which the NGL has been removed.
43 Refinery feedstocks
This division includes refinery feedstocks, i.e. oils or gases from crude oil refining or the pro-cessing of hydrocarbons in the petrochemical industry that are destined for further processing in the refinery excluding blending. Typical feedstocks include naphthas, middle distillates, pyrolysis gasoline and heavy oils from vacuum distillation and petrochemical plants.
44 Additives and oxygenates
Compounds added to or blended with oil products to modify their properties (octane, cetane, cold properties, etc.).
Remark: Examples are: (a) oxygenates such as alcohols (methanol, ethanol) and ethers MTBE (methyl tertiary butyl ether), ETBE (ethyl tertiary butyl ether), TAME (tertiary amyl methyl ether); (b) esters (e.g., rapeseed or dimethylester, etc.); and (c) chemical compounds (such as TML (tetra methyl lead), TEL (tetra ethyl lead) and detergents). Some additives/oxygenates may be derived from biomass while others may be of fossil hydrocarbon origin.
45 other hydrocarbons
This division includes non-conventional oils and hydrogen. Non-conventional oils refer to oils obtained by non-conventional production techniques, that is, oils extracted from reservoirs containing extra heavy oils or oil sands that need heating or treatment (e.g., emulsification) in situ before they can be brought to the surface for refining/processing. They also include oils extracted from oil sands, extra heavy oils, coal and oil shale that are at, or can be brought to, the surface without treatment and require processing after mining (ex situ processing). Non-conventional oils may also be produced from natural gas.
Remark: The oils may be divided into two groups: (i) oils for transformation (e.g., synthetic crudes extracted from extra heavy oils, oil sands, coal and oil shale); and (ii) oils for direct use (e.g., emulsified oils, such as orimulsion and gas-to-liquid (GTL) liquids). Oil sands are also known as tar sands. Extra heavy oils are also known as bitumen. This is not the oil product of the same name made from vacuum distillation residue. Although not a hydrocarbon, hydrogen is included here unless it is a component of another gas.
46 oil products
Products obtained from crude oil, non-conventional oils or gases from oil and gas fields. They may be produced through the refining of conventional crude and non-conventional oils or during the separation of natural gas from gases extracted from oil or gas fields.
461 Refinery gas
Includes a mixture of non-condensable gases, mainly consisting of hydrogen, methane, ethane and olefins obtained during distillation of crude oil or treatment of oil products (e.g., cracking) in refineries or from nearby petrochemical plants.
Remark: It is used mainly as a fuel within the refinery.
462 Ethane
A naturally gaseous straight-chain hydrocarbon (C2H6).
Remark: Ethane is obtained at gas separation plants or from the refining of crude oil. It is a valuable feedstock for petrochemical manufacture.

33Standard International Energy Product Classification 33
463 Liquefied petroleum gases (LPG)
LPG refers to liquefied propane (C3H8) and butane (C4H10) or mixtures of both. Commercial grades are usually mixtures of the gases with small amounts of propylene, butylene, isobutene and isobutylene stored under pressure in containers.
Remark: The mixture of propane and butane used varies according to purpose and season of the year. The gases may be extracted from natural gas at gas separation plants or at plants re-gasifying imported liquefied natural gas. They are also obtained during the refining of crude oil. LPG may be used for heating and as a vehicle fuel.
See also the definition for natural gas liquids. Certain oil field practices also use the term LPG to describe the high vapour pressure components of natural gas liquids.
464 Naphtha
Light or medium oils distilling between 30°C and 210°C that do not meet the specification for motor gasoline.
Remark: Different naphthas are distinguished by their density and the content of paraffins, isoparaffins, olefins, naphthenes and aromatics. The main uses for naphthas are as feedstock for high-octane gasolines and the manufacture of olefins in the petrochemical industry.
465 Gasolines
Complex mixtures of volatile hydrocarbons distilling between approximately 25°C and 220°C and consisting of compounds in the C4 to C12 range.
Remark: Gasolines may contain blending components of biomass origin, especially oxygen-ates (mainly ethers and alcohols), and additives may be used to boost certain performance features.
4651 Aviation gasoline
Gasoline prepared especially for aviation piston engines with additives that assure perform-ance under flight conditions. Aviation gasolines are predominantly alkylates (obtained by combining C4 and C5 isoparaffins with C3, C4 and C5 olefins) with the possible addition of more aromatic components including toluene. The distillation range is 25°C to 170°C.
4652 Motor gasoline
A mixture of some aromatics (e.g., benzene and toluene) and aliphatic hydrocarbons in the C5 to C12 range. The distillation range is 25°C to 220°C.
Remark: Additives are blended to improve octane rating, improve combustion performance, reduce oxidation during storage, maintain cleanliness of the engine and improve capture of pollutants by catalytic converters in the exhaust system. Motor gasoline may also contain biogasoline products when blended.
4653 Gasoline-type jet fuel
Light hydrocarbons for use in aviation turbine power units, distilling between 100°C and 250°C. They are obtained by blending kerosene and gasoline or naphtha in such a way that the aromatic content does not exceed 25 per cent in volume, and the vapour pressure is between 13.7 kPa and 20.6 kPa.
Remark: Gasoline-type jet fuel is also known as aviation turbine fuel.

International Recommendations for Energy Statistics (IRES)34
466 Kerosenes
Mixtures of hydrocarbons in the range C9 to C16 and distilling over the temperature interval 145°C to 300°C, but not usually above 250°C and with a flash point above 38°C.
Remark: The chemical compositions of kerosenes depend on the nature of the crude oils from which they are derived and the refinery processes that they have undergone. Kerosenes obtained from crude oil by atmospheric distillation are known as straight-run kerosenes. Such streams may be treated by a variety of processes to produce kerosenes that are acceptable for blending as jet fuels.
Kerosenes are primarily used as jet fuels. They are also used as domestic heating and cooking fuels, and as solvents. Kerosenes may include components or additives derived from biomass when blended.
4661 Kerosene-type jet fuel
A blend of kerosenes suited to flight conditions with particular specifications, such as freez-ing point.
Remark: The specifications are set down by a small number of national standards committees, most notably ASTM (United States of America), MOD (United Kingdom of Great Britain and Northern Ireland), GOST (Russia).
4669 other kerosene
Kerosene that is used for heating, cooking, lighting, solvents and internal combustion engines.
Remark: Other names for this product are burning oil, vaporizing oil, power kerosene and illuminating oil.
467 Gas oil/diesel oil and heavy gas oil
This group includes gas oils and heavy gas oils.
4671 Gas oil/diesel oil
Gas oils are middle distillates, predominantly of carbon number range C11 to C25 and with a distillation range of 160°C to 420°C.
Remark: The principal marketed products are fuels for diesel engines (diesel oil), heating oils and marine fuel.
Gas oils are also used as middle distillate feedstock for the petrochemical industry and as solvents.
4672 Heavy gas oil
A mixture of predominantly gas oil and fuel oil that distills in the range of approximately 380°C to 540°C.
468 Fuel oil
Comprises residual fuel oil and heavy fuel oil. Residual fuel oils have a distillation range of 350°C to 650°C and a kinematic viscosity in the range 6 to 55 cSt at 100°C. Their flash point is always above 60°C and their specific gravity is above 0.95. Heavy fuel oil is a general term describing a blended product based on the residues from various refinery processes.
Remark: Other names commonly used to describe fuel oil include: bunker fuel, bunker C, fuel oil No. 6, industrial fuel oil, marine fuel oil and black oil.
Residual and heavy fuel oil are used in medium to large industrial plants, marine applications and power stations in combustion equipment such as boilers, furnaces and diesel engines. Residual fuel oil is also used as fuel within the refinery.

35Standard International Energy Product Classification 35
469 other oil products
This group includes oil products not covered in groups 461–468.
4691 White spirit and special boiling point industrial spirits
White spirit and special boiling point (SBP) industrial spirits are refined distillate interme-diates with a distillation in the naphtha/kerosene range. They are mainly used for non-fuel purposes and sub-divided as: (a) white spirit—an industrial spirit with a flash point above 30°C and a distillation range of 135°C to 200°C; and (b) industrial spirit (SBP)—light oils distilling between 30°C and 200°C.
Remark: There are seven or eight grades of industrial spirits, depending on the position of the cut in the distillation range. The grades are defined according to the temperature difference between the 5 per cent and 90 per cent volume distillation points (which is not more than 60°C).
White spirit and industrial spirits are mostly used as thinners and solvents.
4692 Lubricants
Oils, produced from crude oil, for which the principal use is to reduce friction between sliding surfaces and during metal cutting operations.
Remark: Lubricant base stocks are obtained from vacuum distillates that result from further distillation of the residue from atmospheric distillation of crude oil. The lubricant base stocks are then further processed to produce lubricants with the desired properties.
4693 Paraffin waxes
Residues extracted when dewaxing lubricant oils. The waxes have a crystalline structure that varies in fineness according to the grade, and are colourless, odourless and translucent, with a melting point above 45°C.
Remark: Paraffin waxes are also known as petroleum waxes.
4694 Petroleum coke
Petroleum coke is a black solid obtained mainly by cracking and carbonizing heavy hydro-carbon oils, tars and pitches. It consists mainly of carbon (90 to 95 per cent) and has a low ash content.
The two most important categories are green coke and calcined coke.
Green coke (raw coke) is the primary solid carbonization product from high boiling hydro-carbon fractions obtained at temperatures below 630°C. It contains 4–15 per cent by weight of matter that can be released as volatiles during subsequent heat treatment at temperatures up to approximately 1330°C.
Calcined coke is a petroleum coke or coal-derived pitch coke obtained by heat treatment of green coke to about 1330°C. It will normally have a hydrogen content of less than 0.1 per cent by weight.
Remark: In many catalytic operations (e.g., catalytic cracking) carbon or catalytic coke is deposited on the catalyst, thus deactivating it. The catalyst is reactivated by burning off the coke that is used as a fuel in the refining process. The coke is not recoverable in a concentrated form.

International Recommendations for Energy Statistics (IRES)36
4695 Bitumen
A solid, semi-solid or viscous hydrocarbon with a colloidal structure, being brown to black in color.
Remark: Bitumen is obtained as a residue in the distillation of crude oil and by vacuum distillation of oil residues from atmospheric distillation. It should not be confused with the non-conventional primary extra heavy oils that may also be referred to as bitumen.
In addition to its major use for road pavements, bitumen is also used as an adhesive, a water-proofing agent for roof coverings and as a binder in the manufacture of patent fuel. It may also be used for electricity generation in specially designed power plants.
Bitumen is also known in some countries as asphalt, but in others asphalt describes the mix-ture of bitumen and stone aggregate used for road pavements.
4699 other oil products n.e.c.
Products (including partly refined products) from the refining of crude oil and feedstocks that are not specified above.
Remark: These products will include basic chemicals and organic chemicals destined for use within the refinery or for sale to or processing in the chemical industry such as propylene, benzene, toluene and xylene.
5 Biofuels
Fuels derived directly or indirectly from biomass.
Remark: Fuels produced from animal fats, by-products and residues obtain their calorific value indirectly from the plants eaten by the animals.
51 Solid biofuels
Solid fuels derived from biomass.
511 Fuelwood, wood residues and by-products
Fuelwood or firewood (in log, brushwood, pellet or chip form) obtained from natural or managed forests or isolated trees. Also included are wood residues used as fuel and in which the original composition of wood is retained.
Remark: Charcoal and black liquor are excluded.
5111 Wood pellets
Wood pellets are a cylindrical product that has been agglomerated from wood residues by compression with or without the addition of a small quantity of binder. The pellets have a diameter not exceeding 25 mm and a length not exceeding 45 mm.
5119 other Fuelwood, wood residues and by-products
This class includes fuelwood, wood residues and by-products, except in the form of wood pellets.
512 Bagasse
The fuel obtained from the fibre that remains after juice extraction in sugar cane processing.
513 Animal waste
Excreta of animals, meat and fish residues that, when dry, are used directly as a fuel.
Remark: This excludes waste used in anaerobic fermentation plants. Fuel gases from these plants are included under biogases.
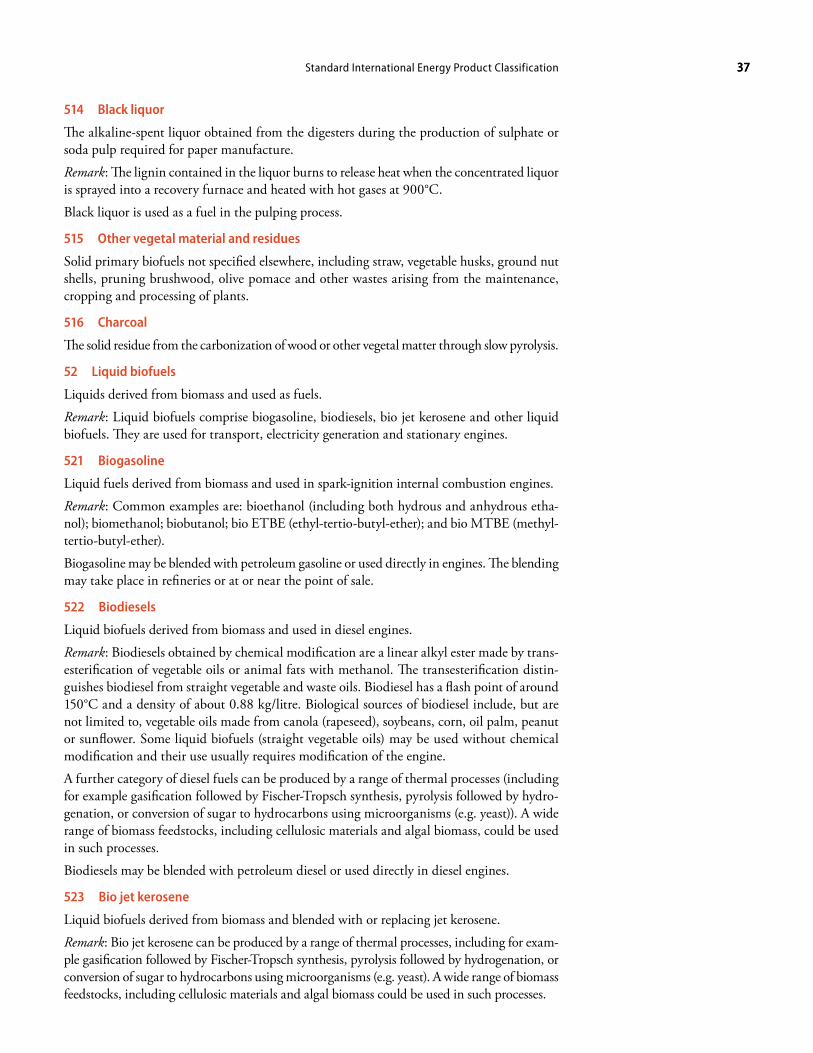
37Standard International Energy Product Classification 37
514 Black liquor
The alkaline-spent liquor obtained from the digesters during the production of sulphate or soda pulp required for paper manufacture.
Remark: The lignin contained in the liquor burns to release heat when the concentrated liquor is sprayed into a recovery furnace and heated with hot gases at 900°C.
Black liquor is used as a fuel in the pulping process.
515 other vegetal material and residues
Solid primary biofuels not specified elsewhere, including straw, vegetable husks, ground nut shells, pruning brushwood, olive pomace and other wastes arising from the maintenance, cropping and processing of plants.
516 Charcoal
The solid residue from the carbonization of wood or other vegetal matter through slow pyrolysis.
52 Liquid biofuels
Liquids derived from biomass and used as fuels.
Remark: Liquid biofuels comprise biogasoline, biodiesels, bio jet kerosene and other liquid biofuels. They are used for transport, electricity generation and stationary engines.
521 Biogasoline
Liquid fuels derived from biomass and used in spark-ignition internal combustion engines.
Remark: Common examples are: bioethanol (including both hydrous and anhydrous etha-nol); biomethanol; biobutanol; bio ETBE (ethyl-tertio-butyl-ether); and bio MTBE (methyl-tertio-butyl-ether).
Biogasoline may be blended with petroleum gasoline or used directly in engines. The blending may take place in refineries or at or near the point of sale.
522 Biodiesels
Liquid biofuels derived from biomass and used in diesel engines.
Remark: Biodiesels obtained by chemical modification are a linear alkyl ester made by trans-esterification of vegetable oils or animal fats with methanol. The transesterification distin-guishes biodiesel from straight vegetable and waste oils. Biodiesel has a flash point of around 150°C and a density of about 0.88 kg/litre. Biological sources of biodiesel include, but are not limited to, vegetable oils made from canola (rapeseed), soybeans, corn, oil palm, peanut or sunflower. Some liquid biofuels (straight vegetable oils) may be used without chemical modification and their use usually requires modification of the engine.
A further category of diesel fuels can be produced by a range of thermal processes (including for example gasification followed by Fischer-Tropsch synthesis, pyrolysis followed by hydro-genation, or conversion of sugar to hydrocarbons using microorganisms (e.g. yeast)). A wide range of biomass feedstocks, including cellulosic materials and algal biomass, could be used in such processes.
Biodiesels may be blended with petroleum diesel or used directly in diesel engines.
523 Bio jet kerosene
Liquid biofuels derived from biomass and blended with or replacing jet kerosene.
Remark: Bio jet kerosene can be produced by a range of thermal processes, including for exam-ple gasification followed by Fischer-Tropsch synthesis, pyrolysis followed by hydrogenation, or conversion of sugar to hydrocarbons using microorganisms (e.g. yeast). A wide range of biomass feedstocks, including cellulosic materials and algal biomass could be used in such processes.

International Recommendations for Energy Statistics (IRES)38
529 other liquid biofuels
This group includes liquid biofuels not elsewhere specified.
53 Biogases
Gases arising from the anaerobic fermentation of biomass and the gasification of solid biomass (including biomass in wastes).
Remark: The biogases from anaerobic fermentation are composed principally of methane and carbon dioxide and comprise landfill gas, sewage sludge gas and other biogases from anaerobic fermentation.
Biogases can also be produced from thermal processes (by gasification or pyrolysis) of biomass and are mixtures containing hydrogen and carbon monoxide (usually known as syngas) along with other components. These gases may be further processed to modify their composition and can be further processed to produce substitute natural gas.
The gases are divided into two groups according to their production: biogases from anaerobic fermentation; and biogases from thermal processes.
They are used mainly as a fuel but can be used as a chemical feedstock.
531 Biogases from anaerobic fermentation
The biogases from anaerobic fermentation are composed principally of methane and carbon dioxide and comprise landfill gas, sewage sludge gas and other biogases from anaerobic fer-mentation.
Explanation: The biogases from anaerobic fermentation are composed principally of meth-ane and carbon dioxide and include gas produced from a range of wastes and other biomass materials, including energy crops in anaerobic digesters (including sewage sludge gas and landfill gas). The gases may be processed to remove the carbon dioxide and other constituents to produce a methane fuel.
5311 Landfill gas
Biogas from the anaerobic fermentation of organic matter in landfills.
5312 Sewage sludge gas
Biogas from the anaerobic fermentation of waste matter in sewage plants.
5319 other biogases from anaerobic fermentation
Other biogases from anaerobic fermentation not elsewhere specified.
Remark: Two of the largest sources of these biogases are the fermentation of energy crops and the fermentation of manure on farms.
532 Biogases from thermal processes
Biogases from thermal processes (by gasification or pyrolysis) of biomass.
Remark: Biogases from thermal processes are a mixture containing hydrogen and carbon monoxide (usually known as syngas) along with other components. These gases may be further processed to modify their composition and can be further processed to produce substitute natural gas.
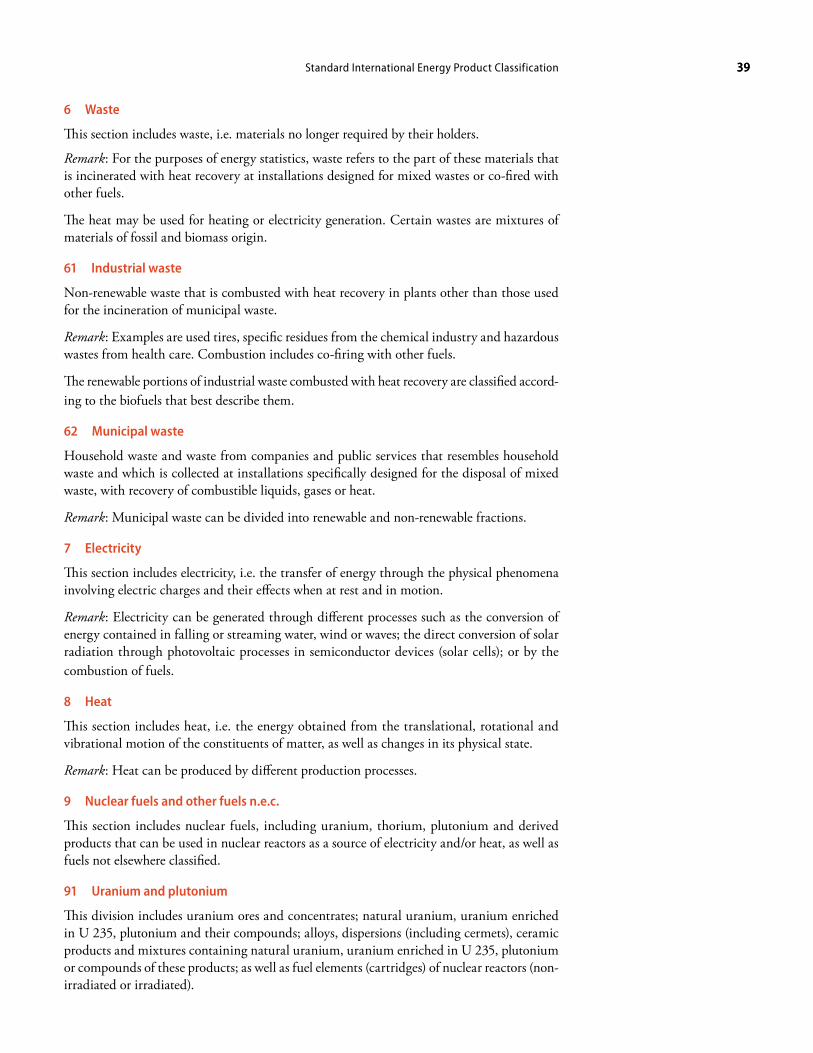
39Standard International Energy Product Classification 39
6 Waste
This section includes waste, i.e. materials no longer required by their holders.
Remark: For the purposes of energy statistics, waste refers to the part of these materials that is incinerated with heat recovery at installations designed for mixed wastes or co-fired with other fuels.
The heat may be used for heating or electricity generation. Certain wastes are mixtures of materials of fossil and biomass origin.
61 Industrial waste
Non-renewable waste that is combusted with heat recovery in plants other than those used for the incineration of municipal waste.
Remark: Examples are used tires, specific residues from the chemical industry and hazardous wastes from health care. Combustion includes co-firing with other fuels.
The renewable portions of industrial waste combusted with heat recovery are classified accord-ing to the biofuels that best describe them.
62 Municipal waste
Household waste and waste from companies and public services that resembles household waste and which is collected at installations specifically designed for the disposal of mixed waste, with recovery of combustible liquids, gases or heat.
Remark: Municipal waste can be divided into renewable and non-renewable fractions.
7 Electricity
This section includes electricity, i.e. the transfer of energy through the physical phenomena involving electric charges and their effects when at rest and in motion.
Remark: Electricity can be generated through different processes such as the conversion of energy contained in falling or streaming water, wind or waves; the direct conversion of solar radiation through photovoltaic processes in semiconductor devices (solar cells); or by the combustion of fuels.
8 Heat
This section includes heat, i.e. the energy obtained from the translational, rotational and vibrational motion of the constituents of matter, as well as changes in its physical state.
Remark: Heat can be produced by different production processes.
9 Nuclear fuels and other fuels n.e.c.
This section includes nuclear fuels, including uranium, thorium, plutonium and derived products that can be used in nuclear reactors as a source of electricity and/or heat, as well as fuels not elsewhere classified.
91 Uranium and plutonium
This division includes uranium ores and concentrates; natural uranium, uranium enriched in U 235, plutonium and their compounds; alloys, dispersions (including cermets), ceramic products and mixtures containing natural uranium, uranium enriched in U 235, plutonium or compounds of these products; as well as fuel elements (cartridges) of nuclear reactors (non-irradiated or irradiated).

International Recommendations for Energy Statistics (IRES)40
9101 Uranium ores
This class includes uranium ores and concentrates.
9109 other uranium and plutonium
This class includes natural uranium, uranium enriched in U 235, plutonium and their com-pounds; alloys, dispersions (including cermets), ceramic products and mixtures containing natural uranium, uranium enriched in U 235, plutonium or compounds of these products; as well as fuel elements (cartridges) of nuclear reactors (non-irradiated or irradiated).
92 other nuclear fuels
This division includes thorium and its compounds; alloys, dispersions (including cermets), ceramic products and mixtures containing thorium or compounds of thereof; other radioac-tive elements and isotopes and compounds (other than uranium, thorium or plutonium); alloys, dispersions (including cermets), ceramic products and mixtures containing these ele-ments, isotopes or compounds.
99 other fuels n.e.c.
This division includes fuels not elsewhere classified.

41
Chapter IV
Measurement units and conversion factors
A. Introduction4.1. Energy products are measured in physical units by their mass, volume, and energy content. The measurement units that are specific to an energy product and employed at the point of measurement of an energy flow are often referred to as “original” or “natural” units. Coal, for example, is generally measured by its mass and crude oil by its volume. On the other hand, cross-fuel tabulations, such as the energy balances, are displayed in a “common” unit to allow comparison across energy products. These “common” units are usually energy units and require the conversion from an original unit through the application of an appropriate conversion factor.24
4.2. When different units are used to measure a product, the compiler is left with the task of converting data that, in the absence of specific information on the products necessary for the conversion between different units (such as density, gravity and calorific value), may lead to discrepancies.
4.3. This chapter reviews the measurement units used for energy statistics, explains the concepts of “original” and “common” units, and presents default conversion factors to use in the absence of country- or region-specific calorific values.
B. Measurement units4.4. This section covers “original” or “natural” units, as well as “common” units. It also makes reference to the International System of Units, often abbreviated as SI from the French “Système International d’Unités”, which is the modern metric system of measurement estab-lished by international agreement. It provides a logical and interconnected framework for all measurements in science, industry and commerce (See box 4.1 for more details on SI).
24 A detailed description of units of measure was provided in Energy Statistics: Definitions, Units of Measure and Conversion Factors, Studies in Methods, Series F, No. 44, United Nations, New York, 1987, and in the IEA/Eurostat Energy Statistics Manual, Paris, 2004, chapter 1, section 5. The present chapter incorporates and updates material found in both these publications.
Box 4.1International System of Units
The International System of Units (SI) was established by and is defined by the General Conference on Weights and Measures (CGPM). It is the result of work that started in 1948 to make recommendations on the establishment of a practical system of units of measurement suitable for adoption by all signatories to the Convention du Mètre.
In 1954 and 1971, the CGPM adopted as base units the units of the following seven quantities: length, mass, time, electric current, thermodynamic temperature, luminous intensity and amount of substance.
In 1960, the CGPM adopted the name Système International d’Unités, with the international abbreviation SI for this practical system of units and laid down rules for prefixes, derived units, and the former sup-plementary units; it thus established a comprehensive specification for units of measurement.
Source: Based on the International Bureau of Weights and Measures ( BIPM), www.bipm.org/en/measure ment-units.
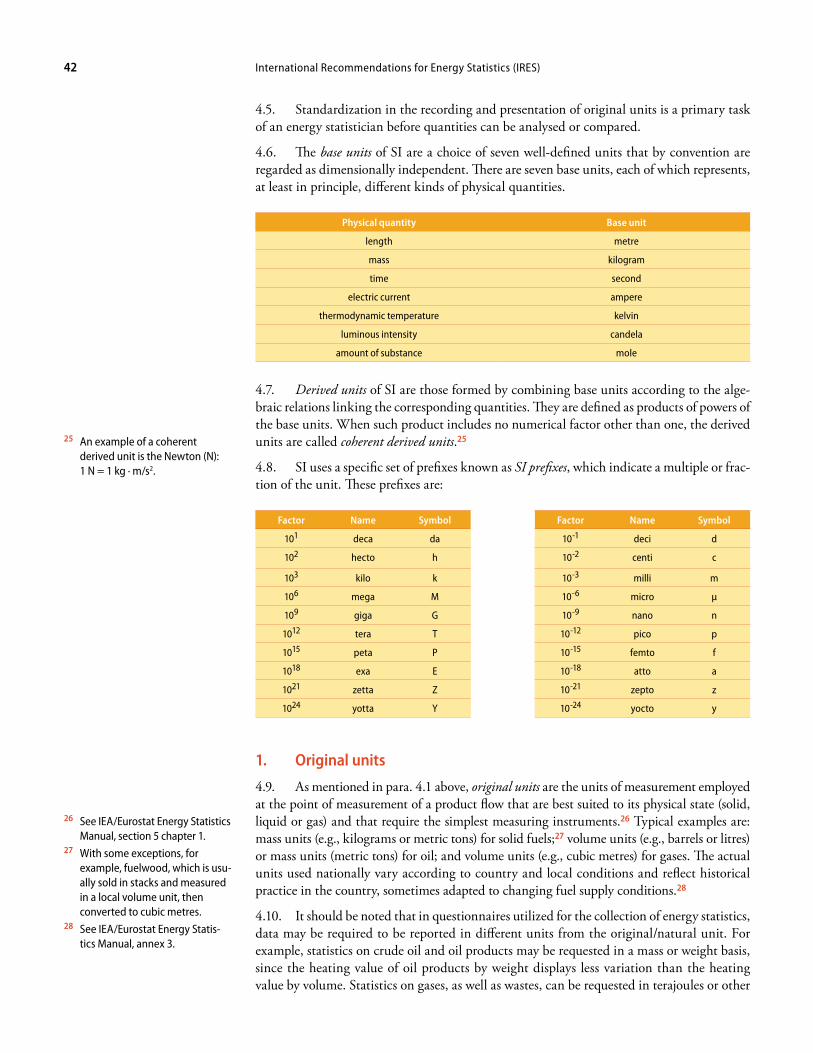
International Recommendations for Energy Statistics (IRES)42
4.5. Standardization in the recording and presentation of original units is a primary task of an energy statistician before quantities can be analysed or compared.
4.6. The base units of SI are a choice of seven well-defined units that by convention are regarded as dimensionally independent. There are seven base units, each of which represents, at least in principle, different kinds of physical quantities.
Physical quantity Base unit
length metre
mass kilogram
time second
electric current ampere
thermodynamic temperature kelvin
luminous intensity candela
amount of substance mole
4.7. Derived units of SI are those formed by combining base units according to the alge-braic relations linking the corresponding quantities. They are defined as products of powers of the base units. When such product includes no numerical factor other than one, the derived units are called coherent derived units.25
4.8. SI uses a specific set of prefixes known as SI prefixes, which indicate a multiple or frac-tion of the unit. These prefixes are:
Factor Name Symbol Factor Name Symbol
101 deca da 10-1 deci d
102 hecto h 10-2 centi c
103 kilo k 10-3 milli m
106 mega M 10-6 micro μ
109 giga G 10-9 nano n
1012 tera T 10-12 pico p
1015 peta P 10-15 femto f
1018 exa E 10-18 atto a
1021 zetta Z 10-21 zepto z
1024 yotta Y 10-24 yocto y
1. original units
4.9. As mentioned in para. 4.1 above, original units are the units of measurement employed at the point of measurement of a product flow that are best suited to its physical state (solid, liquid or gas) and that require the simplest measuring instruments.26 Typical examples are: mass units (e.g., kilograms or metric tons) for solid fuels;27 volume units (e.g., barrels or litres) or mass units (metric tons) for oil; and volume units (e.g., cubic metres) for gases. The actual units used nationally vary according to country and local conditions and reflect historical practice in the country, sometimes adapted to changing fuel supply conditions.28
4.10. It should be noted that in questionnaires utilized for the collection of energy statistics, data may be required to be reported in different units from the original/natural unit. For example, statistics on crude oil and oil products may be requested in a mass or weight basis, since the heating value of oil products by weight displays less variation than the heating value by volume. Statistics on gases, as well as wastes, can be requested in terajoules or other
25 An example of a coherent derived unit is the Newton (N): 1 N = 1 kg · m/s2.
26 See IEA/Eurostat Energy Statistics Manual, section 5 chapter 1.
27 With some exceptions, for example, fuelwood, which is usu-ally sold in stacks and measured in a local volume unit, then converted to cubic metres.
28 See IEA/Eurostat Energy Statis-tics Manual, annex 3.
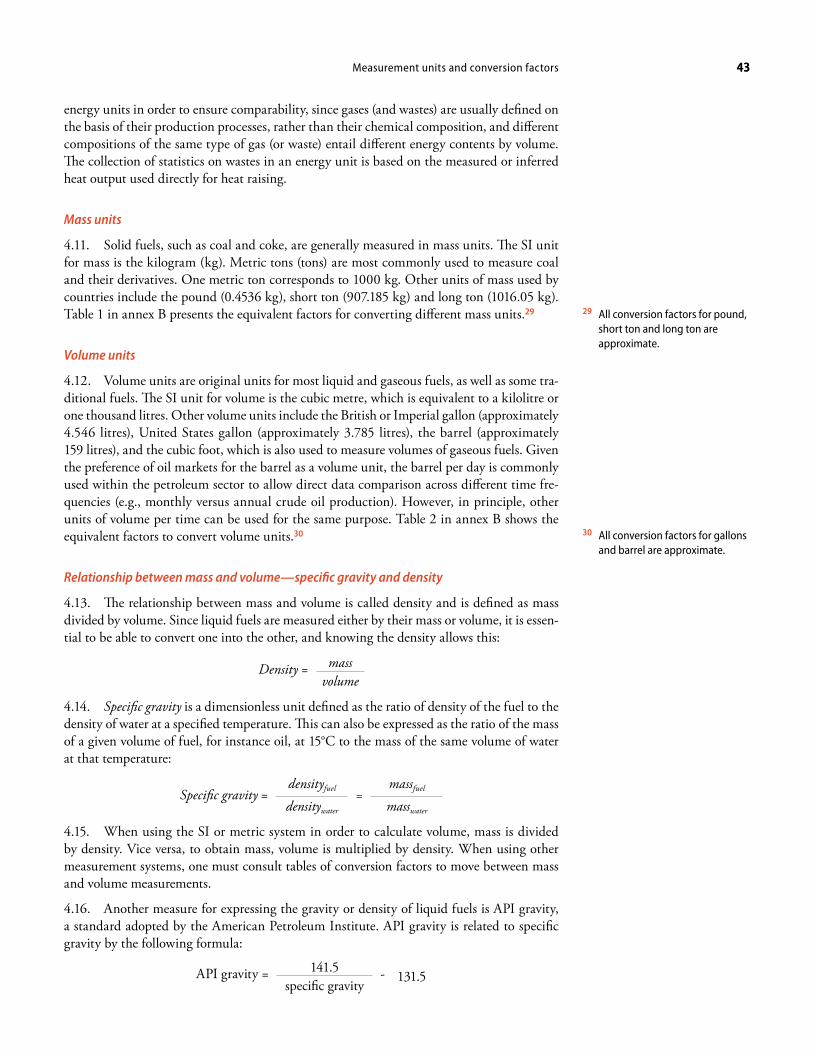
43Measurement units and conversion factors 43
energy units in order to ensure comparability, since gases (and wastes) are usually defined on the basis of their production processes, rather than their chemical composition, and different compositions of the same type of gas (or waste) entail different energy contents by volume. The collection of statistics on wastes in an energy unit is based on the measured or inferred heat output used directly for heat raising.
Mass units
4.11. Solid fuels, such as coal and coke, are generally measured in mass units. The SI unit for mass is the kilogram (kg). Metric tons (tons) are most commonly used to measure coal and their derivatives. One metric ton corresponds to 1000 kg. Other units of mass used by countries include the pound (0.4536 kg), short ton (907.185 kg) and long ton (1016.05 kg). Table 1 in annex B presents the equivalent factors for converting different mass units.29
Volume units
4.12. Volume units are original units for most liquid and gaseous fuels, as well as some tra-ditional fuels. The SI unit for volume is the cubic metre, which is equivalent to a kilolitre or one thousand litres. Other volume units include the British or Imperial gallon (approximately 4.546 litres), United States gallon (approximately 3.785 litres), the barrel (approximately 159 litres), and the cubic foot, which is also used to measure volumes of gaseous fuels. Given the preference of oil markets for the barrel as a volume unit, the barrel per day is commonly used within the petroleum sector to allow direct data comparison across different time fre-quencies (e.g., monthly versus annual crude oil production). However, in principle, other units of volume per time can be used for the same purpose. Table 2 in annex B shows the equivalent factors to convert volume units.30
Relationship between mass and volume—specific gravity and density
4.13. The relationship between mass and volume is called density and is defined as mass divided by volume. Since liquid fuels are measured either by their mass or volume, it is essen-tial to be able to convert one into the other, and knowing the density allows this:
Density = massvolume
4.14. Specific gravity is a dimensionless unit defined as the ratio of density of the fuel to the density of water at a specified temperature. This can also be expressed as the ratio of the mass of a given volume of fuel, for instance oil, at 15°C to the mass of the same volume of water at that temperature:
Specific gravity =densityfuel
densitywater
=massfuel
masswater
4.15. When using the SI or metric system in order to calculate volume, mass is divided by density. Vice versa, to obtain mass, volume is multiplied by density. When using other measurement systems, one must consult tables of conversion factors to move between mass and volume measurements.
4.16. Another measure for expressing the gravity or density of liquid fuels is API gravity, a standard adopted by the American Petroleum Institute. API gravity is related to specific gravity by the following formula:
API gravity = 141.5specific gravity
- 131.5
29 All conversion factors for pound, short ton and long ton are approximate.
30 All conversion factors for gallons and barrel are approximate.

International Recommendations for Energy Statistics (IRES)44
Energy units
4.17. Energy, heat, work and power are four concepts that are often confused. If force is exerted on an object and moves it over a distance, work is done, heat is released (under any-thing other than unrealistically ideal conditions) and energy is transformed. Energy, heat and work are three facets of the same concept. Energy is the capacity to do (and often the result of doing) work. Heat can be a by-product of work, but is also a form of energy. The coher-ent derived SI unit of energy, heat and work is the joule (J). The joule is a precise measure of energy and work, defined as the work done when a constant force of 1 Newton is exerted on a body with mass of 1 gram to move it a distance of 1 metre. Common multiples of the joule are the megajoule, gigajoule, terajoule and petajoule.
4.18. Other units include: the kilogram calorie in the metric system, or kilocalorie (kcal) or one of its multiples; the British thermal unit (Btu) or one of its multiples; ton of coal equiva-lent (tce), ton of oil equivalent (toe); and the kilowatt hour (kWh).
4.19. The International Steam Table Calorie (IT calorie) was originally defined as 1/860 inter-national watt-hour, but was later defined exactly as 4.1868 joules.31 This is the definition of the calorie used in the conversion tables in the annex to this chapter. The kilocalorie and the teracalorie are multiples of the calorie that are commonly used in the measurement of energy commodities. In the context of IRES, these are based on the IT calorie. Other definitions of the calorie include the gram calorie, defined by the amount of heat required to raise the tem-perature of one gram of water 1°C from a reference temperature. With a reference temperature of 14.5°C, the gram calorie equals 4.1855 joules. 32
4.20. The British thermal unit is a measure of heat and is equal to the amount of heat required to raise the temperature of 1 pound of water at 60°F by 1°F.33 Its most used multiples are the therm (105 Btu) and the quad (1015 Btu). The internationally agreed value for the Btu is currently 1055.06 joules.
4.21. In the past, when coal was the principal commercial fuel, the ton of coal equivalent (tce) was commonly used as an energy unit. However, with the increasing importance of oil, it has been replaced by the ton of oil equivalent (toe). The toe is now defined as 41.868 gigajoules, whereas the tce equals 29.3076 gigajoules. Generally, it should not be assumed that one ton of coal contains one tce or that one ton of oil contains one toe of energy content, since there is a wide spread in calorific values among various types of coals, crude oils and petroleum products.34
4.22. Power is the rate at which work is done (or heat released, or energy converted). The rate of one joule per second is called a watt. As an example, a light bulb might draw 100 joules of electricity per second to emit light and heat (both forms of energy). This light bulb would then draw the power of 100 watts.
4.23. The above definition of watt leads to another commonly used measure of energy, the kilowatt hour (kWh), which refers to the energy equivalent of 1000 watt (joules per second) over a one-hour period. Thus, 1 kilowatt-hour equals 3.6x10⁶ joules.
4.24. Electricity is usually measured in kWh. This allows one to perceive the electrical energy in terms of the time an appliance of a specified wattage takes to “consume” this energy. Heat quantities, on the other hand, are usually measured in calories or joules.
4.25. Table 3 in annex B shows the conversion factors between several energy units.
31 Defined at the Fifth International Conference on the Properties of Steam (London, July 1956).
32 Other reference temperatures are also encountered, which leads to different values for the gram calorie.
33 °F denotes degrees Fahrenheit.
34 See chapter IV, section C.
45Measurement units and conversion factors 45
2. Common units
4.26. Since the original units in which energy products are measured vary (e.g., metric tons, barrels, kilowatt hours, therm, calories, joules, cubic metres), quantities of energy products need to be converted into a common unit to allow comparisons of fuel quantities and esti-mate transformation efficiencies. The conversion from different units to a common unit may require specific conversion factors for each product. 35
4.27. The only energy unit in the International System of Units is the joule and it is usually used in energy statistics as a common unit, although other energy units are sometimes also applied (e.g., toe, GWh, Btu, calories, etc.). The use of the joule as a common unit is recommended.
4.28. It is further recommended that national and international agencies in charge of energy statistics and any other organizations that advise them or undertake work for them always clearly define the measurement units, as well as the common units used for presentational purposes in various publications and in electronically disseminated data. The conversion fac-tors and the methods used to convert original physical units into the chosen common unit or units should be described in energy statistics metadata and be readily accessible to users. In addition, it should be made clear whether energy units are defined on a gross or net calorific basis (see section C below for details).
C. Calorific values4.29. Calorific values or heating values of a fuel express the heat obtained from one unit of the fuel. They are necessary for the compilation of overall energy balances where the original units in which the fuels are measured are converted into a common unit of measurement. Even though calorific values are often considered in the context of the preparation of energy balances, they have a wider application in the preparation of any tables designed to show energy in an aggregated form or in the preparation of inter-fuel comparative analyses.
4.30. Calorific values are obtained by measurements in a laboratory specializing in fuel quality determination. They should preferably be in terms of joules (or any of its multiples) per original unit, for example gigajoule/metric ton (GJ/t) or gigajoule/cubic metre (GJ/m3). Major fuel producers (mining companies, refineries, etc.) normally measure the calorific value and other qualities of the fuels they produce. A calorific value is a conversion factor, in the sense that it can be used to convert mass or volume quantities into energy content.
4.31. There are two main issues with regards to calorific values that an energy compiler should pay attention to: the first one refers to whether they are measured gross or net of the latent heat (that is the heat necessary to evaporate the water formed during combustion and the water previously present in the fuel in the form of moisture); and the second one is related to whether the calorific value used refers to the specific product-flow-country situation or it refers to a default value. These two issues are presented in detail in the next two sections.
1. Gross and net calorific/heating values
4.32. Calorific values can be expressed on a gross and net basis. The gross calorific value (GCV), or high heat value, measures the total (maximum) amount of heat that is produced by com-bustion. However, part of this heat will be locked up in the latent heat of evaporation of any water present in the fuel before combustion (moisture), or generated in the combustion pro-cess. The latter comes from the combination of hydrogen present in the fuel with the oxidant oxygen (O2) present in the air to form H2O. This combination itself releases heat but this heat is partly used in the evaporation of the generated water.
35 For example, the factor to convert from m3 to TJ will be different for different types of gaseous or liquid fuels. However, the factor to convert from kWh to TJ is the same for all products.
International Recommendations for Energy Statistics (IRES)46
4.33. The net calorific value (NCV), or low heat value, excludes the latent heat. The NCV is that amount of heat from the combustion process that is actually available in practice for capture and use. The higher the moisture of a fuel or its hydrogen content, the greater is the difference between GCV and NCV. For some fuels with very little or no hydrogen content (e.g., some types of coke, blast furnace gas) this difference is negligible. In terms of magni-tude, the difference between gross and net calorific values of fossil fuels (coal, oil, oil products and gas) is typically less than 10 per cent, while that of biomass energy (fuelwood, bagasse) is usually more than 10 per cent. Examples of differences between gross and net calorific values are presented for selected energy products in table 4 of annex B. It should be noted that the technology used to burn a fuel can also play a role in determining the NCV of that fuel, for instance, depending on how much of the latent heat it can recover from the exhaust gases.
4.34. It is recommended that, when expressing the energy content of energy products in terms of a common energy unit, NCVs be used in preference to GCVs. In other words, the heat required to evaporate moisture, which is present in all fuels and is also produced in the combustion process, should not be treated as part of a fuel’s energy, providing capability. In particular, NCVs are to be preferred over GCVs when building an energy balance, since most current technologies are still not able to recover the latent heat, which would thus not be treated as part of a fuel’s energy providing capability (see chapter VIII for further discussion).36 How-ever, where available, it is strongly encouraged to report both gross and net calorific values.
2. Default vs. specific calorific values
4.35. Energy products with exactly the same chemical composition will carry the same energy content. In practice, however, there are variations in the composition of energy prod-ucts and consequently, their calorific values can vary. For example, “premium” gasoline may have slightly different chemical formulations (and therefore a different energy content) than “regular” gasoline; natural gas may contain variations in the proportions of ethane and meth-ane; liquefied petroleum gas (LPG) may in fact be solely propane or solely butane or any com-bination of the two. Only those products that are single energy compounds, such as “pure” methane or “pure” ethane, and electricity, have precise and unalterable energy contents.
4.36. Default calorific values refer to the energy content of fuels with specific characteristics that are generally applicable to all circumstances (different countries, different flows, etc.). They are used as default values when specific calorific values are not available. Specific calorific values, on the other hand, are based on the specificity of the fuel in question and are meas-urable from the original data source. They are particularly important for fuels that present different qualities: coal, for example, displays a range of quality that makes it suitable for dif-ferent uses. The respective calorific values are thus specific to the fuel and flow in question. However, in using many different specific calorific values, caution should be applied to ensure consistency between the energy content on the supply side and on the consumption side for a particular country and year.
4.37. Often there is a problem in energy statistics as the product produced may not be iden-tical in composition to the product in subsequent processes, even though it is referred to by the same name. Natural gas can be enriched with oil products, for example, to meet market specifications. Motor gasoline can be blended with ethanol and sold as motor gasoline, and depending on the country practice, this may be recorded as consumption of only motor gaso-line or as consumption of motor gasoline and the blending agent. In this case, flow-specific calorific values would allow for a more accurate energy balance.
4.38. It is recommended that countries collect data in original units together with data on specific calorific values. A country-specific calorific value is generally calculated as a weighted
36 A number of countries are currently able to recuperate a significant part of the latent heat, and thus the use of gross calorific values may reflect more appropriately their circumstances.
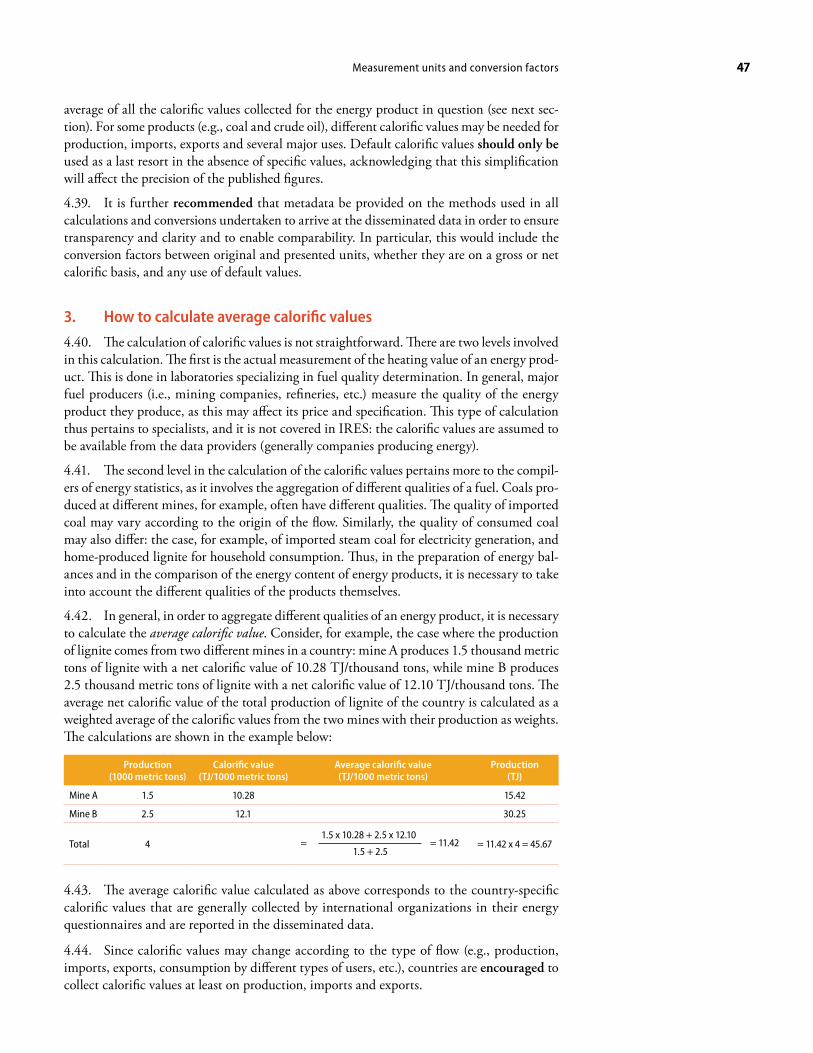
47Measurement units and conversion factors 47
average of all the calorific values collected for the energy product in question (see next sec-tion). For some products (e.g., coal and crude oil), different calorific values may be needed for production, imports, exports and several major uses. Default calorific values should only be used as a last resort in the absence of specific values, acknowledging that this simplification will affect the precision of the published figures.
4.39. It is further recommended that metadata be provided on the methods used in all calculations and conversions undertaken to arrive at the disseminated data in order to ensure transparency and clarity and to enable comparability. In particular, this would include the conversion factors between original and presented units, whether they are on a gross or net calorific basis, and any use of default values.
3. How to calculate average calorific values
4.40. The calculation of calorific values is not straightforward. There are two levels involved in this calculation. The first is the actual measurement of the heating value of an energy prod-uct. This is done in laboratories specializing in fuel quality determination. In general, major fuel producers (i.e., mining companies, refineries, etc.) measure the quality of the energy product they produce, as this may affect its price and specification. This type of calculation thus pertains to specialists, and it is not covered in IRES: the calorific values are assumed to be available from the data providers (generally companies producing energy).
4.41. The second level in the calculation of the calorific values pertains more to the compil-ers of energy statistics, as it involves the aggregation of different qualities of a fuel. Coals pro-duced at different mines, for example, often have different qualities. The quality of imported coal may vary according to the origin of the flow. Similarly, the quality of consumed coal may also differ: the case, for example, of imported steam coal for electricity generation, and home-produced lignite for household consumption. Thus, in the preparation of energy bal-ances and in the comparison of the energy content of energy products, it is necessary to take into account the different qualities of the products themselves.
4.42. In general, in order to aggregate different qualities of an energy product, it is necessary to calculate the average calorific value. Consider, for example, the case where the production of lignite comes from two different mines in a country: mine A produces 1.5 thousand metric tons of lignite with a net calorific value of 10.28 TJ/thousand tons, while mine B produces 2.5 thousand metric tons of lignite with a net calorific value of 12.10 TJ/thousand tons. The average net calorific value of the total production of lignite of the country is calculated as a weighted average of the calorific values from the two mines with their production as weights. The calculations are shown in the example below:
Production (1000 metric tons)
Calorific value(TJ/1000 metric tons)
Average calorific value(TJ/1000 metric tons)
Production(TJ)
Mine A 1.5 10.28 15.42
Mine B 2.5 12.1 30.25
Total 4 1.5 x 10.28 + 2.5 x 12.10 1.5 + 2.5
= = 11.42 = 11.42 x 4 = 45.67
4.43. The average calorific value calculated as above corresponds to the country-specific calorific values that are generally collected by international organizations in their energy questionnaires and are reported in the disseminated data.
4.44. Since calorific values may change according to the type of flow (e.g., production, imports, exports, consumption by different types of users, etc.), countries are encouraged to collect calorific values at least on production, imports and exports.
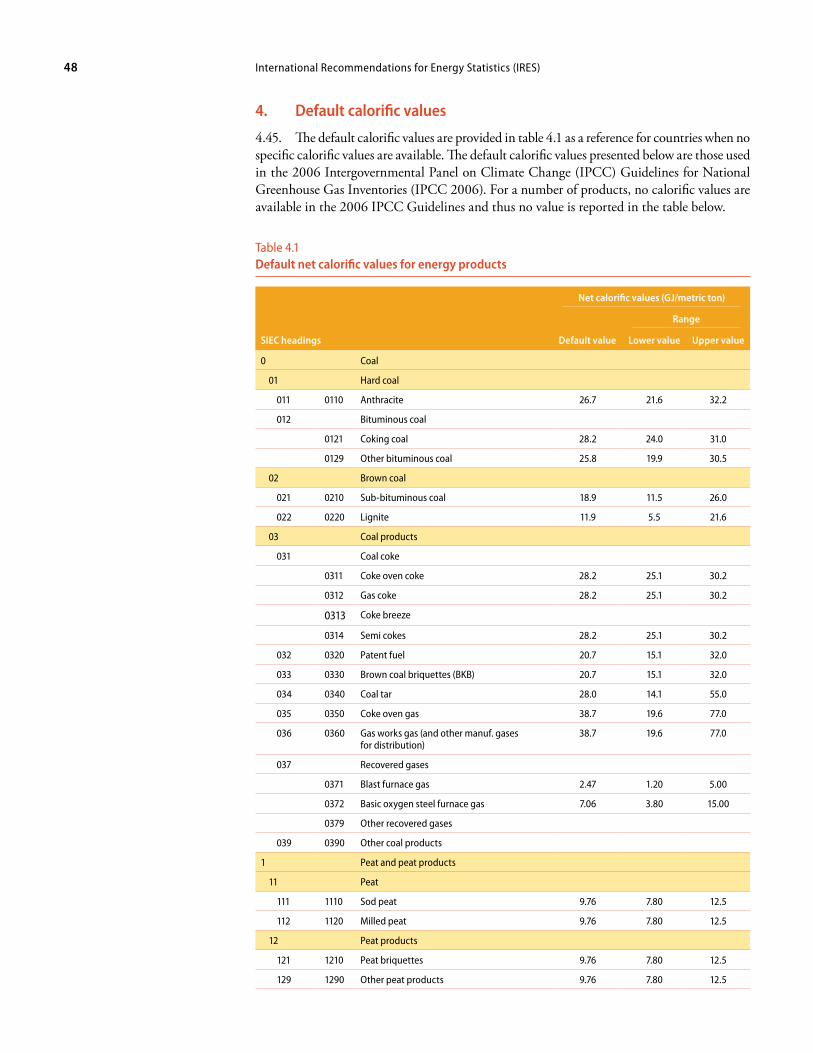
International Recommendations for Energy Statistics (IRES)48
4. Default calorific values
4.45. The default calorific values are provided in table 4.1 as a reference for countries when no specific calorific values are available. The default calorific values presented below are those used in the 2006 Intergovernmental Panel on Climate Change (IPCC) Guidelines for National Greenhouse Gas Inventories (IPCC 2006). For a number of products, no calorific values are available in the 2006 IPCC Guidelines and thus no value is reported in the table below.
Table 4.1Default net calorific values for energy products
Net calorific values (GJ/metric ton)
Range
SIEC headings Default value Lower value Upper value
0 Coal
01 Hard coal
011 0110 Anthracite 26.7 21.6 32.2
012 Bituminous coal
0121 Coking coal 28.2 24.0 31.0
0129 Other bituminous coal 25.8 19.9 30.5
02 Brown coal
021 0210 Sub-bituminous coal 18.9 11.5 26.0
022 0220 Lignite 11.9 5.5 21.6
03 Coal products
031 Coal coke
0311 Coke oven coke 28.2 25.1 30.2
0312 Gas coke 28.2 25.1 30.2
0313 Coke breeze
0314 Semi cokes 28.2 25.1 30.2
032 0320 Patent fuel 20.7 15.1 32.0
033 0330 Brown coal briquettes (BKB) 20.7 15.1 32.0
034 0340 Coal tar 28.0 14.1 55.0
035 0350 Coke oven gas 38.7 19.6 77.0
036 0360 Gas works gas (and other manuf. gases for distribution)
38.7 19.6 77.0
037 Recovered gases
0371 Blast furnace gas 2.47 1.20 5.00
0372 Basic oxygen steel furnace gas 7.06 3.80 15.00
0379 Other recovered gases
039 0390 Other coal products
1 Peat and peat products
11 Peat
111 1110 Sod peat 9.76 7.80 12.5
112 1120 Milled peat 9.76 7.80 12.5
12 Peat products
121 1210 Peat briquettes 9.76 7.80 12.5
129 1290 Other peat products 9.76 7.80 12.5
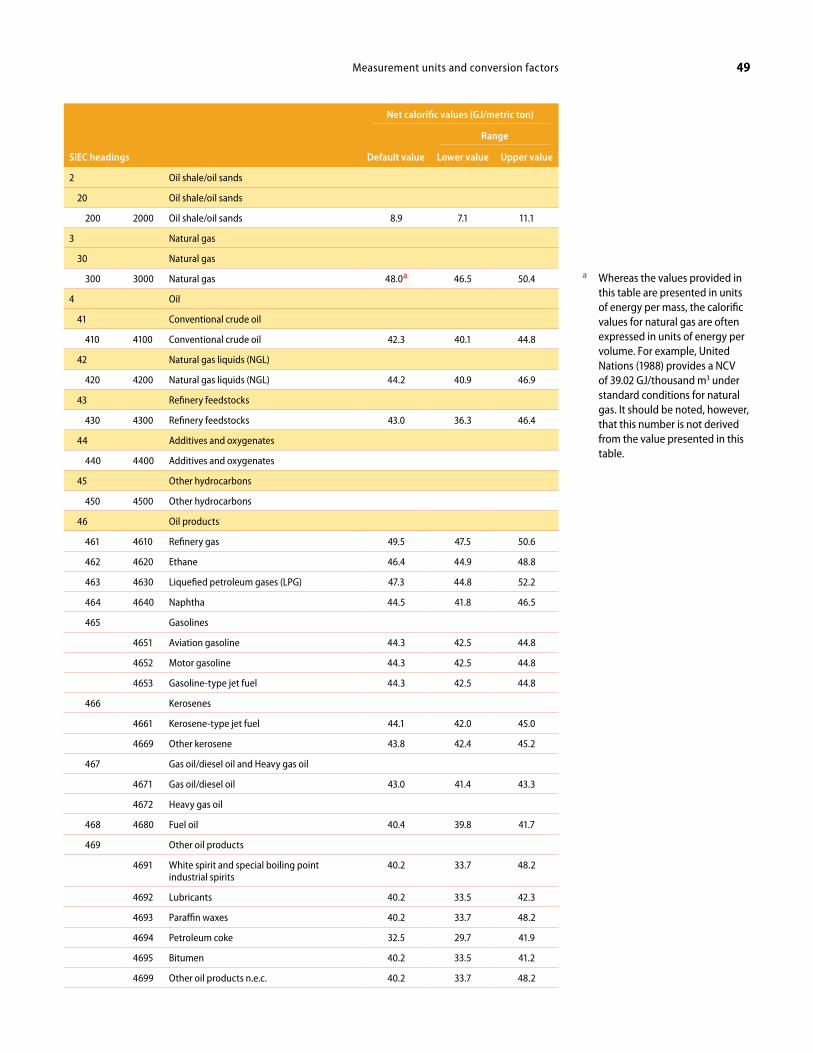
49Measurement units and conversion factors 49
Net calorific values (GJ/metric ton)
Range
SIEC headings Default value Lower value Upper value
2 Oil shale/oil sands
20 Oil shale/oil sands
200 2000 Oil shale/oil sands 8.9 7.1 11.1
3 Natural gas
30 Natural gas
300 3000 Natural gas 48.0a 46.5 50.4
4 Oil
41 Conventional crude oil
410 4100 Conventional crude oil 42.3 40.1 44.8
42 Natural gas liquids (NGL)
420 4200 Natural gas liquids (NGL) 44.2 40.9 46.9
43 Refinery feedstocks
430 4300 Refinery feedstocks 43.0 36.3 46.4
44 Additives and oxygenates
440 4400 Additives and oxygenates
45 Other hydrocarbons
450 4500 Other hydrocarbons
46 Oil products
461 4610 Refinery gas 49.5 47.5 50.6
462 4620 Ethane 46.4 44.9 48.8
463 4630 Liquefied petroleum gases (LPG) 47.3 44.8 52.2
464 4640 Naphtha 44.5 41.8 46.5
465 Gasolines
4651 Aviation gasoline 44.3 42.5 44.8
4652 Motor gasoline 44.3 42.5 44.8
4653 Gasoline-type jet fuel 44.3 42.5 44.8
466 Kerosenes
4661 Kerosene-type jet fuel 44.1 42.0 45.0
4669 Other kerosene 43.8 42.4 45.2
467 Gas oil/diesel oil and Heavy gas oil
4671 Gas oil/diesel oil 43.0 41.4 43.3
4672 Heavy gas oil
468 4680 Fuel oil 40.4 39.8 41.7
469 Other oil products
4691 White spirit and special boiling point industrial spirits
40.2 33.7 48.2
4692 Lubricants 40.2 33.5 42.3
4693 Paraffin waxes 40.2 33.7 48.2
4694 Petroleum coke 32.5 29.7 41.9
4695 Bitumen 40.2 33.5 41.2
4699 Other oil products n.e.c. 40.2 33.7 48.2
a Whereas the values provided in this table are presented in units of energy per mass, the calorific values for natural gas are often expressed in units of energy per volume. For example, United Nations (1988) provides a NCV of 39.02 GJ/thousand m3 under standard conditions for natural gas. It should be noted, however, that this number is not derived from the value presented in this table.
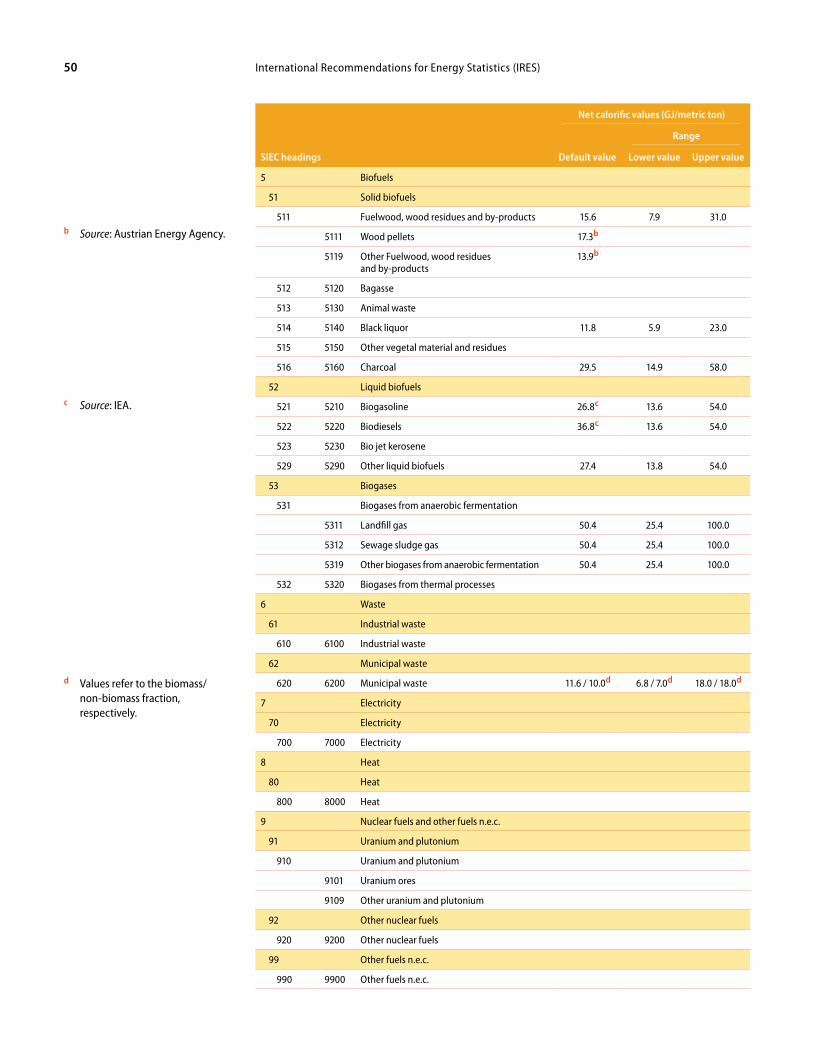
International Recommendations for Energy Statistics (IRES)50
Net calorific values (GJ/metric ton)
Range
SIEC headings Default value Lower value Upper value
5 Biofuels
51 Solid biofuels
511 Fuelwood, wood residues and by-products 15.6 7.9 31.0
5111 Wood pellets 17.3b
5119 Other Fuelwood, wood residues and by-products
13.9b
512 5120 Bagasse
513 5130 Animal waste
514 5140 Black liquor 11.8 5.9 23.0
515 5150 Other vegetal material and residues
516 5160 Charcoal 29.5 14.9 58.0
52 Liquid biofuels
521 5210 Biogasoline 26.8c 13.6 54.0
522 5220 Biodiesels 36.8c 13.6 54.0
523 5230 Bio jet kerosene
529 5290 Other liquid biofuels 27.4 13.8 54.0
53 Biogases
531 Biogases from anaerobic fermentation
5311 Landfill gas 50.4 25.4 100.0
5312 Sewage sludge gas 50.4 25.4 100.0
5319 Other biogases from anaerobic fermentation 50.4 25.4 100.0
532 5320 Biogases from thermal processes
6 Waste
61 Industrial waste
610 6100 Industrial waste
62 Municipal waste
620 6200 Municipal waste 11.6 / 10.0d 6.8 / 7.0d 18.0 / 18.0d
7 Electricity
70 Electricity
700 7000 Electricity
8 Heat
80 Heat
800 8000 Heat
9 Nuclear fuels and other fuels n.e.c.
91 Uranium and plutonium
910 Uranium and plutonium
9101 Uranium ores
9109 Other uranium and plutonium
92 Other nuclear fuels
920 9200 Other nuclear fuels
99 Other fuels n.e.c.
990 9900 Other fuels n.e.c.
d Values refer to the biomass/ non-biomass fraction, respectively.
b Source: Austrian Energy Agency.
c Source: IEA.
51Measurement units and conversion factors 51
Fuelwood
4.46. In rural areas of many developing countries, the principal source of energy for cooking and heating is fuelwood, but statistics on fuelwood in general are poor. This is due largely to the fact that fuelwood is in great part produced by households for their own use and/or traded in the informal sector.
4.47. There is a large variety of wood species and a large variability of moisture and ash content in wood products that highly affect the calorific value of the product. Countries are therefore encouraged to identify typical fuelwood mixes and average water content and to establish country-specific conversion factors between volume and mass. Guidelines for the measurement of fuelwood and the determination of calorific values are provided below.
4.48. Fuelwood can be measured by either volume or weight. If it is measured by volume, it can be either stacked volume or solid volume. Measures of stacked fuelwood are the stere or stacked cubic metre and the cord (128 stacked cubic feet). Solid volume is obtained by the water displacement method, that is the volume of water displaced if the quantity of fuelwood were to be completely submerged. One advantage of measurement by volume is the relatively small influence of the moisture content of the wood on the measurement results. The weight of fuelwood is highly dependent on moisture content, and this is true for all biomass. The more water per unit weight, the less fuelwood. Therefore, it is important that the moisture content be accurately specified when fuelwood is measured by weight.
4.49. There are two ways of measuring moisture content (mc). They are the so-called dry basis and wet basis and are defined below:
Dry basis: mc% = x100wet weight - dry weightdry weight
Wet basis: mc% = x100wet weight - dry weightwet weight
4.50. When biomass is very wet, there is a large difference between the two moisture con-tents (e.g., 100 per cent mc dry basis is equivalent to 50 per cent mc wet basis), but when the biomass is air-dry the difference is small (15 per cent mc dry basis is equivalent to 13 per cent mc wet basis). It is important to state on which basis the moisture content is measured. In most, but not all cases, fuelwood moisture is measured on a dry basis.
4.51. Another important determinant of the energy content of fuelwood is ash content. While the ash content of fuelwood is generally around one per cent, some species can register an ash content of up to four per cent. This affects the energy value of the wood since the sub-stances that form the ashes generally have no energy value. Thus wood with four per cent ash content will have three per cent less energy content than wood with one percent ash content.
4.52. The default calorific values for fuelwood (converting from mass units to energy units) are presented in table 4.2. The table shows how the calorific values vary with different mois-ture content of green wood, air-dried wood and oven-dried wood.
4.53. When fuelwood is collected in volume units, a conversion factor has to be used to obtain mass units. Table 4.3 shows the conversion factors for going from volume to mass units. Table 5 in annex B shows how the different moisture contents of fuelwood affect the conversion factors between cubic metres and metric tons.
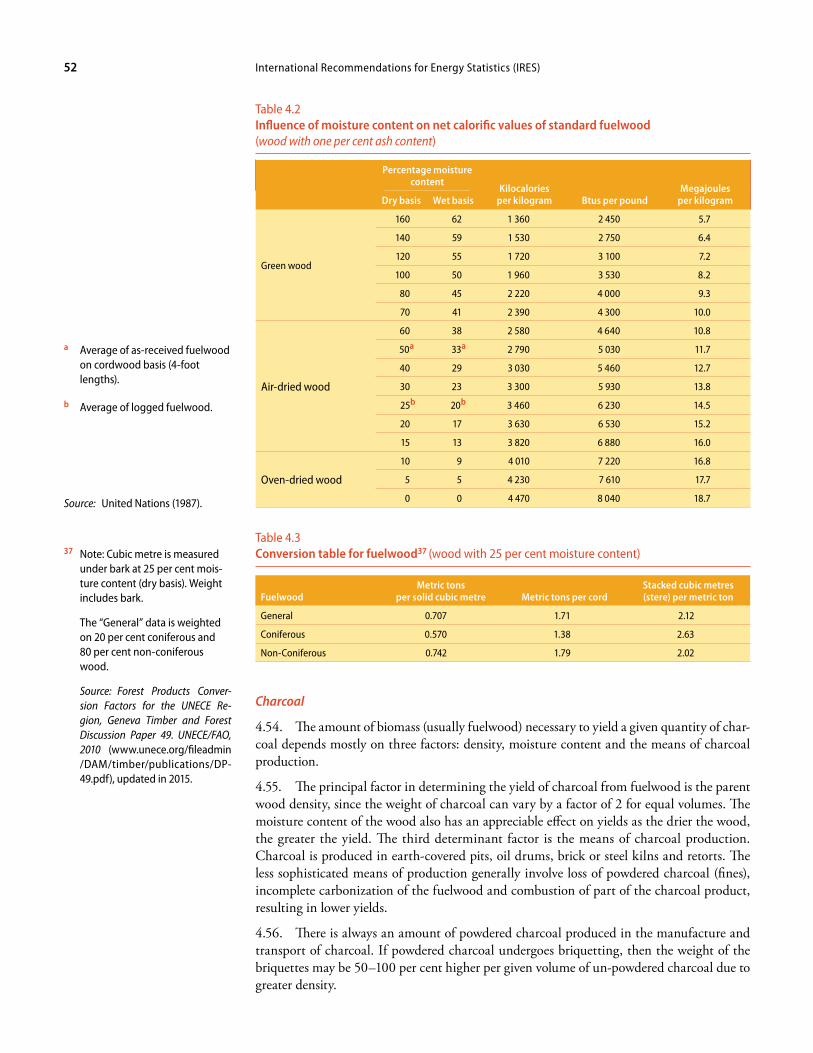
International Recommendations for Energy Statistics (IRES)52
Table 4.2Influence of moisture content on net calorific values of standard fuelwood (wood with one per cent ash content)
Percentage moisture content
Kilocalories per kilogram Btus per pound
Megajoules per kilogramDry basis Wet basis
Green wood
160 62 1 360 2 450 5.7
140 59 1 530 2 750 6.4
120 55 1 720 3 100 7.2
100 50 1 960 3 530 8.2
80 45 2 220 4 000 9.3
70 41 2 390 4 300 10.0
Air-dried wood
60 38 2 580 4 640 10.8
50a 33a 2 790 5 030 11.7
40 29 3 030 5 460 12.7
30 23 3 300 5 930 13.8
25b 20b 3 460 6 230 14.5
20 17 3 630 6 530 15.2
15 13 3 820 6 880 16.0
Oven-dried wood
10 9 4 010 7 220 16.8
5 5 4 230 7 610 17.7
0 0 4 470 8 040 18.7
Table 4.3Conversion table for fuelwood37 (wood with 25 per cent moisture content)
FuelwoodMetric tons
per solid cubic metre Metric tons per cordStacked cubic metres (stere) per metric ton
General 0.707 1.71 2.12
Coniferous 0.570 1.38 2.63
Non-Coniferous 0.742 1.79 2.02
Charcoal
4.54. The amount of biomass (usually fuelwood) necessary to yield a given quantity of char-coal depends mostly on three factors: density, moisture content and the means of charcoal production.
4.55. The principal factor in determining the yield of charcoal from fuelwood is the parent wood density, since the weight of charcoal can vary by a factor of 2 for equal volumes. The moisture content of the wood also has an appreciable effect on yields as the drier the wood, the greater the yield. The third determinant factor is the means of charcoal production. Charcoal is produced in earth-covered pits, oil drums, brick or steel kilns and retorts. The less sophisticated means of production generally involve loss of powdered charcoal (fines), incomplete carbonization of the fuelwood and combustion of part of the charcoal product, resulting in lower yields.
4.56. There is always an amount of powdered charcoal produced in the manufacture and transport of charcoal. If powdered charcoal undergoes briquetting, then the weight of the briquettes may be 50–100 per cent higher per given volume of un-powdered charcoal due to greater density.
Source: United Nations (1987).
a Average of as-received fuelwood on cordwood basis (4-foot lengths).
b Average of logged fuelwood.
37 Note: Cubic metre is measured under bark at 25 per cent mois-ture content (dry basis). Weight includes bark.
The “General” data is weighted on 20 per cent coniferous and 80 per cent non-coniferous wood.
Source: Forest Products Conver-sion Factors for the UNECE Re-gion, Geneva Timber and Forest Discussion Paper 49. UNECE/FAO, 2010 (www.unece.org/fileadmin /DAM/timber/publications/DP-49.pdf), updated in 2015.
53Measurement units and conversion factors 53
4.57. The three variables that affect the energy value of charcoal are: moisture content, ash content and degree of carbonization. The average moisture content of charcoal is 5 per cent. The average ash content of wood charcoal is 4 per cent, while that of charcoal produced from woody crop residues, such as coffee shrubs, is near 20 per cent. With the assumption of com-plete carbonization, the average energy value of wood charcoal with 4 per cent ash content and 5 per cent moisture content is approximately 30.8 MJ/kg. The average energy value of crop residue charcoal with 20 per cent ash content and 5 per cent moisture content is 25.7 MJ/kg.
4.58. Two tables pertaining to charcoal production are provided in annex B. In particular, table 6 illustrates the effect of parent wood density and moisture content on charcoal yield. Table 7 provides conversion factors for the production of charcoal by the various kilns for selected percentages of wood moisture content. It assumes some standard hardwood as input to the process.
Vegetal and animal wastes
4.59. Agricultural wastes and waste products from food processing is used to replace woody biomass in fuelwood deficient areas. These waste products can be burned as fuels to fulfil heating or cooking requirements.
4.60. There are two important determinants of the energy value of non-woody plant bio-mass: moisture content and ash content. While the ash content of wood is generally around 1 per cent, that of crop residues can vary from 3 per cent to over 20 per cent, and this affects the energy value. Generally, the substances that form the ashes have no energy value. Thus, biomass with 20 percent ash content will have 19 percent less energy than a similar substance with 1 per cent ash content. Data for these potential sources of energy are rarely collected directly but derived from crop/waste or end-product/waste ratios. Due to this wide variabil-ity in composition in ash and moisture content of general animal and vegetal wastes across countries, it is recommended that these products be reported to international organizations in an energy unit (preferably TJ) rather than their natural units. National authorities are, in general, able to assess and determine the energy content of these wastes. Alternatively, meas-uring the energy content can be accomplished by measuring the heat or electricity output of transformation devices and applying standard efficiency factors.
4.61. Given the importance of the use of bagasse, the fibrous cane residue from the produc-tion of sugar from sugar cane, possible estimation procedures are outlined for this case below. Also, singling out this specific vegetal waste allows the reporting of quantities to international organizations in its natural unit (weight basis), since its composition does not allow much variation. This has been done by international organizations that treat bagasse separately from ordinary vegetal waste. Bagasse is used as a fuel mostly for the sugar industry’s own energy needs (at times, excess electricity is also fed into the public grid) in many sugar-producing countries. The availability of fuel bagasse can be estimated based on either data on the input of sugar cane into sugar mills, or production data on centrifugal cane sugar.
4.62. Method (a): Studies based on experiences in Central American countries found that the yield of fuel bagasse is approximately 280 kilograms per metric ton of sugar cane pro-cessed. Assuming a 50 per cent moisture content at the time of use, 1 metric ton of bagasse yields 7.72 GJ. The energy values for bagasse corresponding to 1 metric ton of processed sugar cane are, therefore, as follows:
2.16 GJ = 0.516 Gcal = 0.074 tce = 0.051 toe
4.63. Method (b): Based on observations, the Economic Commission for Latin America and the Caribbean (ECLAC) proposed the use of 3.26 kg bagasse yield per kilogram of cen-trifugal sugar produced. Calorific equivalents for bagasse corresponding to the production of 1 metric ton of sugar are as follows:
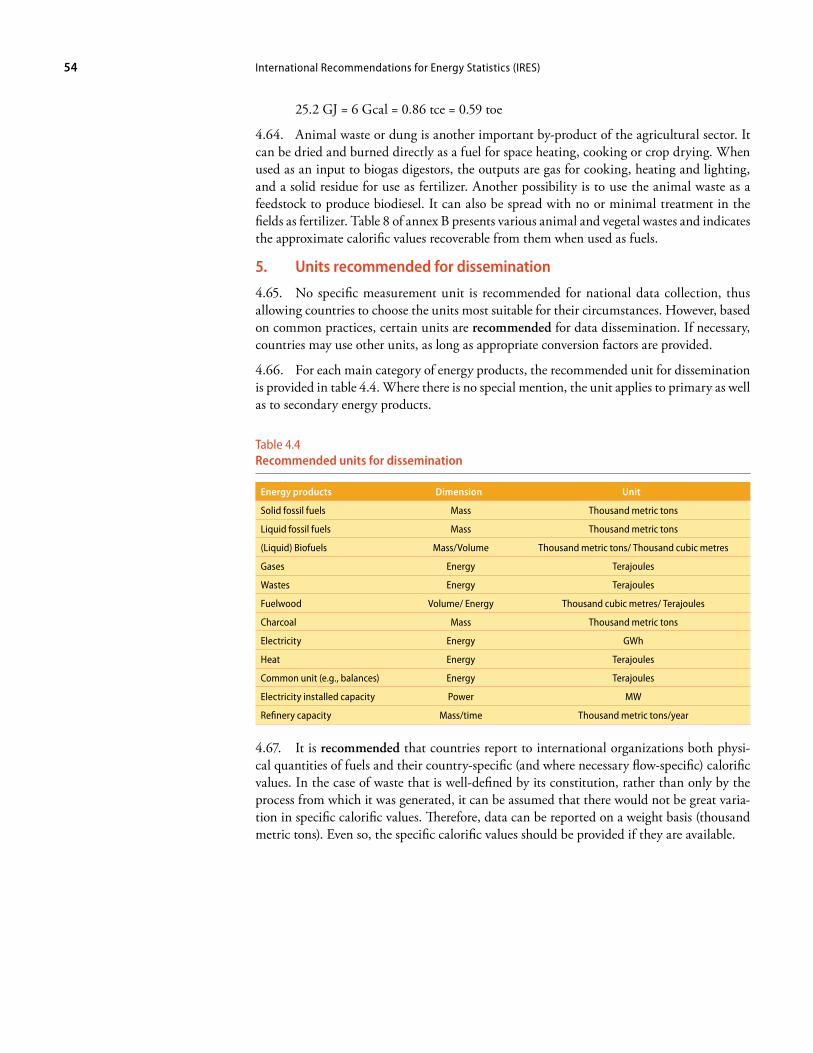
International Recommendations for Energy Statistics (IRES)54
25.2 GJ = 6 Gcal = 0.86 tce = 0.59 toe
4.64. Animal waste or dung is another important by-product of the agricultural sector. It can be dried and burned directly as a fuel for space heating, cooking or crop drying. When used as an input to biogas digestors, the outputs are gas for cooking, heating and lighting, and a solid residue for use as fertilizer. Another possibility is to use the animal waste as a feedstock to produce biodiesel. It can also be spread with no or minimal treatment in the fields as fertilizer. Table 8 of annex B presents various animal and vegetal wastes and indicates the approximate calorific values recoverable from them when used as fuels.
5. Units recommended for dissemination
4.65. No specific measurement unit is recommended for national data collection, thus allowing countries to choose the units most suitable for their circumstances. However, based on common practices, certain units are recommended for data dissemination. If necessary, countries may use other units, as long as appropriate conversion factors are provided.
4.66. For each main category of energy products, the recommended unit for dissemination is provided in table 4.4. Where there is no special mention, the unit applies to primary as well as to secondary energy products.
Table 4.4Recommended units for dissemination
Energy products Dimension Unit
Solid fossil fuels Mass Thousand metric tons
Liquid fossil fuels Mass Thousand metric tons
(Liquid) Biofuels Mass/Volume Thousand metric tons/ Thousand cubic metres
Gases Energy Terajoules
Wastes Energy Terajoules
Fuelwood Volume/ Energy Thousand cubic metres/ Terajoules
Charcoal Mass Thousand metric tons
Electricity Energy GWh
Heat Energy Terajoules
Common unit (e.g., balances) Energy Terajoules
Electricity installed capacity Power MW
Refinery capacity Mass/time Thousand metric tons/year
4.67. It is recommended that countries report to international organizations both physi-cal quantities of fuels and their country-specific (and where necessary flow-specific) calorific values. In the case of waste that is well-defined by its constitution, rather than only by the process from which it was generated, it can be assumed that there would not be great varia-tion in specific calorific values. Therefore, data can be reported on a weight basis (thousand metric tons). Even so, the specific calorific values should be provided if they are available.
55
Chapter V
Energy flows
A. Introduction5.1. The objective of this chapter is to describe energy flows and the main groups of economic units that are relevant for the collection of data on such flows. In particular, this chapter provides a description of energy industries and energy consumers and presents a cross-classification of energy consumers and energy uses. The concepts and definitions introduced in this chapter complement the concepts, definitions and classifications introduced in chap-ters III and IV and provide a foundation for the identification of data items, the formulation of data collection and data compilation strategies and the compilation of energy balances that are described in chapters VI, VII and VIII.
B. Concept of energy flows5.2. In the context of basic energy statistics and energy balances, the term “energy flow” refers to the production, import, export, bunkering, stock changes, transformation, energy use by energy industries, losses during the transformation, and final consumption of energy products within the territory of reference for which these statistics are compiled.38 This terri-tory generally corresponds to the national territory; however, it can also refer to an adminis-trative region at the sub-national level or even to a group of countries. The term “rest of the world” is used here to denote all areas/territories outside the reference territory.
5.3. The first appearance of an energy product in the territory of reference is either through its production or import. Whereas some energy products may be used directly in the form they were captured from the environment, many energy products undergo some sort of transformation before final consumption. This is the case, for example, with the processing of crude oil in petroleum refineries, where the oil is transformed into a range of products that are useful for specific purposes (e.g., gasoline for transportation).
5.4. Once produced and/or transformed, energy products can be: (a) exported to other territories; (b) stored for later use (entering into stock); (c) used for refuelling of ships and airplanes engaged in international voyages (international bunkering); (d) used by the energy industries themselves; and/or (e) delivered for final consumption.
5.5. The final consumption of energy products consists of (a) final energy consumption, i.e. deliveries of energy products to the users located in the territory of reference for their energy needs, such as for heat raising, transportation and electricity, and (b) non-energy use, i.e. deliveries of energy products for use as chemical feedstocks or as raw materials (see para. 5.21 for details).
5.6. For energy policy and analytical purposes, the final energy consumption is further disaggregated according to type of economic activity, while the use of energy products for the purpose of transport is identified independently from the economic sector in which they were consumed.
38 It is acknowledged that there are additional energy flows that are relevant for the compilation of energy accounts such as, for example, the use of energy prod-ucts abroad by resident units and the use of energy products inland by non-resident units.
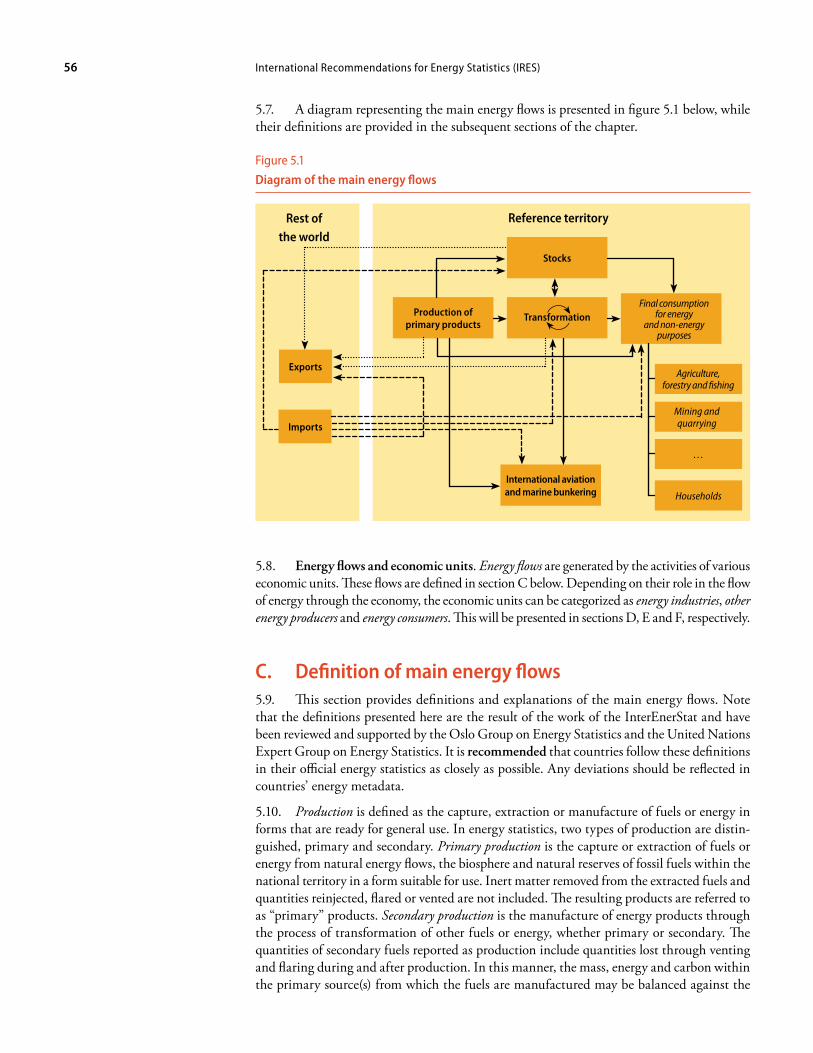
International Recommendations for Energy Statistics (IRES)56
5.7. A diagram representing the main energy flows is presented in figure 5.1 below, while their definitions are provided in the subsequent sections of the chapter.
Figure 5.1
Diagram of the main energy flows
5.8. Energy flows and economic units. Energy flows are generated by the activities of various economic units. These flows are defined in section C below. Depending on their role in the flow of energy through the economy, the economic units can be categorized as energy industries, other energy producers and energy consumers. This will be presented in sections D, E and F, respectively.
C. Definition of main energy flows5.9. This section provides definitions and explanations of the main energy flows. Note that the definitions presented here are the result of the work of the InterEnerStat and have been reviewed and supported by the Oslo Group on Energy Statistics and the United Nations Expert Group on Energy Statistics. It is recommended that countries follow these definitions in their official energy statistics as closely as possible. Any deviations should be reflected in countries’ energy metadata.
5.10. Production is defined as the capture, extraction or manufacture of fuels or energy in forms that are ready for general use. In energy statistics, two types of production are distin-guished, primary and secondary. Primary production is the capture or extraction of fuels or energy from natural energy flows, the biosphere and natural reserves of fossil fuels within the national territory in a form suitable for use. Inert matter removed from the extracted fuels and quantities reinjected, flared or vented are not included. The resulting products are referred to as “primary” products. Secondary production is the manufacture of energy products through the process of transformation of other fuels or energy, whether primary or secondary. The quantities of secondary fuels reported as production include quantities lost through venting and flaring during and after production. In this manner, the mass, energy and carbon within the primary source(s) from which the fuels are manufactured may be balanced against the
Rest of the world
Reference territory
Stocks
Agriculture, forestry and fishing
Mining and quarrying
…
Households
International aviation and marine bunkering
Final consumption for energy
and non-energy purposes
Production of primary products
Exports
Imports
Transformation
57Energy flows 57
secondary fuels produced. Fuels, electricity and heat produced are usually sold but may be partly or entirely consumed by the producer.
5.11. Imports of energy products comprise all fuel and other energy products entering the national territory. Goods simply being transported through a country (goods in transit) and goods temporarily admitted are excluded, while re-imports (i.e. domestic goods exported but subsequently readmitted) are included. The bunkering of fuel outside the reference territory by national merchant ships and civil aircraft engaged in international travel is also excluded from imports.39 Note that the country of origin of energy products should be recorded, where possible, as the country from which goods were imported, but not a transit country.
5.12. Exports of energy products comprise all fuel and other energy products leaving the national territory. Goods simply being transported through a country (goods in transit) and goods temporarily withdrawn are excluded, while re-exports (i.e. foreign goods exported in the same state as previously imported) are included. Also excluded are quantities of fuels deliv-ered for use by merchant ships (including passenger ships) and civil aircraft of all nationalities during international transport of goods and passengers.40 Note that the country of destination of energy products (i.e. the country of the last known destination as it is known at the time of exportation) should be recorded as a country to which these products are exported to, but not a transit country.
5.13. It should be noted that the definitions of imports and exports used in energy statis-tics are those adopted by international merchandise trade statistics for a system of record-ing known as the general trade system, that is, all energy products entering and leaving the national territory of a country and which add to or are subtracted from the stock of material resources of a country are recorded as energy imports and exports,41 except for the bunkering of international fleet, which is excluded from trade figures.42 It should also be noted that, in energy balances, imports and exports exclude nuclear fuels as these are not within the scope of energy balances (see also chapter VIII).
5.14. International marine bunkers are quantities of fuels delivered to merchant ships (includ-ing passenger ships) of any nationality for consumption during international voyages trans-porting goods or passengers. International voyages take place when the ports of departure and arrival are in different national territories. Fuels delivered for consumption by ships during domestic transportation, fishing or military uses are not included here, but are considered part of final consumption of energy (see para. 5.94 for domestic navigation). For the purposes of energy statistics, international marine bunkers are not included in exports; they are recorded separately due to their importance, e.g. for the estimation of greenhouse gas emissions.
5.15. International aviation bunkers are quantities of fuels delivered to civil aircraft of any nationality for consumption during international flights transporting goods or passengers. International flights take place when the ports of departure and arrival are in different national territories. Fuels delivered for consumption by aircraft undertaking domestic or military flights are not included here, but are considered part of final consumption of energy (see para. 5.91 for domestic aviation). For the purposes of energy statistics, international avia-tion bunkers are not included in exports; they are recorded separately due to their importance, e.g. for the estimation of greenhouse gas emissions.
5.16. Stock changes. For the purposes of energy statistics, stocks are quantities of energy products that are held on the national territory and can be used to: (a) maintain service under conditions where supply and demand are variable in their timing or amount due to normal market fluctuations, or (b) supplement supply in the case of a supply disruption.43
Stocks used to manage a supply disruption may be called ”strategic” or “emergency” stocks and are often held separately from stocks designed to meet normal market fluctuations, but both are considered here. Stock changes are defined as the increase (stock build) or decrease
39 Such fuels should be classified as “international marine bunkers” or “international aviation bun-kers”, respectively, in the country where such bunkering is carried out (see paras. 5.14, 5.15).
40 These quantities are recorded as “international marine bunkers” and “aviation bunkers”, respec-tively.
41 See International Merchandise Trade Statistics: Concepts and Definitions 2010, United Nations (2010).
42 These definitions differ from those used in the national accounts where exports and imports are defined as transactions between residents and non-residents. Therefore, compilers of energy accounts should make necessary adjustments to basic energy statistics before using them.
43 The notion of stocks dealt with in this chapter corresponds to what in economic statistics and national accounts is referred to as inventories.
International Recommendations for Energy Statistics (IRES)58
(stock draw) in the quantity of stocks over the reporting period and thus are calculated as a difference between the closing and opening stocks.
5.17. Transfers are essentially statistical devices to overcome practical classification and presentation issues resulting from changes in use or identity of a product. Transfers comprise products transferred and interproduct transfers. Products transferred refers to the reclassifica-tion (renaming) of products, which, for example, is necessary when finished oil products are used as feedstock in refineries. Interproduct transfers refer to the movements of fuels between product categories because of reclassification of a product that no longer meets its original specification. For example, aviation turbine fuel that has deteriorated or has been spoiled may be reclassified as heating kerosene.
5.18. Transformation is the process where part or all of the energy content of a product enter-ing a process moves from this product to one or more different products leaving the process (e.g., from coking coal to coke, from crude oil to oil products, or from fuel oil to electricity) (see section D.2 for further discussion).
5.19. Losses refer to losses during the transmission, distribution and transport of fuels, heat and electricity. Losses also include venting and flaring of manufactured gases, losses of geo-thermal heat after production and pilferage of fuels or electricity. However, production of secondary gases includes quantities subsequently vented or flared. This ensures that a balance can be constructed between the use of the primary fuels from which the gases are derived and the production of the gases.
5.20. Energy industries own use refers to the consumption of fuels and energy for the direct support of the production and preparation for use of fuels and energy, except heat not sold. As such, it covers not only own use by energy industries as defined in para. 5.23, but also by other energy producers as defined in para. 5.75. Quantities of fuels transformed into other fuels or energy are not included here, but within transformation; neither are quantities used within parts of the energy industry not directly involved in the activities listed in the defini-tion. These quantities are reported within final consumption.
5.21. Non-energy use consists of the use of energy products as raw materials for the manufac-ture of products outside the scope of SIEC, as well as for direct uses that do not involve using the products as a source of energy, nor as a transformation input. Examples are lubrication, sealing, preservation, road surfacing and use as a solvent.44
5.22. Final consumption refers to all fuel and energy delivered to users for both their energy and non-energy uses, and which do not involve a transformation process as defined in para. 5.18.
D. Energy industries5.23. Definition of energy industries. Energy production is an energy flow of major impor-tance. Data on energy production are required for various policy and analytical purposes; therefore, the provision of further details on energy production is one of the priorities of energy statistics. Energy can be produced by various economic units. However, not all of them should be treated as belonging to energy industries. In order to ensure international comparability, it is recommended that energy industries be defined as consisting of economic units whose principal activity45 is primary energy production, transformation of energy or distribution46 of energy. For practical reasons, a few additions are made, as described in para. 5.26.
5.24. Statistics on energy industries. To have a better understanding of the efforts of a country to extract, produce, transform and distribute energy products, it is recommended that the collection, compilation and dissemination of statistics describing the main charac-teristics and activities of energy industries be considered as part of official energy statistics.
44 Some studies of the non-energy use of fuels also classify the use of reductants as non-energy use; however, in energy statistics the use of reductants (mostly for the manufacture of iron and steel) is considered as use for energy purposes, because the gases created by the reduction process, which contain most of the carbon from the reductant, are used as fuels to sustain the process or for other heat raising purposes. Reductants are carbon from fuels (usually cokes) that are heated with metal oxides. Dur-ing the process, the formation of carbon monoxide removes the oxygen from the metal oxides and produces the pure metal.
45 For a more detailed definition of principal activity see box 5.1.
46 Note that distribution here refers to distribution systems (consist-ing, for example, of lines, meters, wiring and pipes) that convey energy products received from the generation facility or the transmission system to the final consumer, and not the “trans-mission systems” that convey the energy products from the generation facility to the distri-bution system. Distribution here also excludes the wholesale of energy products (for example, bottled gases).

59Energy flows 59
5.25. Energy industries are engaged in primary production, transformation and distribution of energy products. These activities are very diverse and their detailed technical descriptions quite complex. However, for the purposes of energy statistics, activities of economic units belonging to energy industries can be conveniently identified by the establishments (plants) in which they occur. For example, the typical representatives of primary production are coal mines and oil and gas extraction plants.
5.26. Activities of energy industries. In order to improve cross-country comparability of statistics on energy production by energy industries it is recommended that countries identify, as far as feasible and applicable, the energy industries listed in the left column of table 5.1. It is important to note that it considers a broader definition of energy industries than the core mentioned in para. 5.23, covering some plants, such as blast furnaces, for which the main activity is not energy-related. Table 5.1 also provides information on the ISIC Rev. 4 categories (division/group/class) where the different energy industries can be found.
Table 5.1Energy industries with reference to the relevant ISIC category
Energy industry ISIC Rev. 4
Electricity, CHP and heat plantsa Division: 35—Electricity, gas, steam and air conditioning supply
Pumped storage plants
Coal mines Division: 05—Mining of coal and lignite
Coke ovens Group: 191—Manufacture of coke oven products
Coal liquefaction plants Group: 192—Manufacture of refined petroleum products
Patent fuel plants Group: 192—Manufacture of refined petroleum products
Brown coal briquette plants Group: 192—Manufacture of refined petroleum products
Gas worksb (and other conversion to gases)
Group: 352—Manufacture of gas; distribution of gaseous fuels through mains
Gas separation plants Division: 06—Extraction of crude petroleum and natural gas
Gas-to-liquids (GTL) plants Group: 192—Manufacture of refined petroleum products
LNG plants/regasification plants Group: 091—Support activities for petroleum and natural gas extractionClass: 5221—Service activities incidental to land transportation
Blast furnaces Group: 241—Manufacture of basic iron and steel
Oil and gas extraction Division: 06—Extraction of crude petroleum and natural gasGroup: 091—Support activities for petroleum and natural gas extraction
Oil refineries Group: 192—Manufacture of refined petroleum products
Charcoal plantsc Class: 2011—Manufacture of basic chemicals
Biogas production plantsd Group: 352—Manufacture of gas; distribution of gaseous fuels through mains
Nuclear fuel extraction and fuel processing
Class: 0721—Mining of uranium and thorium ores Class: 2011—Manufacture of basic chemicals
Other energy industry not elsewhere specifiede
Class: 0892—Extraction of peat….
a Also including the distribution of electricity and heat to consumers.
b Also including the distribution of these gases.
c The provided ISIC link refers to the production of charcoal through distillation of wood. If charcoal is produced in the forest using traditional methods, the activity would be classified in ISIC 0220 (“Logging”).
d Plants having the production of biogases as their main activity would be classified in ISIC class 3520, as indicated in the table above. However, biogases may also be produced as by-products of other activities, such as those classified in ISIC 3700 (“Sewer-age”) and 3821 (“Treatment and disposal of non-hazardous waste”).
e The given ISIC link provides an example, namely the extraction of peat, but is not exhaustive.
Box 5.1Principal, secondary and ancillary activities
The principal activity of a producer unit is the activity whose value added exceeds that of any other activity carried out within the same unit (SNA 2008, para. 5.8).
A secondary activity is an activity carried out within a single producer unit in addition to the principal activity and whose output, like that of the principal activity, must be suitable for delivery outside the producer unit. The value added of a secondary activity must be less than that of the principal activity, by definition of the latter (SNA 2008, para. 5.9).
An ancillary activity is incidental to the main activity of an enterprise. It facilitates the efficient running of the enterprise but does not normally result in goods and services that can be marketed (SNA 2008, para. 5.10).
International Recommendations for Energy Statistics (IRES)60
5.27. A brief description of the energy industries of table 5.1 is presented below.
5.28. Electricity, combined heat and power (CHP) and heat plants: see section 1 below for a detailed presentation of these activities.
5.29. Coal mines are plants extracting coal through underground or open-cast mining. In addition to the extraction activity itself, the operation of coal mines also includes operations such as grading, cleaning, compressing, etc., leading to a marketable product.
5.30. Coke ovens are large ovens within which coke oven coke, coke oven gas and coal tars are produced by high temperature carbonization of coking coal.
5.31. Coal liquefaction plants are plants where coal is used as a feedstock to produce liquid fuels by hydrogenation or carbonization. They are also known as coal to liquid (CTL) plants.
5.32. Patent fuel plants are plants manufacturing patent fuel.
5.33. Brown coal briquette plants are plants manufacturing brown coal briquettes (BKB).
5.34. Gas works (and other conversion to gases) are plants manufacturing gases for distribu-tion to the public either directly or after blending with natural gas. Note that the gases are collectively referred to as “gas works gas and other manufactured gases for distribution”; short name—gas works gas. Some gas works may produce coke, as well as gas.
5.35. Gas separation plants are plants involved in the separation of associated gas from crude oil, and/or the separation of condensate, water, impurities and natural gas liquids from natural gas. In addition to the above, the activities of these plants may also involve fractionation of the recovered natural gas liquids.
5.36. Gas-to-liquids (GTL) plants are plants in which natural gas is used as a feedstock for the production of liquid fuels. The liquid fuels are usually used as vehicle fuels. Note that the GTL plants are quite different from liquefied natural gas (LNG) plants, which convert gaseous natural gas into liquid natural gas.
5.37. LNG plants/regasification plants are plants for carrying out liquefaction and/or regasi-fication of natural gas for the purpose of transport. This activity can be carried out on or off the actual point of production.
5.38. Blast furnaces are furnaces that produce blast furnace gas as a by-product when mak-ing pig iron from iron ore. During the process, carbon, mainly in the form of coke, is added to the blast furnace to support and reduce the iron oxide charge and provide heat. Blast furnace gas comprises carbon monoxide and other gases formed during the heating and reduction process.
5.39. Oil and gas extraction are activities of extracting crude oil, mining and extracting oil from oil shale and oil sands, extracting natural gas and recovery of natural gas liquids. This includes overall activities of operating and/or developing oil and gas field properties, including such activities as drilling, completing and equipping wells, operating separators, emulsion breakers, desilting equipment and field gathering lines for crude petroleum and all other activities in the preparation of oil and gas up to the point of shipment from the producing site.
5.40. Oil refineries are plants that transform crude oil and other hydrocarbons (together with additives, feedstocks and natural gas liquids) into finished oil products. Typical finished products are liquefied petroleum gases, naphtha, motor gasoline, gas oils, aviation fuels and other kerosene, and fuel oils.
5.41. Charcoal plants are plants in which wood, or other vegetal matter is carbonized through slow pyrolysis to produce charcoal.
61Energy flows 61
5.42. Biogas production plants are plants for capturing and/or manufacturing biogases. Biogases arise from the anaerobic fermentation of biomass. They can be derived from several sources, including landfills, sewage sludge and agricultural residues. They also include syn-thesis gas produced from biomass.
5.43. Nuclear fuel extraction and fuel processing plants are plants involved in the mining of ores chiefly valued for their uranium and thorium content, the concentration of such ores, the production of yellowcake, the enrichment of uranium and thorium ores, and/or the produc-tion of fuel elements for nuclear reactors.
5.44. Other energy industry not elsewhere specified. This is a residual category that refers to any energy industry not covered elsewhere in the list above. One example is the extraction of peat for energy purposes.
1. Electricity and heat
5.45. Statistics on electricity and heat (SIEC section 7 (Electricity) and section 8 (Heat)) are collected according to the type of producer and type of generating plant. Two types of producers are distinguished:47
• Main activity producers. These are units that produce electricity or heat as their principal activity. Formerly known as public utilities, these enterprises may be privately or publicly owned companies.
• Autoproducers (electricity). These are units that produce electricity, but for which the production is not their principal activity.
• Autoproducers (heat). These are units that produce heat for sale, but for which the production is not their principal activity. Deliveries of fuels for heat generated by a unit for its own purposes are classified as final consumption, and not as transformation inputs.
5.46. It should be noted that any own use by the autoproducer in support of the production of electricity and/or production of heat for sale should be reported under energy industries own use in the same way that the inputs to and the output of electricity and heat sold figure under transformation processes. Energy consumed in support of the principal economic activity should be reported under final consumption (or again in energy industries own use if the autoproducer happens to be an energy industry such as an oil refinery).
5.47. Three types of generating plants are also distinguished:
• Electricity plants refer to plants producing only electricity. The electricity may be obtained directly from natural sources such as hydro, geothermal, wind, tidal, marine, solar energy or from fuel cells, or from the heat obtained from the com-bustion of fuels or nuclear reactions.
• CHP plants refer to plants that produce both heat and electricity from at least one generating unit in the plant. They are sometimes referred to as “co-generation” plants.
• Heat plants refer to plants (including heat pumps and electric boilers) designed to produce heat only for deliveries to third parties. Deliveries of fuels for heat gener-ated by an autoproducer for its own purposes are classified as final consumption.
5.48. The different data reporting requirements for the production and use of fuels are sum-marised schematically in table 5.2.
47 The definitions refer to “units”, which in practice will often be chosen as establishments but could also refer to enterprises or households, depending on cir-cumstances and data availability.

International Recommendations for Energy Statistics (IRES)62
Table 5.2Main activity producers and autoproducers of electricity and heat
Type of plant
Type of producer Electricity plant CHP plant Heat plant
Main activity producers Report all production
and all fuel used
Report all electricity and heat produced and all fuel used
Report all heat produced and all fuel used
Autoproducer Report all electricity produced and heat sold with corresponding fuel used
Report heat sold and corresponding fuel used
5.49. Note that pumped storage plants are plants where electricity is used during periods of lower demand to pump water into reservoirs for subsequent release and electricity generation during periods of higher demand. Less electricity is eventually produced than is consumed to pump the water into the higher reservoir.
5.50. The different types of technology/processes for the generation of electricity and heat are defined as follows.
5.51. Solar photovoltaics (PV ) electricity refers to electricity produced from solar photo-voltaics, i.e. by the direct conversion of solar radiation through photovoltaic processes in semiconductor devices (solar cells), including concentrating photovoltaic systems.
5.52. Solar thermal electricity refers to electricity produced from solar heat (both concentrat-ing and non-concentrating, see para. 5.62).
5.53. Wind electricity refers to electricity produced from devices driven by wind.
5.54. Hydroelectricity refers to electricity produced from devices driven by fresh, flowing or falling water.
5.55. Wave electricity refers to electricity produced from devices driven by the motion of waves.
5.56. Tidal electricity refers to electricity generated from devices driven by tidal currents or the differences of water level caused by tides.
5.57. Other marine electricity refers to electricity generated from devices that exploit sources of marine energy not elsewhere specified. Examples of such sources are non-tidal currents, temperature differences and salinity gradients in seas or salinity differences between sea and fresh water.
5.58. Geothermal electricity refers to the electricity generated from the heat from geothermal sources.
5.59. Nuclear electricity refers to electricity generated by nuclear heat.
5.60. Electricity from chemical processes refers to electricity generated from heat recovered from a non-combusting chemical reaction.
5.61. Electricity from other sources refers to electricity produced from sources not elsewhere specified (including fuel cells).
5.62. Solar heat refers to the generation of heat from solar thermal (concentrating and non-concentrating). Heat from concentrating solar thermal refers to high temperature heat produced from solar radiation captured by concentrating solar thermal systems. The high- temperature heat can be transformed to generate electricity, drive chemical reactions, or be used directly in industrial processes. Heat from non-concentrating solar thermal refers to low- temperature heat produced from solar radiation captured by non-concentrating solar thermal systems. The heat can be used for applications, such as space heating, cooling, water heating, district heating and industrial processes.
Source: IEA Electricity Questionnaire reporting instruction.
63Energy flows 63
5.63. Geothermal heat refers to heat extracted from the earth. The sources of the heat are radioactive decay in the crust and mantle and heat from the core of the earth. Heat from shallow geothermal sources includes heat gained by the earth through direct sunlight and rain. The heat is usually extracted from the earth in the form of heated water or steam.
5.64. Nuclear heat refers, for the purposes of energy statistics, to the heat obtained from a working fluid (possibly steam) in the nuclear reactor. A working fluid is the substance circu-lated in a closed system to convey heat from the source of heat to its point(s) of use.
5.65. Heat and/or electricity from combustible fuels refers to the production of heat and/or electricity from the combustion of fuels that are capable of igniting or burning, i.e. reacting with oxygen to produce a significant rise in temperature.
5.66. Heat from chemical processes refers to recovered heat generated in the chemical industry by exothermic reactions other than combustion, and used for steam-raising or other energy purposes.
5.67. Heat from other sources refers to heat from sources not elsewhere specified.
2. Transformation processes
5.68. Transformation processes play a vital role in the flow of energy throughout an economy, as they ensure that primary energy products that cannot be directly or effectively utilized are changed into other energy products more suitable for consumption. It is important to identify such processes in order to describe and analyse energy transformation more precisely and assess the resources necessary for carrying it out. In energy balances, energy transformation processes are reflected in the rows of the transformation block (see chapter VIII for more detail).
5.69. From the point of view of energy statistics, a transformation process is the movement of part or all of the energy content of a product entering the process to one or more different products leaving the process. There are two groups of transformation processes:
(a) The physical or chemical conversion of a product into another product or products whose intrinsic properties differ from those of the original product. Examples are: • chemical or physical changes to the input product(s) resulting in the creation
of products containing new chemical compounds (e.g., refining); • physical changes to the input product(s) resulting in a separation into several
different products with intrinsic physical properties that are different from those of the input material (e.g., coke oven carbonization of coal);
• conversion of heat into electricity; and• production of heat from combustion or electricity.
(b) The aggregation or blending of products, sometimes involving a change of physi-cal shape. Examples are: • blending of gases to meet safety and quality requirements before distribution
to consumers; and• briquetting of peat and brown coal.
5.70. These transformation processes are currently identified by the plants in which they occur, namely:
• Electricity plants• CHP plants• Heat plants
International Recommendations for Energy Statistics (IRES)64
• Coke ovens
• Coal liquefaction plants
• Patent fuel plants
• Brown coal briquette plants
• Gas works (and other conversion to gases)
• GTL plants
• Blast furnaces
• Oil refineries
• Charcoal plants
• Peat briquette plants
• Natural gas blending plants
• Petrochemical plants
• Other transformation processes not elsewhere classified
5.71. Most of these plants have already been described in the context of table 5.1. Descrip-tions of the remaining plants, which would appear under “Other energy industry not else-where specified” in table 5.1, are given below:
5.72. Peat briquette plants are plants manufacturing peat briquettes.
5.73. Natural gas blending plants are plants, separate from gas works, in which substitute natural gas (see gas works gas), petroleum gases or biogases are mixed with natural gas for distribution in the gas mains. Where blending of substitute natural gas with natural gas takes place within gas works, the blending is considered part of the gas works process.
5.74. Petrochemical plants are plants that convert hydrocarbon feedstock into organic chem-icals, intermediate compounds and finished products, such as plastics, fibres, solvents and surfactants. Feedstock used by the plant is usually obtained from a refinery and includes naphtha, ethane, propane and middle distillate oils (for example, gas oil). The carbon and hydrogen in the feedstock are largely transferred to the basic chemicals and products sub-sequently made from them. However, certain byproducts are also created and returned to the refinery (such as pyrolysis gasoline), or burned for fuel to provide the heat and electricity required for cracking and other processes in the petrochemical plant. Note that since energy transformation is not the principal activity of petrochemical plants, they do not belong to energy industries and, as a group, are treated as energy consumers (see table 5.3). However, the energy transformation performed by these plants is reflected in the middle block of the energy balances (see chapter VIII).
E. other energy producers5.75. Other energy producers are economic units (including households) that choose, or are forced by circumstance, to produce energy for their own consumption and/or to supply energy to other units, but for which energy production is not their principal activity. These units are engaged in the production, transformation and transmission/distribution of energy as a secondary and/or ancillary activity. This means that the “energy” output generated by these activities and measured in terms of value added does not exceed that of the principal activity of the unit. In the case of ancillary activities, the activities are carried out to support the principal and secondary activity of the unit.
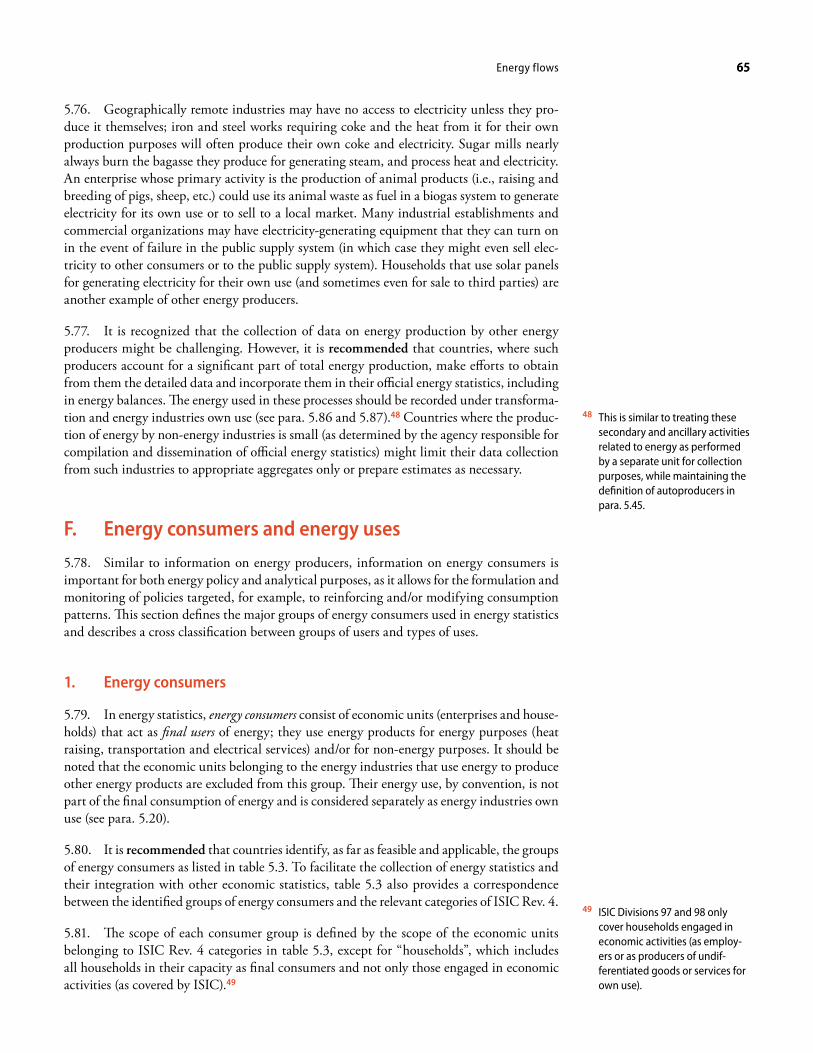
65Energy flows 65
5.76. Geographically remote industries may have no access to electricity unless they pro-duce it themselves; iron and steel works requiring coke and the heat from it for their own production purposes will often produce their own coke and electricity. Sugar mills nearly always burn the bagasse they produce for generating steam, and process heat and electricity. An enterprise whose primary activity is the production of animal products (i.e., raising and breeding of pigs, sheep, etc.) could use its animal waste as fuel in a biogas system to generate electricity for its own use or to sell to a local market. Many industrial establishments and commercial organizations may have electricity-generating equipment that they can turn on in the event of failure in the public supply system (in which case they might even sell elec-tricity to other consumers or to the public supply system). Households that use solar panels for generating electricity for their own use (and sometimes even for sale to third parties) are another example of other energy producers.
5.77. It is recognized that the collection of data on energy production by other energy producers might be challenging. However, it is recommended that countries, where such producers account for a significant part of total energy production, make efforts to obtain from them the detailed data and incorporate them in their official energy statistics, including in energy balances. The energy used in these processes should be recorded under transforma-tion and energy industries own use (see para. 5.86 and 5.87).48 Countries where the produc-tion of energy by non-energy industries is small (as determined by the agency responsible for compilation and dissemination of official energy statistics) might limit their data collection from such industries to appropriate aggregates only or prepare estimates as necessary.
F. Energy consumers and energy uses
5.78. Similar to information on energy producers, information on energy consumers is important for both energy policy and analytical purposes, as it allows for the formulation and monitoring of policies targeted, for example, to reinforcing and/or modifying consumption patterns. This section defines the major groups of energy consumers used in energy statistics and describes a cross classification between groups of users and types of uses.
1. Energy consumers
5.79. In energy statistics, energy consumers consist of economic units (enterprises and house-holds) that act as final users of energy; they use energy products for energy purposes (heat raising, transportation and electrical services) and/or for non-energy purposes. It should be noted that the economic units belonging to the energy industries that use energy to produce other energy products are excluded from this group. Their energy use, by convention, is not part of the final consumption of energy and is considered separately as energy industries own use (see para. 5.20).
5.80. It is recommended that countries identify, as far as feasible and applicable, the groups of energy consumers as listed in table 5.3. To facilitate the collection of energy statistics and their integration with other economic statistics, table 5.3 also provides a correspondence between the identified groups of energy consumers and the relevant categories of ISIC Rev. 4.
5.81. The scope of each consumer group is defined by the scope of the economic units belonging to ISIC Rev. 4 categories in table 5.3, except for “households”, which includes all households in their capacity as final consumers and not only those engaged in economic activities (as covered by ISIC).49
48 This is similar to treating these secondary and ancillary activities related to energy as performed by a separate unit for collection purposes, while maintaining the definition of autoproducers in para. 5.45.
49 ISIC Divisions 97 and 98 only cover households engaged in economic activities (as employ-ers or as producers of undif-ferentiated goods or services for own use).
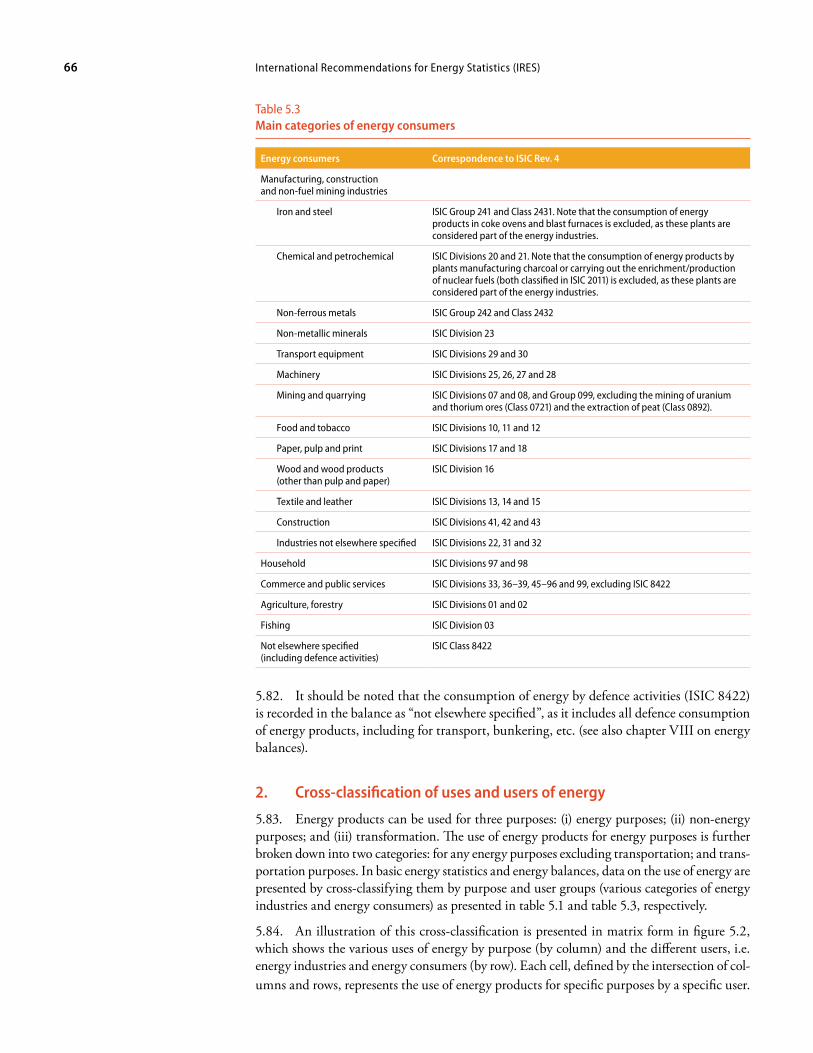
International Recommendations for Energy Statistics (IRES)66
Table 5.3Main categories of energy consumers
Energy consumers Correspondence to ISIC Rev. 4
Manufacturing, construction and non-fuel mining industries
Iron and steel ISIC Group 241 and Class 2431. Note that the consumption of energy products in coke ovens and blast furnaces is excluded, as these plants are considered part of the energy industries.
Chemical and petrochemical ISIC Divisions 20 and 21. Note that the consumption of energy products by plants manufacturing charcoal or carrying out the enrichment/production of nuclear fuels (both classified in ISIC 2011) is excluded, as these plants are considered part of the energy industries.
Non-ferrous metals ISIC Group 242 and Class 2432
Non-metallic minerals ISIC Division 23
Transport equipment ISIC Divisions 29 and 30
Machinery ISIC Divisions 25, 26, 27 and 28
Mining and quarrying ISIC Divisions 07 and 08, and Group 099, excluding the mining of uranium and thorium ores (Class 0721) and the extraction of peat (Class 0892).
Food and tobacco ISIC Divisions 10, 11 and 12
Paper, pulp and print ISIC Divisions 17 and 18
Wood and wood products (other than pulp and paper)
ISIC Division 16
Textile and leather ISIC Divisions 13, 14 and 15
Construction ISIC Divisions 41, 42 and 43
Industries not elsewhere specified ISIC Divisions 22, 31 and 32
Household ISIC Divisions 97 and 98
Commerce and public services ISIC Divisions 33, 36–39, 45–96 and 99, excluding ISIC 8422
Agriculture, forestry ISIC Divisions 01 and 02
Fishing ISIC Division 03
Not elsewhere specified (including defence activities)
ISIC Class 8422
5.82. It should be noted that the consumption of energy by defence activities (ISIC 8422) is recorded in the balance as “not elsewhere specified”, as it includes all defence consumption of energy products, including for transport, bunkering, etc. (see also chapter VIII on energy balances).
2. Cross-classification of uses and users of energy
5.83. Energy products can be used for three purposes: (i) energy purposes; (ii) non-energy purposes; and (iii) transformation. The use of energy products for energy purposes is further broken down into two categories: for any energy purposes excluding transportation; and trans-portation purposes. In basic energy statistics and energy balances, data on the use of energy are presented by cross-classifying them by purpose and user groups (various categories of energy industries and energy consumers) as presented in table 5.1 and table 5.3, respectively.
5.84. An illustration of this cross-classification is presented in matrix form in figure 5.2, which shows the various uses of energy by purpose (by column) and the different users, i.e. energy industries and energy consumers (by row). Each cell, defined by the intersection of col-umns and rows, represents the use of energy products for specific purposes by a specific user.
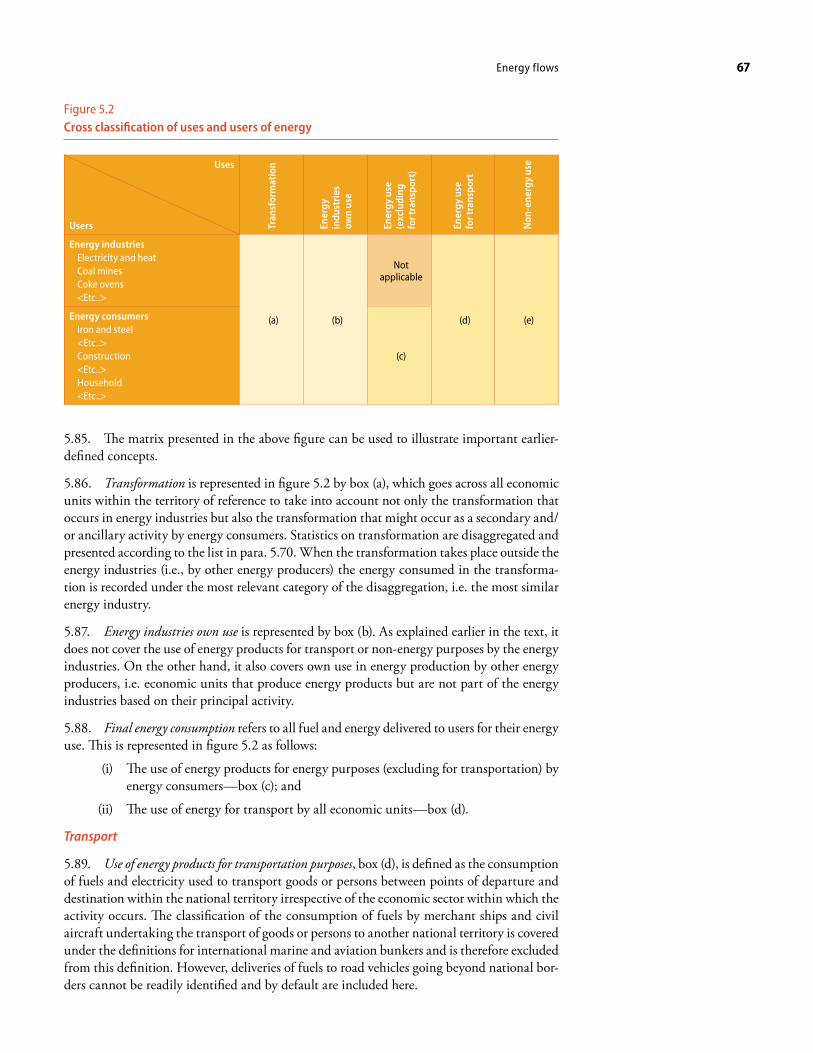
67Energy flows 67
Figure 5.2Cross classification of uses and users of energy
Uses
Tran
sfor
mat
ion
Ener
gy
indu
stri
es
own
use
Ener
gy u
se
(exc
ludi
ng
for t
rans
port
)
Ener
gy u
se
for t
rans
port
Non
-ene
rgy
use
Users
Energy industriesElectricity and heatCoal minesCoke ovens<Etc..>
(a) (b)
Not applicable
(d) (e)Energy consumersIron and steel<Etc..>Construction<Etc..>Household<Etc..>
(c)
5.85. The matrix presented in the above figure can be used to illustrate important earlier-defined concepts.
5.86. Transformation is represented in figure 5.2 by box (a), which goes across all economic units within the territory of reference to take into account not only the transformation that occurs in energy industries but also the transformation that might occur as a secondary and/or ancillary activity by energy consumers. Statistics on transformation are disaggregated and presented according to the list in para. 5.70. When the transformation takes place outside the energy industries (i.e., by other energy producers) the energy consumed in the transforma-tion is recorded under the most relevant category of the disaggregation, i.e. the most similar energy industry.
5.87. Energy industries own use is represented by box (b). As explained earlier in the text, it does not cover the use of energy products for transport or non-energy purposes by the energy industries. On the other hand, it also covers own use in energy production by other energy producers, i.e. economic units that produce energy products but are not part of the energy industries based on their principal activity.
5.88. Final energy consumption refers to all fuel and energy delivered to users for their energy use. This is represented in figure 5.2 as follows:
(i) The use of energy products for energy purposes (excluding for transportation) by energy consumers—box (c); and
(ii) The use of energy for transport by all economic units—box (d).
Transport
5.89. Use of energy products for transportation purposes, box (d), is defined as the consumption of fuels and electricity used to transport goods or persons between points of departure and destination within the national territory irrespective of the economic sector within which the activity occurs. The classification of the consumption of fuels by merchant ships and civil aircraft undertaking the transport of goods or persons to another national territory is covered under the definitions for international marine and aviation bunkers and is therefore excluded from this definition. However, deliveries of fuels to road vehicles going beyond national bor-ders cannot be readily identified and by default are included here.

International Recommendations for Energy Statistics (IRES)68
5.90. Transport can be disaggregated by mode of transport as indicated in table 5.4 below:
Table 5.4
Mode of transport
Transport
Road
Rail
Domestic aviation
Domestic navigation
Pipeline transport
Transport not elsewhere specified
5.91. Domestic aviation refers to quantities of aviation fuels delivered to all civil aircraft undertaking a domestic flight transporting passengers or goods, or for purposes such as crop-spraying and the bench-testing of aero engines. A domestic flight takes place when the departure and landing airports are on national territory. In cases where distant islands form part of the national territory, requiring long flights through the air space of other countries, those flights are, nevertheless, considered part of domestic aviation. Military use of aviation fuels should not be included in domestic aviation but under the energy balance item “not else-where specified”. The use of fuel by airport authorities for ground transport within airports is also excluded here, but included under “commerce and public services”.
5.92. Road refers to fuels and electricity delivered to vehicles using public roads. Fuels deliv-ered for “off-road” use and stationary engines should be excluded. Off-road use comprises vehicles and mobile equipment used primarily on commercial industrial sites or private land, or in agriculture or forestry. The deliveries of fuels related to these uses are included under the appropriate final consumption heading. Deliveries for military uses are also excluded here but included under “not elsewhere specified”. The fuel use for freight transport by road and by trolley buses is included here.
5.93. Rail refers to fuels and electricity delivered for use in rail vehicles, including industrial railways. This includes urban rail transport (including trams).
5.94. Domestic navigation refers to fuels delivered to vessels transporting goods or people and undertaking a domestic voyage. A domestic voyage is between ports of departure and destination in the same national territory without intermediate ports of call in foreign ports. Note that this may include journeys of considerable length between two ports in a country (e.g., San Francisco to Honolulu). Fuels delivered to fishing vessels are excluded here but included under “fishing”.
5.95. Pipeline transport refers to fuels and electricity used in the support and operation of pipelines transporting gases, liquids, slurries and other commodities between points within the national territory. It comprises the consumption at pumping stations and for the main-tenance of the pipeline. Consumption for maintaining the flow in pipelines carrying natural gas, manufactured gas, hot water and steam in distribution networks is excluded here, but included under the appropriate heading within “energy industries own use”. Consumption for the transport of natural gas in transmission networks is included. Consumption of fuels or electricity for maintaining the flow in pipelines carrying water is included in “commerce and public services”. A transmission pipeline transports its contents to distribution pipelines for eventual delivery to consumers. Transmission pipelines for gas usually operate at pressures considerably higher than those used in distribution pipelines.

69Energy flows 69
5.96. Transport not elsewhere specified refers to deliveries of fuels or electricity used for trans-port activities not covered within the modes of transport defined elsewhere. Most of the forms of transport listed in ISIC Class 4922 (other land transport) are included in the modes of transport defined elsewhere. However, consumption of electricity for téléphériques (telfers), and ski and cable lifts would be included here.
5.97. Non-energy use of energy products is represented in figure 5.2 by box (e) and covers the use of energy products for non-energy purposes, irrespective of the economic activity where the use takes place (energy consumers or energy industries). This use is usually presented in an aggregated form and thus not linked to any specific economic activity (see also chapter VIII).

71
Chapter VI
Statistical units and data items
A. Introduction6.1. The aim of this chapter is to describe entities about which information is sought and for which energy statistics are ultimately compiled (i.e. statistical units), and to provide a ref-erence list of data items to be collected from those entities in order to assist countries in the organization of their data collection activities and ensure maximum possible comparability of the collected data with other economic statistics. The clear identification of the statistical units and their consistent use is a fundamental precondition for obtaining unduplicated and comparable data about any phenomenon under investigation, including energy.
6.2. It should be noted that the definitions of most of the data items are determined by the definitions of the relevant energy products (see chapter III) and flows (see chapter V), and are not reproduced in this chapter. However, if certain data items are not covered in chapters III and V, or need further elaboration, additional explanations are provided.
6.3. The list of data items presented in this chapter represents a reference list in the sense that it contains all generally desirable data items for the compilation and dissemination of energy statistics as part of official statistics. It is recommended that countries use the reference list of data items for selecting data items for use in their national energy statistics programmes, in accordance with their own circumstances, respondent load and available resources. It is further recommended that the data items be selected in a way to allow for an adequate assessment of the country’s energy situation, reflect main energy flows specific to the country and enable, as a minimum, the compilation of energy balances in an aggregated format. It is recognized that the compilation of energy statistics is a complex process and involves both direct data collection by energy statisticians, and the re-use of data collected via other national statistics, such as enterprise, foreign trade and price statistics, household statistics, and data from administrative sources. The agency responsible for the overall official energy statistics programme should be aware of the advantages and shortcomings of these other statistics and make efforts to assemble the various data into a coherent data set that best match the expectations of users.
B. Statistical units
1. Statistical units and their definitions
6.4. A statistical unit is an entity about which information is sought and for which statistics are ultimately compiled. It is also the unit at the basis of statistical aggregates and to which tabulated data refer. Because of the diversity of economic entities involved in the production, distribution and consumption of energy, energy data compilers should be aware of the dif-ferent types of statistical units in order to organize data collection, as well as to ensure that data are interpreted and used correctly in conjunction with other statistics. The universe of economic entities involved in the production, transformation and consumption of energy is
International Recommendations for Energy Statistics (IRES)72
vast. It varies from small local energy producers or distributors to large and complex corpora-tions engaged in many different activities carried out at or from many geographical locations. These entities vary in their legal, accounting, organizational and operating structures, and have different abilities to report data. The concepts of statistical units and their characteristics briefly introduced below are intended to assist energy statistics compilers to better organize their work.50
6.5. Statistical units can be divided into two categories: (a) Observation units—identifiable legal/organizational or physical units which are able, actually or potentially, to report data about their activities; and (b) Analytical units—units created by statisticians, often by splitting or combining observation units, in order to compile more detailed and homogeneous statistics than is possible by using data on observation units. Although analytical units are not able to report data themselves about their activities, indirect methods of statistical estimation and imputation of such data exist. The use of analytical units varies from country to country. It should be noted, however, that the accuracy of energy statistics may be increased through the use of analytical units in cases where complex economic entities are active in both energy production and other economic activities. In this connection, countries are encouraged to use analytical units as necessary and feasible in order to improve the quality of their energy statistics. Data about activities of statistical units can be collected from those units themselves (i.e., through census or surveys) or from others (i.e., administrative sources) (see chapter VII on data collection and compilation for details).
6.6. For practical purposes of collecting energy statistics, the following statistical units are differentiated and defined below: enterprise, establishment, kind-of-activity unit, unit of homogeneous production and household.
6.7. Enterprise. An economic entity in its capacity as a producer of goods and services is considered to be an enterprise if it is capable, in its own right, of owning assets, incurring liabilities and engaging in economic activities and transactions with other economic enti-ties. It is also an economic transactor with autonomy in respect of financial and investment decision-making, and with the authority and responsibility for allocating resources for the production of goods and services. It may be engaged in one or more productive activities at one or more locations.
6.8. Establishment. An establishment is defined as an enterprise or part of an enterprise that is situated in a single location, and in which only a single productive activity is carried out, or in which the principal productive activity accounts for most of the value added. 51
Although the definition of an establishment allows for one or more secondary activities to be carried out, their magnitude should be small compared with that of the principal activity. If a secondary activity is as important, or nearly as important, as the principal activity, then the unit is more like a local unit, that is, an enterprise (or part of an enterprise) which engages in productive activities at or from one location.
6.9. In the case of most small- and medium-sized businesses, the enterprise and the estab-lishment will be identical. In general, it is recommended that large enterprises engaged in many economic activities that belong to different industries be broken up into one or more establishments, provided that smaller and more homogeneous units can be identified for which data on energy production or other activities attributed to energy industries may be meaningfully compiled.
6.10. Kind-of-activity unit (KAU). Any given enterprise may perform many different activi-ties, both related and not related to energy. To focus on the part of the enterprise that is of interest to energy statistics, an analytical statistical unit, called the kind-of-activity unit (KAU), may be constructed and used by the energy data compiler. A KAU is defined as an
50 For a detailed description of statistical units and their char-acteristics, see the DESA/UNSD paper “Statistical Units” (ESA/STAT/2008/6), available from https://unstats.un.org/unsd /isdts/docs/StatisticalUnits.pdf.
51 In energy statistics, the term plant is often used as an equiva-lent of the term establishment.
73Statistical units and data items 73
enterprise or part of an enterprise that engages in only one kind of productive activity or in which the principal productive activity accounts for most of the value added. There is no restriction placed on the geographical area in which the activity is carried out. Therefore, if there is only one location from which an enterprise carries out that activity, the KAU and the establishment are the same units.
6.11. Unit of homogeneous production. To ensure the most complete coverage, energy statis-tics compilers may need, in certain cases, to use an even more detailed splitting of the enter-prise activities. The statistical unit appropriate for such a purpose is the unit of homogeneous production. It is defined as a production unit in which only a single (non-ancillary) productive activity is carried out. For example, if an enterprise is engaged primarily in non-energy-related activities, but still produces some energy, the compiler may “construct” an energy-producing unit, which might be classified under the proper energy activity category and collect (or estimate) data about its energy production and inputs used in such a production (while maintaining the autoproducer definition of para. 5.45 if the unit is an electricity or heat pro-ducer). This is the case, for example, of the sugar industry, which burns bagasse to generate electricity for own use. While it may not be possible to collect data corresponding to such a unit directly from the enterprise or establishment, in practice, such data are calculated/estimated by transforming the data supplied by establishments or enterprises on the basis of various assumptions or hypotheses.
6.12. Households. The scope of energy statistics also includes statistics (mainly on consump-tion) in the household sector. In data collection from this sector, a special statistical unit—household—is used. A household is defined as a group of persons who share the same living accommodation, who pool some or all of their income and wealth, and who consume certain types of goods and services collectively, mainly housing and food. In general, each member of a household should have some claim upon the collective resources of the household. At least some decisions affecting consumption or other economic activities must be taken for the household as a whole.52 In some cases, a household may also produce energy products for sale or for own use.
2. An illustrative example
6.13. In order to illustrate the different types of statistical units, an imaginary, but realistic example is presented below. Figure 6.1 shows a schematic representation of a large corporation involved in the primary production, transformation and distribution of energy. The corpora-tion consists of four separate companies (identified in the figure as company A, B, C and D) which carry out activities of extraction, transportation, refining and sale of oil products. Each tile in the figure represents a different geographical location. In each tile a description of the kind of economic activity(ies) carried out at that location is described. For easy reference, the tiles are numbered (1) to (8).
6.14. Company A is engaged in the activity of crude oil extraction (ISIC Rev.4, Group 061). It has plants at two different locations illustrated in the figure by tiles (1) and (2). The crude oil is then transported through pipelines by company B (ISIC Rev. 4, Group 493). Although the pipelines themselves are geographically distributed, the centre of operation can be assigned to a physical location and is illustrated by tile (3). Company B transports the crude oil to Company C, which operates three separate refineries located in different geographical areas, illustrated by tiles (4), (5) and (6). The refinery associated with tile (6) also has a minor secondary activity of electricity generation (ISIC Rev. 4, Group 351), from which small quantities of electricity are sold to third parties.
52 SNA 2008, para. 4.149.
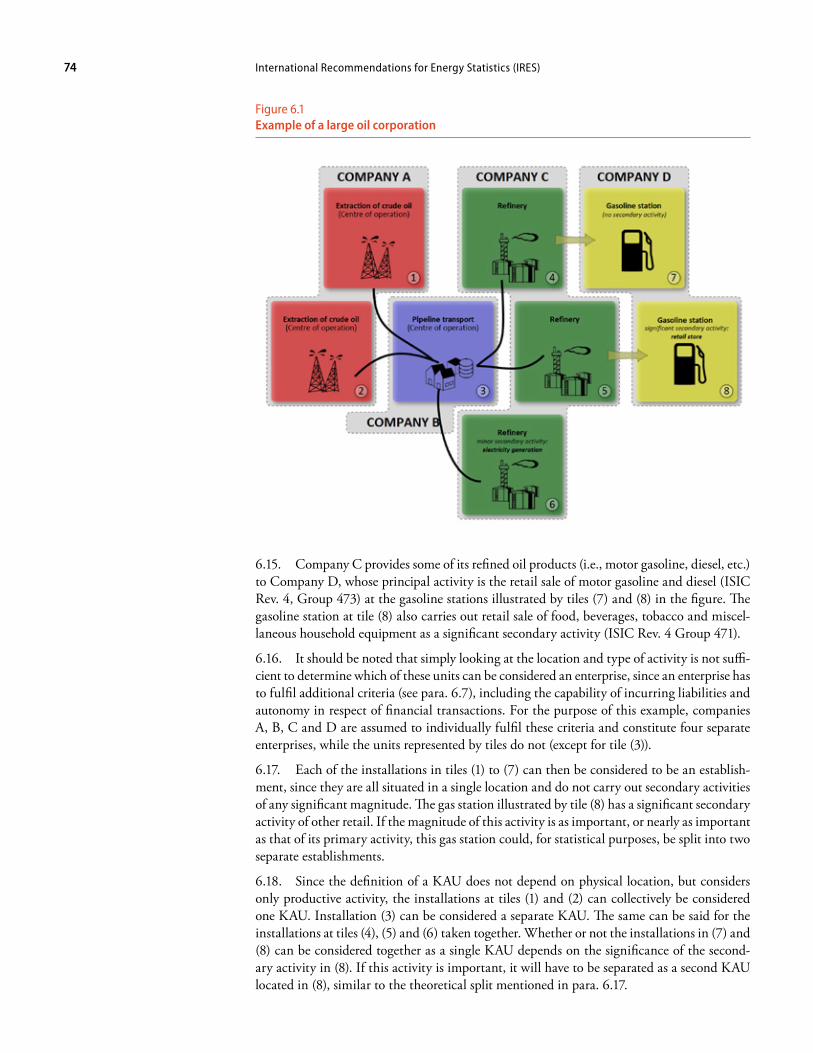
International Recommendations for Energy Statistics (IRES)74
6.15. Company C provides some of its refined oil products (i.e., motor gasoline, diesel, etc.) to Company D, whose principal activity is the retail sale of motor gasoline and diesel (ISIC Rev. 4, Group 473) at the gasoline stations illustrated by tiles (7) and (8) in the figure. The gasoline station at tile (8) also carries out retail sale of food, beverages, tobacco and miscel-laneous household equipment as a significant secondary activity (ISIC Rev. 4 Group 471).
6.16. It should be noted that simply looking at the location and type of activity is not suffi-cient to determine which of these units can be considered an enterprise, since an enterprise has to fulfil additional criteria (see para. 6.7), including the capability of incurring liabilities and autonomy in respect of financial transactions. For the purpose of this example, companies A, B, C and D are assumed to individually fulfil these criteria and constitute four separate enterprises, while the units represented by tiles do not (except for tile (3)).
6.17. Each of the installations in tiles (1) to (7) can then be considered to be an establish-ment, since they are all situated in a single location and do not carry out secondary activities of any significant magnitude. The gas station illustrated by tile (8) has a significant secondary activity of other retail. If the magnitude of this activity is as important, or nearly as important as that of its primary activity, this gas station could, for statistical purposes, be split into two separate establishments.
6.18. Since the definition of a KAU does not depend on physical location, but considers only productive activity, the installations at tiles (1) and (2) can collectively be considered one KAU. Installation (3) can be considered a separate KAU. The same can be said for the installations at tiles (4), (5) and (6) taken together. Whether or not the installations in (7) and (8) can be considered together as a single KAU depends on the significance of the second-ary activity in (8). If this activity is important, it will have to be separated as a second KAU located in (8), similar to the theoretical split mentioned in para. 6.17.
Figure 6.1Example of a large oil corporation
75Statistical units and data items 75
6.19. If the unit of homogeneous production (UHP) is considered for describing the exam-ple, the installations at tiles (1) and (2) could be collectively considered a UHP, but not the installations at tiles (4), (5) and (6), since the installation at (6) is also engaged in some electricity production. In order to define units of homogeneous production, the installation at this tile needs to be conceptually split into two parts: one for the refinery operation and another for the generation of electricity. The installations at (4) and (5), together with the refinery part of the installation at (6) can collectively be considered a unit of homogeneous production, and the electricity generating component of (6) can be considered as a separate unit (of homogeneous production). A similar treatment has to be applied to tiles (7) and (8).
6.20. While the last two paragraphs illustrate a general approach, this is not recommended in the case of energy statistics (see para. 6.21). The use of the UHP can be justified in certain cases (see para. 6.11) but is usually not applied to the whole range of units covered by the statistics collected. The use of enterprise, establishment, KAU or UHP may lead to different results (e.g. when broken down by economic activity) and deviations from the recommenda-tion in para. 6.21 should be carefully weighed.
3. Statistical units for energy statistics
6.21. For the inquiries dealt with in the current recommendations, the statistical units should ideally be the establishment and households. The establishment is recommended because it is the most detailed unit for which the range of data required is normally available. For many analytical applications, data need to be grouped according to such characteristics as kind-of-activity, geographical area and size, and this is facilitated by the use of the estab-lishment unit.
6.22. However, the choice of statistical unit will also be guided by the purpose of the data collection, user needs and the availability of data. Therefore, the enterprise could also be used as the statistical unit. In practice, in the majority of the cases, especially for smaller units, the establishment and the enterprise are the same units.
C. Reference list of data items6.23. This section provides the reference list of data items for use in national energy sta-tistics, aiming to satisfy basic needs of energy policy makers, the business community and the general public, and to ensure the international comparability of such statistics. The list consists of five parts: (i) data items on the characteristics of statistical units; (ii) data items on energy stocks and flows; (iii) data items on production and storage capacity; (iv) data items for assessment of the economic performance of the energy industries; and (v) data items on mineral and energy resources.
1. Characteristics of statistical units
6.24. Data items on characteristics of statistical units are used for the unique identification of units, their classification within particular activity groups and for the description of vari-ous aspects of their structure, operation and relationship with other units. Information about these characteristics of the statistical units allows for the compilation of statistics on the size of energy industries as a whole, as well as on their economic and geographical structure. Also, it is a precondition for an effective organization of statistical sample surveys, as well as for making comparisons and establishing linkages between energy data from different sources, thus significantly reducing the duplication in data collection and the response burden.
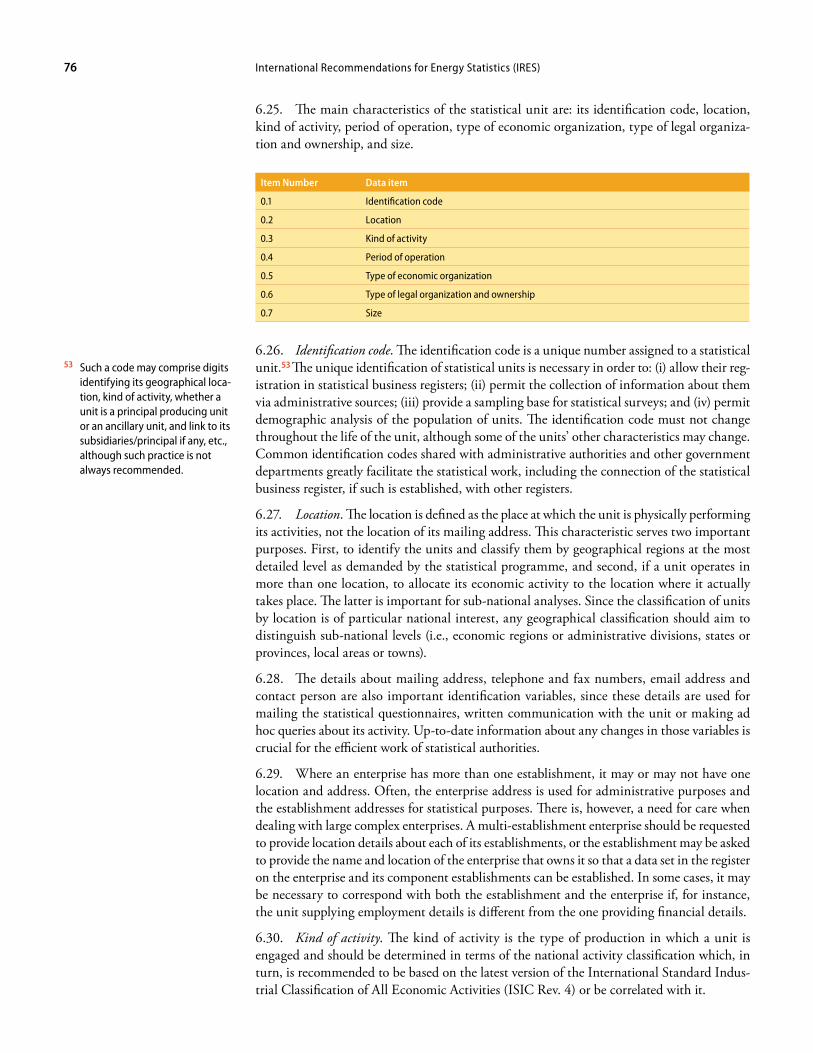
International Recommendations for Energy Statistics (IRES)76
6.25. The main characteristics of the statistical unit are: its identification code, location, kind of activity, period of operation, type of economic organization, type of legal organiza-tion and ownership, and size.
Item Number Data item
0.1 Identification code
0.2 Location
0.3 Kind of activity
0.4 Period of operation
0.5 Type of economic organization
0.6 Type of legal organization and ownership
0.7 Size
6.26. Identification code. The identification code is a unique number assigned to a statistical unit.53 The unique identification of statistical units is necessary in order to: (i) allow their reg-istration in statistical business registers; (ii) permit the collection of information about them via administrative sources; (iii) provide a sampling base for statistical surveys; and (iv) permit demographic analysis of the population of units. The identification code must not change throughout the life of the unit, although some of the units’ other characteristics may change. Common identification codes shared with administrative authorities and other government departments greatly facilitate the statistical work, including the connection of the statistical business register, if such is established, with other registers.
6.27. Location. The location is defined as the place at which the unit is physically performing its activities, not the location of its mailing address. This characteristic serves two important purposes. First, to identify the units and classify them by geographical regions at the most detailed level as demanded by the statistical programme, and second, if a unit operates in more than one location, to allocate its economic activity to the location where it actually takes place. The latter is important for sub-national analyses. Since the classification of units by location is of particular national interest, any geographical classification should aim to distinguish sub-national levels (i.e., economic regions or administrative divisions, states or provinces, local areas or towns).
6.28. The details about mailing address, telephone and fax numbers, email address and contact person are also important identification variables, since these details are used for mailing the statistical questionnaires, written communication with the unit or making ad hoc queries about its activity. Up-to-date information about any changes in those variables is crucial for the efficient work of statistical authorities.
6.29. Where an enterprise has more than one establishment, it may or may not have one location and address. Often, the enterprise address is used for administrative purposes and the establishment addresses for statistical purposes. There is, however, a need for care when dealing with large complex enterprises. A multi-establishment enterprise should be requested to provide location details about each of its establishments, or the establishment may be asked to provide the name and location of the enterprise that owns it so that a data set in the register on the enterprise and its component establishments can be established. In some cases, it may be necessary to correspond with both the establishment and the enterprise if, for instance, the unit supplying employment details is different from the one providing financial details.
6.30. Kind of activity. The kind of activity is the type of production in which a unit is engaged and should be determined in terms of the national activity classification which, in turn, is recommended to be based on the latest version of the International Standard Indus-trial Classification of All Economic Activities (ISIC Rev. 4) or be correlated with it.
53 Such a code may comprise digits identifying its geographical loca-tion, kind of activity, whether a unit is a principal producing unit or an ancillary unit, and link to its subsidiaries/principal if any, etc., although such practice is not always recommended.
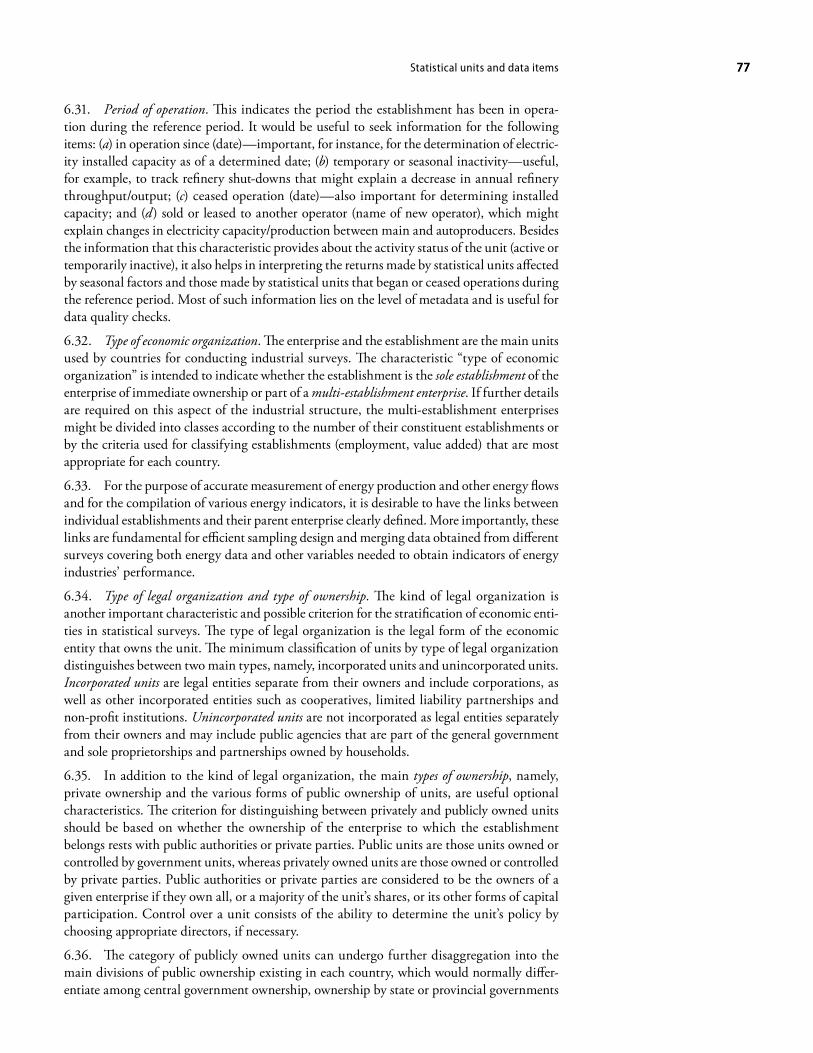
77Statistical units and data items 77
6.31. Period of operation. This indicates the period the establishment has been in opera-tion during the reference period. It would be useful to seek information for the following items: (a) in operation since (date)—important, for instance, for the determination of electric-ity installed capacity as of a determined date; (b) temporary or seasonal inactivity—useful, for example, to track refinery shut-downs that might explain a decrease in annual refinery throughput/output; (c) ceased operation (date)—also important for determining installed capacity; and (d) sold or leased to another operator (name of new operator), which might explain changes in electricity capacity/production between main and autoproducers. Besides the information that this characteristic provides about the activity status of the unit (active or temporarily inactive), it also helps in interpreting the returns made by statistical units affected by seasonal factors and those made by statistical units that began or ceased operations during the reference period. Most of such information lies on the level of metadata and is useful for data quality checks.
6.32. Type of economic organization. The enterprise and the establishment are the main units used by countries for conducting industrial surveys. The characteristic “type of economic organization” is intended to indicate whether the establishment is the sole establishment of the enterprise of immediate ownership or part of a multi-establishment enterprise. If further details are required on this aspect of the industrial structure, the multi-establishment enterprises might be divided into classes according to the number of their constituent establishments or by the criteria used for classifying establishments (employment, value added) that are most appropriate for each country.
6.33. For the purpose of accurate measurement of energy production and other energy flows and for the compilation of various energy indicators, it is desirable to have the links between individual establishments and their parent enterprise clearly defined. More importantly, these links are fundamental for efficient sampling design and merging data obtained from different surveys covering both energy data and other variables needed to obtain indicators of energy industries’ performance.
6.34. Type of legal organization and type of ownership. The kind of legal organization is another important characteristic and possible criterion for the stratification of economic enti-ties in statistical surveys. The type of legal organization is the legal form of the economic entity that owns the unit. The minimum classification of units by type of legal organization distinguishes between two main types, namely, incorporated units and unincorporated units. Incorporated units are legal entities separate from their owners and include corporations, as well as other incorporated entities such as cooperatives, limited liability partnerships and non-profit institutions. Unincorporated units are not incorporated as legal entities separately from their owners and may include public agencies that are part of the general government and sole proprietorships and partnerships owned by households.
6.35. In addition to the kind of legal organization, the main types of ownership, namely, private ownership and the various forms of public ownership of units, are useful optional characteristics. The criterion for distinguishing between privately and publicly owned units should be based on whether the ownership of the enterprise to which the establishment belongs rests with public authorities or private parties. Public units are those units owned or controlled by government units, whereas privately owned units are those owned or controlled by private parties. Public authorities or private parties are considered to be the owners of a given enterprise if they own all, or a majority of the unit’s shares, or its other forms of capital participation. Control over a unit consists of the ability to determine the unit’s policy by choosing appropriate directors, if necessary.
6.36. The category of publicly owned units can undergo further disaggregation into the main divisions of public ownership existing in each country, which would normally differ-entiate among central government ownership, ownership by state or provincial governments
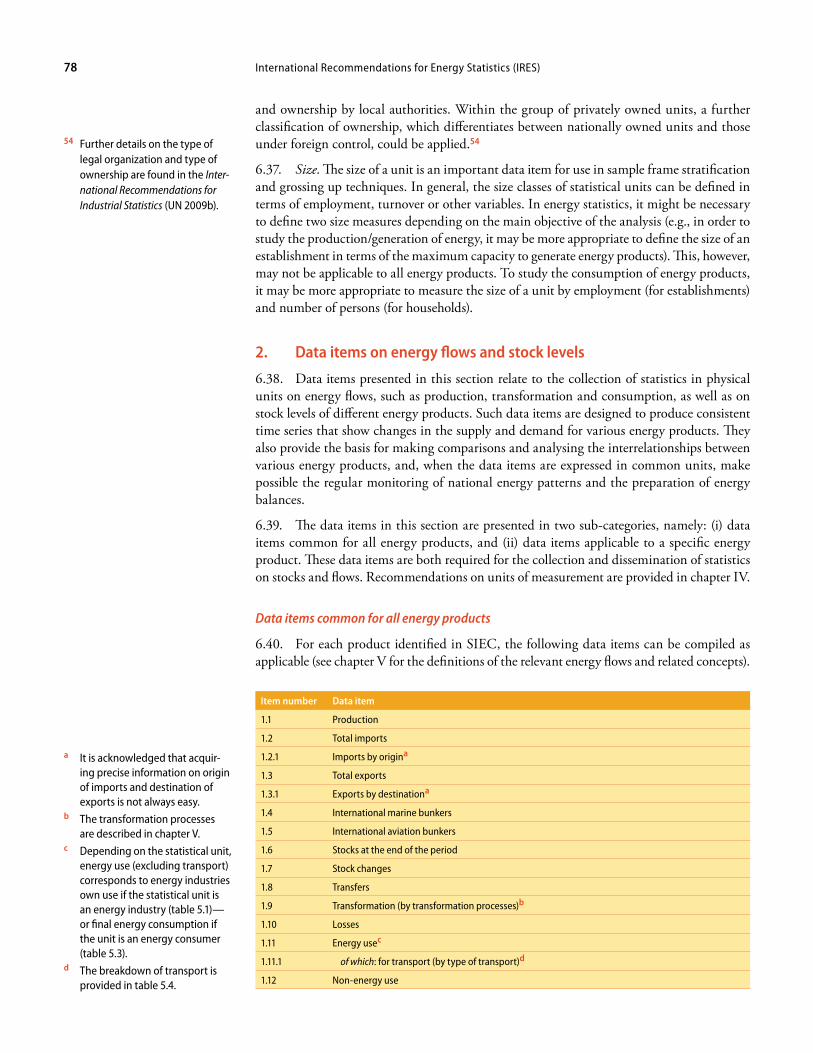
International Recommendations for Energy Statistics (IRES)78
and ownership by local authorities. Within the group of privately owned units, a further classification of ownership, which differentiates between nationally owned units and those under foreign control, could be applied.54
6.37. Size. The size of a unit is an important data item for use in sample frame stratification and grossing up techniques. In general, the size classes of statistical units can be defined in terms of employment, turnover or other variables. In energy statistics, it might be necessary to define two size measures depending on the main objective of the analysis (e.g., in order to study the production/generation of energy, it may be more appropriate to define the size of an establishment in terms of the maximum capacity to generate energy products). This, however, may not be applicable to all energy products. To study the consumption of energy products, it may be more appropriate to measure the size of a unit by employment (for establishments) and number of persons (for households).
2. Data items on energy flows and stock levels
6.38. Data items presented in this section relate to the collection of statistics in physical units on energy flows, such as production, transformation and consumption, as well as on stock levels of different energy products. Such data items are designed to produce consistent time series that show changes in the supply and demand for various energy products. They also provide the basis for making comparisons and analysing the interrelationships between various energy products, and, when the data items are expressed in common units, make possible the regular monitoring of national energy patterns and the preparation of energy balances.
6.39. The data items in this section are presented in two sub-categories, namely: (i) data items common for all energy products, and (ii) data items applicable to a specific energy product. These data items are both required for the collection and dissemination of statistics on stocks and flows. Recommendations on units of measurement are provided in chapter IV.
Data items common for all energy products
6.40. For each product identified in SIEC, the following data items can be compiled as applicable (see chapter V for the definitions of the relevant energy flows and related concepts).
Item number Data item
1.1 Production
1.2 Total imports
1.2.1 Imports by origina
1.3 Total exports
1.3.1 Exports by destinationa
1.4 International marine bunkers
1.5 International aviation bunkers
1.6 Stocks at the end of the period
1.7 Stock changes
1.8 Transfers
1.9 Transformation (by transformation processes)b
1.10 Losses
1.11 Energy usec
1.11.1 of which: for transport (by type of transport)d
1.12 Non-energy use
54 Further details on the type of legal organization and type of ownership are found in the Inter-national Recommendations for Industrial Statistics (UN 2009b).
a It is acknowledged that acquir-ing precise information on origin of imports and destination of exports is not always easy.
b The transformation processes are described in chapter V.
c Depending on the statistical unit, energy use (excluding transport) corresponds to energy industries own use if the statistical unit is an energy industry (table 5.1)—or final energy consumption if the unit is an energy consumer (table 5.3).
d The breakdown of transport is provided in table 5.4.
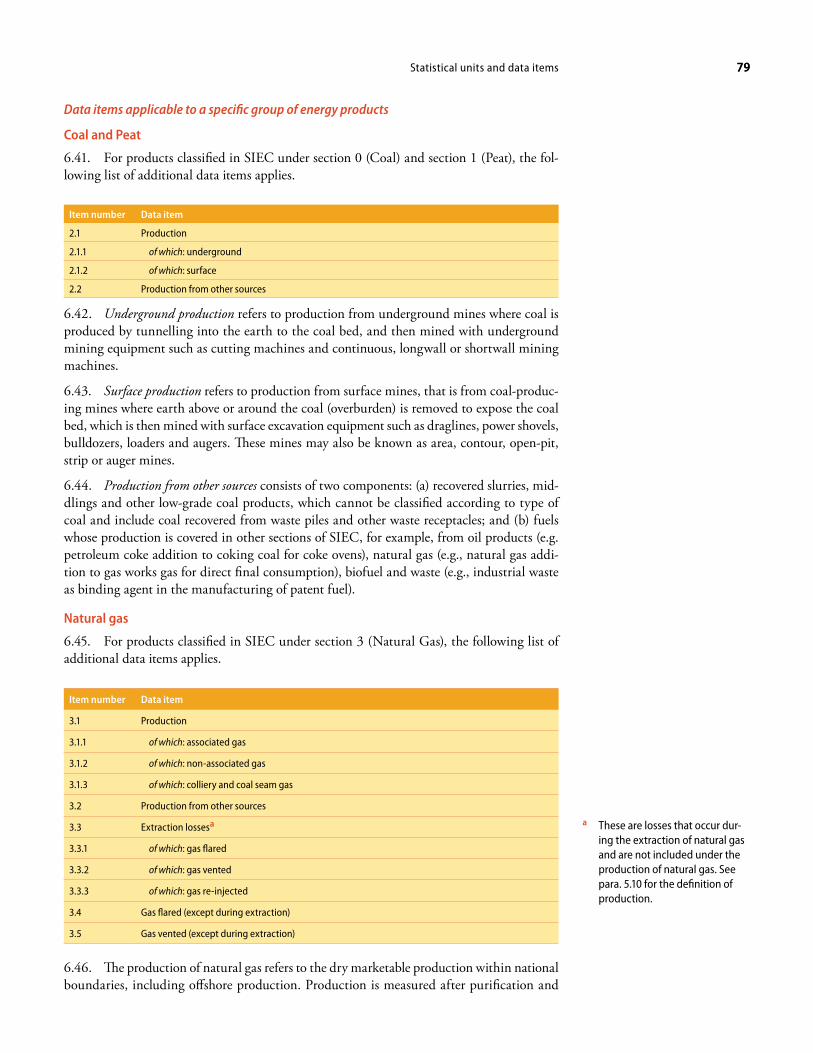
79Statistical units and data items 79
Data items applicable to a specific group of energy products
Coal and Peat
6.41. For products classified in SIEC under section 0 (Coal) and section 1 (Peat), the fol-lowing list of additional data items applies.
Item number Data item
2.1 Production
2.1.1 of which: underground
2.1.2 of which: surface
2.2 Production from other sources
6.42. Underground production refers to production from underground mines where coal is produced by tunnelling into the earth to the coal bed, and then mined with underground mining equipment such as cutting machines and continuous, longwall or shortwall mining machines.
6.43. Surface production refers to production from surface mines, that is from coal-produc-ing mines where earth above or around the coal (overburden) is removed to expose the coal bed, which is then mined with surface excavation equipment such as draglines, power shovels, bulldozers, loaders and augers. These mines may also be known as area, contour, open-pit, strip or auger mines.
6.44. Production from other sources consists of two components: (a) recovered slurries, mid-dlings and other low-grade coal products, which cannot be classified according to type of coal and include coal recovered from waste piles and other waste receptacles; and (b) fuels whose production is covered in other sections of SIEC, for example, from oil products (e.g. petroleum coke addition to coking coal for coke ovens), natural gas (e.g., natural gas addi-tion to gas works gas for direct final consumption), biofuel and waste (e.g., industrial waste as binding agent in the manufacturing of patent fuel).
Natural gas
6.45. For products classified in SIEC under section 3 (Natural Gas), the following list of additional data items applies.
Item number Data item
3.1 Production
3.1.1 of which: associated gas
3.1.2 of which: non-associated gas
3.1.3 of which: colliery and coal seam gas
3.2 Production from other sources
3.3 Extraction lossesa
3.3.1 of which: gas flared
3.3.2 of which: gas vented
3.3.3 of which: gas re-injected
3.4 Gas flared (except during extraction)
3.5 Gas vented (except during extraction)
6.46. The production of natural gas refers to the dry marketable production within national boundaries, including offshore production. Production is measured after purification and
a These are losses that occur dur-ing the extraction of natural gas and are not included under the production of natural gas. See para. 5.10 for the definition of production.
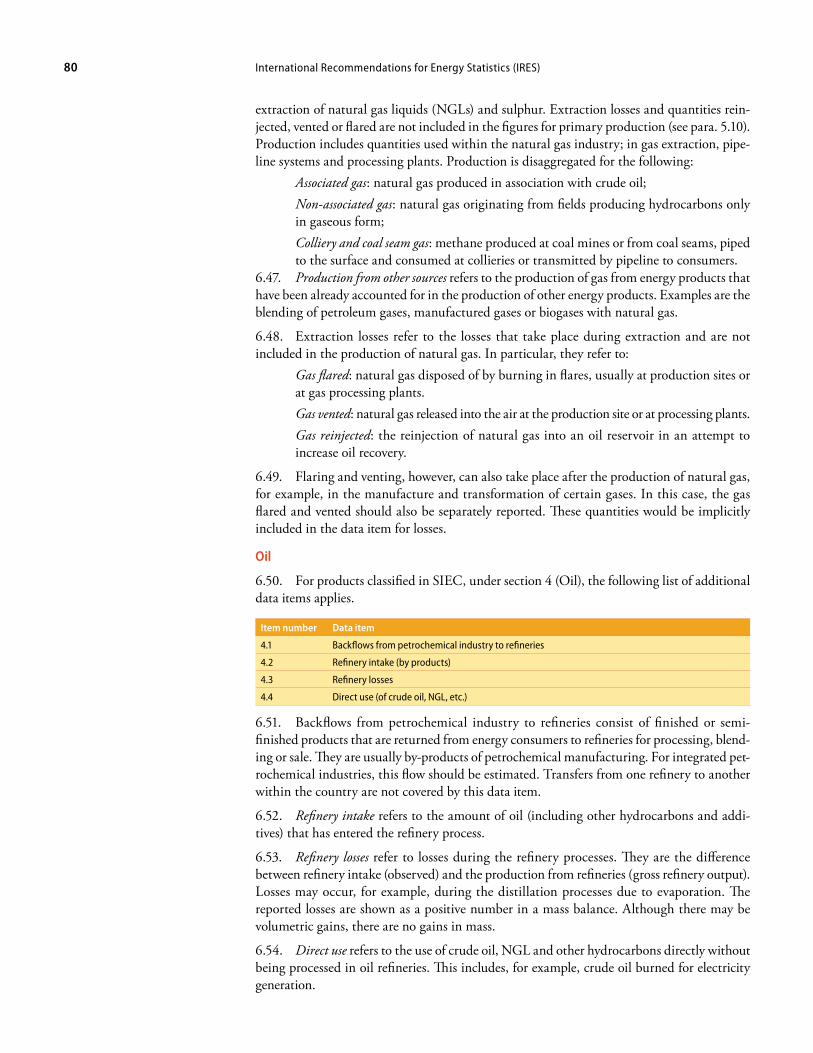
International Recommendations for Energy Statistics (IRES)80
extraction of natural gas liquids (NGLs) and sulphur. Extraction losses and quantities rein-jected, vented or flared are not included in the figures for primary production (see para. 5.10). Production includes quantities used within the natural gas industry; in gas extraction, pipe-line systems and processing plants. Production is disaggregated for the following:
Associated gas: natural gas produced in association with crude oil; Non-associated gas: natural gas originating from fields producing hydrocarbons only in gaseous form; Colliery and coal seam gas: methane produced at coal mines or from coal seams, piped to the surface and consumed at collieries or transmitted by pipeline to consumers.
6.47. Production from other sources refers to the production of gas from energy products that have been already accounted for in the production of other energy products. Examples are the blending of petroleum gases, manufactured gases or biogases with natural gas.
6.48. Extraction losses refer to the losses that take place during extraction and are not included in the production of natural gas. In particular, they refer to:
Gas flared: natural gas disposed of by burning in flares, usually at production sites or at gas processing plants.Gas vented: natural gas released into the air at the production site or at processing plants.Gas reinjected: the reinjection of natural gas into an oil reservoir in an attempt to increase oil recovery.
6.49. Flaring and venting, however, can also take place after the production of natural gas, for example, in the manufacture and transformation of certain gases. In this case, the gas flared and vented should also be separately reported. These quantities would be implicitly included in the data item for losses.
oil
6.50. For products classified in SIEC, under section 4 (Oil), the following list of additional data items applies.
Item number Data item
4.1 Backflows from petrochemical industry to refineries
4.2 Refinery intake (by products)
4.3 Refinery losses
4.4 Direct use (of crude oil, NGL, etc.)
6.51. Backflows from petrochemical industry to refineries consist of finished or semi-finished products that are returned from energy consumers to refineries for processing, blend-ing or sale. They are usually by-products of petrochemical manufacturing. For integrated pet-rochemical industries, this flow should be estimated. Transfers from one refinery to another within the country are not covered by this data item.
6.52. Refinery intake refers to the amount of oil (including other hydrocarbons and addi-tives) that has entered the refinery process.
6.53. Refinery losses refer to losses during the refinery processes. They are the difference between refinery intake (observed) and the production from refineries (gross refinery output). Losses may occur, for example, during the distillation processes due to evaporation. The reported losses are shown as a positive number in a mass balance. Although there may be volumetric gains, there are no gains in mass.
6.54. Direct use refers to the use of crude oil, NGL and other hydrocarbons directly without being processed in oil refineries. This includes, for example, crude oil burned for electricity generation.
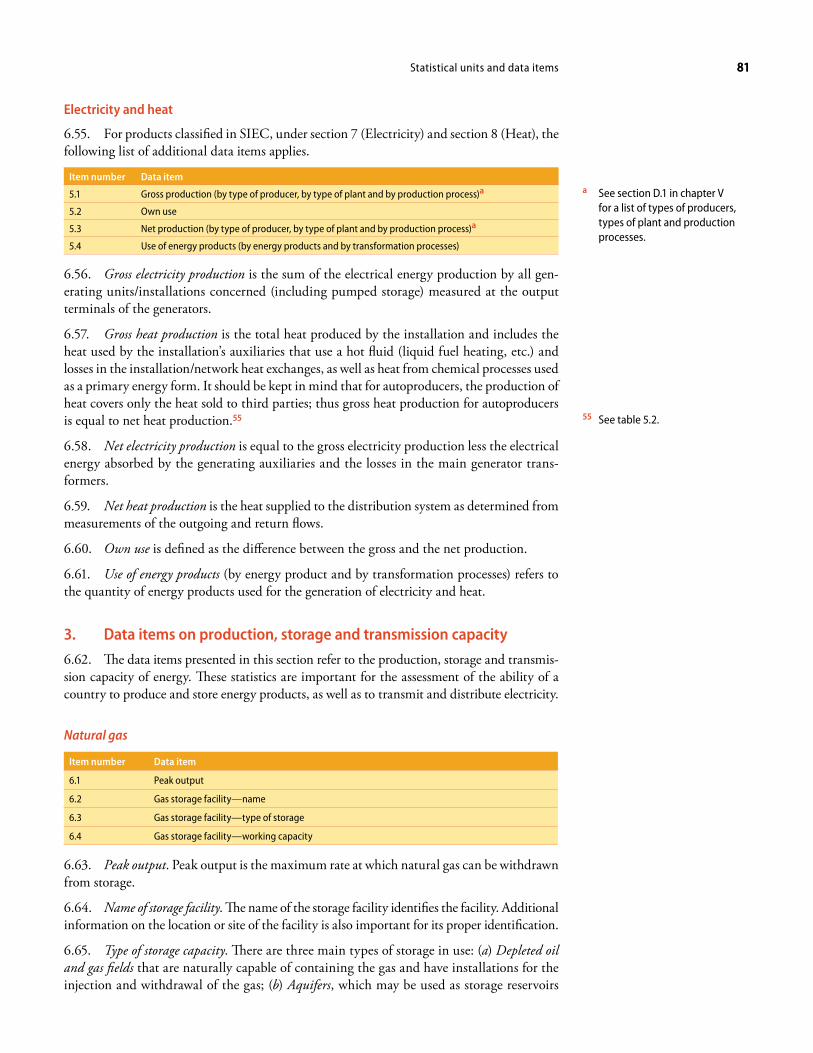
81Statistical units and data items 81
Electricity and heat
6.55. For products classified in SIEC, under section 7 (Electricity) and section 8 (Heat), the following list of additional data items applies.
Item number Data item
5.1 Gross production (by type of producer, by type of plant and by production process)a
5.2 Own use
5.3 Net production (by type of producer, by type of plant and by production process)a
5.4 Use of energy products (by energy products and by transformation processes)
6.56. Gross electricity production is the sum of the electrical energy production by all gen-erating units/installations concerned (including pumped storage) measured at the output terminals of the generators.
6.57. Gross heat production is the total heat produced by the installation and includes the heat used by the installation’s auxiliaries that use a hot fluid (liquid fuel heating, etc.) and losses in the installation/network heat exchanges, as well as heat from chemical processes used as a primary energy form. It should be kept in mind that for autoproducers, the production of heat covers only the heat sold to third parties; thus gross heat production for autoproducers is equal to net heat production.55
6.58. Net electricity production is equal to the gross electricity production less the electrical energy absorbed by the generating auxiliaries and the losses in the main generator trans-formers.
6.59. Net heat production is the heat supplied to the distribution system as determined from measurements of the outgoing and return flows.
6.60. Own use is defined as the difference between the gross and the net production.
6.61. Use of energy products (by energy product and by transformation processes) refers to the quantity of energy products used for the generation of electricity and heat.
3. Data items on production, storage and transmission capacity
6.62. The data items presented in this section refer to the production, storage and transmis-sion capacity of energy. These statistics are important for the assessment of the ability of a country to produce and store energy products, as well as to transmit and distribute electricity.
Natural gas
Item number Data item
6.1 Peak output
6.2 Gas storage facility—name
6.3 Gas storage facility—type of storage
6.4 Gas storage facility—working capacity
6.63. Peak output. Peak output is the maximum rate at which natural gas can be withdrawn from storage.
6.64. Name of storage facility. The name of the storage facility identifies the facility. Additional information on the location or site of the facility is also important for its proper identification.
6.65. Type of storage capacity. There are three main types of storage in use: (a) Depleted oil and gas fields that are naturally capable of containing the gas and have installations for the injection and withdrawal of the gas; (b) Aquifers, which may be used as storage reservoirs
a See section D.1 in chapter V for a list of types of producers, types of plant and production processes.
55 See table 5.2.
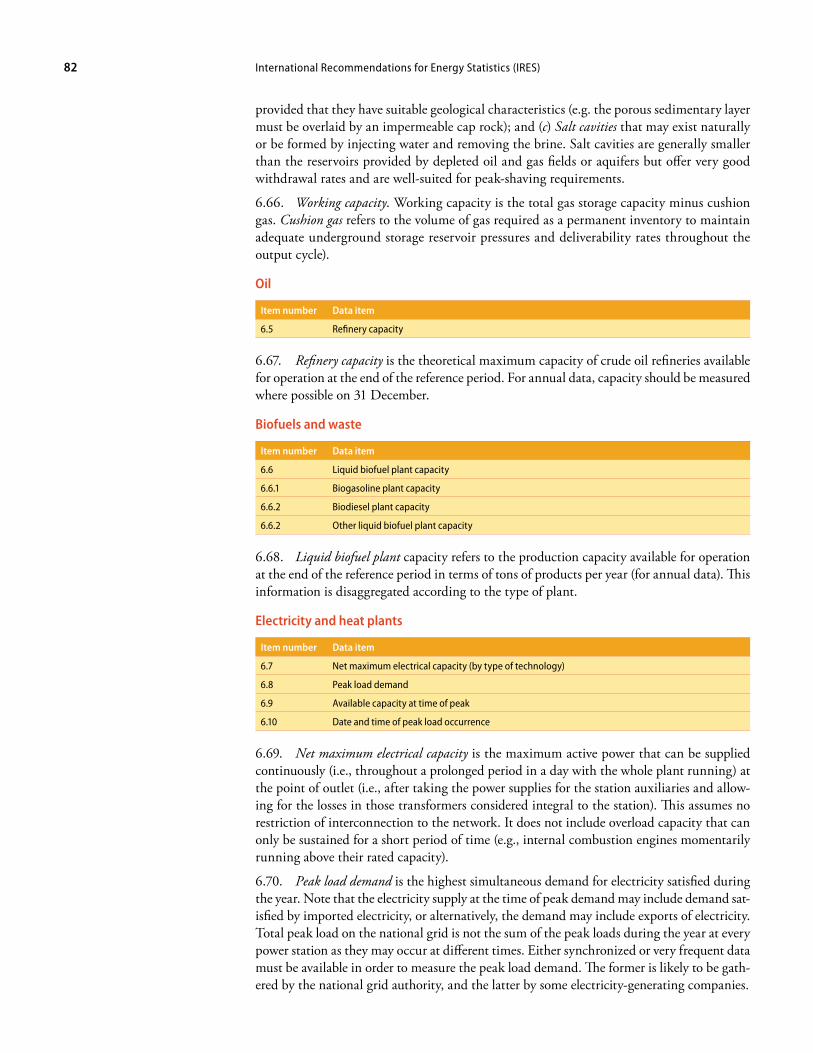
International Recommendations for Energy Statistics (IRES)82
provided that they have suitable geological characteristics (e.g. the porous sedimentary layer must be overlaid by an impermeable cap rock); and (c) Salt cavities that may exist naturally or be formed by injecting water and removing the brine. Salt cavities are generally smaller than the reservoirs provided by depleted oil and gas fields or aquifers but offer very good withdrawal rates and are well-suited for peak-shaving requirements.
6.66. Working capacity. Working capacity is the total gas storage capacity minus cushion gas. Cushion gas refers to the volume of gas required as a permanent inventory to maintain adequate underground storage reservoir pressures and deliverability rates throughout the output cycle).
oil
Item number Data item
6.5 Refinery capacity
6.67. Refinery capacity is the theoretical maximum capacity of crude oil refineries available for operation at the end of the reference period. For annual data, capacity should be measured where possible on 31 December.
Biofuels and waste
Item number Data item
6.6 Liquid biofuel plant capacity
6.6.1 Biogasoline plant capacity
6.6.2 Biodiesel plant capacity
6.6.2 Other liquid biofuel plant capacity
6.68. Liquid biofuel plant capacity refers to the production capacity available for operation at the end of the reference period in terms of tons of products per year (for annual data). This information is disaggregated according to the type of plant.
Electricity and heat plants
Item number Data item
6.7 Net maximum electrical capacity (by type of technology)
6.8 Peak load demand
6.9 Available capacity at time of peak
6.10 Date and time of peak load occurrence
6.69. Net maximum electrical capacity is the maximum active power that can be supplied continuously (i.e., throughout a prolonged period in a day with the whole plant running) at the point of outlet (i.e., after taking the power supplies for the station auxiliaries and allow-ing for the losses in those transformers considered integral to the station). This assumes no restriction of interconnection to the network. It does not include overload capacity that can only be sustained for a short period of time (e.g., internal combustion engines momentarily running above their rated capacity).
6.70. Peak load demand is the highest simultaneous demand for electricity satisfied during the year. Note that the electricity supply at the time of peak demand may include demand sat-isfied by imported electricity, or alternatively, the demand may include exports of electricity. Total peak load on the national grid is not the sum of the peak loads during the year at every power station as they may occur at different times. Either synchronized or very frequent data must be available in order to measure the peak load demand. The former is likely to be gath-ered by the national grid authority, and the latter by some electricity-generating companies.
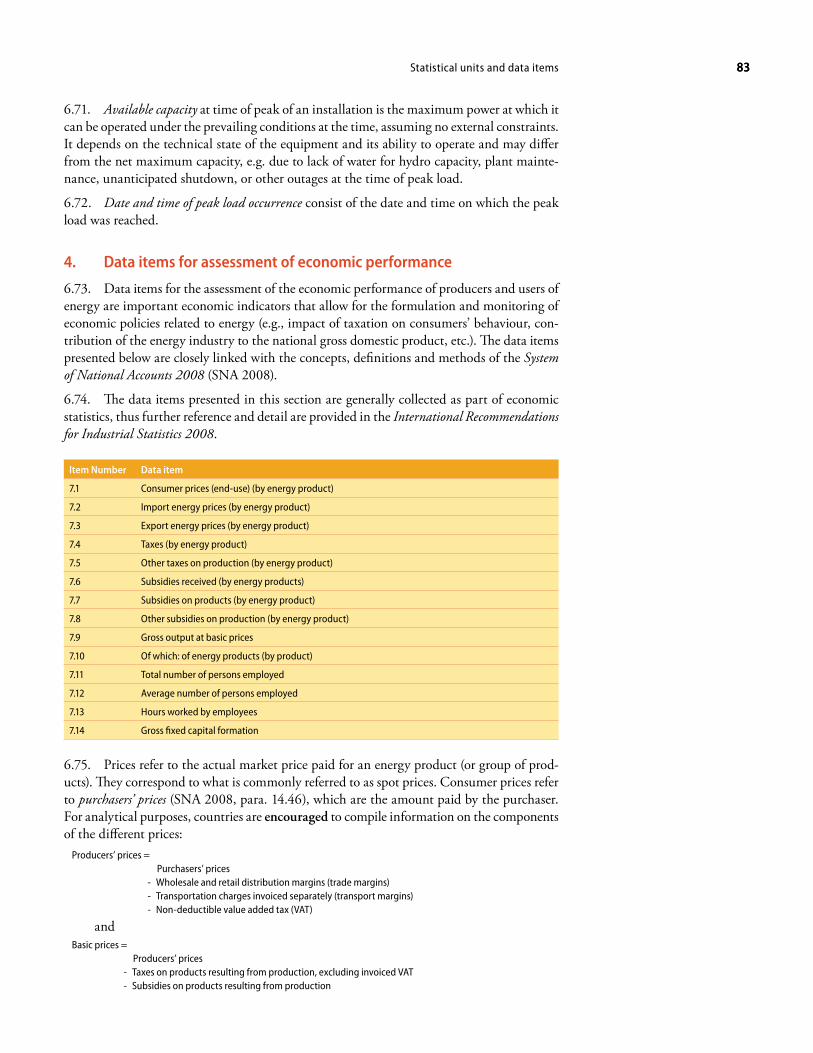
83Statistical units and data items 83
6.71. Available capacity at time of peak of an installation is the maximum power at which it can be operated under the prevailing conditions at the time, assuming no external constraints. It depends on the technical state of the equipment and its ability to operate and may differ from the net maximum capacity, e.g. due to lack of water for hydro capacity, plant mainte-nance, unanticipated shutdown, or other outages at the time of peak load.
6.72. Date and time of peak load occurrence consist of the date and time on which the peak load was reached.
4. Data items for assessment of economic performance
6.73. Data items for the assessment of the economic performance of producers and users of energy are important economic indicators that allow for the formulation and monitoring of economic policies related to energy (e.g., impact of taxation on consumers’ behaviour, con-tribution of the energy industry to the national gross domestic product, etc.). The data items presented below are closely linked with the concepts, definitions and methods of the System of National Accounts 2008 (SNA 2008).
6.74. The data items presented in this section are generally collected as part of economic statistics, thus further reference and detail are provided in the International Recommendations for Industrial Statistics 2008.
Item Number Data item
7.1 Consumer prices (end-use) (by energy product)
7.2 Import energy prices (by energy product)
7.3 Export energy prices (by energy product)
7.4 Taxes (by energy product)
7.5 Other taxes on production (by energy product)
7.6 Subsidies received (by energy products)
7.7 Subsidies on products (by energy product)
7.8 Other subsidies on production (by energy product)
7.9 Gross output at basic prices
7.10 Of which: of energy products (by product)
7.11 Total number of persons employed
7.12 Average number of persons employed
7.13 Hours worked by employees
7.14 Gross fixed capital formation
6.75. Prices refer to the actual market price paid for an energy product (or group of prod-ucts). They correspond to what is commonly referred to as spot prices. Consumer prices refer to purchasers’ prices (SNA 2008, para. 14.46), which are the amount paid by the purchaser. For analytical purposes, countries are encouraged to compile information on the components of the different prices:
Producers’ prices = Purchasers’ prices - Wholesale and retail distribution margins (trade margins) - Transportation charges invoiced separately (transport margins) - Non-deductible value added tax (VAT)
andBasic prices = Producers’ prices - Taxes on products resulting from production, excluding invoiced VAT - Subsidies on products resulting from production
International Recommendations for Energy Statistics (IRES)84
6.76. Import prices generally include cost, insurance and freight (CIF) at the point of entry into the importing economy.
6.77. Export prices are valued free on board (FOB) at the point of exit from the exporter’s economy. It includes the cost of transport from the exporter’s premises to the border of the exporting economy.
6.78. Taxes are compulsory unrequited payments, in cash or in kind, made to the gov-ernment. Two main groups of taxes are identifiable: taxes on products; and other taxes on production. However, only other taxes on production are presented as data item, as these payments are recorded in the business accounts of units. It is recommended that, in statisti-cal questionnaires, countries refer to the specific names or descriptions of taxes as they exist in their national fiscal systems.
6.79. Other taxes on production are taxes that units are liable to pay as a result of engaging in production. As such, they represent a part of production costs and should be included in the value of output. Units pay them irrespective of profitability of production. These taxes consist mainly of taxes on the ownership or use of land, buildings or other assets used in production, or on the labour employed or compensation of employees paid. Examples of such taxes are motor vehicle taxes, duties and registration fees, and levies on the use of fixed assets. Also included are official fees and charges (i.e. duties payable for specific public services, such as the testing of standards of weights and measures, provision of extracts from official registers of crime and the like).
6.80. It may not be possible to collect data on all these taxes at the establishment level; therefore, in such cases the design of statistical questionnaires and subsequent data compila-tion should clearly indicate the type of taxes that have been reported.
6.81. Subsidies received covers payments that government units make to resident producing units on the basis of their production activities or the quantities or values of the goods or services they produce, sell or import. The classification of subsidies follows closely the clas-sification of taxes.
6.82. Subsidies on products correspond to subsidies payable per unit of a good or service pro-duced, either as a specific amount of money per unit of quantity of a good or service, or as a specified percentage of the price per unit; it may also be calculated as the difference between a specified target price and the market price actually paid by a buyer.
6.83. Other subsidies on production consist of subsidies, except subsidies on products that resident enterprises may receive as a consequence of engaging in production (for example, subsidies on payroll or workforce and subsidies to reduce pollution).
6.84. Gross output at basic prices measures the result of the overall production activity of economic units. The value of production corresponds to the sum of the value of all goods or services actually produced within an establishment and made available for use outside that establishment, plus any goods and services produced for own final use. In order to maintain consistency with the valuation principles for output (production) of other international rec-ommendations on business statistics and national accounts, it is recommended that countries compile the output of establishments at basic prices. However, in circumstances where it is not possible to segregate “taxes and subsidies on products” and “other taxes on production”, valuation of output at factor cost can serve as a second best alternative.
6.85. Gross output of energy products (by product) refers to the output generated by the pro-ducing unit for each of the energy products described in SIEC.
6.86. Total number of person employed, average number of persons employed, and hours worked by employees are important data items describing, for example, the contribution of the energy

85Statistical units and data items 85
industry to total employment, as well as allowing for the assessment of labour input and labour efficiency in energy production.
6.87. Gross fixed capital formation is measured by the total value of a producer’s acquisitions, less disposals, of fixed assets during the accounting period, plus certain specified expenditures on services that add to the value of non-produced assets. It should include the value of all durable goods expected to have a productive life of more than one year and intended for use by the establishment (land, mineral deposits, timber tracts and the like, buildings, machinery, equipment and vehicles). This data item is a measure of the investments of an economic entity and should be disaggregated by type of asset to provide a basis for a more comprehensive evaluation of the performance of energy industries.
5. Data items on mineral and energy resources
6.88. Data items on mineral and energy resources are important for the assessment of their availability in the environment, as well as for the assessment of their depletion. This information is often used in the compilation of asset accounts in the SNA, as well as in SEEA-Energy. This section is based on the work that has been carried out in the preparation of SEEA-Energy.
6.89. The mineral and energy resources relevant for energy statistics and accounts are a subset of the resources defined in the SEEA Central Framework and comprise the following.
Table 6.1
Mineral and energy resources relevant for energy56
Oil resources
Natural gas resources
Coal and peat resources
Uranium and other nuclear fuels
6.90. The United Nations Framework Classification for Fossil Energy and Mineral Reserves and Resources (UNFC 2009) provides a scheme for classifying and evaluating these resources according to three dimensions, namely, their economic and social viability, the field project status and feasibility, and the geological knowledge about these resources. SEEA-Energy groups the detailed categories of UNFC into three aggregated classes characterizing the com-mercial recoverability of the resources as follows.57
Table 6.2
Categorization of mineral and energy resources relevant for energy
Class A: Commercially recoverable resources
Class B: Potentially commercially recoverable resources
Class C: Non-commercial and other known deposits
6.91. The data items on mineral and energy resources consist of the items presented below covering the opening and closing stock levels of the energy resources by type of resources (oil resources, natural gas resources, etc.) and by type of characteristics (commercially recover-able, etc.).
56 See SEEA-Energy, table 2.5.
57 See SEEA-Energy, table 5.1 for the definition of these categories in terms of UNFC 2009.

International Recommendations for Energy Statistics (IRES)86
Item number Data item
8.1 Opening stocks of mineral and energy resources (by type of resources and by type of characteristics)
8.2 Closing stocks of mineral and energy resources (by type of resources and by type of characteristics)
6.92. The opening and closing stocks of mineral and energy resources58 refer to the amount of the resource at the beginning and end of the reference year by type of resources (as classified in table 6.1) and type of characteristics (as classified in table 6.2).
6.93. It should be noted that these data are generally estimated by geological institutes through geological modelling and not directly collected by the statistical agency in charge of the compilation of energy statistics.
58 It is important to note that the term stocks is here understood as in the context of SEEA and SNA, where it is used to designate any point-in-time accumulation within the economy, whether they are mineral and energy resources or energy products. What is called stocks in energy statistics is referred to as inventories in the context of SNA and SEEA.
87
Chapter VII
Data collection and compilation
7.1. Energy data collection and compilation are difficult tasks, and country practices in this respect vary significantly. Countries should make efforts to learn from the experiences of others, share best practices and promote relevant standards and strategies that will improve the overall quality of energy data, including their completeness and international compar-ability. To assist countries in these activities, this chapter discusses the role of legal frame-works and institutional arrangements in data collection, followed by a discussion of data collection strategies, data sources and data compilation methods.
A. Legal framework7.2. The existence of a strong legal framework is one of the most important prerequisites for establishing a sound national statistical system in general and a national system of energy statistics in particular. The legal framework is provided by statistical laws and other applica-ble national laws and regulations that, to different degrees, specify the rights and responsi-bilities of entities that collect data, provide data, produce statistics or use statistical outputs. For example, data obtained by conducting statistical surveys depend on statistical laws and energy-related legislation and regulations, while data on imports and exports of energy are subject to customs laws and regulations.
7.3. The establishment of a legal framework to make reporting of energy data mandatory through well-designed channels and instruments is of great importance to ensuring the com-pilation of high-quality energy statistics. Although many countries lack such a legal frame-work, it is important to recognize it as the preferred option. For such a framework, energy min-istries or energy agencies maintain administrative records relevant to energy statistics, while national statistical offices organize data collection from entities that produce energy products as a primary or secondary activity and from energy users. The legal framework should not only enable efficient data collection but deal adequately with confidentiality issues, providing necessary protection to data reporters (see chapter X for further discussion of confidentiality).
7.4. The legal framework should also describe responsibilities for collection, compilation and maintenance of the different data components among different government bodies, tak-ing into account the variety of public policy objectives, and the changes brought about by market liberalization that often increase the difficulty of obtaining data given the growing number of participants in energy industries and the commercial sensitivities around data disclosure in an ever more competitive market.
7.5. It is recommended that, whenever appropriate, national agencies responsible for the compilation and dissemination of energy statistics actively participate in the discussions on national statistical legislation or relevant administrative regulations in order to establish a solid foundation for high-quality and timely energy statistics, with a view to mandatory reporting, whenever appropriate, and adequate protection of confidentiality. Also, such par-ticipation would strengthen the agencies’ responsiveness to the data requirements and priori-ties of the user community.
International Recommendations for Energy Statistics (IRES)88
B. Institutional arrangements7.6. The legal framework creates a necessary, but not sufficient, foundation for energy statistics. To ensure that these statistics are collected and compiled in the most effective way, establishing appropriate institutional arrangements among all relevant governmental agencies is of paramount importance.
7.7. Members of a national system of energy statistics. A national system of energy sta-tistics consists of various governmental agencies engaged in the collection, compilation and dissemination of energy statistics. The most important members of such a system are national statistical offices and specialized governmental agencies responsible for the implementation of energy policies (e.g., energy ministries). However, the complex and vast nature of energy supply and use and the liberalization of the energy markets in many countries have resulted in an increasing number of governmental agencies and other organizations collecting data and maintaining databases on energy, such as chambers of commerce, industry associations, regional offices, etc. This represents, on the one hand, a great potential for reducing the response burden and improving timeliness of the data, but, on the other, poses great chal-lenges to ensuring the harmonization of data as the underlying concepts, definitions, methods and quality assurance applied by different agencies might vary significantly.
7.8. Purposes of institutional arrangements. To function efficiently, a national system of energy statistics should be based on appropriate institutional arrangements among many relevant agencies. Such arrangements should allow for the collection, compilation, stand-ardization and integration of information scattered among different entities and for the dis-semination of the compiled statistics to users through a coherently networked information system or a central energy database. The institutional arrangements should also promote harmonization with international standards and recommendations to enable the collection of high-quality and internationally comparable official energy statistics. Last but not least, effi-cient institutional arrangements will not only minimize the data collection cost for agencies involved by avoiding duplication of work and enabling the sharing of good practices, but will also result in a reduced response burden on data reporters due to improved communication and coordination among data collectors.
7.9. Governance of the national system of energy statistics. A key element of the insti-tutional arrangements is the establishment of a clear, efficient and sustainable system of gov-ernance of the national system of energy statistics. Depending on a country’s legislation and other national considerations, various agencies might lead the system and be responsible for official energy statistics. These can be national statistical offices, energy ministry or agency, or another specialized governmental agency. It is imperative that the lead agency ensures the necessary coordination of work, thus resulting in energy statistics that comply with the qual-ity standards as described in chapter X.
7.10. Mechanism for functioning of the system. In order to guarantee the successful func-tioning of a national system of energy statistics, it is vital that all stakeholders are actively involved. It is recommended that countries develop an appropriate interagency coordina-tion mechanism that, while taking into account existing legal constraints, would systemati-cally monitor performance of the national system of energy statistics, motivate its members to actively participate in the system, develop recommendations focused on improving the system’s functioning, and have the authority to implement such recommendations. Such a mechanism should address, among others, the issue of statistical capacity, as the lack of funding and human resources is a persistent problem in many countries. In this context, the proper allocation of responsibilities to agencies, as well as the convening of joint training courses and workshops on energy matters to further develop the skills and knowledge of the staff, can be of great help.
89Data collection and compilation 89
7.11. Models for the organization of a national system of energy statistics vary from a cen-tralized system, in which one institution is in charge of the whole statistical process (from the collection and compilation to the dissemination of statistics), to a decentralized system, in which several institutions are involved and are responsible for different parts of the process or different components of energy statistics.
7.12. It is recognized that different institutional arrangements (depending on the structure of a country’s government, legal framework and other national considerations) can result in high-quality energy statistics, provided that the overall national system follows internation-ally accepted methodological guidelines, utilizes all available statistical sources and applies appropriate data collection, compilation and dissemination procedures. Effective institutional arrangements are usually characterized by:
(a) The designation of only one agency responsible for the dissemination of official energy statistics or, if this is not possible, the identification of agencies responsible for the dissemination of specific data subsets and mechanisms that will ensure overall consistency of energy statistics;
(b) A clear definition of the rights and responsibilities of all agencies involved in data collection and compilation;
(c) The establishment of formalized working arrangements between them, including agreements on holding inter-agency working meetings and on access to relevant microdata collected by those agencies. The formal arrangements should be com-plemented by informal agreements among the involved agencies and institutions as required.
7.13. It is recommended that countries consider the establishment of the institutional arrangements necessary to ensure the collection and compilation of high-quality energy sta-tistics as a matter of high priority and periodically review their effectiveness.
7.14. Whatever the institutional arrangement, the national agency that has the overall responsibility for the compilation of energy statistics should periodically review the defini-tions, methods and the statistics themselves to ensure that they comply with relevant inter-national recommendations and recognized best practices, are of high quality, and are avail-able to users in a timely fashion. If such an agency is not designated, then an appropriate mechanism should be put in place to ensure that those functions are performed consistently and effectively.
C. Data collection strategies7.15. The collection of energy data can be a complex and costly process, which very much depends on a country’s needs and circumstances, including the legal framework and insti-tutional arrangements. Therefore, it is important that countries undertake it on the basis of well-thought-out strategic decisions regarding the scope and coverage of data collection, organization of the data collection process, selection of the appropriate data sources and use of reliable data collection methods.
1. Scope and coverage of data collection
7.16. The scope and coverage of the collection of energy statistics are defined according to:(a) Conceptual design, which includes the objective and thematic coverage; (b) Target population; (c) Geographical coverage;
International Recommendations for Energy Statistics (IRES)90
(d) Reference period of data collection;
(e) Frequency with which data are to be collected;
( f ) Point in time of collection.
7.17. Conceptual design. The overall objective of the data collection should be defined clearly. The thematic coverage must take into account the type of statistics to be collected, for example, the flows and stocks of energy products and the units of measurement. International standards should be applied in the conceptual design process.
7.18. Target population. Good knowledge of the main groups of data reporters is required for an efficient data collection, so that data collection methods can be customized as neces-sary. It is recommended, as applicable, that at least the following three reporter groups be distinguished: energy industries, other energy producers and energy consumers.
7.19. Energy industries (see chapter V for definition) are represented by various entities whose principal activity is directly related to energy production and which often concentrate on one particular fuel or one part of the overall energy supply chain. Detailed information is compiled by the energy industry entities themselves on a regular basis for management pur-poses, as well as for reporting to government regulatory bodies. Therefore, statistical data can often be obtained without too much delay from those entities directly or from administrative records maintained by regulatory bodies, when the proper data collection mechanisms exist.
7.20. The entities belonging to the energy industries can be differentiated, according to their ownership status, as private industries, public industries and public-private industries. The degree to which a central government is directly involved in the industries can have a significant effect on both the ease with which data may be collected, and the range of data that will be considered reasonable to collect. Given that such industries can provide data on most energy flows, they need to be treated with special attention and be fully enumerated in statistical surveys or covered using appropriate administrative sources (see section on data sources for details). When the number of energy industry entities is large and the energy statistics compiler has no direct contact with the original sources, it is common for industrial associations, regional offices or civil organizations to act as intermediate data collectors and reporters to simplify the data collection process. However, in such a case, efforts should be undertaken to ensure that data quality is not compromised.
7.21. Other energy producers include those economic units (including households) that produce energy for self-consumption; they may sometimes supply it to other consumers, but not as part of their principal activity (see chapter V for details). Since these activities are not the principal objective of these companies and since they may be partially or fully exempt from the provisions of energy legislation and regulations, it cannot be expected that they will have the same amount of detailed information readily.
7.22. Even though in most cases other energy producers account for only a small part of the national energy production, it is important that they are included in national energy statistics to properly account for their energy needs and measure their energy efficiency. In countries where other energy producers play a significant role in the national aggregate of energy supply and consumption, appropriate procedures have to be devised to obtain more adequate data from them. In some countries, the auto-production of electricity and heat (see chapter V for details) requires governmental authorization, which facilitates the monitoring of these companies and creates the means for obtaining the required data.
7.23. Energy consumers can be grouped according to the energy needs of the economic activity under which they are classified, such as industry, households, etc. (see chapter V for details). Data collection from energy consumers is complex since it has to take into account
91Data collection and compilation 91
their diversity, mobility and multipurpose forms. To facilitate this task, specific methodolo-gies and compilation strategies must be designed for the different subgroups of consumers, given their particularities.
7.24. It is usually the case that energy producers can provide data on how much energy in total is being delivered to energy consumers, and often may also be able to provide a break-down of total deliveries by the various consumer groups taking into account differences in applicable tariffs and/or taxes. However, in order to fill the remaining data gaps and obtain more detailed information (e.g., in the case of energy balance compilation), direct consumer surveys might be necessary. The coherence between data based on the information about energy deliveries to final consumers and the information reported by consumers must be ensured. In some other cases, for example solid biomass fuels, information will most likely be obtained through surveys and consumer-derived measurements, rather than from energy producers, thus avoiding potential producer-consumer data mismatch.
7.25. Collection of energy data from the informal sector. The informal sector has been defined by the Fifteenth International Conference of Labour Statisticians 59 according to the types of production units of which it is composed. It consists of a subset of household unin-corporated enterprises, with at least some production for sale or barter, operating within the production boundary of the SNA. As household production units, these enterprises do not constitute separate legal entities independent of the households or household members that own them, and no complete sets of accounts (including balance sheets of assets and liabil-ities) are available that would permit the production activities of the enterprises to be clearly distinguished from the other activities of their owners, nor any flows of income and capital between the enterprises and the owners to be identified.
7.26. An energy producing unit in the informal sector may be defined as a household enter-prise with at least some production of energy for sale or barter that meets one or more of the following criteria: limited size in terms of employment; non-registration of the enterprise; and non-registration of its employees. The informal sector thus defined excludes household enterprises producing energy exclusively for own final use. The area-based enterprise survey approach is commonly used to collect data from such enterprises, as a satisfactory list of such enterprises is normally not available.60
7.27. Geographical coverage. The geographical coverage identifies the area for which the statistics are collected. In general, for policy purposes it is fundamental to collect statistics at the national level. However, for analytical and policymaking purposes it is often the case that countries compile their energy statistics at a subnational level, which implies a more detailed geographical coverage. The collection of energy statistics at the subnational level is often essential in planning future infrastructure, as it allows the different locations of produc-tion and consumption to be taken into account. Where consumption is concerned, regional disaggregation is necessary, since energy use could vary significantly according to climate, local behaviour, customs, economic activities, incomes, availability of energy products, etc. The collection of such detailed information often implies a higher data collection cost and requires additional methodological efforts to ensure that there are no omissions or double-counting in the results when collating regional data up to the national level.
7.28. Reference period of data collection. The reference period of the energy data collected refers to the time period that the data relate to. For example, oil production data may have a reference period of one month, energy use data collected from households may have a refer-ence period of one quarter and energy behaviour data (e.g., data on measures taken to reduce energy use) may have a reference period of one year.
59 Resolution concerning statistics of employment in the informal sector, adopted by the Fifteenth International Conference of Labour Statisticians (January 1993). Available from www.ilo .org/public/english/bureau/stat /download/res/infsec.pdf.
60 For details on issues such as the identification of statistical units applicable in the case of the informal sector and the organi-zation of surveys of the informal sector, see the International Recommendations for Industrial Statistics (UN 2009b) (chapter 2, section F, and chapter 6).
International Recommendations for Energy Statistics (IRES)92
7.29. Frequency of data collection. The frequency of collection of energy data adopted by a given country is the result of a balance between users’ needs, the priority given to timeliness of particular data items, the level of detail required, the availability of data and the available resources. Comprehensive annual data should be the initial objective when setting up an energy statistics programme. However, higher frequency (infra-annual) collections are critic-ally important for the timely assessment of a fast-changing energy situation, and countries are encouraged to conduct them on a regular basis within the identified priority areas of energy statistics. The various frequencies of data collection are further outlined below.
Annual data collections. These collect energy data relating to the basic and most appropriate information needs. In general, they cover production, supply and con-sumption at a detailed level of disaggregation for any energy products that make up a significant share of total energy supply.Infra annual data collections (quarterly, monthly, etc.). These are conducted when the need for frequent data is of high priority (e.g., monthly oil production and trade) but are usually more restricted in the level of detail (for example, total consumption rather than consumption by consumer groups) than those collections carried out annually, as higher frequency leads to increased costs and reporting burden.Infrequent data collections (less frequent than annual). These are generally con-ducted by countries, either for specialized topics (e.g. deployment of fuel cells), to fill in gaps in the data collected annually or infra-annually (e.g. more accurately ascertaining sub-sector breakdowns of minor products), to provide baseline information, or where data collection is particularly expensive (e.g., large consumer surveys or censuses).
7.30. Point in time of collection. The point in time when the collection is carried out should also be carefully considered, since this may have an impact on the response rate (e.g., avoid sending questionnaires during holiday periods, overlap with other surveys, as well as with administrative data collections such as tax filing).
2. organization of data collection
7.31. Proper organization of the data collection process is fundamental for official energy statistics. The first important step in data collection is to identify the production, supply, transformation and consumption flows for each fuel in order to clarify the processes, pro-cedures and the statistical units involved. Then it is necessary to outline the potential data sources for each flow to determine whether it is feasible to obtain accurate information on a regular basis from them, making use of the information they already hold for their own management purposes. From these descriptions it can be determined what kind of energy data can be obtained from different sources, and the process can be planned accordingly.
7.32. In general, data collection relies on the legal framework and institutional arrange-ments of the country, as well as on the use of agreed collection methods, such as the use of statistical business registers, administrative data and census or sample surveys, to obtain comprehensive data. The most appropriate collection method should be selected, taking into consideration the nature and specific characteristics of the given energy activity, the avail-ability of the required data, and the budget constraints that might affect the implementation of the collection strategy.
7.33. An integrated approach to collection of energy statistics. The collection of energy data should be seen as an integral part of the data collection activities of the national statistical system in order to ensure the best possible data comparability and cost efficiency. In this con-text, close collaboration between energy statisticians and compilers of industrial statistics, as well as statisticians responsible for conducting household, labour force and financial surveys,
93Data collection and compilation 93
is of paramount importance and should be fully encouraged and systematically promoted. A collaborative relationship will create a better understanding of the information, provide an opportunity to incorporate energy items into non-energy specific questionnaires, taking into account the priorities and specific needs of the energy industries, and facilitate the conduct of a cost-benefit analysis.
7.34. The establishment or improvement of the regular programme of energy data collection should be part of a long-term strategic plan in the area of official statistics. Such a programme should be properly designed and executed in order to obtain the widest possible coverage and ensure the collection of accurate, detailed and timely energy statistics.
7.35. An integrated approach is especially important for the collection of data on energy consumption, as many different data sources can be used. Data can be obtained directly or indirectly from appropriate economic units (i.e., enterprises or establishments and house-holds) by means of censuses, surveys and/or administrative records. Given that the number of energy consumers is larger than energy suppliers, it may be necessary to exploit existing business surveys to identify those establishments that will be required to answer specific ques-tions on energy consumption. Consistency of data on energy consumption collected from various sources should be ensured.
D. Data sources7.36. The generation of energy statistics is based on data collected from two main sources:
Statistical data sources that provide data collected exclusively for statistical purposes from censuses and/or sample surveys; andAdministrative data sources that provide data created originally for purposes other than the production of statistical data.
1. Statistical data sources
7.37. The typical statistical data sources for compiling energy statistics are surveys of the units in the population under consideration. The surveys are done either by enumerating all the units in the population (census) or a subset of representative units scientifically selected from the population (sample survey).
7.38. In general, censuses represent a time-consuming, resource-intensive and costly exercise for the collection of energy statistics and imply a high overall response burden on the popula-tion. For these reasons, it is unlikely that censuses will be used very often. However, depend-ing on the population of interest, the available resources and the particular circumstances in a country, conducting a census may be a viable option for collecting energy statistics. A complete census of units in the energy industry may be appropriate when, for example, a particular country does not maintain an up-to-date business register, there are few energy producers (in such a case they should be included in a “take all” stratum of appropriate sur-veys), or there is significant user interest for detailed energy data.
7.39. Sample surveys are used to collect information from a portion of the total population, called a sample, in order to draw inferences on the whole population. They are almost always less costly than censuses. There are different types of surveys that can be used in energy statistics depending on the sampling units: (i) enterprise surveys, (ii) household surveys and (iii) mixed household-enterprise surveys. In general, it is recommended that countries make efforts to establish a programme of sample surveys that would satisfy the needs of energy statistics in an integrated way (i.e., as part of an overall national sample survey programme of enterprises and households) to avoid duplication of work and minimize the response burden.
International Recommendations for Energy Statistics (IRES)94
Survey design
7.40. Before carrying out a survey, it is fundamental to have a proper survey design. To achieve this goal, a number of steps are needed. First, the particular information needs should be identified and the specific goals of the project established, placing special emphasis on priorities, feasibility, budget and geographic breakdown. In order to do so, it is necessary to make use of the experience gained in similar projects in other areas of statistics, and take into account relevant international recommendations (e.g., those published in International Rec-ommendations for Industry Statistics 2008) and the provisions of relevant applicable national laws and regulations. This phase requires the expertise of professionals in the specific subject area being covered, such as specialists in energy matters, as well as specialists in sample design, interviewing techniques, analysis procedures, etc. Given the above, participation and cooperation among national statistical office, different ministries and academic institutions are crucial.
7.41. Ideally, energy surveys must be designed to ensure their regular conduct. For this reason, it is recommended that the periodicity of such surveys be established from the very beginning. Countries are encouraged to ensure that the survey design is optimized, keeping in mind the desirable use and inferences from the expected results, while information not essential for survey purposes should be avoided as much as possible. Considering the cost of conducting such surveys, the survey must be designed in such a way as to guarantee the greatest benefits from the analytical results and ensure their consistency over time.
7.42. Once the specific topic(s) of the survey are determined, the next stage is to select the data items using those presented in chapter VI as a reference list and ensuring that the selec-tion is done according to an appropriate classification and precise definition of each of the concepts used in the data items definitions.
7.43. Selecting the target population or sample is critical to successfully meeting the goals of the survey. Within this phase, the number of units to be interviewed must be decided in order to ensure representativeness, taking into account the time availability, budget constraints and necessary degree of precision. The sampling technique used will depend on the population or populations being sampled, as well as on the information available from other regular survey programmes and business registers that may provide a better picture and context of the project being considered.
7.44. The design of the questionnaires and supplementary documentation should follow. Deciding on the interviewer’s profile, the interviewing method best suited for the survey’s purpose (personal interviews, telephone surveys, mail surveys, computer-direct interviews, email surveys, Internet surveys and others), the temporal scope of the data items and the way each of them and related concepts will be presented and asked are essential for good questionnaire design. Determining the type of questions and their sequence comes next, paying special attention to using clear, direct and straightforward language. The use of proper measurement units in terms of which the answers should be provided is also significant and depends largely on who is being interviewed. For example, small units of measurement such as kilowatt-hour, cubic metre, etc., are perfectly proper for consumers or gasoline stations, but not for energy supply industries.
7.45. Another important part of the survey design is the preparation of concise and clear instructions to help clarify any questions that potential respondents might have. It is impor-tant to mention that the survey design should be adapted as required according to the specific context, geographical scope, informant, interviewer and planned procedures. The question-naires must be tested in a context similar to the one in which they will be applied prior to the finalisation of the required adjustments. For example, interviewers need to be carefully
95Data collection and compilation 95
trained in the techniques to be used for measuring different fuels. In some cases, especially for measuring biomass, the availability of measurement instruments (e.g., scales for fuelwood and charcoal) for the physical measurement of fuels actually consumed is extremely important and should be ensured where possible.
Enterprise surveys
7.46. Enterprise surveys are surveys in which the sampling units comprise enterprises (or statistical units belonging to these enterprises such as establishments or kind-of-activity units) in their capacity as the reporting and observation units from/about which data are obtained. They assume the availability of a sampling frame of enterprises. Depending upon the source of the sampling frame, such surveys may also be classified as either list-based or area-based. In a list-based survey, the initial sample is selected from a pre-existing list of enterprises or households. In an area-based survey, the initial sampling units are a set of geographical areas. After one or more stages of selection, a sample of areas is identified within which enterprises or households are listed. From this list, the sample is selected and data collected. In general, it is preferred to use list-based surveys as it may be difficult to enumerate the enterprises within an area, and area-based sampling is inappropriate for (large or medium-sized) enterprises that operate in several areas because of the difficulty of collecting data from just those parts of the enterprises that lie within the areas actually selected. A stratified sampling technique should be used whenever appropriate and feasible to improve accuracy of data.
7.47. Use of business register. In principle, the sampling frame should contain all the units that are in the survey target population, without duplication or omissions. The business reg-ister maintained by countries for statistical purposes provides such a population. In general, a statistical business register is a comprehensive list of all enterprises and other units, together with their characteristics, that are active in a national economy. It is a tool for conducting statistical surveys, as well as a source for statistics in its own right. The establishment and maintenance of a statistical business register in most cases are based on legal provisions, as its scope and coverage are determined by country-specific factors. It is recommended, as the best option, that the frame for every list-based enterprise survey for energy industries be derived from a single general-purpose statistical business register maintained by the statistical office, rather than from stand-alone registers for each individual survey.
7.48. For countries not maintaining an up-to-date business register, it is recommended that the list of enterprises drawn from the latest economic census and amended as necessary, based on relevant information from other sources, be used as a sampling frame.
Ad hoc energy statistics surveys
7.49. Specially designed energy statistics surveys are extremely useful to compensate for the lack of information and gaps associated with the mechanisms and instruments mentioned above. Examples of ad hoc energy statistics surveys are energy consumption surveys designed specifically to measure the quantities of energy products consumed. The sampling unit is likely to be the household and possibly sites of small-scale rural industries below the normal threshold for sample enquiries. Data generally cover the weights (or volumes, if realistic conversions to weight can be made later) of different fuels consumed for different purposes. If there is a seasonal pattern of fuel usage, interviews will have to be spread over the entire year in order to be representative of all seasons. Results will need to be analysed by size of household in order to obtain a range of per capita consumption figures.
7.50. The design and implementation of such surveys may be demanding in terms of finan-cial and human resources and often require multidisciplinary expertise in order to identify

International Recommendations for Energy Statistics (IRES)96
the appropriate sample design, interviewing techniques and analysis procedures. In general, ad-hoc energy statistics surveys are very useful instruments for assessing energy consumption activities, monitoring the impacts of energy programmes, tracking the potential for energy efficiency improvements and targeting the feasibility of future programmes.
Household surveys and mixed household-enterprise surveys
7.51. Household surveys are surveys in which the sampling units are the households. In mixed household-enterprise surveys, a sample of households is selected and each household is asked whether any of its members own and operate an unincorporated enterprise (also called informal sector enterprise in developing countries). The list of enterprises thus compiled is used as the basis for selecting the enterprises from which desired data are finally collected. Mixed household-enterprise surveys are useful for covering unincorporated (or household) enterprises which are numerous and cannot be easily registered.61
7.52. Even though household surveys are not designed specifically for energy data com-pilation, they can give a broad overview of residential energy consumption by end-use and, potentially, of energy production by households. Given the complexity of energy consump-tion characteristics in households, estimates and other measurements of energy consump-tion should be derived from such surveys, using the metadata provided by them. For energy purposes, useful information is related to the number and average size of households, appli-ance penetration and ownership, appliance attributes and usage parameters, fuels used for cooking and for heat and air conditioning, electricity sources (national grid, solar electricity, auto-production, etc.), and types of bulbs used for illumination, etc. It is to be noted that the characteristics of household appliances stock, such as age and efficiency, can also be deter-mined through the use of administrative registers or surveys on appliance sales.
7.53. The frequency of these household surveys is another key element in efforts to obtain information on a regular basis, given that the behaviour in this sector often shows high variation due to changes in prices, technologies and fuel availability. The appearance on the market of new household appliances creates new energy consumption habits that should be taken into account.
7.54. These surveys should be representative not only at national level but also in rural and urban areas and by regions in order to achieve a proper analysis of the data.
2. Administrative data sources
7.55. Publicly controlled administrative data sources. Data may be collected by diverse governmental agencies in response to legislation and/or regulations to: (i) monitor activities related to production and consumption of energy; (ii) enable regulatory activities and audit actions; and (iii) assess outcomes of government policies, programmes and initiatives.
7.56. Each regulation/legislation (or related group of regulations/legislations) usually results in a register of the entities (enterprises, households, etc.) bound by that regulation/legislation and in data resulting from application of the regulation/legislation. The register and related data are referred to collectively as administrative data. The data originating from administra-tive sources can be effectively used in compiling energy statistics.
7.57. There are a number of advantages in the use of administrative data, the most impor-tant of which include the following: reduction of the overall cost of data collection; reduction of the response burden; smaller errors than those arising from a sample survey (due to the complete coverage of the population to which the regulation/legislation applies); sustainability due to minimal additional cost and long-term accessibility; regular updates; possible absence
61 See IRIS 2008, paras. 6.19–6.24 for a description of advantages and disadvantages of mixed household-enterprise surveys.
97Data collection and compilation 97
of a survey design, sample measure and data editing; possibility of cooperation between various agencies, which could lead to feedback on the compiling process and acknowledge-ment of diverse areas of interest; potential data quality improvement; potential recognition of administrative data uses; opportunity to link data from diverse sources; development of statistical systems within agencies; and possible use as a framework for statistical surveys.
7.58. However, since administrative data are not primarily collected for statistical purposes, it is important, when using such data, that special attention be paid to their limitations and efforts made to ensure that their description is given in the relevant metadata. Possible limita-tions in the use of administrative data include: inconsistencies in the concepts and definitions of data items; deviation from the preferred definition of the statistical units; the legislation/regulation may differ from the desired survey population; poor quality data due to lack of quality assurance of the administrative data; possible breaks in the time series because of changes in regulations/legislations; and legal constraints with respect to access and confiden-tiality (see chapter X for further discussion of confidentiality).
7.59. It is important that compilers of energy statistics identify and review the available administrative data sources in their country and use the most appropriate ones for collecting and compiling energy statistics. This significantly reduces the response burden and survey costs. The relative advantages and disadvantages mentioned above are not absolute. Whether they apply and the extent to which they do depend on the specific country situation. Exam-ples of administrative data sources important for energy statistics include customs records (for imports/exports of energy products), value added tax (VAT), specific taxes (or excise duty) payable on specific fuels (gasoline and diesel for road use) or energy types (e.g., carbon tax), and regulated electricity and gas market meter operator systems.
7.60. Privately controlled administrative data sources. Data may be collected by privately controlled organizations, such as trade associations. This is typically done to assist the indus-try in understanding important aspects of its own operations. These data are often also important to governments and decision- and policymakers. The statistical agency responsible for energy statistics should work cooperatively with these private organizations to gain access to such data, in order to maximise their statistical value. This would keep the reporting burden on the industry to a minimum by not requiring the businesses to report to both the private organization and the statistical agency. However, if agreement cannot be reached, the statistical agency may need to require that the data be submitted to them directly. Every effort should be made to establish proper cooperation between private organizations and the statistical agency. Statistical agencies must ensure the quality and objectivity of data being provided by these organizations, as data collection is not their primary activity, and they may be functioning as industry advocates.
E. Data compilation methods7.61. Data compilation, in general, refers to the operations performed on collected data to derive new information according to a given set of rules (statistical procedures), with a view to producing various statistical outputs. In particular, data compilation methods cover: (a) data validation and editing; (b) imputation of missing data; and (c) estimation of popula-tion characteristics. These methods are used to deal with various problems with collected data, such as incomplete coverage, non-response, out-of-range responses, multiple responses, inconsistencies or contradictions and invalid responses to questions. These problems may be caused by deficiencies in the questionnaire design, lack of proper interviewer training, errors by the respondent providing the data and/or errors related to the processing of the data. It is advisable to periodically generate reports specifying the frequency with which each of
International Recommendations for Energy Statistics (IRES)98
the problems occurs, thus identifying the main sources of error and making the necessary adjustments in future data collection processes. A brief overview of the recommended data compilation methods is provided below.62
7.62. Data validation and editing is an essential process for assuring the quality of the col-lected data and refers to the systematic examination of data collected from respondents for identifying and eventually modifying inadmissible, inconsistent and highly questionable or improbable values according to predetermined rules. It is important to define validation cri-teria that clearly and systematically confirm whether or not the data satisfy the requirements of completeness, integrity, arithmetic consistency and congruence, as well as guarantee their overall quality. Validation criteria are established by the statistical authority according to the nature of the data and the analysis of the variables of interest, taking into account magnitude, structure, trends, relationships, causalities, interdependencies and possible response ranks.
7.63. In recognizing the importance of the data validation and editing, it should be empha-sized that any arbitrary alteration of the data should not be allowed, and any changes in the collected data should be based on the relationship between variables and response values. To prevent out-of-range responses and inconsistencies, appropriate response ranges for each question and the congruence that must exist between responses from related questions must be established. For example, checking that the sum of available supplies equals the sum of recorded uses is an important validation criterion. This is also valid for routine questionnaires directed to the energy industries.
7.64. As validation and editing can be very expensive components of the survey process, attention should be focused on the most important areas and issues. For example, many survey responses may have minimal impact on the final results, and effort to correct errors in such responses may be ineffective. To maximize the effectiveness of the validation and editing process, the responses that will have the greatest impact on the final results should be identified prior to the start of the actual process, so that resources can be properly allocated.
7.65. Data imputation. Imputation refers to replacing one or more erroneous responses or non-responses with plausible and internally consistent values in order to produce a complete data set. It is used for estimating missing data values when, for example, the respondent has not answered all relevant questions but only part of them, or when the answers are not logic-ally correct. There are a variety of imputation methods ranging from simple and intuitive to rather complicated statistical procedures.
7.66. The choice of methods for imputation depends on the objective of the analysis and the type of missing data. No method is superior to others in all circumstances.63 In most imputation systems a mix of imputation methods is used. The following are the desirable properties of all imputation processes:
(a) The imputed records should closely resemble the missing or failed edit record, retaining as much respondent data as possible. Thus, the number of imputed data items should be kept to a minimum;
(b) The imputed records should satisfy all edit checks;
(c) The imputed values should be flagged and the used methods and sources of imputation described in the metadata.
7.67. It is recommended that compilers of energy statistics use imputation as necessary, with the appropriate methods consistently applied. It is further recommended that these methods comply with the general requirements as set out in international recommenda-tions for other domains of economic statistics, such as the International Recommendations for Industrial Statistics (UN 2009b).
62 More information on the differ-ent techniques used in data com-pilation is found, for example, in IRIS 2008.
63 For more information on imputa-tion options in the case of item non-response or unit non-response, see IRIS chapter VI.B.2.

99Data collection and compilation 99
7.68. Grossing up procedures. After the data have been validated and edited, and impu-tations corrected for non-response and erroneous responses, special procedures should be applied to the sample values to estimate the required characteristics of the total population (these are referred to as grossing up procedures). These procedures consist of raising the sample value with a factor based on the sampling fraction in order to obtain the levels of data for the sample frame population. In some cases, depending on the relationship with other vari-ables for which data may exist, more sophisticated statistical techniques can be used for this purpose. As the application of estimation procedures is a complex undertaking, it is recom-mended that specialist expertise always be sought for this task.
7.69. The treatment of outliers is an important estimation consideration, particularly in energy statistics. Outliers are reported data that are correct but are unusual in the sense that they do not represent the sampled population and hence may distort the estimates. If the sampling weight is large and the unadjusted outlier value is included in the sample, the final estimate will be inappropriately large and unrepresentative, as it is driven by one extreme value. The simplest way to deal with such an outlier is to reduce its weight in the sample so that it represents itself only. Alternatively, statistical techniques can be used to calculate a more appropriate weight for the outlier unit. The details on the treatment of outliers should be provided in the metadata.

101
Chapter VIII
Energy balances
A. Introduction8.1. Concept of energy balances. An overall energy balance (referred to as “energy bal-ance” in the rest of the chapter) is an accounting framework for the compilation and reconcili-ation of data on all energy products entering, exiting and used within the national territory of a given country during a reference period. Such a balance must necessarily express all forms of energy in a common accounting unit and show the relationship between the inputs to and the outputs from the energy transformation processes. The energy balance should be as complete as possible so that all energy flows are, in principle, accounted for. It should be based firmly on the first law of thermodynamics, which states that the amount of energy within any closed system is fixed and can be neither increased nor diminished unless energy is brought into or sent out from that system.64
8.2. Balances can also be compiled for any particular energy product (energy commodity) and, in these cases, are referred to as energy commodity balances or, for brevity, commod-ity balances. Commodity balances follow the general structure of energy balances but focus on single energy products and display some presentational differences (see section F of this chapter for details).
8.3. Purpose of energy balances. An energy balance is a multi-purpose tool to:
(a) Enhance the relevance of energy statistics by providing comprehensive and rec-onciled data on the energy situation on a national territory basis;
(b) Provide comprehensive information on the energy supply and demand in the national territory in order to understand the energy security situation, the effec-tive functioning of energy markets and other relevant policy goals, as well as to formulate energy policies;
(c) Serve as a quality tool to ensure completeness, consistency and comparability of basic statistics;
(d) Ensure comparability between different reference periods and between different countries;
(e) Provide data for the estimation of CO2 emissions with respect to the national territory;
( f ) Provide the basis for indicators of each energy product’s role in a country’s econ-omy;
(g) Calculate efficiencies of transformation processes occurring in the country (e.g., refining, electricity production by combustion of fuels, etc.);
(h) Calculate the relative shares of the supply/consumption of various products (including renewables versus non-renewables) of a country’s total supply/con-sumption;
(i) Provide an input for modeling and forecasting.
64 It should be noted that the energy balance as presented in this chapter differs from the energy accounts of the SEEA-Energy, which are developed on the basis of concepts, definitions and classifications of the SNA (see chapter XI for details).
International Recommendations for Energy Statistics (IRES)102
8.4. The multipurpose nature of the energy balance could be further increased by the development of supplementary tables that combine information from the balance with addi-tional information on particular issues that are not explicitly reflected in the balance itself. (see para. 8.50 for further discussion of this issue.)
8.5. Detailed and aggregated energy balances. Energy balances can be presented in both detailed and aggregated formats. The degree of detail depends on the policy concern, data and resource availability, and the underlying classifications used. The energy balance in an aggregated format is usually prepared for dissemination in printed form where the level of aggregation, that is the number of columns and rows, is mainly constrained by practical con-siderations. However, it is recommended that countries collect data at the level of detail that allows for the compilation of a detailed energy balance, as presented in table 8.1. When such a level of detail is not available or practical, it is recommended that countries, at a minimum, follow the template of the aggregated energy balance presented in table 8.2.
B. Scope and general principles of energy balance compilation
8.6. The scope of an energy balance is determined, inter alia, by the territory, product and flow boundaries:
(a) Territory boundary—defined by the boundary of the national territory of the compiling country (see chapter II for details);
(b) Product boundary—defined by the scope of all energy products shown in the balance columns (see chapter III for details);
(c) Flow boundary—defined by the scope of energy flows shown in the balance rows (see chapter V for details).
8.7. The product and flow boundaries are fixed in the short term. However, as technol-ogy advances, new sources of energy may become available and should be reflected in the balances when used.
8.8. The scope of an energy balance does not include:
(a) Passive energy, such as the heat gain of buildings, solar energy falling on the land to grow crops, etc.;
(b) Energy resources and reserves (which can nevertheless be considered in additional tables);
(c) Extraction of any materials not covered in primary energy production (e.g. natu-ral gas flared or vented). Data on some such materials are included in the data reference list (see chapter VI), and can be shown in an additional table;
(d) Peat, waste and biomass used for non-energy purposes.
8.9. When compiling an energy balance, some general principles on the coverage and structure of the balance should be taken into account. These principles are as follows:
(a) The energy balance is compiled with respect to a clearly defined reference period. In this respect, it is recommended that countries, as a minimum, compile and disseminate an energy balance on an annual basis;
(b) The energy balance is a matrix represented by rows and columns;
(c) Columns represent energy products that are produced and/or are available for use in the national territory;
103Energy balances 103
(d) The column “total” contains cells which provide the sum of the data entries in the corresponding row; however, the meaning of the cells in the “total” column is not the same for all rows of the balance;
(e) Rows represent energy flows;
( f ) A separate row is reserved for statistical difference, calculated as the numerical difference between the total supply of an energy product and the total use of it;
(g) The detailed energy balance should contain sufficient rows and columns to show clearly the relationship between the inputs to and outputs from transformation processes (production of secondary energy products);
(h) All entries should be expressed in one energy unit (it is recommended that the Joule be used for this purpose, although countries could use other energy units such as tons of oil equivalent, tons of coal equivalent, etc.); the conversion between energy units should be through the application of appropriate conver-sion factors (see chapter IV) and the applied factors should be reported with the energy balance to make any conversion from physical units to Joules or other units transparent and comparable;
(i) Net calorific values should be used for measuring the energy content of energy products. If gross calorific values are used in a country because of the recupera-tion of latent heat or for maintenance of historical data series, the corresponding conversion factors should be reported and countries should clearly identify which method is used;
( j) To give a primary energy equivalent to electricity produced from non-combusti-ble energy sources, the physical energy content method should be used. According to this method, the normal physical energy value of the primary energy form is used for the production figure. This is in contrast to the “partial substitution method” which requires assigning to such electricity a primary energy value equal to the hypothetical amount of fuel required to generate an identical amount of electricity in a thermal power station using combustible fuels. If the partial sub-stitution method is used in a country, that country should clearly mention this, together with the average generating efficiency of thermal power stations used to calculate the primary energy equivalent.
In the physical energy content method, the normal physical energy value of the primary energy form is used for the production figure. For primary electricity, this is simply the gross generation figure for the source. Care is needed when expressing percentage contributions from the various sources of national elec-tricity production. As there is no transformation process recognized within the balances for the production of primary electricity, the respective percentage con-tributions from thermal and primary electricity cannot be calculated using a “fuel input” basis. Instead, the various contributions should be calculated from the amounts of electricity generated from the power stations classified by energy source (coal, nuclear, hydro, etc.).
In the case of electricity generation from primary heat (nuclear, geothermal and concentrating solar), the heat is the primary energy form. As it can be difficult to obtain measurements of the heat flow to the turbines, it is recommended that an estimate of the heat input be used based on an efficiency of 33 per cent for nuclear and concentrating solar, and 10 per cent for geothermal as a default, unless country- or case-specific information is available. This means that, in the absence of measurements of the actual heat input, the equivalent primary nuclear or concentrating solar heat is estimated as three times the electricity produced,
International Recommendations for Energy Statistics (IRES)104
and the equivalent geothermal heat is estimated as 10 times the geothermal elec-tricity output.
(k) Production of primary and secondary energy, as well as external trade in energy products, stock changes, final energy consumption and non-energy use should be clearly separated to better reflect the structure and relationships between energy flows and to avoid double-counting.
C. Structure of energy balance: an overview8.10. Structure. An energy balance is a matrix showing the relationship between energy products (represented in columns) and flows (represented in rows). The structuring of an energy balance depends on a country’s energy production and consumption patterns and the level of detail that country requires. However, it is recommended that certain common approaches, described below, be followed to ensure international comparability and consistency.
8.11. Columns. A column refers to a group of energy products. Each cell in this column shows a flow of energy involving this group of products, as defined by the row name. The number of columns depends, among other things, on whether the balance is intended for detailed analysis or is prepared for general dissemination (including printed publications) where space limitations have to be taken into account. In the first case, the energy balance may contain as many columns as needed, while in the second case it should be compact and contain columns that highlight energy products, especially important for the compiling country, as well as columns needed for international reporting and comparisons. Even when only a compact version of the energy balance is compiled and generally disseminated, a more comprehensive electronic version of the energy balance should be made available to users requiring more detailed information.
8.12. Sequencing of columns. While different columns (except “total”) represent various energy products, they might be grouped and sequenced in a way that adds to the analytical value of the balance. In this connection, it is recommended that:
(a) Groups of energy products be mutually exclusive and based on SIEC;(b) The column “total” follow the columns for individual energy products (or groups
of products);(c) The column “total” be followed by supplementary columns containing additional
subtotals such as “renewables”. The definition of such subtotals and any additional clarification on the column’s coverage should be provided in appropriate explana-tory notes.
8.13. Rows. One of the main purposes of an energy balance is to reflect the relation-ships between the primary production of energy (and other energy flows entering/exiting the national territory), its transformation and final consumption. The number of rows and their sequencing in a balance are intended to make those relationships clear, while keeping the balance compact, especially when presented in an aggregated format.
8.14. Sequencing of rows. It is recommended that an energy balance contain three main blocks of rows as follows:
(a) Top block—flows representing energy entering and leaving the national territory, as well as stock changes to provide information on the supply of energy on the national territory during the reference period;
(b) Middle block—flows showing how energy is transformed, transferred, used by energy industries for own use and lost in distribution and transmission;
105Energy balances 105
(c) Bottom block—flows reflecting final energy consumption and non-energy use of energy products.
8.15. A separate row should be reserved for statistical difference and placed between the top and middle blocks of the balances.
1. Top block—energy supply
8.16. The top block of an energy balance—energy supply—is intended to show flows rep-resenting energy entering the national territory for the first time, energy removed from the national territory and stock changes. The entering flows consist of the production of primary energy products and imports of both primary and secondary energy products. The flows removing energy from the national territory are exports of primary and secondary energy products and international bunkers.
8.17. The balance item of the flows described above and the changes in stock represent the amount of energy that is available in the national territory during the reference period. This aggregate is named total energy supply (TES) and calculated as follows:
Total energy supply = Primary energy production+ Import of primary and secondary energy- Export of primary and secondary energy- International (aviation and marine) bunkers- Stock changes
8.18. As a common convention, the figures shown in the published energy balances already carry the sign that would be allocated through the above formula. While this is obvious in the case of exports and bunkers (e.g., showing an export of “-1000 tons of coal”), care should be taken when reading the values for stock changes, as the balances show them with an oppos-ite sign than that which is described in their definition (see para. 5.16). This results in stock builds being shown with a negative value, which could be misinterpreted as a stock draw.
8.19. Primary energy production. Primary energy production (as defined in para. 5.10) is the capture or extraction of fuels or energy from natural energy flows, the biosphere and natural reserves of fossil fuels within the national territory in a form suitable for use. Inert matter removed from the extracted fuels and quantities re-injected, flared or vented are not included. The production of primary products is usually an activity of the energy industries. However, some primary energy products can be generated by industries other than the energy industries as autoproduction, as well as by households.
8.20. Imports and exports of energy products. Imports and exports of energy products are defined in paras. 5.11 and 5.12. They cover both primary and secondary energy products.
8.21. International bunkers. International bunkers cover both marine and aviation bunkers and are defined in paras. 5.14–5.15.
8.22. Stock changes. Stocks and stock changes are defined in para. 5.16. It is desirable, in principle, to record changes in all stocks located in the national territory at a specific moment in time, but it is recognized that in practice countries often find it difficult to obtain satisfac-tory data on changes in stocks held by final energy users. This problem is particularly trouble-some in the case of the numerous non-industrial final users, making it therefore very costly to cover them in regular stock surveys. As countries may adopt different conventions for the calculation of the change in energy stocks, it is recommended that necessary clarification be provided in country metadata. Countries are encouraged to collect comprehensive data on stock changes from large companies, private or public, as a minimum.
International Recommendations for Energy Statistics (IRES)106
8.23. A stock change can be the result of a stock build or a stock draw. To ensure compa-rability of energy statistics with the accepted practice in other areas of economic statistics, stock changes are measured as closing stock minus opening stock. Thus, a positive value of stock change is a stock build and represents a reduction in the supply available for other uses, while a negative value is a stock draw and represents an addition to the supply for other uses.
8.24. For each product, the row “total energy supply” reflects the supply of energy embodied in that particular energy product. The total supply of energy in the national territory is shown under the column “total”.
2. Middle block—transfers, transformation, own use and losses
8.25. The main purpose of the middle block of an energy balance is to show transfers, energy transformation, energy industries own use and losses.
8.26. Transfers, the first line of the middle block, is essentially a statistical device to move energy between columns to overcome practical classification and presentation issues result-ing from changes in use or identity of an energy product. Transfers cover, for example, the reclassification of oil products (which is necessary when finished oil products are used as feedstock in refineries) and the reclassification of products that no longer meet their original specifications (see para. 5.17).
8.27. Transformation. Energy transformation describes the processes that convert an energy product into another energy product that, in general, is more suitable for specific uses (see paras. 5.18 and 5.68–5.74).
8.28. The transformation of energy is normally performed by energy industries. However, many economic units not part of energy industries produce energy products to satisfy their own needs and/or to sell to third parties. When this involves the transformation of energy products, it is recorded in the balances in the middle block. Examples include manufacturing plants producing their own secondary electricity or heat (autoproducers). Another example of an economic unit included in transformation is blast furnaces (ISIC Group: 241—Manu-facture of basic iron and steel), because its by-product, blast furnace gas, can have different energy uses, making it worthwhile to account for as the output of the transformation of coke.
8.29. Number of rows describing transformation. Each row under transformation specifies the kind of plant performing the energy transformation. A reference list of transformation plants and, therefore, rows to be reflected in the transformation part of the balance is provided in para 5.70. It is recommended that countries show in their balances, to the extent possible and applicable, energy transformation by the categories of plants, as presented in para 5.70.
8.30. Recording of inputs and outputs. It is recommended that: (a) energy entering trans-formation processes (e.g., fuels into electricity generation and heat generation, crude oil into oil refineries for the production of oil products, or coal into coke ovens for the production of coke and coke oven gas) be shown with a negative sign to represent the input, and (b) energy that is an output of transformation activities be shown as a positive number. The sum of the cells in each row appearing in the column “total” should therefore be negative as transfor-mation always results in a certain loss of energy when expressed in energy units. A positive figure would suggest a gain of energy and, as such, would be an indication of incorrect data or metadata such as conversion factors.
8.31. Energy industries own use is defined as the consumption of fuels, electricity and heat for the direct support of the production and preparation for use of fuels and energy, except heat not sold (see para. 5.20). As such, it covers not only own use by the energy industries as defined in para. 5.23, but also by other energy producers as defined in para. 5.75. Typical
107Energy balances 107
examples are the consumption of electricity in power plants for lighting, compressors and cooling systems, or the fuels used to maintain the refinery process. A separate row in com-modity and energy balances is used to show this consumption of energy for the purposes of energy production. For analytical purposes, the energy industries own use will often be further disaggregated by type of energy industry.
8.32. Losses. As defined in para. 5.19, losses are those that occur during the transmission, distribution and transport of fuels, electricity and heat. Losses also include venting and flar-ing of manufactured gases, losses of geothermal heat after production and pilferage of fuels or electricity (sometimes referred to as non-technical losses).
3. Bottom block—final consumption
8.33. The bottom block of an energy balance—final consumption—covers final energy consumption (i.e. flows reflecting energy consumption by energy consumers), as well as non-energy use of energy products. The final consumption is measured by the deliveries of energy products to all consumers. It excludes deliveries of fuel and other energy products for use in transformation processes and the use of energy products for the energy needs of the energy industries (both covered in the middle block).
8.34. As the energy balance involves application of the territory principle, final consump-tion covers all consumption in the national territory independent of the residence status of the consuming units. Thus, the energy consumption by residents abroad is excluded, while the energy consumed by non-residents (foreigners) within the national territory is included.
8.35. It is recommended that final energy consumption be grouped into three main catego-ries: (i) manufacturing, construction and non-fuel mining industries, (ii) transport and (iii) other, and further disaggregated according to countries’ needs (see chapter V for more detail).
8.36. Manufacturing, construction and non-fuel mining industries. The final consump-tion recorded under this category covers the use of energy products for energy purposes by economic units belonging to the industry groups listed below. It, however, excludes the use of energy products for transport, which is recorded under “transport” in a separate row. Taking into account the needs of energy policy makers and to ensure cross-country comparability of energy balances, it is recommended that countries show final energy consumption disag-gregated according to the following groups (see table 5.3):53
• Iron and steel
• Chemical and petrochemical
• Non-ferrous metals
• Non-metallic minerals
• Transport equipment
• Machinery
• Mining and quarrying
• Food and tobacco
• Paper, pulp and print
• Wood and wood products (other than pulp and paper)
• Textile and leather
• Construction
• Industries not elsewhere specified
65 In addition, to ensure better har-monization of energy statistics with other economic statistics countries might also wish to compile energy consumption by applicable ISIC, Rev. 4 classes in their detailed energy balances.
International Recommendations for Energy Statistics (IRES)108
8.37. Transport. The purpose of this category is to provide information on the consump-tion of energy products by any economic entity in transporting goods and/or passenger between points of departure and destination within the national territory. As described in para. 5.89–5.96, transport should be disaggregated by mode of transport.
8.38. By convention, transport fuels used in fishing, farming and defence (including fuels for military means of transport) are not part of transport in the energy balance, because the main purpose of the fuel use in these activities is not for transport but rather for agriculture and defence. Similarly, energy used in lift trucks and construction machinery on industrial sites is considered as stationary consumption, not transport. The category “transport” is sub-divided into the following modes of transport (see table 5.4):
• Road• Rail• Domestic aviation• Domestic navigation• Pipeline transport• Transport not elsewhere specified
8.39. Energy used at compressor and/or pumping stations in pipeline transport (fuels and electricity) within the national territory is included in transport. However, it is recognized that some countries with a large production of oil and gas find it difficult to differentiate between energy for pipeline transport and other fuels consumed in the oil and gas extraction industries.
8.40. Other. This group consists of energy consumers not classified in the manufacturing, construction and non-fuel mining industries category. It is recommended that countries at least subdivide this group in the following way (see chapter V).
• Households• Commerce and public services• Agriculture, forestry• Fishing• Not elsewhere specified (including defence activities)
8.41. As stated in para. 8.37 above, fuels used in tractors for the purpose of farming, in vessels for fishing and for transport by military vehicles are included here. Fuels and other energy products’ consumption in fishing should cover all fishing vessels, including those engaged in deep-sea fishing. It is important to ensure that fuels and other energy products delivered to deep-sea fishing vessels are excluded from quantities reported as international marine bunkers.
8.42. It is recommended that countries further subdivide the major consumer groups identi-fied above, reflecting their needs and the level of detail adopted in other areas of basic statistics.
8.43. Use of energy products for non-energy purposes. This use appears as a separate row in the energy balance. It can be further disaggregated by the compiling countries in accord-ance with their needs and priorities. For example, countries may wish to show non-energy use of energy products by the chemical and petrochemical industry, for transport66 and others.
8.44. The structure of the middle and bottom blocks of energy balances is designed to pre-sent various uses of energy products based on the concepts introduced in chapter V. Figure 8.1 below illustrates how the cross-classification of energy use by purpose and user groups described in chapter V and presented in figure 5.2 is reflected in energy balances.
66 In some balances, there is a separate item for transport. One example of non-energy use in transport is lubricants and greases used in engines.
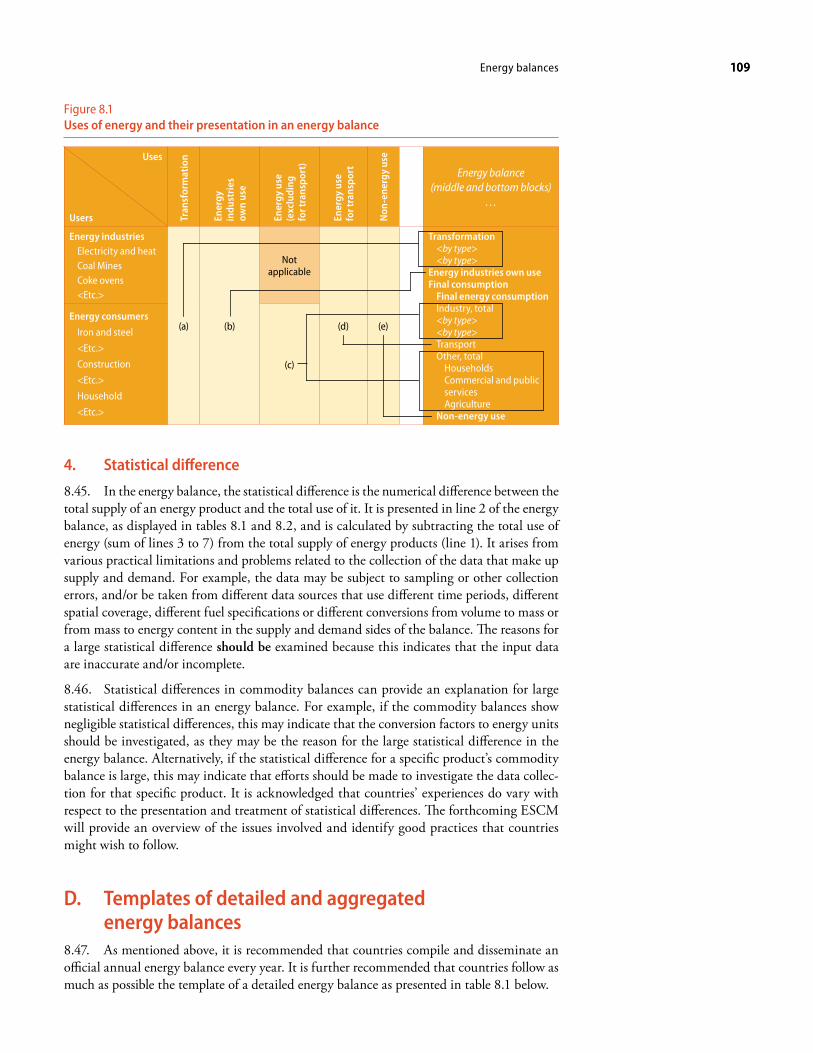
109Energy balances 109
Figure 8.1Uses of energy and their presentation in an energy balance
Uses
Tran
sfor
mat
ion
Ener
gy
indu
stri
es
own
use
Ener
gy u
se
(exc
ludi
ng
for t
rans
port
)
Ener
gy u
se
for t
rans
port
Non
-ene
rgy
use
Energy balance (middle and bottom blocks)
…Users
Energy industriesElectricity and heatCoal MinesCoke ovens<Etc.>
(a) (b)
Not applicable
(d) (e)
Transformation<by type><by type>
Energy industries own useFinal consumption
Final energy consumptionIndustry, total <by type><by type>TransportOther, total
HouseholdsCommercial and public servicesAgriculture
Non-energy use
Energy consumers
Iron and steel
<Etc.>
Construction
<Etc.>
Household
<Etc.>
(c)
4. Statistical difference
8.45. In the energy balance, the statistical difference is the numerical difference between the total supply of an energy product and the total use of it. It is presented in line 2 of the energy balance, as displayed in tables 8.1 and 8.2, and is calculated by subtracting the total use of energy (sum of lines 3 to 7) from the total supply of energy products (line 1). It arises from various practical limitations and problems related to the collection of the data that make up supply and demand. For example, the data may be subject to sampling or other collection errors, and/or be taken from different data sources that use different time periods, different spatial coverage, different fuel specifications or different conversions from volume to mass or from mass to energy content in the supply and demand sides of the balance. The reasons for a large statistical difference should be examined because this indicates that the input data are inaccurate and/or incomplete.
8.46. Statistical differences in commodity balances can provide an explanation for large statistical differences in an energy balance. For example, if the commodity balances show negligible statistical differences, this may indicate that the conversion factors to energy units should be investigated, as they may be the reason for the large statistical difference in the energy balance. Alternatively, if the statistical difference for a specific product’s commodity balance is large, this may indicate that efforts should be made to investigate the data collec-tion for that specific product. It is acknowledged that countries’ experiences do vary with respect to the presentation and treatment of statistical differences. The forthcoming ESCM will provide an overview of the issues involved and identify good practices that countries might wish to follow.
D. Templates of detailed and aggregated energy balances
8.47. As mentioned above, it is recommended that countries compile and disseminate an official annual energy balance every year. It is further recommended that countries follow as much as possible the template of a detailed energy balance as presented in table 8.1 below.
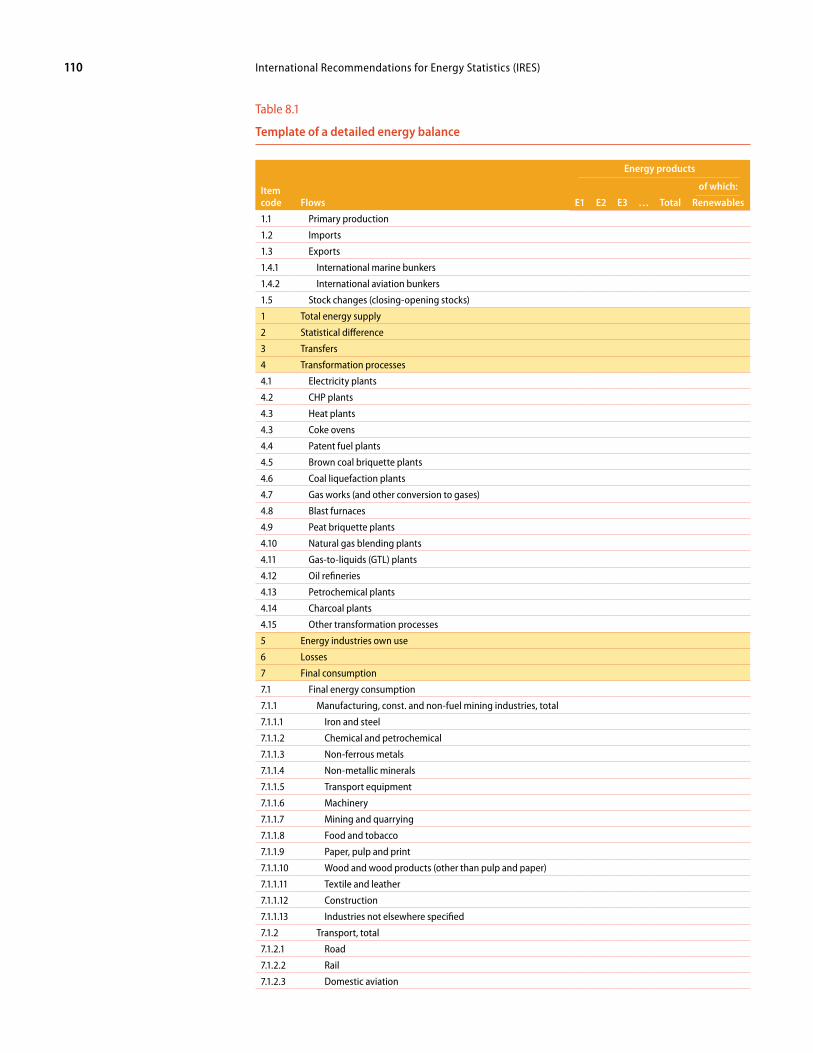
International Recommendations for Energy Statistics (IRES)110
Table 8.1
Template of a detailed energy balance
Item code Flows
Energy products
E1 E2 E3 … Total
of which:
Renewables
1.1 Primary production
1.2 Imports
1.3 Exports
1.4.1 International marine bunkers
1.4.2 International aviation bunkers
1.5 Stock changes (closing-opening stocks)
1 Total energy supply
2 Statistical difference
3 Transfers
4 Transformation processes
4.1 Electricity plants
4.2 CHP plants
4.3 Heat plants
4.3 Coke ovens
4.4 Patent fuel plants
4.5 Brown coal briquette plants
4.6 Coal liquefaction plants
4.7 Gas works (and other conversion to gases)
4.8 Blast furnaces
4.9 Peat briquette plants
4.10 Natural gas blending plants
4.11 Gas-to-liquids (GTL) plants
4.12 Oil refineries
4.13 Petrochemical plants
4.14 Charcoal plants
4.15 Other transformation processes
5 Energy industries own use
6 Losses
7 Final consumption
7.1 Final energy consumption
7.1.1 Manufacturing, const. and non-fuel mining industries, total
7.1.1.1 Iron and steel
7.1.1.2 Chemical and petrochemical
7.1.1.3 Non-ferrous metals
7.1.1.4 Non-metallic minerals
7.1.1.5 Transport equipment
7.1.1.6 Machinery
7.1.1.7 Mining and quarrying
7.1.1.8 Food and tobacco
7.1.1.9 Paper, pulp and print
7.1.1.10 Wood and wood products (other than pulp and paper)
7.1.1.11 Textile and leather
7.1.1.12 Construction
7.1.1.13 Industries not elsewhere specified
7.1.2 Transport, total
7.1.2.1 Road
7.1.2.2 Rail
7.1.2.3 Domestic aviation
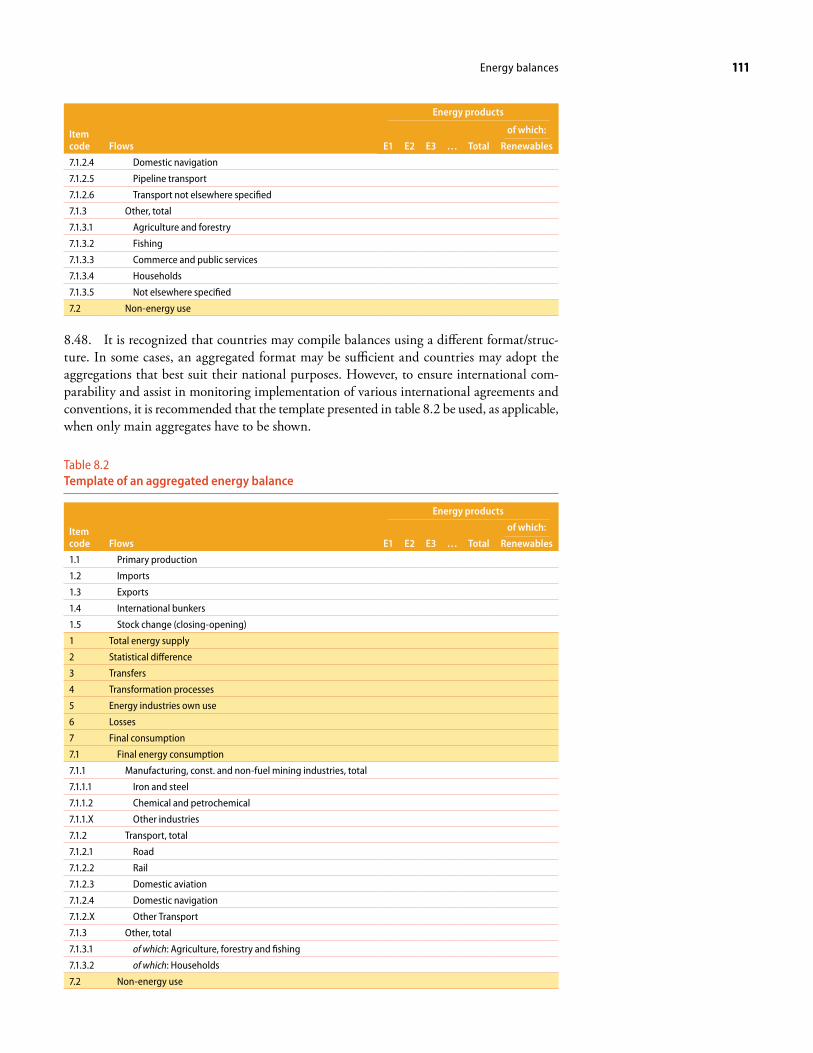
111Energy balances 111
Item code Flows
Energy products
E1 E2 E3 … Total
of which:
Renewables
7.1.2.4 Domestic navigation
7.1.2.5 Pipeline transport
7.1.2.6 Transport not elsewhere specified
7.1.3 Other, total
7.1.3.1 Agriculture and forestry
7.1.3.2 Fishing
7.1.3.3 Commerce and public services
7.1.3.4 Households
7.1.3.5 Not elsewhere specified
7.2 Non-energy use
8.48. It is recognized that countries may compile balances using a different format/struc-ture. In some cases, an aggregated format may be sufficient and countries may adopt the aggregations that best suit their national purposes. However, to ensure international com-parability and assist in monitoring implementation of various international agreements and conventions, it is recommended that the template presented in table 8.2 be used, as applicable, when only main aggregates have to be shown.
Table 8.2Template of an aggregated energy balance
Item code Flows
Energy products
E1 E2 E3 … Total
of which:
Renewables
1.1 Primary production
1.2 Imports
1.3 Exports
1.4 International bunkers
1.5 Stock change (closing-opening)
1 Total energy supply
2 Statistical difference
3 Transfers
4 Transformation processes
5 Energy industries own use
6 Losses
7 Final consumption
7.1 Final energy consumption
7.1.1 Manufacturing, const. and non-fuel mining industries, total
7.1.1.1 Iron and steel
7.1.1.2 Chemical and petrochemical
7.1.1.X Other industries
7.1.2 Transport, total
7.1.2.1 Road
7.1.2.2 Rail
7.1.2.3 Domestic aviation
7.1.2.4 Domestic navigation
7.1.2.X Other Transport
7.1.3 Other, total
7.1.3.1 of which: Agriculture, forestry and fishing
7.1.3.2 of which: Households
7.2 Non-energy use
International Recommendations for Energy Statistics (IRES)112
8.49. Additional information can be presented in supplementary tables and/or memoran-dum items to the energy balances. Examples of such information are: (i) flaring, venting and re-injection that might occur during the primary energy production, but are not covered in the balances (data item 3.3 “extraction losses” in chapter V); and (ii) flaring, venting and re-injection that occur during the transformation processes, and, even though covered in the energy balances, are not explicitly identified (included under “losses”). The collection and com-pilation of such information are very useful for a number of reasons, including their relevance for greenhouse gas emissions and, in the case of extraction losses, their links with the assess-ment of the depletion of underground deposits of the resource. In order to respond to specific user needs, supplementary information could be presented together with the energy balance.
E. Data reconciliation and estimation of missing data8.50. It is recognized that the compilation of an energy balance will require the use of vari-ous sources of data, including those collected by energy statisticians, as well as by compilers working in other statistical domains. This implies that the assessment of data accuracy, data reconciliation, estimation of missing data and imputation will play a significant role in pro-cessing the data during the compilation of the energy balance. While detailed information on good practices will be provided in the ESCM, some general recommendations can be formulated and are presented below.
1. Accuracy requirements
8.51. An energy balance includes interdependent elements of significantly differing levels of reliability, and it may become very difficult to assess the accuracy of the aggregated data. Such difficulties should not, however, be regarded as insurmountable barriers to progress but as challenges to be addressed as experience is gained and good practices are identified. It is recommended that accuracy requirements applicable to basic energy data used in the balance be clearly described in the energy statistics metadata of the country.
2. Estimation of missing data
8.52. It is recommended that countries estimate missing data in order to maintain the integrity of the balance and follow the imputation methods and general principles established in other areas of statistics,67 as well as good practices applicable to energy statistics, which will be elaborated in the forthcoming ESCM (see also chapter VII for a discussion of editing and imputation).
3. Reconciliation
8.53. As the compilation of energy balances requires use of data obtained from various data sources, reconciliation is needed to ensure the coherence of the data and the absence of double-counting. It is recommended that countries provide a summary of the performed rec-onciliation in the energy balance metadata to ensure the transparency of the energy balance preparation and to assist users in proper interpretation of the information contained therein and its relationship with other disseminated statistics.
8.54. Reconciliation of data on imports and exports of energy products and international bunkers. An example of data that need special attention are data on imports/exports of energy products and international bunkers. As official foreign merchandise trade statistics do not always satisfy the needs of balance compilers in this case, enterprise surveys might be needed
67 See, for example, International Recommendation for Industrial Statistics (IRIS 2008).
113Energy balances 113
to complement it in order to distinguish between these flows. However, it is recommended that the suitability of foreign merchandise trade statistics always be reviewed and available data used to the maximum extent possible to avoid duplication of efforts and publication of contradictory figures. If, however, the use of enterprise surveys becomes necessary, and differ-ing figures on exports and imports of energy products are to be published in energy balances and trade statistics, an appropriate explanation of the differences should be published as part of the energy balance metadata. It is further recommended that energy and trade statisticians regularly review data collection procedures to ensure that the needs of energy statistics are met to the extent possible. A national correspondence table between the HS and SIEC should be developed and used to present external trade flows in the energy categories adopted for energy balance purposes.
F. Commodity balances8.55. Purpose. The purpose of a commodity balance is to show the sources of supply and the various uses of a particular energy product with reference to the national territory of the compiling country. The balance can be compiled for any energy commodity. Countries may use various formats of commodity balances depending on their needs and circumstances. However, it is recommended that the format of the energy balance and all applicable concepts defined in IRES consistently used in the compilation of a commodity balance to ensure data consistency.
8.56. The unit of measurement. The unit of measurement used in commodity balances is usually the original unit appropriate for the energy product in question (e.g., metric tons). However, a non-original energy unit (e.g., ton of oil equivalent or terajoule) can be used as well.
8.57. Format (template) of commodity balance. In general, a commodity balance can be compiled in a format similar to that of energy balances. However, not all flows (i.e. rows in the balance) may be applicable for all products. Common flows shown are:68
• Production (primary or secondary)• Production from other sources• Imports• Exports• International bunkers• Stock changes • Supply• Statistical difference• Transfers• Transformation input• Energy industries own use• Losses• Final consumption• Final energy consumption• Non-energy use
8.58. The most commonly used format for the presentation of energy commodity data is the commodity balance in which both the sources of supply and the uses for each commodity are shown in a single column.
68 For definitions and relationships between these terms refer to chapter VI.
International Recommendations for Energy Statistics (IRES)114
8.59. It is recommended that commodity balances be constructed at the national level for every energy commodity in use, however minor, with certain commodities aggregated for working purposes. They should be considered as the basic framework for the compilation of national energy statistics and as a valuable accounting tool for constructing both energy balances and higher aggregates. A key indicator of the data quality of each product is the statistical difference row (see para. 8.45).
8.60. Differences in the flow layout of commodity balances as compared to an energy balance. Commodity balances provide details on the physical flows involving one energy product, and do not consider the interrelationships between different products. For this reason, it is logical to treat secondary production as “production” (in line with the concept of production in other areas of statistics) and not as the “output of transformation”, while at the same time there is no need to show transformation inputs as a negative quantity.
8.61. While energy balances need to distinguish between fossil and non-fossil fuels, both to show what is renewable in total and to accurately calculate greenhouse gas inventories, for commodity balances, however, more interest lies in quantities consumed and the way they are. For example, commodity balances showing consumption of motor gasoline will include any quantities of blended biofuels, in contrast to energy balances.
115
Chapter IX
Data quality assurance and metadata
A. Introduction9.1. Ensuring data quality is a core challenge of all statistical offices and other data-producing agencies. The management of data quality is an integral part of every statistical domain or programme and has to be addressed in each of them. Energy data made available to users, like other subject-matter area statistics, are the end product of a complex process com-prising many stages. These include the definition of concepts and variables (such as energy products and flows), the collection of data from various sources, the processing, analysis and formatting of the data to meet user needs, and data dissemination, which should be followed by an evaluation of the process and outputs to confirm that the objectives have been met and to suggest possible improvement actions. Achieving overall data quality is dependent upon ensuring quality in all stages of this process.
9.2. This chapter discusses quality concepts and quality frameworks, defines and describes the different dimensions of statistical quality and trade-offs among them, and discusses qual-ity measures and indicators for measuring quality. Quality reports are described next, fol-lowed by a summary of the types of quality reviews that can be undertaken to evaluate statistical programmes. The chapter ends with a discussion of metadata.
B. Data quality, quality assurance and quality assurance frameworks
1. Data quality
9.3. For sound decision-making and policy formulation in the energy domain, it is essen-tial that high-quality statistical information about the supply and use of energy be available. While the word “quality” can have different meanings depending on the context in which it is used, data quality is most commonly defined in terms of its “fitness for use”, or how well the statistical outputs meet user needs. The definition is thus a relative one that allows for various perspectives on what constitutes quality, depending on the purposes for which the outputs are intended.
2. Quality assurance
9.4. Quality assurance comprises all planned and systematic activities that can be dem-onstrated to provide confidence that the statistical products or services are adequate or fit for their intended uses by clients and stakeholders. It entails anticipating and avoiding problems, with the goal of preventing, reducing or limiting the occurrence of errors (e.g. in a survey). It is worth noting here that quality assessment is a part of quality assurance that focuses on assessing or determining the extent to which quality requirements have been fulfilled.
9.5. Activities or measures for ensuring that attention is paid to the quality of the data cover not only the final outputs, but also the organization producing the outputs and the
International Recommendations for Energy Statistics (IRES)116
underlying processes that lead to the outputs. The outputs or products are typically described in terms of quality dimensions such as relevance, accuracy, reliability, timeliness, punctuality, accessibility, clarity, coherence and comparability. The organization or agency exhibits high quality when it maintains a professionally independent, impartial and objective institutional environment, a commitment to quality, the guarantee of confidentiality and transparency, and provides adequate resources for producing the outputs. For those processes that the organization considers to be high-priority, the use of sound statistical methodologies and cost-effective procedures that minimize the reporting burden must be paramount.
9.6. To achieve this, quality is approached along three lines: statistical product (or output) quality, process quality and the quality or characteristics of the environment in which the office/agency operates. The focus in this chapter will be on ensuring statistical product (or output) quality.
3. Data quality assurance frameworks
9.7. In the context of a statistical office, systematic data quality management typically takes the form of a quality assurance framework. A national quality assurance framework can be viewed as an overarching framework that can provide context for a country’s quality concerns, activities and initiatives, and explain the relationships between the various quality procedures and tools. Quality assurance frameworks have been developed and adopted to date by countries and international organizations to varying degrees. While all countries’ statistical offices have in place some type of quality assurance approach and a number of quality assurance procedures, and most have similar outlines of the various dimensions of quality (also referred to in the quality assurance literature as criteria, components or aspects), not all countries yet have a formalized quality assurance framework in place.
9.8. In 2012, the United Nations Statistical Commission endorsed the generic National Quality Assurance Framework (NQAF) Template developed by the Expert Group on National Quality Assurance Frameworks to assist countries in formulating and operationalizing their national quality assurance frameworks or to further enhance existing ones. The work of the Expert Group built upon and helped raise greater awareness of the various data quality man-agement references and tools developed by international, regional, national and other organi-zations. They are posted on the United Nations Statistics Division (UNSD) NQAF website.69
9.9. The NQAF Template drew heavily upon, and was designed to be in close alignment with, other main frameworks, i.e., the European Statistics Code of Practice, the Interna-tional Monetary Fund (IMF) Data Quality Assessment Framework (DQAF), Statistics Canada Quality Assurance Framework, and the Code of Good Statistical Practice for Latin America and the Caribbean,70 which have been successfully adopted by many countries and continue to be in use in them. Although these quality frameworks may differ slightly from each other, they share common aspects and provide comprehensive and flexible structures for the qualitative assessment of a broad range of statistics, including energy statistics. They also facilitate taking stock of quality concerns, activities, requirements and initiatives and the fostering of standardization and systematization of quality practices and measurement within statistical offices and across countries. A mapping of each of them to the NQAF Template is available on the UNSD NQAF website.
9.10. The NQAF Template is presented in box 9.1 below. Its five sections outline the elements that a national quality assurance framework should include. The paragraphs on quality assurance that follow focus mainly on the NQAF Template sections 3 and 4, and provide an overview of quality assurance objectives, considerations and practices, including measurement, reporting and evaluation. Additional information on other frameworks can be found in the Energy Statistics Compilers Manual.
69 See http://unstats.un.org/unsd /dnss/QualityNQAF/nqaf.aspx.
70 The NQAF Template is available from http://unstats.un.org/unsd /dnss/QualityNQAF/nqaf.aspx, the ES Code of Practice from http://ec.europa.eu/eurostat /documents/3859598/5921861 /KS-32-11-955-EN.PDF/ 5fa1ebc6-90bb-43fa-888f-dde032471e15 and http://ec .europa.eu/eurostat/documents /3859598/5923349/QAF_2012-EN .PDF/fcdf3c44-8ab8-41b8-9fd0-91bd1299e3ef?version=1.0; IMF’s DQAF from http://dsbb .imf.org/images/pdfs/dqrs_ Genframework.pdf; the LAC’s Code of Good Practice in Statistics at www.dane.gov.co /files/noticias/BuenasPracticas_en.pdf; and Statistics Canada’s Quality Assurance Framework from www.statcan.gc.ca/pub/12-586-x/12-586-x2002001-eng.pdf.

117Data quality assurance and metadata 117
Box 9.1Template for a Generic National Quality Assurance Framework (NQAF)
1. Quality context
1a. Circumstances and key issues driving the need for quality management
1b. Benefits and challenges
1c. Relationship to other statistical agency policies, strategies and frameworks and evolution over time
2. Quality concepts and frameworks
2a. Concepts and terminology
2b. Mapping to existing frameworks
3. Quality assurance guidelines
3a. Managing the statistical system
[NQAF 1] Coordinating the national statistical system
[NQAF 2] Managing relationships with data users and data providers
[NQAF 3] Managing statistical standards
3b. Managing the institutional environment
[NQAF 4] Assuring professional independence
[NQAF 5] Assuring impartiality and objectivity
[NQAF 6] Assuring transparency
[NQAF 7] Assuring statistical confidentiality and security
[NQAF 8] Assuring the quality commitment
[NQAF 9] Assuring adequacy of resources
3c. Managing statistical processes
[NQAF 10] Assuring methodological soundness
[NQAF 11] Assuring cost-effectiveness
[NQAF 12] Assuring soundness of implementation
[NQAF 13] Managing the respondent burden
3d. Managing statistical outputs
[NQAF14] Assuring relevance
[NQAF15] Assuring accuracy and reliability
[NQAF16] Assuring timeliness and punctuality
[NQAF17] Assuring accessibility and clarity
[NQAF18] Assuring coherence and comparability
[NQAF19] Managing metadata
4. Quality assessment and reporting
4a. Measuring product and process quality—use of quality indicators, quality targets and process variables and descriptions
4b. Communicating about quality—quality reports
4c. Obtaining feedback from users
4d. Conducting assessments; labelling and certification
4e. Assuring continuous quality improvement
5. Quality and other management frameworks
5a. Performance management
5b. Resource management
5c. Ethical standards
5d. Continuous improvement
5e. Governance
International Recommendations for Energy Statistics (IRES)118
4. objectives, uses and benefits of quality assurance frameworks
9.11. The overall objective of quality assurance frameworks is to standardize and systema-tize quality practices and measurement within statistical offices and across countries. They are useful as organizing frameworks that provide a single place to record and reference the full range of current quality concepts, policies and practices, and for being forward-looking, since they take into account future actions and activities. For energy statistics programmes, the framework can allow the assessment of national practices in energy statistics in terms of internationally (or regionally) accepted approaches for data-quality management and meas-urement and facilitate reviews of a country’s energy statistics programme as performed by international organizations and other groups of data users.
9.12. The main benefits of having a quality-assurance framework in place are that it: (a) makes the processes by which quality is assured more transparent and reinforces the image of the office as a credible provider of good-quality statistics; (b) creates a quality cul-ture within the organization; (c) guides countries in strengthening their statistical systems by promoting self-assessments to identify quality problems; and (d) facilitates the exchange of ideas on quality management with other producers of statistics at the national, regional and international levels.
9.13. For those energy statistics programmes without a quality-assurance framework yet in place, national statistical offices, ministries and/or agencies responsible for energy statistics can avoid “reinventing the wheel” by reviewing the above-mentioned frameworks and consid-ering whether to directly follow one or structure their own in line with one or some of them in a way that best fits their country’s practices and circumstances. Countries are encouraged to develop their own national quality assurance frameworks based on the above-mentioned approaches or other internationally recognized approaches, taking into consideration their specific national circumstances.
5. Dimensions of quality
9.14. It is widely recognized that the concept of quality in relation to statistical information is multidimensional; there is no one single measure of data quality, and no longer is accuracy thought to be the one absolute measure or indicator of high-quality data. Data outputs are typically described in the various quality assurance frameworks in terms of several dimensions or components of quality. The dimensions are assessed, measured, reported on and monitored over time to provide an indication of output quality to both the data users and data producers. The following dimensions of quality reflect a broad perspective and have been incorporated in most of the existing frameworks: relevance, accuracy, reliability, timeliness, punctuality, accessibility, clarity, coherence and comparability.71 As the dimensions of quality are over-lapping and interrelated, the adequacy of the management of each of them is essential if the information produced is to be fit for use. They should be taken into account when describing, measuring and reporting the quality of statistics in general and energy statistics in particular.
(a) Relevance. The relevance of statistical information reflects the degree to which the information meets or satisfies the current and/or emerging needs of key users. Relevance therefore refers to whether the required statistics are produced and whether those produced are in fact needed and shed light on the issues of most importance to users. To know this requires the identification of user groups and knowledge about their various data needs and expectations. Relevance also covers methodological soundness, particularly the extent to which the concepts, definitions and classifications correspond to those that users require. Relevance can be seen as having the following three components: completeness, user needs and user satisfaction.
71 Some frameworks also include other dimensions, for example, interpretability (which is similar to clarity), credibility, integrity, serviceability, etc.
119Data quality assurance and metadata 119
An energy statistics programme’s challenge would be to weigh and balance the conflicting needs of its current and potential users in order to produce energy statistics that satisfy the most important needs of key users in terms of the data’s content, coverage, timeliness, etc., within given resource constraints. To ensure or manage relevance, producers must engage with their users and data providers before and during the production process, as well as after the outputs have been released. Some strategies for measuring the relevance of an energy programme’s outputs include consulting directly with key users about their needs, priorities and views concerning any deficiencies in the programme, tracking requests from users and evaluating the ability of the programme to respond, and analysing the results of user-satisfaction surveys. Also, since needs evolve over time, ongoing statistical programmes should be regularly reviewed to ensure their continued relevance.
(b) Accuracy and reliability. The accuracy of statistical information reflects the degree to which the information correctly estimates or describes the phenomena it was designed to measure, i.e. the degree of closeness of estimates to true values. It has many facets, and there is no single overall measure of accuracy. It is usu-ally characterized in terms of errors in statistical estimates and is traditionally decomposed into bias (systematic error) and variance (random error) components. In the case of energy estimates based on data from sample surveys, the accuracy can be measured using the following indicators: coverage rates, sampling errors, non-response errors, response errors, processing errors, and measurement and model assumption errors.
Reliability is an aspect of accuracy. It concerns whether the statistics consistently measure over time the reality they are designed to represent. The regular monitor-ing of the nature and extent of revisions to energy statistics is considered a gauge of reliability.
(c) Timeliness and punctuality. Timeliness of information refers to the length of time between the end of the reference period to which the information relates and its availability to users. Timeliness targets are derived from considerations of relevance, in particular the period for which the information remains useful for its main purposes. This varies with the rate of change of the phenomena being measured, the frequency of measurement, and the immediacy of user response to the latest data. Planned timeliness is a design decision, often based on a trade-off between accuracy and cost. Thus, improved timeliness is not an unconditional objective. However, timeliness is an important characteristic that should be moni-tored over time to provide a warning of deterioration, especially as the timeliness expectations of users are likely to heighten as they continue to experience faster and faster service delivery, thanks to the impact of technology. Punctuality refers to whether data are delivered on the dates promised, advertised or announced (for example, in an official release calendar).
Mechanisms for managing timeliness and punctuality include announcing release dates well in advance, implementing follow-up procedures with data providers if they have not responded by the specified deadlines, releasing preliminary data fol-lowed by revised and/or final figures, making the best use of modern technology and adhering to the pre-announced release schedules (and if necessary, informing users of any divergences from the advance release calendar and the reasons for the delays). Paying attention to timeliness and punctuality and announcing schedules and release dates in advance help users plan, provide internal discipline and guar-antee equal access to all by undermining any potential effort by interested parties to influence or delay any particular release for their own benefit.

International Recommendations for Energy Statistics (IRES)120
(d) Coherence and comparability. The coherence of energy statistics reflects the degree to which the data are logically connected and mutually consistent, that is to say, the degree to which they can be successfully brought together with other statisti-cal information within a broad analytic framework over time. Comparability is a measurement of the impact of differences in applied statistical concepts, measure-ment tools and procedures, when statistics are compared between geographical areas or over time. The use of standard concepts, definitions, classifications and target populations promotes coherence and comparability, as does the use of a common methodology across surveys. The concepts of coherence and comparabil-ity can be broken down into coherence within a dataset (internal coherence, e.g. checking across products in an energy balance), coherence across datasets (e.g. checking that concepts such as production and trade agree with economic and customs statistics, respectively), and comparability over time and across countries.
Mechanisms for managing the coherence and comparability of energy statistics include adherence to the methodological basis of the recommendations presented in IRES when data items are compiled and the promotion of cooperation and exchange of knowledge between individual statistical programmes. Automated processes and methods, such as coding tools, can be used to identify issues and promote coherence and consistency within a dataset. The use of common con-cepts, definitions, classifications and methodology will result in coherence across datasets (e.g. between energy and other statistics such as economic and environ-mental), and comparability over time and across countries. Divergences from the recommendations and common concepts, definitions, classifications and methodology, as well as breaks in series resulting from changes in the concepts, definitions, etc. should be explained.
(e) Accessibility and clarity. Accessibility of information refers to the ease with which users can learn of its existence and locate and import it into their own working environment. It includes the suitability of the form or medium through which the information can be accessed and its cost. An advance release calendar or timeta-ble to inform users about when and where the data will be available and how to access them promotes accessibility and also enables equal access to information for all groups of users. A provision for allowing access to microdata for research purposes, in accordance with an established policy that ensures statistical confi-dentiality, also promotes accessibility.
Clarity refers to the extent to which easily comprehensible metadata are available in cases where the metadata are necessary to give a full understanding of the statistics. It is sometimes referred to as interpretability. The clarity dimension is fulfilled by the existence of user-support services and the provision of metadata, which should cover the underlying concepts and definitions, origins of the data, the variables and classifications used, the methodology of data collection and processing, and indications of the quality of the statistical information. User feedback is the best way to assess the clarity of data from the user’s perspective, e.g. through questions regarding their understanding and interpretation in user satisfaction surveys.
6. Interconnectedness and trade-offs
9.15. The dimensions of quality described above are interconnected and as such are involved in a complex relationship. Action taken to address or modify one dimension of quality may affect other dimensions. The accuracy-timeliness trade-off is probably the most frequently occurring and most important of the trade-offs. For example, striving for improvements in timeliness by reducing collection and processing time may reduce accuracy. A similar
121Data quality assurance and metadata 121
situation requiring consideration by energy statistics programmes, for example, would be the trade-off between aiming for the most accurate estimation of the total annual energy production or consumption by all potential producers and consumers, and providing this information in a timely manner when it is still of interest to users. It is recommended that if, while compiling a particular energy statistics dataset, countries are not in a position to meet the accuracy and timeliness requirements simultaneously, they should produce provisional estimates, which would be available soon after the end of the reference period but would be based on less comprehensive data content. These estimates would be supplemented at a later date with information based on more comprehensive data content but would be less timely than their provisional version. In such cases, the tracking of the size and direction of revisions can serve to assess the appropriateness of the chosen timeliness-accuracy trade-off. Additional trade-offs, such as those between relevance and comparability over time, may need to be dealt with when changes made in classifications used in ongoing surveys to improve relevance lead to reductions in comparability over time due to breaks in series.
9.16. Other trade-offs. The trade-offs described above relate to those between two dimen-sions of output quality. Other conflicting situations may emerge requiring difficult trade-offs, such as those between one of the dimensions and such quality considerations as the respondent burden, confidentiality, transparency, security or costs. For example, ensuring the efficiency or cost-effectiveness of the statistical programme may create challenges for ensuring relevance by limiting the flexibility of the programme to address important gaps and deficien-cies. A careful examination of all relevant factors and priorities will be required to make the necessary decisions relating to these types of difficult trade-offs, and those decisions already made should be communicated to users, along with the reasons for making those decisions.
C. Measuring and reporting on the quality of statistical outputs
1. Quality measures and indicators
9.17. There are essentially two ways to measure quality—using quality measures and qual-ity indicators. The quantitative and qualitative quality measures and indicators developed around dimensions such as those described above enable data producers to describe, measure, assess and report output quality to assist users in determining whether the outputs are fit for their intended purposes. The measures and indicators can also be used by data producers to monitor data quality for the purpose of continuous improvement.
9.18. Quality measures are defined as those items that directly measure a particular aspect of quality. For example, the time lag from the reference date to the day of publication of par-ticular energy statistics, measured in the number of days, weeks or months, is a direct quality measure of timeliness. In practice, many other quality measures can be difficult and costly to calculate. In these cases, quality indicators can be used to supplement or act as substitutes for the desired quality measures.
9.19. Quality indicators usually consist of information that is a by-product of the statistical process. They do not measure quality directly but can provide enough information to give an insight into quality. For example, in the case of accuracy, measuring non-response bias is challenging, since the characteristics of the non-responders can be difficult and costly to ascertain. In this instance, response rates are often utilized as a proxy to provide a quality indicator of the possible extent of non-response bias. Other data sources can also serve as a quality indicator to validate or confront the data. For example, commodity balances can be used to compare energy consumption data with energy supply figures (in the statistical dif-ference flow) to flag potential problem areas.
International Recommendations for Energy Statistics (IRES)122
2. Examples and selection of quality measures and indicators
9.20. There are numerous examples of quality indicators and measures that have already been defined around specific dimensions and are in use by statistical organizations. Some are presented in the form of descriptive statements or assertions (e.g. the majority of the indicators of good practice relating to the principles of the European Statistics Code of Practice; the “elements to be assured” in the NQAF Guidelines and NQAF Checklist, and those relating to the IMF “elements of good practice” in the DQAF and the “compliance criteria” in the Code of Good Statistical Practice for Latin America and the Caribbean). Others may be quantita-tive statements or quantified measures calculated according to specific formulas (e.g. the ESS Standard Quality and Performance Indicators). The various quality indicators and measures are intended to make the description of a product by quality dimensions more informative and increase transparency. Countries are encouraged to develop or identify quality measures and indicators for describing, measuring, assessing, documenting and monitoring over time the quality of their energy statistics outputs and make them available to users. The Energy Statistics Compilers Manual presents several sets of indicators for consideration and selection for describing the quality of statistical outputs in general.
9.21. The objective of quality measurement is to have a practical set (limited number) of quality measures and indicators to describe and monitor over time the quality of the data pro-duced by the responsible agencies and to ensure that users are provided with a useful summary of overall quality, while not overburdening respondents with demands for unrealistic amounts of metadata. As such, it is not intended that all quality measures and indicators be addressed for all data. Instead, countries are encouraged to select practical sets of quality measures and indi-cators that are most relevant to their specific outputs and can be used to describe and monitor the quality of the data over time. They should also ensure that the selected measures and indi-cators cover each of the quality dimensions that describe their outputs, have well-established methodologies for their compilation, and are easy to interpret by both internal and external users. Box 9.2 presents a sample of some indicators and measures that countries’ energy statis-tics programmes can consider using to indicate the quality of their energy statistics.
9.22. Data compilers should decide how frequently the measures or indicators for different key outputs are to be produced. Certain types of quality measures and indicators can be pro-duced for each data item in line with the frequency of production or publication of the data. For example, response rates for total energy production can be calculated and disseminated with each new estimate. However, other measures could be produced once for longer periods and only produced again for newly released data if there were major changes.
3. Quality reports
9.23. In order for the users of energy statistics to be able to make informed use of the sta-tistical information provided, they need to know whether the data are of sufficient quality. For some dimensions of quality, such as timeliness, users are able to easily assess the quality for themselves, while others, such as coherence and even relevance, may not be as obvious. The dimension of accuracy in particular is one that users may often have no way of assess-ing and must rely on the statistical agency for guidance to assess. A quality report or similar documentation is meant to provide this guidance.
9.24. National practices for reporting on the quality of outputs vary. The quality of docu-mentation provided by data producers can range from short and concise to very detailed, depending on the users for whom the information is meant. General users will most likely only be interested in a level of detail necessary for knowing whether the data is reliable, while pro-ducers will want more detailed information to be able to evaluate whether the output meets the quality requirements and to identify strengths and areas that might need further improvement.

123Data quality assurance and metadata 123
Box 9.2
Selected Indicators for Measuring the Quality of Energy Statistics72
Quality dimension Quality measure/indicator
Relevance • Procedures are in place to identify the users of energy data and consult with them about their needs;
• Unmet user needs—Gaps between key user needs and compiled energy statistics in terms of concepts, coverage and detail are identified and addressed;
• Requests for energy information are monitored and the capacity to respond is evaluated;
• User satisfaction surveys on the agency’s energy statistics outputs are regularly conducted and the results are analysed and acted upon;
Accuracy and reliability
• Energy source data are systematically assessed and validated;
• Sampling errors of estimates, e.g. standard errors, are measured, evaluated and systematically documented;
• Non-sampling errors, e.g. item non-response rates and unit non-response rates, are measured, evaluated and systematically documented;
• Coverage—The proportion of the population covered by the energy data collected is assessed;
• Imputation rates are reported;
• Information on the size and direction of revisions to energy data is provided and made known publicly;
Timeliness and punctuality
• A published release calendar announces in advance the dates that (key) energy statistics are to be released;
• The time lag between the end of the reference period and the date of the first release (or the release of final results) of energy data is monitored and reported;
• The possibility and usefulness of releasing preliminary data is regularly considered, while at the same time taking into account the data’s accuracy;
• The time lag between the date of the release or publication of the data and the date on which they were announced or promised to be released is monitored and reported;
• Any divergences from pre-announced release times for the energy data are published in advance; a new release time is then announced with explanations on the reasons for the delays;
Coherence and comparability
• Comparison and joint use of related energy data from different sources are made;
• Energy statistics are comparable over a reasonable period of time;
• Divergences from the relevant international statistical standards in concepts and measurement procedures used in the collection/compilation of energy statistics are monitored and explained;
• Energy statistics are internally coherent and consistent;
Accessibility and clarity
• Energy statistics and the corresponding metadata are presented in a form that facilitates proper interpretation and meaningful comparisons, and are archived;
• Modern information and communication technology (ICT) is mainly used for dissem-inating energy statistics; traditional hard copy and other services are provided, when appropriate, to ensure that users have appropriate access to the statistics they need;
• An information or user-support service, call centre or hotline is available for handling requests for energy data and for providing answers to questions about statistical results, metadata, etc.;
• Access to energy microdata is allowed for research purposes, subject to specific rules and protocols on statistical confidentiality;
• The regular production of up-to-date quality reports and methodological docu-ments (on energy concepts, definitions, scope, classifications, basis of recording, data sources (including the use of administrative data), compilation methods, statistical techniques, etc.) is part of the work programme, and the reports and documents are made known publicly;
72 The indicators listed represent only a sample of possible indica-tors that can be used for measur-ing quality. Refer to the Energy Statistics Compilers Manual for more information.
International Recommendations for Energy Statistics (IRES)124
9.25. Quality information is often structured in a template format to promote comparabil-ity and consistency across statistical domains. Sometimes it is issued in a quality report that is separate from the other metadata—not as a replacement for, but as a complement to them. Other times, it may be included as part of other metadata (for example along with explana-tory and technical notes and other more detailed documentation) provided by the compiling agency. Some compilers refer to it as a quality statement or quality declaration. Typically though, the quality reports or quality documentation examine and describe quality according to the dimensions used by the agency to define its products’ fitness for purpose in terms of relevance, accuracy, reliability, timeliness, punctuality, coherence, comparability, accessibility and clarity, as focused on in this chapter.
9.26. Two types of quality reports can be distinguished—the shorter “user-oriented” report and the more detailed “producer-oriented” report. The focus of the user-oriented reports is on output quality, so they are often limited to brief descriptions of the output dimensions and generally include just a few of the indicators for measuring quality listed in the previ-ous section. On the other hand, the longer “producer-oriented” quality reports, such as the comprehensive type European Statistical System (ESS) members are recommended to pro-duce periodically (every five years or so or after major changes), go into greater detail on the dimensions, especially on errors and other aspects affecting accuracy, and provide additional information on the processes and other issues, such as confidentiality, costs and the response burden. For the users, such details may be confusing and unnecessary for their purposes, but for the producers, the comprehensive reports serve as an internal self-assessment. Qual-ity reporting therefore underpins quality assessment, which in turn is the starting point for quality improvements in statistical programmes. See the Energy Statistics Compilers Manual for more information on quality reports and descriptions of quality reporting practices.
9.27. The preparation and updating of quality reports depend on the survey frequency and the stability of the quality characteristics. Balance should be sought between the need for recent information and the report compiling burden. If necessary, the quality report should be updated as frequently as the survey is carried out. However, if the characteristics are stable, the inclusion of quality indicators in the newest survey results could be enough to update the report. Another option is to provide a detailed quality report less frequently, and a shorter one after each survey, covering only the updated characteristics, such as some of the accuracy-related indicators. Countries are encouraged to regularly issue quality reports as part of their metadata.
4. Quality reviews
9.28. Quality reviews can be done in the form of self-assessments, audits or peer reviews. They can be undertaken by internal or external experts, and the timeframe can vary from days to months, depending on the scope of the review. However, the results are more or less identical—the identification of improvement actions/opportunities in processes and prod-ucts. It is recommended that some form of quality review of energy statistics programmes be undertaken periodically, for example every four to five years or more frequently, if significant methodological or other changes in the data sources occur.
9.29. Self-assessments are comprehensive, systematic and regular reviews of an organization’s activities and results are referenced against a model/framework. They are “do it yourself” evaluations. Typically, self-assessment checklists or questionnaires are developed to be used for the systematic assessment of the quality of statistical production processes.73
9.30. A quality audit is a systematic, independent and documented process for obtaining quality evidence concerning the quality of a statistical process and evaluating it objectively to determine the extent to which policies, procedures and requirements on quality are fulfilled.
73 For more information, see for example, the European Statisti-cal System’s Development of a Self-Assessment Programme (DESAP) and Data Quality Assess-ment and Tools, see http://ec.europa.eu/eurostat /documents/64157/4373903/07-Checklist-for-Survey-Managers_DESAP-EN.pdf/ec76e3a3-46b5-409e-a7c3-52305d05bd42.
125Data quality assurance and metadata 125
In contrast to the self-assessments, audits are always carried out by a third party (internal or external to the organization). Internal audits are conducted for the purpose of reviewing the quality system in place (policies, standards, procedures and methods) and the internal objec-tives. They are led by a team of internal quality auditors who are not in charge of the process or product under review. External audits are conducted either by stakeholders or other parties with an interest in the organization, by an external and independent auditing organization, or by a suitably qualified expert.
9.31. Peer reviews are a type of external audit which aim to assess a statistical process at a higher level, not to check conformity with requirements item by item from a detailed check-list. They are therefore often more informal and less structured than formal external audits. Normally, peer reviews do not address specific aspects of data quality but focus rather on broader organizational and strategic questions. They are typically systematic examinations and assessments of the performance of one organization by another, with the ultimate goal of helping the organization under review to comply with established standards and principles, improve its policy making and adopt best practices. The assessments are conducted on a non-adversarial basis, and rely heavily on mutual trust among the organization and assessors involved, as well as their shared confidence in the process.
D. Metadata on energy statistics9.32. Types of statistical data include microdata, macrodata and metadata. Microdata are non-aggregated observations or measurements of characteristics of individual units, macro-data are data derived from microdata by grouping or aggregating them, and metadata are data that describe the microdata, macrodata or other metadata. This section of the chapter will focus on metadata.
9.33. Greater emphasis has been given over the years to the importance of ensuring that statistics published by national statistical offices, international organizations and other data-producing agencies are accompanied by adequate metadata. Metadata, or the “data about data” (and statistical metadata, the “data about statistical data”), are a specific form of docu-mentation that defines and describes data so that users can locate and understand them, make an informed assessment of their strengths, limitations, usefulness and relevance, and use and share them. Without metadata, statistical data are just numbers.
9.34. Metadata therefore are important tools that support the production and final use of statistical information. The main types of metadata are structural metadata and reference metadata.
9.35. Structural metadata are identifiers and descriptors of the data that are essential for discovering, organizing, retrieving and processing statistical datasets. They can be thought of as the “labels” associated with each data item for it to have meaning, such as the names of the table columns, unit of measurement, time period, commodity code, etc. Structural metadata items are an integral part of the statistics database and should be extractable together with any given data item. If they are not associated with the data, it would be impossible to identify, retrieve and browse the data.
9.36. Reference metadata describe the content and quality of the statistical data. They are, for example, conceptual metadata describing concepts used and their practical implementa-tion; methodological metadata describing methods used for generating the data; and quality metadata describing the different quality dimensions of the resulting statistics, i.e. timeliness, accuracy, etc. These reference metadata are often linked (“referenced”) to the data but, unlike structural data, can be presented separately from the data via the Internet or in publications.

International Recommendations for Energy Statistics (IRES)126
9.37. Metadata items. When disseminating comprehensive energy statistics, the compil-ing agency has the responsibility of making the corresponding metadata available and easily accessible to users. There are numerous metadata items that describe a statistical series, and many countries and organizations have developed metadata templates, lists or inventories for the presentation of the concepts, definitions and descriptions of the methods used in the col-lection, compilation, transformation, revision, dissemination and evaluation of their statistics. One such comprehensive inventory is the Single Integrated Metadata Structure (SIMS) for metadata and quality reporting in the ESS whose methodological and quality metadata items are presented in box 9.3. In practice, the amount of metadata detail that different countries disseminate along with their energy data varies, as does the way in which the metadata are presented. The basic purpose though is always the same—to help users understand the data and their strengths and limitations.
9.38. Users and levels of metadata detail. There are many types of users for any given set of data. The wide range of possible users, with their different needs and statistical expertise, means that a broad spectrum of metadata requirements has to be addressed. The responsible agencies, as data suppliers, must make sufficient metadata available to enable both the least and the most sophisticated users to interpret and readily assess the data and their quality. It is recommended that different levels of metadata detail be made available to users to meet the requirements of the various user groups.
9.39. An approach for presenting metadata is to organize them as if they were in layers within a pyramid, where the methodological information describing statistics becomes more detailed as one moves down from the narrower apex (where the summary metadata are) to the wider base level of the “metadata pyramid” (for the more detailed metadata). In this way, users will be able to dig as deeply as they want or need to get a more thorough understanding of the concepts and practices.
9.40. Use of metadata to promote international comparability. Metadata provide a mecha-nism for comparing national practices in the compilation of statistics. This may help and encourage countries to implement international standards and to adopt best practices in the collection of data in particular areas. The use of standard terminology and definitions, and better harmonization of approaches adopted by different countries will improve the general quality and coverage of key statistical indicators.
9.41. Statistical Data and Metadata Exchange (SDMX). SDMX technical standards and content-oriented guidelines provide common formats and nomenclatures for exchanging and sharing statistical data and metadata using modern technology.74 The development of capac-ity in countries to disseminate national data and metadata using web technology and SDMX standards such as cross-domain concepts is recommended as a means to standardize and reduce the international reporting burden.
9.42. Metadata must be a high priority. It is recommended that countries accord high priority to the development of metadata, to keeping them up-to-date, and to consider the dissemination of metadata to be an integral part of the dissemination of energy statistics. Additional country-specific metadata for purposes related to energy statistics will be presented in the forthcoming Energy Statistics Compilers Manual. In consideration of the integrated approach to the compilation of economic statistics, it is also recommended that a coherent system and a structured approach to metadata across all areas of statistics be developed and adopted, focusing on improving their quantity and coverage.
74 For more information on SDMX, see http://sdmx.org.
75 From the Technical Manual of the Single Integrated Metadata Structure (SIMS), available from http://ec.europa.eu/eurostat /documents/64157/4373903 /03-Single-Integrated-Metadata-Structure-and-its-Technical-Manual.pdf/6013a162-e8e2-4a8a-8219-83e3318cbb39.
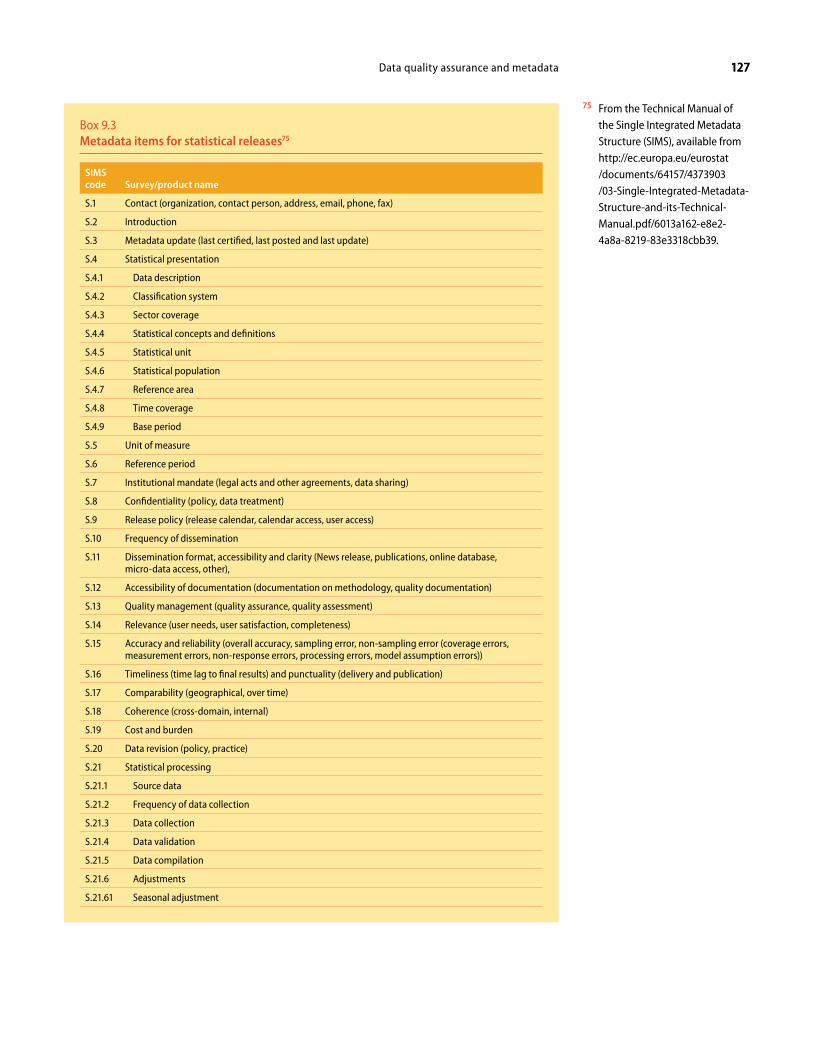
127Data quality assurance and metadata 127
9.37. Metadata items. When disseminating comprehensive energy statistics, the compil-ing agency has the responsibility of making the corresponding metadata available and easily accessible to users. There are numerous metadata items that describe a statistical series, and many countries and organizations have developed metadata templates, lists or inventories for the presentation of the concepts, definitions and descriptions of the methods used in the col-lection, compilation, transformation, revision, dissemination and evaluation of their statistics. One such comprehensive inventory is the Single Integrated Metadata Structure (SIMS) for metadata and quality reporting in the ESS whose methodological and quality metadata items are presented in box 9.3. In practice, the amount of metadata detail that different countries disseminate along with their energy data varies, as does the way in which the metadata are presented. The basic purpose though is always the same—to help users understand the data and their strengths and limitations.
9.38. Users and levels of metadata detail. There are many types of users for any given set of data. The wide range of possible users, with their different needs and statistical expertise, means that a broad spectrum of metadata requirements has to be addressed. The responsible agencies, as data suppliers, must make sufficient metadata available to enable both the least and the most sophisticated users to interpret and readily assess the data and their quality. It is recommended that different levels of metadata detail be made available to users to meet the requirements of the various user groups.
9.39. An approach for presenting metadata is to organize them as if they were in layers within a pyramid, where the methodological information describing statistics becomes more detailed as one moves down from the narrower apex (where the summary metadata are) to the wider base level of the “metadata pyramid” (for the more detailed metadata). In this way, users will be able to dig as deeply as they want or need to get a more thorough understanding of the concepts and practices.
9.40. Use of metadata to promote international comparability. Metadata provide a mecha-nism for comparing national practices in the compilation of statistics. This may help and encourage countries to implement international standards and to adopt best practices in the collection of data in particular areas. The use of standard terminology and definitions, and better harmonization of approaches adopted by different countries will improve the general quality and coverage of key statistical indicators.
9.41. Statistical Data and Metadata Exchange (SDMX). SDMX technical standards and content-oriented guidelines provide common formats and nomenclatures for exchanging and sharing statistical data and metadata using modern technology.74 The development of capac-ity in countries to disseminate national data and metadata using web technology and SDMX standards such as cross-domain concepts is recommended as a means to standardize and reduce the international reporting burden.
9.42. Metadata must be a high priority. It is recommended that countries accord high priority to the development of metadata, to keeping them up-to-date, and to consider the dissemination of metadata to be an integral part of the dissemination of energy statistics. Additional country-specific metadata for purposes related to energy statistics will be presented in the forthcoming Energy Statistics Compilers Manual. In consideration of the integrated approach to the compilation of economic statistics, it is also recommended that a coherent system and a structured approach to metadata across all areas of statistics be developed and adopted, focusing on improving their quantity and coverage.
74 For more information on SDMX, see http://sdmx.org.
75 From the Technical Manual of the Single Integrated Metadata Structure (SIMS), available from http://ec.europa.eu/eurostat /documents/64157/4373903 /03-Single-Integrated-Metadata-Structure-and-its-Technical-Manual.pdf/6013a162-e8e2-4a8a-8219-83e3318cbb39.
Box 9.3Metadata items for statistical releases75
SIMS code Survey/product name
S.1 Contact (organization, contact person, address, email, phone, fax)
S.2 Introduction
S.3 Metadata update (last certified, last posted and last update)
S.4 Statistical presentation
S.4.1 Data description
S.4.2 Classification system
S.4.3 Sector coverage
S.4.4 Statistical concepts and definitions
S.4.5 Statistical unit
S.4.6 Statistical population
S.4.7 Reference area
S.4.8 Time coverage
S.4.9 Base period
S.5 Unit of measure
S.6 Reference period
S.7 Institutional mandate (legal acts and other agreements, data sharing)
S.8 Confidentiality (policy, data treatment)
S.9 Release policy (release calendar, calendar access, user access)
S.10 Frequency of dissemination
S.11 Dissemination format, accessibility and clarity (News release, publications, online database, micro-data access, other),
S.12 Accessibility of documentation (documentation on methodology, quality documentation)
S.13 Quality management (quality assurance, quality assessment)
S.14 Relevance (user needs, user satisfaction, completeness)
S.15 Accuracy and reliability (overall accuracy, sampling error, non-sampling error (coverage errors, measurement errors, non-response errors, processing errors, model assumption errors))
S.16 Timeliness (time lag to final results) and punctuality (delivery and publication)
S.17 Comparability (geographical, over time)
S.18 Coherence (cross-domain, internal)
S.19 Cost and burden
S.20 Data revision (policy, practice)
S.21 Statistical processing
S.21.1 Source data
S.21.2 Frequency of data collection
S.21.3 Data collection
S.21.4 Data validation
S.21.5 Data compilation
S.21.6 Adjustments
S.21.61 Seasonal adjustment

129
Chapter X
Dissemination
A. Importance of energy statistics dissemination
10.1. The first fundamental principle of official statistics states, inter alia, that “official statistics that meet the test of practical utility are to be compiled and made available on an impartial basis by official statistical agencies to honour citizens’ entitlement to public infor-mation.”76 Dissemination is an activity for fulfilling this responsibility and refers to the pro-vision to the public of statistical outputs containing data and related metadata. Energy data are usually disseminated by agencies responsible for energy statistics in the form of various statistical tables or by providing access to the relevant databases. However, country practices differ significantly in their effectiveness and further improvements in this area are necessary.
10.2. Dissemination policy. The dissemination policy should cover a number of issues, including (a) scope of the data for public dissemination, (b) reference period and data dis-semination timetable, (c) data revision policy, (d) dissemination formats, and (e) dissemina-tion of metadata and data quality reports. The dissemination policy should be user-oriented, reaching and serving all user groups (central government, public organizations and territorial authorities, research institutions and universities, private sector, media, general public, and international users), and provide quality information. While each user group has different needs and preferred data formats, the goal should be to reach all kinds of users rather than targeting specific audiences. Therefore, both publications and web sites should be designed as clearly as possible for the general public, as well as for researchers and the media.
10.3. Users and their needs. With the rapid developments in communication technolo-gies, information has become a strategic resource for public and private sectors. Improving dissemination and accessibility of energy statistics is critical to users’ satisfaction. Effective energy data dissemination is not possible without a good understanding of user needs, as this in many ways predetermines what data should be considered for dissemination and in which formats. In this context, countries are encouraged to work closely with the user community by conducting vigorous outreach campaigns, including building stable and productive rela-tionships with users and key stakeholders (for example, inviting interested users to become standing customers, actively helping users to find the statistical information they need and assisting them in the understanding of the role of energy statistics in sound decision making). In addition, the understanding of user needs and data requirements will assist in maintaining the relevance of the statistics produced.
10.4. Users satisfaction surveys. User satisfaction surveys are an important tool for detect-ing user needs and profiles. User feedback should be integrated into the planning process of official energy statistics in order to improve its effectiveness. It is recommended that countries conduct such surveys with the periodicity established by the responsible national agency.
76 Available from http://unstats .un.org/unsd/dnss/gp /fundprinciples.aspx.
International Recommendations for Energy Statistics (IRES)130
B. Data dissemination and statistical confidentiality10.5. One important issue official statistics compilers face is the definition of the scope of data that can be disseminated publicly. The following elements should be taken into account when disseminating data.
10.6. Statistical confidentiality refers to the protection of data that relate to single statistical units, and which are obtained directly for statistical purposes or indirectly from adminis-trative or other sources against any breach of the right to confidentiality. This implies the prevention of unlawful disclosure. Statistical confidentiality is necessary in order to gain and keep the trust of both those required to provide data and those using the statistical informa-tion. Statistical confidentiality has to be differentiated from other forms of confidentiality under which information is not provided to the public, such as, for example, national security concerns.
10.7. Principle 6 of the United Nations Fundamental Principles of Official Statistics pro-vides the basis for managing statistical confidentiality. It states that “Individual data collected by statistical agencies for statistical compilation, whether they refer to natural or legal persons, are to be strictly confidential and used exclusively for statistical purposes.”77
10.8. Legal provisions governing statistical confidentiality at the national level are set forth in countries’ statistical laws or other supplementary governmental regulations. National defi-nitions of confidentiality and rules for microdata access may differ, but they should be consist-ent with the fundamental principle of confidentiality.
10.9. Statistical confidentiality is protected if the disseminated data do not allow statistical units to be identified either directly or indirectly, thereby disclosing individual information. Direct identification is possible if data of only one statistical unit are reported in a cell, while indirect identification or residual disclosure may take place if individual data can be derived from disseminated data (e.g., because there are too few units in a cell, or because of the dominance of one or two units in a cell). To determine whether a statistical unit is identifi-able, account shall be taken of all means that might reasonably be used by a third party to identify it. The Energy Statistics Compilers Manual will contain a separate section on the best country practices in this respect.
10.10. General rules for protecting confidentiality normally require that the following two factors be taken into account when deciding on the confidentiality of data: (a) number of units in a tabulation cell, and (b) dominance of a unit’s or units’ contribution over the total value of a tabulation cell. The application of these general rules in each statistical domain is the responsibility of national statistical authorities.
10.11. Methods of protecting confidentiality. As the first step in statistical disclosure control of tabular data, the sensitive cells need to be identified. Sensitive cells are those that tend to directly or indirectly reveal information about individual statistical units. Once they have been identified, the most common practices used for protecting against the disclosure of confidential data include:
(a) Aggregation. A confidential cell in a table is aggregated with another cell and the information is then disseminated for the aggregate and not for the two individual cells. This may result, for example, in grouping (and disseminating) data on energy production at higher levels of SIEC that adequately ensure confidentiality;
(b) Suppression. Suppression means removing records from a database or a table that contains confidential data. This method allows statisticians to not publish the values in sensitive cells, while publishing the original values in other cells (called primary suppression). Suppressing only one cell in a table means, however, that
77 Ibid.
131Dissemination 131
the calculation of totals for the higher levels to which that cell belongs cannot be performed. In this case, some other cells must also be suppressed in order to guarantee the protection of the values in the primary cells, leading to secondary suppression. If suppression is used to protect confidentiality, then it is important to indicate in the metadata which cells have been suppressed because of confi-dentiality;
(c) Other methods. Controlled rounding and perturbation are more sophisticated techniques for protecting confidentiality of data. Controlled rounding allows statisticians to modify the original value of each cell by rounding it up or down to a near multiple of a base number. Perturbation represents a linear programming variant of the controlled rounding technique.
10.12. Statistical disclosure. Statistical disclosure control techniques are defined as the set of methods used to reduce the risk of disclosing information on individual units. While application of such methods occurs at the dissemination stage, they are pertinent to all stages of the process of statistical production. Statistical disclosure control techniques related to the dissemination step are usually based on restricting the amount of data or modifying the data release. Disclosure control methods attempt to achieve an optimal balance between confidentiality protection and the provision of detailed information. On the basis of available international guidelines78 and national requirements, countries are encouraged to develop their own statistical disclosure methods that best suit their specific circumstances.
10.13. An issue of balance between the application of statistical confidentiality and the need for public information exists. Balancing the respect for confidentiality and the need to pre-serve and increase the relevance of statistics is a difficult issue. It is recognized that legislation on statistical confidentiality has to be carefully considered in cases where its rigorous applica-tion would make it impossible to provide sufficient or meaningful information to the public. In official energy statistics, this issue is of particular importance, as in many countries the production and distribution of energy are dominated by a very limited number of economic units.
10.14. The setup of energy balances illustrates the challenge for official energy statistics. If, for instance, the transformation block of an energy balance cannot be published due to confidentiality, the quality of such a balance significantly deteriorates, since it will no longer be possible to have an internally logical energy balance showing the energy flows from pro-duction and imports/exports through transformation to final consumption. The question is how to make it possible to publish energy balances if there are few units in one part of the balance. The confidentiality issues have to be addressed.
10.15. Application of confidentiality rules in energy statistics. While recognizing the importance of the general rules on statistical confidentiality, countries should implement them in such a way as to promote access to data while ensuring confidentiality, and thus ensure the highest possible relevance of energy statistics, taking into account their legal cir-cumstances. In this regard, it is recommended that:
(a) Any information deemed confidential (and that needs to be suppressed) be reported in full at the next higher level of energy product (or energy flow) aggre-gation that adequately protects confidentiality;
(b) Data that are publicly available (e.g., from company reports, publicly available administrative sources) be fully incorporated and disseminated;
(c) Permission to disseminate certain current data, with or without a certain time delay, be requested from the concerned data reporters;
78 See, for example, Principles and Guidelines for Managing Statistical Confidentiality and Microdata Access, background document prepared for the Statistical Commission at its thirty-eighth session in 2007, available from http://unstats .un.org/unsd/statcom/sc2007 .htm.
International Recommendations for Energy Statistics (IRES)132
(d) Passive confidentiality be considered an option. Passive confidentiality occurs when data are made confidential only at the request of the concerned economic entity and the statistical authority finds the request justified based on the adopted confidentiality rules;
(e) Proposals be formulated for including in confidentiality rules the provision that data can be disseminated if this does not entail excessive damage to the concerned entity. This implies, consequently, that the rules to determine whether or not “excessive damage” might take place are clearly defined and publicly available.
C. Reference period and dissemination timetable10.16. Reference period. It is recommended that countries make their energy data available on a calendar period basis compatible with the practice adopted by the statistical authority of the compiling country in other areas of statistics, preferably according to the Gregorian cal-endar and consistent with the recommendations set out in this publication. For international comparability, countries that use the fiscal year should undertake efforts to report annual data according to the Gregorian calendar.
10.17. Data dissemination timetable. In producing statistical information, there is usually a trade-off between the timeliness with which the information is prepared and the accuracy and level of detail of the published data. A crucial factor, therefore, in maintaining good relations between producers of energy statistics and the user community is developing and adhering to an appropriate release schedule. It is recommended that countries announce in advance the precise dates on which various series of energy statistics will be released. This advance release schedule should be posted at the beginning of each year on the website of the national agency responsible for the dissemination of the official energy statistics.
10.18. The most important elements that should be taken into account in determining the compilation and release schedule of energy statistics include:
(a) The timing of the collection of initial data by various source agencies;(b) The extent to which data derived from the major data sources are subject to revisions;(c) The timing of preparation of important national economic policy documents that
need energy statistics as inputs; and(d) The mode(s) of data dissemination (press release, online access, or hard copy).
10.19. Timeliness is the amount of time between the end of the reference period to which the data pertain, and the date on which the data are released. The timeliness of the release of monthly, quarterly and annual energy statistics varies greatly from country to country, mainly reflecting different perspectives on timeliness, reliability, accuracy and trade-offs between them, but also the differences in available resources and in the efficiency and effectiveness of the statistical production process. From the user perspective, the value of energy data increases significantly when they are released with the shortest possible delay. Countries should under-take systematic efforts to comply with this user demand. However, taking into account both policy needs and prevailing data compilation practices, countries are encouraged to:
(a) Release their monthly data (e.g., on totals of energy production, stocks and stock changes), within two calendar months after the end of the reference month, at least at the most aggregated level;
(b) Release their quarterly data within three calendar months after the end of the reference quarter; and
(c) Release their annual data within fifteen calendar months after the end of the reference year.
133Dissemination 133
10.20. The early release of provisional estimates within one calendar month for monthly data on specific flows and products and within nine to twelve calendar months for annual data is encouraged, provided countries are capable of doing this.
10.21. If countries use additional information for the compilation of annual energy statistics, the data for the fourth quarter (or for the twelfth calendar month) should be compiled and disseminated in their own right and not be derived as the difference between the annual totals and the sum for the first three quarters (or eleven calendar months) in order to provide undistorted data for all months and quarters.
D. Data revision
10.22. Revisions are an important part of the compilation of energy statistics. While the compilation and dissemination of provisional data often improve the timeliness of energy statistics and its relevance, the provisional data should be revised when new and more accu-rate information becomes available. Such practice is recommended if countries can ensure consistency between provisional and final data. Although, in general, repeated revisions may be perceived as reflecting negatively on the reliability of official energy statistics, an attempt to avoid this by producing accurate but untimely data will ultimately fail to satisfy users’ needs. Revisions affect both annual and short-term energy statistics but they are often more significant for short-term data.
10.23. In general, two types of revisions are distinguished: (a) routine, normal or concur-rent revisions that are part of the regular statistical production process and which aim to incorporate new or updated data or to correct data or compilation errors; and (b) major or special revisions that are not part of the regular revision schedule and which are conducted in order to incorporate major changes in concepts, definitions, classifications and changes in data sources.
10.24. With respect to routine revisions, it is recommended that countries develop a revision policy that is synchronized with the release calendar. The description of such a policy should be made publicly available. Agencies responsible for official energy statistics may decide to carry out a special revision, in addition to the normal statistical data revisions, for the purpose of reassessing the data or investigating in depth some new economic structures. Such revisions are carried out at longer, irregular intervals. Often, they may require changes in the time series going as far back as its beginning to retain methodological consistency. It is recommended that these revisions should be subject to prior notification to users to explain why revisions are necessary and to provide information on their possible impact on the released outputs.
10.25. Countries are encouraged to develop a revision policy for energy statistics that is carefully managed and well coordinated with other areas of statistics. That policy should be aimed at providing users with the information necessary for coping with revisions in a sys-tematic manner. The absence of coordination and planning of revisions is considered a quality problem by users. Essential features of a well-established revision policy are predetermined release and revision schedules, reasonable stability from year to year, openness, advance notice of reasons and effects, easy access to sufficiently long time series of revised data, as well as adequate documentation of revisions included in statistical publications and databases. A sound revision policy is recognized as an important aspect of good governance in statistics, as it will not only help the national users of the data but will also promote international con-sistency.79 The future Energy Statistics Compilers Manual will provide detailed information on good practices in revision policy.
79 For examples of good practices, see Organisation for Economic Co-operation and Development, Data and Metadata Reporting and Presentation Handbook (Paris, 2007), chapter 7.
International Recommendations for Energy Statistics (IRES)134
E. Dissemination formats10.26. A key to the usefulness of energy statistics is the availability of data, and hence their broad dissemination. Data can be disseminated both electronically and in paper publications. It is recommended that energy statistics be made available electronically, but countries are encouraged to choose the dissemination format that best suits their users’ needs. For example, press releases of energy statistics must be disseminated in ways that facilitate re-dissemination by mass media; and more comprehensive or detailed statistics need to be disseminated in electronic and/or paper formats. Regular data dissemination should satisfy most, if not all user needs, and customized data sets would be provided only in exceptional cases. It is advis-able that countries ensure that users are clearly made aware of the procedures and options for obtaining the required data.
10.27. Dissemination of metadata. The provision of adequate metadata and quality assess-ments of energy statistics is as important to users as the provision of data itself. Countries are encouraged to harmonize their data with international standards, follow the recommenda-tions provided in chapter IX on data quality assurance and metadata for energy statistics, and develop and disseminate metadata in accordance with the recommendations provided. Countries might wish to consider developing different levels of detail of metadata to facilitate access and use.80
F. International reporting10.28. It is recommended that countries disseminate their energy statistics internationally as soon as they become available to national users and without additional restrictions. To ensure a speedy and accurate data transfer to international and regional organizations, it is recom-mended that countries use the SDMX81 format in the exchange and sharing of their data.
80 For further details on data and metadata reporting, see Organisation for Economic Co-operation and Development, Data and Metadata Reporting and Presentation Handbook (Paris, 2007).
81 The SDMX technical standards and content oriented guidelines can provide common formats and nomenclatures for exchange and sharing of statistical data and metadata using modern technology. The dissemination of national data and metadata using web technology and SDMX standards is encouraged as a means to reduce the interna-tional reporting burden and to increase the efficiency of the international data exchange. For additional information on SDMX, see https://sdmx.org.
135
Chapter XI
Uses of basic energy statistics and balances
A. Introduction11.1. This chapter illustrates the different uses of the data items presented in chapter VI and the energy balances presented in chapter VIII in the compilation of other statistics or for indicators related to energy statistics.
11.2. Section B presents a brief description of the energy accounts of SEEA-Energy. The sec-tion describes the main differences in concepts and definitions between energy balances and energy accounts, the main adjustments needed to link the two systems and the need for addi-tional data items that will allow the compilation of energy accounts from energy balances.
11.3. Section C describes a list of energy indicators as an important tool for monitoring policies. Most of these indicators can be derived from the data items presented in chapter VI.
11.4. Section D provides some reference for the use of basic energy statistics and balances in the calculation of energy-related greenhouse gas emissions. Methods for the calculation of such emissions are discussed here, although details are not provided and the user is referred to the IPCC guidelines instead.
B. The System of Environmental-Economic Accounting for Energy
11.5. The forthcoming SEEA-Energy provides a conceptual framework for organizing energy-related information in a coherent manner consistent with the concepts, definitions and classifications of the SNA.82 It supports analyses of the role of energy within the economy and the relationship between energy-related activities and the environment. SEEA-Energy consists of three main types of accounts, namely:
(a) Physical flow accounts in which flows of energy are recorded in energy units. They record the flow of energy from natural inputs from the environment to the economy, within the economy (as energy products) and from the economy to the environment (as losses and returns of energy to the environment). The various energy flows are recorded in the physical supply and use table (PSUT).
(b) Monetary flow accounts for energy-related transactions, which record the monetary transactions related to physical flows of energy in a supply and use table frame-work. These accounts focus on the transactions within the economy and therefore do not cover flows between the environment and the economy.
(c) Asset accounts in physical and monetary terms, which describe stocks83 at the beginning and end of the accounting year and the changes therein. The asset accounts are com-piled for mineral and energy resources and provide information on the availability of the resource in the environment, its extraction pattern and depletion rate.
82 More information on SEEA-Energy is available from http://unstats.un.org/unsd /envaccounting/seeae
83 Stocks should be understood here in the SEEA sense, covering mineral and energy resources, while in IRES the term would be used for energy products, referring to the given quantity of each resource or product at a given point in time.
International Recommendations for Energy Statistics (IRES)136
1. Main differences between energy balances and energy accounts
11.6. The main differences between energy balances and energy accounts are presented in three groups: conceptual differences, differences in terminology and presentational differences.
Conceptual differences
11.7. The main conceptual difference between energy balances and accounts is the geo-graphical coverage. The reference territory for energy balances is the national territory, and statistics are compiled for all units physically located in that territory. Units physically located outside the territory are considered to be part of the rest of the world. This coverage is referred to as the territory principle.
11.8. Energy accounts, on the other hand, use a geographic coverage based on all insti-tutional units resident in a particular national economy—independent of where they are physically located. Units that are not resident units are considered to be part of the rest of the world. This geographical coverage is referred to as the residence principle. An institutional unit is considered a resident unit of a country when its centre of predominant economic interest is within the economic territory of the country.84 Generally, the economic territory will align with the physical boundary of a country, but adjustments are made for embassies, consulates, military bases, scientific stations and the like, which belong only to the economic territory of the country they represent.
11.9. The use of the territory or residence principle leads to differences in the way certain statistics are recorded (e.g., imports/exports/use, international bunkers, etc.).
11.10. The use of the territory principle implies that imports and exports cover all transac-tions between units physically present in the territory and units physically located outside the territory, independent of the residence status of the units involved (thus trade follows the physical movement of the goods). In addition, transactions between units physically located within the territory are never recorded as imports/exports even if the residence status of the units involved differs. Using the residence principle in energy accounts, however, imports/exports cover transactions between resident and non-resident units independent of the loca-tion where the transaction occurs, whether it is abroad (e.g. in the case of national tourists abroad), or in the national territory (e.g. in the case of foreign companies refueling inland).
11.11. The same goes for recording the uses of products. While in the energy balance the use of energy in the territory covers the use by all units physically located in the territory, in energy accounts, it covers only the use of units resident in the national economy—the use by non-resident units is recorded as an export (provided that the supplying unit is considered resident). In addition, in energy accounts the use of energy products would also include the use by resident units abroad, with the counterpart transaction on the supply side being an import. This is the case, for example, of residents who refuel their own vehicles abroad and ships operated by residents which are refueled abroad.
Differences in terminology
11.12. There are differences in the use of certain terms in energy accounts and energy bal-ances. For example, terms such as “supply”, “final consumption”, “stocks” and “stock changes” are well-defined in both balances and accounts, but their definitions differ.
11.13. Supply. In energy balances, the term supply represents energy entering the national territory for the first time, less energy exiting from the national territory (through exports or international bunkering) and stock changes. Thus:
84 SNA 2008, paras. 4.10-4.14.
137Uses of basic energy statistics and balances 137
Total energy supply = Primary energy production
+ Import of primary and secondary energy
- Export of primary and secondary energy
- International (aviation and marine) bunkers
- Stock changes
11.14. In energy accounts, the term supply is defined as the sum of the production of pri-mary energy and imports (according to the residence principle) of energy products.85 Thus, exports, international bunkers and stock changes, together with intermediate consumption and capital formation are all considered uses. In addition, international bunkering is recorded in the energy accounts as intermediate consumption if the bunkering is undertaken by a ship operated by a resident unit, or as exports if the ship is operated by a non-resident unit.
11.15. Final consumption. In energy balances final consumption refers to the use of fuel, electricity and heat delivered to final consumers of energy for both their energy and non-energy uses. It excludes the use of energy products in energy industries (and by other energy producers) as input into transformation and energy industries own use. In energy accounts, the term final consumption is used to denote the use of goods and services by individual house-holds or the government to satisfy their individual or collective needs or wants. However, when the goods and services are used as inputs to the production process by economic units, this is referred to as intermediate consumption.
11.16. Stocks and stock changes. The concepts of stocks and stock changes defined in energy balances correspond to “inventories” and “changes in inventories” in SEEA-Energy (and SNA 2008). In addition, the stock changes appear in the balances as part of the total supply, while in the energy accounts they appear as part of use.
Presentational differences
11.17. In the standard tables of energy accounts, the presentation of statistics for economic activities and households strictly follows the principles of classification and the structure of the ISIC Rev. 4. Thus, information on any specific enterprise/establishment (be it on the production or on the consumption side) is presented under the ISIC category of the principal activity of the unit involved. Energy balances, however, do not follow the same principle, as information on a specific enterprise/establishment is not completely linked to the relevant ISIC category of the unit involved. Rather, it is presented in different sections of the balances depending on the type of use and the ISIC category of the unit involved.
11.18. A typical example is the use of energy for transport purposes. While detailed infor-mation on the use of energy for transport and other purposes is collected from individual statistical units, data are shown in different ways in energy balances and energy accounts. In energy accounts, data are presented strictly by ISIC category of the statistical units involved, showing transport and other uses of energy within the ISIC class of the unit involved. In energy balances on the other hand, a total aggregate for “transport” is introduced, showing the total energy use for transport purposes by all economic activities, broken down into modes of transport. As a result, the portion of energy used for transport purposes by indi-vidual ISIC industries is not included in the other aggregates for final consumption of energy (such as for wholesalers or manufacturers) in energy balances.86
11.19. Another example is the energy used for producing other energy products. While energy accounts follow strict ISIC categories, energy balances record energy that is trans-formed into different products in the entry “transformation” (broken down by transforma-tion technology), and energy consumed to support energy production in the entry “energy industries own use”.
85 See SEEA-Energy chapter 7. It should be noted though that the term “total supply” is also defined and used differently in other chapters of SEEA-Energy.
86 For more details, see chapter VIII of this publication.
International Recommendations for Energy Statistics (IRES)138
11.20. The energy balance allows for the balancing item “statistical difference”, while the energy accounts, by design, do not allow for discrepancy between supply and use. In cases where there is a difference between supply and use, reconciliation and allocation of this quan-tity to specific flows are needed to reduce or eliminate any discrepancies.
2. Adjustments for the compilation of energy accounts
11.21. Basic energy statistics and energy balances can be used as a data source for the compi-lation of the SEEA-Energy physical supply and use tables. However, because of the differences in concepts and definitions, adjustments are needed in order to compile the energy accounts.
11.22. Adjustments on imports/exports. In order to include imports and exports from the energy balances into the energy accounts, adjustments are needed to relate them to transac-tions between resident and non-resident units, such as the inclusion of fuel purchases by residents abroad as imports.
11.23. Other adjustments for geographical coverage. Other examples relate to the case for international marine and aviation bunkering and for items in the bottom block of the bal-ances. In addition, the different uses of energy products of energy balances need to be disag-gregated so that they can be recorded as “intermediate/final consumption” when the unit is resident or “export” when the unit is non-resident, and complemented with the use by resident units abroad. This is similar to the case of international bunkering.
11.24. It should also be noted that, in principle, some additional adjustments might be neces-sary to the geographical coverage to exclude foreign territorial enclaves in the national terri-tory and/or include national territorial enclaves in the rest of the world. These areas are clearly demarcated land areas (such as embassies, consulates, etc.) located in other territories and used by governments that own or rent them for diplomatic, military or scientific purposes. These areas are excluded from the basic statistics and energy balances when located abroad, whereas foreign enclaves are included when located in the national territory. For statistics presented by the accounting framework, on the contrary, national enclaves in the rest of the world are included, while foreign enclaves in the national territory are excluded.
11.25. Reallocation/regrouping of data to the relevant ISIC category. In order to compile energy accounts, information has to be regrouped according to the different ISIC categories. Information on “transformation”, “transport”, “non-energy use”, “energy industries own use” and “primary production” are examples of items that need to be reallocated in order to present information on a purely ISIC-based tabulation, such as that used in SEEA-Energy.
11.26. Bridge tables may be constructed to clearly show the links for the total supply and total use of the different products between the energy accounts and the energy balances.
Additional data items necessary for the compilation of energy accounts
11.27. In order to compile energy accounts, it is important to have information that allows for the adjustments presented in the previous section. Such information includes, for example the breakdown of deliveries for international bunkering of resident and non-resident units, deliveries to resident and non-resident final consumers, and the use of energy products by resident units abroad.
11.28. In view of the above differences, countries are encouraged to clearly document and make available the methods used for the reallocation and adjustment of data provided by basic energy statistics and balances to energy accounts.

139Uses of basic energy statistics and balances 139
C. Energy indicators
11.29. Energy indicators are a useful tool for summarizing information and monitoring trends reflecting various aspects of a country’s energy situation over time. A number of indi-cators can be compiled from basic energy statistics, energy balances and energy accounts.
11.30. The choice of the set of indicators compiled by a country depends on national circumstances and priorities, sustainability and development criteria and objectives, as well as data availability.
11.31. Examples of core indicators for sustainable development are provided in a joint publi-cation by several international organizations.87 These indicators are organized in three dimen-sions, social, economic and environmental, as well as according to theme and sub-theme. Tables 11.1–11.3 present energy indicators organized according to these three dimensions.88 Most of them can be derived from the data items presented in chapter V. However, for some of them, additional information needs to be collected/compiled (e.g., persons and/or freight tonnage transported times distance travelled, floor area, etc.).
11.32. There is a growing interest in energy efficiency indicators, and work is being carried out (most notably by the International Energy Agency) to review current practices at the national level and provide guidance on concepts and methods. While the importance of these indicators is recognized, many require additional levels of detail than that presented in the list of data items in chapter VI and therefore not all are presented in this chapter.
11.33. It should be noted that the list of indicators presented in this chapter is not exhaustive. Countries are encouraged to develop the list of relevant indicators according to their policy concerns and data availability.
Table 11.1
Energy Indicators linked to the social dimension
Theme Sub-theme Energy Indicator Components
Equity
Accessibility SOC1
Share of households (or population) without elec-tricity or commercial energy, or heavily dependent on non-commercial energy
• Households (or population) without electricity or commercial energy, or heavily dependent on noncommercial energy
• Total number of households or population
Affordability SOC2
Share of household income spent on fuel and electricity
• Household income spent on fuel and electricity
• Household income (total and poorest 20 per cent of population)
Disparities SOC3
Household energy use for each income group and corresponding fuel mix
• Energy use per household for each income group (quintiles)
• Household income for each income group (quintiles)
• Corresponding fuel mix for each income group (quintiles)
Health Safety SOC4Accident fatalities per unit of energy produced by fuel chain
• Annual fatalities by fuel chain Annual energy produced
87 Energy Indicators for Sustainable Development: Guidelines and Methodologies, IAEA, UNDESA, IEA, Eurostat, EEA (Vienna, 2005).
88 Since this publication precedes the work on IRES, the terminol-ogy used for the data items is not always compliant with IRES.
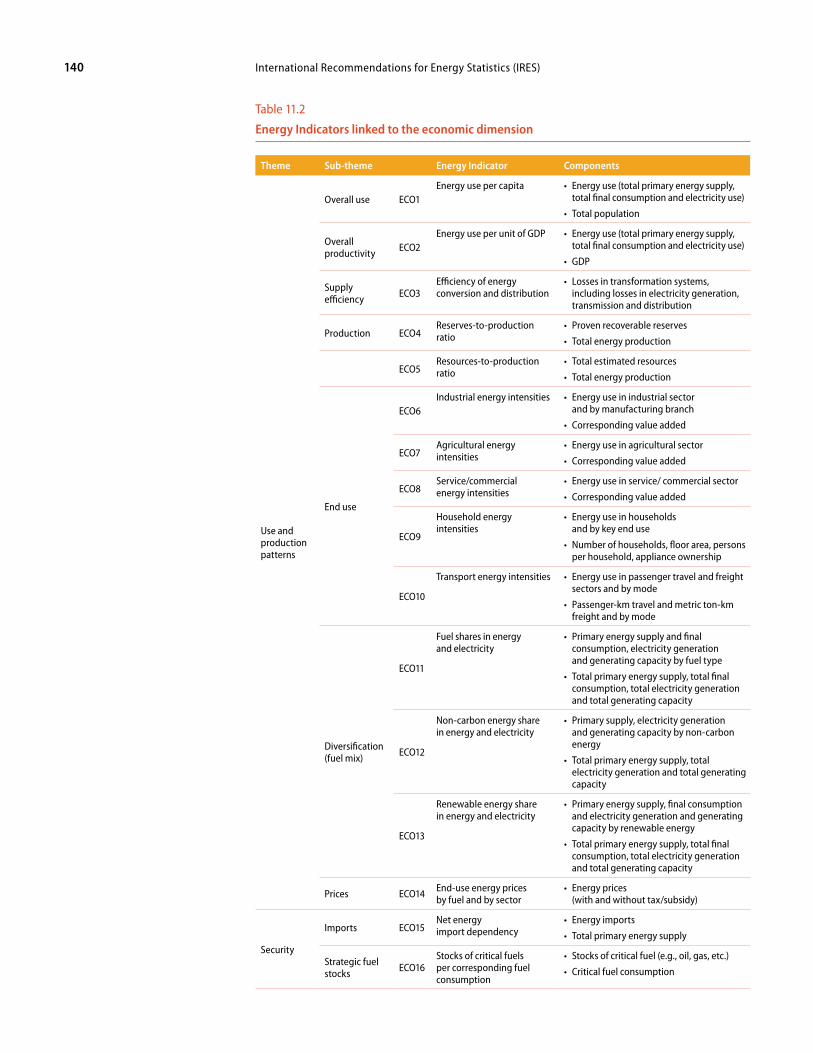
International Recommendations for Energy Statistics (IRES)140
Table 11.2
Energy Indicators linked to the economic dimension
Theme Sub-theme Energy Indicator Components
Use and production patterns
Overall use ECO1Energy use per capita • Energy use (total primary energy supply,
total final consumption and electricity use)
• Total population
Overall productivity ECO2
Energy use per unit of GDP • Energy use (total primary energy supply, total final consumption and electricity use)
• GDP
Supply efficiency ECO3
Efficiency of energy conversion and distribution
• Losses in transformation systems, including losses in electricity generation, transmission and distribution
Production ECO4 Reserves-to-production ratio
• Proven recoverable reserves
• Total energy production
ECO5Resources-to-production ratio
• Total estimated resources
• Total energy production
End use
ECO6Industrial energy intensities • Energy use in industrial sector
and by manufacturing branch
• Corresponding value added
ECO7 Agricultural energy intensities
• Energy use in agricultural sector
• Corresponding value added
ECO8 Service/commercial energy intensities
• Energy use in service/ commercial sector
• Corresponding value added
ECO9
Household energy intensities
• Energy use in households and by key end use
• Number of households, floor area, persons per household, appliance ownership
ECO10
Transport energy intensities • Energy use in passenger travel and freight sectors and by mode
• Passenger-km travel and metric ton-km freight and by mode
Diversification (fuel mix)
ECO11
Fuel shares in energy and electricity
• Primary energy supply and final consumption, electricity generation and generating capacity by fuel type
• Total primary energy supply, total final consumption, total electricity generation and total generating capacity
ECO12
Non-carbon energy share in energy and electricity
• Primary supply, electricity generation and generating capacity by non-carbon energy
• Total primary energy supply, total electricity generation and total generating capacity
ECO13
Renewable energy share in energy and electricity
• Primary energy supply, final consumption and electricity generation and generating capacity by renewable energy
• Total primary energy supply, total final consumption, total electricity generation and total generating capacity
Prices ECO14 End-use energy prices by fuel and by sector
• Energy prices (with and without tax/subsidy)
Security
Imports ECO15 Net energy import dependency
• Energy imports
• Total primary energy supply
Strategic fuel stocks ECO16
Stocks of critical fuels per corresponding fuel consumption
• Stocks of critical fuel (e.g., oil, gas, etc.)
• Critical fuel consumption

141Uses of basic energy statistics and balances 141
Table 11.3
Energy Indicators linked to the environmental dimension
Theme Sub-theme Energy Indicator Components
Atmosphere
Climate change ENV1 GHG emissions from energy production and use per capita and per unit of GDP
• GHG emissions from energy production and use
• Population and GDP
Air quality
ENV2 Ambient concentrations of air pollutants in urban areas
• Concentrations of pollutants in air
ENV3 Air pollutant emissions from energy systems
• Air pollutant emissions
Water Water quality ENV4
Contaminant discharges in liquid effluents from energy systems, including oil discharges
• Contaminant discharges in liquid effluents
Land
Soil quality ENV5 Soil area where acidification exceeds critical load
• Affected soil area
• Critical load
Forest ENV6 Rate of deforestation attributed to energy use
• Forest area at two different times
• Biomass utilization
Solid waste generation and management
ENV7 Ratio of solid waste generation to units of energy produced
• Amount of solid waste
• Energy produced
ENV8 Ratio of solid waste properly disposed of to total gener-ated solid waste
• Amount of solid waste properly disposed of
• Total amount of solid waste
ENV9 Ratio of solid radioactive waste to units of energy produced
• Amount of radioactive waste (cumulative for a selected period of time)
• Energy produced
ENV10
Ratio of solid radioactive waste awaiting disposal to total generated solid radioactive waste
• Amount of radioactive waste awaiting disposal
• Total volume of radioactive waste
D. Greenhouse gas emissions
11.34. The availability of good, reliable and timely basic energy statistics and energy balances is fundamental for the estimation of GHG emissions and to address the global concerns for climate change. Basic energy statistics and energy balances are the main sources of data for the calculation of energy-related GHG emissions, as the IPCC Guidelines are based on the same conceptual framework. Countries are encouraged to make additional efforts to verify the compiled data and make any necessary adjustments to ensure that the calculated emis-sions are internationally comparable.
1. Climate change and GHG emissions
11.35. Human interference with the climate system, driven by the so-called “greenhouse effect”, started being acknowledged as a global problem in 1979, at the First World Climate Conference. Ten years later, in 1988, the IPCC was established by the United Nations Envi-ronment Programme (UNEP) and the World Meteorological Organization (WMO), with a
International Recommendations for Energy Statistics (IRES)142
mission to provide a clear scientific view of the knowledge in climate change and its potential environmental and socio-economic impacts.
11.36. The latest available scientific assessment of climate change from IPCC is provided in the IPCC Fifth Assessment Report (AR5), published in 2013. The report underlines that “warming of the climate system is unequivocal” and that “it is extremely likely that more than half of the observed increase in global average surface temperature from 1951 to 2010 was caused by the anthropogenic increase in greenhouse gas concentrations and other anthropo-genic forcings together.” The AR5 not only corroborated, but reinforced the findings of the IPCC Fourth Assessment Report (AR4), published in 2007. These assessments are consistent with ongoing climate observations reported by WMO. For the future, IPCC AR5 emphasizes that “continued emissions of GHGs will cause further warming and changes in all compo-nents of the climate system”, and that “limiting climate change will require substantial and sustained reductions of greenhouse gas emissions.”
11.37. The international community responded to the growing concerns about climate change by putting in place three key international treaties: the United Nations Framework Convention on Climate Change (UNFCCC), the Kyoto Protocol to UNFCCC and the Paris Agreement under UNFCCC. Reporting on GHG emissions, including emissions from the energy sector, is a key obligation of the Parties to these treaties.
2. IPCC guidelines for estimating GHG emissions
11.38. An important function of IPCC is to provide methodological guidance on the estima-tion of national GHG emissions as part of the preparation of national GHG inventories. The first consolidated and extensive guidance on the estimation of GHG emissions was issued by IPCC in 1995, and revised and published as the Revised 1996 IPCC Guidelines for National Greenhouse Gas Inventories (IPCC 1997). Later, it was followed by the Good Practice Guid-ance and Uncertainty Management in National Greenhouse Gas Inventories (IPCC 2000) and the Good Practice Guidance for Land Use, Land-Use Change and Forestry (IPCC 2003).
11.39. The 2006 IPCC Guidelines for National Greenhouse Gas Inventories were prepared at the invitation of UNFCCC. According to decision 24/CP.19 of the Conference of the Par-ties to UNFCCC (Warsaw, Poland, 11–23 November 2013), Annex I Parties to UNFCCC shall use the 2006 IPCC Guidelines in their national GHG inventory submissions from 2015. While there is no formal decision on the use of the 2006 IPCC Guidelines by non-Annex I Parties to date, some developing countries have started using the Guidelines in preparing national submissions on climate change. It is likely that more and more developing countries will start using the 2006 IPCC Guidelines in the near future.
11.40. The IPCC Guidelines address emissions of direct and indirect GHGs. The direct GHGs covered by the Guidelines are carbon dioxide (CO2), methane (CH4), nitrous oxide (N2O), hydrofluorocarbons (HFCs), perfluorocarbons (PFCs), sulphur hexafluoride (SF6) and some others. The indirect GHGs considered in the Guidelines are nitrogen oxides (NOX), ammonia (NH3), non-methane volatile organic compounds (NMVOC), carbon monoxide (CO) and sulphur dioxide (SO2).
11.41. The methods for estimating GHG emissions in the IPCC Guidelines are structured into a three-tier sectoral approach and a reference approach. These methods are briefly described in box 11.1.
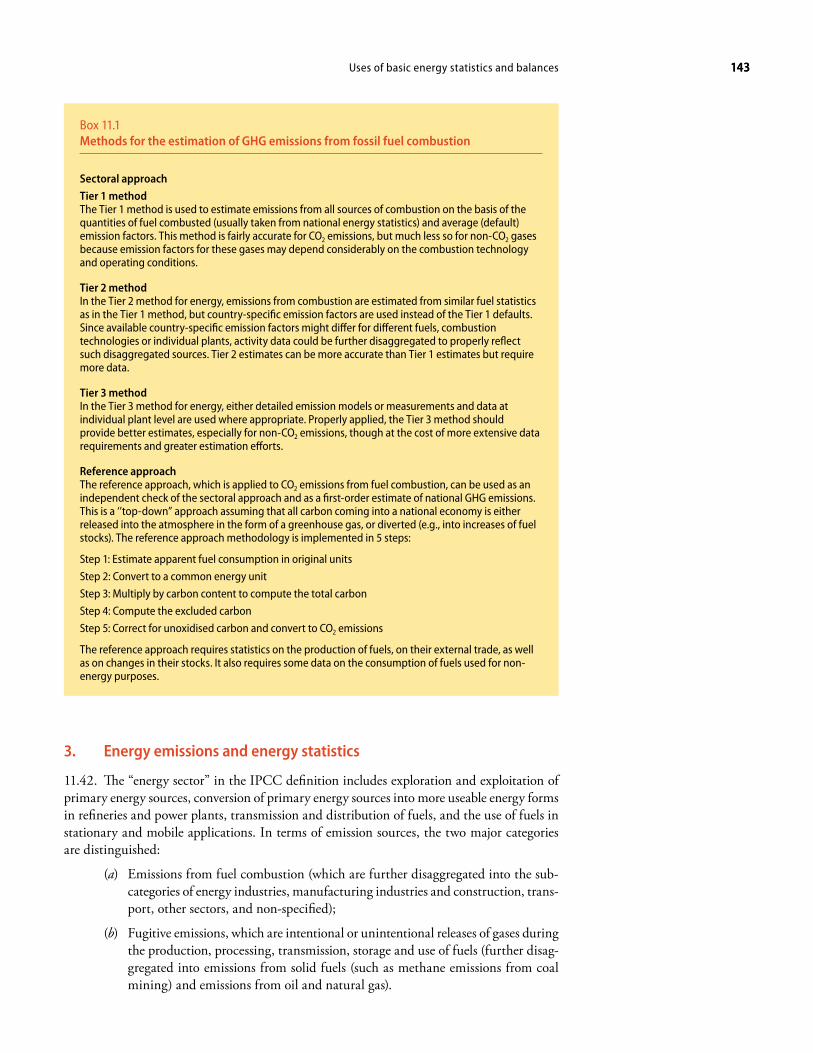
143Uses of basic energy statistics and balances 143
3. Energy emissions and energy statistics
11.42. The “energy sector” in the IPCC definition includes exploration and exploitation of primary energy sources, conversion of primary energy sources into more useable energy forms in refineries and power plants, transmission and distribution of fuels, and the use of fuels in stationary and mobile applications. In terms of emission sources, the two major categories are distinguished:
(a) Emissions from fuel combustion (which are further disaggregated into the sub-categories of energy industries, manufacturing industries and construction, trans-port, other sectors, and non-specified);
(b) Fugitive emissions, which are intentional or unintentional releases of gases during the production, processing, transmission, storage and use of fuels (further disag-gregated into emissions from solid fuels (such as methane emissions from coal mining) and emissions from oil and natural gas).
Box 11.1Methods for the estimation of GHG emissions from fossil fuel combustion
Sectoral approach
Tier 1 method The Tier 1 method is used to estimate emissions from all sources of combustion on the basis of the quantities of fuel combusted (usually taken from national energy statistics) and average (default) emission factors. This method is fairly accurate for CO2 emissions, but much less so for non-CO2 gases because emission factors for these gases may depend considerably on the combustion technology and operating conditions.
Tier 2 method In the Tier 2 method for energy, emissions from combustion are estimated from similar fuel statistics as in the Tier 1 method, but country-specific emission factors are used instead of the Tier 1 defaults. Since available country-specific emission factors might differ for different fuels, combustion technologies or individual plants, activity data could be further disaggregated to properly reflect such disaggregated sources. Tier 2 estimates can be more accurate than Tier 1 estimates but require more data.
Tier 3 method In the Tier 3 method for energy, either detailed emission models or measurements and data at individual plant level are used where appropriate. Properly applied, the Tier 3 method should provide better estimates, especially for non-CO2 emissions, though at the cost of more extensive data requirements and greater estimation efforts.
Reference approach The reference approach, which is applied to CO2 emissions from fuel combustion, can be used as an independent check of the sectoral approach and as a first-order estimate of national GHG emissions. This is a ‘’top-down” approach assuming that all carbon coming into a national economy is either released into the atmosphere in the form of a greenhouse gas, or diverted (e.g., into increases of fuel stocks). The reference approach methodology is implemented in 5 steps:
Step 1: Estimate apparent fuel consumption in original units
Step 2: Convert to a common energy unit
Step 3: Multiply by carbon content to compute the total carbon
Step 4: Compute the excluded carbon
Step 5: Correct for unoxidised carbon and convert to CO2 emissions
The reference approach requires statistics on the production of fuels, on their external trade, as well as on changes in their stocks. It also requires some data on the consumption of fuels used for non-energy purposes.

International Recommendations for Energy Statistics (IRES)144
11.43. The energy sector is the major source of GHG emissions. According to the IPCC AR5, around 70 per cent of global GHG emissions in 2010 related to energy supply and use, with CO2 from fuel combustion accounting for a major part. Therefore, it is important, even critical, to accurately estimate energy-related emissions and CO2 emissions, in particular.
11.44. Estimates are normally done at the level of individual emission sources that may cor-respond to a physical facility (e.g. a power plant) or to an industrial or economic group (e.g. cement production). These estimates are then summed up to obtain sectoral and national totals by individual gases, as well as the total of all gases calculated as a weighted average in terms of the so-called CO2-equivalent. The number of individual source categories may vary depending on data availability, the organizational and methodological frameworks of the assessment, and the resources available. For each individual source category, CO2 emissions are often estimated using an equation of the type shown below:
Emissionsfuel = FuelCombustedfuel x EmissionFactorfuel, tech
where Emissionsfuel are CO2 emissions by type of fuel (for a given source category), FuelCombustedfuel is the quantity of fuel combusted, and EmissionFactorfuel, tech is the CO2 emission factor by type of fuel and combustion technology used. Sometimes a carbon oxida-tion factor is added to this equation. While the equation is simple, estimating values for the amount of fuel combusted and selecting emission factors consistent with the definitions of the IPCC emission categories may be difficult.
11.45. Regardless of the tier used, consumption of fuels by fuel/product type is the very first basic step in the estimation of CO2 emissions from fuel combustion. If this basic step is not done properly, the subsequent steps cannot result in an accurate estimate. Data on the production and consumption of fuels and energy products are part of national energy statistics, normally in the form of national energy balances. It is therefore unequivocal that the quality of GHG estimates depends critically on the quality of national energy statistics. This dependence is fully recognized by the IPCC Guidelines, which encourage the use of fuel statistics collected by official national bodies, as this usually provides the most appropriate and accessible data.
11.46. If national data sources are unavailable or have gaps, IPCC suggests using data from international organizations (based normally on national submissions from countries). The two main sources of international energy statistics are the UNSD and IEA. Both collect data from the national administrations of their member countries through questionnaires (thus collecting “official data”), and they exchange data to ensure consistency and prevent duplica-tion of efforts by reporting countries.
11.47. Estimating non-CO2 emissions from fuel combustion normally requires more specific methods than for CO2 emissions and more detailed information, such as the characteristics of fuel composition, combustion conditions, combustion technologies and emission control methods. Specific methods and data are also used for estimating fugitive CO2 and non-CO2
emissions. Such methods and associated data requirements can be found in the correspond-ing sections of the IPCC Guidelines. It is quite clear also in the Guidelines that for these emissions national energy statistics are indispensable for obtaining a solid emissions estimate.
11.48. A number of references related to GHG emission estimates are provided in the bibli-ography to this publication.

145
Annex A Primary and secondary products; renewables and non-renewables
Energy statistics conventionally distinguishes between primary and secondary energy prod-ucts, and between renewable and non-renewable products (see chapter II for definitions and other details). The cross-classification of these categories of energy products and their list are provided below.
Cross-classification of primary/secondary and renewable/non-renewable products
Primary products Secondary products
Non
-ren
ewab
les
01—Hard coal02—Brown coal11—Peat20—Oil shale30—Natural gas41—Conventional crude oil42—Natural gas liquids (NGL)44—Additives and oxygenates61—Industrial waste62 (partially)89—Municipal wasteNuclear heatHeat from chemical processes
03—Coal products
12—Peat products
43—Refinery feedstocks46—Oil products
Electricity and heat from combusted fuels of fossil origin Electricity derived from heat from chemical processes and nuclear heatAny other product derived from primary/secondary non-renewable products
Rene
wab
les
5—Biofuels (except charcoal) 62 (partially)—Municipal waste Heat from renewable sources, except from combusted biofuelsElectricity from renewable sources, except from geothermal, solar thermal or combusted biofuels90
516—Charcoal
Electricity and heat from combusted biofuels
Electricity from geothermal and solar thermalAny other product derived from primary/secondary renewable products
List of primary/secondary and renewable/non-renewables
SIEC HeadingsPrimary (P) /
Secondary (S)Renewable (R) /
Non -renewable (NR)
0 Coal NR
01 Hard coal P NR
011 0110 Anthracite P NR
012 Bituminous coal P NR
0121 Coking coal P NR
0129 Other bituminous coal P NR
02 Brown coal P NR
021 0210 Sub-bituminous coal P NR
022 0220 Lignite P NR
89 The part of municipal waste coming from biomass origin is considered renewable, whereas the part coming from fossil origin is considered non-renewable.
90 Renewable sources of electricity are comprised of: hydro, wind, solar (photovoltaic and solar thermal), geothermal, wave, tide and other marine energy, as well as the combustion of biofuels. Renewable sources of heat are: solar thermal, geothermal and the combustion of biofuels.
It should be noted that at the time of publication no internationally agreed definition of renewable and non-renewable products was available. Therefore, the list provided below is indicative and subject to amendments.
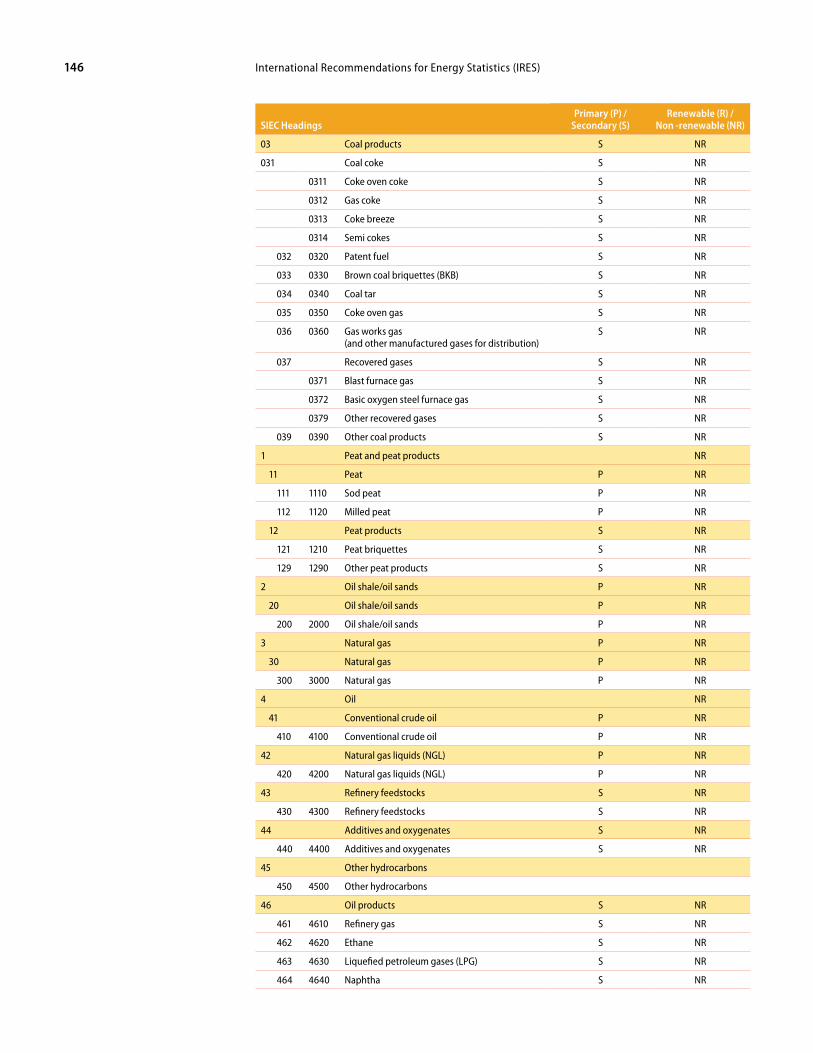
International Recommendations for Energy Statistics (IRES)146
SIEC HeadingsPrimary (P) /
Secondary (S)Renewable (R) /
Non -renewable (NR)
03 Coal products S NR
031 Coal coke S NR
0311 Coke oven coke S NR
0312 Gas coke S NR
0313 Coke breeze S NR
0314 Semi cokes S NR
032 0320 Patent fuel S NR
033 0330 Brown coal briquettes (BKB) S NR
034 0340 Coal tar S NR
035 0350 Coke oven gas S NR
036 0360 Gas works gas (and other manufactured gases for distribution)
S NR
037 Recovered gases S NR
0371 Blast furnace gas S NR
0372 Basic oxygen steel furnace gas S NR
0379 Other recovered gases S NR
039 0390 Other coal products S NR
1 Peat and peat products NR
11 Peat P NR
111 1110 Sod peat P NR
112 1120 Milled peat P NR
12 Peat products S NR
121 1210 Peat briquettes S NR
129 1290 Other peat products S NR
2 Oil shale/oil sands P NR
20 Oil shale/oil sands P NR
200 2000 Oil shale/oil sands P NR
3 Natural gas P NR
30 Natural gas P NR
300 3000 Natural gas P NR
4 Oil NR
41 Conventional crude oil P NR
410 4100 Conventional crude oil P NR
42 Natural gas liquids (NGL) P NR
420 4200 Natural gas liquids (NGL) P NR
43 Refinery feedstocks S NR
430 4300 Refinery feedstocks S NR
44 Additives and oxygenates S NR
440 4400 Additives and oxygenates S NR
45 Other hydrocarbons
450 4500 Other hydrocarbons
46 Oil products S NR
461 4610 Refinery gas S NR
462 4620 Ethane S NR
463 4630 Liquefied petroleum gases (LPG) S NR
464 4640 Naphtha S NR
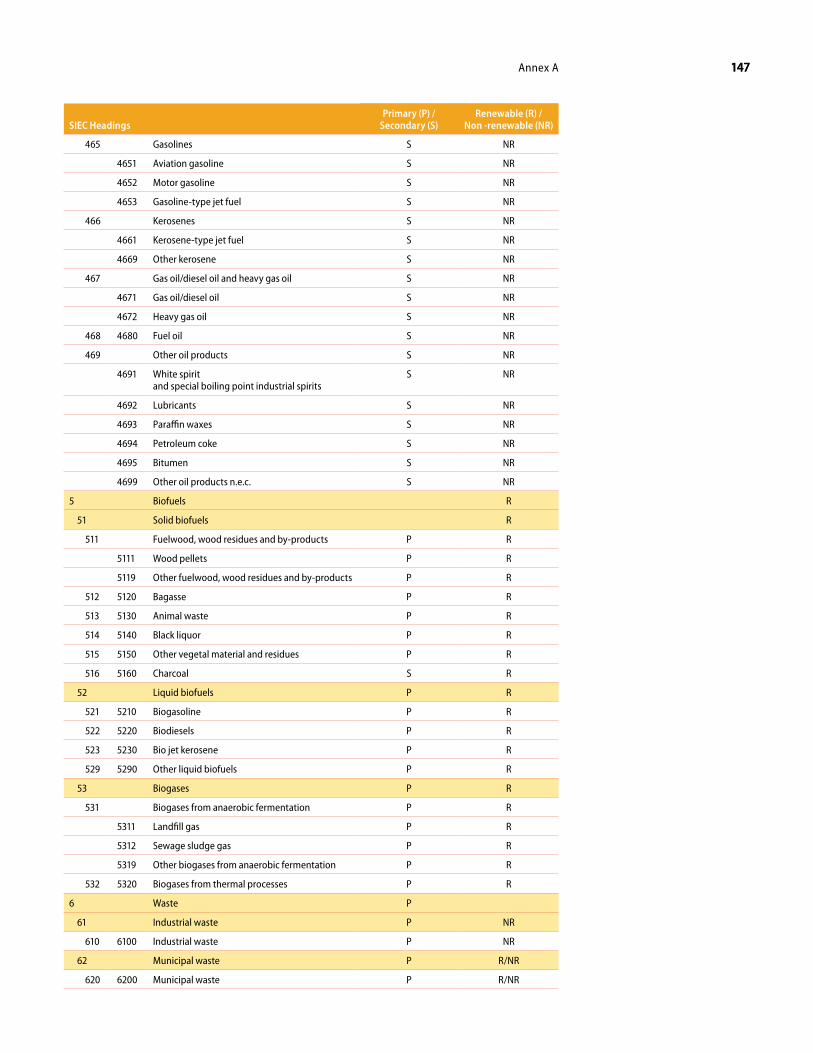
147Annex A 147
SIEC HeadingsPrimary (P) /
Secondary (S)Renewable (R) /
Non -renewable (NR)
465 Gasolines S NR
4651 Aviation gasoline S NR
4652 Motor gasoline S NR
4653 Gasoline-type jet fuel S NR
466 Kerosenes S NR
4661 Kerosene-type jet fuel S NR
4669 Other kerosene S NR
467 Gas oil/diesel oil and heavy gas oil S NR
4671 Gas oil/diesel oil S NR
4672 Heavy gas oil S NR
468 4680 Fuel oil S NR
469 Other oil products S NR
4691 White spirit and special boiling point industrial spirits
S NR
4692 Lubricants S NR
4693 Paraffin waxes S NR
4694 Petroleum coke S NR
4695 Bitumen S NR
4699 Other oil products n.e.c. S NR
5 Biofuels R
51 Solid biofuels R
511 Fuelwood, wood residues and by-products P R
5111 Wood pellets P R
5119 Other fuelwood, wood residues and by-products P R
512 5120 Bagasse P R
513 5130 Animal waste P R
514 5140 Black liquor P R
515 5150 Other vegetal material and residues P R
516 5160 Charcoal S R
52 Liquid biofuels P R
521 5210 Biogasoline P R
522 5220 Biodiesels P R
523 5230 Bio jet kerosene P R
529 5290 Other liquid biofuels P R
53 Biogases P R
531 Biogases from anaerobic fermentation P R
5311 Landfill gas P R
5312 Sewage sludge gas P R
5319 Other biogases from anaerobic fermentation P R
532 5320 Biogases from thermal processes P R
6 Waste P
61 Industrial waste P NR
610 6100 Industrial waste P NR
62 Municipal waste P R/NR
620 6200 Municipal waste P R/NR
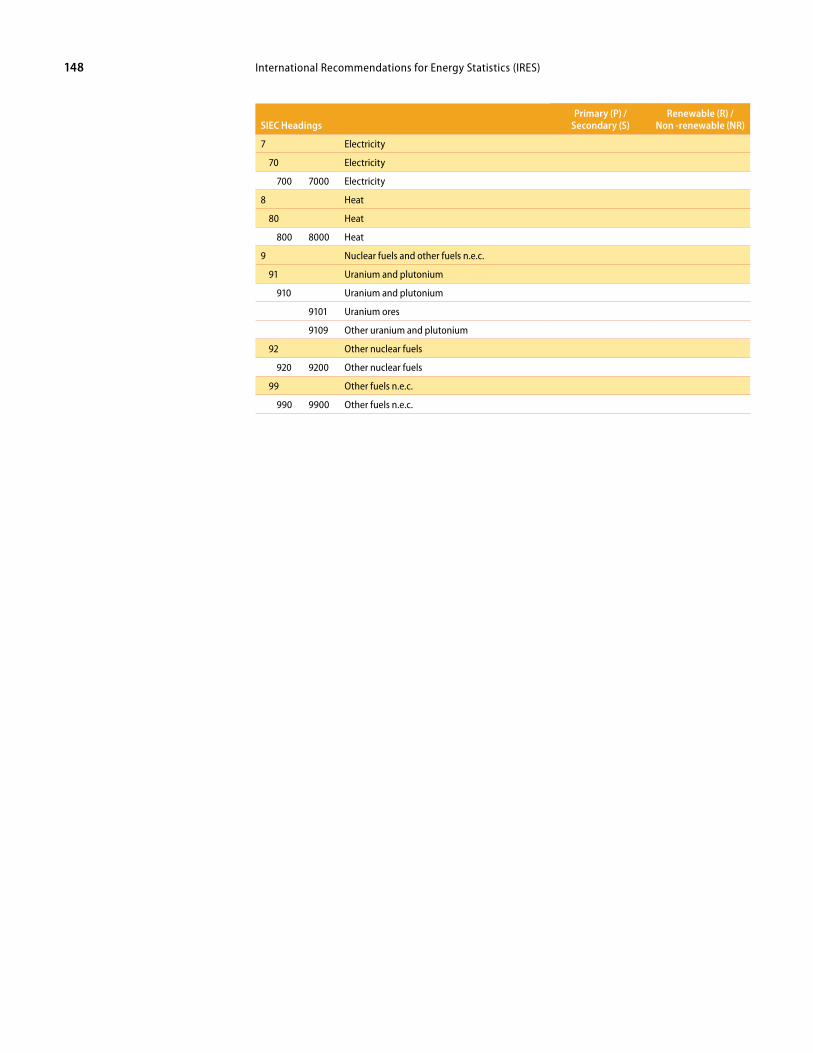
International Recommendations for Energy Statistics (IRES)148
SIEC HeadingsPrimary (P) /
Secondary (S)Renewable (R) /
Non -renewable (NR)
7 Electricity
70 Electricity
700 7000 Electricity
8 Heat
80 Heat
800 8000 Heat
9 Nuclear fuels and other fuels n.e.c.
91 Uranium and plutonium
910 Uranium and plutonium
9101 Uranium ores
9109 Other uranium and plutonium
92 Other nuclear fuels
920 9200 Other nuclear fuels
99 Other fuels n.e.c.
990 9900 Other fuels n.e.c.
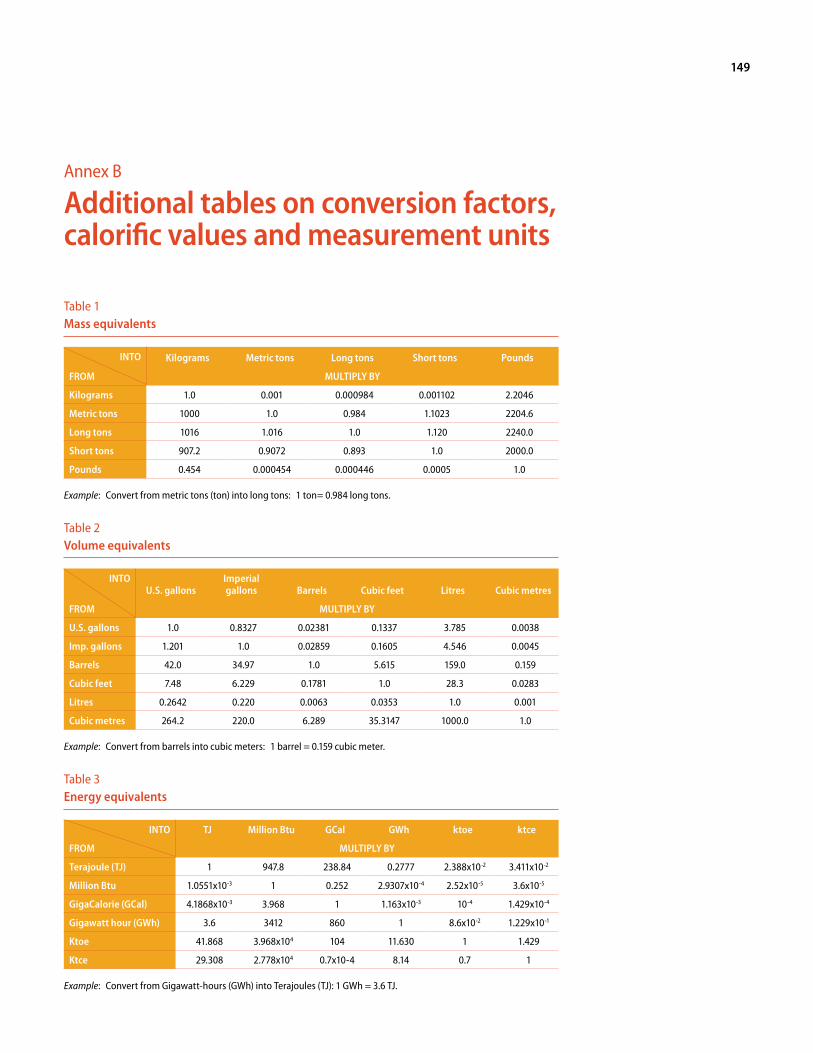
149
Annex B
Additional tables on conversion factors, calorific values and measurement units
Table 1Mass equivalents
INTo Kilograms Metric tons Long tons Short tons Pounds
FRoM MULTIPLY BY
Kilograms 1.0 0.001 0.000984 0.001102 2.2046
Metric tons 1000 1.0 0.984 1.1023 2204.6
Long tons 1016 1.016 1.0 1.120 2240.0
Short tons 907.2 0.9072 0.893 1.0 2000.0
Pounds 0.454 0.000454 0.000446 0.0005 1.0
Example: Convert from metric tons (ton) into long tons: 1 ton= 0.984 long tons.
Table 2Volume equivalents
INTo U.S. gallons
Imperial gallons Barrels Cubic feet Litres Cubic metres
FRoM MULTIPLY BY
U.S. gallons 1.0 0.8327 0.02381 0.1337 3.785 0.0038
Imp. gallons 1.201 1.0 0.02859 0.1605 4.546 0.0045
Barrels 42.0 34.97 1.0 5.615 159.0 0.159
Cubic feet 7.48 6.229 0.1781 1.0 28.3 0.0283
Litres 0.2642 0.220 0.0063 0.0353 1.0 0.001
Cubic metres 264.2 220.0 6.289 35.3147 1000.0 1.0
Example: Convert from barrels into cubic meters: 1 barrel = 0.159 cubic meter.
Table 3Energy equivalents
INTo TJ Million Btu GCal GWh ktoe ktce
FRoM MULTIPLY BY
Terajoule (TJ) 1 947.8 238.84 0.2777 2.388x10⁻² 3.411x10⁻²
Million Btu 1.0551x10⁻³ 1 0.252 2.9307x10⁻⁴ 2.52x10⁻⁵ 3.6x10⁻⁵
GigaCalorie (GCal) 4.1868x10⁻³ 3.968 1 1.163x10⁻³ 10-4 1.429x10⁻⁴
Gigawatt hour (GWh) 3.6 3412 860 1 8.6x10⁻² 1.229x10⁻¹
Ktoe 41.868 3.968x10⁴ 104 11.630 1 1.429
Ktce 29.308 2.778x10⁴ 0.7x10⁻⁴ 8.14 0.7 1
Example: Convert from Gigawatt-hours (GWh) into Terajoules (TJ): 1 GWh = 3.6 TJ.
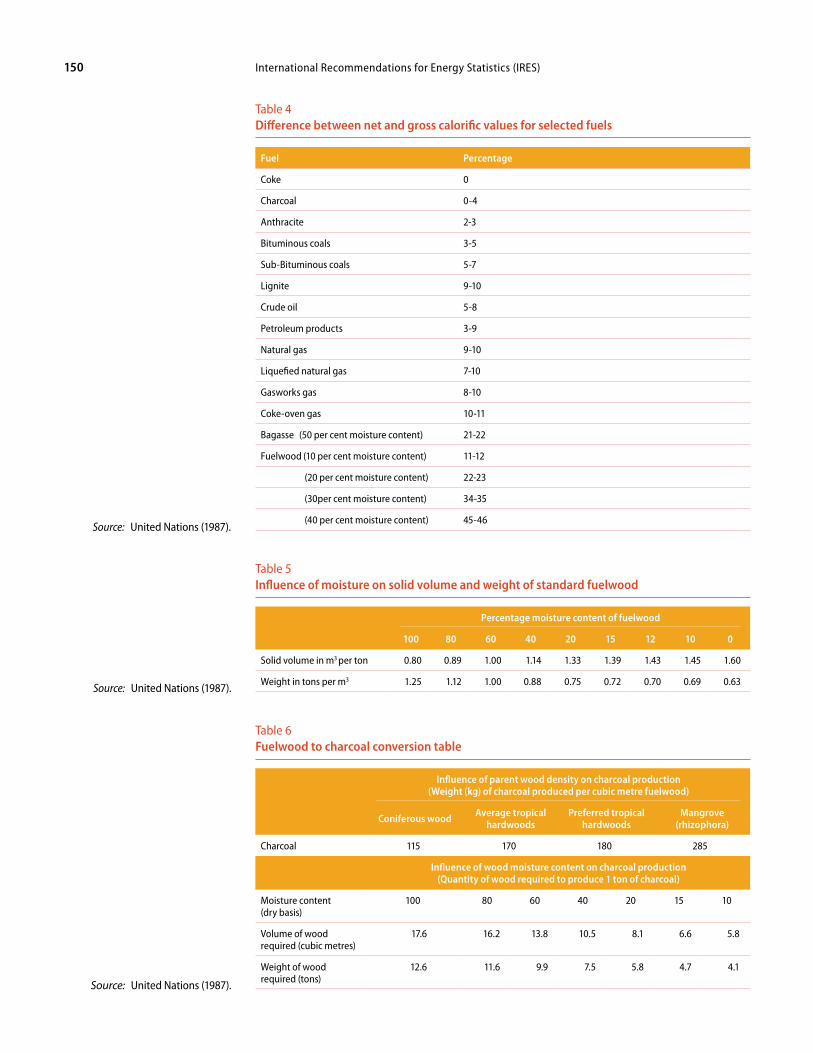
International Recommendations for Energy Statistics (IRES)150
Table 4Difference between net and gross calorific values for selected fuels
Fuel Percentage
Coke 0
Charcoal 0-4
Anthracite 2-3
Bituminous coals 3-5
Sub-Bituminous coals 5-7
Lignite 9-10
Crude oil 5-8
Petroleum products 3-9
Natural gas 9-10
Liquefied natural gas 7-10
Gasworks gas 8-10
Coke-oven gas 10-11
Bagasse (50 per cent moisture content) 21-22
Fuelwood (10 per cent moisture content) 11-12
(20 per cent moisture content) 22-23
(30per cent moisture content) 34-35
(40 per cent moisture content) 45-46
Table 5Influence of moisture on solid volume and weight of standard fuelwood
Percentage moisture content of fuelwood
100 80 60 40 20 15 12 10 0
Solid volume in m3 per ton 0.80 0.89 1.00 1.14 1.33 1.39 1.43 1.45 1.60
Weight in tons per m3 1.25 1.12 1.00 0.88 0.75 0.72 0.70 0.69 0.63
Table 6Fuelwood to charcoal conversion table
Influence of parent wood density on charcoal production (Weight (kg) of charcoal produced per cubic metre fuelwood)
Coniferous wood Average tropical hardwoods
Preferred tropical hardwoods
Mangrove (rhizophora)
Charcoal 115 170 180 285
Influence of wood moisture content on charcoal production (Quantity of wood required to produce 1 ton of charcoal)
Moisture content (dry basis)
100 80 60 40 20 15 10
Volume of wood required (cubic metres)
17.6 16.2 13.8 10.5 8.1 6.6 5.8
Weight of wood required (tons)
12.6 11.6 9.9 7.5 5.8 4.7 4.1
Source: United Nations (1987).
Source: United Nations (1987).
Source: United Nations (1987).
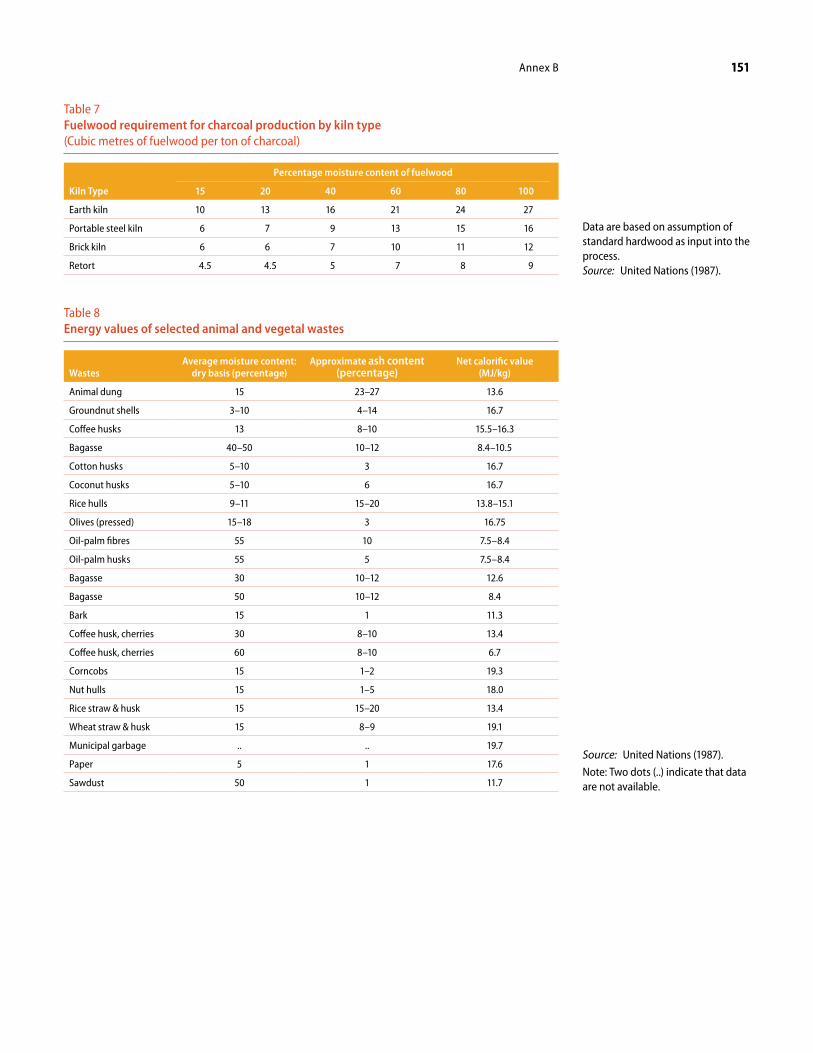
151Annex B 151
Table 7Fuelwood requirement for charcoal production by kiln type (Cubic metres of fuelwood per ton of charcoal)
Kiln Type
Percentage moisture content of fuelwood
15 20 40 60 80 100
Earth kiln 10 13 16 21 24 27
Portable steel kiln 6 7 9 13 15 16
Brick kiln 6 6 7 10 11 12
Retort 4.5 4.5 5 7 8 9
Table 8Energy values of selected animal and vegetal wastes
WastesAverage moisture content:
dry basis (percentage)Approximate ash content
(percentage)Net calorific value
(MJ/kg)
Animal dung 15 23–27 13.6
Groundnut shells 3–10 4–14 16.7
Coffee husks 13 8–10 15.5–16.3
Bagasse 40–50 10–12 8.4–10.5
Cotton husks 5–10 3 16.7
Coconut husks 5–10 6 16.7
Rice hulls 9–11 15–20 13.8–15.1
Olives (pressed) 15–18 3 16.75
Oil-palm fibres 55 10 7.5–8.4
Oil-palm husks 55 5 7.5–8.4
Bagasse 30 10–12 12.6
Bagasse 50 10–12 8.4
Bark 15 1 11.3
Coffee husk, cherries 30 8–10 13.4
Coffee husk, cherries 60 8–10 6.7
Corncobs 15 1–2 19.3
Nut hulls 15 1–5 18.0
Rice straw & husk 15 15–20 13.4
Wheat straw & husk 15 8–9 19.1
Municipal garbage .. .. 19.7
Paper 5 1 17.6
Sawdust 50 1 11.7
Data are based on assumption of standard hardwood as input into the process.Source: United Nations (1987).
Source: United Nations (1987).
Note: Two dots (..) indicate that data are not available.


153
References
Economic Commission for Europe (2004). United Nations Framework Classification for Fossil Energy and Mineral Resources. Available from www.unece.org/energy/se/pdfs/UNFC/UNFCemr.pdf.
——— (2009). United Nations Framework Classification for Fossil Energy and Mineral Reserves and Resources, ECE Energy Series No. 39. UNECE, Geneva. Available from www.unece.org /energy/se/unfc_2009.html.
European Commission et al. (2009). System of National Accounts 2008, United Nations publication, Statistical Papers, Series F, No. 2, Rev. 5.
European Union (2008). Regulation (EC) No 1099/2008 of the European Parliament and of the Council of 22 October 2008 on energy statistics.
Food and Agriculture Organization of the United Nations (2004). UBET: Unified Bioenergy Terminology. Available from www.fao.org/docrep/007/j4504e/j4504e00.htm#TopOfPage.
——— (2010). Yearbook of Forest Products 2008. Available from www.fao.org/docrep/012/i1521m /i1521m02.pdf.
International Atomic Energy Agency, United Nations, International Energy Agency, Eurostat and European Environment Agency (2005). Energy Indicators for Sustainable Development: Guide-lines and Methodologies. IAEA, Austria.
Intergovernmental Panel on Climate Change (1997). Revised 1996 IPCC Guidelines for National Greenhouse Inventories, vols. 1–3. IPCC, IPCC/OECD/IEA, Paris, France. Available from www.ipcc-nggip.iges.or.jp/public/gl/invs1.htm.
——— (2000). Good Practice Guidance and Uncertainty Management in National Greenhouse Gas Inventories. IPCC, IPCC/OECD/IEA/IGES, Hayama, Japan. Available from www.ipcc-nggip.iges.or.jp/public/gp/english.
——— (2003). Good Practice Guidance for Land Use, Land-Use Change and Forestry. IPCC, IPCC/IGES, Hayama, Japan. Available from www.ipcc-nggip.iges.or.jp/public/gpglulucf/gpglulucf .htm.
———. (2006). 2006 IPCC Guidelines for National Greenhouse Gas Inventories. IGES, Japan. Available from www.ipcc-nggip.iges.or.jp/public/2006gl/index.html.
International Labour Organization, International Monetary Fund, Organisation for Economic Co-operation and Development, Eurostat, Economic Commission for Europe and World Bank (2004). Consumer Price Index Manual: Theory and Practice. Geneva, ILO. Available from www.ilo.org/public/english/bureau/stat/guides/cpi/index.htm.
International Labour Organization, International Monetary Fund, Organisation for Economic Co-operation and Development, Economic Commission for Europe and the World Bank (2004). Producer Price Index Manual: Theory and Practice. Washington, D.C, IMF. Available from www.imf.org/external/np/sta/tegppi/index.htm.
International Labour Organization, International Monetary Fund, Organisation for Economic Co-operation and Development, Economic Commission for Europe and World Bank (2009). Export and Import Price Index Manual: Theory and Practice. Washington, IMF. Available from www.imf.org/external/np/sta/tegeipi/index.htm.
International Energy Agency, Eurostat, Organisation for Economic Co-operation and Development (2005). Energy Statistics Manual. Paris, France.
International Recommendations for Energy Statistics (IRES)154
United Nations (1982). Concepts and Methods in Energy Statistics, with Special Reference to Energy Accounts and Balances: A Technical Report, Statistical Papers, Series F, No. 29. Available from http://unstats.un.org/unsd/pubs/gesgrid.asp?ID=20.
——— (1987). Energy Statistics: Definitions, Units of Measure and Conversion Factors, Statistical Papers, Series F, No. 44. Available from http://unstats.un.org/unsd/pubs/gesgrid.asp?ID=37.
——— (1991). Energy Statistics: A Manual for Developing Countries, Statistical Papers, Series F, No. 56. Available from http://unstats.un.org/unsd/pubs/gesgrid.asp?ID=51.
——— (2008a). International Standard Industrial Classification of All Economic Activities, Statistical Papers, Series M, No. 4 , Rev. 4. Available from http://unstats.un.org/unsd/cr/isic-4.asp.
——— (2008b). Central Product Classification, Version 2, Statistical Papers, Series M, No. 77, Ver. 2. Available from http://unstats.un.org/unsd/cr/cpc-2.asp.
——— (2009a). International Recommendations for Distributive Trade Statistics 2008, Statistical Papers, Series M, No. 89. Available from http://unstats.un.org/unsd/pubs/gesgrid.asp?id=407.
——— (2009b). International Recommendations for Industrial Statistics 2008, Statistical Papers, Series M, No. 90. Available from http://unstats.un.org/unsd/industry/guidelines.asp.
——— (2010). International Merchandise Trade Statistics: Concepts and Definitions 2010, Statistical Papers, Series M, No. 52, Rev. 3. Available from http://unstats.un.org/unsd/statcom/doc10 /BG-IMTS2010.pdf.
——— (2015). Central Product Classification, Version 2.1, Statistical Papers, Series M, No. 77, Ver. 2.1. Available from http://unstats.un.org/unsd/cr/cpc-21.asp.
——— (forthcoming). System of Environmental-Economic Accounting for Energy, Final draft. Available from http://unstats.un.org/unsd/envaccounting/seeae/chapterList.asp.
Reference for greenhouse gas emissions
United Nations Framework Convention on Climate Change homepage, available from http://unfccc .int/2860.php.
National Greenhouse Gas Inventory Submissions by Annex I Parties available from http://unfccc.int /national_reports/annex_i_ghg_inventories/national_inventories_submissions/items/5270 .php.
Online data interface providing access to all GHG data reported under the Climate Change Conven-tion available from http://unfccc.int/ghg_data/items/3800.php.
Report of the Conference of the Parties on its Nineteenth Session, held in Warsaw from 11 to 23 November 2013. Addendum. Part two: Action taken by the Conference of the Parties at its Nineteenth Ses-sion (FCCC/CP/2013/10/Add.3). Available from http://unfccc.int/resource/docs/2013/cop19 /eng/10a03.pdf.
World Meteorological Organization homepage, available from https://public.wmo.int/en. World Meteorological Organization statements on the status of global climate available from
www.wmo.int/pages/prog/wcp/wcdmp/CA_2.php.World Meteorological Organization Greenhouse Gas Emissions Bulletin available from https://public
.wmo.int/en/resources/library/wmo-greenhouse-gas-bulletin.

ISBN 978-92-1-161584-5
Intern
ation
al Reco
mm
end
ation
s for E
nerg
y Statistics
13-1
2499