international research into developing integrated …2/041+2roberti.pdf · international research...
TRANSCRIPT

Austrian Journal of Statistics Volume 33 (2004), Number 1&2, 3-33
International Research into Developing Integrated and Systematized Information Systems (EISIS) for EU
Business Policy Impact Analysis
Paolo Roberti1 ISTAT (Italian Statistical Institute), Rom
Abstract: The author reports on two EU funded projects involving various government departments and academic institutes. “DIECOFIS” assesses the issues facing modelers in developing multi-sourced micro-databases of the business sector in Italy and the UK to improve the measurement and analysis of fiscal and economic issues, particularly those relating to competitiveness, fiscal stability, and comparative taxation. Euroky-Pia addresses the issue of establishing knowledge databases to support policy impact analysis across all areas of government. The paper focuses on the high level issues such as the assessment of user need, co-ordination of data from administrative and statistical sources, the roles and constraints affecting the organizations contributing to analysis, and the key differences in national circumstances. Different modeling approaches are addressed. Zusammenfassung: Der Autor berichtet über zwei EU-finanzierte Projekte, an denen mehrere öffentliche Institutionen und akademische Institute mitarbeiten. DIECOFIS befasst sich mit Problemen, die bei der Entwicklung von Datenbeständen von Mikro-Daten durch Zusammenführen von mehreren Datenbeständen zu lösen sind. Auf Basis solcher integrierter Datenbestände sollen verbesserte Verfahren des Messens und der Analyse von Sachverhalten des Wirtschaftslebens entwickelt und insbesondere Aspekte der Wettbewerbsfähigkeit und Auswirkungen auf die Steuersysteme vergleichend untersucht werden. Euroky-Pia zielt auf das Erstellen von Wissens-Datenbanken, mit deren Hilfe die Auswirkungen von politischen Maßnahmen auf alle möglichen Bereiche der öffentlichen Verwaltung untersucht werden können. Das Manuskript befasst sich mit zentralen Fragen wie der Bewertung von Anforderungen der Nutzer, der Koordination von administrativen Daten und amtlichen Datenbeständen, der Rolle und den Beschränkungen von unterschiedlichen beteiligten Organisationen und Institutionen und den Auswirkungen der verschiedenen nationalen Einbettungen. Das Manuskript behandelt mehrere Ansätze der Modellierung. Keywords: Drivers of Change and Growth, Performance Indicators, Tax Modelling and Microsimulation Models to Improve Policy Analysis in the
1 The views expressed in this paper are those of the author. They cannot and should not be attributed to his employer. This paper draws on work carried out under the two IST FP5 Project DIECOFIS and EUROKY-PIA and, specifically, an earlier paper written with Richard Eason and Filippo Oropallo (2003). Thanks are due to M.G. Calza, L. Lo Cascio and Alessandro Fazio.

4 Austrian Journal of Statistics,Vol. 33 (2004), Number 1&2, 3-33
EU, Multisource Database Integration, Enterprises Integrated and Systematized Information Systems
1 Introduction
At the end of the day, policy impact analysis (PIA) means “numbers” and companion information or evidence that can serve to (i) promote and support evidence-based policy choices; (ii) foster debates and it make easier to reach consensus, by separating “facts” from “judgments”; (iii) nurture multilevel openness, participation, accountability, effectiveness and overall coherence; (iv) open up of the policy-making process to get more people and organizations involved in shaping and delivering EU and member States policies; (v) include stakeholders and the civil society; (vi) answer to a series of ‘what if ‘ questions; (vii) draw “scenarios” and “landing spaces”, that can play an important role in informing about the future (such as for the assessment of sustainability) backed by economic and social scientific thinking; (viii) distinguish between “best” and “worst” policies on account of scientific evidence on a whole range of effects that can be associated to new policies, not on judgments and partial assessments; (ix) reinforce the culture of consultation and dialogue by offering a platform to broaden debates; and (x) enhance democratic accountability, assist political decisions, promote closer understanding and support programs implementation and management. Unlike North America, Australia and New Zealand, PIA in Europe is an under-research and underdeveloped area. With the notable exception of the UK and other Nordic countries, existing capacity is in short supply. EU Institutions are no exception. Indeed, many EU governments and the Commission appear to suffer from what has been called the “Master Artificer” or “Absolute Wisdom” syndrome2, which entails a conspicuous preference for the top down, allegedly “scientific” and “technocratic” approach to decision, not policy making, based on the judgement that policy makers always know best. This view has evolved considerably since the 1970s. Increasingly, PIA has come to be seen as an instrument to reinforce the culture of consultation and dialogue, and to enhance democratic accountability and assist political decisions. Nowadays, the question at issue is, as C.L. Schultze put it almost half a century ago, “..is not how Policy Impact Analysis can supplant the political process, but whether and how it can fit into that process and permit evidence base debates and decisions…. Policy impact analysis is not a substitute for good judgement, political wisdom and choice”3.
Since the May 2000 Lisbon Meeting, things have started to move in Brussels. This is witnessed by the 2001 “Governance White Paper”, by the Commission decision on “Impact Analysis” and by a host of related documents. Among these, is the European Commission “European Competitiveness Report 2002”, where the need for PIA is witnessed by the statement that the Commission intends to develop a multisectoral framework to link enterprise and competition policies and national States regional aid
2 W. C Baer “On Making of Perfect and Beautiful Social Programs”, The Public Interest, 39, Spring 1975, p.85. 3 Schultze C.L., The Politics and Economics of Public Spending, Brookings, Washington D.C., (1968), p.55.

decisions, to select the sectors to be regarded as sensitive and to examine their impact. Concern has also been is rising for issues such as: (i) is it possible to de-link “evidence based policy” from “Good Governance?”; (ii) are “one-size/typology fits all” policy good for all member countries, i.e. have they a uniform impact across the EU, irrespective of underlying socio-economic structures?; and (iii) do policy-maker have the “compass” and the “maps” and, more generally, the knowledge and information which they need?
Research resources committed to the development of PIA knowledge and capacity in the EU area remain, however, scanty. Possibly because the need, the effort and the investment which are entailed are underrated. PIA is data thirsty and requires microsimulation models and other tools. Without data, microsimulation models cannot generate the policy “evidence”, that is the estimates, the coefficients and the indicators upon which public choices can be made and good policies implemented. Without resolve, progress can scarcely be expected to occur in the medium-term.
In this paper, lessons are drawn from experience on two EU IST FP5 projects: DIECOFIS (Development of a System of Indicators of Competitiveness and Fiscal Impact on Enterprises Performance) and EUROKY-PIA (Developing European Knowledge for Policy Impact Analysis). These have permitted to pilot test problems in two member countries, and to map the way ahead in view of extending the work done to cover the whole EU area. Results have been rewarding. They have “offered a taste” of the value added that is created, and of the opportunities that open up in the two research areas of policy micromodelling and statistics, when an integrated and comprehensive analytical approach is adopted. Achievements have included: factuals and counterfactuals; well-behaved performance indicators (one-, n-dimensional, composite and decomposable); an integrated and systematized statistical Information System for entreprises (EISIS), which have supported (i) the production of large scale performance maps, that can be “blown up” and customized; and (ii) benchmarking of national tax systems across and within countries.
This paper has seven parts. The first three provide a description of the “swings in focus” which have occurred over time in socioeconomic research, the reasons behind them, and the fast growing demand which has ensued from these trends for micro data increasingly customized to suit users’ needs, not just governments’. Parts four, fifth and sixth discuss the DIECOFIS and EUROKY-PIA projects: their background, objectives and accomplishments. Finally, Part 7 highlights the lessons that can be drawn and directions for future research.
2 Analytical “Visions” and Swings Between the Micro and Macro Research Scales
In the course of human history, the focus of socio-economic research has swayed backward and forward on the swing of the micro and macro research scales. The former, practically dominated until the mid 1800s. The latter, instead, began to attract momentous interest only much later, with a pace which was slow at first, and a lot faster from around 1930. This research scale became definitely predominant after World War II. However, by the end of the 1980s the pendulum begun to swing back again, as

6 Austrian Journal of Statistics,Vol. 33 (2004), Number 1&2, 3-33
witnessed by the growing emphasis on the micro and meso analytical scales, and on the need to integrate all three dimensions within consistent, comprehensive analytical frameworks.
At first sight, these swings may be interpreted as the consequence of an unremitting struggle, with alternate outcomes, between different visions and approaches. As it happens, they represent steps forward towards a better understanding of demographic and socioeconomic trends and a wide range of life phenomena and interactions which occur over time among manifold factors, including human, social, technological, institutional, policy and behavioral. All along, advances and setbacks plot the way ahead. They form a continuum towards the development of comprehensive analytical frameworks, tools, measures and data for the study of economic and social events, behaviors and policies, in a never ending quest for unveiling causal relationships and generating knowledge that can be applied to grasp the outlook, envision “paths” and shape the future by
• using macro and microlevel databases and models4;
• simulating the behavior of individual decision units and governments;
• applying probabilistic and other techniques5
such as with Keynesian macro modeling, which has universally been developed “..to forecast the main aggregates of economic activity in national accounting terms, ..as background to the various government budgets”6; and with Orcutt’s microsimulation techniques, which have spread and which are used to simulate factuals and counterfactuals for public policy evaluation and monitoring purposes7.
Key drivers behind the swing in the first half of the 1900s, towards the macro research scale were the stock market crash in 1929 and the end of laissez-faire; Keynesian economic thinking, with its faith in economic management and focus on aggregation at the national scale (that is on aggregates, levels and volumes, processes, identities and relationships); on aggregate variables (dependent and independent), propensities and multipliers; on studies of the trend of the dynamic of the (time) path for macro variables, centered on short- and long-run growth, structural change, “regimes” (growth models) and, more generally, on blueprints for growth/development in terms of progress towards a selection of aggregate welfare goals. As Michael Bruno noted in the early 1960s, after World War II there was broad agreement as to goals, needs and broad aims of government intervention, but “…little had been done in the way of integration of individual sector plans and policy measures into one consistent whole”. The policy-making process was fragmented and compartmentalized. It lacked of aggregate frameworks (such as the national accounting frameworks which have eventually been developed for economic policy and development forecasting) that could serve to
4 Such as, general equilibrium models, standard CGE, regional GEA microeconomic simulation models linked/not linked to macro/sectoral models, partial equilibrium models. 5 Such as specific purpose built models ex-ante and ex-post marginal incidence analyses; program evaluation adjusting for possible selection process; qualitative and quantitative program evaluation. 6 National Research Council, Improving Information for Social Policy Decision. Review and Recommendations, National Academy Press, Washington D.C. ( 1993) p.109 7 Orcutt G.H., “A New Type of Socio-Economic System”, Review of Economics and Statistics, 80 (1957) 1081-1100.

produce long-term forecasts which could be translated “..into annual ‘National Budget’ … intended to form the background to the various government budgets submitted to Parliament. (and) intended to indicate the pattern of economic policy most suitable for attaining specific and agreed upon economic goals..”8
Analytical Research Scale Time Micro Macro Meso
.. .. .. .. 1850
1930
1960 1980
1990
2000
Figure 1: Epochs in the Micro/Macro Research Swing
The standing of aggregates reached its apex during the years from the early 1900s and the beginning of the 1980s, primarily with Keynesian modeling and its supporting structured system of statistics (SNA), when it was assumed that structures and patterns could be depicted within common frameworks by “a set of neatly packaged national boxes”. These, by condensing all information into “points estimates”, were thought they could effectively be used for analytical and policy purposes and, specifically, to steer the economy towards stable growth. Their attraction was obvious, as witnessed by their spread and use. However, it was not justified, as indicated by a number of factors and subsequent developments from the late 1960s onward, especially on patterns and models of growth and other issues, such as those allied with:
8 Bruno M., “The Use of National Accounting Frameworks for Economic Policy and Development Forecasting: A Survey of Israel’s Research Experience 1958-61” in Clark C. and Stuvel G., Income Redistribution and the Statistical Foundations of Economic Policy, Bowes & Bowes, London, (1964), p.1.

8 Austrian Journal of Statistics,Vol. 33 (2004), Number 1&2, 3-33
• Multidimensionality, heterogeneity and complexities of various types, pertaining to concepts, definitions and measures (such as notions of growth, inequality and sustainability).
• Complementarities and clashes between different objectives (e.g., growth may not necessarily be pro-poor) and calls for measures that are able to catch the full dimensions of change (e.g., are sensitive to changes occurring in different components or at different levels; are well-behaved and so on);
• The revival of a Schumpeterian type hostility towards “totalities” which are essentially “creations of statisticians.. that.. vitiate the search for actual causations”9 and do not help to configure aggregates/groups which are homogeneous and retain both their space and time dimensions (such as, nations, economies and populations).
• The global shifts which change the world map and make it appear vastly more complicated than twenty or thirty years ago10. Admittedly, these shifts have made it increasingly difficult to catch trends and their distinctive features with the available analytical lenses of the national unit and the elaborate companion statistical system of national accounts;
3 Socioeconomic Transformations and Challenges to National Aggregates and Macro “Point Estimates”
The first test to aggregates came during post-WWII boom years from signs alerting that economic growth was not creating just new “welfares”, but also a plethora of new and old “diswelfares” which, unlike the former, were not accounted for in the narrow SNA framework11. The latter, was also overlooking changes occurring in income distribution or at the structural level. As it happened, it progressively became obvious that trends in incomes and inequality might diverge; that steadfast growth in high income countries would not necessarily be making everybody better off, rich and poor –as postulated by the then widely held Kuznet’s inverted-U curve hypothesis; that equality would not necessarily be brought about or poverty reduced by growth; that welfares and diswelfares would not necessarily be symmetrically distributed; and that throwing money at problems would not necessarily contribute to solve them.
Confronted with distributive problem, and a host of other socio-economic hurdles, “aggregates” (e.g. GDP growth rates, overall indices of inequality and other synthetic coefficients) increasingly showed their pitfalls and drawbacks, and failed the test. They began to
• “breed offspring”, such as social indicators, which swell to an incredible number during the 1970s;
9 Brookfield H., Interdependent Development, Methuen & Co. Ltd. , London, (1975), p.191. 10 Dicken P., Global Shift, PCP Ltd, London, (1999), pp.60-68. 11 Titmuss R.M., Social Policy, Allen & Unwin, London, (1974), p.27.

• “break up”, such as decomposable indicators (e.g. Gini’s and other similar overall indices);
• “add up”, such as composite and multidimensional indicators (e.g. the FGT poverty index and the UNHD index ); and
• cluster, group and subgroup, such as benchmarking indicators and satellite accounts.
More generally, the research context gradually widened, and the spotlight turned away from the complexity of the economy towards the complexity of social systems and human beings; from workers and economic men towards “whole men”12; and from national aggregations towards regional disparities, structures and systemic features. Accordingly, aggregates began to be supplemented and, in specific instances supplanted, by custom-made statistics bespoken for homogeneous segments, groups, subgroups (e.g. subdivisions and sectors), and typical situations or circumstances (e.g. the OECD average production worker). Likewise, research thrived on
• the study of properties and general criteria deemed desirable in the use of aggregates –in an attempt to establish rules for discriminating between situations in which their use is permissible and meaningful, and those in which it is not; and on
• using microlevel data bases, probabilistic techniques and micro (dynamic and static) models (e.g. Orcutt) for analyzing the effects of national economic and social policies on individual decision units (which may be families, doctors, hospitals, corporations and so on), by simulating their behavior –which were thought would “..provide a richer and much more realistic tool for policy analysis than could the macroeconomic models of the national economy”13; and open up new vistas for the development of purpose-shaped and well-behaved, micro-founded indicators.
The second test to aggregates came during the 1980s, from advances in the macroeconomic theory of growth triggered by empirical and theoretical microeconomic research on technical change, disparities, economic structures and organization and other interdependencies and interactive effects bearing out, as Landau et al put it
• That history, internal behavior and structures matter;
• That national, regional, industry, and firm level differences matters and leave a legacy;
• That, which industries or firms survive in world competition matters; and
• That countries, industries, and firms that pay proper attention to structural and systemic issues can consistently do better than others14;
12 Titmuss R.M., Income Distribution and Social Change, George Allen & Unwin Ltd. London, (1962), Ch.9. 13 National Research Council, op. cit., p.110. 14 Landau R., Taylor T. and Wright G. (eds), The Mosaic of Economic Growth, Standford University Press, Standford, (1996), p.13.

10 Austrian Journal of Statistics,Vol. 33 (2004), Number 1&2, 3-33
From the 1990s, the process of change has gained new momentum, furthered by new waves of technological change and by globalization. It has taken novel, ICT shaped features. It has become more dramatic. The global geography of human activity has been in constant turmoil and has been transforming fast. Patterns and structures have become much more complex and multiscale. At the systemic level, a network of intricate and changing relationships has emerged and formed what has been called a “mosaic of unevenness in a continuous state of flux”15. Unless the traditional, economy-wide level picture can be aggregated at the global level and disaggregated, step by step, down to the basic functions of firms, the diversity of factors, the inter-relationships, the complexity and volatility which characterize real-world processes cannot be uncovered, neither can the true determinants of a country’s productivity and living standards.
If yesterday it was sufficient to support research with national aggregates, developments such as those described above are making it necessary to look through and beyond aggregates. At present, the latter continue to constitute functional “frames” within which individuals, firms and other entities can usefully be aggregated. Alone, however, they inhibit the observation of structures, interdependencies and relationships within and between units belonging to the same, to distinct or to several aggregates or levels of analysis16. Inevitably, therefore, valuable information on drivers of change and performance remains hidden underneath aggregates and is lost. Until the dis-aggregate function is built in into existing statistical frames, valuable and badly needed micro information will continue to remain uncovered and unexploited.
4 Social Statistics Have Progressed and have been Customized to Users’ Needs. Economic Statistics Have Lagged Behind
Social policy analysts have been the first to be bewildered and challenged by the pitfalls and shortcomings of aggregates. They have also been the first to move beyond aggregates and to engage into developing information hyper and microcubes that can be “sliced”, “diced” and “drilled” in order to be able to navigate macro frames, horizontally and vertically; across dimensions and over time (to chain link indicators referring to different dimensions and characters; benchmark, monitor, simulate and assess; map socio-economic structures at different levels to identify best performers, gainers and losers, drivers, factors/areas of systemic weakness and strength and of progress and decline; and so on). Accordingly, good analysts have dovetailed macro, meso and micro research within an increasingly robust, integrated, multidimensional and topical analytical framework. Economic policy analysts, instead, have by and large continued to focus on macro and sectoral aggregates and relationships. Micro level research has been hindered by the databases available in both instances. However,
15 Storper M. and Walker R., The Spatial Division of Labour: Labour and the Location of Industries” in Sawers L and Tubb W.K. (eds), Sunbelt/Snowbelt: Unrban Development and Regional Restructuring, Oxford University Press, New York, (1984), p. 37. 16 Brookfield H. C., Multum in Parvo: Some Questions about Diversification in Small Countries, in Selwing P. (ed.) Development Policy in Small Countries, London, (1975).

mapping systemic economic features and change onto micro-systems remains by far and for the most part an under researched area. Progress in the social field has instead been impressive.
The social indicators adventure of the late 1960s and 1970s established the limits of summary descriptive statistics for policy impact analysis (PIA). Since then social PIA has made advances which at the time were difficult to imagine. This is witnessed by the swelling availability and extensive use of households’ micro data and microsimulation (static and dynamic) models, and by the development of a host of micro-founded (summary and decomposable) indicators. The tools developed for the analysis of inequality and poverty, and their high degree of sophistication provide notable examples of the developments that have occurred.
Presently, the focal point of social PIA has moved on from ratios and indicators to statistics that can assist in the unraveling of the complex and multi faceted social policy conundrum. This involves dealing with matters relating to severity, relativities, duration, causal links, delivery options, competing claims and choice between programmes which can differently impact on persons and groups.
In other words, the limelight has turned away from aggregate snapshots and coefficients to distributional analysis within an integrated analytical framework that acknowledges interrelationships (such as between different policies) as well as the existence of multifarious other elements17. In the end, sets of “purpose oriented” and “scope fulfilling” indicators have replaced the long lists of crude, area-specific summary/average ratios popular in the 1970s and 1980s. In parallel, and to facilitate these developments, national statistical institutes have tailored the supply of social statistics to social policy analysts’ and social PIA’s demands. There is now the increasingly widespread practice of collecting data through multi-topic and longitudinal household surveys18 and the increasingly unproblematic access to micro households datasets (such as the LIS-Luxembourg Income Study data set).
But no similar development has occurred in the field of economic analysis. Here, the object of analysis and the data that are used are predominantly macro and meso (sectoral and territorial). Amazingly, enterprise microdata are still quite difficult to access. Moreover, enterprise data collection is segmented and uncoordinated. Use of multi-topical surveys is not widespread, and the ensuing fragmentation of available information compels analysts to research in an “environment with many blind spots, where crucial information may be seen only dimly or not at all”. Each survey is shaped by a single topic or dimension. Even when datasets can be linked and merged together easily, they normally remain separate. And, when data sets are integrated, it is more often for validation rather than research purposes. In practice, there is a sizeable wedge between the information that is potentially available and the one that is actually accessible. Microeconomic research is hindered and research opportunities are foregone. For instance, if economic growth is buoyant and income grows, we can draw detailed charts to map income distribution. These reveal the gainers and the losers, income gaps and differentials, and whether income inequalities have fallen or widened. 17 Including first and second order effects, changes in individual behaviour, take-up, enforcement and compliance hitches, such as insufficient information and lack of knowledge, fraud and sheer error. 18 See. Eason, R., Microsimulation for direct taxes and fiscal policy in the United Kingdom, prepared for IARIW conference in Canberra, December 1993, in: A Harding, Microsimulation and Public Policy, North Holland Ed. (1996).

12 Austrian Journal of Statistics,Vol. 33 (2004), Number 1&2, 3-33
No similar information is accessible for the income production side. Individual enterprises can seldom, if ever, be ranked according to their performance. Important questions remain unanswered, such as: has growth been good because performance has improved for all firms, or only for some? Whose performance has increased most? Have performance gaps widened or shrunk? What are the traits and the profile of best performers? Are best performers gaining or loosing ground?
In practice, social statistics have progressed and have increasingly been customized to tailor users’ needs. Instead, developments in economic statistics have lagged behind. Sheer lack of information and little access to micro data are the culprits. The information wedge has hindered the development of serious microeconomic analysis of systemic and policy aspects, such as incentives, drivers, “differential effects” and patterns. This has also hindered the development of micro economic models for enterprise analyses and policy, or greatly reduced their scope. When they have been developed, they have had to be based, with very few exceptions, on a small fraction of the information needed or potentially available.
5 Enterprises Integrated and Systematized Information Systems (EISIS) and Microsimulation Models to Improve Policy Analysis in the European Union
Against this background, it has appeared important to gather research consensus on the scope for the development of enterprise analytical tools, such as microsimulation models and the information to support them, including integrated and systematized information systems (EISIS). To this effect, Istat in Italy and Inland Revenue in the UK have joined forces and taken the lead to develop two EU FP IST projects, DIECOFIS and EUROKY-PIA, to generate critical research mass to test and pilot problems and methods, develop prototypes and search for the best ways that can eventually lead to fill an increasingly patent gap in economic policy analysis. Istat started from the perspective of a national statistics office with wide ranging data collection responsibilities, while the Inland Revenue began from the perspective of a department with policy responsibilities and limited data of its own from the administration of its policies. Moreover, notable national differences in organization, law, culture, and practice appeared to be desirable factors in the decision to undertake a project expected to chart the way for other EU countries and, eventually, the development of an EU wide microsimulation tax model. The DIECOFIS and EUROKYPIA EU IST 5th Framework Programme Projects: Background, Objectives and Main Results a) DIECOFIS - Background and Main Objectives: Tax policy remains a critical issue in the EU policy agenda. Member countries have not yet developed the instruments and PIA knowledge needed to properly inform debates on business performance and taxation.

In spite of extensive discussions, by experts’ and working groups and a crowd of reports [ ], the "facts" on the impact of taxation on businesses are scanty. Those available have a high degree of approximation and are not necessarily informative. Existing tax indicators have well-known pitfalls and drawbacks. Clearly, they do not catch the great diversity and wide dispersion (much greater than for individuals and families) which is observed in actual ratios, nor their sensitivity to different “real drivers”, that is to choices that can lead companies to pay more or less tax as a proportion of their profits or performance. Analysis of the specimen average wage earner across countries is simple and helpful, but analysis of the average company is neither.
Understanding how taxes affect economic performance, and developing better indicators to gauge their impact - especially in the area of corporate taxation - is central to endow the EU with a set of efficient and fair tax policies. To achieve this, a system of micro-founded indicators based on factuals and counterfactuals estimated through micro-simulation models, is proposed under DIECOFIS. The project is committed to pave the way for the development of national and EU-wide micro-simulation models of enterprise taxation by exploring the problems and issues that need to be tackled to build much needed knowledge and capacity for tax-PIA.
The general objective of DIECOFIS is to foster the development of “best practice” policy analysis and evaluation techniques in the field of taxation, to further the Lisbon objectives and EU governance. To this effect, the project intends (i) to develop an integrated and systematized statistical information system19 of enterprise data that effectively supports policy-making; (ii) to develop national micro-simulation models for the analysis of the impact of taxation on competitiveness and enterprise performance in both static and dynamic contexts, in two European countries, Italy and the UK; (iii) to learn lessons and portray a “common demonstrator” in view of the subsequent expansion of the activity to the whole EU area; and (iv) to develop systemic maps and indicators – elementary as well as composite – that capture important links between taxation and economic performance. b) EUROKY-PIA20 - Background and Main Objectives: The “vision” behind EUROKY-PIA stems from DIECOFIS. The focus of DIECOFIS was deliberately limited to corporate taxation and other taxes on enterprises in two countries. Wider country coverage appeared impracticable at that stage. The scope of the project was limited to exploring, testing, piloting and mapping opportunities and ways ahead in a specific policy area, taxation, before embarking on an ambitious, full EU scale endeavour aimed at developing knowledge and capacity for policy analysis across more countries and areas of government. And as work on DIECOFIS has advanced, the need for a wider and larger study has been confirmed.
At the beginning of the 2000s most EU countries appeared to lag significantly behind the USA in policy analysis, though demand for PIA was clearly picking up. PIA knowledge and capacity was needed to support EU policy makers and policymaking at the “federal”, national and regional level21. To achieve this, it appeared desirable, along
19 Including data files from economic, tax and social insurance census, survey and administrative sources. 20 EUROKY-PIA, Developing European Knowledge for Policy Impact Analysis, EU IST 2002-38704. 21 This is witnessed by the EU ongoing effort to develop PIA knowledge and capacity.

14 Austrian Journal of Statistics,Vol. 33 (2004), Number 1&2, 3-33
the lines of EUROMOD for social PIA, to build support and to foster the highest level of EU-wide cooperation. An EU network was formed and funding was obtained under the EU-IST FP5 to explore issues, carry out feasibility studies, prepare an agenda, a plan and a roadmap.
The first objective is to shape a “vision” and a “roadmap” for developing “Policy Analysis Knowledge” that can serve to prepare the ground for a future FP6 project that can support emerging national and EU policy issues, as well as policy coherence and effectiveness.
The second objective is to bring together in a common effort, within a framework of excellence and EU wide cooperation, all the different actors, including (i) National Statistical Institutes, that collect, hold and provide high-quality information; (ii) IT enterprises and communities, that can support NSIs’ transition efforts from “hard-statistics and “hard-databases” to e-statistics, e-data bases and “virtual” wide-ranging data sets resulting from the integration and systematization of information from administrative and statistical sources, by means of appropriate procedures that permit to allow for differences in data quality (e.g. imprecision and errors); (iii) Academia and research institutions (national and international), that have a key role in the development of the best methods, tools and models for policy impact analysis; and (iv) government departments and other organizations of the civil society, that need and require policy impact evaluation to evaluate proposals and choose, support and enact those that are shown to be the most cost-effective and fair.
Within the framework of the project, it is expected that the different participants will each benefit from sharing the perspectives, knowledge and skills of others, developing both synergy in improving policy analysis and a better common understanding across national borders of the essential components of demand and effective systems and tools.
EUROKY-PIA has just taken off. At this stage activity has centred on a review of the issues and of the status of PIA in different areas and countries. Meanwhile, the core group22 of the network has begun identifying the EU priorities and policy areas on which a PIA investment will have to focus at the launch, as well as defining a medium-term strategy (plan and sequence) in view of presenting a EU FP6 integrated project. DIECOFIS23 - Achievements and Main Results a) Synoptic Overview: DIECOFIS has offered an opportunity to work together in a trans-national, multi-disciplinary and networked research environment to government officials, statistical services, academics and researchers in five EU member countries24, with the objective of developing knowledge and tools for enterprise tax policy and performance analysis.
22 Consortium members include: ISTAT (co-ordinator), Inland Revenue, Informer SA, European Commission Joint Research Centre, Mantos UK, Global Insight, University of Tor Vergata. 23 DIECOFIS, Development of a System of Indicators of Competitiveness and Fiscal Impact on Enterprises Performance, EU IST 2000-31125, www.istat.it/diecofis. 24 Consortium members include: ISTAT (co-ordinator), Inland Revenue, Informer SA, European Commission Joint Research Centre, CERES Centre Economic and Social Research, University of Cambridge, London School of Economics, University of Florence, Wirtschaftsuniversitaet Wien, University of Tor Vergata.
The project is shaped around four major thematic areas (see Box 1). During its one and a half year’s life span, it has (i) pilot tested the development of an EISIS in Italy; a UK companion corporate tax model for Italy covering three major taxes on enterprises (corporate tax, Regional tax on economic activities and social security contributions); composite and decomposable performance indicators; (ii) as well as helped to get a better grasp on methodological and research issues; (iii) charted the road for developing an EU demonstrator and for replicating similar models in the other EU member countries.
When DIECOFIS started, the UK was far more advanced than Italy in the development and use of microsimulation business models. Tax analysis and research within the Inland Revenue was well established. UK microsimulation models have operated on data drawn from the administration of tax and household surveys since the 1970’s25. These were the main sources of distributional analysis to support policy formulation.
Among the various business models, the main one was the corporation tax forecasting model26. This only had a narrow dataset for use in policy analysis. The capability in respect of modeling the taxation of the business sector was insufficient to meet the many and varied questions that arise concerning the direct and behavioral impact of taxation on businesses and the wider impacts on
Box 1 DIECOFIS Main Research Thematic Areas DIECOFIS is shaped around four major thematic areas. Theme 1 embraces the issues that fall within the upper section of Chart 4. They include: o The systematisation of single data sources into an integrated database, and related data quality and
validation issues; o The development of appropriate statistical and IT tools to integrate and select the data needed for
micro-simulation purposes; and o Sensitivity analysis. Once these activities are completed, all the variables required for micro-simulation purposes will be available and stored in a single “hub”. This is expected to open up new vistas such as exploring the linkages between policies and performance, developing micro-founded systemic indicators, and permitting access to micro-data through new demand driven methods. Theme 2 embraces the issues that fall within the central section of Chart 4. Basically, these concern the development of micro-simulation models and tools for policy impact analysis -in the circumstances, static tax models. Behavioural issues, however, cannot and are not overlooked. At this early stages however, only some tax evasion and avoidance issues are scheduled for modelling. Theme 3 embraces the issues that fall within the bottom section of Chart 4. It includes the study of the properties, and the development of indicators, composite as well as elementary, that can be used to describe the links between the dynamics of performance and competitiveness and policy impact. The majority of existing macro indicators are inadequate for capturing the complexities arising from globalisation and technological change, and how these are reflected in growth patterns. The use of systematized and integrated statistical information systems makes it possible to create new micro-founded indicators that are more appropriate to describe different economic systems and their features and to
25 See, Commission of the European Communities, Company Taxation and Internal Market, Bruxelles, Sec (2001) 1681. 26 See, Eason, R., Modelling Corporation Tax in the United Kingdom, prepared for the conference in Portland Maine, July 1997, in Anil Gupta and Vishnu Kapur, Microsimulation in Government Policy and Forecasting, North Holland Ed. (2000).

16 Austrian Journal of Statistics,Vol. 33 (2004), Number 1&2, 3-33
understand their systemic strength and weakness. In turn linking this information with micro-economic counter-factuals can be expected to permit to grasp how policies can hinder or foster growth prospects. Theme 4 embraces issues that are closely related to those mentioned under Theme 3 above. It deals with the issues associated with the development of an "EU demonstrator". It presents the lessons that can be gathered from the work carried out under the three preceding themes and the knowledge that is needed for tackling the task of developing a pan-European tax micro-simulation model. Chart 1 presents a visual illustration of how the activities on the development of the two national models will be harnessed to extract the knowledge on the “core features” (as opposed to country specific features) upon which the pan-European model can be built. business performance and the economy. To make progress on these needs, a new team was established in 2002 to develop a new more comprehensive business model to support policy analysis. In the circumstances, the team welcomed the opportunity to participate in the DIECOFIS project, both to learn from the experience of other participators and to investigate international issues such as the comparison of corporate tax systems.
A key area of interest and primary task for the new team was to improve understanding of two main topics:
• “drivers” of business performance and tax payments, that provide a sound understanding of the relevant economic and business relationships which link aspects such as the macro-economic situation with commercial business performance and business performance with the level of tax liability, taking into account the nature and complexities of the tax system. Based on previous research, establishing these drivers was an essential fist step to capturing the relevant data and improving model accuracy;
• the availability of relevant micro-data, including developing a critical assessment of aspects such as reliability, definitions, timeliness, availability, and access.
On the Italian side, analysis and research was in its very early stages. Moreover, the capacity for policy analysis that existed concerned households. In effect, DIECOFIS began with a “vision”, a strong interest, a wealth of enterprises data and “pixie dust” sparkled by the British Embassy in Rome. This successfully connected Italian and British researchers and academics. Austria, also believed and joined this endeavour.
After a year and a half DIECOFIS has achieved much. In Italy microsimulation models now exist for corporate taxation, the regional tax on economic activity, and social security contributions. Progress in developing the EISIS is particularly noteworthy. Istat has successfully integrated and systematized five primary and secondary statistical sources of enterprise data that are routinely collected. Subsequently, statistics from three administrative sources, containing commercial accounts, tax and social security data, have been added. All data, and the microsimulation models have been validated. Sensitivity analysis is under way.
In the UK complementary work has focused on exploring the drivers of taxation and performance for large and small companies and scooping the many data issues arising in establishing multi-sourced databases.
New vistas have gratifyingly opened up in linking taxation and economic performance and in broadening the number of variables in the EISIS. Further, microsimulation models are being used (i) to simulate the proposed reform of business

taxation in Italy; (ii) to study interactions between tax systems and enterprises “systemic” characteristics; and (iii) to analyse the determinants of tax ratios, such as how much of the difference that is observed between the tax ratios of two countries, notably the UK and Italy, is due to differences in rates, tax base definition, deductions and so on. DIECOFIS main results and problems are discussed in the paragraph which follows, b) Main Results: Even if work is still in its early stages, DIECOFIS has permitted to make important steps forward on both the Italian and UK sides. It has shown great potentiality for PIA. It has displayed the importance and need for investment in the development of EISIS, and the additional value created when National Statistical Offices put policy users’ needs and demands at the heart of their mission. As seen above, targets have been met and results have gone beyond consortium members’ expectations (such as in the case of purpose-oriented, scope-fulfilling and well-behaved "systemic indicators”).
New Italian EISIS and microsimulation models are a fact. The former is the result of the integration and systematization of five primary and secondary enterprises statistical sources which are routinely collected within the EU, and subsequently, of four administrative sources containing data on commercial accounts, tax returns, social security contributions and custom records. All data have been validated. Sensitivity analysis is underway. Tax modeling work has also been completed and validated. Currently, it is being applied to simulate the new government proposal on the reform of business taxation. A further, on-going activity includes “cross-country simulations”, that is the simulation of the tax burden imposed on one country’s (i.e. Italy) enterprises if another country (i.e. the UK) legislation were to be introduced. To this effect, three variants are being simulated and studied. These include, equalization limited to statutory tax rates only (Variant A) or to tax base rules only (Variant B); and full substitution (Variant C). Eventually, this exercise will help explain how much of the differences observed between the UK and Italy can be imputed to differences in legislation (and specific provisions) or to structural and behavioral factors. Table 1 illustrates the various tax modeling activities envisaged under DIECOFIS.
On the whole, research activities have progressed along two main tracks:
• The UK’s, which has proved to be the most robust when the focus is on tax modelling and tax analysis (impact and forecast);
• Italy’s, which has shown to be the most appealing when the analytical framework embraces wider and interrelated economic, fiscal and tax issues.
Setting aside the obvious dissimilarities in aims and purposes, the main difference between the two approaches is in the database and its broader/narrower coverage. In the case of the UK, analysis has been undertaken from the data that are directly available from the Inland Revenue’s detailed information. A drawback, in this instance, is that the models that can be developed and the scope of the analysis are “restricted” within narrow limits by the data that are accessible. These are functions-dependent, while databases are purpose built. These features shape and hinder the research that can be supported. They also preclude the study of the broader context.

18 Austrian Journal of Statistics,Vol. 33 (2004), Number 1&2, 3-33
In the Italian approach, the data have come from the integration of different sources. These have range from census and survey to administrative (including fiscal) data. In this instance, the available information has revealed a “higher potential” and proven to be “richer” and much more flexible. Many more issues can be investigated and analyses can stretch from aggregate to very detailed, depending on scope, tools and the availability of software that can be used to “slice”, “dice”, “drill up”, “drill down”, “drill through” and “drill across” the information hyper and micro-cubes depending on users’ needs
6 EISIS and Related Dated issues
The development of good quality EISISs to support business modeling is more difficult than in comparable areas of policy analysis. The business community itself is heterogeneous and its response to government policy is more so. Business decisions are taken for a multitude of reasons and success and failure are frequently enigmatic. So, for example two apparently similar tax units might bear quite different tax burdens Moreover a large proportion of business activity is undertaken by multi-national companies that are not constrained by national boundaries and policies. For these, business modelling is both complex and “data thirsty”,
The statistical information that can be accessed for modelling purposes may be more or less rich and effective depending on the extent and quality of the integration process of the data that are available from different sources. In general, the greater, the level and quality of the process of integration, the richer and more effective the database available to support tax modelling and analysis can be expected to be.
Against, this background, DIECOFIS has established that enterprises data integration is a concern that, first, does not figure high in NSIs’ business plans, let alone their agendas and priorities. Second, it is seldom carried out. When it is, it is functional to data production, since it is largely used for validation and remedial purposes. Database fragmentation is still the norm in most countries, which suggests that opportunities are unduly lost by not putting users’ needs and demands in the limelight of statistical activities.
An indication that has come from the joint IT-UK DIECOFIS experience is that in transplanting experience or reproducing approaches, a first necessary step, before engaging in the development of microsimulation models, is to take stock on data availability and, on that basis, define a logical model.
The research work carried out by the UK hints that, unless you are a national statistical office, it is always desirable to structure the thinking in terms of a business modelling environment, rather than a single database and model; and on the broad area of outputs that a business modelling environment might aim to produce. From this can emerge a better understanding of the data and modelling requirements needed to support policy analysis of the business sector.
Chart 2 helps in navigating the “seas” of possible modelling choices and in mapping best courses once the “tonnage of the boat“, that is the information that is available, is known. Each “sea” is of different “depth” and opens up to different vistas, that is levels and type of analysis:

Table 1. A Framework for Business Modelling
Level of analysis
Outputs Type of Model Micro-data sources
High Economic indicators and analysis
Determinants of productivity, profitability and competitiveness
• Economic survey data • Consolidated accounts • Other sample surveys of
business Mixed Fiscal and
competitiveness indicators
Quantifying determinants of commercial and tax performances and UK effective tax rates
• IR tax assessments & computations (company level)
• IR and City ‘knowledge’ • UK and global
consolidated group accounts
• Production and other surveys
Low Specific tax analysis
Estimates of cost of specific tax changes and distributional/behavioural impact
• IR tax details • Details from accounts • Ad-hoc inputs
• “High” level analysis, which tends to be based on a limited but relatively high-level dataset. It might use macro-data on the economy and micro-data on variables such as turnover, profitability, investment and overall tax accrual. Typically, however, data have come from one micro-data source and therefore lacked the depth necessary to explore many of the issues of interest. Such analysis may produce statistically significant results. The knowledge gained, however, tend to be limited and the results may be spurious because of the impact of factors not isolated in the analysis.
• “Low” level analysis, which uses data directly related to the issue being studied but the narrow limits of the database prevent analysis of the broader context. Much of the current microanalysis on specific tax proposals is undertaken directly from the tax authority’s detailed information and thus the reasons for the changes in income or tax allowances cannot be studied.
In between, lie the many types of analysis that need to relate almost disparate aspects of business, for example the spending in a particular location or on particular aspect of investment with commercial profitability and tax liability. These need the richer "mixed" or multi-sourced database. Many major issues concerning detailed tax policies and wider fiscal issues can only be addressed through the collation of micro-data from different sources. In the UK, the main area of investigation that led to this conclusion was the study of the Effective (Corporation) Tax Rates (ETRs) of major UK companies. But consideration of tax policy for small companies has also led to the need to collate data on the companies with that on their owners.

20 Austrian Journal of Statistics,Vol. 33 (2004), Number 1&2, 3-33
If access to data is less constrained and problematic, as it has been in the case of ISTAT, information “oceans” can be navigated, even though the boats that are available have not been built for this. Information “oceans” are very deep and rich. They open up amazing research vistas. This is the conclusion to which research in Italy has lead. When DIECOFIS began all pieces needed to put together the EISIS jigsaw were available. The successful integration of census, survey and administrative data has proved that (i) putting the puzzle together is viable (though, with methodological challenges that may well have to be solved in better ways in the future); and (ii) data integration can best be carried out by NSIs since they “hub”, and are best equipped to retrieve a great quantity of data and to by-pass information-access barriers (for more details see Filippo Oropallo’s papers in this AJS issue). EISESs give maximum choice and minimize restrictions. They allow to travel the whole spectrum of available information, backwards and forwards, and to link “large”, “low” and “very fine” scale levels of research.
Figure 1: EISIS Hypercube
All in all, DIECOFIS has unveiled a new vision for enterprises statistics. In this
vision, enterprises data are not handled as “fragments” of a universe, but are assembled as pieces of a mosaic. The model behind this vision is characterized by a “spine” (the businesses register) and is pigeon-holed (survey and administrative data). The spine is constituted by a list of unique “identifiers” ordered according to some criteria. Each identifier singles out a tier (i.e. an enterprise). On each tier, next to each identifier/enterprise there are many horizontally-lined boxes. In each box are arranged statistics, one variable per box. Within each box, statistics are sequenced according to
T-nT-1
Industrial Production
Foreign Trade d
Commercial Accounts c
Tax Returns
Data b
Social Security
Data a
Large
100 percent coverageSample
(a) Enterprise w ith employees only - This database is shaped by the National Social Security Legislation(b) All enterprises - This database is shaped by the National Tax Legislation(c) Incorporated enterprises only (Their account system is regulated by UE directives)(d) Exporting enterprises only(e) These Sources are governed by: (i) Council Regulations: no 3924/91 - survey of industrial production; (ii) n. 696/93 - statistical units for the analysis of the production system; (iii) n. 58/97 - structural business statistics; (iv) Commission Regulation: n. 1618/99 - evaluation of quality of structural business statistics;
Smal
l and
med
ium
Other Surveys:ICT - CIS
Structural Business Statistics
Enterprises
SPIN
E
Administrative Sources TSurvey Sources e

their age, starting from the most recent. When a data is missing, this is signalled by an empty space. If estimates are available for missing variables these may be included or they may be calculated with appropriate methods (and imputed) to fill gaps. The end result is an hypercube which contains all available information. This cube can be drilled in all directions: up, down, across and so on. What is needed is a drill, that is a software. Given this configuration, the research potential associated with the development of an EISIS, such as the one built by ISTAT, is augmented to its the highest degree (though various methodological issues have not yet been tackled).
From a research and analytical viewpoint, the latter proves to be by far superior in terms of potential and opportunities. In particular, it allows microsimulation to be deployed to meet users’ needs. All that is needed to “connect” models and data is a good and flexible software. In the traditional approach models were driven by the limited data available.
Eventually, DIECOFIS will propose a new integrated vision and approach to statistics for PIA and, specifically, for microsimulation. This vision will then act as corner stone for EUROKY-PIA (see Figure 2).
Figure 2: Project Areas and Information, Tools and Methods for Policy Impact Analysis (PIA)

22 Austrian Journal of Statistics,Vol. 33 (2004), Number 1&2, 3-33
7 Tax Modelling and Analysis
In a nutshell, progress in tax modelling and analysis can be summarized in five points. DIECOFIS has made it possible to:
• Microsimulate existing legislation and “what if” hypotheses;
• Study systemic features, that is factors of strength and weakness of different “economic textures”;
• Develop fine-grained “maps” and decomposable/composable indicators;
• Monitor and benchmark performance with systemic indicators shaped and tailored to suit purpose;
• Explore relationships between taxation, drivers and performance.
Results of analysis in DIECOFIS have demonstrated the heterogeneity and complexity of the business community and its taxation. Nothing alike is conveyed by the aggregate indicators which are currently used to compare tax burdens across countries. International Comparisons of Business Tax Burdens: What Summary Indicators Show May be Distorted and Flawed The first indication from the tax modelling analysis is that the significance of cross-country comparisons on tax incidence seem to be of limited relevance, if based on summary indicators of tax burdens. As Figure 3 makes clear, statutory tax rates are not a very good proxy for tax incidence analysis, both within and across sectors and regions, even when rates are uniform and proportional. What they show may not only be distorting but flawed.
The second, is a reminder rather than an indication: no policy is an island and no policy can be implemented brushing aside the problems it is designed to tackle, and without knowing the nuts and bolts of the underlying socio-economic and policy milieu. Structural differences matters and make a difference. Consequently, business modelling needs to recognise differences in ways the means used and population.
Concerning the former, governments can make choices and use different instruments to collect their revenue. As Figure 4 shows when one looks at the one and the full tax comparison, the picture can look very different. Microsimulation models permit to overcome these shortcomings, as they make it possible to add up different taxes and to estimate total net tax takes. The ensuing tax ratios, as shown in Chart 5 that presents a picture that is by no means similar to the one shown in Chart 4.
With regard to populations, in the case of enterprises it may mean at least the following – large companies, small companies, individuals in business and employees. Their circumstances are quite different and each requires the development of appropriate modelling techniques. For instance, small and medium companies and self employers in Italy are overwhelming. They represent over 99 percent of all enterprises, employ just over 66 percent of workers and produce more than 62 percent of total value

added. In the UK, instead, a relatively small number of large multi-national company groups comprise a large proportion of business activity, employment, profit, and tax.27
Thus, in any study for business tax policy it is very important to develop appropriate modelling capacity. The taxation of small companies and individual entrepreneurs spans both business and individual taxation, but it is clearly rather different from the taxation of the majority of employed workers. Small companies are by definition rather simpler than large multi-national groups. However their successful modelling for tax policy purposes does involve factors that are not immediately obvious. A small company is usually owned by an individual or just a few people (maybe two or three other family members or just a business partner). These often also work directly for that company. In this position the tax of the company is closely related to the tax of the individuals. Income of the company can be paid as remuneration to the owners (and family members), reported as company profit and then paid as dividends, or profits may be retained in the company and dispersed to the owners later by various means. National insurance, loans, pensions, and share schemes can also affect the owners remuneration strategy. Hence successful modelling of small companies requires collation of details about the owners and their finances.
Coverage of large groups in general, and multinationals in particular is no less important and even much more complex, as shown by Inland Revenue analysis, since:
• tax is charged on each company’s profits and not at company group level, whereas groups report their performance at group level;
• most groups tend to have substantial non-UK activity which generates little UK tax, but the segmental details in the accounts are in most instances limited;
• accounting details for each member of a company group are not readily available for analytical purposes in the Inland Revenue;
• most groups pay their corporation tax by quarterly instalments under group payment arrangements, but the amount paid may be rather different from the amount finally agreed when all the details for all the group members are settled.
Despite the inevitable inaccuracies in estimation, the analysis has shown very wide dispersions and proved the need for a rich and broad database to begin to understand the reasons why some companies pay little or no tax while others pay far more as a proportion of their profits. What were the real “drivers” of this diverse position? Study so far has been limited. However, some conclusions can be safely drawn. Just as business is diverse in its activity, its financing, and its performance, so are the drivers of performance and tax levels. At one extreme, a large bank may reduce its tax because of an increase in bad debt provision or an unsuccessful venture into e-banking while a pharmaceutical company’s profits may fall (or surge) as a result of the expiry of patents on important drugs. Substantial changes in corporate structure, such as mergers and acquisitions, have major impacts on the taxation of the companies concerned and the profits of the financial institutions advising on the changes.
27 The same applies to large (even if not necessarily multi-national) companies in Italy. Although they comprise less than one percent of all enterprises, they employ just less than one fourth of all workers and produce just about 38 percent of the total value added.

24 Austrian Journal of Statistics,Vol. 33 (2004), Number 1&2, 3-33
Investigating the importance and the factors behind these differences is essential, if analyses and comparisons are to be meaningful and revealing. Understanding these aspects is vital especially for tax convergence and harmonization policies.
20%
24%
28%
32%
36%
C DA DB DC DD DE DF DG DH DIDJ DK DL
DM DN E F G H I K M N O
All sec
tors
Gap between statutory and effective ratesEffective rate (per cent of taxable income)
Figure 3: Statutory and Effective Rates by NACE Sectors in Italy
0%
10%
20%
30%
40%
50%
60%
70%
80%
90%
C E
DK
DE
DG DA O
All S
ecto
rs DL
DB
DM D
I I G N
DN M DJ F K
DH H
DC
DD DF
Corporate taxRegional TaxSocial Security Contribution
Figure 4: Total Tax Takes by NACE Sectors in Italy28
(as a percentage of Total Value Added)
28 Include the Corporate income tax, the regional business tax and employers’ social security contribution.

0%
15%
30%
45%
60%
0 100 200 300 400 500 600
Total Inherent Risk Score
ETR per cent
Overall weighted average
Figure 5: Effective Tax Rates for Total Companies, UK
0%
5%
10%
15%
20%
25%
0 100 200 300 400 500 600
Avge Total Risk (Inherent Risk Score)
Avge ETR
Insurance
Retail
Telecoms
Motor man.
Construction
Media
Property
Pharma
Transport
All sectors
Electritiy & water
IT
All other
Other servs
Other inds
Other cons goods
UK Retail banksOther bank/finance
Figure 6: Effective Tax Rates for Top Companies, UK
26 Austrian Journal of Statistics,Vol. 33 (2004), Number 1&2, 3-33
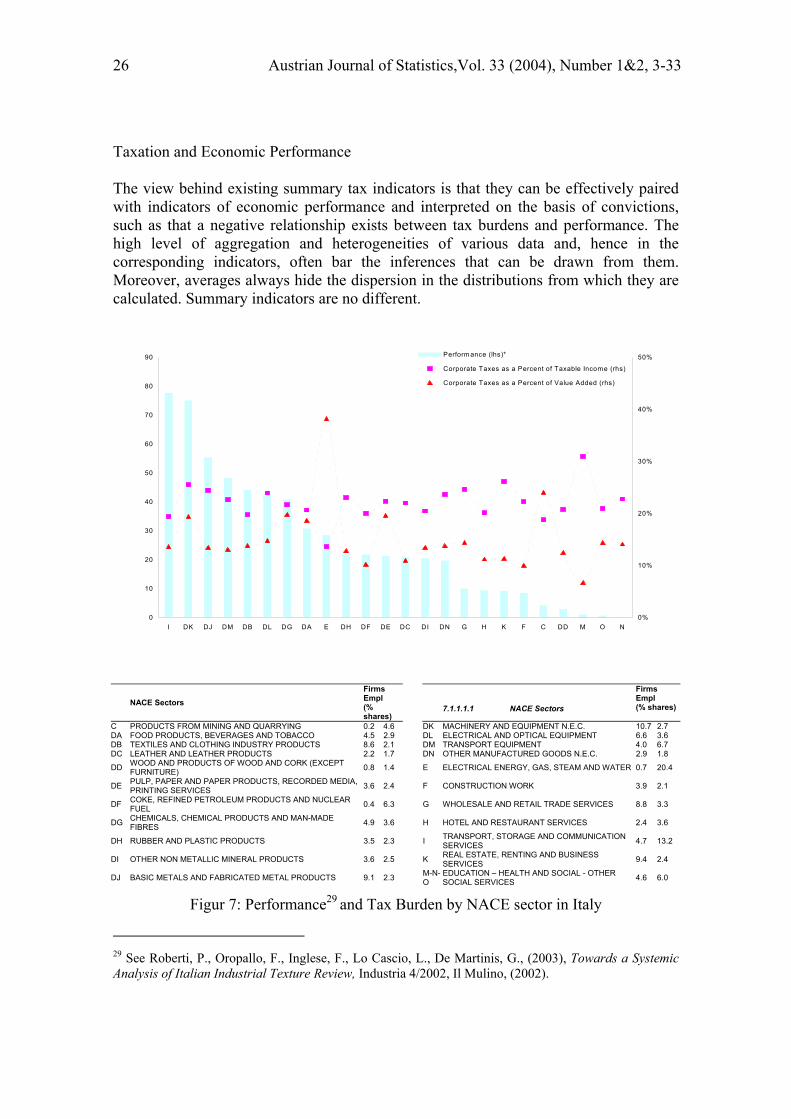
Taxation and Economic Performance The view behind existing summary tax indicators is that they can be effectively paired with indicators of economic performance and interpreted on the basis of convictions, such as that a negative relationship exists between tax burdens and performance. The high level of aggregation and heterogeneities of various data and, hence in the corresponding indicators, often bar the inferences that can be drawn from them. Moreover, averages always hide the dispersion in the distributions from which they are calculated. Summary indicators are no different.
0
10
20
30
40
50
60
70
80
90
I DK DJ DM DB DL DG DA E DH DF DE DC DI DN G H K F C DD M O N0%
10%
20%
30%
40%
50%Perform ance (lhs)*
Corporate Taxes as a Percent of Taxable Income (rhs)
Corporate Taxes as a Percent of Value Added (rhs)
NACE Sectors Firms Empl (% shares)
7.1.1.1.1 NACE Sectors
Firms Empl (% shares)
C PRODUCTS FROM MINING AND QUARRYING 0.2 4.6 DK MACHINERY AND EQUIPMENT N.E.C. 10.7 2.7 DA FOOD PRODUCTS, BEVERAGES AND TOBACCO 4.5 2.9 DL ELECTRICAL AND OPTICAL EQUIPMENT 6.6 3.6 DB TEXTILES AND CLOTHING INDUSTRY PRODUCTS 8.6 2.1 DM TRANSPORT EQUIPMENT 4.0 6.7 DC LEATHER AND LEATHER PRODUCTS 2.2 1.7 DN OTHER MANUFACTURED GOODS N.E.C. 2.9 1.8
DD WOOD AND PRODUCTS OF WOOD AND CORK (EXCEPT FURNITURE) 0.8 1.4 E ELECTRICAL ENERGY, GAS, STEAM AND WATER 0.7 20.4
DE PULP, PAPER AND PAPER PRODUCTS, RECORDED MEDIA, PRINTING SERVICES 3.6 2.4 F CONSTRUCTION WORK 3.9 2.1
DF COKE, REFINED PETROLEUM PRODUCTS AND NUCLEAR FUEL 0.4 6.3 G WHOLESALE AND RETAIL TRADE SERVICES 8.8 3.3
DG CHEMICALS, CHEMICAL PRODUCTS AND MAN-MADE FIBRES 4.9 3.6 H HOTEL AND RESTAURANT SERVICES 2.4 3.6
DH RUBBER AND PLASTIC PRODUCTS 3.5 2.3 I TRANSPORT, STORAGE AND COMMUNICATION SERVICES 4.7 13.2
DI OTHER NON METALLIC MINERAL PRODUCTS 3.6 2.5 K REAL ESTATE, RENTING AND BUSINESS SERVICES 9.4 2.4
DJ BASIC METALS AND FABRICATED METAL PRODUCTS 9.1 2.3 M-N-O
EDUCATION – HEALTH AND SOCIAL - OTHER SOCIAL SERVICES 4.6 6.0
Figur 7: Performance29 and Tax Burden by NACE sector in Italy
29 See Roberti, P., Oropallo, F., Inglese, F., Lo Cascio, L., De Martinis, G., (2003), Towards a Systemic Analysis of Italian Industrial Texture Review, Industria 4/2002, Il Mulino, (2002).

DIECOFIS has helped progress on indicators and to throw new insight into existing relationships. It has made it possible to calculate sets of micro-founded indicators of impact and performance, characterized by high levels of homogeneity and precision (since they refer to the same populations). In turn, this has helped finely map enterprises and their performance by, say, size, regions, sectors and so on, using sets of elementary and multidimensional, composable and decomposable indicators. As can be seen from Chart 8 and 9, DIECOFIS has paraded “dwarf” and “giant” enterprises (or groups of them), lined up from top to worst performers (with performance measured by means of a three-dimensional and composite indicator for NACE sector, and enterprises classified by region and size). Since, the tax burden for each enterprise in the parade was known, the analysis plots rather precise maps and indications as to how the latter may relate to the former.
-
10
20
30
40
50
60
70
80
90
100
>1000 500-999 250-499 200-249 100-1998%
18%
Performance (lhs)*
Corporate Taxes as a Percent of Taxable Income (rhs)
Corporate Taxes as a Percent of Value Added (rhs)
-
10
20
30
40
50
60
70
80
90
100
LOM
LAZ
PIE
VEN
EMR
TOS
TAA
FVG
MAR LI
G
ABR
SAR
PUG
UM
B
CAM VD
A
BAS
SIC
MO
L
CAL
0%
10%
20%
30%
Performance (lhs)*Corporate Taxes as a Percent of Taxable Income (rhs)Corporate Taxes as a Percent of Value Added (rhs)
Figur 8: Performance and Tax Burden by Number of Workers and Region in Italy

28 Austrian Journal of Statistics,Vol. 33 (2004), Number 1&2, 3-33
8 Lessons That Can Be Drawn. Conclusions and Next Steps
Research under DIECOFIS leads to three main conclusions. The first concerns the issues in constructing EISISs. The second, the issues in accessing EISISs in ways that are flexible and adaptable. And the third, modelling.
Issues in constructing EISISs - EISISs have a great potential. They create new “value added information” and overcome the artificial wedges that presently hinder data access and research30.
As Chart 3 above shows, PIA research activities may be aimed at providing “inputs”, “means” and “output”. They can cut-across the board, as when the purpose is to develop general PIA knowledge and capacity; or be topic specific. The former embrace a range of necessary “spine” activities needed to carry out policy analysis and evaluation. These include disciplinary research, operational research, applied policy analysis, IT development and basic input information/treatment. The latter, instead, focus on specific policies and areas.
Three reasons support a systemic approach to the development of PIA knowledge-bases and capacity. First, because of complexity and rapid change, the data and models that are used for PIA is characterized by a process of rapid obsolescence. Continuously, new sources, additional fine-grained information and new tools are needed to successfully confront changing and entirely new problems. Thus, PIA requires anticipatory research, research concerning how and when to develop new data sources, and research on methodologies for new model requirements.
Second, Data has little sense without some theory supporting it. National Accounts, the key statistical function in macroeconomics, is born from Keynesian theory. It provides the inputs required for macroeconomic PIA. The theoretical progress in microeconomics and, more generally social science, in fields as important for policy making as market structures, pricing, technological change or simply investment, is still lacking an adequate statistical observational system. Consequently, lack of adequate data hinders not only research on these issues, but also on the academic theories that are needed to support data collection activities.
Third, the advent of the Information Society is recording and storing billions of transactions that could potentially provide a mass of microdata required by microeconomic PIA. This information gold mine is to a great extent un-mined. New technologies are not being used to store and access appropriately the microdata that are collected. To a great extent, collection and access remain supply driven, not demand pulled, with a strong inclination to “rehearse the past”. Besides, a variety of wedges hinder access (including wedges due to old fashioned storing methods), with a consequent loss of potentially available information and high opportunity costs in terms of both quality and quantity31.
One aim of EUROKY-PIA is to develop e-accessible statistical information systems of micro-data, including metadata, relational models, software and statistical
30 See Oropallo, F., Lo Cascio, L., op.Cit.. 31 See, Oropallo, F., Lo Cascio, L., The Development of a Multisource and a Systematized Database for Economic and Policy Impact Analysis, DIECOFIS project, CAED London, September 2003.

methodologies to support PIA in various policy areas. The objective is to make them accessible to Government Agencies, the research community and stakeholders. This will require reconciling (data-linking) statistics from multiple sources, taking into account differences in definitions and adjusting for inconsistencies between sources (metadata matrix), as well as knowledge of the quality and reliability (statistical properties) of linked datasets. In parallel an investment in IT software (including extract, transformation and Loading procedures; implementation of integration algorithms; on line analytical processing implementation) is needed.
Difficulties can easily be underestimated. Of course, the task is not easy for data providers, who necessarily have to operate in an economic environment that constrains their capacity for action. But in many cases it will be more a matter of applying appropriate information technologies. One advantage with the new data is that it does not need to be developed by expensive surveys; it is already there in the network, and the question is how to find where it is and how to get access to it.
In the construction of Multi-Sourced Databases for Companies, the richness of data required means that
• access to a variety of micro-data sources is essential, that the data sources need to be matched successfully (either by record linking or statistical matching or imputation), and that the variables used need to be well understood because of the recognised dangers of trying to draw conclusions from data drawn from different sources;
• further data capture may be necessary; in particular that the data drawn from the tax system for analytical purposes needs to be extended and centrally collated. For companies the limited range of information on the tax assessment covering the different types of income and the main allowances and reliefs is already available. The initiative to encourage companies to e-file the whole of their tax return, including the accounts and the computations that derive the assessment details from the accounts, should make more information available for the self-selecting group of companies that e-file. Comparable data capture for others remains an outstanding problem. Similarly the collation of details for small companies and their directors needs development;
• it is unlikely that one multi-sourced database will suffice for the range of purposes envisaged to support business tax policy. The tasks of updating and maintenance and the inevitable problems of size and complex structure suggest that trying to hold all the data as one entity will be expensive and probably ineffective. It is expected that the data will need to be organised as a substantial core with prompt and easy access to other databases. Furthermore, the arrangements for access, record linkage, imputation, and perhaps modification of variables must be solved in advance for effective use.
Issues in accessing EISISs in ways that are flexible and adaptable - This is about the analyst’s task. Successful analysis requires data, IT facilities, and an analyst capable of merging the former components successfully or, if EISISs and IT facilities are available, of digging out the right statistics that are needed. For business sector research, the complexity of the data and the extensive modelling needs indicate that the analysts must be extremely capable. Their role will not be to use a few menu-driven screens on a well-

30 Austrian Journal of Statistics,Vol. 33 (2004), Number 1&2, 3-33
established and user-friendly model using a fixed clean dataset. Their role will be to first establish the key variables for their research from previous research and discussion. Then, they will need to form a relevant dataset from an EISIS or, if this is not available, from available core data, other databases, and by new data collection if necessary. Almost certainly they will use a subset of businesses of which some will have missing information; they will therefore have to reconsider aspects of non-response, sampling and grossing to population levels. Next they will analyse their data before considering the precise modelling to be undertaken which will probably involve coding specific changes, incorporating various assumptions and estimated relationships. Sensitivity analysis will be necessary. And the whole process will probably have to be repeated several times as various aspects are refined. The IT model32 behind DIECOFIS EISIS provides a prototype of the software that may be applied for managing and accessing the data needed for microsimulation. Modelling and International Comparisons - DIECOFIS has confirmed that micro-data analysis, possibly linked with some macro-data, and microsimulation are certain to be fundamental for effective policy analysis in general, and for taxation and fiscal indicators in particular. For the business sector, the variation over the population is much greater than that for individuals and households. Experience so far suggests that the best strategy for the future is to develop a modelling “environment” that focuses on facilitating research studies, rather than providing one model that delivers the required output from a few menu-driven screens. At the national level, this environment would have to provide the following facilities:
• a core database and prompt access to a range of other databases with aspects of access, record linkage, consistency of variables already solved;
• the addition of further micro-data by the researcher, with suitable record linkage facilities;
• a library of macro-economic data that can be used in analysis;
• core modelling facilities including the capacity to design and establish new datasets for analysis;
• standard software for example tax calculators, standard reports, graphics, and access to already established models;
• some advanced modelling facilities, for example the ability to model using different hierarchies of data (global performance, UK and IT group, individual company), expected behaviours based on previous research, some feedback facilities for use in simulating changes, iterative solutions, and projection facilities for ageing the population taking account of the economic conditions and the diversity of the population;
• bespoke software development so that the researcher can modify and extend the core modelling and standard software to suit the specific needs.
32 See, Roberti, P., Oropallo, F., Composite Indicators for the Measurement of Economic Performance, mimeo, ISTAT, NESIS Project, (2003).

The overall objective is to develop a highly flexible modelling environment to meet the wide range of requirements. Modelling must develop from the relatively static limited data models that served yesterday’s needs to dynamic models using multi-sourced micro-data combined with relevant micro-data.
At the EU level, the first objective is a common European tax module in each national microsimulation model. The Italian team is piloting the issues and problems that may have to be expected. Currently, the work looks feasible. Yet, more countries will have to be modelled before feasibility can be truly gauged
One of the aims of the DIECOFIS project was to facilitate international comparisons of the business sector and its taxation. The UK contribution from the Inland Revenue has approached this issue from the perspective of the needs of the tax authority which needs a strong evidence base for its policy decisions. UK research has demonstrated the need for substantial development of data and modelling facilities to achieve that objective. The Italian contribution from the ISTAT has approached the issue from the perspective of a producer of data. Its research work has relied on both statistical surveys and administrative sources, including tax authority information. It has shown great potential. At the same time it has confirmed the difficulty of making direct comparisons across countries, since approaches are heterogeneous and EISISs are far from common. In addition, the composition of the business sectors is quite different and tax systems are not easily comparable. Comparisons of different tax systems on a typical business basis approach are possible, but they are believed to be uninformative, since many tax heterogeneities may be hidden behind them. Further work is needed to develop the multi-sourced data and modelling described above in several countries so that, for example, detailed analysis of ETRs for large companies can be undertaken or, for small companies, the relationships between tax on directors remuneration and company profits can be compared. The analysis of the sources of heterogeneity across groups and countries is important and should be factored in in developing EISISs and models.
References
W.C. Baer. On Making of Perfect and Beautiful Social Programs, The Public Interest, 39, Spring 1975.
R.F. Bardazzi, M.G. Pazienza, V. Parisi. The Effects of the Italian Tax Reform on Corporations: a Microsimulation Approach. DIECOFIS project, http://www.istat.it/ diecofis. 2003.
H. Brookfield. Interdependent Development, Methuen & Co. Ltd. , London, (1975).
H.C. Brookfield. Multum in Parvo: Some Questions about Diversification in Small Countries. In P. Selwing (ed.) Development Policy in Small Countries, London, 1975.
M. Bruno. The Use of National Accounting Frameworks for Economic Policy and Development Forecasting: A Survey of Israel’s Research Experience 1958-61. In C.

32 Austrian Journal of Statistics,Vol. 33 (2004), Number 1&2, 3-33
Clark and G. Stuvel (eds). Income Redistribution and the Statistical Foundations of Economic Policy, Bowes & Bowes, London, 1964.
P. Dicken. Global Shift, PCP Ltd, London, 1999.
R. Landau, T. Taylor and G. Wright (eds). The Mosaic of Economic Growth, Standford University Press, Standford, 1996.
R. Eason, Modelling Corporation Tax in the United Kingdom, prepared for the conference in Portland Maine, July 1997. In A. Gupta and V. Kapur, Microsimulation in Government Policy and Forecasting, North Holland Ed. 2000.
R. Eason. Microsimulation for direct taxes and fiscal policy in the United Kingdom, prepared for IARIW conference in Canberra, December 1993. In A. Harding, Microsimulation and Public Policy, North Holland Ed., Amsterdam. 1996.
National Research Council, Improving Information for Social Policy Decision. Review and Recommendations, National Academy Press, Washington D.C. 1993.
G.H. Orcutt. A New Type of Socio-Economic System, Review of Economics and Statistics, 80, pp. 1081-1100. 1957.
F. Oropallo, L. Lo Cascio. The Development of a Multisource and a Systematized Database for Economic and Policy Impact Analysis, DIECOFIS project, CAED London. September 2000.
P. Roberti, F. Oropallo, F. Inglese, L. Lo Cascio. De Martinis, G. Towards a Systemic Analysis of Italian Industrial Texture Review, Industria 4/2002, Il Mulino. 2003.
P. Roberti, F. Oropallo. Composite Indicators for the Measurement of Economic Performance, mimeo, ISTAT, NESIS Project. 2003.
P. Roberti, R. Eason, F. Oropallo. International Research into Using Micro-Databases to Improve Policy Analysis. Lessons from the DIECOFIS and EUROKY-PIA Research Projects, Paper presented at the Canberra December 8-12, 2003 Microsimulation Conference, mimeo. 2003.
M. Storper and R. Walker. The Spatial Division of Labour: Labour and the Location of Industries” in L. Sawers and W.K. Tubb (eds), Sunbelt/Snowbelt: Unrban Development and Regional Restructuring, Oxford University Press, New York. 1984.
C.L. Schultze. The Politics and Economics of Public Spending, Brookings, Washington D.C. 1968.
R.M. Titmuss. Social Policy, Allen & Unwin, London, p.27. 1974.
R.M. Titmuss. Income Distribution and Social Change, George Allen & Unwin Ltd. London. 1962.

C. Yeend, R.J. Eason. Database Construction for Tax Indicators Building Purposes: Issues of Database Development in the Inland Revenue, http://www.istat.it/diecofis 2003.
Author's address: Dr. Paolo Roberti Istat - Istituto Nazionale di Statistica Via Cesare Balbo 16 00184 - Roma Italy
Tel. +39 6 4673 / 4124 Fax +39 6 4673 / 4125 Elec.Mail: [email protected] http://www.istat.it
