international space station eclss technical task agreement
TRANSCRIPT
NASA Technical Memorandum 108508
International Space Station ECLSSTechnical Task AgreementSummary ReportC.D. Ray and S. Minton-Summers, Compilers
May 1996
https://ntrs.nasa.gov/search.jsp?R=19960045292 2018-02-19T18:08:22+00:00Z


NASA Technical Memorandum 108508
International Space Station ECLSSTechnical Task AgreementSummary Report
C.D. Ray, CompilerMarshall Space Flight Center ,, MSFC, Alabama
and
S. Minton-Summers, CompilerIon Electronics • Huntsville, Alabama
National Aeronautics and Space AdministrationMarshall Space Flight Center ° MSFC, Alabama 35812
May 1996


Table of ContentsPage
List of Figures ................................................................................................................... vi
List of Tables .................................................................................................................... .vii
Acronyms .......................................................................................................................... viii
1.0 INTRODUCTION .................................................................................................... 1
2.0 TASK AGREEMENTS ........................................................................................... 1
3.0 ORGANIZATION ..................................................................................................... 1
4.0 WATER RECOVERY SYSTEMS ........................................................................ 3
4.1 Component Design and Development ................................................... 34.1.1 Process Pump ...................................................................................... 3
4.1.1.1 Inconel 718 2992 Pump .................................................... 44.1.1.2 Stainless Steel 15-5 2992 Pump ..................................... 44.1.1.3 Low Speed 15-5 2992 Pump ........................................... 54.1.1.4 Borided Inconel 718 2992 Pump ..................................... 54.1.1.5 Borided Stellite 6B 2941 Pump ........................................ 5
4.1.2 Mostly Liquid Separator ..................................................................... 74.1.3 Volatile Removal Assembly ............................................................. 124.1.4 Process Control Water Quality Monitor ......................................... 124.1.5 Urine Pretreatment ............................................................................ 13
4.2 Stage 9 Water Recovery Test ................................................................. 14
4.3 Analytical Model Development .............................................................. 184.3.1 Multifiltration Beds ............................................................................. 19
4.3.1.1 Ion Exchange Modeling ................................................... 214.3.1.2 Adsorption Modeling ........................................................ 23
4.3.2 Volatile Removal Assembly Reactor .............................................. 26
4.4 Life Testing ................................................................................................. 304.4.1 Subassembly Life Testing ............................................................... 30
4.4.1.1 Urine Processor Assembly .............................................. 304.4.2 Microbial Check Valve ...................................................................... 334.4.3 Water Distribution Plumbing ............................................................ 33
4.5 ECLSS Flight Experiments ..................................................................... 354.5.1 Vapor Compression Distillation Preliminary Design .................. 35
4.5.1.1 Enhanced Urine Ersatz Development .......................... 38
iii

Table of Contents (continued)
Page
5.0 AIR REVITALIZATION SYSTEMS .................................................................... 39
5.1 Component Design and Development ................................................. 39
5.1.1 Trace Contaminant Control Subsystem Catalyst PoisoningInvestigation ....................................................................................... 39
5.2 Oxygen Generation Systems .................................................................. 425.2.1 Static Feed Electrolyzer ................................................................... 425.2.2 Solid Polymer Electrolyzer .............................................................. 45
5.3 Integrated Systems Testing .................................................................... 515.3.1 Oxygen Generation ........................................................................... 525.3.2 Carbon Dioxide Removal ................................................................. 525.3.3 Atmosphere Monitoring .................................................................... 535.3.4 Trace Contaminant Control ............................................................. 53
5.4 Analytical Model Development .............................................................. 585.4.1 Spacelab Charcoal Analysis ........................................................... 58
5.4.1.1 Spacelab Trace Contaminant Removal SystemCharcoal Analyses ........................................................... 58
5.4.1.2 Spacelab Charcoal Analyses for Target andNon-Target Organic Compounds .................................. 59
5.4.2 Carbon Dioxide Removal System Computer Model ................... 615.4.2.1 Monodisperse and Bidisperse Diffusion
5.4.2.25.4.2.35.4.2.45.4.2.55.4.2.65.4.2.7
Modeling ............................................................................. 63Thermal Effects Modeling ................................................ 64Nitrogen Co-adsorption Effects Modeling .................... 64Water Co-adsorption Effects Modeling ......................... 67Adsorption Equilibria ........................................................ 70Column Dynamics ............................................................ 71Integrated 4BMS Model Development ......................... 71
5.5 Life5.5.15.5.2
Testing ................................................................................................. 71Carbon Dioxide Removal System .................................................. 71Trace Contaminant Control System ............................................... 73
5.6 Static Feed Electrolyzer Flight Experiment Preliminary Design ...... 75
6.0 MICROBIOLOGY .................................................................................................. 78
6.1 Assessment of Microbial Degradation of Space StationMaterials ..................................................................................................... 78
6.2 Polymerase Chain Reaction Assessment ............................................ 81
iv

Table of Contents (continued)Page
7.0 GENERAL TEST SUPPORT TASKS ............................................................... 83
7.1 Database .................................................................................................... 837.2 Boeing Analytical Laboratory Support .................................................. 84
ACKNOWLEDGEMENTS .................................................................................. 86
R EFER ENCES ..................................................................................................... 87
V

Figure 3.0-1Figure 4.1-1Figure 4.1-2Figure 4.2-1Figure 4.3-1Figure 4.3-2Figure 4.3-3Figure 4.3-4Figure 4.3-5Figure 4.3-6Figure 4.4-1Figure 4.4-2Figure 4.5-1Figure 4.5-2Figure 5.1-1Figure 5.1-2Figure 5.1-3Figure 5.2-1Figure 5.2-2Figure 5.3-1Figure 5.3-2Figure 5.3-3Figure 5.3-4Figure 5.3-5Figure 5.4-1Figure 5.4-2Figure 5.4-3Figure 5.4-4Figure 5.4-5Figure 5.4-6Figure 5.4-7Figure 5.4-8Figure 5.4-9Figure 5.4-10Figure 5.4-11Figure 5.4-12Figure 5.4-13Figure 5.5-1Figure 5.5-2Figure 5.6-1Figure 6.1-1Figure 6.1-2
List of Figures
Page
ECLSS Technical Task Agreement Organizational Interface ........... 2Water Processor Pump Prototype .......................................................... 3Mostly Liquid Separator ........................................................................... 9Water Recovery System Simplified Functional Schematic ............. 16Simplified Schematic of Water Processing System for ISS ............ 18Multifiltration Bed Schematic ................................................................. 20Schematic of Hydrated Strong Acid Cation Resin ............................ 21PSDM Mechanisms ................................................................................ 23Mass Transfer Process for a Single Catalyst Particle ....................... 27Schematic Diagram of Bench Scale Reactor System ...................... 28VCD-VA Simplified Schematic ............................................................. 31Tube Configuration ................................................................................. 34VCD Concept ........................................................................................... 36VCD Flight Experiment Mockup ............................................................ 37Schematic of the Catalyst Testing Apparatus .................................... 39Cyclic Poisoning Test using Dichloromethane .................................. 41Baseline Performance Test using Hydrogen Sulfide ....................... 41SFE Oxygen Generator .......................................................................... 43SPE Schematic ......................................................................................... 47AR System Test Schematic and Average Mass Balance ................ 53SFE Mechanical Schematic .................................................................. 54CDRA Mechanical Schematic ............................................................... 55MCA Block Diagram ................................................................................ 56TCCS Mechanical Schematic ............................................................... 57TCRS Configuration ................................................................................ 60Four Bed Molecular Sieve Schematic ................................................. 62Intraparticle Mechanism of Diffusion for Monodisperse Sorbent ...63Intraparticle Mechanisms of Bidisperse-pore Sorbent ..................... 64Single Component Mass and Heat Transfer Effects ......................... 65Thermal Validation of the Computer Model ........................................ 65Mass Transfer Effects of Nitrogen Co-adsorption .............................. 66Heat Transfer Effects of Nitrogen Co-adsorption ............................... 66Effects of Water Co-adsorption ............................................................. 67Mass Transfer of CO2 for CO2/H20/N2 Co-adsorption ...................... 68Mass Transfer of H20 for CO2/H20/N 2 Co-adsorption ...................... 68Heat Transfer Effects for CO2/H20/N2 Co-adsorption ....................... 69CO2 Adsorption on Grace 13X Zeolite ................................................. 70Four Bed Molecular Sieve ..................................................................... 72TCCS Schematic ..................................................................................... 74SFE Flight Experiment PDR Mockup ................................................... 76Microbial Colonization of Polyurethane Coating ............................... 80Microbial Colonization of Polyurethane Coating with Fungicide ... 80
v±

Table 5.2-1Table 7.1-1Table 7.2-1
List of Tables
Page
Anomaly Summary .................................................................................. 44Testing Supported by FEDS in 1995 ................................................... 83ISS Potable Water Quality Specifications .......................................... 85
vii

%°CoFpg/L4BMSAI203AITAPAARARCBABMIBOSTC/MICASE/ACO
CDRCDRACFMCFU/m 30H2012CH4CHeCSCHXCMS
CO2DCDMSODNADTODVBdynes/cmEBCTECLSSED62EISEL65EMAEMUEPAEPTFAMEFCFCAFEDSFIDFORTRAN
Acronyms
Percent
Degrees CentigradeDegrees FahrenheitMicrograms per LiterFour-Bed Molecular SieveAlumina
Analysis and Integration TeamAqueous Phase AdsorptionAir RevitalizationAmes Research CenterBoeingBattelle Memorial Institute
Baseline Operations System TestControl/Monitor Instrumentation
Computer Aided System Engineering and AnalysisCubic centimeters
Critical Design ReviewCarbon Dioxide Removal AssemblyCubic feet per minuteColony Forming Units per cubic meterDichloromethaneMethaneCrew Health Care SystemCondensing Heat ExchangerCore Module SimulatorCarbon dioxideDirect CurrentDimethylsulfoxideDeoxyribonucleic AcidDesign Test ObjectiveDivinylbenzeneDynes per centimeterEmpty Bed Contact Time
Environmental Control and Life Support SystemsEnvironmenta Control and Life Support BranchElectrochemical Impedance SpectroscopyDevelopment Test BranchElectrochemical Module AssemblyExtravehicular Mobility UnitEnvironmental Protection AgencyExtended Performance TestFatty Acid Methyl EsterFictive ComponentFictive Component AnalysisFunctional ECLSS Data SystemFlame Ionization DetectorFormula Translator
viii

FY
gGACGC/MS
gm/IGUIH+H2H20H2SO4HSHTCOIARTlASTIMLISS
KgKOHKSC
Ib/dayIb/hr
Ibs oxygen/dayLFSPELIMSLiOHLSlM/Nm3/hrMCAMCLMCVMFBmg/LmLMLSmm HgMSFCMTUN2NASANDNDIRNTU02OCOGAORU
Acronyms (continued)
Fiscal YearGramsGranular Activated Carbon
Gas Chromatography/Mass SpectrometryGrams per literGraphical User InterfaceHydrogen ionsHydrogenWaterSulfuric AcidHamilton Standard Space Systems InternationalHigh Temperature Catalytic OxidizerIntegrated Air Revitalization TestIdeal Adsorbed Solution TheoryInternational Microgravity LaboratoryInternational Space StationKilogramsPotassium HydroxideKennedy Space CenterPounds per dayPounds per hourPounds of oxygen per dayLiquid Feed Solid Polymer ElectrolyzerLaboratory Information Management SystemLithium HydroxideLife Systems, IncorporatedModel number
Cubic meters per hourMajor Constituent AnalyzerMaximum Contaminant LevelMicrobial Check ValveMultifiltration beds
Milligrams per LiterMillilitersMostly Liquid SeparatorMillimeters of MercuryMarshall Space Flight CenterMichigan Technological UniversityNitrogenNational Aeronautics and Space AdministrationNot Detected
Non-Dispersive Infrared (methane analyzer)Nephelometric Turbidity UnitsOxygenOrganic contaminantsOxygen Generation AssemblyOrbital Replacement Unit
ix

PPCAPCRPCWQMPdPDRPFU/1 O0 m LPOSTppC02pphppmpp02PSDMpsipsiapsidpsigPt/CoPWPQFDRcRHRNARO
rpmrRNARTDS&ESACSBASCMTSEMSFESLD2SLJSLS2SPASPDFRSPESPE OGA
SSSSFSTPTCATCBTCCS
Acronyms (continued)
Pressure
Pressure Control AssemblyPolymerase Chain ReactionProcess Control Water Quality MonitorPalladium
Preliminary Design ReviewPlaque Forming Unit per 100 millilitersPredevelopment Operational System TestCarbon Dioxide partial pressurePounds per hourParts per millionOxygen partial pressurePore and Surface Diffusion ModelPounds per square inchPounds per square inch absolutePounds per square inch deltaPounds per square inch gaugePlatinum/CobaltPotable Water ProcessorQuality Function DeploymentRockwell Hardness Scale CRelative HumidityRibonucleic AcidReverse osmosis
Revolutions per minuteRibosomal Ribonucleic AcidResidence Time Distribution
Science and EngineeringStrong acid cationStrong base anionSodium-N-methyI-N-"coconut oil acid" taurateScanning Electron MicroscopyStatic Feed ElectrolyzerSpacelab D MissionSpacelab J MissionSpacelab S MissionSolid Phase AcidificationSurface to pore diffusion flux ratioSolid Polymer ElectrolyzerSolid Polymer Electrolyzer-Oxygen GenerationAssemblyStainless steelSpace Station FreedomStandard Temperature and PressureThermal Control Assembly1,2,4-Trich Io ro benzeneTrace Contaminant Control Subsystem
X
TCETCRSTHCTMTOCTONFiATTNUPUPAUPNUSUSMLUSOSVCDVRAWACWBAWDSWPWRMWRTWWORUWWP
Acronyms (continued)
TrichloroethyleneTrace Contaminant Removal SystemTemperature and Humidity ControlTechnical MemorandumTotal Organic CarbonThreshold Odor Number
Technical Task AgreementsThreshold Taste NumberUrine ProcessorUrine Processor AssemblyUnique Program NumberUnited States
United States Microgravity LaboratoryUnited States On-Orbit SegmentVapor Compression DistillationVolatile Removal AssemblyWeak acid cationWeak base anion
Water Degradation StudyWater ProcessorWater Reclamation and ManagementWater Recovery TestsWaste Water Orbital Replacement UnitWastewater Water Processor
x±


1.0 INTRODUCTION
This document provides a summary of work accomplished under Technical TaskAgreements (TTA) by the Marshall Space Flight Center (MSFC) regarding theEnvironmental Control and Life Support Systems (ECLSS) of the International SpaceStation (ISS) program. All the activities were approved in task agreements betweenthe MSFC and the National Aeronautics and Space Administration (NASA)Headquarters Space Station Program Management Office located at Johnson SpaceCenter and their prime contractor for the ISS, Boeing. These MSFC activities were in-line to the designing, the development, the testing, and the flight of ECLSS equipmentplanned by the Boeing Company in Huntsville supporting the prime contractor Boeingin Houston. MSFC's unique capabilities for performing integrated system testing andanalyses, and its ability to perform some tasks cheaper and faster to support ISSprogram needs are the basis for the TTA activities.
Tasks were completed in the Water Recovery Systems, Air Revitalization Systems, andmicrobiology areas. The tasks in the Water Recovery and Air Revitalization areaswere divided into component design, development and testing; subsystem andintegrated systems testing; analytical model development; life testing; and preliminarydefinition of flight experiments for the Phase I Shuttle/Mir missions. In the microbiologyarea, assessments of microbial degradation of Space Station materials and thePolymerase Chain Reaction microbial monitor were conducted. The results of each ofthese tasks are described in this report. More detailed reports are referenced and areavailable upon request from the MSFC Document Repository.
2.0 TASK AGREEMENTS
The MSFC initiated supporting development task agreements with the NASAHeadquarters Space Station Program Office in Fiscal Year 94 (FY-94) and they coverprojected activities through Fiscal Year 2000 (FY-00). In addition, some Fiscal Year 93(FY-93) ECLSS funded tasks were also approved by the program office in 1993.Results of the FY-93 and FY-94 activities are summarized in this ECLSS report.Although MSFC has many tasks with the program office, only the ECLSS activities aresummarized in this report.
The current ECLSS activities are managed under two program office task agreementUnique Program Numbers (UPN) 478-31-34 and 478-31-41. Those agreementsprovide a task summary description, cost by fiscal year, and civil service manpower toaccomplish the work.
3.0 ORGANIZATION
Organizations which support TTA activities and their interfaces are shown in Figure3.0-1. The Environmental Control and Life Support Branch (ED62) of the Structuresand Dynamic Laboratory within the Science and Engineering (S&E) Directorate ofMSFC managed the overall ECLSS TTA work. Within ED62, engineers wereassigned responsibilities to develop test requirements, perform analyses of testresults, support actual testing, and manage special tasks performed under NAS8-38250 (test services contract). The Development Test Branch (EL65) of the Systems
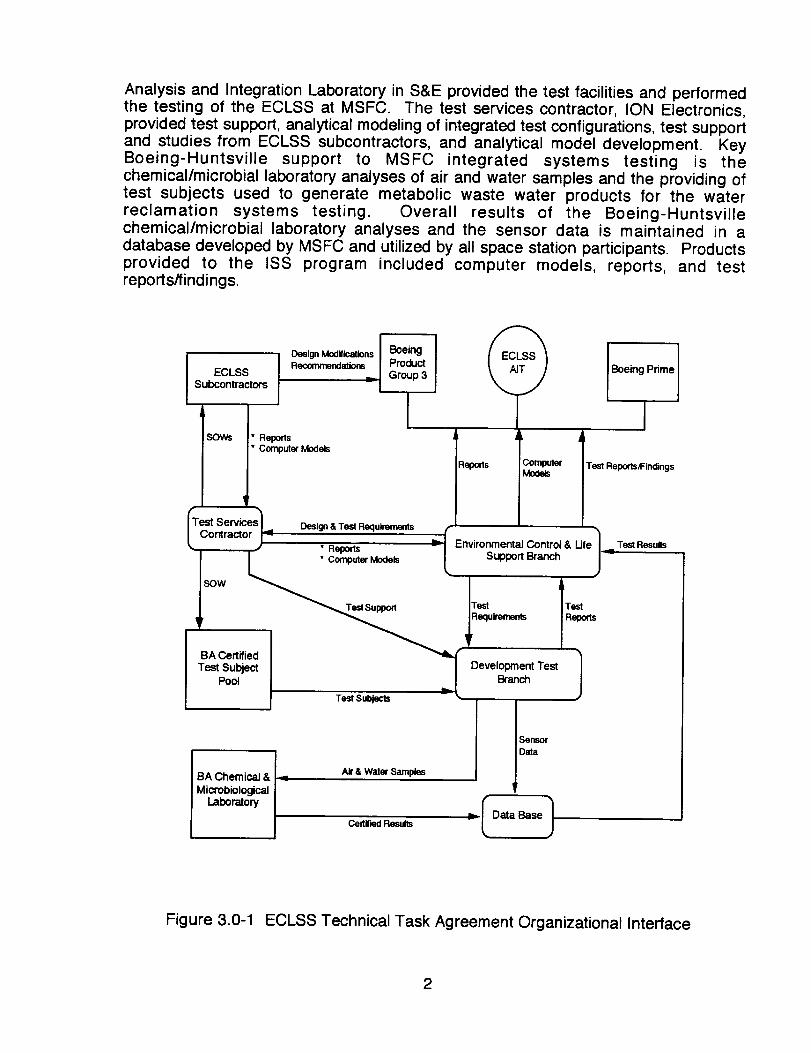
Analysis and Integration Laboratory in S&E provided the test facilities and performedthe testing of the ECLSS at MSFC. The test services contractor, ION Electronics,provided test support, analytical modeling of integrated test configurations, test supportand studies from ECLSS subcontractors, and analytical model development. KeyBoeing-Huntsville support to MSFC integrated systems testing is thechemical/microbial laboratory analyses of air and water samples and the providing oftest subjects used to generate metabolic waste water products for the waterreclamation systems testing. Overall results of the Boeing-Huntsvillechemical/microbial laboratory analyses and the sensor data is maintained in adatabase developed by MSFC and utilized by all space station participants. Productsprovided to the ISS program included computer models, reports, and testreports/findings.
ECLSSSubcontractors
SOWs
I 'ngIGroup 3 1
• Reports• ComputerModels
IT_st Serv_es L
Contractor ) -
Design & Test Requkemenls
• Reports
_" ComputerModels
SOW
_..,_est Support
BA CertifiedTest SubjectPool
Test Subjects - _,
I BA Chemical & i--_ Air& WaterSamples
MicrobiologicalLaboratory
CertiliedResults
Reports ComputerMocle4s
Boeing Prime
TestReports/Findings
Environmental Control & UfeSupport Branch
equirements
Development TestBranch
_..__Test Results
lT-
Figure 3.0-1 ECLSS Technical Task Agreement Organizational Interface
2

4.0 WATER RECOVERY SYSTEMS
4.1 Component Design and Development
There are several outstanding design issues associated with components in theUnited States (US) segment water recovery systems which require early developmentattention. The following sections describe the specific component, the design issue,and the on-going supporting development activity that is addressing the issues.
4.1.1 Process Pump 1
The process pump is an integral part of the Waste Water Orbital Replacement Unit(WWORU) within the ISS Water Processor (WP). The function of the WWORU is todegas waste water, store waste water prior to processing, and pump waste waterthrough the WP. The process pump's function is to supply the system's flow rate andoperating pressure of 15 pounds per hour (pph) and approximately 70 pounds persquare inch gauge (psig), respectively.
During the first and second quarter of 1992, HS evaluated prototype Process Pumpmodel number (M/N) 2992 for performance capabilities in meeting the Space StationFreedom (SSF) requirements. Two identical gear pump assemblies were procuredfrom Howden Fluid Systems, formerly Pneu Devices Inc. The pump and motorcontroller are shown in Figure 4.1-1. The gears were manufactured of nitrited 17-4PHstainless steel (SS). Testing efforts were terminated due to high motor temperatureand no flow conditions indicating pump failure. After extensive review, the failureresulted from corrosion of a low carbon steel plug in the test rig. Particles from thecorroded plug flowed into the pump which caused gear lock-up. Internal evaluationsof the pump head showed several areas of corrosion and concluded that the corrosionresistance of the gear and cartridge materials needed to be improved to meet the liferequirements.
Figure 4.1-1 Water Processor Pump Prototype
3

The primary goal of the program that began March 1994 and concluded July 1995,was to continue the development of the 2992 process pump by significantly improvingcorrosion resistance while still meeting the mechanical requirements for the pump.The first gear materials evaluated included Inconel 718 and 15-5 PH stainless steel.These gear materials were tested during August and September 1994.
4.1.1.1 Inconel 718 2992 Pump
The Inconel 718 gear pump operated for approximately 30 seconds before it locked-up. The tear down investigation revealed that significant galling deformation hadoccurred. The galling was found between the side plate and the gear end faces alongwith between the drive faces of the gears. The galling at the gear end face appearedto cause the pump lock-up.
The conclusion from this test indicated that the surface hardness of the gears in a non-lubricating fluid was insufficient to provide proper wear resistance. The hardness ofthe Inconel 718 gears tested was approximately 40 - 41 RC (Rockwell Hardness ScaleC), which compared to a standard nitrided 17-4 PH SS gear material hardness of 58 -65 RC, is relatively low. It was originally anticipated that the pump operatingconditions would allow lower gear surface hardness but the results indicated this wasnot true.
4.1.1.2 Stainless Steel 15-5 2992 Pump
The 15-5 PH SS gear pump was tested for 188 hours using waste water. The testingwas initiated with a two hour operational check out, the pump and cartridge assemblywere then disassembled to inspect the gears. The inspection found no galling andonly a slight wear pattern on the gear teeth. The slight wear was judged normal;therefore, testing continued.
After the test was stopped at 188 hours, the pump was disassembled and the cartridgeassembly was inspected. The inspection revealed that the drive faces of both gearshad significant wear which led to the pump's performance decrease. Similar to theconclusion reached on the Inconel 718 gears, the 15-5 PH gear surface hardness wastoo low to provide adequate life in the non-lubricating fluid.
Following the conclusion of these tests, a program review meeting resulted in thedevelopment of a new action plan to continue the gear pump development. Threemajor tests were developed to further evaluate improvements in gear life performance.These included: (1) operating a 15-5 PH SS gear set at lower speeds to determine iflife performance is improved; (2) fabricate and test a borided Inconel 718 set of gears;and (3) fabricate and test a borided cobalt alloy Stellite 6B set of gears. The stellitegears were manufactured for a larger pump (M/N 2941) for pump operation atapproximately 1500 revolutions per minute (rpm). This pump would be used to furtherevaluate lower operating speeds. The three options listed were fabricated and testedfrom January through June 1995.
4

4.1.1.3 Low Speed 15-5 2992 Pump
Since an additional set of 15-5 PH SS gears was already available, it was decidedthat a low cost and quick method of obtaining some quantitative results on thisparameter would be to operate the 2992 pump at a reduced speed and evaluate anyimprovement in performance life. The test accumulated 257 hours of operation beforestopping the test due to a significant performance reduction.
Following the test the pump and cartridge were disassembled and inspected. Theinspection revealed that damage similar to the initial 15-5 PH SS had occurred.Although the lower speed pump test operated approximately 37 percent (%) longer,the initial 170 hours were operated at a lower pressure (i.e., 55 psig); therefore, lowergear loading resulted. Also taking into account that this test was conducted with alimited number of samples, the results indicate no significant improvements in pumplife was achieved.
4.1.1.4 Borided Inconel 718 2992 Pump
An initial check-out test was conducted on the borided Inconel 718 pump using cleandeionized water as the test fluid. At test beginning the pump operated smoothly andquietly. No noise readings were taken but the pump could not be heard over thelaboratory background noise. The test was stopped as a result of a pump lock-up after87 test hours. A tear down and inspection revealed significant damage to the geardrive faces. The metallurgical examination found that the boride layer on the geardrive faces had been removed. Once the borided surface was removed, gallingoccurred resulting in pump lock-up. No corrosion or damage to the cartridge wasfound.
4.1.1.5 Borided Stellite 6B 2941 Pump
An initial check out test was conducted on the borided Stellite 6B pump (M/N 2941)utilizing clean deionized water as the test fluid. This pump was tested in parallel withthe M/N 2992 borided Inconel 718 pump. At test beginning the pump operatedsmoothly, but unlike the M/N 2992 pump, this pump was clearly audible. No noisereadings were taken but the pump could be easily heard over the laboratorybackground noise. An interim clean water performance check indicated a slightdecrease in performance. Following this check, the waste water was replaced and thelife test was continued.
The test was stopped after 424.75 hours to investigate if any damage had or was in theprocess of occurring to the Stellite 6B gears. This decision was based on evidencefound on the Inconel 718 gears along with the decreased pump performance. Theintent of the early shutdown was to find some evidence of possible boride coatingfailure, possibly in process, on the Stellite 6B gears. The pump performance haddecreased from the test start. Specifically, the power had increased approximately10% and the outlet pressure gauge was fluctuating approximately 20 psig. Also, thenoise and vibration from the pump appeared to have increased. This gauge and noiseinformation indicated that possible internal gear damage may have occurred.
5

A teardown and inspection revealed significant damage to the gear drive faces whichwas similar to that found on the Inconel 718 gears. The metallurgical examinationfound that the boride layer on the gear drive faces was removed. Once the boridedsurface was removed, wear of the gears occurred. The wear/damage to the gearscaused an increase to the pump backlash which was believed to have caused thegauge instability and increased pump vibration and noise. Also, the increasedbacklash was believed to have caused the decrease in pump performance.
The examination of both the Inconel 718 and Stellite 6B gears showed cracking in theareas near the edge of the removed boride. These cracks likely indicated the coatingwas not sufficient to withstand the gear loading. No corrosion or damage to thecartridge was found.
The following observations were obtained during the Process Pump developmentprogram:
• No foreign contaminants were responsible for any pump/gear failures.
• All improvements to the cartridge components appeared to be successful.
• No signs of corrosion were evident on any materials tested.
The following conclusions were drawn:
• The combination of the thin boride diffusion depth of 0.001 inch and the hard/brittlenature of the boride zone led to cracking and removal of the boride layer.
• Borided gears are insufficient for this gear pump application.
There was no apparent improvement in life performance anticipated with a pumpspeed reduction of approximately 500 to 600 rpm. Therefore, the 2992 pumpconfiguration was better for further development of this pump. This permits the useof the higher efficiency device.
• A gear pump may not be the proper technology for the ISS WP application.
HS presented the trade study results from Phase 1 of the process pump developmenteffort January 1996. The trade study was based on the Quality Function Deployment(QFD) technique. The pump requirements were selected and prioritizedindependently from the technology assessment. Eleven major selection criteria weredeveloped and prioritized to assess 50 different pump technology configurations.Go/No Go criteria were developed to screen the fifty technologies before thecomparative evaluation was undertaken. As a result of the Go/No Go screening andthe combining of similar pump technologies, the 50 pump technology configurationswere reduced to 12. The eleven criteria were weighted according to priority, withreliability being the highest priority at 29.9% of the total grade, and reliability, designapplicability, and development cycle together accounting for 54% of the total grade.The 12 pump technologies remaining after the screening were then evaluated againsteach of the 11 criteria. External gear and piston pump technologies were the clear
6

winners of the trade study. The external gear pump scored the highest in 8 of theeleven criteria, but tied with 3 of the 12 pumps for the lowest score in readability. Thepiston pump scored the highest in 6 of the eleven criteria, and tied with 5 of the 12pumps for the second highest score in readability. After review and discussion, NASAand Boeing agreed with HS's trade study results and agreed that gear and pistonpump prototype designs should be developed as two of the three technologies calledout in the contract. The next highest rated pumps were the vane and diaphragmtechnologies. Because they were so closely scored (diaphragm scored 429 pointsand the vane pump scored 430), HS took an action to investigate the diaphragm andvane pump technologies further to determine which technology will be carried throughthe prototype design with the external gear and piston pump during this phase.Presently, all four pump technologies will be carried forward to a prototype design.
Parallel to the trade study and prototype development effort, the original process pumpdesign was to be tested using 17-4 stainless steel gears. In previous testing, thesegears had shown an operational life approximately an order of magnitude longer thanother gear materials used in this design, but a test stand failure had caused prematurefailure of the pump. This test was intended to determine the actual life of these gearsto see if they showed promise for meeting the requirements of the ISS. However,since Howden Fluid Systems did not respond to the Statement of Work issued by HSin a timely fashion, the pump will not be on test until April 1996, which is one monthprior to the scheduled completion of this phase of the development effort. Technically,it was agreed in the meeting by HS, Boeing, and MSFC, that the Howden pump hadlittle hope of showing a significant improvement in life compared to the other gearmaterials. Therefore, it was recommended both from a technical and programmaticperspective that the Howden pump test be dropped from the tasks of Phase 1. Thisrecommendation was reviewed with the Space Station ECLSS Manager and heconcurred with this decision.
4.1.2 Mostly Liquid Separator 2
The Mostly Liquid Separator (MLS) is another integral part of the WWORU within theISS WP. The MLS removes free gas from waste water prior to storage. The MLSdesign will remove approximately 10% by volume of free gas.
Water processor waste water contains free gas along with other materials which causefoaming. If the gas is not removed the system can become "gas-locked" which resultsin the degradation of the system's performance. HS has developed the MLS wherefree gas is separated, collected, and vented to the cabin; and the waste water is storedor drawn into the processor by the process pump.
HS built an initial MLS unit to remove free gas from the inlet waste water of the PotableWater Processor (PWP). This MLS used a series of low speed paddles which createdthe forces to separate the fluids, and a high speed screen coalescer which entraineddroplets from the gas vent flow. The unit was tested using deionized water with variedinlet gas content. These studies gave a positive indication of the MLS unit feasibility.
After SSF redesign to ISS, the Potable and Hygiene Water Processors were combinedinto a single water processor. The MLS, with a single water processor, would have to
7

treat waste water loaded with soap. Since the paddle design aggravated the foamingproblem, a design change was necessary. The paddle and screen design wasreplaced with a series of cylindrical disks. This design was tested using clean(deionized) water, soap and water, and shower water with varied free gasconcentrations. Although there were modifications incorporated into the MLS designduring testing, results indicated that the design concept provided gas/liquid separationand insignificant foaming.
The primary purpose of the MLS tests was to further develop the MLS technology,characterize its performance, and define its operating requirements. The four mainobjectives to develop the next generation MLS from the requirements of the ISS WPwere:
To map the performance of the MLS within the expected operating conditions of theSpace Station Water Processor. This effort first focused on identifying the lowestrpm at which the separator would operate without water carry over into the gasoutlet line for the full range of inlet flow rates. As the MLS was designed to operatewith a constant rpm, the lowest possible rpm suitable for all flow rates would thenbe selected as the operating value. It was believed that minimizing the rpm wouldlower power consumption and minimize any detrimental turbulences within theMLS. Using this rpm, the amount of air carried over in the water outlet lines wasmeasured for each inlet flow rate and for various percentages of air in the inletstream. This performance mapping procedure was repeated using clean water,soap and water, and shower water.
• To demonstrate the insensitivity of the MLS unit to gravity. This was accomplishedby orienting the MLS in various positions and then mapping its performance.
To identify potential enhancements to the design or operation of the MLS.Observations made during development testing resulted in frequent modificationsto the MLS and test rig.
To evaluate the extended performance characteristics of the separator. Thepurpose of this test gathered experience on how the MLS works in near-continuous, long term operation using "real" water.
A new MLS design was created that was sized to operate over the full 60 to 960pounds per hour (Ib/hr) inlet flow range and that utilized an improved controlmechanism to regulate gas venting. MLS units were built and tested to demonstrateacceptable performance at high inlet flow rates (up to 960 Ib/hr), under a variety ofwater conditions. The success of the development program was aided by the use of atranslucent plastic MLS which provided visual observation during operation.Performance mapping indicated that acceptable performance can be achieved at1900 rpm for any water condition with 0% - 14% air in the inlet stream. Severalhardware modifications were made during the course of the program to improveperformance, the majority were successful. Test results suggested that maintaining anear-constant backpressure and rpm within the MLS was of prime importance inproviding acceptable performance.
8

The MLS unit is shown in Figure 4.1-2. The prototype MLS units, built and tested,contained all of the features of the flight unit except for a flight-style motor, which wasreplaced with a variable speed, external, direct drive motor.
Figure 4.1-2 Mostly Liquid Separator
The motor spins a hollow center shaft mounted on journal bearings. A series of disksare attached to the shaft extending radially outward to a diameter approximately 1/4inch from the inside diameter of a cylindrical housing. Each disk has a series of slottedholes extending through the disk near its center. The shaft has slots cut into its outsidediameter so that the space between some of the disks near the center of the stack isvented to the shaft's center. The end of the shaft is open to a level control valvearrangement that connects to the gas vent.
In operation, a mixture of water and air enters the unit tangentially near the motor endof the housing. The mixture is forced to spin around the housing centerline as itfollows the cylindrical housing wall. Initial separation occurs in this portion of thehousing with the water moving to the outside and the air bubbles moving toward thecenterline. The partially separated mixture then enters the disk portion of the housingwhere the centrifugal action of the spinning disks forces the water to the housing wall,forming a water ring that is maintained in motion by contact with the outer edge of thespinning disks. The air moves to the center line and flows through the holes in thedisks towards the slots that connect to the center of the shaft. As the control valve
opens, gas is vented from the separator. The water moves along the outer wall of thehousing and exits tangentially, allowing recovery of some pressure head. Water levelin the water ring is maintained by the action of the control valve. A control piston
9

pushes on the control valve element with a force that is proportional to the height andspinning velocity of the water ring. As the water level increases, the static pressure atthe outer diameter increases with respect to the centerline pressure due to increaseddepth and due to an increased rotational velocity resulting from greater contact areaon the rotating disks. This difference in pressure creates the level control force and isbalanced against a spring to determine the vent valve position.
The Extended Performance Test (EPT) was conducted for 296.5 hours, frequentlyrunning 24 hours per day. Inlet flow was held at 60 pph, inlet air was held at 14%, andthe MLS ran at 1900 rpm. No difficulties or unusual conditions were noted.
The final observations concern the modifications made to the MLS hardware:
• The diaphragm seal needs to be flat and requires minimal force to seal. A 0.031inch thick Fluoroelastomer was used.
• The end disk, with paddles removed and enlarged vent holes, improved the aircarryover performance.
• A dynamic seal was necessary to prevent water leakage past the Rulon journalbearing.
The flat disks, with vent holes modified into slots to reduce the air flow restriction,improved air carryover performance.
The inclusion of an end disk in the first or second disk position (nearest the inlet)improved performance.
Repositioning the disk assembly shaft's vent holes two positions further away fromthe inlet improved water carryover performance.
The new backpressure valve did not provide a constant backpressure that wasindependent of inlet flow.
The current fault detection magnets and proximity switches did not provide thenecessary sensitivity for proper operation.
The air primarily vented at discrete times, rather than continuously. When thisoccurred, the backpressure would momentarily go to 0 pounds per square inch(psi), and the depth of the water ring would increase as the gas was vented. Therpm would consequently change in response to the changing depth of the waterring. It was concluded that the interaction of each of these responses resulted inthe relative instability seen at times in the operation of the MLS unit, and that thisinstability affected the air carryover performance. Consequently, it was concludedthat transient backpressure fluctuations need to be minimized or eliminated and thebackpressure needs to be held constant for all inlet flow rates.
Use of a single 1/2 inch ball valve to regulate backpressure resulted in dramaticimprovement in the air carryover performance of the MLS.
10
The following conclusions were drawn regarding the performance of the MLS:
• The performance of both MLS units met the design requirements.
• No performance degradation was noted after an extended duration performanceevaluation.
• Higher flow rates required a higher rpm to prevent water carryover.
• The percentage of air that is carried over into water outlet lines increases withincreasing rpm and inlet flow.
• An acceptable operating speed is 1900 rpm.
• The inlet chamber and inlet disks both affected air carryover performance when theMLS was oriented horizontally.
• Backpressure instability will adversely affect air carryover performance.
• The diameter of the main water outlet line may need to be increased to help ensurethat backpressure can be independent of inlet flow.
• The use of a translucent plastic housing was a significant aid in testing.
The current MLS development effort will implement design changes to solve some ofthe short comings discovered in the previous development effort. The most significantdesign changes that will be incorporated are as follows:
Because of the sensitivities to back pressure, inlet flow rate, and rpm fluctuations,changes to test rig as well as to the MLS design will be incorporated. Backpressure will be improved by using a water accumulator to provide a stable backpressure on the MLS. The diameter of the outlet line of the MLS has beenincreased to remove sensitivities to inlet flow rate (resulting in internal changes inback pressure). A constant speed direct drive motor is being used for this effort toremove any loss in rpm due to loading of the discs when input flow rates increase.
To further improve water carryover in the air side, a redesign of the shaft and airsolenoid valve was undertaken. The shaft is now hollow, with the outlet port for theair located internal to the shaft. This design shields the outlet from any splashingwhich occurs at the control valve end of the MLS (the original location of the airoutlet port) and should therefore improve separation performance.
• The control valve was redesigned to improve sensitivity and provide adequatecontrol during MLS operation.
The design was completed in February of 1996. Manufacturing will begin in February1996 with testing of the redesigned MLS to start in the fall of 1996.
11

4.1.3 Volatile Removal Assembly 3
The Volatile Removal Assembly (VRA) Reactor is an integral part of the Space StationWP. The WP is used to generate potable quality water from a variety of waste watersgenerated on the Space Station. The VRA reactor is located in the Catalytic ReactorOrbital Replacement Unit (ORU) which is downstream of the two Unibeds ®. Its
purpose is to oxidize volatile organics which are not easily removed by multifiltrationtechnology (ion exchange and adsorption). The VRA Reactor uses gaseous oxygenalong with a noble metal catalyst to oxidize the organics. This reaction produces acombination of organic acids and carbon dioxide which are subsequently removed bya downstream phase separator and an ion exchange resin bed. The reactor operatesat relatively low temperatures, approximately 265 degrees Fahrenheit (°F), and alsosterilizes the water that flows through it.
In August 1991, the predevelopment potable water processor, containing a VRAreactor with a carbon substrate, was delivered to MSFC and subsequently tested. Thistesting indicated a degradation in reactor substrate over time, which would eventuallycause an unsatisfactory operating life. HS continued development efforts to improvethe reactor's performance life. These efforts resulted in the use of a new substratematerial, alumina, designed to improve the reactor's life. The second system, thePredevelopment Water Processor, used this new reactor material and was delivered inAugust 1992 for further testing at MSFC.
In a parallel effort, the improved reactor design and 250 cc of the raw catalyst weredelivered to Michigan Technological University (MTU) to develop performancecharacteristics for a mathematical model of the VRA Reactor. The mathematical modelused empirical data gathered by in-house MSFC testing of the referenced VRAReactor. The catalyst was received on July 20, 1994 and the VRA Reactor wasreceived on August 18, 1994. A more detailed discussion of this effort is included inSection 4.3.2.
4.1.4 Process Control Water Quality Monitor
The purpose of this task was to procure a development unit Process Control WaterQuality Monitor (PCWQM) to be utilized in the Stage 9 Water Recovery Test. The WPdesign for the Space Station Water Reclamation and Management (WRM) Subsystememploys a PCWQM to verify acceptability of water prior to use. An integrated testinvolving a flight-like PCWQM was necessary to verify that the design of the PCWQMcan be integrated with the WP.
The PCWQM was refurbished with the necessary flight-like sensors and componentsso that it could be successfully integrated and operated in the Water Recovery Test(WRT) Stage 9. Astro International delivered one PCWQM that utilized the sensortechnology proposed for the flight design of the PCWQM. The operations manual andother applicable documentation were also included in this procurement. A discussionof the PCWQM performance may be found in the ISS ECLSS Phase III WaterRecovery Test Stage 9 Final Report, Technical Memorandum (TM)-108498. 5
12

4.1.5 Urine Pretreatment 4
There are several problems and considerations for the proper collection, storage, andprocessing of urine in a microgravity environment for long duration manned spacecraftmissions such as the Space Station. Urine processing for water reclamation usuallyrequires the addition of chemicals to fix the urea, provide microbial control, andminimize urine particulate formation. Because there is minimal use of flush water, theadditive chemicals must also eliminate particulate deposits within the equipment andplumbing which can cause premature failure to hardware and systems.
Urine pretreatment, as presently defined for the Space Station program for properdownstream processing of urine, is a two-part chemical treatment of 5.0 grams (g) ofOXONE® Monopersulfate compound and 2.3 milliliters (mL) of sulfuric acid (H2SO4)per liter of urine. A new method of introducing the OXONE ® portion into the two-phaseurine/air flow stream of the Space Station urine processor has been successfullytested and evaluated. The feasibility of this innovative method has been establishedfor purposes of providing a simple, convenient, and safe method of handling achemical pretreatment. During a real time test collection of 750 pounds of urine,OXONE ® introduced into the processors urine/air flow, upstream of the Fan/Separator,has demonstrated the following advantages:
• Eliminated urine precipitate buildup on internal hardware and plumbing.
• Minimized odor from collected urine.
• Virtually eliminated airborne bacteria.
This study program and test demonstrated only the addition of the proper ratio ofOXONE ® into the urine collection system.
The program was divided into three major tasks: (1) a trade study, to define andrecommend the type of OXONE ® injection method to pursue further; (2) the design andfabrication of the selected method; and (3) a test program using high fidelity hardwareand fresh urine to demonstrate the method feasibility.
The trade study was conducted to define different forms and methods for introducingOXONE ® into a urine system. OXONE ® was considered in liquid, solid, paste, andpowdered forms. The results from the trade study recommended a solid tablet in a bagsuspended in the urine/air flow stream. These OXONE ® tablets would slowly dissolveat a controlled rate providing the proper concentration in the collected urine.
To implement the solid tablet in a bag approach, a design concept was completed withprototype drawings of the urine pretreatment prefilter assembly. A successfulfabrication technique was developed for retaining the OXONE ® tablets in a fabriccasing attached to the end of the existing Space Station Waste Collection Systemurine prefilter assembly. The final pretreatment prefilter configuration held sufficientOXONE ® in a tablet form to allow normal scheduled daily (or twice daily) change out ofthe urine filter depending on the use rate of the Space Station urine collection system.
13

The test to prove the concept was conducted using the Urine Fan/Separator assemblythat was originally used in the STS-52 Design Test Objective (DTO) urinal assembly.The Fan/Separator was installed into a portable urine collection test assembly for realtime collection of urine. Urine collection continued over a 2-month period with a totalof 40 batches of urine collected. Each batch consisted of approximately one day ofurine collection with a fresh pretreatment prefilter installed at the beginning of the day.Based on a mass balance of urine collected and OXONE® tablets used, an averagepretreatment ratio of 5.2 g of OXONE ® per liter was obtained. This meets the testprogram goal of a minimum average of 5.0 grams per liter (gm/I). Also, a post testteardown of the test hardware (including the urine separator and downstream urinecheck valve) showed that OXONE ® alone does an excellent job of eliminatingundesirable urine particulates in the system. The collection reservoir also maintaineda 4.5 pH average.
Other related tests were conducted to demonstrate the actual minimum ratio ofOXONE ® to urine that will control microbial growth. The results of this test indicated
that at 3.0 gm/I there was limited control and above 4.0 gm/I microbial growth wasprevented over 7 days. A microbial air sampling test (at 10 cubic feet per minute (cfm)air entrainment flow) of the Urinal Fan/Separator indicated that sample points withinthe urine collection system and at the outlet did not contain microbes over thedetection limits of 12 Colony Forming Units per cubic meter (CFU/m3). Air samples atthe urine funnel showed that men's bathroom air entering the system was as high as193 CFU/m 3.
An effective method of dispensing sulfuric acid to the waste stream is currently underinvestigation. A solid tablet has been developed using potassium bisulfate to hold thesulfuric acid in the tablet. Potassium bisulfate is already a part of the Oxone ® so noadditional chemicals would be added, only a slightly larger amount of that salt. Thistablet would be added to the string Oxone ® tablets already in the filter so that the urinepretreatment chemicals would be added once or twice daily with the filter. Noadditional maintenance would be required for the pretreatment. Testing to prove thismethod is planned for the near future.
4.2 Stage 9 Water Recovery Test 5
The provisions of safe potable water to spacecraft crew members has been arequirement since the beginning of the US manned space program three decadesago. Spacecraft water systems have evolved from stored chlorinated supplies used inthe Mercury and Gemini programs to the Space Shuttle's iodinated fuel cell productwater system.
To reduce the quantity of fresh water to be resupplied from the ground (as well as toreduce the quantity of waste water to be returned to the ground or otherwise disposedof on-orbit) the ISS WRM System will reclaim water from a variety of waste watersources for reuse. Through reclamation and reuse, a given mass of water may beused repeatedly. Resupply of fresh water and return (or disposal) of waste water isthus reduced to that necessary to compensate for the inefficiencies of the reclamationprocesses.
14

The development of the ISS WRM System has been supported through integratedECLSS testing at MSFC. This testing, which began in 1986 and has continuedthrough ISS Preliminary and Critical Design phases, has been conducted withdevelopment potable and hygiene water reclamation assemblies which wereintegrated with end-use equipment. Man-in-the-loop testing of these integratedsystems has provided early performance data on "heart-of-the-subsystem"technologies in environments that would have otherwise been impossible toreproduce with artificially prepared "ersatz" waste waters or "stand-alone" subsystemtestbeds.
Integrated ECLSS testing dedicated to the WRM System has been conducted as partof the WRT series. The WRT was originally conceived as a nine-stage test proceedingfrom open-loop "donor-mode" in which human test subjects generated waste watersfrom non-recycled water to closed loop "recipient-mode" in which reclaimed water wasreturned to test subjects for reuse and subjective assessment. Data collected fromearly WRT stages, combined with the passing of ISS program design review andrestructuring milestones, necessitated the revision of the WRT plan. Donor mode tests,with a dual-loop (potable and hygiene) water recovery system were completed in1990. Recipient mode tests, with a dual-loop system, which was modified inaccordance with ISS subsystem technology selections, were completed in 1991.Donor and recipient mode testing, with a single loop system representative of therestructured ISS baseline and modified to utilize the current available technology forthe WP, was completed in early 1992. Additional single loop testing, complete in late1992, evaluated the impact of eliminating the WP presterilizer on unibed life andoverall WP performance.
In 1993, the Space Station Program went through the most extensive redesign sincethe program began in the mid 1980s. When the redesign was concluded in late 1993,SSF was completely redesigned and was renamed International Space Station. Aspart of the redesign, Boeing's Predevelopment Operational Systems Test (POST) forthe WRM System was deleted and replaced with the WRT Stage 9.
The WRT Stage 9 was conducted at NASA/MSFC to evaluate the latest water recoverysystem design for the United States On-Orbit Segment (USOS) of the ISS with higherfidelity hardware and integration than has been achieved in previous WRT stagetesting. Potable and urine processing assemblies were integrated with end-useequipment and operated for 116 days. The overall integrated configuration of the testsystem included a single water recovery loop that was automated and controlled froma central computer. The Water Recovery System, Stage 9 simplified functionalschematic is shown in Figure 4.2-1.
The main objective of Stage 9 was to operate higher fidelity Water Recovery hardware,integrated to reflect the ISS USOS configuration, in an automated system level controlscheme. Previous WRT stages at MSFC had successfully demonstrated that the WRMSystem technologies could produce potable grade water from the various wastestreams expected on the Space Station. Stage 9 allowed the assessment of the waterrecovery technologies under system operational constraints and conditions that wouldbe expected on the Space Station.
15

PCWQM i
Water Processor V
samples &[
simulated ]recipient
mode I
End-use Equipment facility water
- _reclaimed potable water "" q
Oral WL St
urine distillate
animalcondensate
ersatz
humidity condensate
Urine Urine
Processor [ I
equipment off-gas [ f _ Icondensate ersatz [ .__ [ Microwave [ [
I-- ------ --
CHeCSWaste
Ersatz
Figure 4.2-1 Water Recovery System Simplified Functional Schematic
Analysis of the WRT Stage 9 test data resulted in a number of conclusions andrecommendations. These conclusions and recommendations are given in thefollowing paragraphs.
The control logic for the WRM System and simulated recipient mode performed wellthroughout Stage 9. Based on the Stage 9 data, the water management control logicis considered to be sufficient to maintain product water availability and waste waterstorage capability aboard the ISS. However, the PCWQM data interpretationalgorithm was unable to respond to the dynamics of the WP or PCWQM performance.Additional studies are recommended to develop control algorithms that are bettersuited for interpreting the PCWQM data. As the ISS operational scenarios are better
defined, the WRM System control logic should be tested using computer modelingtechniques.
The predevelopment urinal functioned effectively in collecting urine and providingpretreated urine to the Urine Processor (UP). Air entrained in the pretreated urinestream created starf-up difficulties for the Vapor Compression Distillation-V (VCD-V)though this phenomenon is not expected to be significant in microgravity. The VCD-Vwas able to produce distillate meeting water quality requirements while incurring nohardware anomalies.
16

The PCWQM Total Organic Carbon (TOC) and conductivity sensors performed wellthroughout Stage 9. The iodine and pH sensor data was not consistent with thatreported by the Boeing laboratory, requiring a further assessment of these sensors.Gas in the product water led to an inconsistent pH measurement, which subsequentlyled to erroneous calibration and recirculation modes. The presence of gas in thesample loop also caused channeling which potentially reduced the life of the SolidPhase Acidification (SPA) module.
The PCWQM sample loop experienced a high delta pressure anomaly during the testwhich raised concern regarding the tubing size in the sample loop and the effect ofgas on the PCWQM. The small tubing size (0.040 inch diameter) used in the PCWQMsample loop was at great risk of particulate blockage. Since this was also thesuspected cause of failure in the ECLSS Flight Experiment that utilized similar sizetubing, analyses should be conducted to ensure particulate contamination does notlead to a PCWQM failure. The high delta pressure anomaly could also have resultedfrom paste resistant to flow, thus creating a high pressure drop. The effect of gas onthe SPA module and the PCWQM pH sensor emphasized the sensitivity of thePCWQM performance to the presence of the free gas in the product water and theneed to develop a flight design WP phase separator and validate its performance.
The TOC Monitor Deletion study determined that no correlation can be establishedbetween reactor effluent conductivity and on-line product water TOC. The mostfeasible approach to a real-time assessment of the VRA performance is with on-lineTOC monitoring. An alternative approach is batch TOC analysis subsequent toproduct water generation, though it would not provide water quality verification prior touse. This batch approach accepts the risk that VRA performance degradation will notpresent a critical safety hazard as a result of product water consumption prior to TOCanalysis.
The ISS integration and operational modes simulated in Stage 9 reduced the life ofthe WP filter. Additional filter surface area will be required to enable the filter to meetthe throughput requirement. No measurable impact to the Unibed® life was observedbetween Stages 7, 8, and 9 with regard to ionic contamination loading. The identicalcontaminant loading rates achieved in the tests indicated that a shelf life of up to 22months has no detectable effect on the Unibed® performance.
The VRA reactor transient temperature anomaly was seen in all previous tests atMSFC and was considered unacceptable for the efficient operation of the VRA reactor.Control and heater configuration design changes will be required to eliminate thistransient anomaly.
Viral testing was conducted on the WP to verify its ability to meet the ISS specificationof <1 Plaque Forming Unit per 100 milliliters (PFU/IO0 mL). No viruses were detecteddownstream of the Unibed ® train, indicating adsorption of the viruses by the Unibed ®adsorbents. The high temperature, oxidation environment of the VRA was expected toprovide an additional barrier for the viruses. Based on these results, the ability of theWP to remove viruses from the waste water appeared to be excellent.
17

The automated operation had no apparent effect on the WP product water quality. On-line PCWQM data detected two phenomena related to the performance of the VRA.First, a TOC spike at the beginning of each process cycle was determined to consist of
organics leaching off of the IRN-78 resin located in the ion exchange bed. Replacingthe IRN-78 resin with IRA-68 resin could potentially minimize if not eliminate theseleachates without impacting the life expectancy of the ion exchange bed. Second, anincrease in product water TOC occurred due to a degradation in catalyst performanceover the course of a processing cycle. The cause of this degradation appears to becatalyst poisoning due to the slow desorption of oxidation products in the reactorand/or the contamination of the catalyst with compounds that occupy reaction siteswithout being readily oxidized. Overall, the effect of the TOC rise on product waterquality was minimal, though further studies of this phenomenon are recommended to
ensure that the WP will be able to reliably produce water meeting the ISS water qualityrequirements.
4.3 Analytical Model Development
Recycling the water aboard the ISS involves a series of treatment processes to convertwaste water to potable (drinking) water. Figure 4.3-1 below is a simplified schematicof the WRM System. It shows the source points for water and the collection bus which
feeds into the water processing assembly. The various waste streams treated by theISS water processor include: 1) urine distillate; 2) waste shower/handwash water; 3)humidity condensing heat exchanger (CHX) condensate; 4) oral hygiene and wetshave waste; 5) mixture of animal condensate and evaporated urine; 6) fuel cellproduct water; and 7) Extravehicular Mobility Unit (EMU) condensate.
Urhe and Flush
MullfllmtioflBed
CondensateJ
J
Figure 4.3-1 Simplified Schematic of Water Processing System for ISS
18

Once the water reaches the water processor bus, it first passes through a 0.5 micronfilter to remove particulate matter (dirt, urine particulates, system contamination, etc.).Next in the sequence, ion exchange resins and adsorption media are combined inmultifiltration beds (MFB) for removal of ionic and organic compounds. These bedsremove specific organic compounds and ion contaminants. Catalytic Oxidationtechnology incorporated into the VRA follows the MFB to remove low molecular weightorganics not efficiently eliminated via MFB adsorption. The water is tested via thePCWQM and, if it meets the defined quality requirements, it is distributed back to theend use points for recycling.
Water Recovery system analytical models are being developed for the water processormultifiltration beds and the VRA reactor. When completed, these computer models willhave the capability to predict performance of these components for varying inputconditions and thus reduce the amount of testing that is currently required.
4.3.1 Multifiltration Beds e
A schematic of a multifiltration bed is shown in Figure 4.3-2. The MFB model wasdeveloped to enable engineers to predict the impact of changing process variables onthe performance of the multifiltration bed. The model will also be used to simulatelaboratory and pilot scale experiments. Process variables such as the time variableinfluent contaminant concentrations (including number and type of contaminants),empty bed contact time, sequence of the ion exchange resins and adsorbents(including number and type) within a multifiltration bed or multiple beds, andcompetitive interactions among ions and adsorbates can be evaluated with the model.
The first phase of testing focused on verification of the model for a surrogate of thewaste shower and handwash stream, termed "ersatz" water. An ersatz water wasmade up to mimic the TOC adsorption capacity of the actual waste shower andhandwash water as it exists after exiting the waste tank storage and pre-filter (seeFigure 4.2-1). A TOC isotherm was performed to verify that the TOC adsorptioncapacity of the ersatz water was similar to that of the actual waste shower andhandwash water. Once verified as a suitable surrogate in this manner, the ersatz wastreated as an unknown mixture for modeling efforts. Waste shower and handwashwater is the most prevalent and most contaminated waste stream in the ISS, andcontains the component sodium-N-methyI-N-"coconut oil acid" taurate (SCMT) whichis "soap" used for hygiene purposes. Consequently, it was assumed that if theperformance of the ion exchange and adsorption processes could be predictedaccurately for this waste stream using the MFB model, then the model should be ableto predict the performance of the MFB in treating other waste water streams or theirmixtures. A full scale multifiltration bed experiment was performed using the ersatzshower and handwash waste stream. The combined ion exchange and adsorptionmodel was verified by comparing the model predictions to empirical data.
19

Influent
EBCT = 221 rain
Ion ExchangeEBCT = 132.62rain
EBCT = 5447 rain
EBCT = 58.67 rnin
EBCT = 16.62 rain
EBCT = 16.62 rain
Ion E_hangeEBCT = 2.21 rain
•41_----IRN-T7, EBCT =2.21 rainI _ Effluent
Figure 4.3-2 Multifiltration Bed Schematic
The ion exchange model development includes multicomponent equilibrium as wellas external and intraparticle mass transfer. Binary isotherms were conducted todetermine separation factors for the ions of interest on each resin. Multicomponentisotherms were conducted and used to validate the multicomponent equilibriumdescription. Kinetic studies were performed to determine external and intraparticlemass transfer parameters and/or validate the application of literature correlations andvalidate the multicomponent fixed bed model.
The adsorption model was developed to predict the removal of individual targetcompounds and TOC from mixtures of unknown composition. The Fictive ComponentAnalysis (FCA) was developed to describe the competitive interactions between
individual known target compounds and the unknown background matrix making upthe overall mixture TOC concentration. TOC and known individual target compoundisotherms were performed on all the adsorbents and used to determine the FictiveComponent (FC) concentrations. Column studies were performed on all theadsorbents and compared to model calculations to obtain intraparticle mass transfercorrelations for the wide range of adsorbing contaminants expected in the ISS wastestream and to verify the fixed bed model.
The multifiltration bed model was designed for the Microsoft Windows" environmentwith a Graphical User Interface (GUI) to maximize user-friendliness. The MicrosoftWindows interface was used because of its built-in file and hardware control featureswhich frees the analyst from concerns over printer drivers and other machine issuesand allows more attention to the computational algorithms. The GUI consists of a front-
end shell written in Visual Basic" (Trademark Microsoft Corporation 1981 - 1995, Allrights reserved) that calls Formula Translator (FORTRAN) computer program languagesubroutines in order to perform calculations.
20

4.3.1.1 Ion Exchange Modeling
Ion exchange resins are insoluble matrices containing fixed charged sites whichexchange ions for aqueous phase ions. The main types of ion exchange resins arenatural mineral ion exchangers, synthetic inorganic ion exchangers, and syntheticorganic ion exchangers. The resins investigated in this work are synthetic organic ionexchange resins which are comprised of polymer chains crosslinked withdivinylbenzene (DVB). Fixed functional groups contained within the matrix providecharged exchange sites as shown in Figure 4.3-3. Ion exchange resins have beencompared to a plate of spaghetti (polymer chain) cooled to the point of sticking(crosslinking) together.
The fixed exchange sites can be positively charged (anionic exchange resins),negatively charged (cation exchange resin), or amphoteric (capable of exchangingboth cations and anions depending on pH). Ion exchange resins are grouped by theirfunctional exchange site characteristics. Ion exchange resins can be strong or weak:strong acid cation (SAC); weak acid cation (WAC); strong base anion (SBA); or weakbase anion (WBA). This distinction is based on the functional pH ranges of the resins.
F_xcdn=_veiy ¢i=arb,ed exchangesite:.L=.. S03"• Mobile pos/_veiy _ cxci_mged=too-" i.¢, Na"
Pol_'t_'ene chain
Div/w/Ibemz_e cmsslh_k
;:._'_'.--;w==rof_,d_o.
Figure 4.3-3 Schematic of Hydrated Strong Acid Cation Resin
21

The total number of exchange sites per unit of resin is the total exchange capacity andis independent of the experimental conditions. The apparent capacity depends onexperimental conditions, such as pH and solution concentrations, and is usually lowerthan the total capacity. The capacity of a resin also depends on the presaturant ionsuch as hydrogen or sodium since the density is different for each form of resin.
Total resin capacities and physical properties for each of the resins wereexperimentally determined. Fitted apparent capacities were also determined using thebinary Langmuir equation. Both the total capacities and apparent capacities arecomparable to the reported manufacturer's capacities.
Binary isotherms were performed on SAC (IRN-77), SBA (IRN-78), WBA (IRA-68),mixed bed (IRN-150), and iodinated (MCV-RT)ion exchange resins. Separationfactors/equilibrium exchange constants for IRN-77, IRN-78, and IRA-68 resins weredetermined from the binary isotherms. The separation factors for the IRN-77 and IRN-78 resins were able to describe equilibrium for the IRN-150 resin by coupling the waterformation reaction with the binary Langmuir equilibrium expression for each ion.
When the separation factors determined from binary isotherms were used, themulticomponent Langmuir equilibrium expression predicted six-component isothermdata for the IRN-77 and IRN-78 resins. The multicomponent predictions were withinapproximately 10% error for liquid phase predictions and approximately 50% for solidphase predictions.
A multicomponent isotherm with the IRA-68 resin was conducted to validate theLangmuir multicomponent equilibrium description for WBA resins. The preliminarymodel calculations showed promising results. However, more multicomponentequilibrium experiments are needed to verify the multicomponent Langmuirequilibrium expression for WBA resins.
The Langmuir multicomponent equilibrium expression was able to predict the ionexchange in the ersatz water for IRN-77 resin, but overpredicted the amount of ionexchange for the IRN-78 resin. The separation factor determined for SCMT could beunderpredicted, or fouling of the anionic resin by the negatively charged SCMT andorganic contaminants may have caused the observed decrease in resin capacity.
The ersatz isotherms with IRN-77 did not indicate resin fouling. Fouling of SAC resinsby organics, especially by polar and anionic organics, is not usually a problembecause the functional groups of SAC resins are negatively charged. The ammoniumersatz isotherm data for IRN-77 resin showed an increased resin capacity forammonium. A decrease in competition or an increase in capacity could account forthis observation. It is possible that binding to soap (SCMT), present in the ersatzwater, could decrease the liquid phase concentration of ammonium causing anapparent increase in solid phase concentration.
22

4.3.1.2 Adsorption Modeling
The fixed bed adsorption model includes multicomponent equilibrium and bothexternal and intraparticle mass transfer resistances. Single solute isothermcorrelations were developed to predict single solute isotherm parameters for thecomponents of interest. The single solute isotherm parameters were used in themulticomponent equilibrium description to predict the competitive adsorptioninteractions occurring during the adsorption process. Multicomponent isotherms wereused to validate the multicomponent equilibrium description. Column studies wereused to develop and validate external and intraparticle mass transfer parametercorrelations for components of interest. The fixed bed model was verified using theshower/handwash ersatz water.
There were two overall objectives for the MFB adsorption model. The first objectivewas to predict the performance of the adsorption beds in series in the MFBs forremoving TOC from the shower and handwash waste water. The second objectivewas to predict the removal of target compounds in the MFB.
The fixed bed model used in this study assumed both pore and surface diffusion wereintraparticle transport mechanisms and plug flow was the axial transport mechanism.It is named the Pore and Surface Diffusion Model (PSDM). Figure 4.3-4 illustrates the
adsorption and diffusion mechanisms incorporated into the PSDM.
Local EquilibriumBetween Fluid Phase
and Adsorbent Phase
:c. L. --.
• ._ Pore'.. / _ Diffusion _1
/
• *. _,! • o ,_o_, o • Qo
J Force ". qr _r,,,: ._ .... ..-o *
L I ....._r I_;;:_5 J__",.'.,X Surface s_..... .'.._.::_..; ,:- ,, . /" I C ......". I_::_ Dlffusnon :
... , I p.t ......".",,, J__-hr"
r , _ / \ . -- IIII x_, --.-._,,.',Lr_.,,Z'_,_ _, _ "1
/ i_,.":,_..,_: _,i_r,:-_: /I_' _' _-" _''
Huid Phase Adsorbent Phase
Mass Mass = O _q D,¢._C_.__u_ .k:(c_-c,) _,,x "'_'_,-'-C, _,
Figure 4.3-4 PSDM Mechanisms
23
The assumptions and mechanisms that are built into the model are:
• Plug-flow conditions exist in the bed (axial and radial dispersion are neglected).
• The hydraulic loading is constant.
• Single solute adsorption equilibrium is represented by the Freundlich isothermequation.
• Ideal adsorbed solution theory incorporating the Freundlich isotherm equationdescribes the multicomponent adsorption equilibrium.
Local adsorption equilibrium exists between the solute adsorbed onto theadsorbent particle and the solute in the intraparticle stagnant fluid. (The rate ofsorption onto the adsorbent surface is much faster than the diffusion rate.)
• A linear driving force approximation describes the liquid-phase mass transfer fluxat the exterior of the adsorbent.
• Intraparticle mass flux is described by surface diffusion and/or pore diffusion.
• There are no solute-solute interactions during the diffusion and/or pore diffusion.
A fixed bed adsorption model employing the FCA was developed for use in modelingthe adsorption processes within the Space Station MFB. This modeling approach waschosen because it can predict the TOC breakthrough as well as target compoundbreakthrough from the MFB in an unknown mixture. The modeling approach wasverified using the shower/handwash ersatz water.
The three adsorbents currently included in the MFB design were evaluated in thisstudy. Those adsorbents were 580-26 GAC, APA GAC, and XAD-4 resin. The wasteshower and handwash ersatz water included SCMT, trichloroethylene (TCE), toluene,m-xylene, 1,2,4-trichlorobenzene (TCB), and naphthalene as its adsorbable
components. These components represent a distribution of weakly to stronglyadsorbing compounds. SCMT was included since it is reported to account for over60% of the TOC in the actual waste shower and handwash water. The ersatz wateralso contained ions representative of the actual waste shower and handwash water.
Single solute isotherm data was available for each of the adsorbates in the ersatzwater on each of the MFB adsorbents. The isotherm data was obtained over aconcentration range of approximately 10 micrograms per liter (pg/L) to 10 milligramsper liter (mg/L) and described using the Freundlich isotherm equation. The isothermson the 580-26 and APA activated carbons were all linear on a log-log plot and theFreundlich equation fit the data well. The single solute isotherm on the XAD-4 resinexhibited some curvature on a log-log plot. For this reason, the XAD-4 resinFreundlich parameters were dependent on the concentration range fit.
24

The single solute isotherm data for each adsorbent was correlated using the Polanyitheory. Polanyi correlations were developed for each adsorbent using the molarvolume of the compound as the correlating physical parameter, and the compound'saqueous solubility was used in determining the adsorption potential. The data wascorrelated so that Freundlich isotherm parameters for compounds other than TCE,toluene, m-xylene, 1,2,4-TCB, and naphthalene could be estimated. The error in thecorrelation could possibly be removed by refining the correlation for differentcompound classes. The use of different physical property correlating factors (otherthan molar volume) could also result in a better correlation.
A TOC isotherm was performed on the actual waste shower and handwash water todetermine its TOC adsorption capacity. The isotherm revealed, as expected, that thewaste shower and handwash water was a multicomponent mixture with anonadsorbing TOC fraction. Unfortunately, this was the only isotherm data obtainedfor the actual waste shower and handwash water.
Isotherms were performed on each of the adsorbents using the ersatz water. Theisotherms were analyzed for TOC and the individual constituents of the water. TheFCA was applied to this isotherm data to determine the TOC and tracer FC for eachadsorbent. The FCs were determined from fitting the isotherm data in a manner whichwould facilitate beds in series modeling of the different adsorbents. The FCA was ableto accurately fit the TOC isotherms for each of the adsorbents. This indicated that theTOC FC used in Ideal Adsorbed Solution Theory (lAST) calculations accuratelysimulated the TOC adsorption capacity of the ersatz water.
The FCA was also able to fit the tracer isotherms well for each of the adsorbents. Thetracer FCs were tested in lAST calculations to see if the equilibrium of the other ersatzwater constituents could be predicted based on the tracer fit. The results indicated thatas the adsorbability of the compound increased, the accuracy of the model predictionto the data decreased. The model generally did a good job of predicting theequilibrium for TCE, toluene, and m-xylene. The equilibrium description consistentlyover predicted the reduction in capacity for 1,2,4-TCB, naphthalene, and SCMT in thesystem. It was likely that the reduction in capacity was observed for naphthalene and1,2,4-TCB since the strongly adsorbing compounds were already accounted for in themixture by the FC because a weakly adsorbing compound was fit. The reduction incapacity for SCMT was overpredicted because SCMT made up such a largepercentage of the overall TOC of the mixture. A component must make up a smallamount of the TOC in the mixture because its adsorption potential is alreadyaccounted for by the FC. The fits and predictions were more accurate for the XAD-4resin than for either of the activated carbons.
Column experiments were performed on each of the adsorbents using the ersatzwater. The breakthrough curves for each of the known ersatz water constituents werefit on a single solute basis using the PSDM to determine the optimum fluid residencetime in the packed bed and the surface to pore diffusion flux ratio (SPDFR) for eachcompound. The fitting results were used to develop correlations for prediction of fluidresidence time in the packed bed and SPDFR for other target compounds on eachadsorbent. The results indicated that pore diffusion was the controlling mass transfermechanism for both 580-26 and APA GACs. Surface diffusion was approximately 5
25

times more important than pore diffusion in describing the mass transfer for the XAD-4resin. The mass transfer parameter correlations were used to predict the mass transferparameters for the FCA.
The TOC FCs were used in the PSDM to predict the TOC breakthrough from each ofthe adsorption columns. The results indicated that the model slightly overpredicted thecapacity of the columns for TOC adsorption. The model calculations involved usingthe 6 TOC FCs determined from fitting the TOC isotherms in fixed bed calculations.
The tracers FC were used in the PSDM with the known constituents of the ersatz water
to predict breakthrough of those compounds. The model calculations used the targetcompound and the 5 tracer FCs determined from fitting the tracer isotherms in fixedbed calculations. The results were then compared to the experimental data to test themodel. The model predictions were best for the weakly to moderately adsorbingcompounds. As the strength of the adsorbing compound increased, the accuracy ofthe PSDM prediction consistently decreased_ This is due to the mass transferparameters and tracer FC used in the system. The mass transfer parameters andtracer FC could be tuned to better predict the breakthrough of the stronger compounds.
One experiment was performed using a series of adsorbents and ion exchange resinsset up in the same configuration as the actual MFB design. This experiment was alsoperformed with the ersatz water. The breakthrough of TOC and target compoundsfrom the verification MFB was predicted with the fixed bed model and compared to thebreakthrough data. The model predicted the TOC breakthrough slightly before theexperimental data. The model did a good job of predicting the SCMT breakthrough.The breakthrough prediction began slightly after the data but was steeper than thedata indicating that the mass transfer parameters used for the SCMT could use somefine tuning to get a better prediction. The model predicted TCE breakthrough occurredabout 15% earlier than the data. The error appears to be due to the mass transferparameters. The predicted breakthrough of toluene is significantly later than theexperimental data. However, it is difficult to determine if the error is due to masstransfer parameters of capacity since only part of the breakthrough curve wasobserved during the experiment. The error in the MFB verification column predictionsmay have occurred since the SCMT was held up for some time period in the ionexchange resins but it was not held up in the experiments where the mass transfer
parameter correlations were determined. This error could be corrected by tuning themass transfer parameters for this situation. These results have shown that the FCAused in conjunction with the PSDM can predict breakthrough of both TOC and targetcompounds from the MFB. However, this verification was only on ersatz water.
4.3.2 Volatile Removal Assembly Reactor 7
Recovery of waste water streams for potable use onboard space-based installations,such as the ISS, is paramount for long term missions in space. Although carbonadsorption and ion exchange can remove a majority of the pollutants in such streams,weakly adsorbing organic compounds must still be removed to make the waterpotable. One method of removing these organic compounds is via catalytic oxidation.A catalytic reactor system known as the VRA was designed to perform such anoperation. The VRA is a co-current bubble column which uses gas-phase oxygen as
26

the oxidant over a catalyst consisting of a noble metal on an alumina substrate. InEarth-based testing, the VRA is run in an upflow mode. In zero gravity the gas phasewill be moved only under the influence of the water's drag forces. Therefore, theresidence time of the gas and liquid phases may be slightly altered. Before the designand operating conditions for the VRA are finalized, a numerical model incorporatingmass transfer, contacting patterns, and the multicomponent reaction kinetics should bedeveloped and tested to predict the reactor's performance.
Heterogeneous catalysts can be used effectively in oxygen purged packed bedreactors to remove aqueous organics at elevated temperatures. Conversions of formicacid are quite high in a trickle bed reactor and ethanol can be readily oxidized toacetic acid in either an upflow or downflow packed bed reactor. Numerous studieshave been reported for oxidation of single components through packed beds, mostly indownflow trickle bed reactors. A thorough review revealed no studies on themultiphase oxidation of multicomponent streams. A small number of studies werefound on the mass transfer characteristics of co-current upflow packed bubble columns(also known as flooded bed reactors). The extension of earlier models to amulticomponent mixture and the determination of the necessary parameters aredescribed in the following.
A flooded bed reactor is a reactor in which a continuous liquid phase and a dispersegas phase flow co-currently through a fixed bed of catalyst particles while the reactiontakes place. The rate at which this reaction occurs is a function of the mass transferrates for the reactants, internal (pore) mass transfer, and the actual surface reactionrate. Figure 4.3-5 represents the external mass transfer processes occurring for asingle catalyst particle within the reactor. Figure 4.3-6 shows a schematic diagram ofthe bench scale reactor system.
Liquid
Coc_
" iiiiiiiiiiiii:, fill
Figure 4.3-5 Mass Transfer Process for a Single Catalyst Particle
27

[
m
Pres3ure
7"runsduccr 13uck Pressure
[ _ Regulator
To Sampling
H_ _ LEGEND
Recycle to Feed Solutton Q t_ 77_ree Way Valve
_..._ f _ Two IVa?/ ValveI_ [ Platinum RTD Probe
Prtmary S),srem
Pump Pump
Figure 4.3-6 Schematic Diagram of Bench Scale Reactor System
As the continuous phase, the liquid generally covers the catalyst particle. The gasphase (in the form of bubbles) forces its way between the liquid covered particles. Thekey steps in the mass transfer process are the transfer of the reactant (oxygen) fromthe gas to the liquid and of all the reactants from the liquid to the catalyst particlesurface. The other reactants in the aqueous phase are the dilute aqueous organiccontaminants (OC). The basic transport and reaction steps in this three phase reactionare as follows: (1) transport of oxygen from the bulk gas phase to the gas-liquidinterface; (2) equilibrium partitioning of oxygen at the gas-liquid interface; (3) transportof oxygen from the interface to the bulk liquid; (4) transport of the OC and oxygen fromthe bulk liquid to the catalyst surface; and (5) diffusion and reaction of the reactantsinside the catalyst pellet.
By taking the 5 basic transport and reaction steps into account along with anappropriate reactor model, the behavior of a flooded bed reactor can be determined.To derive an appropriate model to describe the flooded bed reactor, primarysimplifying assumptions are made as:
Isothermal reactor operation - Since the concentration of the contaminants is verylow, the heat generated by the oxidation reactions has a negligible effect on thewater temperature.
28
• Axial dispersion in the gas phase is negligible - The bubbles would tend to moveforward as self-contained units. Little backmixing would be possible.
• Conditions are uniform in the radial direction - The liquid is evenly dispersed in theradial direction, and there is no "channeling".
• Gas and liquid flow rates are constant throughout the reactor - This is the standardsteady state assumption (no accumulation).
Mass transfer resistances in the gas phase are negligible so that equilibrium existsat the gas-liquid interface - The diffusion rate in the gas phase is several orders ofmagnitude higher than the liquid phase.
Axial dispersion models take into account the diffusion of the components in the axialdirection, whereas plug flow models typically assume axial dispersion is negligible.
A multiphase, multicomponent reactor model was developed for the oxidation of dilutecontaminants in water. Over the range of temperatures and flow rates examined, theexperimental data for the destruction of chlorobenzene, ethanol, dimethylsulfoxide(DMSO), formaldehyde, and urea were used to calculate the single component overallreaction rate constants. The resulting data for each compound was fit to the Arrheniusequation and the individual activation energies determined. The activation energiesobtained for the raw catalyst fell within the range which is generally ascribed to porediffusion limited for ethanol, external mass transfer limited for formaldehyde andchlorobenzene, and surface reaction limited for urea and DMSO. By running theexperiments at different particle sizes, it was possible to qualitatively identify that thebigger catalyst size is largely internal mass transfer limited, and this is directly lumpedinto the overall rate constant determined.
The multicomponent plug flow model developed was applied to a five componentmixture and gave predicted results close to actual experimental results for urea,chlorobenzene, and ethanol over the range of conditions. The deviations between themodel and experiments were well within the range of experimental error. The resultsfor formaldehyde showed the reaction rate to be determined totally by the rate of masstransfer. DMSO has been determined to be a weak catalyst poison, and as a result theconversions were always lower than predicted, which may affect the results for othercompounds. By incorporating the appropriate mass transfer correlations and scale upparameters, this model allowed the testing of other reactor configurations andcontaminant mixtures.
29
4.4 Life Testing
4.4.1 Subassembly Life Testing
4.4.1.1 Urine Processor Assembly 8
The purpose of the test is to provide for long duration operation of the VCD ECLSSsubsystem at normal operating conditions to determine the useful life of ECLSShardware. A complete VCD subsystem is being tested to determine life characteristicsof mechanical components under actual on-orbit conditions.
The VCD Urine Processor Assembly ¥'A, (VCD-VA.) is a phase-change water recoverysubsystem developed for space application to reclaim water from urine and otherSpace Station waste waters. The VCD process recovers the latent heat ofcondensation by compressing the water vapor to raise its saturation temperature andpressure, and then condenses it on a surface that is in thermal contact with the
evaporator. The resulting heat flux from the condenser to the evaporator, driven bythis saturation temperature difference, is enough to evaporate an equal mass of waterfrom waste water so that the only additional energy required is that necessary tocompress the water vapor and overcome any mechanical and thermal inefficiencies.
A simplified schematic of the VCD-VA. is shown in Figure 4.4-1. The waste water iscirculated through the distillation unit by a four section peristaltic fluids pump. Thefeed section of the pump discharges waste water to the inner surface of the evaporatordrum (still) at a higher rate than the distillation rate. The vapor is first compressed andthen condensed. The condensate is collected in the condenser, pumped out of thedistillation unit, and passed through a conductivity sensor. Unacceptable water, thatdoes not meet conductivity specifications, is routed back to the recycle loop forreprocessing. Good quality condensate is delivered as product water. Excess wastewater feed is returned through a recycle filter tank by the second and third sections ofthe fluids pump. Having two pump sections pumping water out assures the rate out isalways greater than the rate in, which avoids flooding the still.
The condenser/evaporator drum is rotated by a brushless direct current (DC) motor, byway of a magnetic coupling, to maintain the fluid evaporator liquid/vapor interface inmicrogravity. The entire evaporationlcompressionlcondensation process takes placeat a lower than normal temperature by operating the subsystem at near vacuum.Periodically, a purge valve is activated to remove noncondensables (gases) from thecondenser.
The VCD design has continued to evolve over 20 years. Since it was first introduced,changes and improvements have included changes in the peristaltic fluids pump,various improvements on sensor hardware, changes in the shape of the distillationunit to a tapered drum, and improvements to the compressor. The materials usedhave been upgraded to withstand the harsh environment in which the subsystem mustoperate.
30
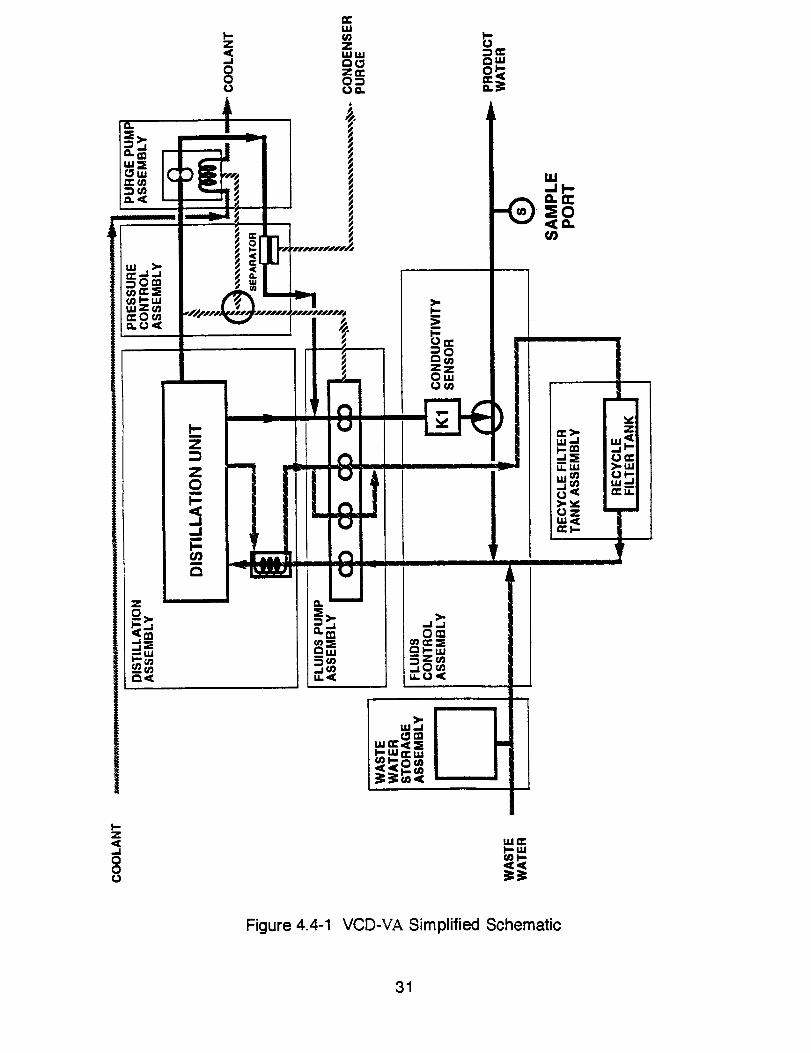
Figure 4.4-1 VCD-VA Simplified Schematic
31

According to the established procedure, the VCD-VA is run approximately 6 hours aday during scheduled workdays. The VCD-VA has continued to run well throughoutLife Testing and has provided useful data on the wear and tear of components. Asummary of VCD life test anomalies is provided in the following paragraphs.
The fluids pump failed after 51 days of testing. The failure was determined to besimilar to that which occurred during checkout at the hardware supplier. A flex splinein a gear reduction mechanism of the fluids pump drive shaft failed in both cases. Itwas determined that the failure may have resulted from a sliqht horizontalmisalignment introduced into the pump during retrofit at the hardware vendor. Thehardware supplier has implemented use of a new alignment jig during hardwareassembly to provide the proper alignment. This jig will be used for flight hardwareassembly.
A second pump problem was related to the tubing used in the peristaltic purge pump.This pump uses the same tubing as the fluids pump although it pumps a two-phasemixture which is mostly gas. This application was found to cause tube spalling whichresults in the air/water separator to become clogged with tube material flakes. Theinitial resolution suggested by the hardware supplier was to add a filter downstream ofthe pump to prevent air/water separator clogging; however, there are other designsolutions such as alternate tubing material. Eventually, modifications to the VCD willbe made which will include the appropriate design change. An inspection of theair/water separator is made every 30 days to avoid build up of materials.
During the last half of 1995, the VCD-VA experienced increasing problems such asexcessive noise, increasing temperature, and high current loads. Also, slippage of thedrum at startup was occurring more often. To correct the problems and to determine
which parts were wearing out, the VCD-VA was disassembled for repairs, which werecompleted during the week of January 15, 1996.
The following conditions were noted upon disassembly of the VCD-VA:
An o-ring seal was missing between the condenser end plate and the drum. Therewas no indication of liquid leakage, however, so the metal-to-metal contactapparently provided a good seal.
• Some slight corrosion was evident between the condenser end plate and the drumspokes.
The urine injection tube had a small "blob" of solids (1/8" to 1/4" thick) around theend of the tube. This material was hard and was removed as a "chunk". Theopening of the injection tube was not restricted.
The compressor gears showed some wear, with a gap of 0.013" to 0.0165" ratherthan the desired 0.006", but there were no chips or missing teeth. There was acoating of vespel lubricant dust on components of the pump. Examination under amicroscope also showed metallic particles on the vespel gear.
• The drive belt from the compressor to the drum was stretched about 14%.
32

The compressor gears had operated for an estimated 4831 hours, and the drive beltfor a similar length of time. The condition of the gears and drive belt indicates that theyhad reached the end of their useful life and they were replaced. Upon reassembly andstartup the VCD-VA showed unusual behavior and shut down after about one hour.The unit was restarted and operated as expected. The problem reappears after aperiod of no operation (such as over a weekend). Investigations are continuing todetermine the cause of the problem and the best solution.
4.4.2 Microbial Check Valve 9
The Microbial Check Valve (MCV) is intended for use on the ISS in the waterprocessor recycle loop, and will provide a microbial barrier to that portion of the waterrecovery system. A life test will provide information which will help lead to the mosteconomical MCV replacement scenario on the ISS.
Four MCVs will be used in the test. The first three will be used in the water circulationportion of the test, and a fourth will be placed on the shelf, in the vicinity of the watercirculation test, for shelf life testing. Water will be circulated through each of the first 3MCVs daily (five days per week), for three years, or until all three of the MCVs fail.
Due to unexpected regulatory concerns from the Environmental Protection Agency(EPA), the project was suspended pending EPA approval.
4.4.3 Water Distribution Plumbing 10
The need for the Water Degradation Study (WDS) originally stemmed from the 1991Space Station restructure baseline design which called for the water lines to belaunched wet and to be undisturbed until the activation of the water recovery andmanagement system for an extended period of time. This "launch-wet-and-wait"scenario fueled concern over whether the biocidal iodine would break down duringextended storage, leaving the distribution lines vulnerable to microbial growth,biofouling, and microbial-induced corrosion. These concerns prompted engineersand scientists to investigate the change in water quality under long-term storageconditions.
The WDS is being conducted as an engineering demonstration activity. As ademonstration, the study emphasizes geometric and material similarity with spacestation water distribution lines. Because the test fixtures are relatively expensive, thebudget for this activity has precluded the use of replication. The WDS lends credibilityto its results by allowing comparisons among tubes of similar material, initial waterquality, or exposure time.
The WDS consists of a total of 34 tubes that are configured as straight sections, 10 feetlong, with valves at each end as illustrated in Figure 4.4-2. These tubes are groupedinto two batches, designated Batch 1 and Batch 2. Within each batch, the tubes aregrouped into sets according to exposure time. All tubes are stored vertically in a rackuntil their exposure time is completed.
33

Thus far, the WDS has clearly demonstrated that it is possible to store water in astainless steel or titanium distribution system for up to 3 years without significant levelsof microbial growth. The WDS has shown that the microbial integrity of the water canbe maintained even after iodine depletion, if the quality of the water and tubes arecarefully controlled during the filling. Although some parameters, such as pH,conductivity, iodine, iron, nickel, and TOC have been shown to violate their specifiedlimits during extended storage, the absence of biofilm growth would enable the lines tobe ready for use following a simple flushing operation. Furthermore, the WDSsuggests that the water flushed from the system would be easily reconditioned by thespace station's water processor for use as potable water.
Data from the WDS suggests that there is an interaction between iodine and nickelthat results in depletion of up to 10 parts per million (ppm) iodine within 3 to 6 months.Viewed another way, the WDS suggests that an initial iodine concentration of 10 ppmmay be insufficient to maintain iodine levels above the specified 2 ppm minimum forany extended period of time. Of course, if iodine is indeed being consumed throughsome interaction with stainless steel or with a nickel-rich lubricant, avoiding thesematerials could increase the longevity of biocidal iodine in the distribution lines.
Results from batch 2, expected in early 1996 and 1998, should provide insight intoiodine longevity in an all-titanium system without the nickel-rich valve lubricant.
Despite the rapid decrease in iodine concentrations, no bacterial growth has beendetected in the water stored in the tubes. Extremely low levels of bacteria wereisolated on only four samples with no correlation between the occurrences. These
events could possibly be attributed to contamination during sampling or samplehandling due to the nature of the bacteria that were isolated, common organismsfound in the environment. The early depletion of iodine suggests that optimization ofthe initial iodine levels may be needed to maintain an active biocide concentration in a"launch-wet-and-wait" scenario.
1" TuOing0.035" Wall Thic_mess
Figure 4.4-2 Tube Configuration
34

4.5 ECLSS Flight Experiments
4.5.1 Vapor Compression Distillation Preliminary Design 11
The VCD Waste Water Processor (WWP) technology was selected for use as the UrineProcessor Assembly (UPA) for the SSF as a result of performance demonstratedduring the Comparative Test conducted at the MSFC in 1989 and 1990. Followingselection, the design process continued through a Space Station Critical DesignReview (CDR) which was held in August 1994.
Following completion of the Space Station CDR, the UPA was placed on hold as aresult of the restructure of the Space Station program from SSF to ISS. The newschedule for the restructured program called for a delay in the completion of the UPAwith work not restarting until October 1997. As a result of this delay an opportunity wascreated to conduct a flight experiment that would provide a means by which operationof the technology in zero gravity could be demonstrated and the risks of its ISS futureuse greatly reduced.
The VCD Flight Experiment was developed in a two step process. The first step(funded by the Space Station Program Office under TTA's), the Preliminary DesignStudy, was to produce a design that could be implemented in either the SPACEHAB,Spacelab, or Russian MIR flight vehicles. As work progressed the flight vehicle wasidentified to be the SPACEHAB. Therefore, the design documentation focused on theexperiment being performed on the SPACEHAB flight vehicle. The second step(funded by NASA Headquarters Code U) will be the completion of the final designthrough the flight and flight data interpretation.
The VCD WWP concept is illustrated in Figure 4.5-1. The concept uses a phasechange process to efficiently recover product water from waste water feed. A keycharacteristic of the process is the recovery of the latent heat of condensation from theproduct water. This recovery is accomplished by compressing water vapor to raise itssaturation temperature and then condensing it on a surface which is in thermal contactwith the evaporator. This results in heat transfer from the condenser to the evaporator.To achieve phase separation in microgravity, the evaporator/condenser and productwater collector are rotated. This imparts sufficient centrifugal force on the fluids toachieve phase separation.
The primary focus of the VCD Flight Experiment is subsystem performance. NASA hasrecognized the need for water recovery from waste water and has been developingVCD WWP technology for space applications since the early 1960s. Key aspects ofVCD WWP technology have been verified with over tens of thousands of hours oftesting. Significant improvements have been made in water production rates, waterquality, specific energy, pump designs, packaging, maintainability, andControl/Monitor Instrumentation (C/M I)throughout the development history. However,an important element lacking from previous subsystem development efforts is actualflight testing. Consequently, important goals of the VCD Flight Experiment are thedemonstration and validation of the VCD WWP technology, as well as the investigationof system performance, in microgravity.
35

WasteWater In _
ProductWater
Evaporator
I"'P I"'P I"'Pt I 0 iii == ==
II !! i!I I I_ IB
LalentHeat
Condenser
Water Vapor
WasteWater Out
Compressor
Figure 4.5-1. VCD Concept
To achieve the goal of abating or avoiding problems associated with integrating VCDWWP hardware onboard ISS, a flight experiment utilizing a full-sized VCD Wastewater Recovery System must be conducted. The VCD WWP and associatedexperiment support equipment should reflect, to the maximum extent possible, thedesign of VCD WWP hardware currently developed and intended for use aboard theSpace Station.
The following are the general objectives of the VCD Flight Experiment:
Verify the readiness of VCD WWP technology for utilization in space, including thevalidation of; VCD waste water processing concept, interaction of components andparts, quality and quantity of product water, and efficiency of the VCD WWPprocess.
Verify ground-based analyses of the VCD WWP components and processes.Include the validation of; VCD WWP components sensitivity to the launchenvironment, and VCD WWP components and processes sensitivity to themicrogravity environment on an integrated basis.
Specific flight experiment objectives which support these general objectives are:
Verify integrated hardware operations. This includes evaluating the waterproduction rate, water quality, power consumption, dynamic loads, all possiblemode changes, free/entrained gas addition at various rates, and dry system start-up with evacuated recycle filter tank.
Characterize waste water droplet/film behavior during normal start-up andshutdown, during normal operation, during emergency (e.g., power loss) shutdownand restart, and during shutdown following emergency shutdown.
• Examine the effects of precipitates in recycle filter tank.
• Confirm gas/liquid separator performance.
36

Concentration on these specific objectives will identify operational risks, problems, oranomalies which may impact actual implementation of the VCD WWP in spaceoperations.
The objectives of the Preliminary Design Program were to define the experiment testplan that, if successfully performed, accomplishes the program objectives statedabove; and to develop and document a design through a Preliminary Design Review(PDR) that can be efficiently implemented into hardware and qualified for flight that canimplement the specified experiment test plan.
The VCD Flight Experiment will provide extensive data, that when compared to Earth-based test data, will verify the readiness of VCD WWP technology for application toISS or other long-duration missions. The successful implementation of the PDRshows that a VCD Flight Experiment can be implemented within the resourceconstraints of the available flight vehicles that will accomplish the program goals.Figure 4.5-2 presents a photograph of the VCD Flight Experiment Mockup.
Figure 4.5-2 VCD Flight Experiment Mockup
37

4.5.1.1 Enhanced Urine Ersatz Development 12
The VCD Flight Experiment was designed to investigate critical issues associated withoperating a VCD-based waste water processor under microgravity conditions. Thegoal of the VCD Flight Experiment was to minimize future development andimplementation risks by evaluating the microgravity sensitivity of the VCD waste waterprocessor components on an integrated basis. The experiment will verify thereadiness of this technology for use in space and substantiate planned closed-loopwater recovery for ISS.
Two approaches were used in deriving the chemical formulation of the process fluid:(1) development of a synthetic urine ersatz based upon the composition of raw humanurine; and (2) use of reconstituted (diluted) concentrated pretreated human male urineas the process fluid. The concept of using a synthetic urine ersatz was aborted due topotential biological degradation and the absence of precipitated solids in concentrated
solutions. Preliminary results (i.e., surface tension, density, conductivity, andprecipitation characteristics) of the reconstituted concentrated pretreated urine justifiedits selection as the process fluid for the VCD Flight Experiment. Hence, concentratedpretreated urine at 0.15 grams solute/gram solution (solute weight fraction) wasrecommended as the process fluid stock solution.
Standard laboratory benchtop tests demonstrated that the physical characteristics andphysical properties of the approved fluid conform with the NASA specifications.Specifically, it was capable of providing waste water carryover via conductivitymeasurements. The vapor pressure, surface tension, and viscosity of the fluid were22.0 millimeters of Mercury (mm Hg), 46.7 dynes per centimeters (dynes/cm) and0.924 Centistokes, respectively, at 25 degrees Centigrade (°C). The quantity ofprecipitates in the urine ersatz brine increased with increased solute weight fraction(i.e., solids concentration).
The favorable results of the benchtop tests raised expectations for a successful
performance test in Life System Incorporated's (LSI) VCD-VI test unit. However, thisdid not occur due to the absence of visible precipitated solids in the concentratedbrine. It was postulated that storage of the urine at relatively high temperatures (i.e.,78 ° to 82 ° F) for an extended period of time prior to the performance test led to itschemical degradation as evidence by the formation of mold on its surface. Tests areplanned to validate the use of the concentrated urine as the process fluid.
38

5.0 AIR REVITALIZATION SYSTEMS
5.1 Component Design and Development
5.1.1 Trace Contaminant Control Subsystem Catalyst PoisoningInvestigation 13
The Trace Contaminant Control Subsystem (TCCS) developed for the Space Stationutilizes palladium (Pd) on alumina (AI203) catalyst for oxidizing organic contaminantsin Space Station cabin air. A series of tests were designed and conducted to study thepoisoning effects of miscellaneous chemical compounds on the catalyst. A detailedschematic of the catalyst testing apparatus is shown in Figure 5.1-1.
Gas Metering Reactor Gas AnalysisPenstaJtic PumD Boiler
Water Suogty ,
,__J\
Heated Line
^_-_.-__ ! i _ i _ I _ ReactorTuDe
I I I-_ _-_'-_ I ,_-r--Three-ZoneTuoeFurnace
,:,i ._ l Methane i
c_" 1 tChr°ma_gr'_h!
Vent
Figure 5.1-1 Schematic of the Catalyst Testing Apparatus
This investigation determined the following:
• The effects of halocarbon (dichloromethane, Freon 113, and Halon 1301) andinorganic (ammonia and hydrogen sufide) catalyst poisons on methane oxidationactivity.
• The regenerability of the catalyst used in the TCCS.
39

Experimentation to achieve these objectives included the following:
• The catalyst efficiency for methane oxidation (the most difficult organic molecule tooxidize), both in pure air and air containing poisons.
• The by-products of halocarbon, inorganic sulfide, and ammonia oxidation.
• The products of pure air oxidation (baseline).
Ten ppm dichloromethane in air was injected into the catalyst bed at 400°C at a gashourly space velocity of 8000 per hour and 40% relative humidity (based on ambient).The catalyst rapidly poisoned dropping to 15% methane conversion after 20 hours.
No additional degradation was observed after 20 hours (this is still a high enoughconversion rate to meet Space Station specifications). Upon exposure to "clean" air,the catalyst slowly recovered. After 100 hours with "clean" air, the catalyst conversionof methane was approximately 90% that of the fresh catalyst. Additionalpoisoning/recovery cycles (8 total) showed similar degradation and recovery profiles(no significant additional degradation). Figure 5.1-2 summarizes the three monthcyclic poisoning test with CH2CI2, showing all eight poisoning regeneration cycles.
These experiments were performed to show catalyst recovery from a poisoned state.Tests were performed at various temperatures and stages in the cyclic poisoning (150to 400 °C, 95 hours into the poisoning cycle, and 102.5 hours into the regenerationcycle). There was little difference in the catalyst activity at 400 °C. Following the rampexperiment, the catalyst was exposed to "clean" air at 400 °C and recovered to 90%methane oxidation.
One ppm hydrogen sulfide in air was injected into the catalyst bed at 400 °C (Figure5.1-3), a gas hourly space velocity of 8000 per hour, and 40% relative humidity (basedon ambient). The catalyst rapidly poisoned dropping to 60% methane conversion after23 hours. The catalyst did not regenerate significantly when exposed to "clean" air at400 °C. In initial tests, the hydrogen sulfide was adsorbed by the hot stainless steelreactor wall used in the test rig. A quartz sleeve was installed to overcome thisphenomenon. The adsorption of hydrogen sulfide by stainless steel may ensure thatthe Space Station catalyst is not poisoned by the compound, but further work isrequired to be certain. Additionally no significant generation sources of sulfides, otherthan minimal human metabolic products, exist on the station.
The by-products of chemical oxidation in the TCCS catalyst were investigated. Theby-products produced through the oxidation of dichloromethane were formaldehyde(0.45 ppm at operating temperature) and hydrogen chloride (16 ppm at operatingtemperature). No detectable phosgene or chlorine gas was produced as a by-productof dichloromethane oxidation. The by-products produced through the oxidation ofhydrogen sulfide were sulfur dioxide (0.6 ppm at operating temperature) and hydrogensulfate (0.3 ppm at operating temperature). No detectable carbon monoxide orformaldehyde was observed.
40

100 _pm CH 4, 7000 ppm CO 2, RH=40%, SV=8000 h-I
....100 x. , :_C, I t2_'' , i , z , I , T , l , l , ; , I ,
e.-
_ 2o
0 " ' "
0 200 400 500 800 1000 1200 1400 1600 1800 2000 2200
Time (h)
Figure 5.1-2 Cyclic Poisoning Test using Dichloromethane
1 O0
A
o_ so
-,r60
0t-oca 40
t-O0 2o
0_II m I I l
_ O_ _:',_
_.._o_ h_ 0
C1-14C_¢...q oo i_n 1 ppm H,_ N° ICz'SL
I
co_co_..,.7,oooI_m
Blllmce t Idr
0
0 150 300 450 600 750 900
Time (h)
Figure 5.1-3 Baseline Performance Test using Hydrogen Sulfide
41

A study of the poisoning effects of Halon 1301 was also performed. At 10 ppm Halonin air, catalyst efficiency dropped to 65% in 100 hours (an initial rapid decrease to 70%followed by slow stabilization). The reaction rate was 16 times lower than with fresh
catalyst. The catalyst regenerated to an acceptable level, but still had an activity fourtimes lower than fresh catalyst.
A fresh load of catalyst was exposed to 1 ppm Freon 113 (R-113) in air. At that level,catalyst activity dropped by a factor of 5 in 17 hours with little additional depletion after17 hours. At 10 ppm Freon, the catalyst activity dropped by a factor of 10 in 68 hours.The steady state was reached after 100 hours. Regeneration increased the catalyticactivity by a factor of 4 showing that the Freon has less poisoning potential thandichloromethane.
A study of the reaction by-products of ammonia was performed to determine ifundesirable nitrogen oxides will be produced should ammonia break through theTCCS carbon bed. In this study, the catalyst was exposed to 10 ppm ammonia in air.The ammonia did not affect the catalyst's ability to oxidize methane, and only nitrogenand nitrogen oxide were observed as reaction products of ammonia oxidation (i.e. nonitrogen dioxide was observed).
5.2 Oxygen Generation Systems
5.2.1 Static Feed Electrolyzer 14
The Static Feed Electrolyzer (SFE) Oxygen Generator uses electrolysis to generateoxygen from water (Figure 5.2-1). The process incorporated by the SFE involves thevaporization of water through a membrane into an aqueous potassium hydroxide(KOH) electrolyte. Oxygen (02) is generated at the anode and hydrogen (Hs) isgenerated at the cathode. Both outlet gases are saturated with water vapor. Becausethe electrolysis process is not 100% efficient, some heat is generated and must becontrolled by the feed liquid flow. For each kilogram of water processed 0.89kilograms (kg) of 02 and 0.11 kg of H2 are produced.
Because the ISS 02 generator was changed from continuous to cyclic operations, theSFE-IVA required modifications. The SFE-IVA had been provided by LSI for use inthe POST. The contract issued for this conversion included hardware and softwaremodifications to incorporate cyclic operation and to implement performanceapproaches identified as necessary by the comparative test.
A refurbishment program has been established to upgrade the SFE for independentsubsystem testing and for use in the Integrated Air Revitalization Test (IART).Refurbishments addressed design problems identified in previous testing. Problemsidentified were cell flooding, aerosol buildup, excessive thermal swings, and theThermal Control Assembly (TCA) pump.
42

Figure 5.2-1 SFE Oxygen Generator
Cell flooding was alleviated by improving the humidity control in the ElectrochemicalModule Assembly (EMA) and by circulating an electrolyte feed instead of a water feed.By adding filter cells to the EMA, aerosol residue was eliminated from the 02 andnitrogen (N2) streams and will not build up on the regulator poppets. Excessivethermal swings were fixed by improving the TCA and modifying the control software.
Additional problems were discovered and addressed in the refurbishment program.The Pressure Control Assembly (PCA) was redesigned to fix the tendency of the SFEto pressurize improperly during start-up. PCA improvements prevented movement ofthe electrolyte caused by pressure variations in the 02 and H2 streams. By using N2for the initial pressurization, the long start-up time was reduced. An ion exchanger anda deiodinator were added to the design to prevent contamination of the electrolyte bythe intake water.
After refurbishment was completed, the SFE-IVA' was tested extensively at the LSI
facility. Checkout, shakedown, break-in, design verification, cyclic endurance, andparametric testing were conducted with the goal of verifying that the subsystem couldoperate in the cyclic mode. This testing began February 21, 1995 and was concludedon April 28, 1995. Total test time was 48 days with 14 days of continuous operation.
Subsystem performance during this testing was nominal with no significant anomalies.
43

The SFE-IVA' was shipped to MSFC on May 2, 1995 and installed in the CMS inBuilding 4755. Initial subsystem startup occurred on June 22, 1995 with independentsubsystem testing continuing until November 29, 1995. Total test time during thisperiod was 26 days total with 15.6 days of continuous operation. Subsystemperformance during this testing was nominal except when anomalies occurred.
During the testing at MSFC, four anomalies occurred as shown in Table 5.2-1. Each of
these anomalies resulted in the subsystem being shipped back to LSI for repair. Thefirst two anomalies were caused by operator error and quality control problems. Thethird anomaly was a software problem and was resolved by raising the filter cell setpoint temperature. The fourth anomaly was a hardware problem associated with loosefastener inserts (keenserts) at the module-to-interface plate location. Repeatedassembly/disassembly to resolve the last anomaly resulted in LSI informing MSFC thatthey could not deliver an operable subsystem for subsequent Integrated AirRevitalization testing at MSFC.
Table 5.2-1 Anomaly* Summary
DateNo. Observed How Manifested Immediate Cause
1 7/7/95 Low P2 Alarm Liquid blocked H 2
filterfoarrier cells
2 8/19/95 P1 failed to reach Uquid on H2 regulatoroperating pressure seatduring Standby toNormal transition
3 10/20/95 High P2 Alarm Liquidin 02 filterfoardercells
4 11/29/95 Low P2 Alarm Sudden loss of 02pressure
Root Cause SummaryFeed core leak caused by hot spot incell resulting from multiple out-of-tolerance operations and conditions• Nondetected feedcore leak from
Anomaly No. 1• Insufficient compression in
replacement fluids insulationplate
• Insufficient epoxy in passage ofreplacement fluids insulationplate
Condensation of water vapor in 02filter/barrier cells due to overcapacityoperation, followed by inadvertentapplication of high N2 pressure duringdry-out attemptSmall amount of residual liquid (fromprior disassembly) in 02 regulatorand/or loss of seal at module-to-interface plate location due to loosefastener inserts (keenserts)
* Event that caused automatic shutdown with its root cause not fully explainable at time ofoccurrence and prevented restart and/or continued operation without returning unit to LSI foranalysis and repair.
Conclusions based on testing of the SFE-IVA' include:
All test requirements and goals were met except for the goal of 30 days of total runtime at MSFC (26 days achieved). Cyclic operation was successfully demonstratedwith an accumulated run time of 1189 orbital cycles.
44

Considering the extent of modifications made to the hardware, the budgetconstraints, and the fact that MSFC was checking out a new facility, the anomaliesencountered should not have been unexpected.
• Lessons learned from these anomalies will be applied to the SFE flight experimentprogram.
• None of the anomalies experienced indicate problems with the SFE technology'sability to meet ISS requirements.
• Test data shows that the hardware performed well for extended periods betweenanomalies.
5.2.2 Solid Polymer Electrolyzer 15
The Solid Polymer Electrolyzer-Oxygen Generation Assembly (SPE-OGA, originallydesignated the Liquid Feed Solid Polymer Electrolyzer (LFSPE) Oxygen GenerationSubsystem), was designed and built by HS in the late 1980s, and was designed tosafely and efficiently generate oxygen and hydrogen, under pressure, using a 12-cellliquid feed Solid Polymer Electrolyzer (SPE) water electrolyzer. The systemparticipated in the SSF ECLSS Technology Demonstration Program, and a follow-onprogram in November 1990.
The HS SPE (Figure 5.2-2) safely generates 02 and H2 gas through the electrolysis ofwater. The oxygen gas is generated and delivered at ambient pressure directly to theenvironment, while the hydrogen is generated at slightly elevated pressure forpossible delivery to a carbon dioxide (CO2) reduction system. The SPE includes allvalves, regulators, sensors, and other controls for safe operation of the system.
The cell stack is a liquid anode feed water electrolyzer consisting of 18 SPE waterelectrolysis cells assembled in a bipolar arrangement between two compression endplates. In the electrolysis process, liquid water is fed to the anode, or oxygencompartment, where it is electrolyzed to produce gaseous oxygen, hydrogen ions (H+),and electrons. The H + ions, or protons, are transported across the ion exchangemembrane and the electrons travel through the external electrical circuit to thecathode. These protons are fully hydrated and deliver water to the cathode side of themembrane. The electrons combine with the protons to form gaseous hydrogen at thecathode. Excess water is pumped through the anode compartment to remove heatgenerated by the electrolysis process.
The oxygen/water stream exiting the electrolysis cell stack enters a shell and tubeliquid-to-liquid heat exchanger to reject waste heat from the electrolysis reaction andto reduce the dew point of the oxygen gas. The two-phase stream then enters theoxygen/water phase separator to deliver water free oxygen to the oxygen deliverysystem while oxygen free water is returned to the water recirculation loop. The phaseseparator assembly consists of two stages. In the first stage six hydrophilicmembranes allow water to wick through but, because of their high bubble point, themembranes will not allow gas to flow through. The fluid exiting the two-phase cavity ismostly gas with a small amount of water carry-over. The fluid is directed to the second
45

stage, or "polishing" section of the separator. The polishing section contains ahydrophilic and hydrophobic membrane, where the remaining water is returned to thewater recirculation loop. The oxygen gas is delivered to the oxygen delivery systemthrough the hydrophobic membrane. Because the hydrophobic membrane has a highwater intrusion pressure (an attribute similar to the bubble point of a hydrophilicmembrane), the oxygen gas is delivered free of any liquid water. The operatingpressure of the water recirculation loop is lower than the water intrusion pressure ofthe hydrophobic membrane under all operating conditions.
Water exiting the oxygen/water phase separator is delivered to a metal bellowsaccumulator which serves as a feed tank for the electrolysis cell stack and anexpansion volume for the water recirculation loop during the system start-up transient.Water is returned to the electrolysis cell stack by a gear pump driven by a brushlessDC motor. The water is polished with a deionizer bed to ensure the water is free ofany ionic contamination (cation and anion) that would be detrimental to cell life. Aconductivity sensor located immediately downstream of the deionizer bed monitorswater quality and performance of the deionizer bed. Water flow to the module ismonitored by a flow switch located immediately upstream of the cell stack.
The oxygen gas produced in the SPE electrolyzer is free of hydrogen, with purity of99.5% or greater typically measured. Since the SPE has been designed to operatewith hydrogen pressure always greater than oxygen pressure, redundant combustiblegas sensors located at the oxygen outlet interface constantly monitor the oxygen forhydrogen. A pressure sensor initiates a shutdown should an obstruction occur in thedelivery line, and a relief valve provides redundancy in the event of a failed pressuresensor.
The hydrogen/water exiting the cell stack is mostly hydrogen gas by volume with asmall amount of liquid water present from protonic pumping in the ion exchangemembrane. The hydrogen/water phase separator employs two cavities, eachcontaining a hydrophilic and hydrophobic membrane, and is similar in design andoperation to the polishing section of the oxygen/water phase separator. The hydrogengas passes through the hydrophobic membranes to the hydrogen valve manifoldcontaining the pressure control system, and the water is delivered to the "stripper"section of the phase separator. The stripper section contains four electrochemicalhydrogen pumps that remove dissolved hydrogen from the water before it is returnedto the water recirculation loop. The electrochemical hydrogen pump uses an SPEmembrane and electrode assembly similar to the electrolysis membrane and electrodeassembly. The degassed water is subsequently delivered to one of two metal bellowsaccumulators after dropping in pressure through a negative bias back pressureregulator referenced to hydrogen.
46

N
.: £
Ii _ ': i _ _
mnlmB,,,®®
Figure 5.2-2 SPE Schematic
47

Several problems were noted with the SPE during the Technology DemonstrationProgram tests. These problems were:
• Water carry-over from the hydrogen phase separator during start-up transientconditions
• Rising cell potentials while operating the system with water from the reverseosmosis (RO) water processor
• Inadequate priming of the recirculation water loop pump
• Inaccurate flow sensor readings for the recirculating water loop
• Inadequate heat rejection from the recirculating water loop heat exchanger due tohigher than expected cell potentials
• Failure of the three-way solenoid valves which divert the flow of generated gas toeither a delivery or vent interface
• Blistering of hydrophobic membrane material in the oxygen phase separator,inhibiting gas transport
• Frequent alarm conditions triggered by the hydrogen sense cell of the hydrogenphase separator assembly
• Failed electrical contactor for the 4-way ball valve, resulting in incomplete valvetravel
• Failed current control isolation board, resulting in reduced current to theelectrolysis module and, hence reduced gas output
HS addressed and corrected the above deficiencies, and incorporated additionalhardware and software changes. These additional changes were made to meet theISS requirements. These changes included:
• Generation of oxygen while on the light side of the space station orbit (set at 53minutes)
• Variable oxygen generation rates (7.4 pounds per day (Ib/day) ±10 Ib/dayadjustable)
• Space Station nitrogen interface reduced to 100 pounds per square inch absolute(psia) maximum
The contract requirements instructed HS to:
• Conduct a baseline test of the as-received system to determine the status of keysystem components
48

Refurbish the system to incorporate design changes as necessary to correct systemdeficiencies, and provide variable oxygen generation rates and cyclic systemoperation
• Test the effectiveness of the design changes
• Provide field support of the unit once returned to NASA/MSFC
Refurbishment of the Oxygen Generation Assembly (OGA) began in September 1994.The entire system was disassembled to the component level, with each itemseparately bagged to preserve cleanliness. Modifications performed duringrefurbishment included:
The hydrogen phase separator assembly was modified tohydrophilic-hydrophobic cavities. Proper fluid separationconditions was observed thus eliminating water carry-over.
incorporate dualat all operating
• The 12-cell electrolysis cell stack was refurbished to an 18-cell configuration toaccomodate thermal efficiency at ambient temperature.
The recirculating water loop was modified to correct inadequate pump priming atsystem startup, and to correct for loss of pump prime during system shutdown. Inaddition, a thermal flow switch was installed to monitor the water flow rate to thestack. A liquid-to-liquid heat exchanger was added to reject waste heat from thewater electrolysis process.
• The failed 3-way solenoid valve was refurbished to ensure proper operation in anenclosed environment without over heating.
The oxygen phase separator was refurbished providing a blister free membranecapable of transporting gas with little condensation (utilizing "X" membranematerial versus the "S" material of the first design). The unit was installed separatefrom the stack-manifold assembly.
• Since a Failure Mode and Effects Analysis showed sufficient fault detection, aproblematic Hydrogen Sense Cell was removed from the subsystem.
• A mechanical contactor on the 4-way Ball Valve was replaced with a 6 ampreplacement.
• A failed current control isolation board for the electrolysis power supply wasreplaced.
The subsystem was reconfigured to operate in a cyclic mode with a variableoxygen generation rate. The software was set-up to allow for a 6.66 to 8.14 Ib/hroxygen production rate with variable light side operation from 50-60 minutes, andvariable dark side operation from 40-30 minutes.
49

• Since the space station nitrogen pressure was reduced to 100 psia maximum, thesubassembly was reconfigured to meet this specification.
The refurbished SPE was subjected to an acceptance test program at HS. Thepurpose of the acceptance test was to verify the effectiveness of the refurbishment bydemonstrating elimination of operational deficiencies present in the original system,and operation of the system at various oxygen generation rates and in a cyclicalmanner. After successfully completing a thorough check-out test, including proofpressure and leakage testing, anomaly verification testing, and mode/state transitiontesting, the unit operated for 743 hours, including 693 hours in the cyclic mode ofoperation. With a simulated orbit of 90 minutes, the system completed approximately460 cycles of light side/dark side operation.
The NASA Liquid Feed Solid Polymer Electrolyzer Test Plan required the unit tooperate in cyclic mode for 30 test days total. Included in the 30 day requirement was14 consecutive days of testing at a nominal production rate (7.4 pounds of oxygen perday (Ibs oxygen/day)). Also required were two sets of two consecutive test days eachat a 6.66 Ib oxygen/day production rate, and an 8.14 Ib oxygen/day production rate.
The test ran for the prescribed 30 test days though not continuously (approximately664 hours total). The 14 consecutive day requirement was achieved between thedates of August 23 and September 6, 1995. The two day requirement at a 6.66 Iboxygen/day production rate was met between September 11 and September 13,1995. The two day requirement at 8.14 Ib oxygen/day production rate was metbetween September 13, 1995 and September 15, 1995.
Overall the test went well. Anomalies were minor and the flight-like components, thecell stack, and phase separators, performed their function throughout the test. Severalshutdowns occurred due to differential pressure transients at the hydrogen separator,but these were resolved by raising shutdown setpoints after evaluation of the effect onthe separator.
The hydrogen phase separator transients were attributed to pressure regulators whichdo not track well at the low flow conditions observed during "night" cycle processing.As a result, when the system cycled from day to night or night to day, differentialpressure spikes or troughs were observed. The retention of these regulators in therefurbishment was a design decision for economy, and the transients occurring as aresult are less than two thirds of the recommended tolerance of the hydrogen phaseseparators according to HS.
Differential pressure transients also occurred in the oxygen separators but did notresult in shutdowns during the test. One of the oxygen phase separator differentialpressure shutdown setpoints was, however, adjusted prior to the start of the test.
Several other shutdowns were the result of a gradual failure of a volume sensor on abellows accumulator tank. The sensor was part of the original SPE, and was firstinstalled in 1989. The sensor was not replaced during refurbishment because noproblems were linked to the sensor during the refurbishment process. High watershutdowns were not observed following sensor repair. A normally energized solenoid
50

nitrogen isolation valve, which was rebuilt during the refurbishment, also failed. It wasrepaired and offered no more trouble. These failed parts were both commercial off theshelf.
All data gathering objectives of the test were met with the exception of fatty acid,amine, oxidizability, and alkaline KOH analyses which were not performed. Theanalyses were not performed because no laboratory method existed for the analysesat the time of the test.
The lack of significant problems during the test allowed the test engineers toconcentrate their efforts on the differential pressure transients in the phase separators.Analysis of the separators' performance has resulted in many recommendations forsubsystem improvements. Some of these improvements have already beenimplemented by HS with good results, in preparation for planned life testing of theSPE.
5.3 Integrated Systems Testing 16
The ECLSS IART will be performed at MSFC. Testing of the ISS configuration of theAir Revitalization (AR) subsystem will be performed to provide data and gainknowledge of technical issues concerning operation and control to support the SpaceStation design and development. The ISS program ECLSS design includes oxygengeneration, carbon dioxide removal, trace contaminant control, and atmospheremonitoring as the baseline AR design with scars included for carbon dioxide reduction.The TCCS will be included in the test but will not be challenged with an extensive listof contaminants until the follow-on phase. The test's primary purpose is to provideimportant data with respect to the AR subsystem's ability to control oxygen and carbondioxide levels within ISS specifications, given crew metabolic profiles representativeof predicted on-orbit operations incorporating day/night orbital cycle power savingmeasures. In addition, lessons learned from this test will be used to gain insight intothe technical challenges to be faced by the technology ultimately selected for oxygengeneration.
Hardware, data, instrumentation, and test requirements are outlined to support the testobjectives of subsystem checkout followed by a minimum 14-day closed doorintegrated test. Process sampling requirements are included to provide additionaldata to assess the performance of the subsystems during the test.
The IART is scheduled to begin February 1996. A final test report will summarize theresults. The major objectives for the IART are:
Demonstrate simultaneous operation of oxygen generation, carbon dioxideremoval, trace contaminant control, and atmosphere monitoring hardware underremote automatic control in the Core Module Simulator (CMS) with closed doorsfor a minimum of 14 days (7 days uninterrupted).
Simulate metabolic oxygen consumption and carbon dioxide generation of 4 crewmembers inside closed door chamber with transient metabolic profilesrepresentative of typical Space Station operational activity timelines.
51

Provide performance data on oxygen generation, carbon dioxide removal, andatmosphere monitoring subsystems for controlling partial pressures of oxygen andcarbon dioxide for a crew of four.
Demonstrate capability of software for automatic control of oxygen partial pressure(ppO2) through integration of the Major Constituent Analyzer (MCA) ppO2 signalwith oxygen generator production rate.
Demonstrate day/night orbital cyclic operation of oxygen generation and carbondioxide removal subsystems with signal from control system representative ofday/night orbit.
Demonstrate the oxygen generation subsystem operation with actual reclaimedwater from the Integrated Water Recovery Test (Stage 9) as feed water forelectrolysis.
Determine the accuracy of the MCA water vapor measurement when integratedwith a simulated length of sample delivery system tubing as compared to cabinwater vapor concentrations measured directly by facility sensors.
A schematic showing the subsystems and major facility support hardware necessaryfor the test is shown in Figure 5.3-1. Subsystems include an oxygen generationassembly, a carbon dioxide removal assembly, an atmosphere monitoring assembly,and a trace contaminant control system. Facility support hardware includes ametabolic simulator, a vacuum chamber, a temperature and humidity control system,and an oxygen concentrator. Figure 5.3-1 also includes a mass balance for the test ataverage nominal 4 crew member metabolic levels. Ranges of metabolic levels will bevaried between values representing sleep to exercise to test the ability of the system tocontrol ppO2 and carbon dioxide partial pressure (ppCO2) levels within Space Stationrequirements.
5.3.1 Oxygen Generation
The SFE OGA (Figure 5.3-2), will be used to generate oxygen and hydrogen fromreclaimed water from the Integrated Water Recovery Test. Under closed dooroperation, oxygen produced will be fed to the Temperature and Humidity Controlsystem and hydrogen will be vented. The facility should also be capable of venting theoxygen under independent (open door) subsystem operation. The hardware will be a
refurbished version of the SFE-rVA, modified, for day/night cyclical operation.
5.3.2 Carbon Dioxide Removal
The 4BMS Carbon Dioxide Removal Assembly (CDRA) (Figure 5.3-3), will be used toremove carbon dioxide from the Core Module Simulator atmosphere. Removedcarbon dioxide will be vented to a simulated space vacuum, and regenerated airrouted back to the CMS through the Temperature and Humidity Control (THC) System.The hardware will be the POST unit modified for day/night cyclic operation.
52

SampleExhausl
MCA
I0 (Control)I
f
Waler -,,. SFE
0,35 IbJhr
F',_,,d.2i I Product02
0.04 rothr [ Yi"0.31 IMir
To Vent
Oxygen
Removal "-'>
Melabollc
Simulalor
1120 Vapor
1.0 Ib/l_r
co 20.37 Ib/hr
Air
Inlet
Supply to chamber
Vacuum
Syslem
I C02
0.37 Ib/hr
lair
Air out
m
TIIC
_elurn Item d_mber
Condensale
TCCS
Used for Independent
(open door) subsyslsm
lesllng
Figure 5.3-1 AR System Test Schematic and Average Mass Balance
5.3.3 Atmosphere Monitoring
The MCA (Figure 5.3-4), will be used to measure the partial pressures of oxygen,nitrogen, carbon dioxide, and water vapor inside the CMS. Oxygen partial pressuredata will be used by the control system to adjust the level of oxygen production by theSFE to maintain proper oxygen partial pressures. The water vapor measurement willbe compared to chamber humidity levels to determine the effects of the sampledelivery system on accuracy of the MCA water vapor reading.
5.3.4 Trace Contaminant Control
The TCCS (Figure 5.3-5) will be operated in this phase of testing as part of theintegrated AR configuration; however, the system will not be challenged with a rangeof contaminants until the follow-on phase of testing. The TCCS unit to be used in thetest is the Life Test unit. Process air is drawn into the TCCS directly from the chamberatmosphere. TCCS exhaust air is returned to the chamber via the THC return duct(combined with the CDRA process air return).
53

THERMAL
CONTROLASSEMBLY
I
i
T
FLUIDSCONTROLASSEMBLY
I
J
I
II
COOLa+I_I"
EL_CTROLY51S
MODULE
Figure 5.3-2 SFE Mechanical Schematic
54

ILl
>-0')rn
{/)-J
O
LUEE
Iiia
Xo__a
zomrt"
er_0
_§'"
o
II II II
i[-N ®
Figure 5.3-3 CDRA Mechanical Schematic
55

_m
i
i
i
U,I _"
v
_=
4.
Figure 5.3-4 MCA Block Diagram
56

Figure 5.3-5 TCCS Mechanical Schematic
57
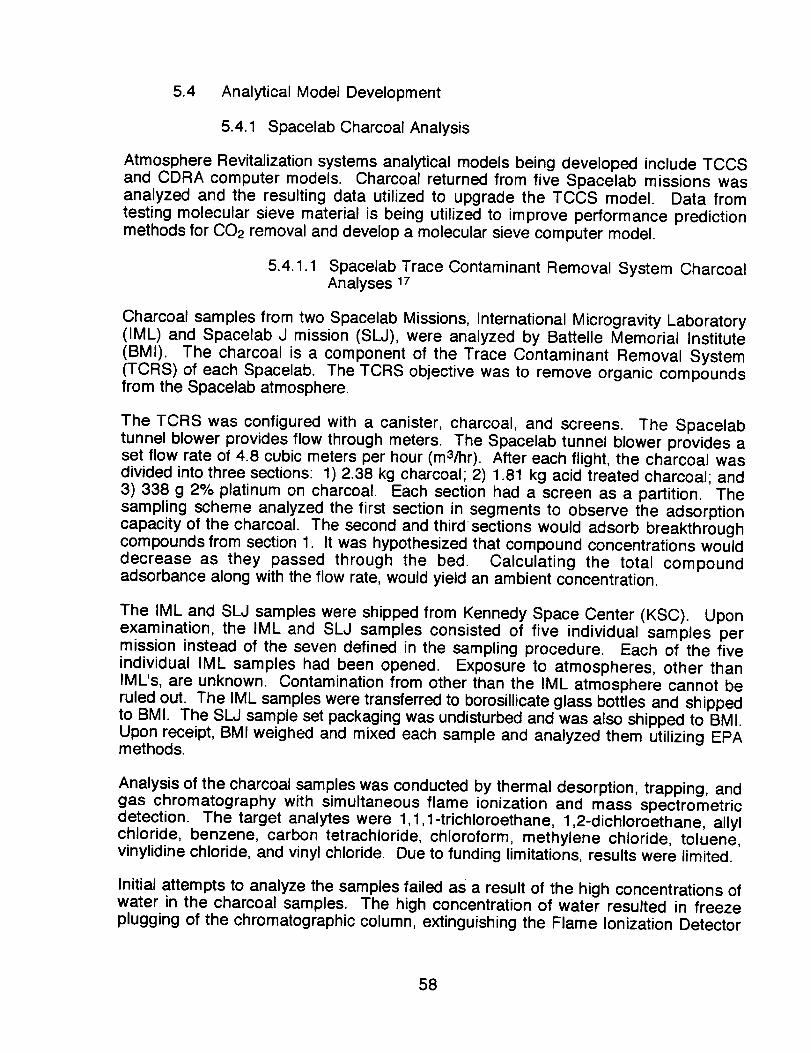
5.4 Analytical Model Development
5.4.1 Spacelab Charcoal Analysis
Atmosphere Revitalization systems analytical models being developed include TCCSand CDRA computer models. Charcoal returned from five Spacelab missions wasanalyzed and the resulting data utilized to upgrade the TCCS model. Data fromtesting molecular sieve material is being utilized to improve performance predictionmethods for CO2 removal and develop a molecular sieve computer model.
5.4.1.1 Spacelab Trace Contaminant Removal System CharcoalAnalyses 17
Charcoal samples from two Spacelab Missions, International Microgravity Laboratory(IML) and Spacelab J mission (SLJ), were analyzed by Battelle Memorial Institute
(BMI). The charcoal is a component of the Trace Contaminant Removal System(TCRS) of each Spacelab. The TCRS objective was to remove organic compoundsfrom the Spacelab atmosphere.
The TCRS was configured with a canister, charcoal, and screens. The Spacelabtunnel blower provides flow through meters. The Spacelab tunnel blower provides aset flow rate of 4.8 cubic meters per hour (m3/hr). After each flight, the charcoal wasdivided into three sections: 1) 2.38 kg charcoal; 2) 1.81 kg acid treated charcoal; and3) 338 g 2% platinum on charcoal. Each section had a screen as a partition. Thesampling scheme analyzed the first section in segments to observe the adsorptioncapacity of the charcoal. The second and third sections would adsorb breakthroughcompounds from section 1. It was hypothesized that compound concentrations woulddecrease as they passed through the bed. Calculating the total compoundadsorbance along with the flow rate, would yield an ambient concentration.
The IML and SLJ samples were shipped from Kennedy Space Center (KSC). Uponexamination, the IML and SLJ samples consisted of five individual samples permission instead of the seven defined in the sampling procedure. Each of the fiveindividual IML samples had been opened. Exposure to atmospheres, other thanIML's, are unknown. Contamination from other than the IML atmosphere cannot beruled out. The IML samples were transferred to borosillicate glass bottles and shippedto BMI. The SLJ sample set packaging was undisturbed and was also shipped to BMI.Upon receipt, BMI weighed and mixed each sample and analyzed them utilizing EPAmethods.
Analysis of the charcoal samples was conducted by thermal desorption, trapping, andgas chromatography with simultaneous flame ionization and mass spectrometricdetection. The target analytes were 1,1,1-trichloroethane, 1,2-dichloroethane, allylchloride, benzene, carbon tetrachloride, chloroform, methylene chloride, toluene,vinylidine chloride, and vinyl chloride. Due to funding limitations, results were limited.
Initial attempts to analyze the samples failed as a result of the high concentrations ofwater in the charcoal samples. The high concentration of water resulted in freezeplugging of the chromatographic column, extinguishing the Flame Ionization Detector
58
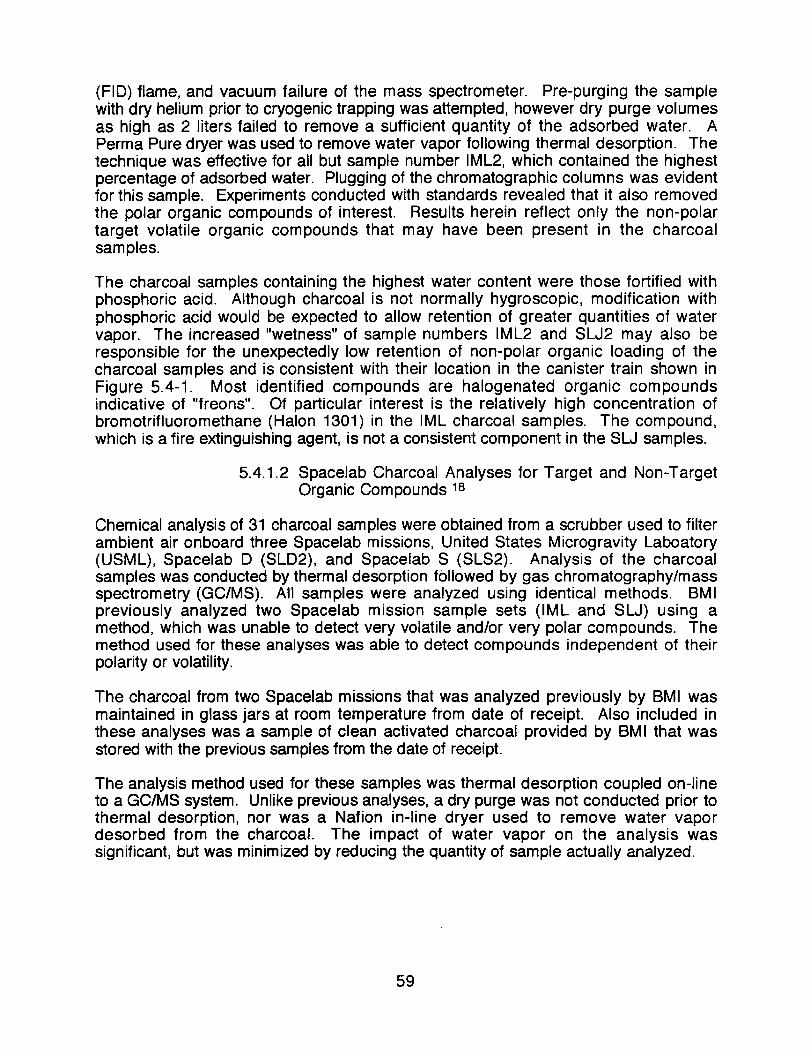
(FID) flame, and vacuum failure of the mass spectrometer. Pre-purging the samplewith dry helium prior to cryogenic trapping was attempted, however dry purge volumesas high as 2 liters failed to remove a sufficient quantity of the adsorbed water. APerma Pure dryer was used to remove water vapor following thermal desorption. Thetechnique was effective for all but sample number IML2, which contained the highestpercentage of adsorbed water. Plugging of the chromatographic columns was evidentfor this sample. Experiments conducted with standards revealed that it also removedthe polar organic compounds of interest. Results herein reflect only the non-polartarget volatile organic compounds that may have been present in the charcoalsamples.
The charcoal samples containing the highest water content were those fortified withphosphoric acid. Although charcoal is not normally hygroscopic, modification withphosphoric acid would be expected to allow retention of greater quantities of watervapor. The increased "wetness" of sample numbers IML2 and SLJ2 may also beresponsible for the unexpectedly low retention of non-polar organic loading of thecharcoal samples and is consistent with their location in the canister train shown inFigure 5.4-1. Most identified compounds are halogenated organic compoundsindicative of "freons". Of particular interest is the relatively high concentration ofbromotrifluoromethane (Halon 1301)in the IML charcoal samples. The compound,which is a fire extinguishing agent, is not a consistent component in the SLJ samples.
5.4.1.2 Spacelab Charcoal Analyses for Target and Non-TargetOrganic Compounds 18
Chemical analysis of 31 charcoal samples were obtained from a scrubber used to filterambient air onboard three Spacelab missions, United States Microgravity Laboatory(USML), Spacelab D (SLD2), and Spacelab S (SLS2). Analysis of the charcoalsamples was conducted by thermal desorption followed by gas chromatography/massspectrometry (GC/MS). All samples were analyzed using identical methods. BMIpreviously analyzed two Spacelab mission sample sets (IML and SLJ) using amethod, which was unable to detect very volatile and/or very polar compounds. Themethod used for these analyses was able to detect compounds independent of theirpolarity or volatility.
The charcoal from two Spacelab missions that was analyzed previously by BMI wasmaintained in glass jars at room temperature from date of receipt. Also included inthese analyses was a sample of clean activated charcoal provided by BMI that wasstored with the previous samples from the date of receipt.
The analysis method used for these samples was thermal desorption coupled on-lineto a GC/MS system. Unlike previous analyses, a dry purge was not conducted prior tothermal desorption, nor was a Nafion in-line dryer used to remove water vapordesorbed from the charcoal. The impact of water vapor on the analysis wassignificant, but was minimized by reducing the quantity of sample actually analyzed.
59

#.
I,-I,U.-II,-
o
.,.I "--J
0')
_)em
"0
(D
m
d,,"
Zm
\I I
37diNVS
9 ::ITdiNVS
n-I,UI---,Ii1
Figure 5.4-1 TCRS Configuration
60

To improve quantitative accuracy, standard mixtures were prepared containing knownconcentrations of selected compounds. The compounds were among the mostabundant in previous scrubber charcoal analyses (including those conducted at BMI).This standard mixture was analyzed for purposes of calibration by direct splitlessinjection into the GC/MS system or, for purposes of estimating recovery, by spikingonto a charcoal sample followed by thermal desorption GC/MS. Initial trials usingsolvent based spikes onto previously desorbed charcoal samples were not successfulbecause the solvent created excessive peak broadening rendering identification andquantification difficult. To overcome this problem, a pressurized gas standard wasprepared. This gas standard was used for both direct injection to single point calibratethe GC/MS system, and for loading previously desorbed "blank" charcoal samples toestimate recovery.
The results obtained from the charcoal analyses represent a range of compounds and,in some cases, unusually high concentrations of polar compounds such as ethanoland acetone. The use of GC/MS to analyze a range of compounds is widely utilizedfor environmental analyses, however this approach becomes complicated for charcoalanalyses because of the unusually high water loading. The first set of Spacelabcharcoal samples did not show consistent water loading nor did these samples revealthe same concentration of non-polar compounds as determined in previous results.The remaining three sample sets showed a variety of polar and non-polar organiccompounds.
5.4.2 Carbon Dioxide Removal System Computer Model 19
Adsorption involves the selective transfer of one or more solutes from fluid solutionsonto and into solids. Physical adsorption is a surface phenomenon. When fluid is incontact with solid surface, molecules in the fluid phase spontaneously concentrate onthe surface without any chemical change. At low temperature, adsorption is usuallycaused by intermolecular forces, such as Van der waal forces. The adsorptionpotential determines the strength with which any given molecule is adsorbed. Thedifferences in the surface energy of the adsorbent and the properties of each kind ofmolecule cause differences in the amount adsorbed on certain kinds of surfaces, i.e.,the selectivity. Separation of solutes in fluid mixtures can be accomplished throughselective collection and concentration onto a solid surface.
Separation of gas mixtures by adsorption can be obtained by using either singlecolumn or multi-column configurations. However, for both processes the adsorbentcolumn is alternately saturated and regenerated in a cyclic manner. One example of acontinuous cyclic selective process is the Four-Bed Molecular Sieve (4BMS) used inISS for the removal of CO2 (Figure 5.4-2).
As shown in Figure 5.4-2, the actual CO2 removal system for ISS consists of four beds.Two beds operate in the adsorption mode (a desiccant and CO2 sorbent bed) whilethe other set of identical beds desorbs. The desiccant beds desorb through gasstripping while the sorbent beds are heated and subjected to a vacuum (e.g., thepressure and thermal swing process). Following the air flow path in Figure 5.4-2,cabin air laden with CO2 and water enters at the system inlet, then enters desiccantbed (1), which consists of silica gel and 13X sorbent materials. The desiccant bed is
61

required to remove virtually all water from the air stream. The dry air is next pulledthrough the air blower, which overcomes the system pressure drop. A heat exchanger,the precooler, removes the heat of compression and heat of adsorption from thedesiccant bed before the air enters the 5A sorbent which is responsible for removingthe CO2 from air. Following the precooler, the 5A bed (4) performs the primary systemfunction of removing CO2. The other 5A bed is concurrently desorbed with heat fromembedded electrical heaters and allowed to vent to the vacuum of space. At thebeginning of a new half cycle, the selector valves cycle to alternate the desorbing andadsorbing beds. Heated air from the hot, previously desorbing CO2 sorbent bed, stripsthe downstream desiccant bed (3) of water, which is returned to the cabin in the returnair stream. Note that in Figure 5.4-2, beds 1 and 4 operate concurrently to removeCO2 while beds 3 and 2 desorb and recondition. The reverse is true when beds 3 and2 operate to remove CO2.
Because of the complexity of the process, the design of an efficient 4BMS CO2removal system mission depends on many mission parameters, such as duration,crew size, cost of power, volume, fluid interface properties, etc. A need for spacevehicle CO2 removal system models capable of accurately performing extrapolatedhardware predictions is inevitable due to the change of the parameters whichinfluences the CO2 removal system capacity.
TEMP
SENSOR
f
qm,,
AIR
INLET
AIR
RETL_N
DESICCANT BED (1) CO2 SORBENT BED (4)(DESORBING)
(ADSORBING) I I L.= ELECTRICAL
CHECK I _ _'- HEATERS
_Iii_iliiii]__ _:i:i:i:i:i iiiiiiiiii VALVE . :_iiiiii!'":i_ii_i_ii_'";iiJii'_F , [ VENTiALVEOPENLOOPAIR SAVE
PRECOOLER ;_ I
. <iJ L )'o,j s ,,x I ,I '
- {r JzJ i ilill)Q(I )j ...-.---............... SENSOR
DESICCANT BED (3) _ ELECTRICAL
(DESORBING) CO2 SORBENT BED (2) HEATERS
(ADSORBING) TO
SPACEVACUUM
Figure 5.4-2 Four Bed Molecular Sieve Schematic
62

The purpose of this study was to: (1) investigate the mathematical techniques requiredfor a model capable of accurate extrapolated performance predictions; and (2) obtaintest data required to estimate mass transfer coefficients and verify the computer model.Models have been developed to demonstrate that the finite difference technique canbe successfully applied to sorbents and conditions used in spacecraft C02 removalsystems. The non-isothermal, axially dispersed, plug flow model with linear drivingforce for 13X and pore diffusion for silica gel were then applied to test data from aMSFC fixed bed column apparatus. A more complex model, a non-darcian model (2-dimensional) has also been developed for simulation of the test data. This modeltakes into account the channeling effect on column breakthrough.
5.4.2.1 Monodisperse and Bidisperse Diffusion Modeling
Mass transfer of solute from bulk gas to sorbed state is driven by equilibriumisotherms. The mass balance equation inside the sorbent material depends on thestructure of the pellet. Monodisperse pore diffusion and bi-disperse pore diffusion arethe two models used to predict the mass transport within the pellet. The diffusionmechanism for the two types of sorbents are illustrated in Figures 5.4-3 and 5.4-4. Ingeneral, the mass transfer mechanism of an adsorption process includes four steps:fluid-film transfer; pore diffusion; surface adhesion; and surface diffusion. Since thesurface adhesion rate approximates the order of the collision frequency of the gas onthe solid surface, which is much faster than the transport processes, equilibrium isassumed to be reached instantaneously at the interfaces. Adsorbates initially transferfrom the bulk gas stream through an external film around the particles and reach theexternal surface of the particles. Molecules of adsorbate then diffuse into the pores ofthe particles, are adsorbed on the active sites, and then diffuse along the surface. Anyof the steps can constitute the rate-controlling mechanism. The external mass transferrate is defined in terms of an effective transfer coefficient as a linear driving forceequation.
bulk stream
_ _ A
v
pore
J diffusion
surface
diffusion
Figure 5.4-3 Intraparticle Mechanism of Diffusion for Monodisperse Sorbent
63

bulk streammh==
bulk _-"J_ _1_ pore "_
diffusion _on .
intracystal _ intracrystal
Figure 5.4-4 Intraparticle Mechanisms of Bidisperse-pore Sorbent
Results of the study are discussed below. Simulations were performed on an AlphaVAX computer. Experiments were performed on the insulated fixed-bed rig at MSFC.The sorbent is a 5A zeolite. Flow rates are scaled to match the superficial velocity inthe 4BMS. Nitrogen is the carrier gas. Experiments begin with the column at ambientroom temperature.
5.4.2.2 Thermal Effects Modeling
The time-sequence of simulation results in Figure 5.4-5 illustrate the significantthermal response of the column to a charge of C02 at a partial pressure ofapproximately 9 mmHg. The thermal wave caused by the heat of adsorption travelsfaster than and broadens the C02 front. For full saturation of the bed (an object ofdesign), the thermal wave must exit the column.
The thermal model is validated by comparison with heating of the sub-scale columnwith an inert gas, shown in Figure 5.4-6. Nitrogen was heated to a temperature of350°F and passed through an initially cold column. The markers are the measuredtemperatures at the inlet, midpoint, and exit of the column. The lines are the resultsfrom simulation.
5.4.2.3 Nitrogen Co-adsorption Effects Modeling
The importance of not neglecting the effect of nitrogen co-adsorption with C02 isshown in Figure 5.4-7. C02 in nitrogen at 6.2 mmHg was passed through an initiallyclean zeolite column. The gas at the column centerline was analyzed periodically atthe column inlet, midpoint, and outlet. These results are compared with simulationsthat either included (solid lines) or neglected (dashed lines) the effect of nitrogen.Nitrogen clearly has a noticeable effect; however, the simulations that included N2adsorption over-predicted the effect slightly.
64

lJch_ AIo_B Bed (m;_,_t_ wdues)tq
ElaF_I Time = 15 minutes Time = 33 minutes
o
Aloe S Bed
Elapaed Time = 24 minutes .Elal:_d Time =42 min,._tes
Figure 5.4-5 Single Component Mass and Heat Transfer Effects
25O
20O
o_
lOO
5O
. • . ' | . ' ' ' I " ' l , I "
J' / _ exit"..............___,_.t_ ..........
/ / .(r- , micipoinf "• exit
}
0.5 1 1.5 2
Time, Hours
Figure 5.4-6 Thermal Validation of the Computer Model
65

7
i i j5 °.-.°°..°°.°.
5
4
3
2
1
0
-1
0 0.5 1 1.5 2
Time, hours
Figure 5.4-7 Mass Transfer Effects of Nitrogen Co-adsorption
The thermal sensitivity to N2 co-adsorption is shown in Figure 5.4-8. The agreement ismuch better when the heat of adsorption of nitrogen is accounted. A dip intemperature occurs at 0.15 hours in both the test data and the simulation, due to N2displacement by CO2• N2 is seen to reduce the bed capacity and lower overall bedtemperatures through desorption.
o_
F.
105
100
95
9O
85
8O
75
:" _sim. temperature, inlet, with N2i f"".,"., %, adsorption
............................. ._.. .............. ::_. ........... _midpoint[" . _exit
,,v".,,. r_,.:.L.. "_, . _m-,_e.ud temp_,_, i_et• :t __ ,/.f'_." _ :,, • midpoint
..._'_,.,._.,,..._.--.!....;......_ ............ :i,.......... sirn. temperature, inlet, no N2J #" _ f _ | " _ :: adsorpIJon
L_
; ......... ....
-,,.........................................._.',_.::_....." ................................: • ..'.......
i , , , I l , l - i .... i . , . |
0.5 1 1.5 2
Time, Hours
Figure 5.4-8 Heat Transfer Effects of Nitrogen Co-adsorption
66

5.4.2.4 Water Co-adsorption Effects Modeling
The interaction of water and 002 adsorption, and the effects of resulting heatgeneration, are shown in the simulation results in Figure 5.4-9. As illustrated by thistime-sequence, the relatively weakly-adsorbed CO2 initially saturates the sorbentdownstream of the steep, slow-moving H20 mass transfer wave. This results in twopeaks on the thermal wave in the first figure (at 15 minutes). At 45 minutes, thethermal wave due to H20 adsorption begins to drive CO2 off the sorbent; by 105minutes, the thermal wave effects are nearly complete. Finally, the H20 is seen tocompletely displace CO2 as it slowly moves down the column.
11me _ 15 rrdnut(_llmo _ 75 rratlutes
11me = 45 minutmTime- 105 n_null3S
Figure 5.4-9 Effects of Water Co-adsorption
Verification of the model for CO2/H20/N2 co-adsorption shown in Figures 5.4-10 to5.4-12. These three figures illustrate testing and simulation runs for adsorption ofwater at 6.3 mmHg and CO2 at 2.89 mmHg in a carrier gas of nitrogen. All figuresshow test data as markers and simulation data as lines.
Figure 5.4.10 illustrates the "roll-up" phenomenon as adsorbed 002 iS driven off bywater, and the CO2 partial pressure rises above the inlet level temporarily. The effectshould be larger at the column outlet than midpoint as shown by test data.
Figure 5.4-11 shows the water breakthrough at the column midpoint and outlet. Alsoshown is the H20 partial pressure of gas mixed by passing through glass beadsdownstream of the sorbent material. Note the mixed gas breaks through before thegas at the centerline, indicating that channeling is significant along the walls of thetwo-inch diameter column. Since the heater core of the 4BMS sorbent bed consists ofchannels roughly one-half inch in diameter, the channeling effect on CO2 removal willbe significant. The results of the two-dimensional model (not shown here) confirm thatchanneling has a significant effect on this adsorption process. Finally, Figure 5.4-12shows the temperatures of the bed at midpoint and outlet.
67
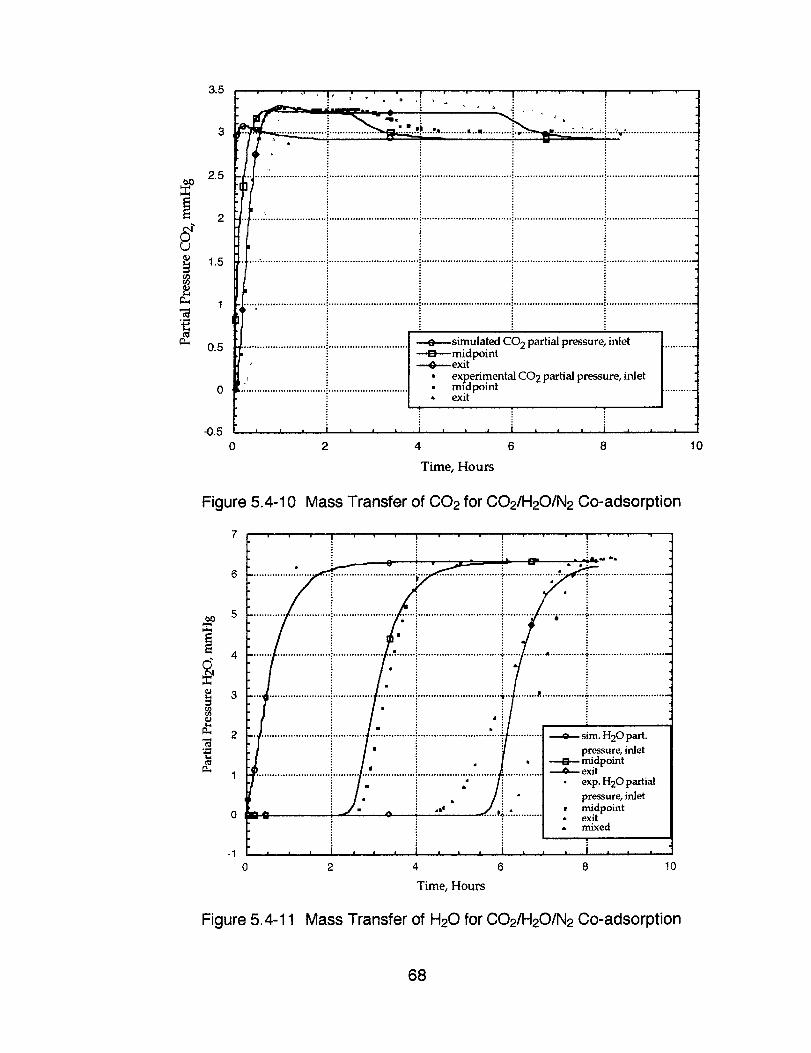
3 : I I I" : " " ;
2.5
_ 1.5
0.5 " --.l_--midpoint
i _ exit, experimental CO 2 partial pressure, inlet0 .'.'i........................................................... • midpoint
• exit
: i-05. , L , I , _ , I . , , , , , , a a
0 2 4 6 8 10
Time, Hours
Figure 5.4-10 Mass Transfer of CO2 for CO2/H20/N2 Co-adsorption
sire. H20 part.
pressure, inlet---O.-- midpoint--o-.. exit
• exp. H20 partial
pressure, inleti midpoint- exit• mixed
-10 2 4 6 8 10
Time, Hours
Figure 5.4-11 Mass Transfer of H20 for CO2/H20/N2 Co-adsorption
68

120
110
100
_ 9o
8o
70
: --o--simulated temperature, inlet
: I _midpoint
i ---O---exit• experimental temperature, inlet
i • midpoint................. 4 .................. ;.................. :.................. -_...... ' exit
..................................................... -'........-'{....................................i.................................
. . . --.,.II
r • , , I .... I .... I .... I , , , , I .... I .... I ....
1 2 3 4 5 6 7 8
Time, hours
Figure 5.4-12 Heat Transfer Effects for CO2/H20/N2 Co-adsorption
Based on analytical and experimental investigation of convective flows in porousmedia the following conclusions are drawn:
The experimental results from the laboratory scale-fixed bed adsorber arequantitatively consistent with the one-dimensional model at the column center. Theaverage concentration of cross sectional bed obtained by test result deviates fromthe column center concentration appreciably. This indicates the strong effects ofporosity variation along the radial direction of column bed on the temperature,concentration, and velocity field. These observations resulted in the decision tomodel the dynamic behavior of the column in two-dimensions.
The two-dimensional model demonstrates the importance of non-darcianmomentum and porosity variation on the flow distribution, concentration, andtemperature in the radial direction of the bed. The two-dimensional model not onlypredicts the concentration and temperature profile at the column center well, but italso predicts the average concentration reasonably well.
• A linear driving force mass transfer model provides a reasonable fit to theexperimental adsorption and desorption.
The concentration of a key component, 002, is affected by the presence of the non-key component, N2, in CO2/N2 adsorption. CO2 effluent concentration overshoots itsinlet concentration because of H20 displacement (more easily adsorbed)component. The height of this roll-up is increased with the inlet concentration ofH20 component.
69
• Comparison of model results with test data shows the created models can beaccurately used for modeling of the actual 4BMS.
The two-dimensional model can be used to simulate the actual 5A bed of 4BMS,
which contains an array of approximately 1/2 inch square channels, for porosityvariation.
• The lAST equilibrium predicts the breakthrough curve much closer to the test data
than the Lanmuir-Fredlitch theory for mixtures of CO2/N2 and 002/H20.
5.4.2.5 Adsorption Equilibria 2o
Single component adsorption isotherms required for the simulations are collected viastatic volumetric adsorption experiments. Isotherms are obtained for all adsorbent
(13X and 5A zeolites and silica gel) and gas (N2, CO2, and H20) combinations overtemperatures ranging from 0 ° to 250°C. Other physical properties of the adsorbents
(e.g., porosity and thermal characteristics) are obtained through routine methods.Multicomponent experiments are performed to test the co-adsorption equilibriumprediction. Single and multicomponent testing is being performed at Ames ResearchCenter (ARC). The family of adsorption equilibrium isotherms for CO2 on Grace 13Xzeolite is shown in Figure 5.4-13.
10
.5el
,.9,°
oo o.1
0.010.001 0.01 0.1 1 10 100
pressure (mmHg)
1000
Figure 5.4-13 CO2Adsorption on Grace 13X Zeolite
70

5.4.2.6 Column Dynamics
Fixed-bed column tests are performed on a 20-inch long, 2-inch diameter insulatedcolumn. Gas samples are taken and temperatures are measured at four axiallocations and at the exit. Samples are analyzed using a gas chromatograph equippedwith a thermal conductivity detector. The experiments provide data for simulationverification and coefficients for lumped mass transfer terms in the model. Fixed-bedcolumn tests are performed at MSFC.
5.4.2.7 Integrated 4BMS Model Development
Integration of the verified single-bed models described above is being performed atMSFC. The integrated model will be developed in two formats.
A standalone version is being developed featuring transportability to any computerplatform with a FORTRAN 77 compiler. This version will utilize simplified heatexchanger and blower components and will be limited to bed configurations matchingthe existing 4BMS configuration.
Conversion of the single-bed models to CASE/A (Computer Aided SystemEngineering and Analysis) 21 component models will follow development of thestandalone 4BMS model. CASE/A, a graphical-based system-level computermodeling tool, will allow much greater flexibility in configuration of the sorbent models.The 4BMS CASE/A model will be developed using the graphical user interface andexisting CASE/A components such as heat exchangers, valves, blowers, controllers,and timers. Other CO2 removal system configurations can be readily developed basedon the verified single-bed models in CASE/A to analyze candidate technologies for theevolutionary Space Station and future manned missions.
5.5 Life Testing
5.5.1 Carbon Dioxide Removal System 8
The ECLSS CDRA, 4BMS, utilizes the zeolite materials acting as sieves on amolecular scale to remove CO2 molecules from air. The CO2 molecules in the CO 2enriched air are adsorbed to the zeolite 5A as the air flows through, and then releasedwhen the zeolite 5A undergoes a thermal/pressure swing process. The desorbed CO 2is either released to the outside air, or collected in the accumulator tank for further
processing. This process removes the excess CO2 from the air in a confinedenvironment.
The 4BMS system is shown in Figure 5.5-1. Major components are comprised of twopairs of desiccant and sorbent beds. The desiccant bed consists of a canistercontaining sorbent materials of silica gel and zeolite 13X. The carbon dioxide sorbentbed contains sorbent material zeolite 5A. Other components include a blower, a heatexchanger, a CO 2 pump, a CO 2 accumulator tank, four air selector valves, two CO 2
71

selector valves, and two check valves. Also, sensors with signal amplifiers measuringthe temperatures, pressures, and dew point temperatures are used for controllingpurposes. Among all components, the desiccant and sorbent bed materials are flight-like.
Figure 5.5-1 Four Bed Molecular Sieve
Since the Life Test initiation, the flight-like adsorbent material, cylindrical zeolite 5A,has displaced within the beds and produced small particles and dust. The particlesand dust entered the system through the originally designed filters and causedpremature blower failures. After the redesigned filtering system was installed, andparticle flow was redirected to a bypass, the 4BMS subsystem ran nominally withminimum dust in the system. However, the dust is still being produced inside thesorbent beds and the majority of the dust is confined in the beds by the filters. Verysmall amounts of dust has passed through the filters, entered the system, andcollected in the dust collection pipe.
Efforts have been made to resolve this dust problem. Both new and used adsorbentmaterials from the CO2 sorbent bed have been analyzed by Scanning Electron
Microscopy (SEM). The micrographs showed cracks on the used material but not onthe fresh zeolite 5A. The dust composition, collected from 4BMS life testing, has alsobeen analyzed with SEM and X-ray backscatter techniques. The results showed aconsistent composition between samples indicating that the small particles and dustwere physically breaking up and flaking off the zeolite 5A pellets. It has also beenconcluded that the adsorption and desorption process is not a dominant source of dustgeneration.
72

Among all the dust generation sources, the compression forces during the initialloading of the beds and those resulting from thermal expansion and contraction of thesorbent bed housing and heater core are considered most predominant. Since thedust generation continues, the vendor has proposed that in addition to the improvedcontainment design the material geometry be changed from a pellet form to spheres. Itis believed that the roundness of a sphere will be less likely to wear than the edges ofa pellet. To assess the contributions of compressive forces and provide further data tosupport or deny the plausibility of a material geometry change, a bench-scale test wasconducted on the two shapes of zeolite materials, cylindrical and spherical. Theresults showed that the spherical material is more prone to dust generation. A testconducted by AlliedSignal also showed that the performance of the sphericalmaterials did not meet the CO2 removal requirement. Thus, the sorbent materialgeometry will not be changed.
The most recent anomaly occurred when the 4BMS subsystem life testing restarted onNovember 20, 1995. It was running nominally with a lower power consumption ofsorbent bed (2) (Refer to Figure 5.4-2). The temperature of sorbent bed (2) was alsomuch lower than sorbent bed (4). After adjusting the variac to increase the wattage,there was still no significant improvement. It was concluded that some heaterelements were burned out from the shutdown occurring on November 1, 1995. Duringthis shutdown the system was locked in the heating mode of sorbent bed (2) andcaused the heater elements to burn out. There are thirteen heater elements for the
primary and secondary heaters. Only four primary heater elements are still good. Theother primary heater elements and all secondary heater elements were open. Theheater elements of sorbent bed (4) have also been checked. Only two secondaryheater elements were open and the rest of the heater elements are all good.
Both beds will be sent to AlliedSignal to replace the heater core. A heater elementsfailure report will be requested when AlliedSignal replaces the heater elements. Thecurrent materials in these beds will be reused to preserve the life accumulated.AlliedSignal is preparing a cost proposal for this refurbishment.
Initial 4BMS life testing started January, 1993, with testing on the desiccant andsorbent materials. Total test time has exceeded 13,500 hours and there is no sign ofmaterial degradation. A flight-like blower is being fabricated and will be integrated intothe existing test stand for operational life test after delivery. The control software,including the day/night operating cycle, will also be integrated to test functionalities.
5.5.2 Trace Contaminant Control System 22
The purpose of the TCCS Life Test was to provide long duration operation of theECLSS TCCS High Temperature Catalytic Oxidizer (HTCO) at normal operatingconditions. Specifically, the test was designed to demonstrate thermal stability of thehigh temperature oxidizing catalyst. The TCCS life test was discontinued after 762 testdays with no observed catalyst degradation.
A TCCS utilizing a 0.5% palladium on alumina catalyst is scheduled for use on theISS for oxidizing trace organics in cabin air, yielding primarily CO2 and H20. Theseproducts will be removed from the air stream, by other ECLSS components, prior to
73

the air stream's reentry into the cabin atmosphere. The organics to be oxidized will beintroduced into the cabin as human metabolic products, and through off-gassing ofmaterials used in ISS construction.
TCCS Life Testing utilized flight-like hardware built by Lockheed Missiles and SpaceCompany. The axial fan and the low leg blower were both refurbished by the vendorprior to the beginning of the life test. The HTCO was fitted with additional
thermocouples to more efficiently monitor internal temperatures. The flight-like testhardware was the HTCO assembly, and the palladium on alumina catalyst foundwithin the HTCO housing. A TCCS simplified schematic is shown in Figure 5.5-2.
oPl
ii
VACUUMCONNECTION
r-
VACUUM _ 8vl
t 1Regemer_le CarbonBed _Un=ac_ea)
UOH Soroemt/_
Metr=_ 0 Be,= _ Tit_l_l_Por_(Life Test)
LEGEND
AXIAL FAN T
(J-r01-JT0 o_
- G('Poz}
T
_J (F'COI )
OP = Differermal Pressure SensorV = V_tve
W = V=_'uum Valve
BV = Bleed V=dve
( ) = Life "re_ Port Derign=Uarm
MV = Minual Isolation VaNe1"= TemDer-at_re S_sot
A = Q.I_ MEet"
AS = Higfl Temperature S_utm_f
S = SamDte PortF_/= Row ¢otm'ot ValveFM = Row Meter
F = Fa=lity (ex. FT01 )
Figure 5.5-2 TCCS Schematic
74

In the TCCS catalyst life test, 3% methane in air was bled into an air stream in thecatalytic oxidizer lower leg. This is just prior to the lithium hydroxide (LiOH) PresorbentBed canister. The canister was used as a mixing chamber for this test, and wasotherwise inoperable. The air stream methane concentration, as it left the presorbentcanister, was approximately 90 ppm. The air stream then entered the HTCO assembly(containing the palladium catalyst), where it passed through a heat exchanger, andthen the catalyst bed. Within the bed, methane and other organic contaminants wereoxidized. The air stream containing the oxidation by-products then left the bed,passed again through the heat exchanger (cooling somewhat as it gave up heat to theincoming air stream), and exited the assembly.
Life testing of the TCCS has provided much useful information. Above all, the test hasshown that the HTCO catalyst life is much longer than previously estimated. While theISS logistics plan calls for catalyst replacement every 180 days, the Life Test hasshown that, under non-poisoning conditions, the catalyst can remain effective inexcess of two years and possibly much longer at the baseline temperature and flowconditions. This represents tremendous cost savings to the ISS program. In addition,preliminary catalyst poisoning test results have shown that a poisoned catalyst of thistype can recover to a usable extent with increased heat and exposure to a non-poisoning atmosphere (Section 5.1.1).
5.6 Static Feed Electrolyzer Flight Experiment Preliminary Design 23
In 1989 and 1990 a comparative test of electrolyzer technologies was conducted at theMSFC in Huntsville, Alabama. As a result of this test, LSI's SFE was selected for useon the SSF and proceeded through a Space Station PDR. Soon after completion ofthe PDR, the Space Station Program was restructured and further development of the02 generator was deferred. As a result of this deferral, SFE work was placed on hold.
The next significant event was the change from SSF to ISS. Of significance in thischange was that the 02 generator operation was changed from continuous to cyclic tomatch the light/dark cycle of the orbit which required modifications to the SFEhardware design and control software. The change from continuous to cyclicoperation of the 02 generation introduced a requirement that the 02 generator becapable of rapid transitions from inactive operation (Standby Mode) to active operation(Normal Mode) so that maximum utilization of the 53 minute sunlight period of the orbitcan be achieved. Because this requirement did not previously exist, all past emphasiswas placed on long-term continuous operations.
Closure of the ISS OGA development was still deferred to later in the program. At thispoint it was recognized that it was possible to implement a Flight Experiment thatwould demonstrate the operation of an integrated SFE subsystem in microgravity andsignificantly reduce the risk of using the SFE on ISS.
This opportunity was identified by NASA and, with the sponsorship of MSFC withinNASA, a Flight Experiment program was initiated. This program was structured as atwo-phase process. The first phase (funded by the Space Station Program Officeunder TTA's) was structured to define the experiment and complete design workthrough a PDR. The second phase (funded by NASA Headquarters Code M) is to
75

implement the design documented by the Preliminary Design through a flight test ineither the MIR, Spacelab, or SPACEHAB flight platforms. The SPACEHAB has beenidentified as the flight vehicle to be used. Figure 5.6-1 presents a photograph of theSFE Flight Experiment PDR Mockup.
Figure 5.6-1 SFE Flight Experiment PDR Mockup
The overall objective of the SFE Flight Experiment is to demonstrate the readiness ofthe technology for use in long duration space missions as a water electrolysis basedutility. Specifically, the objectives of the experiment are to:
Evaluate the microgravity sensitivity of all SFE System components and processeson an integrated basis. This includes validation of ground-based analyses andmultiple-cell configuration behavior.
Verify the performance of the integrated SFE System in microgravity, which willvalidate: (1) the entire SFE concept at the systems level; (2) the interaction ofcomponent parts; (3) quality and quantity of product gases; and (4) the SFEefficiency.
76

The objectives of the Preliminary Design program were to define an experiment that, ifsuccessfully performed, accomplish the two overall program goals stated above and,to develop and document a design through a PDR that can be efficiently implementedinto hardware and qualified for flight.
Extensive test data from operation of the upgraded SFE-IVA, designated the SFE-[VA'will be available to support the final design of the SFE Flight Experiment which willincorporate the new features being demonstrated by the SFE-IVA'. Modifications tothis subsystem and a summary of test data was provided in Section 5.2.1 of this report.
The SFE Flight Experiment will provide extensive data, that when compared to Earth-based test data, will verify the readiness of SFE technology for application to ISS orother long-duration missions. The successful implementation of the PDR shows thatan SFE Flight Experiment can be implemented within the resource constraints of theavailable flight vehicles that will accomplish the goals of the program.
77

6.0 MICROBIOLOGY
6.1 Assessment of Microbial Degradation of Space Station Materials 24,25
The degradation of materials by microbial attack is now accepted as a commonoccurrence. This hazard has been recognized in the Soviet/Russian space program.Numerous examples of attack of spacecraft materials have been documented. Thegoal of this task (Task A) was to assess the risk from microbial activities to candidatematerials for the Space Station.
To assess the hazard for the Space Station, literature from the Russian space programand European Space Agency was reviewed. A collection of more than 70 paperswere gathered in which either materials were determined to have been damaged bymicrobial attack, or human health hazards were reported because of the growth ofmicroorganisms on surfaces in space habitats. The main focus was on theengineering problems rather than on the effects on crew health.
The Russian literature reports a wide range of materials attacked by bacteria andfungi. For example, on Salyut-6 thick fungal growth was observed on rubber straps.On Salyut-7 visible mold was observed on the hull, joints, and cables in the work area.Structural damage, including perforation of insulating material, was detected. Theviewing window of the Soyuz transport vehicle was obscured by fungal growth.Degradation of polymeric materials, including epoxy enamels, by microbial activity,was also detected.
All of the publications reviewed for this report have been incorporated into a database,entitled MicroBase. This database was prepared to make the assembled literatureeasily accessible. All pertinent articles, books, and reports, which were located in theliterature search, are in the database. Key words have been provided to facilitate easylocation and cross-referencing of the data.
A major part of Task A was to test the susceptibility of candidate materials for theSpace Station to microbial attack. No methods were available to either qualitatively orquantitatively assess the risk of material biodeterioration. A set of detailed protocolswere developed for use in screening materials for susceptibility to microbial attack.
These protocols were applied to test seven candidate materials for susceptibility tomicrobial growth and degradation. The materials tested are polyimide foam, rubber-silicone sealant, teflon wire insulation, titanium tubing, a composite underdevelopment, a polyurethane coating, and polyurethane coating containing 1%fungicide.
Accelerated testing was performed at high humidity and high temperature. All sevenmaterials developed large populations of bacteria and fungi within two weeks. SEMshowed penetration of the non-metallic materials by microorganisms. ElectrochemicalImpedance Spectroscopy (EIS) was used to determine damage to the coatings andthe composite. The materials showed damage due to attack by fungi within fourweeks. Results for attachment studies of the two coatings indicate that there is nodifference in the development of the microbial population between the polyurethane
78

coating without fungicide and the polyurethane coating containing 1% fungicide.Results indicated that the fungicide in the polyurethane coating failed to inhibit eitherattachment or growth of microorganisms at the concentration used (Figure 6.1-1 and6.2-2).
The task was extended (Task B) to investigate the effect of lowering the temperatureand humidity on the proliferation of microorganisms on surfaces of Space Stationmaterials. In addition, electrochemical degradation studies initiated during Task Awere continued to determine the long-term effect of microbial growth on candidatematerials.
Results of Task B indicated the following:
At ambient temperatures, all seven of the materials supported large microbialpopulations when the atmospheric humidity was permitted to fluctuate within arange of 40% to 80% Relative Humidity (RH).
At ambient temperatures, maintenance of the atmospheric humidity within therange specified for the Space Station, 45% to 55% RH, resulted in a drop-off of themicrobial population on the surfaces of all seven candidate materials.
Scanning Electron Microscopy observations confirmed that on surfaces maintainedat ambient temperature and 45% to 55% RH, microbial populations remained atextremely low levels.
In assessing the efficacy of the biocide treatment for the polyurethane coating, itwas conducted that the biocide is ineffective at the concentration specified for use.EIS analysis demonstrated that microorganisms overrode the biocide, resulting indeterioration of the protective coating.
The data obtained during Task B led to a number of conclusions. Humidity is the keyto microbial growth on surfaces. Variation in humidity between approximately 40%and 80%, even at low temperatures, leads to massive growth on all surfaces tested.Conversely, if the humidity is maintained below 55% RH, the microorganisms die off.This is a surprising and important observation. Even when the surfaces are repeatedchallenged with microbial contamination, the number of microbes rapidly declines tolow levels at humidities in the range of 45% to 55% RH.
The implications of these results are that, at temperatures close to ambient for theSpace Station, if humidity is maintained at a "reasonable" 45% to 55%, then microbialsurvival and growth on candidate materials for the Space Station should be minimal.
Continuation of EIS analysis of the polyurethane coatings, with and without biocideadditive, confirmed preliminary findings. The data from attachment studies show thatthe biocide, used at the concentration specified, does not prevent growth ofmicroorganisms as intended. Furthermore, EIS data show that the polyurethanecoating is highly susceptible to microbial attack. The microorganisms rapidly overrodethe biocide additive and attacked the biocide-treated coating. Our analysis stronglyindicates failure of the biocide.
79

Figure 6.1-1 Microbial Colonization of Polyurethane Coating
Figure 6.1-2 Microbial Colonization of Polyurethane Coating with Fungicide
8O

6.2 Polymerase Chain Reaction Assessment 26
The monitoring of spacecraft life support systems for the presence of healththreatening microorganisms is paramount for crew well being and successfulcompletion of missions. Development of technology to monitor spacecraft recycledwater based on detection and identification of the genetic material of contaminatingmicroorganisms and viruses would be a substantial improvement over current NASAplans to monitor recycled water samples that call for the use of conventionalmicrobiology techniques which are slow, insensitive, and labor intensive. Thefeasibility of Polymerase Chain Reaction (PCR) technology was addressed fordevelopment of a microbial water quality monitor for use on the Space Station.
PCR is a genetic-based method in which a Deoxyribonucleic Acid (DNA) segment ofthe target microorganism is detected by enzymatic amplification of a single DNAsegment to a million fold. The PCR procedure consists of three steps which is referredto as a cycle: (1) The double-stranded DNA is heat-denatured; (2) two primers (shortsingle-stranded oligonucleotides, the nucleotide sequence which is located at the twoends of the target DNA to be amplified) are annealed at low temperature; and (3) theprimers are enzymatically extended by DNA polymerase (TaqMan) at an intermediatetemperature. An exponential increase of the target DNA occurs by repetition of eachcycle. The PCR amplification is accomplished by using an instrument called athermocycler which repeatedly changes the temperature of the PCR sample. Thetechnique is relatively new; however, it is being used increasingly as a method ofdiagnosing and precisely identifying microbial contamination in environmental,clinical, and industrial samples.
The chemistry and molecular biology needed to utilize these probe-hybridization/PCRinstruments must evolve in parallel with the hardware. The following issues ofchemistry and biology must be addressed in developing a monitor:
Early in the development of a PCR-based microbial monitor it will be necessary todecide how many and which organisms does the system need the capacity todetect. We propose a set of 17 different tests that would detect groups of bacteriaand fungus, as well as specific eukaryotic parasites and viruses.
To use the great sensitivity of PCR it will be necessary to concentrate watersamples using filtration. If a lower limit of detection of 1 microorganism per 100 mLis required then the microbes in a 100 mL sample must be concentrated into avolume that can be added to a PCR assay.
The TaqMan PCR product detection system is the most promising method fordeveloping a rapid, highly automated gene-based microbial monitoring system.The method is inherently quantitative. NASA and other government agencies haveinvested in other technologies that, although potentially could lead to revolutionaryadvances, are not likely to mature in the next 5 years into working systems.
PCR-based methods cannot distinguish between DNA or Ribonucleic Acid (RNA)of a viable microorganism and that of a non-viable organism. This may or may notbe an important issue with reclaimed water on the ISS. The recycling system
81

probably damages the capacity of the genetic material of any bacteria or viruseskilled during processing to serve as a template in a PCR designed to amplify alarge segment of DNA (>650 pairs). If necessary vital dye staining could be used inaddition to PCR, to enumerate the viable cells in a water sample.
The quality control methods have been developed to ensure that PCRs are workingproperly, and that reactions are not contaminated with PCR carryover productswhich could lead to the generation of false-positive results.
The sequences of the small Ribosomal RNA (rRNA) subunit gene for a largenumber of microorganisms are known, and .they constitute the best database forrational development of the oligonucleotide reagents that give PCR its greatspecificity. From those gene sequences, sets of oligonucleotide primers for PCRand TaqMan detection that could be used in a NASA microbial monitor wereconstructed using computer based methods.
To develop a working microbial monitor using TaqMan PCR that will meet NASA'sneeds for ensuring water quality, work will need to proceed in concert in three differentresearch areas: (1) a small, fully automated instrument with low power needs willneed to be developed. Similar work for other government agencies to develop a PCR-based microbial monitor is being researched; (2) the chemistry and molecular biologyneeded to utilize a probe-hybridization/PCR instrument must evolve in parallel.Otherwise, it would require an additional two years to develop and optimize the PCRprimers and TaqMan probes as well as determine quantitative relationships betweenthe intensity of the TaqMan signal and the number of microorganisms in a sample; and(3) a system of water sample collection and contaminant concentration must bedeveloped, and integrated with the actual monitor.
82

7.0 GENERALTEST SUPPORT TASKS
7.1 Database
The Functional ECLSS Data System (FEDS) was implemented in 1990, and resideson the MINS2 VAX at MSFC. It stores data from all ECLSS testing performed atMSFC, and has supported all test reports for ECLSS hardware produced since thattime. FEDS has served as a powerful analysis tool for the ECLSS hardware designengineers.
FEDS was established to track and maintain all sample schedules, analyses fromindependent labs for chemical and microbial parameters, predetermined parameterspecifications to maintain water quality, sensor data, and analytical control samples.The database provides ECLSS engineers on-line access to analyze data andprovides formatted reports, graphical, and statistical results. Menu driven interfacesallow the user to retrieve data on-line or extract test data to files. Real-time sensor
data recorded during testing is available by downloading to spreadsheet format.
In 1994, a preload program was written to support direct transfer of data from BoeingAnalytical Labs to FEDS, along with specific error-checking routines. This preloadprogram was first used to support WRT Stage 9, which ran from August to December1994. Regenerative testing supported since then includes SFE and LFSPE oxygengenerators. Life testing has been supported constantly since November 1992. Otherspecific testing supported is described in Table 7.1-1. A total of 15,510 records wereadded during 1994 and 1995. A rewrite of the user manual is in work.
Table 7.1-1 Testing Supported by FEDS in 1995
Water Recovery Test (WRT)
• System sterilization in preparation for Stage 9 WRT• Evaluation of the latest water recovery system design for the U.S. On-orbit Segment of
the ISS, 9/15/94 to 4/15/95• Follow on testing to produce condensate for unibed modeling at MTU and to perform a
viral challenge on Water Processor product water, 1/9/95 to 1/30/95• Verify the VCD can process simulated udne (ersatz) planned for processing in a VCD
flight experiment_ 2/27/95 to 4/1/95Subsystem Life Test (LFT)
• Life testing of the TCCS• Life testing of the VCD urine processor• Ufe testing of 4BMS carbon dioxide removal subsystem
Air Revitalization Test (ART)
• Checkout test of the oxygen removal portion of the metabolic simulator• Checkout of the CDRA• Checkout of the CDRA with repacked desiccant beds• Independent performance test of the SFE oxygen generator• Independent performance test of the SPE oxygen generator
Water Degradation Study (WDS)
• Continued Degradation Test #1 with stainless steel and titanium• Degradation study of water exposed to all titanium wetted surfaces
83
7.2 Boeing Analytical Laboratory Support
Boeing analytical laboratory support is essential to perform MSFC's Technical TaskAgreements involving development testing of Space Station air and water systems.Unique capabilities have been enhanced under NASA Contract NAS8-50000,Schedule F, and NAS8-38250. Boeing provided test support for the Stage 9 WaterRecovery Test, Life Testing, and are currently involved in pre-test activities for theupcoming IART.
Analysis and full characterization of water and air samples for both organic andinorganic contaminants involves both standard environmental methods (EPA,Standard Methods, etc.). Unique methods developed by the Boeing laboratoryspecifically for contaminants derived from human metabolic processes and equipmentoff-gassing are established by the MSFC°s Analytical Control Test Plan andMicrobiological Methods for Water Recovery Testing, (Version 3.2). 27 High volumesampling, from several different simultaneous tests, require analysis for numerouschemical and microbial parameters. Strict custody procedures and computerizedsample and data management are in place to ensure and preserve sample identity,traceability, custody, tracking, and data reporting.
Boeing Analytical Services, has been performing this role since 1989. Boeing alsoprovides unique microbiology capabilities established in conjunction with theUniversity of Alabama in Birmingham. The lab has the ability to quickly turn aroundlarge volumes of data utilizing sophisticated instrumentation including a Fatty acidmethyl ester (FAME) Gas Chromatography system used for microbe identification, inaddition to a Vitek Biochemical Identification System, and Biolog CarbohydrateUtilization Identification System.
The Test Subjects for the Stage 9 Water Recovery Test and their physicalexaminations were provided by Boeing. Lab analysis confirmed the acceptability ofthe facility tank water for use by test subjects for hygiene purposes. To enhanceSpace Station waste inputs, Boeing prepared ersatz to simulate animal condensate,equipment off-gassing contaminants, and Crew Health Care System (CHeCS)wastewater. Boeing collected samples from designated ports and completed thespecific analyses listed in the ISS potable water quality specifications (Table 7.2-1).This is necessary to confirm subsystem performance and verify in line sensors suchas the PCWQM. Also, the TOC analysis provided valuable design information relativeto the VRA in the water processor.
In preparation for the IART, Boeing provided the Integrated AR Test team consultation
necessary to establish an on-line GC analysis capability for the AR test utilizing theexisting Hewlett Packard GC previously purchased by Boeing as government property.Boeing supported the test team in equipment set-up, optimization, and calibration;designed an automated sampling system, including method development andverification; maintaining the software, and controls required to operate the instrument;writing a Standard Operating Procedure; and provided training to test personnel in thedaily GC operation.
84

Boeing provided Method development for the SFE to analyze for low levels (ppm) ofhydrogen in product oxygen, acetone, and alcohols, total aldehydes, nitrogen dioxide,ammonia, and carbon monoxide. Methods still under development are halo acids,total fatty acids, and amines. Method development for KOH in 02 was evaluated toanalyze for and quantify aerosol KOH in product oxygen samples from the SFE.
Life testing support included analysis of air and water samples from the TCCS, theVCD urine processor, and the 4BMS. These results provide invaluable data relative tosubsystem performance, and verification of in-line sensor data.
Table 7.2-1 ISS Potable Water Quality Specifications
SpecificationPHYSICAL PARAMETERSTotal Solids (mg/L) 100Color, true (Pt/Co) 15Taste (TTN) 3Odor (TON) 3Particulates (max micron) 40pH 6-8.51Turbidity (NTU) 1Dissolved Gas (free @ 37° C) (a)Free Gas (@ STP) (a)INORGANIC CONSTITUENTS (mg/L)Ammonia 0.5Arsenic 0.01Barium 1.0Cadmium 0.005Calcium 30Chlorine (total) 200Chromium 0.05Copper 1.0Iodine (total) 15Iron 0.3Lead 0.05Magnesium 50Manganese 0.05Mercury 0.002Nickel 0.05NOTES:
SpecificationINORGANIC CONSTITUENTS (continued)Nitrate (NO3-N) 10Potassium 340Selenium 0.01Silver 0.05Sulfate 250Sulfide 0.05Zinc 5.0BACTERICIDE (mg/L)Residual Iodine (min) 1.0Residual Iodine (max) 4.0AESTHETICSCO2 15MICROBIAL
Total Count Bacteria/Fungi 100Total Coliform NDVirus (PFU/100 mL) ND
ORGANIC PARAMETERS (/./g/L) (b)Total Acids 500Cyanide 200Halogenated Hydrocarbons 10Total Phenols 1Total Alcohols 500Total Organic Carbon (TOC) 500Uncharacterized TOC (c) 100
(a) No detectable gas using volumetric gas versus fluid measurement system.aesthetic purposes.
Excludes CO2 used for
(b) Each parameter/constituent MCL must be considered individually and independently of others.(c) Uncharacterized TOC equals TOC minus the sum of analyzed organic constituents expressed inequivalent TOC.
85

8.0 ACKNOWLEDGEMENTS
The authors would like to acknowledge the following people from the MSFCEnvironmental Control and Life Support Branch/ED62 for their contributions: RobynCarrasquillo, Layne Carter, Robert Erickson, Donald Holder, Cindy Hutchens, JamesKnox, Jay Perry, Monsi Roman, Mary Traweek, and Paul Wieland. The authors wouldlike to thank the Development Test Branch/EL63 for their technical contributions, thestaffs of Boeing Laboratory, Computer Science Corporation, and ION Electronics fortheir technical support.
86

9.0
1.
.
o
.
.
.
.
.
.
10.
11.
12.
REFERENCES
Space Station Water Processor Process Pump Final Report, SVHSER 16990,Hamilton Standard, Contract # NAS8-38250-12, July 14, 1995.
Space Station Water Processor Mostly Liquid Separator (MLS) Final Report,SVHSER 16991, Hamilton Standard, Contract # NAS8-38250-12, July 14,1995.
Procurement of the Space Station Water Processor Volatile Removal Assembly(VRA) Reactor, Technical/Management Volume 1, HSPC 93T35, HamiltonStandard, Contract # NAS8-38250-16, November 1993.
Final Test Report for Urine Pretreat Injection System, SVHSER-17066 Rev. A,Hamilton Standard, Contract # NAS8-38250-28, August 1995.
International Space Station Environmental Control and Life Support SystemPhase III Water Recovery Test Stage 9 Final Report, NASA TM-108498, D.L.Carter, D.W Holder, and C.F. Hutchens, September 1995.
Development of the Multifiltration Bed Model for the International Space StationPotable Water System - Phase I Report, ION8-38250-27, D.W. Hand, J.L.Bulloch, D.R. Hokanson, B.L. Clancey, and J.C. Crittenden, MichiganTechnological University, Contract # NAS8-38250-27.
PHASE I Final Report for VRA Modeling, ION8-38250-18FR, L.M. Kindt, M.E.Mullins, D.W. Hand, and A.Ao Kline, Michigan Technological University,Contract # NAS8-38250-18.
Environmental Control and Life Support Systems Life Test QuarterlyReports #1 - #10, C. Chiu, B. Salyer, and J. Tatara, ION Electronics, Contract# NAS8-38250, July 1993 - December 1995.
Test Plan - Microbial Check Valve (MCV) Life Test, ION Electronics, Contract #NAS8-38250, June 23, 1994.
Interim Report on the Space Station Water Degradation Study Covering theFirst 24 Months of Exposure, NASA TM-108499, P.S. McRight and M.C. Roman,September 1995.
Preliminary Design Program Final Report,Flight Experiment Program, TR-1738-3,# NAS8-38250-11, May 22, 1995.
Vapor Compression DistillationLife Systems, Inc., Contract
Enhanced Urine Ersatz Development and Testing Final Report, TR-1738-43,M.T. Andras, F.H. Schubert, Life Systems, Inc., Contract # NAS8-38250-11,August 31, 1995.
87

13.
14.
15.
16.
17.
18.
19.
20.
21.
22.
23.
24.
25.
International Space Station TCCS Catalyst Poisoning Investigation(Presentation Material), J. Tatara, ION Electronics, Contract # NAS8-38250.
Refurbishment of SFE-VIA Monthly Progress Reports, Life Systems, Inc.,Contract # NAS8-38250-21, May 9, 1994 - present.
Final Report for the SPE® Oxygen Generator Assembly (OGA) (Refurbishmentof the Technology Demonstrator LFSPE Oxygen Generation Subsystem),SPEOGA-38250-23FR, Hamilton Standard, Contract # NAS8-38250-23, July1995.
Requirements for Space StationSystem Integrated AtmosphereCarrasquillo, November 1994.
EnvironmentalRevitalization
Control and Life SupportTest, Revision B, R.L.
Analysis of IML and SLJ Spacelab Charcoal for Target and Non-Target OrganicCompounds, Preliminary Report, ION8-38250-06, Battelle Memorial Institute,Contract # NAS8-38250-06, August 5, 1993.
Spacelab Charcoal Analyses- Phase II, Final Report, ION8-38250-14FR,Battelle Memorial Institute, Contract # NAS8-38250-14, January 20, 1995.
Molecular Sieve Bench Testing and Computer Modeling Final Report,MDC 95W5104, McDonnell Douglas Aerospace - Huntsville, Contract# NAS8-38250-17, September 1995.
Single Component Isotherm Data for International Space Station CDRASorbent Materials, J. Knox, ED62(82-95), MSFC, November 1995.
Computer Aided System Engineering and Analysis (CASE/A) User's Manual -ECLSS Series, MDC W5074-5, McDonnell Douglas Space Systems Company,Huntsville Division, October 1990.
International Space Station Alpha Trace Contaminant Control SubassemblyLife Test Final Report, NASA TM-108488, J. Tatara and J. Perry, March 1995.
Preliminary Design Program Final Report - Static Feed Electrolyzer FlightExperiment Program, TR-1723-20, Life Systems, Inc., Contract #NAS8-38250-29, February 24, 1995.
Assessment of Microbial Degradation of Space Station Materials, Report ofTask A, ION8-TASK A-06/95, Altran Materials Engineering, Inc., Contract #NAS8-38250-20, June 1995.
Assessment of Microbial Degradation of Space Station Materials, Report ofTask B, ION8-38250-20, Altran Materials Engineering, Inc., Contract #NAS8-38250-20, August 1995.
88

26.
27.
Polymerase Chain Reaction (PCR) Based Microbial Monitor for Analysis ofRecycled Water the International Space Station: Issues and Prosects, FinalReport, ION8-38250 FR 7/5, G.H. Cassell, J.I. Glass, E.J. Lefkowitz, J. Barbaree,and J.J. Gauthier, Universtiy of Alabama at Birmingham, NAS8-38250-2695,July 1995.
Analytical Control Test Plan and Microbiological Methods for the WaterRecovery Test, NASA TM-108473, M.S. Traweek and J.D. Tatara, editors,December 1994.
89

Approval
International Space Station ECLSSTechnical Task Agreement Summary Report
Compiled by: Charles D. Ray and Silvia Minton-Summers
The information in this document has been reviewed for technical content. Review ofany information concerning Department of Defense or nuclear enerqy activities orprograms has been made by the MSFC Security Classification Officer. l'his document,in its entirety, has been determined to be unclassified•
Chief, ECLS Branch
J.V_. Owen
Chief, Thermal and Life Support DivisionDate
J._ Blair
Director, Structures and Dynamics LaboratoryDate


REPORT DOCUMENTATION PAGE FormApprovedOMB No. 0704-0188
Public_=_.,_lngburdenIortht,,c.:.1_,_t_;,nd Inlu,,,,,=;;onb eetlmatedto average1 hourper response,includingthe timefor reviewingImdructio_%wuchlng exlatlng dataeource%gatheringand maintainingthe dataneeded,and oornpleUngand Nwiewtngthe oolieofior=of Information.Sendoomrnent=regardingthisburdenelllmate or anyotheraspectof this¢ctlectionof Information,includingsuggeltionefor reducingthieburden,toWashingtonHeadquadersServices,Directoratefor InformationOperations end Re xx'ts, 1215JeffereonDavis Highway,Suite 1204, Arlington,Va 22202-4802, and tothe Office of ManagementandBudget,PaperworkReductionProject(0704-0188),Waahlngton,DC 20503.
1. AGENCY USE ONLY (Leave Blank) 12. REPORT DATE 13. REPORT TYPE AND DATES COVEREDMay 1996 Technical Memorandum
4. TITLE AND SUBII I LE 5. FUNDING NUMBERS
International Space Station ECLSS Technical Task Agreement
Summary Report
6. AUTHOR(S)
C. D. Ray and S. Minton-Summers, Compilers
7. PERFORMING ORGANIZATION NAME(S) AND ADDRESS(ES)
George C. Marshall Space Flight Center
Marshall Space Flight Center, Alabama 35812
9. SPONSORING/MONITORING AGENCY NAME(S) AND ADDRESS(ES)
National Aeronautics and Space Administration
Washington, D.C. 20546
11. SUPPLEMENTARY NOTES
8. PERFORMING ORGANIZATON
REPORT NUMBERS
10. SPONSORING/MONITORING
AGENCY REPORT NUMBER
NASA TM-I08508
Prepared by Structures and Dynamics Laboratory, Science and Engineering Directorate
12a. DISTRIBUTION_V_LABILITYSTATEMENT
Unclassified-Unlimited
12b. DISTRIBUTION CODE
13. ABSTRACT (Maximum 200 words)
A summary of work accomplished under Technical Task Agreement by the Marshall Space
Flight Center (MSFC) documents activities regarding the Environmental Control and Life
Support Systems (ECLSS) of the International Space Station (ISS) program. These MSFC
activities were in-line to the designing, the development, the testing, and the flight of
ECLSS equipment. MSFC's unique capabilities for performing integrated system testing and
analyses, and its ability to perform some tasks cheaper and faster to support ISS program
needs are the basis for the Technical Task Agreement activities. Tasks were completed in
the Water Recovery Systems, Air Revitalization Systems, and microbiology areas. The
results of each task is described in this summary report.
14 SU_ECTI_HMS Environmental Control, ECLSS, International Space
Station, ISS, Water Recovery Test, WRT, Air Revitalization, IART,
Microbiology Technical Task Agreement, TTA
17. SECURITY CLASSIFICATION
Unclassified
NSN 7540 - 01 - 280 - 5500
18. SECURITY CLASSIFICATIO N
OF THIS PAGE
Unclassified
19. SECURITY CLASSIFICATION
OF ABSTRACT
Unclassified
15. NUMBER OF PAGES
103
16. PRICE CODE
NTIS
20. LIMITATION OF ABSTRACT
Unlimited
Standard Form 298 (Rev 2-89)
Mac-Computer Generated Preealbed by ANSI Std. 239-18

National Aeronautics and
Space Administration
Code JTT
Washington, DC20546-0001
Official Business
Penalty for Private Use, $300
Postmaster: If Undeliverable (Section 158 Postal Manual), Do Not Return