international stormwater best management practices (bmp ...bmpdatabase.org › docs › 2012 water...
TRANSCRIPT

International Stormwater Best Management Practices (BMP) Database
Pollutant Category Summary Statistical Addendum:
TSS, Bacteria, Nutrients, and Metals
Prepared by
Geosyntec Consultants, Inc. Wright Water Engineers, Inc.
Under Support From
Water Environment Research Foundation Federal Highway Administration
Environment and Water Resources Institute of the American Society of Civil Engineers
July 2012

International Stormwater BMP Database
Pollutant Category Summary Addendum Page ii July 2012
Disclaimer The BMP Database (“Database”) was developed as an account of work sponsored by the Water Environment Research Foundation (WERF), the American Society of Civil Engineers (ASCE)/Environmental and Water Resources Institute (EWRI), the American Public Works Association (APWA), the Federal Highway Administration (FHWA), and U.S. Environmental Protection Agency (USEPA) (collectively, the “Sponsors”). The Database is intended to provide a consistent and scientifically defensible set of data on Best Management Practice (“BMP”) designs and related performance. Although the individuals who completed the work on behalf of the Sponsors (“Project Team”) made an extensive effort to assess the quality of the data entered for consistency and accuracy, the Database information and/or any analysis results are provided on an “AS-IS” basis and use of the Database, the data information, or any apparatus, method, or process disclosed in the Database is at the user’s sole risk. The Sponsors and the Project Team disclaim all warranties and/or conditions of any kind, express or implied, including, but not limited to any warranties or conditions of title, non-infringement of a third party’s intellectual property, merchantability, satisfactory quality, or fitness for a particular purpose. The Project Team does not warrant that the functions contained in the Database will meet the user’s requirements or that the operation of the Database will be uninterrupted or error free, or that any defects in the Database will be corrected.
UNDER NO CIRCUMSTANCES, INCLUDING CLAIMS OF NEGLIGENCE, SHALL THE SPONSORS OR THE PROJECT TEAM MEMBERS BE LIABLE FOR ANY DIRECT, INDIRECT, INCIDENTAL, SPECIAL, OR CONSEQUENTIAL DAMAGES INCLUDING LOST REVENUE, PROFIT OR DATA, WHETHER IN AN ACTION IN CONTRACT OR TORT ARISING OUT OF OR RELATING TO THE USE OF OR INABILITY TO USE THE DATABASE, EVEN IF THE SPONSORS OR THE PROJECT TEAM HAVE BEEN ADVISED OF THE POSSIBILITY OF SUCH DAMAGES.
The Project Team’s tasks have not included, and will not include in the future, recommendations of one BMP type over another. However, the Project Team's tasks have included reporting on the performance characteristics of BMPs based upon the entered data and information in the Database, including peer reviewed performance assessment techniques. Use of this information by the public or private sector is beyond the Project Team’s influence or control. The intended purpose of the Database is to provide a data exchange tool that permits characterization of BMPs solely upon their measured performance using consistent protocols for measurements and reporting information.
The Project Team does not endorse any BMP over another and any assessments of performance by others should not be interpreted or reported as the recommendations of the Project Team or the Sponsors.

International Stormwater BMP Database
Pollutant Category Summary Addendum Page iii July 2012
Acknowledgements
Report Preparation1 Primary Authors:
Marc Leisenring, P.E., Geosyntec Consultants, Inc. Jane Clary, Wright Water Engineers, Inc. Paul Hobson, Geosyntec Consultants, Inc.
Reviewers:
Eric Strecker, P.E., Geosyntec Consultants, Inc. Jonathan Jones, P.E., D.WRE, Wright Water Engineers, Inc. Marcus Quigley, P.E., D.WRE, Geosyntec Consultants, Inc.
Project Information WERF Project Director: Jeff Moeller, P.E., Water Environment Research Foundation Principal Investigators: Eric Strecker, P.E., Geosyntec Consultants, Inc. Jonathan Jones, P.E., D.WRE, Wright Water Engineers, Inc. Project Steering Committee: Susan Jones, P.E., Federal Highway Administration Christopher Kloss, P.E., Office of Water/Office of Science & Technology, U.S. Environmental
Protection Agency Brian Parsons, P.E., Environmental and Water Resources Institute of American Society of Civil
Engineers Marcel Tchaou, Ph.D., P.E., P.H., MBA, Federal Highway Administration Office of Project
Development and Environmental Review Courtney Thompson, American Public Works Association
Project Subcommittee: Michael E. Barrett, Ph.D., P.E., D.WRE, Center for Research in Water Resources, University of
Texas Bob Carr, P.E., O’Brien and Gere David R. Graves, CPESC, Environmental Science Bureau, New York State Dept. of
Transportation Gregory E. Granato, U.S. Geological Survey Jesse Pritts, P.E., Engineering and Analysis Division Office of Water/Office of Science &
Technology, U.S. Environmental Protection Agency
1 Contact Jane Clary ([email protected]) or Marc Leisenring ([email protected]) with questions regarding this summary.

International Stormwater BMP Database
Pollutant Category Summary Addendum Page iv July 2012
Table of Contents 1 INTRODUCTION .......................................................................................................... 1
2 CATEGORY-LEVEL BMP ANALYSIS................................................................................ 2
2.1 TOTAL SUPENDED SOLIDS ............................................................................................... 5 2.2 BACTERIA ........................................................................................................................ 6
2.2.1 Enterococcus ............................................................................................................... 6 2.2.2 Escherichia coli ............................................................................................................ 7 2.2.3 Fecal Coliform ............................................................................................................. 8
2.3 METALS ........................................................................................................................... 9 2.3.1 Arsenic ......................................................................................................................... 9 2.3.2 Cadmium ................................................................................................................... 11 2.3.3 Chromium .................................................................................................................. 13 2.3.4 Copper ....................................................................................................................... 15 2.3.5 Iron ............................................................................................................................ 17 2.3.6 Lead ........................................................................................................................... 19 2.3.7 Nickel ......................................................................................................................... 21 2.3.8 Zinc ............................................................................................................................ 24
2.4 NUTRIENTS .................................................................................................................... 25 2.4.1 Phosphorus ................................................................................................................ 25 2.4.2 Nitrogen .................................................................................................................... 28
3 REFERENCES ............................................................................................................. 31
4 ATTACHMENTS ......................................................................................................... 31

Pollutant Category Summary Addendum Page 1 March 2012
1 INTRODUCTION In 2010, the Water Environment Research Foundation (WERF), Federal Highway Administration (FHWA), and the American Society of Civil Engineers’ Environmental and Water Resources Institute (EWRI) co-sponsored a comprehensive stormwater best management practice (BMP) performance analysis technical paper series relying on data contained in the International Stormwater BMP Database (BMPDB) .2 This series, published in 2011, included papers for solids, bacteria, nutrients, and metals, with each paper summarizing the regulatory context of the constituent category, primary sources, fate and transport processes, removal mechanisms, and statistical summaries of BMP performance for data contained in the BMPDB. This report is an update of the statistical summaries provided in that series to include the data from over 50 new studies added to the database in late 2011 after the publication of the series. This report is not intended to replace the discussion of the previous technical papers because only the statistical summaries are included here. Constituents summarized in this report are listed in Table 1.
Table 1. Constituents Summarized by Pollutant Category Pollutant Category Summarized Constituent Solids Total suspended solids (TSS) Bacteria Fecal coliform
Escherichia coli (E. coli) Enterococcus
Metals Arsenic (total and dissolved) Cadmium (total and dissolved) Chromium (total and dissolved) Copper (total and dissolved) Iron (total and dissolved) Lead (total and dissolved) Nickel (total and dissolved) Zinc (total and dissolved)
Nutrients Total phosphorus Orthophosphate Dissolved phosphorus Total nitrogen Total Kjeldahl nitrogen (TKN) Nitrate plus nitrite (NOx)
2 The BMP Database is a long-term project that began in 1994 through the vision of members active in the Urban Water Resources Research Council of ASCE and the leadership of EPA. Funded for many years by EPA, the project is now supported by a coalition of partners including WERF, FHWA, EWRI and the American Public Works Association (APWA). The technical reports can be downloaded from www.bmpdatabase.org/BMPPerformance.htm.

International Stormwater BMP Database
Pollutant Category Summary Addendum Page 2 July 2012
2 CATEGORY-LEVEL BMP ANALYSIS An overview of BMP performance for the analyzed constituents is provided in the subsections 2.1 to 2.4 below. The analyses were based upon the distributions of effluent water quality for individual events by BMP category, thereby providing greater weight to those BMPs for which there are a larger number of data points reported. In other words, the performance analysis presented in this technical summary is “storm-weighted,” as opposed to “BMP weighted.”3 This update does not include BMP weighted analyses (i.e., analyses of individual study site central tendencies). The BMP categories included in this analysis are grass strips, bioretention, bioswales, composite/treatment train BMPs, detention basins (surface/grass-lined), green roofs, manufactured devices, media filters, porous pavement, retention ponds (surface pond with a permanent pool), wetland basins (basins with open water surface), and wetland channels (swales and channels with wetland vegetation). Note that for bacteria, manufactured devices are broken down into three subcategories: disinfection devices (Manufactured Device – D), inlet insert/filtration (Manufactured Device – F), and physical settling/straining devices (Manufactured Device – P).4 The effectiveness and range of unit treatment processes present in a particular BMP may vary depending on the BMP design. Several other BMP categories and sub-classes are included in the database, but these have been excluded from this analysis due to limited data sets available for meaningful categorical comparisons. To be included in this category-level summary, at least three BMPs must be included in the BMP category, with each BMP having effluent data for at least three storms. A variety of additional screening criteria are applied for purposes of category-level analysis to make sure that the data sets and BMP designs are reasonably representative, as documented in the “Monitoring Station” table of the BMP Database, which can be downloaded from www.bmpdatabase.org. Poor performance of a BMP is not a reason for data exclusion. In the subsections below, side-by-side box plots for the various BMPs measurements have been generated using the influent and effluent concentrations from the studies. For each BMP 3 There are several viable approaches to evaluating data in the BMP Database. Two general approaches that have been presented in the past (Geosyntec Consultants and Wright Water Engineers, 2008) are the “BMP-weighted” and “storm-weighted” approaches. The BMP-weighted approach represents each BMP with one value representing the central tendency and variability of each individual BMP study, whereas the storm-weighted approach combines all of the storm events for the BMPs in each category and analyzes the overall storm-based data set. The storm-weighted approach has been selected for this memorandum as it provides a much larger data set for analysis. 4 A separate technical summary for manufactured devices (Geosyntec and Wright Water Engineers, 2012) was also released in July 2012 providing a more detailed analysis of manufactured device subcategories based on unit treatment processes. See www.bmpdatabase.org to download this analysis.
Figure 1. Box Plot Key

International Stormwater BMP Database
Pollutant Category Summary Addendum Page 3 July 2012
category, the influent box plots are provided on the left and the effluent box plots are provided on the right. A key to the box plots is provided in Figure 4. In addition to the box plots, tables of influent/effluent medians, 25th and 75th percentiles, and number of studies and data points are provided, along with 95% confidence intervals about the medians. The median and interquartile ranges were selected as descriptive statistics for BMP performance because they are non-parametric (do not require distributional assumptions for the underlying data set) and are less affected by extreme values than means and standard deviations. Additionally, the median is less affected by assumptions regarding values below detection limits and varying detection limits for studies conducted by independent parties over many years. However, confidence intervals about the median can still be affected by outliers if simple substitution is used. Therefore, a robust regression-on-order statistics (ROS) method as described by Helsel and Cohn (1988) was utilized to provide probabilistic estimates of non-detects before computing descriptive statistics. Despite use of this robust method, conclusions regarding BMP performance should carefully consider the influence of large percentages of non-detects. The number of influent and effluent non-detects should be reviewed before making conclusions, particularly for dissolved metals where non-detects are most prevalent. For more information on the influence of non-detects on dissolved metals data in the BMP Database, see the discussion in the Metals Technical Summary (Wright Water Engineers and Geosyntec, 2011), accessible at www.bmpdatabase.org). Confidence intervals in the figures and tables were generated using the bias corrected and accelerated (BCa) bootstrap method described by Efron and Tibishirani (1993). This method is a robust approach for computing confidence intervals that is resistant to outliers and does not require any restrictive distributional assumptions. Due to random sampling that is conducted as part of this method, insignificant variations in the results may occur and is the cause of any inconsistencies between the values in the attachments and the tables presented below. Comparison of the confidence intervals about the influent and effluent medians can be used to roughly identify statistically significant differences between the central tendencies of the data. However, non-parametric hypothesis tests, such as the Mann-Whitney rank sum test or the Wilcoxon signed-rank test, can provide additional and more robust results for evaluating significant differences between medians. The Mann-Whitney test applies to independent data sets, whereas the Wilcoxon test applies to paired data sets (Helsel and Hirsch, 1992). Results of these tests are provided in the attached statistical summary reports for TSS, bacteria, metals, and nutrients. In some cases, the Mann-Whitney and Wilcoxon hypothesis test results produce conflicting conclusions regarding statistically significant differences. Such cases are more likely to occur where there are imbalances in the number of influent and effluent samples for a particular data set since the Mann-Whitney test operates on the entire data set, whereas the Wilcoxon test only operates on data pairs. In the summary tables which follow, effluent values in bold green indicate the upper 95% confidence interval of the effluent median is less than the lower 95% confidence interval of the influent median. Effluent values in red bold italics indicate the lower 95% confidence interval of the effluent median is greater than the upper 95% confidence interval of the influent median. BMP categories with summary statistics in grey indicate that there are less than three studies with either influent or effluent data available – these statistics should be used with caution due to

International Stormwater BMP Database
Pollutant Category Summary Addendum Page 4 July 2012
the limited data available. In some cases, the retention ponds and wetland basin categories have been combined into a single category to provide more than three studies. Values with no color italic emphasis indicate the influent and effluent intervals overlap. Be aware that for some BMP types, a statistically significant difference between influent and effluent concentrations may not be present, but the effluent concentrations achieved by the BMP are relatively low and may be comparable to the performance of other BMPs that have statistically significant differences between inflow and outflow. For example, data sets that have low influent concentrations and similarly low effluent concentration (i.e., clean water in = clean water out) may not show statistically significant differences. However this does not necessarily imply that the BMP would not have been effective at higher influent concentrations.

International Stormwater BMP Database
Pollutant Category Summary Addendum Page 5 July 2012
2.1 Total Supended Solids Figure 2. Box Plots of Influent/Effluent TSS Concentrations
Table 2. Influent/Effluent Summary Statistics for TSS (mg/L)
BMP Type Count of Studies
and EMCs 25th Percentile Median (95% Conf. Interval)* 75th Percentile
In Out In Out In Out In Out Grass Strip 19, 350 20, 286 19.3 10.0 43.1 (36.0, 45.0) 19.1 (16.0, 21.5)** 88.0 35.0 Bioretention 14, 202 14, 193 18.0 3.8 37.5 (29.2, 45.0) 8.3 (5.0, 9.0)** 87.8 16.0 Bioswale 21, 338 23, 354 8.00 5.12 21.7 (16.2, 26.0) 13.6 (11.8, 15.3)** 56.0 33.0 Composite 10, 201 10, 163 40.3 8.0 94.0 (76.2, 107) 17.4 (12.4, 18.8)** 184.0 34.0 Detention Basin 20, 278 21, 299 24.2 11.3 66.8 (52.3, 76.1) 24.2 (19.0, 26.0)** 121.0 46.5 Green Roof 2, 20 4, 51 1.44 0.89 10.5 (1.13, 14.5) 2.9 (1.0, 3.5) 20.5 8.0 Manufactured Device 55, 923 63, 904 12.0 6.0 34.5 (30.0, 36.8) 18.4 (15.0, 19.9)** 93.0 45.0 Media Filter 28, 442 29, 409 26.2 4.0 52.7 (45.9, 58.2) 8.7 (7.4, 10.0)** 112.0 22.0 Porous Pavement 14, 246 23, 406 18.3 7.08 65.3 (45.0, 80.3) 13.2 (11.0, 14.4)** 186.7 27.0 Retention Pond 47, 725 48, 723 20.7 5.72 70.7 (59.0, 79.0) 13.5 (12.0, 15.0)** 180.0 33.0 Wetland Basin 15, 301 17, 305 9.4 2.36 20.4 (16.6, 24.4) 9.06 (7.0, 10.9)** 54.4 19.5 Wetland Channel 8, 189 8, 154 12.0 8.0 20.0 (17.0, 22.0) 14.3 (10.0, 16.0)** 66.0 27.0
*Computed using the BCa bootstrap method described by Efron and Tibishirani (1993) **Hypothesis testing in Attachment 2 shows statistically significant decreases for this BMP category.

International Stormwater BMP Database
Pollutant Category Summary Addendum Page 6 July 2012
2.2 Bacteria
2.2.1 Enterococcus
Figure 3. Box Plots of Influent/Effluent Enterococcus Concentrations
Table 3. Influent/Effluent Summary Statistics for Enterococcus (#/100 mL)
BMP Type Count of Studies
and EMCs 25th
Percentile Median (95% Conf. Interval*) 75th Percentile
In Out In Out In Out In Out
Grass Strip NA NA NA NA NA NA NA NA Bioretention 3, 48 3, 49 178 32 605 (225, 922) 234 (58, 437)** 2440 2190 Bioswale NA NA NA NA NA NA NA NA Composite NA NA NA NA NA NA NA NA Detention Basin NA NA NA NA NA NA NA NA Green Roof NA NA NA NA NA NA NA NA Manufactured Device-D 1, 33 1, 32 240 10 911 (500, 1700) 10 (10, 10)** 1700 10 Manufactured Device-F 5, 48 5, 46 573 1340 4130 (1000, 8000) 6890 (1750, 12000) 25500 29500 Manufactured Device-P NA NA NA NA NA NA NA NA Media Filter NA NA NA NA NA NA NA NA Retention Pond NA NA NA NA NA NA NA NA Retention Pond or Wetland Basin 5, 78 5, 78 186 20 615 (248, 1110) 153 (56, 300)** 2770 1630
Wetland Basin NA NA NA NA NA NA NA NA *Computed using the BCa bootstrap method described by Efron and Tibishirani (1993) **Hypothesis testing in Attachment 2 shows statistically significant decreases for this BMP category.

International Stormwater BMP Database
Pollutant Category Summary Addendum Page 7 July 2012
2.2.2 Escherichia coli
Figure 4. Box Plots of Influent/Effluent E. coli Concentrations
Table 4. Influent/Effluent Summary Statistics for E. coli (#/100 mL)
BMP Type Count of Studies
and EMCs 25th
Percentile Median (95% Conf. Interval*) 75th Percentile
In Out In Out In Out In Out
Grass Strip NA NA NA NA NA NA NA NA Bioretention 3, 54 3, 54 42 5 150 (50, 210) 44 (6, 137) 1820 965 Bioswale 5, 39 5, 39 295 1200 3990 (200, 5600) 4190 (1200, 5900) 11000 10000 Composite NA NA NA NA NA NA NA NA Detention Basin 3, 32 3, 32 398 60 1300 (460, 1990) 429 (82, 720)** 12600 1880 Green Roof 1, 6 3, 39 8 5 232 (1, 550) 16 (5, 48) 5.0 61 Manufactured Device-D NA NA NA NA NA NA NA NA Manufactured Device-F NA NA NA NA NA NA NA NA Manufactured Device-P NA NA NA NA NA NA NA NA Media Filter NA NA NA NA NA NA NA NA Retention Pond 4, 68 4, 69 607 10 2800 (1350, 4300) 150 (31, 387)** 17500 800 Wetland Basin 3, 42 3, 42 257 65 785 (363, 1350) 632 (199, 1160) 2510 3580
*Computed using the BCa bootstrap method described by Efron and Tibishirani (1993) **Hypothesis testing in Attachment 2 shows statistically significant decreases for this BMP category.

International Stormwater BMP Database
Pollutant Category Summary Addendum Page 8 July 2012
2.2.3 Fecal Coliform
Figure 5. Box Plots of Influent/Effluent Fecal Coliform Concentrations
Table 5. Influent/Effluent Summary Statistics for Fecal Coliform (#/100 mL)
BMP Type Count of Studies
and EMCs 25th
Percentile Median (95% Conf. Interval*) 75th Percentile
In Out In Out In Out In Out
Grass Strip 2, 14 2, 13 2090 2300 32000 (1450, 91700) 23200 (300,39600) 145000 97200 Bioretention NA NA NA NA NA NA NA NA Bioswale 10, 79 10, 79 1400 1900 4720 (2120, 5500) 5000 (2600, 6200) 20300 18500 Composite 4, 56 5, 49 4320 2640 13500 (7740, 18300) 11200 (6590, 16000) 36700 20600 Detention Basin 13, 139 14, 170 300 78 1480 (789, 1900) 1030 (500, 1900) 7520 8720 Green Roof NA NA NA NA NA NA NA NA Manufactured Device-D 1, 33 1, 32 300 10 1190 (300, 3000) 12 (10, 20) 3000 20 Manufactured Device-F 5, 45 5, 48 200 200 478 (200, 1300) 1890 (200, 3000) 3000 5000 Manufactured Device-P 5, 59 5, 59 500 752 2210 (900, 3000) 2750 (1400, 5000) 8080 11000 Media Filter 19, 191 20, 185 200 110 1350 (725, 2300) 542 (200, 625)** 10900 5000 Retention Pond 11, 102 12, 129 150 30 1920 (970, 2650) 707 (200, 1160)** 7520 5000 Wetland Basin 5, 37 5, 29 3780 230 13000 (5080, 21000) 6140 (230, 11800) 25100 20600
*Computed using the BCa bootstrap method described by Efron and Tibishirani (1993) **Hypothesis testing in Attachment 2 shows statistically significant decreases for this BMP category.

International Stormwater BMP Database
Pollutant Category Summary Addendum Page 9 July 2012
2.3 Metals
2.3.1 Arsenic
Figure 6. Box Plots of Influent/Effluent Dissolved Arsenic Concentrations
Table 6. Influent/Effluent Summary Statistics for Dissolved Arsenic (µg/L)
BMP Type Count of Studies
and EMCs 25th
Percentile Median (95% Conf. Interval*) 75th Percentile
In Out In Out In Out In Out
Grass Strip 12, 220 12, 152 0.17 0.24 0.61 (0.46, 0.70) 0.64 (0.50, 0.80) 1.10 2.10 Bioretention NA NA NA NA NA NA NA NA Bioswale 8, 45 8, 37 0.50 0.50 0.60 (0.50, 0.70) 0.60 (0.50, 0.66) 1.70 0.85 Composite NA NA NA NA NA NA NA NA Detention Basin 5, 44 5, 42 0.60 0.63 1.04 (0.77, 1.20) 1.04 (0.80, 1.20) 1.30 1.30 Green Roof 1, 6 3, 29 0.16 0.57 0.23 (0.06, 0.28) 0.84 (0.62, 0.95) 0.27 1.09 Manufactured Device 2, 28 8, 55 0.50 0.75 0.98 (0.50, 1.00) 1.02 (1.00, 1.20) 1.2 2.40 Media Filter 12, 123 12, 119 0.31 0.41 0.53 (0.50, 0.63) 0.62 (0.50, 0.70) 1.50 1.25 Porous Pavement NA NA NA NA NA NA NA NA Retention Pond NA NA NA NA NA NA NA NA Wetland Basin NA NA NA NA NA NA NA NA Wetland Channel NA NA NA NA NA NA NA NA
*Computed using the BCa bootstrap method described by Efron and Tibishirani (1993)

International Stormwater BMP Database
Pollutant Category Summary Addendum Page 10 July 2012
Figure 7. Box Plots of Influent/Effluent Total Arsenic Concentrations
Table 7. Influent/Effluent Summary Statistics for Total Arsenic (µg/L)
BMP Type Count of Studies
and EMCs 25th
Percentile Median (95% Conf. Interval*) 75th Percentile
In Out In Out In Out In Out
Grass Strip 12, 220 12, 153 0.32 0.36 1.04 (0.65, 1.10) 0.94 (0.55, 1.20) 2 2.50 Bioretention NA NA NA NA NA NA NA NA Bioswale 8, 44 8, 37 1.07 0.60 1.68 (1.30, 1.81) 1.17 (0.95, 1.30)** 2.65 2.10 Composite NA NA NA NA NA NA NA NA Detention Basin 6, 62 6, 56 1.70 1.20 2.21 (1.89, 2.50) 1.78 (1.29, 1.80)** 2.98 2.32 Green Roof 1, 6 3, 29 0.12 0.60 0.22 (0.05, 0.26) 0.89 (0.65, 1.17) 0.26 1.36 Manufactured Device 2, 28 8, 55 0.68 1.00 1.02 (0.95, 1.30) 1.63 (1.00, 2.40) 1.0 3.65 Media Filter 12, 123 12, 119 0.54 0.50 1.01 (0.75, 1.20) 0.87 (0.61, 1.00) 2.07 1.65 Porous Pavement**** 3, 111 3, 105 2.50 2.50 2.50 (2.50, 2.50) 2.50 (2.50, 2.50) 2.50 2.50 Retention Pond 3, 25 3, 24 1.00 0.50 1.36 (1.00, 1.80) 0.85 (0.54, 1.15)** 2 1.41 Wetland Basin NA NA NA NA NA NA NA NA Wetland Channel NA NA NA NA NA NA NA NA
*Computed using the BCa bootstrap method described by Efron and Tibishirani (1993) **Hypothesis testing in Attachment 3 shows statistically significant decreases for this BMP category. ****Conclusions are limited for this BMP category due to a large percentage of non-detects in the influent.
International Stormwater BMP Database
Pollutant Category Summary Addendum Page 11 July 2012
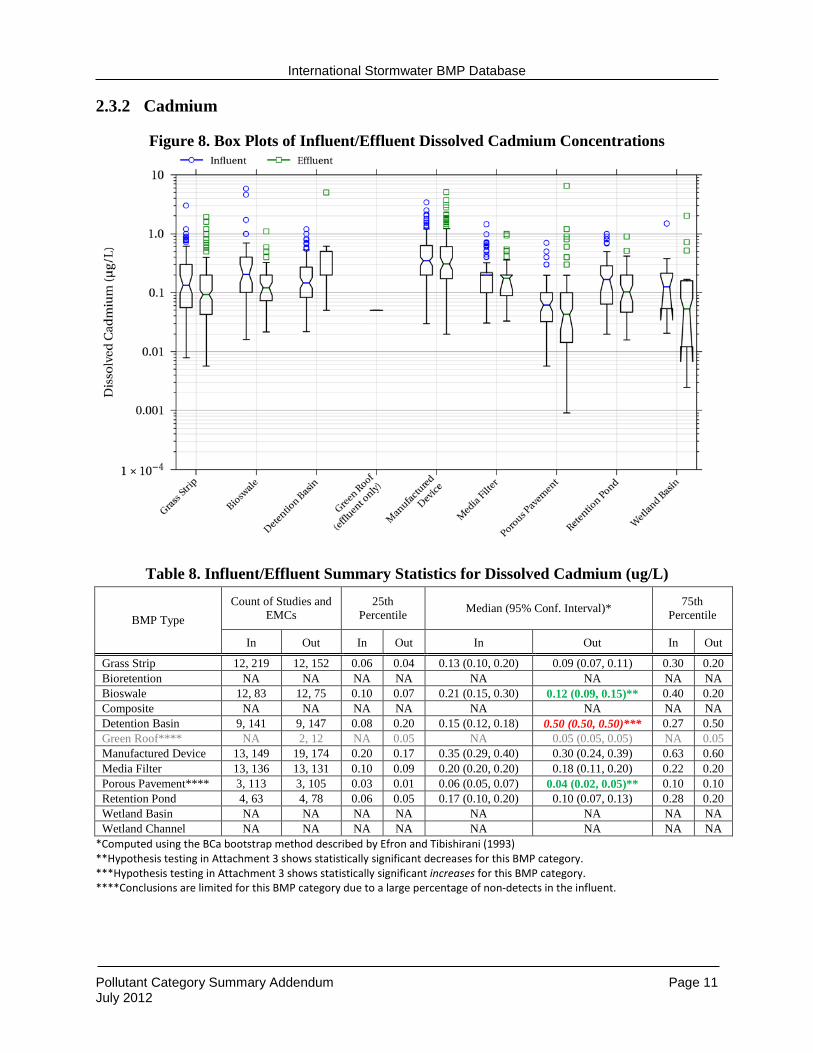
2.3.2 Cadmium
Figure 8. Box Plots of Influent/Effluent Dissolved Cadmium Concentrations
Table 8. Influent/Effluent Summary Statistics for Dissolved Cadmium (ug/L)
BMP Type Count of Studies and
EMCs 25th
Percentile Median (95% Conf. Interval)* 75th Percentile
In Out In Out In Out In Out
Grass Strip 12, 219 12, 152 0.06 0.04 0.13 (0.10, 0.20) 0.09 (0.07, 0.11) 0.30 0.20 Bioretention NA NA NA NA NA NA NA NA Bioswale 12, 83 12, 75 0.10 0.07 0.21 (0.15, 0.30) 0.12 (0.09, 0.15)** 0.40 0.20 Composite NA NA NA NA NA NA NA NA Detention Basin 9, 141 9, 147 0.08 0.20 0.15 (0.12, 0.18) 0.50 (0.50, 0.50)*** 0.27 0.50 Green Roof**** NA 2, 12 NA 0.05 NA 0.05 (0.05, 0.05) NA 0.05 Manufactured Device 13, 149 19, 174 0.20 0.17 0.35 (0.29, 0.40) 0.30 (0.24, 0.39) 0.63 0.60 Media Filter 13, 136 13, 131 0.10 0.09 0.20 (0.20, 0.20) 0.18 (0.11, 0.20) 0.22 0.20 Porous Pavement**** 3, 113 3, 105 0.03 0.01 0.06 (0.05, 0.07) 0.04 (0.02, 0.05)** 0.10 0.10 Retention Pond 4, 63 4, 78 0.06 0.05 0.17 (0.10, 0.20) 0.10 (0.07, 0.13) 0.28 0.20 Wetland Basin NA NA NA NA NA NA NA NA Wetland Channel NA NA NA NA NA NA NA NA
*Computed using the BCa bootstrap method described by Efron and Tibishirani (1993) **Hypothesis testing in Attachment 3 shows statistically significant decreases for this BMP category. ***Hypothesis testing in Attachment 3 shows statistically significant increases for this BMP category. ****Conclusions are limited for this BMP category due to a large percentage of non-detects in the influent.

International Stormwater BMP Database
Pollutant Category Summary Addendum Page 12 July 2012
Figure 9. Box Plots of Influent/Effluent Total Cadmium Concentrations
Table 9. Influent/Effluent Summary Statistics for Total Cadmium (µg/L)
BMP Type Count of Studies
and EMCs 25th
Percentile Median (95% Conf. Interval*) 75th Percentile
In Out In Out In Out In Out
Grass Strip 12, 220 12, 153 0.20 0.06 0.52 (0.42, 0.60) 0.18 (0.09, 0.20)** 0.86 0.33 Bioretention**** 3, 40 3, 37 0.50 0.50 0.99 (1.00, 1.00) 0.94 (0.25, 1.00)** 1.00 1.00 Bioswale 14, 136 14, 123 0.43 0.20 0.50 (0.50, 0.50) 0.31 (0.27, 0.34)** 0.63 0.50 Composite 5, 83 6, 80 0.39 0.36 0.51 (0.50, 0.54) 0.50 (0.43, 0.50)** 0.71 0.52 Detention Basin 12, 162 13, 178 0.17 0.17 0.39 (0.28, 0.49) 0.31 (0.25, 0.35) 0.79 0.53 Green Roof**** 1, 14 3, 28 0.25 0.05 0.27 (0.25, 0.50) 0.21 (0.05, 0.25) 0.59 0.25 Manufactured Device 18, 234 25, 260 0.18 0.10 0.40 (0.32, 0.44) 0.28 (0.20, 0.31)** 0.95 0.70 Media Filter 21, 268 21, 250 0.13 0.05 0.31 (0.20, 0.31) 0.16 (0.10, 0.20)** 0.60 0.25 Porous Pavement**** 3, 113 4, 111 0.16 0.25 0.28 (0.21, 0.35) 0.25 (0.25, 0.25) 0.60 0.50 Retention Pond 25, 374 25, 384 0.20 0.10 0.49 (0.40, 0.50) 0.23 (0.20, 0.29)** 1.00 0.50 Wetland Basin 5, 100 5, 117 0.10 0.10 0.31 (0.19, 0.34) 0.18 (0.10, 0.20)** 0.74 0.50 Wetland Channel 3, 69 3, 54 0.16 0.17 0.50 (0.23, 0.50) 0.49 (0.19, 0.50) 0.50 0.50 *Computed using the BCa bootstrap method described by Efron and Tibishirani (1993) **Hypothesis testing in Attachment 1 shows statistically significant decreases for this BMP category. ***Hypothesis testing in Attachment 1 shows statistically significant increases for this BMP category. ****Conclusions are limited for this BMP category due to a large percentage of non-detects in the influent.

International Stormwater BMP Database
Pollutant Category Summary Addendum Page 13 July 2012
2.3.3 Chromium
Figure 10. Box Plots of Influent/Effluent Dissolved Chromium Concentrations
Table 10. Influent/Effluent Summary Statistics for Dissolved Chromium (µg/L)
BMP Type Count of Studies
and EMCs 25th
Percentile Median (95% Conf. Interval)* 75th Percentile
In Out In Out In Out In Out
Grass Strip 12, 220 12, 152 1.00 1.00 2.13 (1.60, 2.30) 1.68 (1.20, 1.70) 4.25 3.60 Bioretention NA NA NA NA NA NA NA NA Bioswale 6, 37 6, 29 1.00 1.00 1.53 (1.00, 2.80) 1.38 (1.00, 2.70) 3.40 3.20 Composite NA NA NA NA NA NA NA NA Detention Basin 4, 42 4, 36 0.62 0.55 1.25 (0.76, 1.50) 1.08 (0.70, 1.65) 2.97 1.90 Green Roof NA NA NA NA NA NA NA NA Manufactured Device 10, 117 16, 144 0.95 1.10 1.40 (1.13, 1.48) 1.63 (1.46, 1.80) 1.93 2.31 Media Filter 13, 133 13, 128 0.54 0.61 1.00 (1.00, 1.00) 1.00 (1.00, 1.00) 1.10 1.10 Porous Pavement**** 3, 113 3, 106 0.50 1.76 0.50 (0.50, 0.50) 2.82 (2.40, 3.10)*** 0.50 4.07 Retention Pond 4, 67 4, 81 1.00 0.60 1.18 (1.00, 1.47) 1.00 (1.00, 1.00)** 2.00 1.00 Wetland Basin NA NA NA NA NA NA NA NA Wetland Channel NA NA NA NA NA NA NA NA
*Computed using the BCa bootstrap method described by Efron and Tibishirani (1993) **Hypothesis testing in Attachment 3 shows statistically significant decreases for this BMP category. ***Hypothesis testing in Attachment 3 shows statistically significant increases for this BMP category. ****Conclusions are limited for this BMP category due to a large percentage of non-detects in the influent.

International Stormwater BMP Database
Pollutant Category Summary Addendum Page 14 July 2012
Figure 11. Box Plots of Influent/Effluent Total Chromium Concentrations
Table 11. Influent/Effluent Summary Statistics for Total Chromium (µg/L)
BMP Type Count of Studies
and EMCs 25th
Percentile Median (95% Conf. Interval)* 75th Percentile
In Out In Out In Out In Out
Grass Strip 13, 223 13, 156 2.90 1.37 5.49 (4.50, 6.10) 2.73 (2.10, 3.25)** 8.60 5.90 Bioretention NA NA NA NA NA NA NA NA Bioswale 6, 37 6, 29 1.80 1.50 4.53 (2.10, 6.30) 2.32 (1.50, 3.30) 9.20 4.80 Composite NA NA NA NA NA NA NA NA Detention Basin 6, 60 5, 46 3.50 1.90 5.02 (3.97, 5.50) 2.97 (2.20, 3.35)** 7.80 3.70 Green Roof**** 1, 6 3, 23 0.20 0.44 0.20 (0.20, 0.20) 0.73 (0.41, 0.88) 0.20 1.15 Manufactured Device 11, 120 17, 145 2.57 1.90 3.66 (3.17, 4.00) 2.82 (2.40, 3.11)** 5.45 4.20 Media Filter 13, 134 13, 128 1.20 1.00 2.02 (1.50, 2.43) 1.02 (1.00, 1.20)** 3.49 2.12 Porous Pavement**** 3, 113 3, 105 2.02 2.20 3.60 (2.81, 4.24) 3.73 (2.99, 4.42) 6.90 6.30 Retention Pond 12, 153 12, 162 2.35 1.00 4.09 (3.70, 4.72) 1.36 (1.00, 1.84)** 7.60 3.39 Wetland Basin NA NA NA NA NA NA NA NA Wetland Channel 3, 70 3, 55 1.00 0.50 1.72 (1.20, 2.19) 1.41 (0.57, 1.92) 3.25 4.00
**Hypothesis testing in Attachment 1 shows statistically significant decreases for this BMP category. ***Hypothesis testing in Attachment 1 shows statistically significant increases for this BMP category. ****Conclusions are limited for this BMP category due to a large percentage of non-detects in the influent.

International Stormwater BMP Database
Pollutant Category Summary Addendum Page 15 July 2012
2.3.4 Copper
Figure 12. Box Plots of Influent/Effluent Dissolved Copper Concentrations
Table 12. Influent/Effluent Summary Statistics for Dissolved Copper (µg/L)
BMP Type Count of Studies
and EMCs 25th Percentile Median (95% Conf. Interval)* 75th Percentile
In Out In Out In Out In Out
Grass Strip 12, 233 12, 163 5.10 2.85 11.66 (8.60, 13.00) 5.40 (4.50, 5.90)** 21.00 8.55 Bioretention NA NA NA NA NA NA NA NA Bioswale 13, 109 13, 92 6.05 4.94 11.01 (7.39, 11.10) 8.02 (6.30, 9.24) 18.60 11.55 Composite 3, 59 3, 52 2.58 4.38 5.32 (3.44, 7.00) 5.00 (5.00, 5.00) 20.00 5.00 Detention Basin 9, 170 9, 170 2.32 1.93 5.56 (3.80, 6.30) 3.52 (2.80, 4.72) 11.00 9.92 Green Roof 1, 6 3, 39 0.81 7.14 1.72 (0.44, 2.83) 9.55 (7.34, 11.50) 2.71 13.60 Manufactured Device 17, 219 23, 307 3.00 2.41 6.70 (5.60, 8.00) 6.08 (4.82, 7) 12.15 12.00 Media Filter 13, 191 13, 186 2.68 1.92 5.37 (4.30, 6.50) 4.35 (3.58, 5.10) 10.50 10.00 Porous Pavement 6, 138 7, 190 3.32 4.10 5.37 (4.60, 5.60) 5.75 (4.90, 5.91) 7.80 8.70 Retention Pond 10, 202 10, 213 4.00 2.90 6.57 (5.96, 7.00) 4.24 (4.00, 4.57)** 9.00 6.00 Wetland Basin NA NA NA NA NA NA NA NA Wetland Channel NA NA NA NA NA NA NA NA *Computed using the BCa bootstrap method described by Efron and Tibishirani (1993) **Hypothesis testing in Attachment 3 shows statistically significant decreases for this BMP category.

International Stormwater BMP Database
Pollutant Category Summary Addendum Page 16 July 2012
Figure 13. Box Plots of Influent/Effluent Total Copper Concentrations
Table 13. Influent/Effluent Summary Statistics for Total Copper (µg/L)
BMP Type Count of Studies
and EMCs 25th
Percentile Median (95% Conf. Interval)* 75th Percentile
In Out In Out In Out In Out
Grass Strip 13, 237 13, 167 11.00 4.80 24.52 (19, 26) 7.30 (6.40, 7.90)** 51.00 12.00 Bioretention 4, 63 4, 56 8.35 3.98 17.00 (11.00, 23.00) 7.67 (4.60, 9.85)** 38.50 12.00 Bioswale 16, 258 18, 300 5.02 3.57 10.86 (8.70, 13.20) 6.54 (5.70, 7.70)** 27.00 13.20 Composite 6, 123 7, 109 6.84 3.74 10.93 (9.71, 13.63) 5.88 (5.05, 6.79)** 30.00 10.00 Detention Basin 12, 193 13, 203 4.83 2.11 10.62 (7.78, 14.00) 5.67 (4.00, 6.80)** 31.00 15.00 Green Roof 2, 20 4, 55 2.52 8.61 4.12 (2.38, 5.40) 12.60 (9.58, 15.60) 8.63 21.00 Manufactured Device 26, 349 33, 434 7.40 4.65 13.42 (11.90, 14.70) 10.16 (7.94, 11.0)** 23.00 17.85 Media Filter 25, 408 25, 377 6.96 2.95 11.28 (10.00, 12.68) 6.01 (5.10, 6.60)** 21.10 10.00 Porous Pavement 11, 190 12, 236 8.70 4.84 13.07 (11.45, 15.30) 7.83 (6.80, 8.10)** 27.00 12.62 Retention Pond 33, 525 33, 517 4.93 3.00 9.57 (8.00, 10.00) 4.99 (4.06, 5.00)** 20.10 7.32 Wetland Basin 6, 149 6, 148 3.53 2.00 5.61 (4.36, 6.34) 3.57 (3.00, 4.00)** 9.57 6.00 Wetland Channel 3, 95 3, 77 3.30 3.30 4.52 (3.80, 5.10) 4.81 (3.61, 5.20) 7.50 10.00 *Computed using the BCa bootstrap method described by Efron and Tibishirani (1993) **Hypothesis testing in Attachment 1 shows statistically significant decreases for this BMP category.

International Stormwater BMP Database
Pollutant Category Summary Addendum Page 17 July 2012
2.3.5 Iron
Figure 14. Box Plots of Influent/Effluent Dissolved Iron Concentrations
Table 14. Influent/Effluent Summary Statistics for Dissolved Iron (µg/L)
BMP Type
Count of Studies and
EMCs
25th Percentile Median (95% Conf. Interval)* 75th
Percentile
In Out In Out In Out In Out Grass Strip 5, 67 4, 52 23.2 47.3 44.9 (25.0, 56.0) 151.9 (63.0, 226.5)*** 139.0 435.0 Bioretention NA NA NA NA NA NA NA NA Bioswale NA NA NA NA NA NA NA NA Composite NA NA NA NA NA NA NA NA Detention Basin NA NA NA NA NA NA NA NA Green Roof NA NA NA NA NA NA NA NA Manufactured Device NA NA NA NA NA NA NA NA
Media Filter NA NA NA NA NA NA NA NA Porous Pavement 3, 113 3, 106 37.9 62.5 68.4 (49.4, 80.0) 98.63(70.0, 105.0) 120.0 167.5 Retention Pond 5, 118 5, 129 20.0 27.0 51.5 (35.0, 60.0) 59.72 (45.4, 70.8) 110.0 109.0 Wetland Basin NA NA NA NA NA NA NA NA Wetland Channel NA NA NA NA NA NA NA NA
*Computed using the BCa bootstrap method described by Efron and Tibishirani (1993) ***Hypothesis testing in Attachment 3 shows statistically significant increases for this BMP category.

International Stormwater BMP Database
Pollutant Category Summary Addendum Page 18 July 2012
Figure 15. Box Plots of Influent/Effluent Total Iron Concentrations
Table 15. Influent/Effluent Summary Statistics for Total Iron (µg/L)
BMP Type Count of Studies
and EMCs 25th Percentile Median (95% Conf. Interval)* 75th Percentile
In Out In Out In Out In Out Grass Strip 5, 67 4, 52 291 129 792 (490, 1000) 590 (287, 939) 1800 1307 Bioretention 3, 44 3, 42 253 478 515 (280, 619) 1032 (510, 1380) 805 1845 Bioswale 3, 55 4, 75 39 40 151 (45, 180) 86 (43, 88) 514 265 Composite 3, 67 3, 54 477 160 1603 (820, 2170) 264 (165, 330)** 5095 464 Detention Basin NA NA NA NA NA NA NA NA Green Roof NA NA NA NA NA NA NA NA Manufactured Device NA NA NA NA NA NA NA NA Media Filter 7, 141 7, 123 267 113 606 (437, 754) 210 (163, 250)** 1430 455 Porous Pavement NA NA NA NA NA NA NA NA Retention Pond 15, 299 16, 305 430 153 1094 (858, 1265) 280 (230, 335)** 3404 510 Wetland Basin NA NA NA NA NA NA NA NA Wetland Channel NA NA NA NA NA NA NA NA
*Computed using the BCa bootstrap method described by Efron and Tibishirani (1993) **Hypothesis testing in Attachment 1 shows statistically significant decreases for this BMP category.

International Stormwater BMP Database
Pollutant Category Summary Addendum Page 19 July 2012
2.3.6 Lead
Figure 16. Box Plots of Influent/Effluent Dissolved Lead Concentrations
Table 16. Influent/Effluent Summary Statistics for Dissolved Lead (µg/L)
BMP Type Count of Studies
and EMCs 25th
Percentile Median (95% Conf. Interval)* 75th Percentile
In Out In Out In Out In Out Grass Strip 12, 232 12, 164 0.11 0.09 0.64 (0.32, 1.00) 0.26 (0.19, 0.35) 2.80 1.00 Bioretention NA NA NA NA NA NA NA NA Bioswale 13, 109 13, 92 0.60 0.49 1.36 (0.70, 1.46) 1.08 (0.76, 1.60) 6.40 3.26 Composite 5, 64 5, 56 0.08 0.05 0.61 (0.21, 0.99) 0.29 (0.09, 0.44) 4.63 1.07 Detention Basin 9, 170 9, 171 0.29 0.27 0.79 (0.54, 1.00) 0.66 (0.48, 0.90) 1.76 1.49 Green Roof**** 1, 6 3, 39 0.05 0.04 0.05 (0.05, 0.05) 0.12 (0.05, 0.14) 0.05 0.28 Manufactured Device 14, 159 20, 245 0.61 0.71 1.49 (1.00, 1.70) 1.24 (1.00, 1.38) 3.55 2.90 Media Filter 13, 191 13, 186 0.50 0.39 1.00 (1.00, 1.00) 1.00 (1.00, 1.00) 1.70 1.00 Porous Pavement**** 3, 113 3, 106 0.50 0.50 0.50 (0.50, 0.50) 0.50 (0.50, 0.50) 0.50 0.50 Retention Pond 14, 202 14, 214 0.08 0.07 0.76 (0.34, 1.03) 0.48 (0.23, 0.96) 3.85 3.00 Wetland Basin NA NA NA NA NA NA NA NA Wetland Channel 3, 53 3, 47 1.85 0.12 3.26 (2.35, 3.98) 0.52 (0.12, 0.75)** 7.09 2.66
*Computed using the BCa bootstrap method described by Efron and Tibishirani (1993) **Hypothesis testing in Attachment 3 shows statistically significant decreases for this BMP category. ****Conclusions are limited for this BMP category due to a large percentage of non-detects in the influent.

International Stormwater BMP Database
Pollutant Category Summary Addendum Page 20 July 2012
Figure 17. Box Plots of Influent/Effluent Total Lead Concentrations
Table 17. Influent/Effluent Summary Statistics for Total Lead (µg/L)
BMP Type Count of Studies
and EMCs 25th
Percentile Median (95% Conf. Interval)* 75th Percentile
In Out In Out In Out In Out Grass Strip 13, 237 13, 167 3.20 0.72 8.83 (6.60, 11.50) 1.96 (1.30, 2.20)** 29.00 4.60 Bioretention 3, 47 3, 43 2.06 2.50 3.76 (2.49, 5.50) 2.53 (2.50, 2.50) 7.00 5.00 Bioswale 17, 277 19, 318 1.65 1.08 3.93 (2.80, 5.00) 2.02 (1.80, 2.29)** 18.20 6.27 Composite 9, 158 10, 149 7.78 2.00 19.7 (13.27, 23.45) 4.78 (3.00, 5.61)** 51.00 10.30 Detention Basin 12, 193 13, 204 1.80 1.10 6.08 (3.86, 8.00) 3.10 (2.15, 4.30) 41.00 11.00 Green Roof 2, 20 4, 55 0.16 0.18 0.58 (0.15, 1.00) 0.30 (0.19, 0.35) 1.20 0.59 Manufactured Device 20, 247 27, 334 4.20 2.00 8.24 (6.77, 9.56) 4.63 (3.80, 5.16)** 18.95 10.00 Media Filter 25, 394 25, 362 3.28 1.00 10.5 (8.02, 11.79) 1.69 (1.30, 2.00)** 23.00 3.99 Porous Pavement 8, 162 13, 174 1.99 0.93 4.30 (3.28, 5.47) 1.86 (1.38, 2.21)** 9.98 4.93 Retention Pond 40, 631 40, 627 2.97 1.00 8.48 (6.80, 9.41) 2.76 (2.00, 3.00)** 25.30 8.00 Wetland Basin 6, 121 6, 121 1.00 0.71 2.03 (1.57, 2.24) 1.21 (1.00, 1.55)** 5.73 3.47 Wetland Channel 6, 117 6, 102 1.06 1.00 2.94 (1.90, 4.20) 2.49 (1.40, 3.11) 14.00 6.73
*Computed using the BCa bootstrap method described by Efron and Tibishirani (1993) **Hypothesis testing in Attachment 1 shows statistically significant decreases for this BMP category. ****Conclusions are limited for this BMP category due to a large percentage of non-detects in the influent.

International Stormwater BMP Database
Pollutant Category Summary Addendum Page 21 July 2012
2.3.7 Nickel
Figure 18. Box Plots of Influent/Effluent Dissolved Nickel Concentrations
Table 18. Influent/Effluent Summary Statistics for Dissolved Nickel (µg/L)
BMP Type Count of Studies
and EMCs 25th
Percentile Median (95% Conf. Interval)* 75th Percentile
In Out In Out In Out In Out Grass Strip 12, 220 12, 152 1.27 1.53 2.68 (2.30, 2.90) 2.09 (2.00, 2.15)** 4.30 3.00 Bioretention NA NA NA NA NA NA NA NA Bioswale 5, 31 5, 23 2.80 2.00 4.93 (2.90, 5.90) 2.04 (2, 2.40)** 8.35 2.50 Composite NA NA NA NA NA NA NA NA Detention Basin 5, 52 5, 46 2.00 2.00 2.82 (2.05, 3.47) 2.55 (2.00, 3.00) 4.05 3.50 Green Roof NA NA NA NA NA NA NA NA Manufactured Device 9, 102 15, 129 0.10 0.27 0.50 (0.26, 1.03) 1.92 (0.44, 2.00) 2.07 3.90 Media Filter 13, 133 13, 128 0.94 0.80 1.99 (1.02, 2.00) 1.90 (0.99, 2.00) 2.80 2.43 Porous Pavement**** 3, 113 3, 106 0.49 0.23 0.88 (0.68, 1.10) 0.43 (0.33, 0.52)** 1.50 0.81 Retention Pond 4, 45 4, 45 1.00 1.16 1.68 (1.17, 2.00) 2.11 (1.40, 2.53) 2.59 3.70 Wetland Basin NA NA NA NA NA NA NA NA Wetland Channel NA NA NA NA NA NA NA NA
*Computed using the BCa bootstrap method described by Efron and Tibishirani (1993) **Hypothesis testing in Attachment 3 shows statistically significant decreases for this BMP category. ****Conclusions are limited for this BMP category due to a large percentage of non-detects in the influent.

International Stormwater BMP Database
Pollutant Category Summary Addendum Page 22 July 2012
Figure 19. Box Plots of Influent/Effluent Total Nickel Concentrations
Table 19. Influent/Effluent Summary Statistics for Total Nickel (µg/L)
BMP Type Count of Studies
and EMCs 25th
Percentile Median (95% Conf. Interval)* 75th Percentile
In Out In Out In Out In Out Grass Strip 12, 220 12, 153 3.30 2.10 5.41 (4.50, 6.10) 2.92 (2.40, 3.10)** 9.20 4.30 Bioretention NA NA NA NA NA NA NA NA Bioswale 5, 31 5, 23 5.15 2.35 9.26 (5.20, 12.00) 3.16 (2.30, 4.20)** 14.50 4.65 Composite NA NA NA NA NA NA NA NA Detention Basin 6, 60 6, 54 4.57 2.00 5.64 (4.85, 6.60) 3.35 (2.20, 3.75)** 11.00 4.98 Green Roof NA NA NA NA NA NA NA NA Manufactured Device 9, 102 15, 129 0.85 2.80 3.84 (2.50, 4.10) 4.51 (3.11, 5.00) 6.07 6.90 Media Filter 13, 134 13, 128 2.10 1.45 3.51 (2.70, 3.70) 2.20 (2.00, 2.60)** 5.38 3.90 Porous Pavement 3, 113 3, 106 2.40 1.20 3.64 (2.80, 4.20) 1.71 (1.40, 1.80)** 6.90 2.50 Retention Pond 10, 115 10, 112 2.48 2.00 4.46 (3.19, 5.59) 2.19 (2.00, 2.60)** 9.34 5.82 Wetland Basin NA NA NA NA NA NA NA NA Wetland Channel 3, 68 3, 53 2.00 2.00 2.80 (2.09, 3.00) 2.18 (2.00, 2.40) 3.75 3.00
*Computed using the BCa bootstrap method described by Efron and Tibishirani (1993) **Hypothesis testing in Attachment 1 shows statistically significant decreases for this BMP category.

International Stormwater BMP Database
Pollutant Category Summary Addendum Page 23 July 2012
Figure 20. Box Plots of Influent/Effluent Dissolved Zinc Concentrations
Table 20. Influent/Effluent Summary Statistics for Dissolved Zinc (µg/L)
BMP Type Count of Studies
and EMCs 25th Percentile Median (95% Conf. Interval)* 75th Percentile
In Out In Out In Out In Out Grass Strip 12, 233 12, 163 14.0 6.0 36.1 (30.0, 43.1) 14.0 (10.0, 16.0)** 75.0 28.0 Bioretention NA NA NA NA NA NA NA NA Bioswale 13, 109 13, 92 30.0 17.7 52.7 (35.8, 59.9) 24.5 (21.3, 27.5)** 113.0 39.2 Composite 4, 72 4, 61 10.0 4.0 29.0 (10.2, 30.0) 9.9 (4.4, 10.0)** 50.0 20.0 Detention Basin 9, 169 9, 171 5.0 4.0 15.6 (10.8, 21.0) 11.08 (8, 17) 42.0 31.5 Green Roof 1, 6 3, 39 59.4 12.6 97.3 (55.2, 126.0) 20.3 (13.3, 25.2) 126.0 28.1 Manufactured Device 18, 219 24, 307 19.5 20.0 47.8 (36.0, 55.0) 53.3 (44.0, 64.0) 125.0 109.0 Media Filter 13, 191 13, 185 23.0 3.0 51.3 (37.1, 60.0) 12.2 (8.3, 17.0)** 125.0 38.0 Porous Pavement 6, 138 7, 189 8.3 2.1 13.5 (10.9, 15.9) 6.5 (4.9, 7.9)** 26.3 13.6 Retention Pond 11, 201 11, 212 9.0 2.0 22.5 (18.0, 26.0) 9.6 (5.3, 10.9)** 41.0 20.0 Wetland Basin NA NA NA NA NA NA NA NA Wetland Channel 3, 64 3, 56 4.5 2.9 11.6 (6.2, 17.0) 9.5 (2.9, 10.0) 20.0 20.0
*Computed using the BCa bootstrap method described by Efron and Tibishirani (1993) **Hypothesis testing in Attachment 1 shows statistically significant decreases for analyzed BMPs for total zinc

International Stormwater BMP Database
Pollutant Category Summary Addendum Page 24 July 2012
2.3.8 Zinc
Figure 21. Box Plots of Influent/Effluent Total Zinc Concentrations
Table 21. Influent/Effluent Summary Statistics for Total Zinc (µg/L)
BMP Type Count of Studies
and EMCs 25th
Percentile Median (95% Conf. Interval)* 75th Percentile
In Out In Out In Out In Out Grass Strip 13, 237 13, 167 53.0 11.0 103.3 (86.0, 120.0) 24.3 (16.0, 26.0)** 210.0 52.5 Bioretention 6, 106 6, 99 46.3 4.8 73.8 (62.0, 83.5) 18.3 (7.7, 25.0)** 153.8 36.0 Bioswale 18, 292 20, 327 19.1 15.5 36.2 (30.0, 40.0) 22.9 (20.0, 26.6)** 136.0 50.0 Composite 7, 137 8, 118 50.0 17.7 102.9 (77.4, 122.2) 33.0 (28.5, 39.5)** 161.5 57.9 Detention Basin 12, 193 14, 212 22.0 8.0 70.0 (40.0, 95.0) 29.7 (17.1, 38.2)** 230.0 72.8 Green Roof 2, 20 5, 60 21.5 14.3 41.8 (22.0, 68.1) 25.0 (18.0, 28.2) 79.1 33.7 Manufactured Device 39, 507 46, 593 44.3 26.3 87.7 (79.0, 95.0) 58.5 (52.8, 63.5)** 167.5 120.0 Media Filter 28, 450 28, 406 40.0 7.0 77.3 (68.2, 86.0) 17.9 (15.0, 20.0)** 160.8 34.8 Porous Pavement 12, 201 17, 261 27.0 9.0 57.6 (49.6, 66.0) 15.0 (12.5, 16.8)** 131.4 26.7 Retention Pond 39, 574 40, 579 30.0 10.0 53.6 (49.0, 59.0) 21.2 (20.0, 23.0)** 110.0 40.0 Wetland Basin 9, 177 9, 176 31.6 12.0 48.0 (40.6, 53.2) 22.0 (16.7, 24.3)** 87.3 33.3 Wetland Channel 4, 107 4, 86 13.5 10.0 23.0 (16.0, 30.0) 15.6 (11.0, 20.0) 42.0 30.0
*Computed using the BCa bootstrap method described by Efron and Tibishirani (1993) **Hypothesis testing in Attachment 3 shows statistically significant decreases for analyzed BMPs for total zinc.

International Stormwater BMP Database
Pollutant Category Summary Addendum Page 25 July 2012
2.4 Nutrients
2.4.1 Phosphorus
Figure 22. Box Plots of Influent/Effluent Total Phosphorus Concentrations
Table 22. Influent/Effluent Summary Statistics for Total Phosphorus (mg/L)
BMP Type Count of Studies
and EMCs 25th
Percentile Median (95% Conf. Interval*) 75th Percentile
In Out In Out In Out In Out Grass Strip 20, 358 20, 280 0.08 0.10 0.14 (0.11, 0.15) 0.18 (0.15, 0.20)*** 0.26 0.35
Bioretention 18, 271 18, 249 0.06 0.05 0.11 (0.08, 0.12) 0.09 (0.07, 0.10) 0.22 0.20 Bioswale 20, 331 22, 364 0.06 0.12 0.11 (0.09, 0.12) 0.19 (0.17, 0.20)*** 0.24 0.32
Composite 9, 176 10, 153 0.17 0.08 0.36 (0.27, 0.40) 0.13 (0.11, 0.15)** 0.69 0.23 Detention Basin 18, 250 19, 275 0.19 0.13 0.28 (0.25, 0.30) 0.22 (0.19, 0.24)** 0.51 0.36
Green Roof 2, 22 5, 60 0.02 0.31 0.09 (0.02, 0.13) 0.50 (0.36, 0.72)*** 0.21 1.20 Manufactured Device 45, 602 52, 641 0.09 0.06 0.19 (0.16, 0.22) 0.12 (0.10, 0.13)** 0.46 0.30
Media Filter 28, 433 28, 403 0.10 0.05 0.18 (0.16, 0.19) 0.09 (0.08, 0.10)** 0.32 0.17 Porous Pavement 13, 231 22, 389 0.09 0.05 0.15 (0.12, 0.16) 0.09 (0.08, 0.09)** 0.29 0.14 Retention Pond 46, 657 48, 654 0.15 0.06 0.30 (0.27, 0.31) 0.13 (0.12, 0.14)** 0.53 0.23 Wetland Basin 13, 282 13, 278 0.08 0.04 0.13 (0.11, 0.14) 0.08 (0.07, 0.09)** 0.20 0.15
Wetland Channel 8, 167 8, 147 0.09 0.10 0.15 (0.13, 0.17) 0.14 (0.13, 0.17) 0.23 0.23 *Computed using the BCa bootstrap method described by Efron and Tibishirani (1993) **Hypothesis testing in Attachment 4 shows statistically significant decreases for this BMP category. ***Hypothesis testing in Attachment 4 shows statistically significant increases for this BMP category.

International Stormwater BMP Database
Pollutant Category Summary Addendum Page 26 July 2012
Figure 23. Box Plots of Influent/Effluent Orthophosphate Concentrations
Table 23. Influent/Effluent Summary Statistics for Orthophosphate (mg/L)
BMP Type Count of Studies
and EMCs 25th
Percentile Median (95% Conf. Interval)* 75th Percentile
In Out In Out In Out In Out Grass Strip 14, 274 14, 223 0.01 0.02 0.03 (0.03, 0.04) 0.06 (0.04, 0.07)*** 0.10 0.15
Bioretention 13, 164 13, 164 0 0.01 0.01 (0.01, 0.02) 0.04 (0.02, 0.05)*** 0.05 0.16 Bioswale 5, 140 7, 197 0.02 0.07 0.03 (0.02, 0.03) 0.12 (0.10, 0.13)*** 0.04 0.18
Composite 4, 56 4, 47 0.07 0.03 0.09 (0.07, 0.12) 0.07 (0.04, 0.10) 0.19 0.14 Detention Basin 2, 31 2, 31 0.28 0.22 0.53 (0.28, 0.82) 0.39 (0.24, 0.56) 1.26 1.03
Green Roof 2, 21 4, 55 0.01 0.23 0.02 (0.003, 0.03) 0.46 (0.26, 0.68)*** 0.23 1.41 Manufactured Device 14, 201 14, 185 0.05 0.02 0.21 (0.12, 0.25) 0.10 (0.06, 0.13)** 0.46 0.41
Media Filter 9, 170 9, 157 0.02 0.01 0.05 (0.03, 0.06) 0.03 (0.02, 0.03)** 0.09 0.06 Porous Pavement 7, 87 9, 112 0.02 0.03 0.05 (0.04, 0.06) 0.05 (0.04, 0.06) 0.08 0.09 Retention Pond 27, 361 28, 357 0.06 0.02 0.10 (0.09, 0.11) 0.04 (0.03, 0.05)** 0.21 0.09 Wetland Basin 5, 166 5, 161 0.03 0.01 0.04 (0.04, 0.05) 0.02 (0.01, 0.02)** 0.09 0.06
Wetland Channel 3, 84 3, 63 0.01 0.04 0.03 (0.02, 0.04) 0.06 (0.04, 0.06)*** 0.06 0.08 NA – not available or less than 3 studies for BMP/constituent. *Computed using the BCa bootstrap method described by Efron and Tibishirani (1993) **Hypothesis testing in Attachment 4 shows statistically significant decreases for this BMP category. ***Hypothesis testing in Attachment 4 shows statistically significant increases for this BMP category.

International Stormwater BMP Database
Pollutant Category Summary Addendum Page 27 July 2012
Figure 24. Box Plots of Influent/Effluent Dissolved Phosphorus Concentrations
Table 24. Influent/Effluent Summary Statistics for Dissolved Phosphorus (mg/L)
BMP Type Count of Studies
and EMCs 25th
Percentile Median (95% Conf. Interval)* 75th Percentile
In Out In Out In Out In Out Grass Strip 3, 21 3, 17 0.06 0.18 0.08 (0.05, 0.08) 0.25 (0.16, 0.26) 0.14 0.38
Bioretention 1, 10 1, 10 0.11 0.07 0.25 (0.11, 0.43) 0.13 (0.05, 0.18) 0.46 0.19 Bioswale 6, 66 6, 52 0.03 0.05 0.06 (0.04, 0.07) 0.07 (0.05, 0.11)*** 0.09 0.26
Composite 7, 143 8, 142 0.08 0.05 0.16 (0.13, 0.19) 0.08 (0.06, 0.09)** 0.26 0.13 Detention Basin 8, 91 9, 94 0.07 0.07 0.10 (0.08, 0.11) 0.11 (0.08, 0.12) 0.17 0.16
Green Roof NA NA NA NA NA NA NA NA Manufactured Device 16, 239 23, 265 0.03 0.03 0.08 (0.05, 0.09) 0.06 (0.04, 0.07) 0.20 0.19
Media Filter 13, 103 13, 96 0.05 0.04 0.08 (0.05, 0.09) 0.08 (0.06, 0.09) 0.15 0.14 Porous Pavement 4, 114 5, 125 0.03 0.03 0.04 (0.04, 0.05) 0.05 (0.04, 0.05) 0.08 0.07 Retention Pond 19, 379 20, 371 0.07 0.03 0.13 (0.11, 0.14) 0.06 (0.06, 0.07)** 0.21 0.14 Wetland Basin 5, 114 5, 113 0.04 0.02 0.08 (0.06, 0.09) 0.05 (0.03, 0.06)** 0.13 0.13
Wetland Channel 5, 92 5, 89 0.05 0.06 0.08 (0.07, 0.10) 0.09 (0.07, 0.10) 0.15 0.14 NA – not available or less than 3 studies for BMP/constituent. *Computed using the BCa bootstrap method described by Efron and Tibishirani (1993) **Hypothesis testing in Attachment 4 shows statistically significant decreases for this BMP category. ***Hypothesis testing in Attachment 4 shows statistically significant increases for this BMP category.

International Stormwater BMP Database
Pollutant Category Summary Addendum Page 28 July 2012
2.4.2 Nitrogen
Figure 25. Box Plots of Influent/Effluent Total Nitrogen Concentrations
Table 25. Influent/Effluent Summary Statistics for Total Nitrogen (mg/L)
BMP Type Count of Studies
and EMCs 25th
Percentile Median (95% Conf. Interval)* 75th Percentile
In Out In Out In Out In Out Grass Strip 8, 138 8, 122 0.80 0.80 1.34 (1.06, 1.50) 1.13 (1.00, 1.23) 2.04 1.55
Bioretention 12, 218 12, 200 0.77 0.53 1.25 (1.06, 1.35) 0.90 (0.74, 0.99)** 1.99 1.54 Bioswale 6, 181 8, 238 0.41 0.43 0.75 (0.60, 0.92) 0.71 (0.63, 0.82) 1.60 1.54
Composite 3, 53 4, 64 1.75 1.25 2.37 (1.85, 2.75) 1.71 (1.45, 1.81)** 3.79 2.36 Detention Basin 3, 52 3, 64 0.90 1.18 1.40 (1.03, 1.57) 2.37 (1.75, 2.69)*** 2.02 3.27
Green Roof NA NA NA NA NA NA NA NA Manufactured Device 8, 133 8, 117 1.29 1.40 2.27 (1.98, 2.65) 2.22 (1.90, 2.41) 3.58 3.29
Media Filter 5, 100 5, 87 0.67 0.46 1.06 (0.85, 1.25) 0.82 (0.68, 0.99)** 2.25 2.13 Porous Pavement 1, 14 9, 136 1.20 0.73 1.26 (1.13, 1.38) 1.49 (1.28, 1.65) 1.42 2.28 Retention Pond 19, 259 19, 272 1.05 0.86 1.83 (1.60, 1.98) 1.28 (1.19, 1.36)** 2.87 1.78 Wetland Basin 6, 222 6, 223 0.80 0.89 1.14 (1.04, 1.28) 1.19 (1.04, 1.21) 1.90 1.66
Wetland Channel 5, 83 6, 88 1.22 0.95 1.59 (1.38, 1.78) 1.33 (1.05, 1.56) 2.10 1.92 NA – not available or less than 3 studies for BMP/constituent. *Computed using the BCa bootstrap method described by Efron and Tibishirani (1993) **Hypothesis testing in Attachment 4 shows statistically significant decreases for this BMP category. ***Hypothesis testing in Attachment 4 shows statistically significant increases for this BMP category.

International Stormwater BMP Database
Pollutant Category Summary Addendum Page 29 July 2012
Figure 26. Box Plots of Influent/Effluent Total Kjeldahl Nitrogen Concentrations
Table 26. Influent/Effluent Summary Statistics for Total Kjeldahl Nitrogen (mg/L)
BMP Type Count of Studies
and EMCs 25th
Percentile Median (95% Conf. Interval)* 75th Percentile
In Out In Out In Out In Out Grass Strip 19, 350 19, 272 0.75 0.75 1.29 (1.15, 1.41) 1.09 (0.97, 1.12) 2.00 1.64
Bioretention 14, 214 14, 201 0.54 0.32 0.94 (0.77, 1.04) 0.60 (0.46, 0.72)** 1.58 1.25 Bioswale 17, 288 19, 324 0.31 0.29 0.72 (0.59, 0.85) 0.62 (0.50, 0.70) 1.48 1.10
Composite 7, 130 9, 145 0.79 0.60 1.64 (1.33, 1.80) 1.02 (0.88, 1.14)** 2.96 1.50 Detention Basin 11, 175 12, 185 0.90 0.89 1.49 (1.22, 1.59) 1.61 (1.16, 1.78) 2.70 2.71
Green Roof 1, 15 3, 32 0.85 1.13 1.51 (0.70, 1.90) 1.75 (1.14, 2.35) 3.95 3.72 Manufactured Device 24, 390 31, 433 0.83 0.73 1.59 (1.44, 1.73) 1.48 (1.32, 1.55) 2.82 2.45
Media Filter 26, 411 25, 374 0.55 0.33 0.96 (0.85, 1.02) 0.57 (0.50, 0.61)** 1.77 1.10 Porous Pavement 12, 224 23, 396 1.00 0.46 1.66 (1.40, 1.80) 0.80 (0.74, 0.90)** 2.50 1.30 Retention Pond 36, 482 39, 496 0.78 0.73 1.28 (1.10, 1.33) 1.05 (0.98, 1.10)** 2.13 1.50 Wetland Basin 6, 72 8, 184 0.58 0.76 0.95 (0.69, 1.10) 1.01 (0.92, 1.09) 1.32 1.29
Wetland Channel 6, 122 7, 139 0.94 0.83 1.45 (1.30, 1.60) 1.23 (1.10, 1.30)** 2.00 1.60 NA – not available or less than 3 studies for BMP/constituent. *Computed using the BCa bootstrap method described by Efron and Tibishirani (1993) **Hypothesis testing in Attachment 4 shows statistically significant decreases for this BMP category. ***Hypothesis testing in Attachment 4 shows statistically significant increases for this BMP category.

International Stormwater BMP Database
Pollutant Category Summary Addendum Page 30 July 2012
Figure 27. Box Plots of Influent/Effluent NOx as Nitrogen Concentrations
Table 27. Influent/Effluent Summary Statistics for NOx as Nitrogen (mg/L)
BMP Type Count of Studies
and EMCs 25th
Percentile Median (95% Conf. Interval)* 75th Percentile
In Out In Out In Out In Out Grass Strip 20, 360 20, 287 0.20 0.14 0.41 (0.35, 0.46) 0.27 (0.24, 0.31)** 0.92 0.61
Bioretention 17, 278 17, 259 0.16 0.11 0.26 (0.23, 0.27) 0.22 (0.19, 0.25)** 0.41 0.39 Bioswale 20, 335 22, 372 0.11 0.13 0.30 (0.24, 0.33) 0.25 (0.20, 0.28) 0.62 0.47
Composite 9, 157 10, 142 0.34 0.24 0.57 (0.45, 0.65) 0.40 (0.33, 0.46)** 1.08 0.82 Detention Basin 13, 201 14, 213 0.22 0.10 0.55 (0.43, 0.63) 0.36 (0.24, 0.45)** 0.99 0.72
Green Roof 2, 21 4, 55 0.07 0.06 0.39 (0.06, 0.68) 0.31 (0.10, 0.42) 0.89 1.55 Manufactured Device 33, 504 40, 546 0.20 0.20 0.41 (0.36, 0.44) 0.41 (0.35, 0.44) 0.82 0.77
Media Filter 27, 434 26, 391 0.20 0.28 0.33 (0.30, 0.35) 0.51 (0.46, 0.57)*** 0.58 0.90 Porous Pavement 13, 229 23, 401 0.22 0.33 0.42 (0.34, 0.49) 0.71 (0.59, 0.77)*** 0.79 1.36 Retention Pond 43, 639 43, 626 0.18 0.05 0.43 (0.40, 0.46) 0.18 (0.15, 0.20)** 0.82 0.45 Wetland Basin 11, 245 11, 246 0.08 0.02 0.24 (0.19, 0.28) 0.08 (0.05, 0.11)** 0.50 0.28
Wetland Channel 8, 149 8, 132 0.18 0.09 0.34 (0.27, 0.40) 0.19 (0.15, 0.22)** 0.74 0.55 NA – not available or less than 3 studies for BMP/constituent. *Computed using the BCa bootstrap method described by Efron and Tibishirani (1993) **Hypothesis testing in Attachment 4 shows statistically significant decreases for this BMP category. ***Hypothesis testing in Attachment 4 shows statistically significant increases for this BMP category.

International Stormwater BMP Database
Pollutant Category Summary Addendum Page 31 July 2012
3 REFERENCES Efron, B. and Tibishirani, R. (1993). An Introduction to the Bootstrap. Chapman & Hall, New
York.
Helsel, D.R. and Cohn, T.A. (1988). “Estimation of Descriptive Statistics for Multiply Censored Water Quality Data.” Wat. Res. Research, 24(12): 1997-2004.
Helsel, D.R. and Hirsch, R.M. (1992). Statistical Methods in Water Resources. Studies in Enivironmental Science. Elsevier, N.Y.
Geosyntec and Wright Water Engineers (2012). International Stormwater Best Management Practices (BMP) Database Technical Summary: Manufactured Devices Performance Summary. Prepared under Support from WERF, FHWA, EWRI/ASCE and EPA. July.
Wright Water Engineers and Geosyntec and (2011). International Stormwater Best Management Practices (BMP) Database Technical Summary: Metals. Prepared under Support from WERF, FHWA, EWRI/ASCE and EPA. August.
4 ATTACHMENTS Attachment 1. TSS Statistical Summary Report Attachment 2. Bacteria Statistical Summary Report Attachment 3. Metals Statistical Summary Report Attachment 4. Nutrients Statistical Summary Report