international symposium on green manufacturing and ... of proceedings_papers.pdf · dong-ju lee,...
TRANSCRIPT

Copyright (c) 2016 by KSPE and ISGMA
International Symposium on Green Manufacturing and Applications 2016
ISGMA 2016 Proceedings ISSN 2198-0810 (Online)
CONTENTS
OP007 Pre-Assessments of the Production Re-Configurability for Automotive Assembly Lines Us-ing Modeling and Simulation Technologies Quanri Li, Jongwan Lim, Myungjun Ko, Seohyeon Park and SangDo Noh
OP014 Simulation of Consumed Energy of Machine Tool During 3-Axis Machining Motions Akio Hayashi, Zen Kimura and Yohichi Nakao
OP017 Ballistic Performance Assessment of Al2O3/Ti Functionally Graded Material Yu-Liang Chen, Chuan-Cheng Chang, Meng-Chiau Wu and Wei-Lun Chen
OP029 A Knowledge Based System for 3D Printing Process Planning Hong-Seok Park and Ngoc-Hien Tran
OP038 Rheological Characteristics of Powder Injection Molding Feedstock with Powder Space Holder Sangjune Park and Seokyoung Ahn
OP050 Development of Automation System For Constraints Extraction During Plant Module Transportation Hee Chan Kim, Min Hyuk Woo, Hyun Tae Hwang, Kweon Woo Moon and Soo Hong Lee
OP052 Gearbox Fault Diagnosis via Acoustic and Vibration Measurements Dennis Hartono, Dunant-Halim and Gethin Wyn Roberts
OP055 Comparison of Evaluation Criteria for Sustainable Factories of the Future Jahau Lewis Chen
OP058 A branch and Bound Algorithm for Parallel and Se-lective Disassembly Sequencing with Sequence-Dependent Setups Hyung-Won Kim and Dong-Ho Lee
1 of 2

Copyright (c) 2016 by KSPE and ISGMA
PP032 Structural Design and Analysis of a Novel Heat Exchanger for Aero Engine Na-Hyun Kim, Joo-Hwan Yoon, Jong-Rae Cho and Sang-Hu Park
PP051 The Strength Analysis of Planetary Gears of Two Speed Reducer for Rotator System with Hybrid Function for the Piling Construction Work Myung-Ho Bae and Tae-Yeol Bae
PP055 Design of Solenoid Actuator for FCV Cylinder Valve using Electro Magnetic Field Analysis Dong-Ju Lee, Hyo Ryeol Lee, Jung Hwan Ahn and Hwa Young Kim
PP075 An Evaluation of Effect on Transition Layer using selective Deposition Technology on Hot Forging Dies Haichuan Shi, Gi-Yeol Gwak, Ho-Jin Lee, Jong-Rae Cho and Dong-Gyu Ahn
PP154 Development of Web-based Simulator for Verifying the Design of Embedded Systems Jin Yongzhu, Woong Yang, Hyun-Tae Hwang and Soo-Hong Lee
PP177 Prediction of Machined Surface Profile based on Energy Modeling of Abrasive Water-Jet RakWon Choi, Annadurai Vimalesh, Junghwan Ahn and Hwayoung Kim
PP246 The Effect of CNT Diameters on Properties of CNT-Polyamide Composites Joon Hyuk Song, Young soo Park, Kyung Jae Kim, Myoung han Yoo, Min seok Moon, Je ha Oh, Shin jae Kang and Sung Mo Yang
PP252 Analysis of Ballistic Performance on Varied Content of Alumina/Zirconia FGM Chin-Yu Huang, Yu-Liang Chen and Jun-Jie Shen
PP274 Development of Carbon Nanotube Reinforced Composite by Low Pressure Casting Yongbum Choi, Zhefeng Xu, Kazuhiro Matsugi, Kenjiro Sugio, Sangpill Lee and Gen Sasaki
2 of 2

International Symposium on Green Manufacturing and Applications (ISGMA 2016) OP007
1. Introduction
Reconfiguring Manufacturing System (RMS) is a system which is designed to rapidly change its related hardware, software and system structure to adjust production capability of certain products to main-tain competitiveness in the market and rapid response to ever-changing markets and its regulations.1 In other words, RMS is able to respond to design change of a product in the middle of its production process with minimized ramp-up time by reconfiguring production lines. Elements such as short lead-time, product varieties, low & fluc-tuating volumes and low price are required to secure manufacturing competitiveness,2 and RMS which provides an adjustable production capability is one solution to resolve the problems. However, when it comes to make a decision on introducing RMS to a manufacturing company, decision makers need to address considerations on applica-tions of Reconfigurable Machines (RM) and ways to configure pro-duction lines. In this paper, a methodology that can assess re-configurability of a factory which has reconfigurable hardware by utilizing productivity and investment/cost efficiency and that can support decision making through simulations is proposed, and a deci-sion making supporting system that is based on simulations are pro-
posed as well. ElMaraghy (2005) divides reconfiguration of a manufacturing
system into ‘physical (hard)’ and ‘logical (soft)’ elements. The physi-cal (hard) elements are layout, machines, material handling devices and machine elements while the logical (soft) elements are rerouting, rescheduling, re-planning, reprogramming and augmentation (people, time, subcontracting etc.)3 In a research on hardware of RMS, Abdi and Labib (2005) propose a methodology for selection of layout con-figuration of a RMS by AHP analysis. In the research, layout re-configurability, cost, quality and reliability are chosen as objectives for the selection of appropriate layout configuration and modularity, material handling, scalability, verity, mobility and reconfiguration time are derived as criteria for layout re-configurability.4 Ayman et al. (2007) conducted a research on selection of RMS configuration which possesses optimal capital cost and system availability derived by utilizing genetic algorithm and Tabu search5 and Wang et al. (2012) conducted a research on scalability planning problems which is main-ly aimed at minimization of number of machines required to meet demands from a new market by utilizing generic algorithm. In the research, authors derived a methodology and support basis for addi-tion and allocation of machines to existing production lines by adding
Pre-Assessments of the Production Re-Configurability for Automotive Assembly Lines using Modeling and Simulation Technologies
Quanri Li1, Jongwan Lim1, Myungjun Ko1, Seohyeon Park1, and Sang Do Noh2,#
1 Department of Industrial Engineering, Sungkyunkwan University, 2066, Seobu-ro, Jangan-gu, Suwon-si, Gyeonggi-do, 400-746, South Korea 2 Department of Systems Management Engineering, Sungkyunkwan University, 2066, Seobu-ro, Jangan-gu, Suwon-si, Gyeonggi-do, 400-746, South Korea
# Corresponding Author / E-mail: [email protected], TEL: +82-31-290-7603, FAX: +82-31-290-7610
KEYWORDS : Pre-assessment, Reconfigurability, Modeling and simulation, Automotive assembly
Recently, most manufacturing companies are aiming to improve competitiveness of their manufacturing systems with better reconfigurability, which is capable of changing products, manufacturing processes, machines, production flows and a factory layout to enhance quality, capacity and productivity. The reconfigurability of a factory becomes more and more important to cope with ever changing market requirements, customer demands and applicable technologies. However, the assessment of reconfigurability has been left inconclusive. This paper proposes a methodology to assess both reconfigurability and productivity of a factory by modeling and simulation technologies, which are suitable for quantitative evaluations of not only productivity, but also capability to change manufacturing processes, machines, production flows, and layout of a manufacturing system. As a case study, the assessment method developed in this paper was applied into a Korean automobile manufacturer which produces cockpit and door trim modules. The result shows that modeling & simulation technologies are very useful and effective, so pre-assessment of the reconfigurability could be possible in the early stage of product developments and production preparations.

International Symposium on Green Manufacturing and Applications (ISGMA 2016) 1 to 5 machines to check increasing trend of system productivity (or Jobs per Hour, JPH) by utilizing generic algorithm.6 To current, many of research mainly focus on deriving compositions and elements of RMS while few of them focus on how reconfigurable a factory is nor on how to assess the re-configurability of a factory. 2. Re-configurability and Methodology for Pre-Assessment of Re-Configurability 2.1 Re-configurability of a factory
In this research, re-configurability of an assembly line is mainly covered, and Reconfigurable Manufacturing Line (RML) is defined as a production line that is reconfigured and composed with variable (or reconfigurable) equipment. In an assembly line, workbenches or equipment with jigs that are dedicated to a certain product and con-veyors are subjects to reconfiguration.
To introduce RML effectively, it requires a system for pre-assessment and beforehand confirmation of changes incurred by re-configuration of the production lines. In this research, cost (or in-vestment) efficiency, productivity (operating ratio/JPH/C.max) and areal efficiency are selected as elements for assessment of re-configuration of existing production lines and pre-assessment system of it based on selected elements is proposed.
2.2 Methodology for pre-assessment of re-configurability
In the process of pre-assessment of re-configuration of a factory with utilization of simulation technology, assessing elements are de-rived as following:
1. Through running a simulation scenario of dedicated manu-facturing line (DML) which has jigs and/or equipment that are dedicated to a certain product and simulation scenarios of RML, it can derive the result of simulations in terms of productivity (operating ratio/JPH/C.max).
2. Through derivation of JPH, it can derive capacity of each of production lines and through derivation of operating ratio and C.max, it can derive line balancing and productivity of entire production lines.
3. With information on composition of production lines and equipment costs, which is a part of standard information, cost (or investment) efficiency can be derived, and based upon investing cost of DML scenario, the cost (or invest-ment) efficiency score for RML scenario can be derived.
4. With information on composition of production lines and re-quired area for each of equipment, the minimum required ar-ea for DML scenario can be derived, and based upon which, area efficiency score for RML scenario can be derived.
𝐶𝐶𝐶𝐶𝐶𝐶𝐶𝐶 𝑒𝑒𝑒𝑒𝑒𝑒𝑒𝑒𝑒𝑒𝑒𝑒𝑒𝑒𝑒𝑒𝑒𝑒𝑒𝑒 𝐶𝐶𝑒𝑒𝐶𝐶𝑠𝑠𝑒𝑒 = 𝐶𝐶𝐶𝐶𝐶𝐶𝐶𝐶 𝑓𝑓𝐶𝐶𝑓𝑓 𝐷𝐷𝐷𝐷𝐷𝐷 𝐶𝐶𝑠𝑠𝑠𝑠𝑠𝑠𝑓𝑓𝑠𝑠𝐶𝐶 𝐶𝐶𝐶𝐶𝐶𝐶𝐶𝐶 𝑓𝑓𝐶𝐶𝑓𝑓 𝑅𝑅𝐷𝐷𝐷𝐷 𝐶𝐶𝑠𝑠𝑠𝑠𝑠𝑠𝑓𝑓𝑠𝑠𝐶𝐶
(1)
𝐴𝐴𝑠𝑠𝑒𝑒𝐴𝐴𝐴𝐴 𝑒𝑒𝑒𝑒𝑒𝑒𝑒𝑒𝑒𝑒𝑒𝑒𝑒𝑒𝑒𝑒𝑒𝑒𝑒𝑒 𝐶𝐶𝑒𝑒𝐶𝐶𝑠𝑠𝑒𝑒 = 𝐴𝐴𝑓𝑓𝐴𝐴𝑠𝑠 𝑓𝑓𝐴𝐴𝑟𝑟𝑟𝑟𝑠𝑠𝑓𝑓𝐴𝐴𝑟𝑟 𝑓𝑓𝐶𝐶𝑓𝑓 𝐷𝐷𝐷𝐷𝐷𝐷 𝐶𝐶𝑠𝑠𝑠𝑠𝑠𝑠𝑓𝑓𝑠𝑠𝐶𝐶 𝐴𝐴𝑓𝑓𝐴𝐴𝑠𝑠 𝑓𝑓𝐴𝐴𝑟𝑟𝑟𝑟𝑠𝑠𝑓𝑓𝐴𝐴𝑟𝑟 𝑓𝑓𝐶𝐶𝑓𝑓 𝑅𝑅𝐷𝐷𝐷𝐷 𝐶𝐶𝑠𝑠𝑠𝑠𝑠𝑠𝑓𝑓𝑠𝑠𝐶𝐶
(2)
With the scores and assessment elements derived, decision mak-ers can make decision on selection of scenarios for their factories on
the basis of their KPIs or strategies. 3. Pre-Assessment System 3.1 System composition
As depicted in Fig. 1, re-configurability pre-assessment system proposed in this research is composed of 3 different modules. Scenar-io and data controller plays a role of a database where various infor-mation are stored. The controller decides how and where simulation scenarios are stored and stores various rules and simulation results needed for pre-assessment of re-configurability, and also provides these information to the user interface. Simulation engine controller receives simulation settings and scenarios, runs simulation scenarios and provides the results of each simulation scenarios. Once the simu-lations are completed, it delivers results to the user interface for com-parison between results of scenarios and intuitive analysis. The user interface of the system is a viewing model which shows the infor-mation and result received from the controllers. Also, in the user in-terface, users can input, modify and update various information.
3.2 Implementation of the system The system proposed in chapter 3.1 is developed under Win-
dows 7 and with WPF. Fig. 2 shows the main user interface of the system. Through main user interface, users can select simulation scenarios desired and run it, and can open windows under which users can input standard information on process and cost of equipment in scenario settings panel.
Fig.3 shows the form where users can input standard infor-mation on process. Through which, users can input process name, process code, degree of variety which means number of products a jig or an equipment can deal with, area required for each of pro-cess or equipment, availability of process and mean-time-to-repair (MTTR). The user interface also provides preference function with which users can load predefined or stored data for each of simulation scenarios by clicking combo box.
Fig. 4 shows the form where users can input cost (or investment) of each process. The form also provides loading predefined data through selecting designate simulation scenario.
Fig. 1 Re-configurability pre-assessment system

International Symposium on Green Manufacturing and Applications (ISGMA 2016) OP007
Fig. 2 Main user interface of the system
Fig. 3 User interface for standard information
Fig. 4 User interface for cost of each process
As depicted in Fig. 5, once the simulation for each of scenarios are completed, simulation results and pre-assessment results are shown in a form where the results are plotted in column charts which is accessible by clicking report menu in main user interface. By clicking each of columns in the chart, more detailed excel spread sheets that contain standard information and the process of calculation are provided and can be saved as a new file as users desire.
4. Case Study
In this research, the proposed system is applied to a domestic au-tomobile component manufacturing company which mainly deals with assembly of finishing components and interior components in
door trims of an automobile. The production process is mainly com-posed of assembly, load onto the conveyor and unload in the order of process sequence. Fig. 7 shows the composition and layout of the current factory in 3D.
Fig. 5 User interface for assessment report
Fig. 6 Example of simulation model for pre-assessment of re-configurability
Fig. 7 3D layout of the factory in the case study
The data applied in this research is acquired by interviewing factory managers, measuring process times and based on standard work orders (detailed data are not shown due to confidentiality).
International Symposium on Green Manufacturing and Applications (ISGMA 2016) Table 1 Pre-assessment scores of each scenario
Scenario Avg.
Productivity Efficiency
Areal Efficiency
Score
Cost Efficiency
Score
Total Score
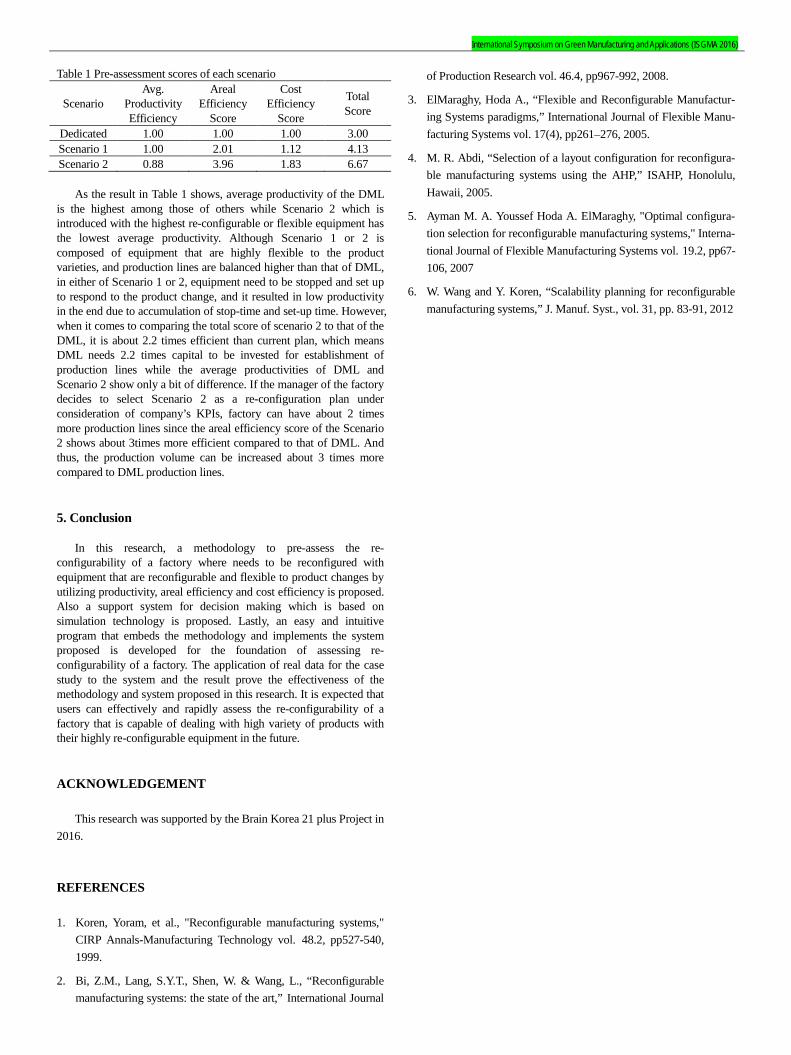
Dedicated 1.00 1.00 1.00 3.00 Scenario 1 1.00 2.01 1.12 4.13 Scenario 2 0.88 3.96 1.83 6.67
As the result in Table 1 shows, average productivity of the DML
is the highest among those of others while Scenario 2 which is introduced with the highest re-configurable or flexible equipment has the lowest average productivity. Although Scenario 1 or 2 is composed of equipment that are highly flexible to the product varieties, and production lines are balanced higher than that of DML, in either of Scenario 1 or 2, equipment need to be stopped and set up to respond to the product change, and it resulted in low productivity in the end due to accumulation of stop-time and set-up time. However, when it comes to comparing the total score of scenario 2 to that of the DML, it is about 2.2 times efficient than current plan, which means DML needs 2.2 times capital to be invested for establishment of production lines while the average productivities of DML and Scenario 2 show only a bit of difference. If the manager of the factory decides to select Scenario 2 as a re-configuration plan under consideration of company’s KPIs, factory can have about 2 times more production lines since the areal efficiency score of the Scenario 2 shows about 3times more efficient compared to that of DML. And thus, the production volume can be increased about 3 times more compared to DML production lines.
5. Conclusion In this research, a methodology to pre-assess the re-
configurability of a factory where needs to be reconfigured with equipment that are reconfigurable and flexible to product changes by utilizing productivity, areal efficiency and cost efficiency is proposed. Also a support system for decision making which is based on simulation technology is proposed. Lastly, an easy and intuitive program that embeds the methodology and implements the system proposed is developed for the foundation of assessing re-configurability of a factory. The application of real data for the case study to the system and the result prove the effectiveness of the methodology and system proposed in this research. It is expected that users can effectively and rapidly assess the re-configurability of a factory that is capable of dealing with high variety of products with their highly re-configurable equipment in the future.
ACKNOWLEDGEMENT
This research was supported by the Brain Korea 21 plus Project in 2016.
REFERENCES 1. Koren, Yoram, et al., "Reconfigurable manufacturing systems,"
CIRP Annals-Manufacturing Technology vol. 48.2, pp527-540, 1999.
2. Bi, Z.M., Lang, S.Y.T., Shen, W. & Wang, L., “Reconfigurable manufacturing systems: the state of the art,” International Journal
of Production Research vol. 46.4, pp967-992, 2008.
3. ElMaraghy, Hoda A., “Flexible and Reconfigurable Manufactur-ing Systems paradigms,” International Journal of Flexible Manu-facturing Systems vol. 17(4), pp261–276, 2005.
4. M. R. Abdi, “Selection of a layout configuration for reconfigura-ble manufacturing systems using the AHP,” ISAHP, Honolulu, Hawaii, 2005.
5. Ayman M. A. Youssef Hoda A. ElMaraghy, "Optimal configura-tion selection for reconfigurable manufacturing systems," Interna-tional Journal of Flexible Manufacturing Systems vol. 19.2, pp67-106, 2007
6. W. Wang and Y. Koren, “Scalability planning for reconfigurable manufacturing systems,” J. Manuf. Syst., vol. 31, pp. 83-91, 2012

International Symposium on Green Manufacturing and Applications (ISGMA 2016) OP014
NOMENCLATURE J = Inertia of motor and ball screw M = Mass of table K = Equivalent axial stiffness ft= Coulomb’s friction torque between table and guide way fv= Coulomb’s friction torque between ball screw and nut ct= Viscous damping between table and guide way cv= Viscous damping between ball screw and nut L= Lead of ball screw
1. Introduction
In recent years, the shortage of energy source is the serious problem in the world. Thus, the energy saving has been promoted in various fields. In particular, vast amounts of the energy have been consumed in manufacturing fields. Thus, the reducing energy consumption in the manufacturing field is the most important problem. To solve this problem, the energy consumption in manufacturing systems has been measured and analyzed by many researchers. As the results, the energy consumption of NC machine tools which is the most important facility in the modern shop floor has been focused on.1-3
Then, we presented that the energy consumption of NC machine tools changes by the difference of the feed speed and the motion direction in previous studies. Accordingly, it is expected that the energy consumption during the machining process can be reduced by considering its motion.
However, current commercialized CAD/CAM systems do not consider the energy consumption when the system generates the tool paths. If the CAD/CAM systems can generate the tool paths considering the energy consumption of NC machine tools, the energy consumption will be reduced without replacing or overhaul the machine tools.
From this point of view, we propose the simulation model of the energy consumption of the feed drive systems of NC machine tool. By the proposed simulation model, it is shown that the simulation model can simulate the power consumption of the feed motion in each control axis.
Furthermore, the various tool paths were generated by a CAD/CAM system and the energy consumption of three-control axis machine tool operation was simulated by the derived simulation model. In order to verify the proposed model, the simulation result of the energy consumption during machining motion is compared with measurement result. In addition, it was shown that the energy consumption is significantly different by the difference in the tool paths even if same part shape is machined. Then, based on the simulation model, we consider the influential factors to generate tool paths for reducing the energy consumption
Simulation of Consumed Energy of Machine Tool During 3-Axis Machining Motions
Akio Hayashi1,#, Zen Kimura2, and Yohichi Nakao1 1 Department of Mechanical Engineering, Kanagawa University, 3-27-1, Rokkaku-bashi, Kanagawa-ku, Yokohama, 221-8686, Japan
2 Department of Mechanical Engineering, Graduate School of Kanagawa University, Japan # Corresponding Author / E-mail: [email protected], TEL: +81-45-481-5661, FAX: +81-45-491-7915
KEYWORDS : NC machine tools, Energy consumption, CAD/CAM, Tool paths
Recent years, the shortage of the energy source is the serious problem in the world. Thus, the reduction of the energy consumption in manufacturing fields has been demanded. The energy consumption of NC machine tools has been also focused on. However, the energy consumption of the machine tool motion of each control axis during machining process has not been considered. In this study, we focus on the energy consumption during the machining process and we proposed the simulation model of the energy consumption of the feed drive systems of NC machine tool. Based on the proposed model, the energy consumption during the machining motion was simulated and evaluated. From these results, if the CAD/CAM systems can generate the tool paths considering about the energy consumption of NC machine tools, the energy consumption will be reduced without replacing or overhaul the machine tools.

International Symposium on Green Manufacturing and Applications (ISGMA 2016) of the machine tool motions.
2. Simulation Model of Power Consumption of Feed Drive System of NC Machine Tools 2.1 Modeling of feed drive system of machine tool
Figure 1 shows the schematic diagram of the machine tool. This machine tool has three control liner axes (X, Y and Z- axis) and two rotary control axes (B and C axis). X-axis consists on the Y-axis and Z-axis is independent. In addition, the feed drive mechanism of liner axis using a ball screw is modeled as shown in Fig. 2. In the model, the coulomb and the viscous frictions between the table and guide way are considered. In addition, the friction between the ball screw and the nut is also considered.4,5
Based on the model of the drive mechanism of machine tool, the equation of motion of the motor can be derived as Eq. (1). In addition, the equation of motion of the table is also derived as Eq. (2).
( ) ( )2 2 2 2b i bL L L LT J c K x c x fθ θ θ θπ π π π
= + + − + − + (1)
0 ( ) ( )2 2t i tL LMx c x K x c x fθ θπ π
= + − − − − + (2)
Then, the control system is added to the feed drive mechanism, the block diagram is depicted as shown in Fig. 3. Here, the electric power consumption of the each axis is assumed to be equal to the motor power. Thus, the power consumption is calculated from the multiplication of the motor torque T and the angular velocity ω as Eq. (3).
P T ω= × (3)
Fig. 1 Structure of 5-axis machining center
Fig. 2 Model of feed drive mechanism by ball screw
Fig. 3 Block diagram of feed drive system of machine tool
Fig. 4 Measurement results of motor torque The coulomb and the viscous frictions in this model were
determined by experimental results of the motor torque. In case of the model for the feed drive system driven by ball screw, the friction coefficient of coulomb’s friction torque f and viscous damping c affect to the motor torque. The motor torque is derived as Eq. (4) during the constant feed rate motion, since the influence of the moment of inertia on the motion torque can be ignored.
T J c fθ θ= + + (4)
The measurement test was carried out with constant feed rate with various feed rates. Figure 4 shows the results of measured motor torque.
The coulomb and the viscous frictions were derived from experimental result. At this time, the motor torque and the velocity were recorded and their averaged values are calculated. From the results, the relationship between the velocity and motor torque from the measurement results can be identified as shown in Fig. 4. The approximately line is obtained by the least-squares method. The intercept of the approximately line indicates the coulomb’s friction force. On the other hand, the gradient of the approximately line indicates the viscous damping coefficient. 2.2 Measurement and simulation test of power consumption on feed drive system in machine tool
The measurement tests of the power consumption of three linear control axes were carried out. Figure 5 shows the measurement results of the power consumption during the linear reciprocal motion with the feed rate of 1000 mm/min. The total distance of the motion is 100 mm. From Fig. 5, the Y-axis consumed the biggest power in three linear axes since the mass of Y-axis is the biggest. On the other hand, the power consumption of X and Z axis was nearly the same.
Then, the power consumption was simulated by the proposed model. The each control axes of the machine tool was reciprocated with the feed rate of 1000 mm/min and 2000mm/min. Figure 6 shows the results of the measured and simulated power consumption of each control axis.
Fig. 5 Power consumption of each linear axis (X, Y and Z-axis)
0 1 2 3 4 5 6 7 8 90
10
20
30
40
50
60
Time [s]
Pow
er c
onsu
mpt
ion
[W]
X-axisY-axisZ-axis

International Symposium on Green Manufacturing and Applications (ISGMA 2016) OP014
Fig. 6 Comparison between measurement and simulation results of power consumption (X-axis)
As the results, it can be seen that the simulation model can
estimate the power consumption during reciprocal motion. However, the power consumption at the acceleration was not simulated correctly. It is due to the error of acceleration and deceleration gain of the model. 3 . M e a s u re m e n t a n d S i m u l a t i o n of E n e r g y Consumption during Machine Tool Operation for Machining Hemisphere
The tool paths from roughing to finishing process for machining hemisphere were generated by CAD/CAM system. The radius of the hemisphere is 20 mm and the workpiece is the cube of 50×50×40 mm. Figure 7 shows the tool paths. In Fig. 7, tool paths (a), (b) and (c) are the roughing process, tool paths (c) and (d) are the finishing process. The measurement tests of power consumption were carried out. In addition, the power consumption was simulated by the proposed model and the simulation and measurement results were compared. Figure 8 shows the total energy consumption in each process. From this result, the prediction of the energy consumption are fairly well. In case of the contour machining, the simulated energy consumption is much smaller than the measured results. The path for the contour machining took the longest motion time.
Fig. 7 Tool paths for roughing and finishing processes
Fig. 8 Simulation and measurement results of energy consumption 4. Energy Consumption for Machine Tool Motion with Various Tool Paths
In order to evaluate the energy consumption in various tool
paths, the tool path using contour line with small pitch (as shown in Fig. 7(c)) was changed to three types of paths. Three types of tool paths were shown in Fig. 9. The feed rate is 1000 mm/min and the machining is set to be same by changing the cutting pitch and the angle pitch.
Figs. 11, 12 and 13 shows the measurement and simulation results of the power consumption for each tool path. Then, the energy consumption was calculated by integration of the power consumption. Table 1 shows the motion time of each control axis and the total motion time of three linear control axes. Table 2 shows the energy consumption of each control axis and the total energy consumption.
In these generated tool paths, the machining time is set to be about 150 s. On the other hand, the motion time of each control axis is different since the travel distance of the motion of each control axis is different depending on tool path as shown in Table 1. In addition, the total of the motion time of each control axis is longer than machining time since each control axis moves at the same time. For these reasons, even in the case where processing is the same, there are a difference in the energy consumption by the tool path.
(a) Radial (b) Scan line (c) Contour line Fig. 9 Tool paths for evaluation tests of energy consumption Table 1 Motion time and machining time in each tool path
Tool path type
Motion time X-axis [s]
Motion time Y-axis [s]
Motion time Z-axis [s]
Total of motion time [s]
Radial 72.35 72.30 88.11 232.75 Scan line 65.52 62.52 73.92 201.96 Contour 97.41 96.99 4.18 198.49 Table 2 Energy consumption of motion in each tool path
Tool path type
Energy consumption X-axis [J]
Energy consumption Y-axis [J]
Energy consumption Z-axis [J]
Total energy consumption [J]
Radial 2735.8 3477.3 3006.1 9219.3 Scan line 2500.0 2883.47891 2643.9 8027.4

International Symposium on Green Manufacturing and Applications (ISGMA 2016) Contour 3541.9 4362.2 568.8 8473.1
Fig.10 Power consumption of radial tool path
Fig. 11 Power consumption of scan line path
In these tool paths, the energy consumption of radial tool path is the biggest. The radial tool path takes the longest total of the motion time than other tool paths. In addition, the energy consumption of Y-axis and Z-axis for the radial tool path are the largest. Therefore, the motion time of each control axis greatly influences to the total energy consumption during machining process. In the radial tool path, it consumes the large energy due to all control axes were constantly moving as shown in Fig. 10(a)
From this result, the scan line tool path consumed the least energy consumption in these three types of the tool path. The totals of the motion time of the scan line path and the contour line path are almost equal. However, it is important that the motion time of the Y-axis which consumes the large energy is short in the scan line path. From this result, the scan line tool path reduces maximum energy consumption among the considered three tool paths.
Fig. 12 Power consumption of contour line path 5. Conclusions
In this study, the simulation model of the power consumption of the feed drive system of NC machine tool was proposed. Then, the measurement tests of power consumption were carried out and it is verified that the proposed model can estimate the energy consumption in various tool paths. REFERENCES 1. M. Mori and M. Fujishima and Y. Inamasu and Y. Oda, “A
Study on Energy Efficiency Improvement for Machine Tools,” CIRP Annals-Manufacturing Technology, 60, pp.145-148, 2011.
2. Draganescu. F., Gheorghe. M., and Doicin. C. V., “Models of Machine Tool Efficiency and Specific Consumed Energy,” J. of Materials Processing Technology, 141, pp. 9-15. 2003.
3. Avram. O. L., and Paul. X., “Evaluating the Use Phase Energy Requirements of a Machine Tool System,” Journal of Creaner Production, 19, pp. 699-711(2011).
4. Ryuta S. and Masaomi T. “Modeling and Controller Tuning Techniques for Feed Drive Systems,” Proceedings of the ASME Dynamic Systems and Control Division, Part A, DSC-Vol. 74-1, pp.669-679, 2005.
5. Akio H., Ryuta S. and Keiichi S. “Measurement and Simulation of Energy Consumption of Feed Drive Systems,” Int. J. of mechanics Engineering and Automation, Vol. 4, No. 3, pp. 203-212, 2014.

International Symposium on Green Manufacturing and Applications (ISGMA 2016) OP017
NOMENCLATURE A = Areal density F = Reflection coefficient h = Thickness m = Bullet’s mass M1 = Dry weight M2 = Wet weight M3 = Suspended weight P = Porosity T = Transmission coefficient νi = Bullet’s initial velocity νr = Bullet’s residual velocity ρ = Density ΔEA = Energy absorbed by the target
1. Introduction Ceramics with high-strength fabric or ceramic/metal composites
(CMC) are a widely used impact resistant material with interfacial adhesion. Continued advancements in defense technology have led to improved armor, tank, aircraft, and soldier protection equipment. Therefore, developing stronger, lighter ceramic material is an industry focus. Currently, high-strength aluminum oxide (Al2O3), silicon carbide (SiC), and boron carbide (B4C) are all typically used in protective equipment, but Al2O3, which is cheap and easily accessible, is more commonly used in experiments. Numerous studies have also conducted numerical simulation analysis on the ballistic performance of Al2O3 [1-3]. Morka et al. (2012) examined the numerical simulation results of not only Al2O3 but also SiC and B4C to analyze their ballistic performances [2]. Liu et al. (2013) investigated the ballistic performance of SiC for various sintering conditions [4].
Recent studies on protective material have focused on CMCs composed of different ceramics and different backings. These ceramic/high-tensile backing composite structures use two impact
Ballistic Performance Assessment of Al2O3/Ti Functionally Graded Material
Yu-Liang Chen1, Chuan-Cheng Chang1, Meng-Chiao Wu2,# and Wei-Lun Chen1
1 Dept. of Power Vehicle and Systems Engineering, Chung Cheng Institute of Technology, National Defense University, No.75, Shiyuan Rd., Daxi Dist., Taoyuan City 33551, Taiwan 2 School of Defense Science, Chung Cheng Institute of Technology, National Defense University, No.75, Shiyuan Rd., Daxi Dist., Taoyuan City 33551, Taiwan
# Corresponding Author / E-mail: [email protected], TEL: +886 3 3809257#118
KEYWORDS :Functionally graded materials, Composite, Ballistic test, Simulation
Functionally graded material (FGM) has become increasingly popular due to the unique performance resulting from its continuous variation in material structure, composition, and performance over thickness. This study used power metallurgy to produce an FGM composed of alumina (Al2O3) and titanium (Ti) and evaluated the FGM’s ballistic performance with ballistic test and finite element simulation. The results were compared with the ballistic performance of traditionally produced ceramic/metal composite (CMC) and a single-layer Al2O3 ceramic. The ballistic test used 0.30 caliber armor piercing (AP) bullets to assess the ballistic performance of FGM, CMC, and Al2O3 and calculated the energy absorbed by each structure. The results of the ballistic test showed that the FGM fragments produced during ballistic impact were smaller than CMC fragments. Furthermore, the FGM fragments remained in one piece, while CMC fragments delaminated. Compared with CMC, FGM absorbed approximately 9% more energy and was 4% lighter. In addition, FGM absorbed approximately 20% more energy than did Al2O3. This study used Ls-Dyna finite element simulation software to conduct numerical simulation analysis and verification. For ceramic, the simulated brittle material JH-2 (MAT_Johnson_Holmquist_Ceramics) model was used to describe the damage behavior of brittle material under high strain and high stress. In terms of energy absorption, the numerical simulation results were highly consistent with the results of the ballistic test, verifying the accuracy of the numerical simulation analysis. The simulation also depicted the velocity course and stress transfer process for each structure during ballistic penetration.

International Symposium on Green Manufacturing and Applications (ISGMA 2016) resistant mechanisms for protection. First, the high-hardness ceramic is used to passivate the bullet and dissipate the energy from the bullet, limiting the bullet’s capacity to puncture. When the bullet hits the metal or high-tensile backing, the backing undergoes plastic deformation and absorbs the bullet’s residual energy [5]. The problem with using CMCs is that the relative strength of the bonded inter-layer easily affects ballistic performance [6].
Functionally gradient material (FGM) is an alternative to improve ballistic performance in ceramic composites. FGM is both lighter and mitigates ballistic performance problems created by inter-layer bonding in CMCs. Therefore, this study investigated the effect of FGM structure on the ballistic performance of the material.
Currently, few studies have conducted ballistic tests of FGM. The design concept of FGM can be applied to improve the disadvantages of CMCs and enhance the advantages of using protective equipment, thereby satisfying the need for lighter protective equipment. Light-weight applications to the development of armors and tanks are considered crucial technologies that critically influence the military’s mobility and speed. Every nation is actively conducting research on how to improve ballistic performance while decreasing weight in future protection equipment. The FGM design concept could serve as a solution to this enormous challenge [7].
Sarýkan et al. (2012) used power metallurgy to produce FGM. Power metallurgy is the simplest FGM production method and provides a macro-level observation on the separation of FGM interfaces. FGM is currently used in the fields of electronics, chemistry, optics, and medicine [8].
Gupta et al. (2012) produced TiB/Ti FGM and tested it using small caliber bullets, analyzing the bullet penetration depth of each sample to calculate ballistic efficiency and fragment size [9]. Ubeyli et al. (2014) developed SiC/aluminum alloy FGM, testing and analyzing the two types of FGM of same thickness using small caliber bullets. They recommended an FGM thickness of at least 25 mm [10]. In addition to producing actual FGM for testing, other researchers have used numerical simulation to test FGM. For example, Templeton (2007) reduced the cost and time associated with FGM production by demonstrating that AlN/aluminum FGM improved ballistic performance by 15% compared to CMC [11].
In contrast to CMC that can resist significant loads in ballistic tests, FGM has no abrupt change in impedance, no bonded interface, and is lighter than CMC. Despite these advantages, few studies have been conducted on examining ballistic protection applications for FGM and comparing it to CMC and thus, continued human and material resource investments are required to conduct such research.
This study used Ls-Dyna finite element programming to run simulations and compared them with the ballistic test results. For the simulation, material No.110 (MAT_Johnson_Holmquist _Ceramics, JH-2) was selected as the ceramic material model. This model specifically describes the behavior of ceramics and other brittle materials under dynamic loading. McIntosh (1998) selected this model to describe and examine the effect of certain ceramic parameters on penetration depth and ballistic limits [12]. Johnson et al. (1994) used the JH2 model in Ls-Dyna to simulate brittle
material, determining that the Lagrangian and Eulerian methods were suitable and verified that this material model was appropriate to simulate brittle material under significant stress, high strain rate, and high pressure [13]. 2. Sample Production and Test Methods 2.1 Sample Production
This study selected Al2O3 and Ti to fabricate a three-layer FGM by using power metallurgy. The average particle size for the Al2O3 powder was 20 μm, and the average particle size for the Ti powder was 56 μm. The two materials were combined based on the layer ratios outlined in Table 1, finally being sintered together by hot-pressing (HP) at 1400°C and 20 Mpa. After sintering was complete, no cracks or delamination were observed at the macro level (Fig. 1). To determine if pores were present inside the samples, porosity was measured using Archimedes‘ principle. In this method, the sample is first weighed in air to obtain the dry weight (M1). A suitable amount of water is then poured into a beaker, and the sample is submerged in the water until the pores are filled with water, obtaining the wet weight (M2). The sample is then tied to a tension spring and suspended fully submerged into the water to obtain the suspended weight (M3). After obtaining M1, M2, M3, and the water density, the sample density and porosity are calculated using formulas (1, 2).
𝜌𝜌 = 𝑀𝑀1×𝜌𝜌𝐻𝐻2𝑂𝑂𝑀𝑀2−𝑀𝑀3
(1)
𝑃𝑃 = 𝑀𝑀2−𝑀𝑀1𝑀𝑀2−𝑀𝑀3
× 100% (2)
Where ρ is density, P is porosity (%), M1 is dry weight (g), M2 is wet weight (g), and M3 is suspended weight (g).
Table 1. FGM layer ratios.
Layer Material
Layer 1 100% Al2O3
Layer 2 80% Al2O3/20% Ti
Layer 3 50% Al2O3/50% Ti
Fig. 1 FGM three-layer interface.

International Symposium on Green Manufacturing and Applications (ISGMA 2016) OP017
2.2 Ballistic Test For the ballistic test, photo electricity was used to measure the
velocities of 0.30 caliber armor piercing (AP) bullets. Photoelectric screens were used to sense and receive photo strength variance, sending signals to the oscilloscope to calculate the bullet’s velocity. The signal interval produced by two blocked light source represents the time required for the bullet to pass through two screens. The screens were grouped into sets of two and placed 1 m apart. The first set of screens was positioned between the gun barrel and the target, and the first screen was 2 m away from the gun barrel. The second set was positioned behind the target, with the third screen placed 5.4 m away from the gun barrel. The ballistic target was positioned 4.2 m from the gun barrel. The entire test set-up is illustrated in Fig. 2. The samples were limited to a constant thickness of 9 mm to compare the ballistic performance of Al2O3, Al2O3/Ti CMC, and Al2O3/Ti FGM. Assuming that the deformation of the AP bullet after striking the samples is negligible, the change in the bullet’s kinetic energy could be calculated using equation (3) to ascertain the energy absorbed by the sample.
∆𝐸𝐸𝐴𝐴 = 12𝑚𝑚𝑣𝑣𝑖𝑖2 −
12𝑚𝑚𝑣𝑣𝑟𝑟2 (3)
where ΔEA is the energy absorbed by the target (J), m is the bullet’s mass (kg), νi is the bullet’s initial velocity (m/s), and νr is the bullet’s residual velocity after puncturing the sample (m/s).
To compare the different samples, the areal density for each sample can be calculated using the following formula:
𝐴𝐴 = 𝜌𝜌 × ℎ (4) where A is areal density (g/cm2), ρ is density (g/cm3), and h is
thickness (cm)
Fig. 2. Test equipment set-up. 2.3 Numerical Simulation
Fast, safe, and cheap, numerical calculation methods have broad applications in scientific research and engineering technology, and along with theoretical and experimental research, constitute the three pillars of modern scientific technology. However, non-linear problems involving significantly deformed, fractured, melted, or vaporized materials generated following high-speed crashes, impact penetration, explosions, metal stamping, dynamic crack expansion, and fluid-solid coupling, present a series of complicated physical processes that hinder the process of numerical calculations.
This study used Ls-Dyna to simulate and calculate the condition of material after high-speed impact. This software is
composed of three basic modules: pre-processing, solver, and post-processing. First, during pre-processing, a high-speed impact numerical analysis model was built for the projectile and each type of material target. This process involves drawing the model, meshing the network, defining the characteristics of each material, selecting the material model, defining contact methods and control parameters, and setting the boundary conditions. A keyword file is then produced. After the keyword file is input into Ls-Dyna’s solver for computing, LS-PrePost analyzes the mode of fracture of the penetrated target, estimates the projectile’s residual velocity and penetration depth, and graphs the results.
This study built a quarter-size model in Ls-Dyna. First, the 0.30" caliber AP bullet model (Fig. 3) was constructed with copper plating and a steel core. In terms of presenting the results, the quarter-size model could be reflected once on the XY and the YZ planes to restore the authenticity of the test results. After model construction, the material descriptions must be selected in the numerical simulation. Material 3 (Mat_Plastic_Kinematic) was used to describe the bullet’s steel core, and Material 10 (Mat_ Elastic_Plastic_Hydro) was used to describe the copper plating.
Fig. 3. 0.30" caliber AP bullet model.
The samples in this study were all 70 mm in diameter. The first sample, Al2O3, was 9 mm thick, and Material 110 (MAT_Johnson_Holmquist_Ceramics, JH-2) was selected as its material description. In the CMC sample, the Al2O3 layer and the Ti layer were each 4.5 mm thick. JH-2 was selected for the Al2O3 in the CMC sample, and Material 10 (Mat_Elastic_Plastic_Hydro) was used to describe Ti. Each layer in the FGM sample was 3 mm thick, and JH-2 was used to describe each layer. Figs. 4–6 present the meshing of the sample models.
International Symposium on Green Manufacturing and Applications (ISGMA 2016)
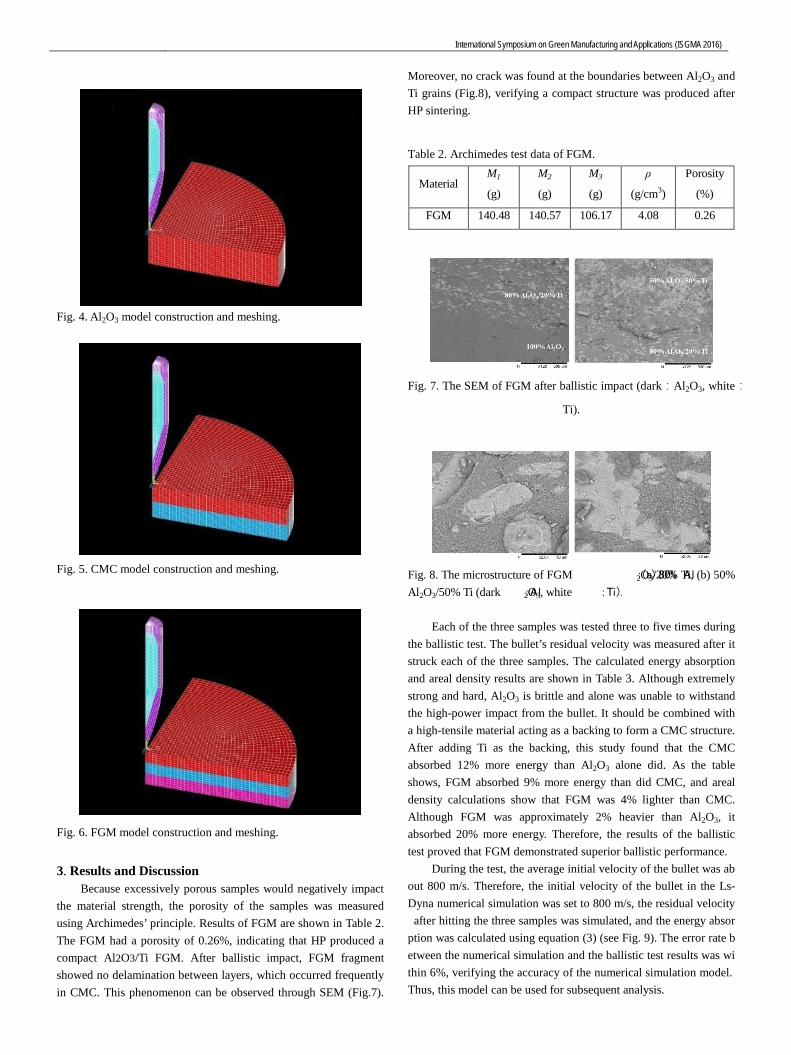
Fig. 4. Al2O3 model construction and meshing.
Fig. 5. CMC model construction and meshing.
Fig. 6. FGM model construction and meshing.
3. Results and Discussion
Because excessively porous samples would negatively impact the material strength, the porosity of the samples was measured using Archimedes’ principle. Results of FGM are shown in Table 2. The FGM had a porosity of 0.26%, indicating that HP produced a compact Al2O3/Ti FGM. After ballistic impact, FGM fragment showed no delamination between layers, which occurred frequently in CMC. This phenomenon can be observed through SEM (Fig.7).
Moreover, no crack was found at the boundaries between Al2O3 and Ti grains (Fig.8), verifying a compact structure was produced after HP sintering.
Table 2. Archimedes test data of FGM.
Material M1
(g)
M2
(g)
M3
(g)
ρ
(g/cm3)
Porosity
(%)
FGM 140.48 140.57 106.17 4.08 0.26
Fig. 7. The SEM of FGM after ballistic impact (dark:Al2O3, white:
Ti).
Fig. 8. The microstructure of FGM :(a) 80% Al2O3/20% Ti, (b) 50% Al2O3/50% Ti (dark :Al2O3, white :Ti).
Each of the three samples was tested three to five times during the ballistic test. The bullet’s residual velocity was measured after it struck each of the three samples. The calculated energy absorption and areal density results are shown in Table 3. Although extremely strong and hard, Al2O3 is brittle and alone was unable to withstand the high-power impact from the bullet. It should be combined with a high-tensile material acting as a backing to form a CMC structure. After adding Ti as the backing, this study found that the CMC absorbed 12% more energy than Al2O3 alone did. As the table shows, FGM absorbed 9% more energy than did CMC, and areal density calculations show that FGM was 4% lighter than CMC. Although FGM was approximately 2% heavier than Al2O3, it absorbed 20% more energy. Therefore, the results of the ballistic test proved that FGM demonstrated superior ballistic performance.
During the test, the average initial velocity of the bullet was about 800 m/s. Therefore, the initial velocity of the bullet in the Ls-Dyna numerical simulation was set to 800 m/s, the residual velocity after hitting the three samples was simulated, and the energy absorption was calculated using equation (3) (see Fig. 9). The error rate between the numerical simulation and the ballistic test results was within 6%, verifying the accuracy of the numerical simulation model. Thus, this model can be used for subsequent analysis.

International Symposium on Green Manufacturing and Applications (ISGMA 2016) OP017
Table 3 Ballistic test data.
Sample Areal
density (g/cm2)
DEA (J)
Avg. DEA (J)
Al2O3-1
3.54
2155.56
1823.81
Al2O3-2 1642.53
Al2O3-3 1842.92
Al2O3-4 1601.90
Al2O3-5 1876.12
CMC-1
3.80
1816.01
2093.18
CMC-2 2056.36
CMC-3 2290.95
CMC-4 2142.47
CMC-5 2160.13 FGM-1
3.64
2160.49
2304.79 FGM-2 2270.24
FGM-3 2483.63
Fig. 9. Comparison between numerical simulation and ballistic test results.
The numerical simulation showed the change in ballistic velocity after the bullet hit the three samples (Fig. 10). As the graph shows, the bullet’s residual velocity after striking FGM was 481.20 m/s, after striking CMC was 490.93 m/s, and after striking Al2O3 was 535.09 m/s.
Fig. 10. Change in ballistic velocity after striking each of the three samples.
The numerical simulation shows that the bullet’s residual speed after hitting Al2O3 did not decelerate after approximately 41μs, indicating that the sample at this time had failed to continue to wear down the bullet, and the bullet was about to puncture the sample (Fig. 11).
Fig. 11. Ballistic strike of Al2O3.
The numerical simulation also shows the bullet striking CMC (Fig. 12). At 33μs, the bullet penetrates the ceramic and enters the metal layer. By using a metal backing to reinforce the ceramic material, the sample could continue to consume the bullet’s kinetic energy and decrease its velocity. The graph clearly shows that with a metal layer, CMC can prolong the abrasion on the bullet, increasing CMC’s capacity to absorb ballistic energy.
Fig. 12. Ballistic strike of CMC.
When the bullet struck FGM (Fig. 13), there is clear velocity attenuation when it penetrated layer 1 at approximately 31 μs. The velocity attenuation gradually slowed as the bullet penetrated layer 2 and layer 3; however, the overall effect created the slowest residual velocity out of the three samples, demonstrating FGM’s superior energy absorption capacity over CMC and Al2O3.
Fig. 13. Ballistic strike of FGM.

International Symposium on Green Manufacturing and Applications (ISGMA 2016)
In CMC, bonding strength is crucial to ballistic capabilities.
Therefore, FGM was designed to continuously vary physical properties from ceramic to metal, thereby increasing ballistic performance by simultaneously meeting the ballistic requirements of ceramics and the backing while avoiding inter-layer bonding strength problems. According to stress-wave theory, because wave resistance [material density (ρ) multiplied by material longitudinal wave velocity (C)] differs by material medium, a wave in the interface between two mediums will simultaneously reflect and transmit. According to stress-wave theory, the wave reflection and transmission coefficients are calculated as follows:
∆𝐹𝐹 = (𝜌𝜌1𝐶𝐶1)−(𝜌𝜌2𝐶𝐶2)(𝜌𝜌1𝐶𝐶1)+(𝜌𝜌2𝐶𝐶2)
(5)
𝑇𝑇 = 2(𝜌𝜌1𝐶𝐶1)(𝜌𝜌1𝐶𝐶1)+(𝜌𝜌2𝐶𝐶2)
(6)
where F is the reflection coefficient and T is the transmission coefficient. The subscript 2 represents the upper material layer near impact.
When F>0 and T>1, meaning that the reflection wave and the transmission wave are identical to the incident wave. The stress wave transfer from the medium with less resistance to the medium with greater resistance, and compression wave (extension wave) reflect compression wave (extension wave). This phenomenon resembles a stress wave transferring from a soft material to a hard material.
When F<0 and 0<T<1, meaning that the reflection wave is the inverse of and the transmission wave is identical to the incident wave. The stress wave transfer from the medium with greater resistance to the medium with less resistance, and the compression wave (extension wave) reflect extension wave (compression wave). This phenomenon resembles a stress wave transferring from a hard material to a soft material.
When F=0 and T=1, the incident waves are completely transmitted without reflection. When the stress waves transfer to an interface between two mediums, the stress waves will not reflect as long as those mediums have identical wave resistance.
When an impact causes stress waves to transfer from a hard material to a soft material, the compression waves in the vertical sample will reflect extension waves. Ceramics are known to be unable to withstand significant tension [14] and are prone to fracture and separate from the backing. As the remains of the CMC after ballistic impact show in Fig. 14, although this structure can absorb a significant amount of energy, the ceramic Al2O3 layer completely separated from the metal Ti layer and was unable to withstand a second strike. Furthermore, the bonded interface in CMC affects ballistic performance. The remains of the ballistic impact on FGM are shown in Fig. 15. No delamination was observed in the FGM sample because the wave resistances in each layer were similar.
Fig. 14. CMC sample after ballistic impact.
Fig. 15. FGM sample after ballistic impact.
Energy absorption capacity can be analyzed based on the
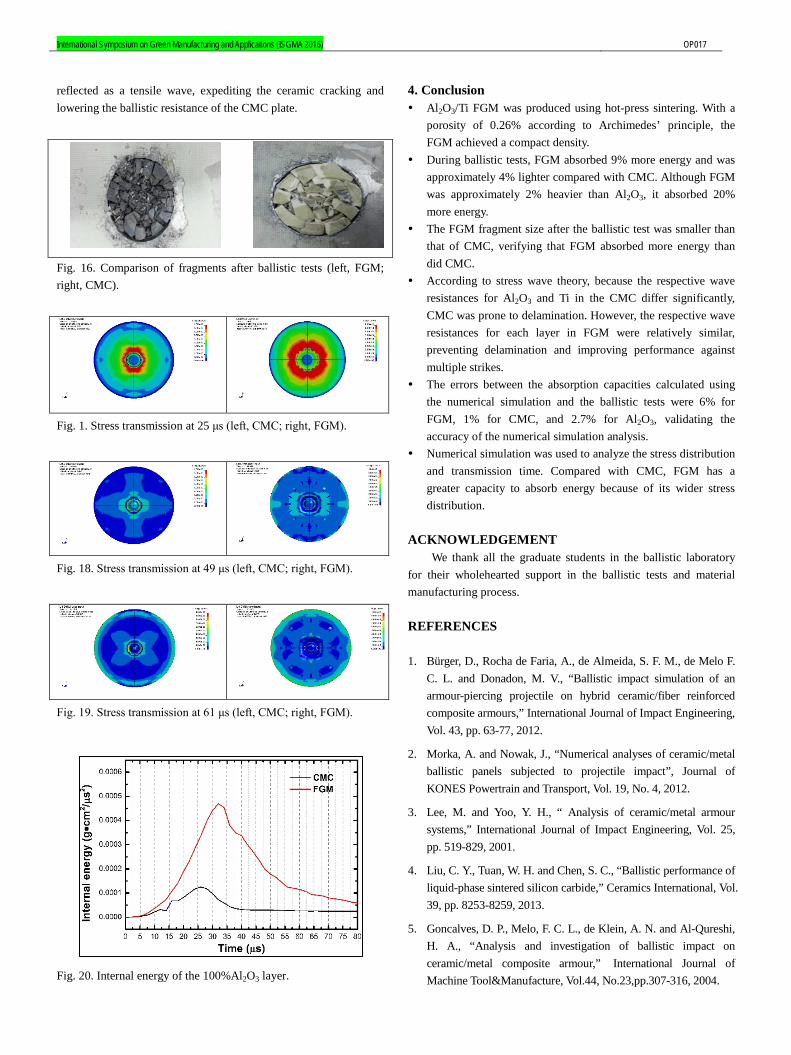
fragment size of the ceramic after the ballistic impact test. As the fragment sizes for FGM and CMC after the ballistic test in Fig. 16 clearly show, FGM produced smaller fragments than CMC did. Therefore, FGM has a significantly greater energy absorption capacity compared with CMC. Based on the numerical simulation, from ballistic impact to exit, stress was more widely distributed over a longer time in FGM than in CMC, verifying the test results.
The numerical simulation illustrated the stress distribution over time for FGM and CMC during the ballistic impact (Fig. 17-19). This study examined the stress distribution for each sample at 25 μs, 49 μs, and 61 μs. The stress is more widely distributed in FGM than in CMC at 25 μs and 49 μs, demonstrating that FGM can absorb more energy than CMC. At 61μs when the bullet is about to penetrate the target, the stress in FGM is still being transferred, indicating that FGM continues to absorb energy, improving ballistic performance.
In LS-DYNA software, the internal energy, or total strain energy, is calculated by multiplying the stress and strain produced in six directions of every element. The simulation results showed that the maximal internal energy in the CMC occurred at 26 μs, 6 μs earlier than that in the FGM (Fig. 20). This confirmed that the adhesive layer caused the reflection coefficient to increase, which in turn increased the reflected energy that induced the 100% Al2O3 ceramic layer of the CMC to reach maximal strain energy, causing the ceramic to fracture early. In addition, the compression wave was
International Symposium on Green Manufacturing and Applications (ISGMA 2016) OP017
reflected as a tensile wave, expediting the ceramic cracking and lowering the ballistic resistance of the CMC plate.
Fig. 16. Comparison of fragments after ballistic tests (left, FGM; right, CMC).
Fig. 1. Stress transmission at 25 μs (left, CMC; right, FGM).
Fig. 18. Stress transmission at 49 μs (left, CMC; right, FGM).
Fig. 19. Stress transmission at 61 μs (left, CMC; right, FGM).
Fig. 20. Internal energy of the 100%Al2O3 layer.
4. Conclusion Al2O3/Ti FGM was produced using hot-press sintering. With a
porosity of 0.26% according to Archimedes’ principle, the FGM achieved a compact density.
During ballistic tests, FGM absorbed 9% more energy and was approximately 4% lighter compared with CMC. Although FGM was approximately 2% heavier than Al2O3, it absorbed 20% more energy.
The FGM fragment size after the ballistic test was smaller than that of CMC, verifying that FGM absorbed more energy than did CMC.
According to stress wave theory, because the respective wave resistances for Al2O3 and Ti in the CMC differ significantly, CMC was prone to delamination. However, the respective wave resistances for each layer in FGM were relatively similar, preventing delamination and improving performance against multiple strikes.
The errors between the absorption capacities calculated using the numerical simulation and the ballistic tests were 6% for FGM, 1% for CMC, and 2.7% for Al2O3, validating the accuracy of the numerical simulation analysis.
Numerical simulation was used to analyze the stress distribution and transmission time. Compared with CMC, FGM has a greater capacity to absorb energy because of its wider stress distribution.
ACKNOWLEDGEMENT
We thank all the graduate students in the ballistic laboratory for their wholehearted support in the ballistic tests and material manufacturing process. REFERENCES 1. Bürger, D., Rocha de Faria, A., de Almeida, S. F. M., de Melo F.
C. L. and Donadon, M. V., “Ballistic impact simulation of an armour-piercing projectile on hybrid ceramic/fiber reinforced composite armours,” International Journal of Impact Engineering, Vol. 43, pp. 63-77, 2012.
2. Morka, A. and Nowak, J., “Numerical analyses of ceramic/metal ballistic panels subjected to projectile impact”, Journal of KONES Powertrain and Transport, Vol. 19, No. 4, 2012.
3. Lee, M. and Yoo, Y. H., “ Analysis of ceramic/metal armour systems,” International Journal of Impact Engineering, Vol. 25, pp. 519-829, 2001.
4. Liu, C. Y., Tuan, W. H. and Chen, S. C., “Ballistic performance of liquid-phase sintered silicon carbide,” Ceramics International, Vol. 39, pp. 8253-8259, 2013.
5. Goncalves, D. P., Melo, F. C. L., de Klein, A. N. and Al-Qureshi, H. A., “Analysis and investigation of ballistic impact on ceramic/metal composite armour,” International Journal of Machine Tool&Manufacture, Vol.44, No.23,pp.307-316, 2004.

International Symposium on Green Manufacturing and Applications (ISGMA 2016) 6. Oberg, E.K., Dean, J. and Clyne, T.W., “Effect of inter-layer
toughness in ballistic protection systems on absorption of projectile energy,” International Journal of Impact Engineering, Vol. 76, pp. 75-82, 2015.
7. Chin, E. S. C., “Army focused research team on functionally graded armor composites,” Materials Science and Engineering A259, pp. 155-161, 1999.
8. Sarýkan, B., Balcý, E., Mustafa Ubeyli, M., Necip, C. C.., “Investigation of the aging behaviour of the function gradient material consisting of boron carbide and an aluminum alloy,” Materials and technology, Vol. 46, No. 4, pp. 393-397, 2012.
9. Gupta, N., Bhanu, P. V. V., Madhu, V. and Basu, B., “Ballistic studies on TiB2-Ti functionally graded armor ceramics,” Defence Science Journal, Vol 62, No 6, pp. 382-389, 2012.
10. Ubeyli, M., Balci, E., Sarikan, B., Oztas, M. K., Camuscu, N., Yildirim, R. O. and Keles, O., “The ballistic performance of SiC-AA7075 functionally graded composite produced by powder metallurgy,” Materials and Design, Vol. 56, pp. 31-36, 2014.
11. Ayzenberg-Stepanenkoa, M. and Osharovichb, G., “Numerical simulation of high-speed penetration-perforation dynamics in layered armor shields, ” Cornell University Library, 2012.
12. Templeton, D. W., Gorsich, T. J., and Holmquist T. J., “Computational study of a functionally graded ceramic-metallic armor,” 23rd International Symposium on Ballistics, 2007.
13. Mcintosh, G., “The Johnson-Holmquist Ceramic Model as Used
in Ls- Dyna2D,” Defence Research Establishment Centre, 1998.
14. Johnson, G. R. and Holmquist, T. J., “An improved computational constitutive model for brittle materials,” Alliant Techsystems, 1994.
15. Feli, S. and Asgari, M. R. “Finite element simulation of ceramic/composite armor under ballistic impact,” Composites: Part B, Vol. 42, pp. 771-780, 2011.

International Symposium on Green Manufacturing and Applications (ISGMA 2016) OP029
1. Introduction
3D printing technology has been mainly applied in many fields from medical products to automobiles, electric home appliances and so on. Currently, with the rapid growth of this technology, the selection of the most appropriate 3D printing technology to meet the printed part’s requirements is really difficult due to having a large number of 3D printing methods in the market. Each method has its own advantages, applications, and limitations. Decision on which one is suitable for the printed part requires users to consider the interactions between the quality, properties, cost, build envelope, build time and so on.1,2,5
In the medical field, 3D printing techniques and different materials for printing medical products have been proposed. 3D printing opens up the capabilities for customization in a wide variety of applications. Medical devices with bio-compatible and drug-contact materials can be produced. These devices are perfectly suited for a particular individual. Fig.1 shows a difficult stage to have decisions about the selection of the appropriate technology in creation of a prototype in the context of a number of presented methods such
as SLM (Selective Laser Melting), DLMS (Direct metal laser sintering).
Fig.1 Necessity for selecting the appropriate 3D printing method
A Knowledge based System for 3D Printing Process Planning
Hong-Seok Park1,# and Ngoc-Hien Tran2 1 School of Mechanical and Automotive Engineering, University of Ulsan, 93, Daehak-ro, Nam-gu, Ulsan, 44610, South Korea
2 University of Transport and Communications, Lang Thuong Ward, Dong Da District, Hanoi, Vietnam # Corresponding Author / E-mail: [email protected], TEL: +82-52-259-2294, FAX: +82-52-259-1680
KEYWORDS : 3D printing method, Knowledge based system, Medical products, Decision making, Materials
Several traditional manufacturing methods can be replaced by 3D printing technologies where three dimensions are built by subsequent overprinting. 3D printing becomes one of the essential technologies that allow manufacturers to improve product quality as well as reduce time and cost of products. 3D printing allows transferring quickly the designs from concept to functional prototype that can cut product development schedule to weeks or months. Currently, there are a large number of 3D printing methods in the market. Selection of an appropriate method for a printed object is a difficult decision due to lack of bench mark standards and industry experiences with most of these methods. The paper presents a knowledge based system for selecting an appropriate 3D printing method to print medical products. From product requirements, printing methods were analyzed and evaluated to decide which one fulfills the product requirements in the best way. For realizing the knowledge based system, databases about materials as well as 3D printing methods were built; rules for decision making were proposed. The system allows selecting an appropriate 3D printing method from inputted product requirements.
International Symposium on Green Manufacturing and Applications (ISGMA 2016)
2
The paper presents a knowledge based system for selecting the best 3D printing method in consideration of the materials, layer thickness, accuracy and printing speed. The developed system enables users to extend databases of the printed materials as well as the 3D printing methods. 2. Literature Review
Selection of the best 3D printing method among a large number of 3D printing methods in the market is difficult task which depends on factors as well as selection criteria. Pham and Gault2 have an overview of the 3D printing technologies and comments on their strengths and weaknesses.
In the literature, these are many researches to drive out the methodology for selecting which one fulfils the product requirements the best way such as analytic hierarchy process,3 a rule based expert system.5
Bauer et al.4 proposed a rapid prototyping system selector for selecting the best combination of materials and printing machines to fabricate a prototype rather than to select the most suitable printing process.5
Masood and Soo proposed a rule based expert system for selecting the printing method with 39 rapid prototyping systems commercially available from 21 manufacturers worldwide6 However, it is difficult to order the ranking of the most suitable printing systems using conditional statements.5 3. Engineering Model for 3D Printing Selection
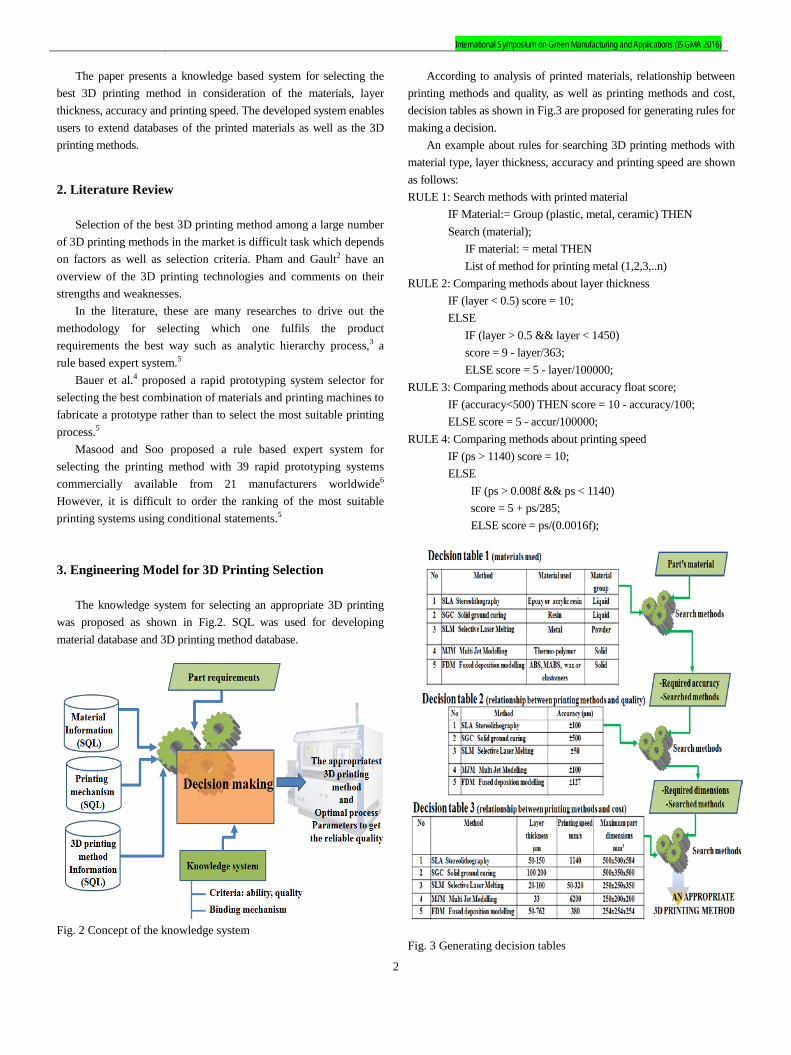
The knowledge system for selecting an appropriate 3D printing
was proposed as shown in Fig.2. SQL was used for developing material database and 3D printing method database.
Fig. 2 Concept of the knowledge system
According to analysis of printed materials, relationship between printing methods and quality, as well as printing methods and cost, decision tables as shown in Fig.3 are proposed for generating rules for making a decision.
An example about rules for searching 3D printing methods with material type, layer thickness, accuracy and printing speed are shown as follows: RULE 1: Search methods with printed material IF Material:= Group (plastic, metal, ceramic) THEN Search (material); IF material: = metal THEN List of method for printing metal (1,2,3,..n) RULE 2: Comparing methods about layer thickness IF (layer < 0.5) score = 10; ELSE IF (layer > 0.5 && layer < 1450) score = 9 - layer/363; ELSE score = 5 - layer/100000; RULE 3: Comparing methods about accuracy float score; IF (accuracy<500) THEN score = 10 - accuracy/100; ELSE score = 5 - accur/100000; RULE 4: Comparing methods about printing speed IF (ps > 1140) score = 10; ELSE IF (ps > 0.008f && ps < 1140) score = 5 + ps/285; ELSE score = ps/(0.0016f);
Fig. 3 Generating decision tables

International Symposium on Green Manufacturing and Applications (ISGMA 2016) OP029
4. Development of the Knowledge System
Fig.4 shows steps in flowchart for selecting the best 3D printing method. System description, material database generation, 3D printing method database generation and selection of the best printing method are four modules of the developed system. The best 3D printing method is recommended by the system in consideration of material database, printing method database and printed part requirements.
Fig. 4 Systematic procedure for selecting the 3D printing method
For programming the proposed system, the structured chart is shown in Fig. 5. C# programming language was used for programming the system. Databases were built using SQL 2008. The developed system requires the .Net framework 4.0 as platform for running. The screenshot of the developed system is shown in Fig. 6.
Fig. 7 shows the system functionality for generating the material database. Access function (shown by 1) enables user to active the interface. The “Add” function (shown by 2) is used to input new material properties to the database. Material properties are shown by 3. Then, generation of material database is shown by 4.
Screenshot for generating printing method database is shown in Fig 8. After accessing the interface (shown by 1) the “Add new” function (shown by 2) enables user to active the 3D printing information (shown by 3). These information are stored to database using the “Save” function (shown by 4).
Fig. 5 Structured chart for programming the system
Fig.6 Screenshot of developed modules

International Symposium on Green Manufacturing and Applications (ISGMA 2016)
4
Fig. 7 Screenshot for generating material database
Fig. 8 Screenshot for generating printing method database
Fig. 9 shows screenshot of the system for selecting the best printing method. After accessing the interface (shown by 1) “The best 3D printing” function (shown by 3) enables user to get the best 3D printing method according to the part requirements (shown by 2). 5. Conclusions
An appropriate printing method is selected depending on the material characteristics and the requirement of the final quality of a product. This research proposes to develop a knowledge system for selecting the best 3D printing in medical field, in which the concepts of the knowledge system as well as the modules of the system were presented.
ACKNOWLEDGEMENT
This work was supported by the ICT R&D program of MSIP/IITP. [B0101-14-1081, Development of ICT based software platform and service technologies for medical 3D printing applications].
Fig. 9 Screenshot for selecting the best printing method REFERENCES 1. Braglia, M., and Petroni, A., “A management-support technique for
the selection of rapid prototyping technologies,” Journal of Industrial Technology, Vol. 15, No. 4, pp. 1-6, 1999.
2. Pham, D.T., and Gault, R.S., “A comparison of rapid prototyping technologies,” International Journal of Machine Tools & Manufacture, Vol.38, pp. 1257–1287, 1998.
3. Borille, A.V., and Gomes, J.O., “Selection of additive manufacturing technologies using decision methods,” Rapid Prototyping Technology – Principles and Functional Requirements, Intech Publisher, pp. 29-54, 2011.
4. Bauer, J., Klingenberg, H.H., and Muller, H., “Computer based rapid prototyping system selection and support,” in: Proceedings of Conference on Time Compression Technologies, The Heritage Motor Center, Gaydon, UK, pp.241–250, 1996.
5. Venkata Rao, R., and Padmanabhan, K.K., “Rapid prototyping process selection using graph theory and matrix approach,” Journal of Materials Processing Technology, Vol. 194, pp. 81–88, 2007.

International Symposium on Green Manufacturing and Applications (ISGMA 2016) OP029
6. Masood, S.H., and Soo, A., “A rule based expert system for rapid prototyping system selection,” Robotics and Computer Integrated Manufacturing, Vol. 18, pp. 267–274, 2002.

International Symposium on Green Manufacturing and Applications (ISGMA 2016) OP038
NOMENCLATURE η = viscosity 𝛾 = shear rate n = Power-law indeex
1. Introduction
Porous metal has extraordinary properties such as low density, high strength-to-weight ratio, large specific surface, high gas and liquid permeability, high thermal conductivity and excellent energy absorption. Because of these advantages, there are various manufacturing methods of producing micro-porous metal foam.1 Porous structures can be categorized into open porous and closed porous. Closed porous structures can be used in applications that need light-weight structural elements with better sound and impact energy absorption. Open porous structures can be used for high-performance applications such as heat exchangers and heat sinks for thermal management, and also for medical implants, filters and electrodes for biological and chemical reactions. Pores can be produced by PIM process. Various beneficial characteristics of these materials are listed
by Heaney et al.2 In this research, PMMA used as powder space holder because of high rigidity, thermal resistance, non-reactiveness to metal powder and stiffness. PMMA also exhibits compatible mixing with wax and polymeric binders.3 To make micro porous structure, Powder injection molding (PIM) is used. PIM can make complex parts at low cost and suitable for mass production of small metal parts. There are 4 steps involved in forming a component by PIM : 1) Mixing 2) Injection molding 3) Debinding 4) Sintering.4 For successful Injection molding, Analysis of feedstock’s rheological characteristic is important. Viscosity is one of the most important factor in the feedstock rheology. Also feedstock homogeneity is significant factor for viscosity. There is few studies about feedstock rheology including powder space holder. Therefore, this study investigated the effects of size and volume fraction of PMMA. 2. Experimental Procedure 2.1 Materials
The metal powders used in this experiments are SUS 316L (ATMIX Inc., Japan). The powders and Binders characteristics are given in Table 1 and Table 2. Polymethyl methacrylate (PMMA, Sunjin chemical Inc., Korea) used as powder space holder and it’s
Rheological Characteristics of Powder Injection Molding Feedstock with Powder Space Holder
Sangjune Park1 and Seokyoung Ahn1,# 1 Department of Mechanical Engineering, Pusan National University, 2, Busandaehak-ro 63beon-gil, Geumjeong-gu, Busan, 46241, South Korea
# Corresponding Author / E-mail: [email protected], TEL: +82-51-510-2471
KEYWORDS : Powder injection molding, Powder space holder, Rheology
Powder injection molding using a powder space holder is one of the important fabrication technology for the net-shape production of micro-sized porous and complex metal products. Spherical shape polymethyl methacrylate (PMMA) was used as space holder because of high rigidity, thermal resistance, non-reactiveness to metal powder and stiffness. PMMA also exhibits compatible mixing with wax and polymeric binders. For successful manufacturing, rheological behavior of PIM feedstock must be characterized and comprehended. In this study, SUS 316L stainless steel powder, binder systems (Paraffin wax, polypropylene, polyethylene, stearic acid) and 3 different size of PMMA were used for powder injection molding feedstock. To find out the effect of PMMA, we prepared six different feedstock. Feedstock without PMMA and including PMMA but changed the PMMA size and volume fraction. We investigate each feedstock’s rheological characteristics by using capillary rheometer.

International Symposium on Green Manufacturing and Applications (ISGMA 2016) characteristics are given in Table 3. In Table 1, D50 means the particle sizes at 50 percent points on the particle size distribution.
Table 1 Metal powder (SUS 316L) characteristics used in this study
SUS 316L Particle size(D50) Density(g/cm3) 8.10 μm 7.95
Table 2 Binder characteristics used in this study
Property PW PP PE SA Density(g/cm3) 0.92 0.92 0.93 0.95
Melting temperature()
51 78 120 53
Decomposition temperature()
242-280 464-481 464-471 246-275
Table 3 Powder space holder (PMMA) characteristics used in this study
PMMA Particle size Density(g/cm3) Melting
temperature() P1 20 μm 1.19 165 P2 50 μm 1.19 165 P3 80 μm 1.19 165
2.2 Mixing
Twin-screw Extruder type of Mixer (CetaTech Inc., Korea) is used to make feedstock. Setting temperature is 150 because of PMMA melting temperature. To find out the effect of PMMA size and volume fraction, we make 6 different feedstock. There are feedstock characteristics in the Table 4, 5. Put pre-mixed powder-powder space holder-binder mixtures into the machine then mixtures pass the various degree of screw. To get a homogeneity of feedstock, the experiment is repeated three times. Table 4 Feedstock number and solid loading to find out the effect of PMMA size
Feedstock number
SUS 316L (vol%)
PMMA (vol%) Binder system
(vol%) F1 60 0 40 F2 40 20(P1) 40 F3 40 20(P2) 40 F4 40 20(P3) 40
Table 5 Feedstock number and solid loading to find out the effect of PMMA volume fraction
Feedstock number
SUS 316L (vol%)
PMMA (vol%) Binder system
(vol%) F1 60 0 40 F3 40 20 40 F5 30 30 40 F6 20 40 40
2.3 Rheological measurements
Among the feedstock characteristics, viscosity is one of the most important factor and viscosity should be stable. The viscosity of the feedstock was measured by Capillary rheometer (Rosand RH7, Malvern instruments Ltd, UK). Cavity of Capillary rheometer
heated until the temperature becomes 150. Put feedstocks into the heated cavity and it is forced through a die by ram. While feedstocks pass through a die, ram position, pressure, shear rate, shear stress, viscosity, ram speed are measured. Capillary rheometer is proper rheometer to get a viscosity for high shear rate. So we set shear rate range as 100-2000/s. By setting the temperature as follows, we could get a viscosity and viscosity variation at various shear rate. 3. Result 3.1 Capillary rheometer 3.1.1 Effect of PMMA size
To find out the effect of PMMA size, PMMA size is changed (20 μm, 50 μm, 80 μm). Fixed solid loading is SUS 316L : Powder space holder : Binder = 40:20:40 vol%, binder fraction is 40 vol%. In Fig. 1, there are results of capillary rheometer for different PMMA sizes. X-axis of graph is shear rate and Y-axis of graph is viscosity. F1 has no PMMA, F2 has 20 μm PMMA, F3 has 50 μm PMMA, F4 has 80 μm PMMA. To analyze the characteristics of the graph, Power law model is used. F1 shows η = 4323.3𝛾−0.681, F2 shows η = 1300.3𝛾−0.545, F3 shows η = 1135.8𝛾−0.534, F4 shows η = 994.04𝛾−0.52 . Therefore n values are 0.319(F1), 0.455(F2), 0.466(F3), 0.48(F4). All values of n is smaller than 1, so fluids shows Shear-thinning fluid behavior. Also Powder size is getting bigger, viscosities decrease and shows less sensitivity of viscosity on the shear rate. Feedstock including PMMA shows less viscosity than feedstock without PMMA.
Fig. 1 viscosity results of F1, F2, F3, F4 3.1.2 Effect of PMMA volume fraction
To figure out the effect of PMMA volume fractions, only 50μm PMMA used and PMMA volume fractions are changed (20 vol%, 30 vol%, 40 vol%). In Fig. 2, there are results of capillary rheometer for different PMMA volume fractions. F1, F3, F5, F6 are the feedstocks that have 0 vol% PMMA, 20 vol% PMMA, 30 vol% PMMA, 40vol% PMMA. PMMA volume fraction replace the SUS 316L volume fraction. It means that PMMA volume fraction increase, SUS 316L volume fraction decrease. F1, F3, F5, F6 are represented by η = 4323.3𝛾−0.681 , η = 1135.8𝛾−0.534 , η =
10
20
40
80
160
50 100 200 400 800 1600 3200
Visc
osity
(Pa.
s)
Shear rate(/s)
F1 F2
F3 F4

International Symposium on Green Manufacturing and Applications (ISGMA 2016) OP038
548.95𝛾−0.451, η = 214.54𝛾−0.345. Using the previous formula, calculate the n values as follows : n=0.319(F1), n=0.466(F3), n=0.549(F5), n=0.655(F6). All values of n is smaller than 1, therefore fluids shows Shear-thinning fluid. Also PMMA vol% increase, viscosity decrease and shows less sensitivity of viscosity on the shear rate. Compared with the results of PMMA size effect, volume fractions drop viscosity more. These effects easily observed in the graphs. Depending on the results, it can be seen that the metal powders have more effect on the viscosity than the PMMA.
Fig. 2 viscosity results of F1, F3, F5, F6 4. Conclusions
In this study, we investigated the effect of powder space holder to the PIM feedstock using capillary rheometer. PMMA is used as powder space holder. To find out the critical solid loading, Torque rheometer is used. For PIM feedstock, viscosity is one of the most important rheological characteristic. Using Capillary rheometer, viscosity is measured. Making 6 different feedstock then measured the effect of PMMA in three ways. 1. PMMA size increase, viscosity of feedstock decrease. 2. Increasing of PMMA volume fraction drops viscosity of feedstock more than result of 1. 3. In the case of wall slip, PMMA size and volume fraction increase slip velocity decrease. 4. Increasing of PMMA volume fraction drop slip velocity more than increase of PMMA size. ACKNOWLEDGEMENT
This work was supported by the National Research Foundation of
Korea (NRF) grant funded by the Korea government (MSIP) (No. NRF-2012M2B2B1055503) and NRF-2013R1A1A2060197 REFERENCES
1. A. Manonukul, N. Mueya, F. Leaux, S. amaranan, Effects of replacing metal powder space holder on metal foam produced by metal injection molding, Journal of Materials Processing Technology, 210, (2010), 529-535.
2. Heaney, D.F., Gurosik, J.D., and Binet, C., Isotropic forming of porous structures via metal injection molding, Journal of Material Science, 40, 973-981, 2005.
3. K. nishiyabu, Powder space holder metal injection molding (PHS-MIM) of micro-porous metals, 2012, Handbook of metal injection molding.
4. Randall M. German, Powder injection molding, 1990, Cambridge Univ Press.
10
20
40
80
160
50 100 200 400 800 1600 3200
Visc
osity
(Pa.
s)
Shear rate (/s)
F1 F3
F5 F6

International Symposium on Green Manufacturing and Applications (ISGMA 2016) OP050
NOMENCLATURE a = directional orientation of the system h = strip thickness with strip thickness and strip thickness strip thickness
1. Introduction
Designers in recent product development, as well as the early stage of design, manufacture of the product in the later transportation, there is a need for consideration to the use stage. It is noted as an element for improving the competitiveness of products that fundamentally shorten the design cost of the product development cycle reduction. However, it is not easy to grasp the problem. This is because the design team and engineering team, production team, through to the evaluation team, and there are departments and various teams for a variety of product development, is a problem that occurs in each part, and some of the circumstances, various This is because with the variables. Therefore, the design process for the design and evaluation and re-design process is almost is advanced at the same time has been generalized.. For front loading design is a particular need for the initial product design information is established. Based on this, evaluation of the virtual prototyping is performed. Software is utilized that Multibody Dynamics in such a process. In order to reduce design time and cost,
take advantage of the expert of the know-how of product development and a variety of software tools in that you use the tool of such an interpretation, to understand the mutual relationship between the constraints and data is also required experience gained engaged in a relatively long period of time of the design part. However, the development of these tools lefts a huge amount of data on the design, also it is difficult to manage the data. Among the data, is considered more meaningful if it is possible to extract a new feature existing designer did not know a method of improving the efficiency in more Design.
In this study, to consider the safety of the early stages of plant module transport in the modular design of the plant, consider this in advance to the initial design. It is considered as an important design factor for transport during the plant module designing. Plant module, it is essential to the design of the fastening device for safe transport of maritime and land transport of modules. To this design, not only static behavior analysis, dynamic analysis is also required, each land, experimental conditions of maritime and land environment is necessary. Only on land transportation, it is required to transmit to the designer attribute information in consideration of the module transporting. For this purpose, first, it is necessary to collect the data of the fastening device and modular plant on the various paths. For this purpose, after executing the simulation, the modular system for automatically extracting the resulting data is required based on certain input information.
Development of Automation System For Constraints Extraction During Plant Module Transportation
Hee Chan Kim1, Min Hyuk Woo1 , Hyun-Tae Hwang1, Kweon Woo Moon1, and Soo-Hong Lee1
1 School of Mechanical Engineering, Yonsei University, 50, Yonsei-ro, Seodaemun-gu, Seoul, 03722, South Korea # Corresponding Author / E-mail: [email protected], TEL: +82-2-2123-2823, FAX: +82-2-312-2159
KEYWORDS : Multi-body dynamics, Modular plant, Transportation, Automation System
To improve the plant design and construction quality, and reduce the plant construction time in the cold land, and by reducing the cost, the overseas market share of the Construction Department and designed to ensure a high value-added engineering capabilities of domestic EPC industry expanded, there at the time required PLM-based plant modular design technology development business of state-led in order to discover new promising business areas. In this study, aims to develop an optimized design technology and knowledge-based design technology of collaboration unit module of the plant based on the transport assessment. Prior to build an automated system for the collaboration support system was constructed an automated system for the pre-verification. The input conditions of the user, to minimize such weight path and plant module, extracts a specific path constraints, to confirm the effectiveness of the system.

International Symposium on Green Manufacturing and Applications (ISGMA 2016)
Fig. 1 System Architecture for feature abstraction during transportation simulation
2. Development of Automation System
2.1 Multi-body dynamics software
It explored the possibilities ahead for the development of this system. we used a V-rep which is one of the Multi-Body Dynamics Software. Using the API provided by the V-rep, acquires user input data coming from external and applied simulation based on this. We assumed that set the load on fastening device for observation as the main element. The result of the simulation was extracted to an external file. 2.2 Web based automation platform
For the information of the user input element, first, we implemented on the Web. User information enter on the Web is applied through a database to Multibody Dynamic Simulation, the results so that users can see on the Web. it was to build a platform. Based on this, it was confirmed the possibility of the system construction in the future. 2.3 Result data analysis
In the method of distributing the result of the extracted through simulation for the user, it is first display mode through the graph extracted Raw data. For this purpose, specific section, it is necessary to interpret the relationship between the data of the various variables and results, it is considered possible to transmit the new attribute information to the designer on the basis of this. In the data analysis, data mining, machine learning such as pattern recognition would be able to provide a more useful knowledge. 3. Conclusions
To construct a system which transmits meaningful and useful
information to designer considering transportation stage of the initial design stage of the plant modules is the ultimate goal of this study designer, the automation system must precede. Using the V-rep for that, and to build a Web-based automation system, now look sure to allow the possibility, by utilizing a more accurate and reliable software, after the extracted data, based on this, perform data analysis, we are planning to deliver the results and raw data to the user. Currently, extracts the effective result value through potential and API automation system. In the future, there are plans to go worrying about how to analyze the data on the basis of the engineering data through the research and study of the data analysis method. To derive the correlation between the input data and results data and when it is carried out transport of pre-verification work in designing the future of the designer, contribute to the competitiveness such as reduce the product development time and cost. REFERENCES 1. KRISTIANSEN, Svein. Maritime transportation: safety
management and risk analysis. Routledge, 2013.
2. THOMKE, Stefan; FUJIMOTO, Takahiro. The Effect of “Front‐Loading” Problem‐Solving on Product Development Performance. Journal of product innovation management, 17.2: 128-142, 2000.
3. BRYDIA, Robert, et al. Development of intelligent transportation system data management. Transportation Research Record: Journal of the Transportation Research Board, 1625: 124-130, 1998.

International Symposium on Green Manufacturing and Applications (ISGMA 2016) OP052
NOMENCLATURE t = time n = sample k = frequency index g(t) = modulated gear meshing vibration X(k) = frequency spectra fs = tooth mesh frequency M = total number of gear mesh harmonics N = total number of samples am = amplitude modulation of a gear mesh harmonic bm = phase modulation of a gear mesh harmonic Xm = amplitude of the m-th meshing harmonic φm = phase of the m-th meshing harmonic SNR = Signal to Noise Ratio TSA= Time Synchronous Averaging FFT = Fast Fourier Transform
1. Introduction
Gearbox fault diagnosis has been an ongoing research for the last few decades. Vibration-based diagnosis is considered as the most commonly used method for gearbox fault diagnosis. The dynamic
characteristics of healthy or faulty gearboxes can usually be observed from the change in the vibration signal, which can be used to infer certain faults in the gearbox system. However, vibration signals measured from gearbox are complex, consisting of multi-component signals associated with vibration signatures from tooth-meshing, gear-shaft rotation, gearbox resonances and measurement noise. The acquired vibration signals often contain a significant level of noise (i.e. a low signal-to-noise ratio (SNR)), making it difficult to obtain an accurate identification of the operational condition of gearbox. Therefore, a special care must be taken when processing the signals used in the vibration-based fault diagnosis. In addition, the need to use contact vibration sensors rules out certain sensor locations, such as regions close to moving components or regions that are exposed to high temperatures or harsh chemical environment.
On the other hand, the use of acoustic-based measurements offers another solution for gearbox fault diagnosis. Although the sound field around the machine may contain abundant fault-related information, very little literature is available on the application of audio frequency acoustic signals to gearbox fault diagnosis.1 This is due to the perception that monitoring of airborne sound from a machine is noisy and complex when used in a normal industrial environment. The acoustic-based condition monitoring has a particular advantage over the vibration-based one. It only requires a non-contact acoustic measurement so that it can be performed at a distance away from the machine, reducing certain safety risk and eliminating the need for
Gearbox Fault Diagnosis via Acoustic and Vibration Measurements
Dennis Hartono1,#, Dunant-Halim1 and Gethin Wyn Roberts2
1 Department of Mechanical, Materials and Manufacturing Engineering, The University of Nottingham Ningbo China, Ningbo, Zhejiang 315100, China 2 Department of Civil Engineering, The University of Nottingham Ningbo China, Zhejiang 315100, China
# Corresponding Author / Email: [email protected], TEL: +86-131-3633-7257
KEYWORDS: Gearbox, Vibration, Acoustic, Fast fourier transform
The work presented in this paper investigates the effectiveness of vibration and acoustic measurements for fault diagnosis of gearbox systems, normally used in a wide range of manufacturing applications. The use of vibration measurements have been common for gearbox fault diagnosis. Although acoustic signals can contain abundant information related to the state-of-health of a gearbox, gearbox fault diagnosis using acoustic measurements is a less visited research area of research compared to the one using vibration measurements. In this work, however, the use of both vibration and acoustic measurements were considered for fault diagnosis, and vibration-acoustic comparative studies were undertaken. A partial removal from of the teeth of a spur gear was used to simulate the typical fault existed in an industrial gearbox. Time Synchronous Averaging was incorporated to provide an accurate fault diagnosis from the raw vibration and acoustic measurements. The use of frequency domain analysis was also investigated to provide further fault diagnostic information. The experimental results demonstrated that the use of non-contact acoustic measurements provides an effective alternative solution for gearbox fault diagnosis.

International Symposium on Green Manufacturing and Applications (ISGMA 2016) special vibration sensors (e.g. high-temperature sensors) with their limited mounting considerations. However, fault diagnosis using acoustic measurements still remain relatively less visited area of research.
In this work, the use of both vibrations and acoustic measurements is considered for identifying certain faults in a gearbox system. The Time Synchronous Averaging (TSA) method was implemented to extract the fault feature from both vibration and acoustic signals that were heavily corrupted by measurement noise. TSA has the capability of presenting the vibration and acoustic signals in terms of the angular location of gear, enabling the identification of gear fault location. Furthermore, the Fast Fourier Transform (FFT) method was then utilized to extract sidebands around gearmesh frequencies to identify the existence of faults in a gearbox.2
This paper is organized as follows: Section 2 provides a brief description about the background theory of TSA and FFT method. Section 3 presents the experimental set-up using a spur gearbox test rig developed at The University of Nottingham Ningbo China. Section 4 discusses the experimental results based on the vibration and acoustic measurements from the gearbox. Finally, Section 5 offers the main conclusion of this work.
2. Theoretical Background 2.1 Time synchronous averaging
Time Synchronous Averaging (TSA) method is commonly used to extract the vibration component, that is contributed from a single gear, from the overall vibration of the gearbox system, which is quite useful for diagnostic purposes. When one of the gear teeth contains a local defect, such as a chipped tooth, it will cause amplitude and phase modulations in vibration signals. The resulting modulated gear meshing vibration is formulated as:3,4
g(𝑡𝑡) = 𝑋𝑋𝑚𝑚1 + 𝑎𝑎𝑚𝑚(𝑡𝑡)cos (2𝜋𝜋𝜋𝜋𝑓𝑓𝑠𝑠𝑡𝑡 + ∅𝑚𝑚 + 𝑏𝑏𝑚𝑚(𝑡𝑡))𝑀𝑀
𝑚𝑚=0
Here, am and bm are the respective amplitude and phase modulation caused by the changes in vibration signals due to the defect. Xm and φm are the respective amplitude and phase of the m-th meshing harmonics, while fs is the tooth meshing frequency of the gear. In this work, TSA method is used to evaluate not only the vibration signals, but also the associated acoustic signals obtained from the experiment. 2.2 Fast fourier transform
For frequency domain analysis, Fast Fourier Transform (FFT) is an efficient computational algorithm that can be used to compute the Discrete Fourier Transform (DFT) of measurement signals, which can be formulated as:5
X(𝑘𝑘) = 𝑥𝑥(𝑛𝑛)𝑒𝑒−𝑗𝑗2𝜋𝜋 𝑁𝑁 𝑛𝑛𝑛𝑛𝑁𝑁−1
𝑛𝑛=0
Here, N is the total number of samples of the signal and k is the frequency index. 3. Gearbox Experimental Setup
Vibration measurements from two pairs of a spur gear unit from a gearbox test rig were performed. One of the gear pairs contained a broken tooth, while the other pair did not have any broken tooth. The gearbox test-rig located at The University of Nottingham Ningbo China was used to conduct the experiment. During the experiment, a 1-HP DC motor was used to drive the gearbox system. The rotational input was set at 500 RPM. Two torque and speed sensors were located at the input and output of the gearbox and they were incorporated to achieve the constant operational speed during the experiment. In addition, a magnetic brake was incorporated as a load in the system. The whole experiment was conducted on the Nexus Optical Table to isolate vibration from external environment and the picture of the gearbox test-rig is shown in Fig. 1.
Fig. 1 The gearbox test rig used in the experiment
The experimental data were obtained from a spur gearbox
comprising a pinion gear of 18 teeth in mesh with another gear of 27 teeth, driven by the DC motor. The faulty tooth considered in this work was a chipped tooth as shown in Fig. 2, where it can be seen that only a slight part of the gear has been taken out. This was done in purpose to test the effectiveness of vibration and acoustic measurements in diagnosing the fault in the gearbox.
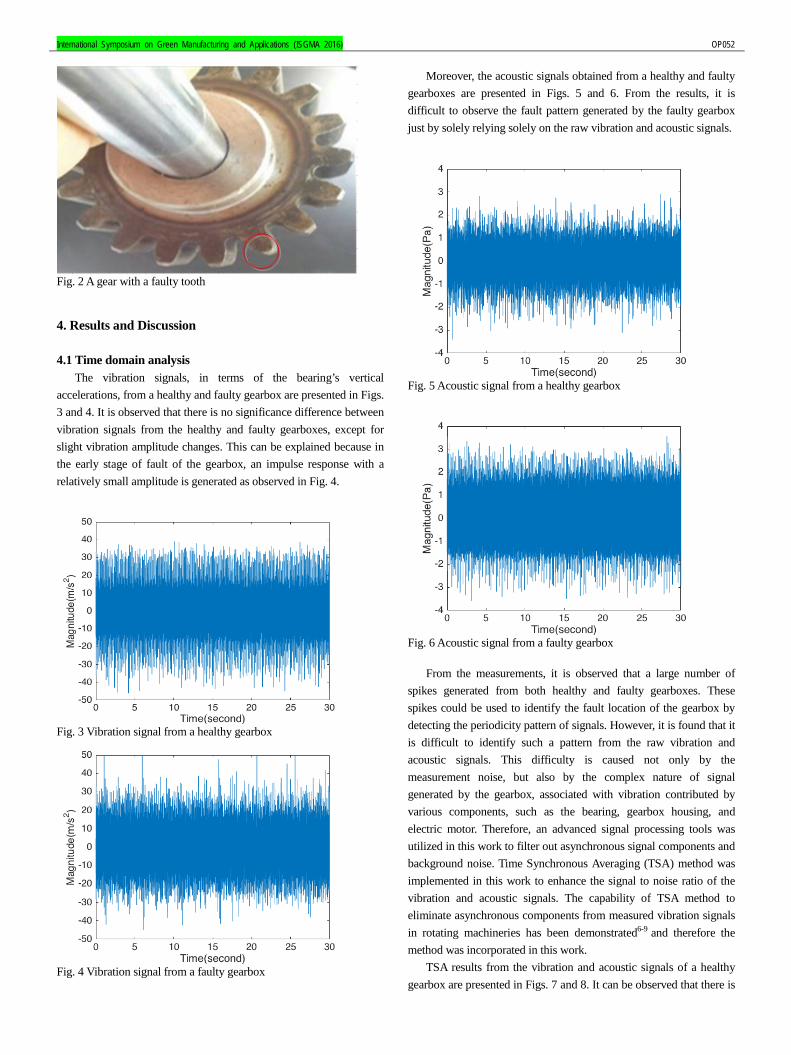
International Symposium on Green Manufacturing and Applications (ISGMA 2016) OP052
Fig. 2 A gear with a faulty tooth 4. Results and Discussion 4.1 Time domain analysis
The vibration signals, in terms of the bearing’s vertical accelerations, from a healthy and faulty gearbox are presented in Figs. 3 and 4. It is observed that there is no significance difference between vibration signals from the healthy and faulty gearboxes, except for slight vibration amplitude changes. This can be explained because in the early stage of fault of the gearbox, an impulse response with a relatively small amplitude is generated as observed in Fig. 4.
Fig. 3 Vibration signal from a healthy gearbox
Fig. 4 Vibration signal from a faulty gearbox
Moreover, the acoustic signals obtained from a healthy and faulty gearboxes are presented in Figs. 5 and 6. From the results, it is difficult to observe the fault pattern generated by the faulty gearbox just by solely relying solely on the raw vibration and acoustic signals.
Fig. 5 Acoustic signal from a healthy gearbox
Fig. 6 Acoustic signal from a faulty gearbox
From the measurements, it is observed that a large number of spikes generated from both healthy and faulty gearboxes. These spikes could be used to identify the fault location of the gearbox by detecting the periodicity pattern of signals. However, it is found that it is difficult to identify such a pattern from the raw vibration and acoustic signals. This difficulty is caused not only by the measurement noise, but also by the complex nature of signal generated by the gearbox, associated with vibration contributed by various components, such as the bearing, gearbox housing, and electric motor. Therefore, an advanced signal processing tools was utilized in this work to filter out asynchronous signal components and background noise. Time Synchronous Averaging (TSA) method was implemented in this work to enhance the signal to noise ratio of the vibration and acoustic signals. The capability of TSA method to eliminate asynchronous components from measured vibration signals in rotating machineries has been demonstrated6-9 and therefore the method was incorporated in this work.
TSA results from the vibration and acoustic signals of a healthy gearbox are presented in Figs. 7 and 8. It can be observed that there is
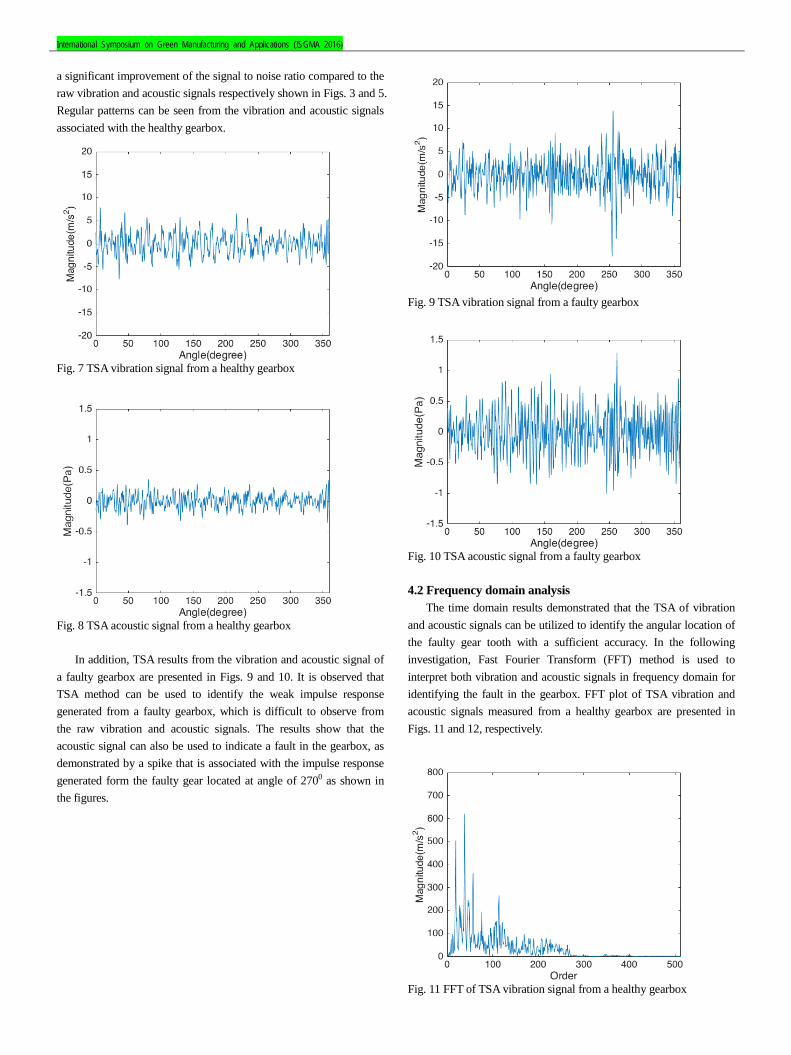
International Symposium on Green Manufacturing and Applications (ISGMA 2016) a significant improvement of the signal to noise ratio compared to the raw vibration and acoustic signals respectively shown in Figs. 3 and 5. Regular patterns can be seen from the vibration and acoustic signals associated with the healthy gearbox.
Fig. 7 TSA vibration signal from a healthy gearbox
Fig. 8 TSA acoustic signal from a healthy gearbox
In addition, TSA results from the vibration and acoustic signal of a faulty gearbox are presented in Figs. 9 and 10. It is observed that TSA method can be used to identify the weak impulse response generated from a faulty gearbox, which is difficult to observe from the raw vibration and acoustic signals. The results show that the acoustic signal can also be used to indicate a fault in the gearbox, as demonstrated by a spike that is associated with the impulse response generated form the faulty gear located at angle of 2700 as shown in the figures.
Fig. 9 TSA vibration signal from a faulty gearbox
Fig. 10 TSA acoustic signal from a faulty gearbox 4.2 Frequency domain analysis
The time domain results demonstrated that the TSA of vibration and acoustic signals can be utilized to identify the angular location of the faulty gear tooth with a sufficient accuracy. In the following investigation, Fast Fourier Transform (FFT) method is used to interpret both vibration and acoustic signals in frequency domain for identifying the fault in the gearbox. FFT plot of TSA vibration and acoustic signals measured from a healthy gearbox are presented in Figs. 11 and 12, respectively.
Fig. 11 FFT of TSA vibration signal from a healthy gearbox
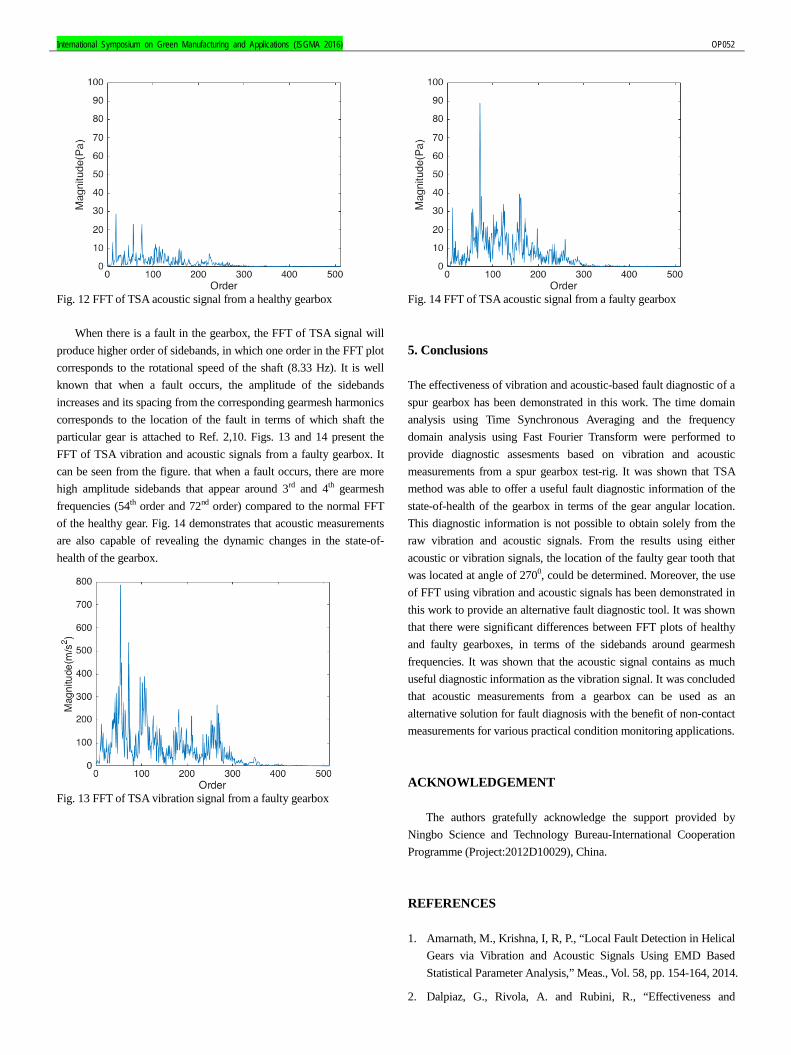
International Symposium on Green Manufacturing and Applications (ISGMA 2016) OP052
Fig. 12 FFT of TSA acoustic signal from a healthy gearbox
When there is a fault in the gearbox, the FFT of TSA signal will produce higher order of sidebands, in which one order in the FFT plot corresponds to the rotational speed of the shaft (8.33 Hz). It is well known that when a fault occurs, the amplitude of the sidebands increases and its spacing from the corresponding gearmesh harmonics corresponds to the location of the fault in terms of which shaft the particular gear is attached to Ref. 2,10. Figs. 13 and 14 present the FFT of TSA vibration and acoustic signals from a faulty gearbox. It can be seen from the figure. that when a fault occurs, there are more high amplitude sidebands that appear around 3rd and 4th gearmesh frequencies (54th order and 72nd order) compared to the normal FFT of the healthy gear. Fig. 14 demonstrates that acoustic measurements are also capable of revealing the dynamic changes in the state-of-health of the gearbox.
Fig. 13 FFT of TSA vibration signal from a faulty gearbox
Fig. 14 FFT of TSA acoustic signal from a faulty gearbox 5. Conclusions
The effectiveness of vibration and acoustic-based fault diagnostic of a spur gearbox has been demonstrated in this work. The time domain analysis using Time Synchronous Averaging and the frequency domain analysis using Fast Fourier Transform were performed to provide diagnostic assesments based on vibration and acoustic measurements from a spur gearbox test-rig. It was shown that TSA method was able to offer a useful fault diagnostic information of the state-of-health of the gearbox in terms of the gear angular location. This diagnostic information is not possible to obtain solely from the raw vibration and acoustic signals. From the results using either acoustic or vibration signals, the location of the faulty gear tooth that was located at angle of 2700, could be determined. Moreover, the use of FFT using vibration and acoustic signals has been demonstrated in this work to provide an alternative fault diagnostic tool. It was shown that there were significant differences between FFT plots of healthy and faulty gearboxes, in terms of the sidebands around gearmesh frequencies. It was shown that the acoustic signal contains as much useful diagnostic information as the vibration signal. It was concluded that acoustic measurements from a gearbox can be used as an alternative solution for fault diagnosis with the benefit of non-contact measurements for various practical condition monitoring applications. ACKNOWLEDGEMENT
The authors gratefully acknowledge the support provided by
Ningbo Science and Technology Bureau-International Cooperation Programme (Project:2012D10029), China. REFERENCES 1. Amarnath, M., Krishna, I, R, P., “Local Fault Detection in Helical
Gears via Vibration and Acoustic Signals Using EMD Based Statistical Parameter Analysis,” Meas., Vol. 58, pp. 154-164, 2014.
2. Dalpiaz, G., Rivola, A. and Rubini, R., “Effectiveness and

International Symposium on Green Manufacturing and Applications (ISGMA 2016)
Sensitivity of Vibration Processing Techniques for Local Fault Detection in Gears,” Mech. Syst. Sig. Proc., Vol. 14, pp. 387-412, 2000.
3. McFadden, P. D., Smith, J, D., “A Signal Processing Technique for Detecting Local Defects in a Gear from the Signal Average of the Vibration,” Proc. Inst. Mech. Eng., Vol. 199, pp. 287-292, 1985.
4. McFadden, P, D., “Detecting Fatigue Cracks in Gears by Amplitude and Phase Demodulation of the Meshing Vibration,” J. Vib. Acoust. Stress. Reliab. Des., Vol. 108, pp. 165-170, 1986.
5. Ingle, V, K. and Proakis, J, G., “Digital Signal Processing Using MATLAB,” Ceng. Learn, 3rd edition, pp. 155, 2012.
6. Randall, R, B., “A New Method of Modelling Gear Faults,” J. Mech. Des., Vol. 104, pp. 259-267, 1982.
7. McFadden, P, D., “Determining the Location of a Fatigue Crack in a Gear from the Phase of the Change in the Meshing Vibration,” Mech. Sys. Sig. Proc., Vol. 2, pp. 403-409, 1990.
8. McFadden, P, D., “Low Frequency Vibration Generated by Gear Tooth Impacts,” N. D. T. Intern, Vol. 5, pp. 279-282, 1985.
9. McFadden, P, D., “Examination of a Technique for the Early Detection of Failure in Gears by Signal Processing of the Time Domain Average of the Meshing Vibration,” Mech. Syst. Sig. Proc, Vol. 1, pp. 173-183, 1987.
10. Belsak, A. and Flasker, J., “Detecting Cracks in the Tooth Root of Gears,” Eng. Fail. Anal., Vol. 14, pp. 1466-1475, 2007.
International Symposium on Green Manufacturing and Applications (ISGMA 2016) OP055
1. Introduction
The development of technology plays a crucial role in modern economic growth but it also is the key factor of environmental crisis. It is usually emphasizing the novelty and economic usefulness of an innovation product but neglects its environmental impacts. Currently, many eco-design and eco-innovation methods have been developed to support the designer for reducing the environmental impact of the product throughout its life cycle. However, those methods are focused on the innovative design of products. Therefore, there is a need to develop an eco-innovative design method for factory.
The "Factory of Tomorrow" research program in Austrian1,2 proposes to develop zero-waste, zero-emission production system by generating maximum benefit with minimum consumption of resources and minimum environmental impact. Minimal manufacturing concept proposed by Japan3 is a manufacturing system to produce products with maximum functions from minimal resource inputs and using minimal energy in the manufacturing process, and with minimal environmental loads throughout whole life cycle.
Gajdzik and Burchart-Korol4 present some eco-innovation cases of steel manufacturing plant on Polish. Peralta and his co-authors5 propose a design methodology MGE2 (genomic model of eco-innovation and eco-design) by using the new paradigm Cradle to Cradle (C2C) for clean manufacturing. Quella6 presents some direction for eco-design of plants: (1)improve hardware equipment, such as green machine tools, (2)improve process on which plant is based, (3)control of equipment, such as embedded system, (4) use
software for the control of the whole plant, (5)extension by inclusion of internet. Popovici and his co-authors7 present a new concept of eco-design of a factory by innovation a low environmental footprint wood panels manufacturing plant. Mery and his co-authors8 develop a design methodology for performing eco-design of process plants by using a fully integrated process modeling and life cycle assessment tool and applying it to a drinking water treatment plant.
Hermann et al.9 described the vision of the “Factory of the Future” has two aspects, (1) symbiotic integration of factories into the surroundings (urban or domestic areas), (2) positive impact on the ecology and aiming at eco-effectiveness. The assessment criteria for green factory from Japan, Taiwan and Germany are evaluated and comparison with each other. This paper describes an initial effort to develop sustainable evaluation criteria for the concept of sustainable factories of tomorrow. 2. Current Concept of Sustainable Factories of the Future
Recently, several new concepts for the factory of the future are proposed.10-15 The concepts most closely related with sustainable factory are circulation factories, green cycle factories, and positive impact factories.
2.1 Smart factories
The “industry 4.0” technology10 plays the key factor of future smart factory concept. It is integrated “Cyber-Physical System” (CPS) and “Internet of Things” (IoT) by “Information and Communication
Comparison of Evaluation Criteria for Sustainable Factories of the Future
Jahau Lewis Chen1,#
1 Department of Mechanical Engineering, National Cheng Kung University, Tainan, 701, Taiwan # Corresponding Author / E-mail: [email protected], TEL: +886-6-2757575-62166, FAX: +886-6-2352973
KEYWORDS : Sustainable factories of the future, Evaluation criteria, Super green factory, Green factory label, Positive impacts factory
Sustainable factories are the dream of factories of the future. However, current sustainable evaluation methods are most focused on design of products. Therefore, there is a need to study evaluation method for sustainable factories of the future. This paper will first review the current concept of sustainable factories of the future. The “super green factory” concept of Japan, the “Green Factory Label” program in Taiwan and the “Positive Impact Factories” concept evaluation criteria from Germany are evaluated and comparison with each other. Finally, this paper describes an initial effort to develop sustainable evaluation criteria for the concept of sustainable factories of tomorrow.

International Symposium on Green Manufacturing and Applications (ISGMA 2016) Technology” (ICT) to communication and intelligent control all machines and products within production system. 2.2 Slow factories
The slow factory concept11 is to recover the value of tradition and craftwork by slow manufacturing processes with selecting of high-quality materials for producing long life time and/or high standards of quality products, and adding distinctive value to products.
2.3 Learning factories
The concept of learning factory12 is to provide realistic environments as training facility for new employees or others. It main focus areas can be energy efficiency, resource efficiency & sustainability, process optimization, and logistics. 2.4 Circulation factories
The concept of circulation factories13 is a factory which combines manufacturing with remanufacturing and recycling into one integrated factory. 2.5 Green cycle factories
The new green cycle factory concept14 is a carbon-based manufacturing process using CO2 as raw material and renewable energies to convert into new raw and finished materials based on carbon (C) and CO2, such as graphene. 2.6 Positive impact factories
The concept of positive impact factory15 is focus on the strategy of eco-effectiveness – “doing the right things” to find the possibility in different environmental and social impact categories as opportunities to turn into positive contributions of the future factory. 3. Evaluation Criteria for Sustainable Factories
The “super green factory” concept of Japan,16 the “Green Factory
Label” program in Taiwan17 and the “Positive Impact Factories” concept evaluation criteria from Germany15 are selected for evaluation and comparison. 3.1 Super green factories
In 2003 Sharp Corporation in Japan proposed certification of super green factories based on 21 quantified environmental performance criteria,16 as shown in Table 1. A factory scoring 90 points or more out of a possible 100 is certified as “Super Green Factory”. 3.2 Green factory label
The “Green Factory Label System”17 was developed by the Taiwan’s Industry Development Bureau (IDB) of the Ministry of Economic Affairs (MOEA) since 2012 to promote energy conservation and carbon reduction amongst Taiwanese manufacturers in keeping with international trends encouraging enhanced environmental protection. The “Green Factory Label” is the
comprehensive certification system that considers not only the environmental benefits arising from the technological advancements within the factory, but also such international sustainability trends as eco-design, green management, social responsibility and innovation.
In order to earn its Green Factory Label, it first had to obtain a “Green Building Label” from the Ministry of the Interior (MOI) of Taiwan and then pass the “Cleaner Production Assessment Method Evaluation” through the IDB of Taiwan. The cleaner production assessment method18 is shown in Table 2. Table 1 Ceriria of super green factories16
Environmental performance criteria Reduction in Greenhouse gas emissions (30%)
Reduction in PFC Promotion of variable supply control systems Recovery and recycling of waste heat Introduction of a cogeneration system Introduction of highly efficient equipment Introduction of new energy sources Continued improvement in production unit Implementation of managerial decision-making standards
Reduction in the emission of chemical substances (26%)
PRTR atmospheric emissions PRTR water emissions Sulfoxide produced by combustion Measures against various bad odors
Appropriate disposal of industrial waste (14%)
Zero discharge to landfill Confirmation of appropriate disposal Convert waste to valuable recycled materials
Reduction in the amount of industrial water used (9%)
Use of rain condensation water Recovery of production rinse water
Surveillance safety and information disclosure (21%)
Disaster and fire prevention measures for hazardous materials Special safety measures Adoption of central surveillance measures Disclosure of environment-related information
3.3 Positive impact factories
Hermann et al.15 proposed a paradigm change, from bad towards positive impacts of a factory and provided a comparison of bad and positive factory impacts for environmental and social impact categories. The positive impacts for the criteria are shown in Table 3. Table 2 Cleaner production evaluation criteria in Taiwan18

International Symposium on Green Manufacturing and Applications (ISGMA 2016) OP055
Indicators Production and Manufacturing
1. Conservation of Energy Resources
1-1 Usage of Raw Materials
1-2 Rate of Recycled Raw Materials
1-3 Usage of Energy Consumption
1-4 Rate of Energy Recovery
1-5 Usage of Water Resources
Consumption
1-6 Waste Water Recovery Rate
1-7 Volume of Industrial Waste
Generated
1-8 Industrial Waste Recovery Rate
1-9 Volume of Greenhouse Gas
Emissions
2.Green Manufacturing Process
2-1 Effectiveness of Plant Process
Management
2-2 Adoption and Utilization of Clean
Production Process Technology
3. Pollution Controls and End of Pipe Treatment Processes
3-1 Proper Treatment of Industrial Waste
3-2 End of Pipe Equipment Capacity and
Procedures for Handling Equipment
Malfunctions
Eco-Design
4.
Environmentally
-friendly Designs
4-1 Utilization of Material-Saving
Designs
4-2 Utilization of Energy-Conserving
Designs
4-3 Utilization of Designs for
Disassembly Parts
4-4 Utilization of Waste Reduction
Designs
4-5 Utilization of Recyclable Designs
Green Management and Corporate Social Responsibility
5. Green Management
5-1 Controlling Hazardous Substances
5-2 Obtaining International Management
Systems
5-3 Voluntary Adoption of Greenhouse
Gas Management Systems
5-4 Communication with Stakeholders
5-5 Green Supply Chain Management
5-6 Green Procurement Management
6. Corporate Social Responsibility
6-1Employee Work Environment
6-2Development and Disclosure of
Sustainability Information
6-3 Sharing of Green Experiences and
Results
Innovation
7. Innovative Thinking
7-1 Dematerialization Innovation
7-2 Detoxification Innovation
7-3Decarburization Innovation
7-4 Furthering Environmental
Sustainability Innovation
Table 3 Positive impacts of a factory15
Dimension Category Positive Impacts Environmental
Energy & resource demand
Use of secondary materials, renewable energies (energy flexibility)
Waste Reuse, recycling, conversion of industrial or residential waste and sewage water
Particle Emissions Emission sink for e.g. air and water pollutants
Noise Emissions Factory as a noise sink Biodiversity Creation of new habitats
for animals and environmental regeneration
Traffic Development of transport infrastructure, short distances for workers
Risks Source of domestic emergency supplies, factory as shelter
Social
Worker Satisfaction Place for life-long learning and personal development
Work Life Balance Factory adapts to the workers’ capabilities, place for recreational activity
Working Conditions Factory as a fitness studio Automation Safeguards human health Openness Factory is open for
customers and residents Individuality of Products
Individualized products
Architecture Factory as architectural attraction, harmonic integration into surrounding
4. Comparison of Evaluation Criteria for Sustainable
Factories of Tomorrow 4.1 Comparison of evaluation criteria for sustainable factories
The criteria for super green factory of Toshiba is focused on environmental performance issues, such as reduction in greenhouse gas emissions, reduction in chemical substances, reduction in the consumption of industrial water, appropriate disposal of industrial waste and surveillance, safety and information disclosure. However, the social performance issue of sustainability is not included in the criteria for super green factory of Toshiba. The comparison of evaluation criteria of environmental performance issues for sustainable factories is illustrated in Table 4.
Table 4 Comparison of criteria of environmental performance issues
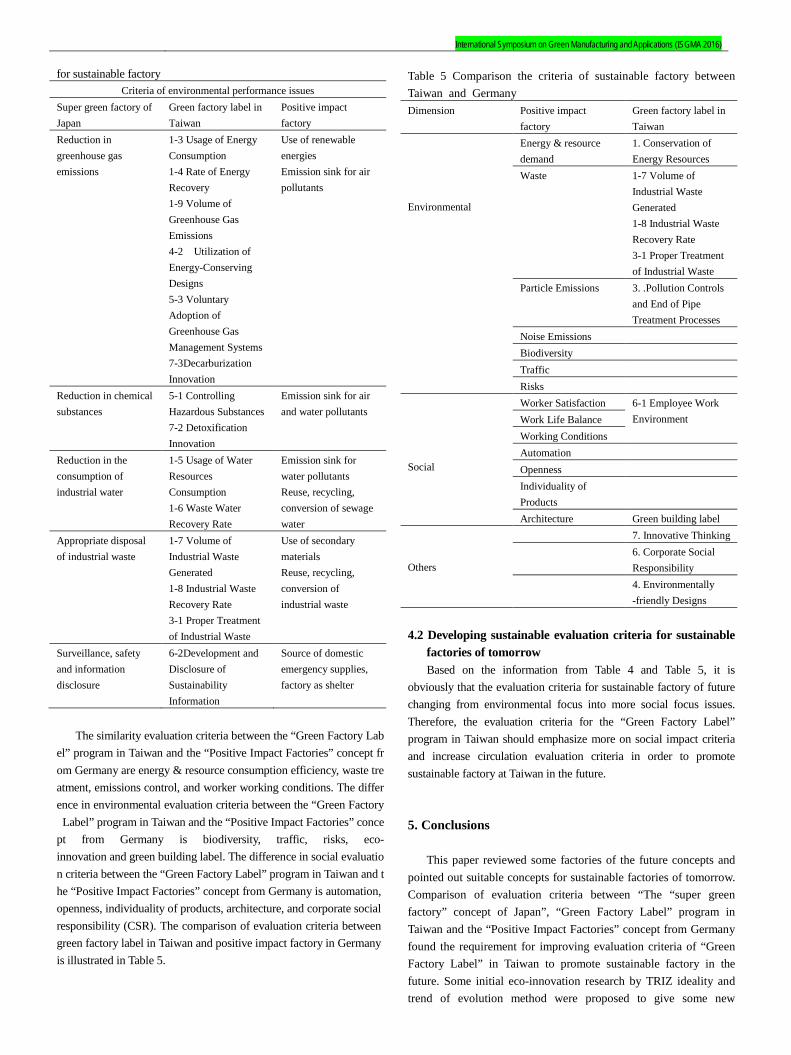
International Symposium on Green Manufacturing and Applications (ISGMA 2016) for sustainable factory
Criteria of environmental performance issues Super green factory of Japan
Green factory label in Taiwan
Positive impact factory
Reduction in greenhouse gas emissions
1-3 Usage of Energy Consumption 1-4 Rate of Energy Recovery 1-9 Volume of Greenhouse Gas Emissions 4-2 Utilization of Energy-Conserving Designs 5-3 Voluntary Adoption of Greenhouse Gas Management Systems 7-3Decarburization Innovation
Use of renewable energies Emission sink for air pollutants
Reduction in chemical substances
5-1 Controlling Hazardous Substances 7-2 Detoxification Innovation
Emission sink for air and water pollutants
Reduction in the consumption of industrial water
1-5 Usage of Water Resources Consumption 1-6 Waste Water Recovery Rate
Emission sink for water pollutants Reuse, recycling, conversion of sewage water
Appropriate disposal of industrial waste
1-7 Volume of Industrial Waste Generated 1-8 Industrial Waste Recovery Rate 3-1 Proper Treatment of Industrial Waste
Use of secondary materials Reuse, recycling, conversion of industrial waste
Surveillance, safety and information disclosure
6-2Development and Disclosure of Sustainability Information
Source of domestic emergency supplies, factory as shelter
The similarity evaluation criteria between the “Green Factory Lab
el” program in Taiwan and the “Positive Impact Factories” concept from Germany are energy & resource consumption efficiency, waste treatment, emissions control, and worker working conditions. The difference in environmental evaluation criteria between the “Green Factory Label” program in Taiwan and the “Positive Impact Factories” concept from Germany is biodiversity, traffic, risks, eco-innovation and green building label. The difference in social evaluation criteria between the “Green Factory Label” program in Taiwan and the “Positive Impact Factories” concept from Germany is automation, openness, individuality of products, architecture, and corporate social responsibility (CSR). The comparison of evaluation criteria between green factory label in Taiwan and positive impact factory in Germany is illustrated in Table 5.
Table 5 Comparison the criteria of sustainable factory between Taiwan and Germany Dimension Positive impact
factory Green factory label in Taiwan
Environmental
Energy & resource demand
1. Conservation of Energy Resources
Waste 1-7 Volume of Industrial Waste Generated 1-8 Industrial Waste Recovery Rate 3-1 Proper Treatment of Industrial Waste
Particle Emissions 3. .Pollution Controls and End of Pipe Treatment Processes
Noise Emissions Biodiversity Traffic Risks
Social
Worker Satisfaction 6-1 Employee Work Environment Work Life Balance
Working Conditions Automation Openness Individuality of Products
Architecture Green building label Others
7. Innovative Thinking 6. Corporate Social
Responsibility 4. Environmentally
-friendly Designs
4.2 Developing sustainable evaluation criteria for sustainable
factories of tomorrow Based on the information from Table 4 and Table 5, it is
obviously that the evaluation criteria for sustainable factory of future changing from environmental focus into more social focus issues. Therefore, the evaluation criteria for the “Green Factory Label” program in Taiwan should emphasize more on social impact criteria and increase circulation evaluation criteria in order to promote sustainable factory at Taiwan in the future. 5. Conclusions
This paper reviewed some factories of the future concepts and
pointed out suitable concepts for sustainable factories of tomorrow. Comparison of evaluation criteria between “The “super green factory” concept of Japan”, “Green Factory Label” program in Taiwan and the “Positive Impact Factories” concept from Germany found the requirement for improving evaluation criteria of “Green Factory Label” in Taiwan to promote sustainable factory in the future. Some initial eco-innovation research by TRIZ ideality and trend of evolution method were proposed to give some new
International Symposium on Green Manufacturing and Applications (ISGMA 2016) OP055
sustainable factory concepts.19 Furthermore, Other TRIZ techniques for eco-innovation of sustainable factories are also under investigation and will be reported in the future. REFERENCES 1. Mainoni , E . , “Project Examples: Factory of Tomorrow,”
Austrian Federal Ministry for Transport, Innovation and Technology, http://www.fabrikderzukunft.at/fdz_pdf/broschuere_project-examples.pdf, [Access at 2014/06/02].
2. Ecodesign Infoknoten, “Research Results: Factory of Tomorrow”, Institute for Engineering Design, Vienna University of Technology, http://www.ecodesign.at/forschung/fdz/index.en.html, [Access at 2014/04/26].
3. Murata , K . , Matsumoto , J . , Tezuka, A., Matsuba, Y. and Yokoyama, H., “Super-Fine Ink-jet Printing: Toward the Minimal Manufacturing System,” Microsystem Technologies, Vol. 25, pp. 1-2, 2005.
4. Gajdzik , B . a n d Burchart-Korol , D., “Eco-innovation in Manufacturing Plants Illustrated with An Example of Steel Products Development,” METALURGIJA, Vol. 50, pp. 63-66, 2011.
5. Peralta , M . E . , Aguayo, F., and Lama, J. R., “Clean Manufacturing from Cadle to Cradle,” Key Engineering Materials, Vol. 502, pp. 43-48, 2012.
6. Quella, F., “New Perspectives for Ecodesign,” In: Ecodesign13. Keynote presentation at the 8th International Symposium on Environmentally Conscious Design and Inverse Manufacturing, Jeju, Korea, 4-6 December, 2013.
7. Poppvici, E., Benetto, E., Cerniglia, G., and Becker, M., “Factory of the Future – Toward a Near-Zero Environmental Footprint in Wood Panels Manufacturing,” In: LCM 2013. Proceedings of the 6th International Conference on Life Cycle Management, Gothenburg, 2013.
8. Mery, Y., Tiruta-Barna, L., Baudin, I., Benetto, E., and Igos, E., “Formalization of a Technical Procedure for Process Ecodesign Dedicated to Drinking Water Treatment Plants,” Journal of Cleaner Production, Vol. 68, pp. 16-24, 2014.
9. Hermann, C., Schmidt, C., Kurle, D., Blume, S., and Thiede, S., “Sustainability in Manufacturing and Factories of the Future,” International Journal of Precision Engineering and Manufacturing – Green Technology , Vol. 1, pp.283-292, 2014.
10. Sauer, O., “Information Technology for the Factory of the Future –State of the Art and Need for Action,” Procedia CIRP, Vol. 25, pp. 293-296, 2014.
11. Campana, G. and Cimatti, B., “The Slow Factory: A New
Paradigm for Manufacturing,” In: GCSM 2013. Proceedings of the 11th Global Conference on Sustainable Manufacturing, Berlin, 23-25 September 2013.
12. Wagner, U, T, ElMarag., and Muller, E., “The State-of-the-Art and Prospects of Learning Factories,” Procedia CIRP, Vol. 3, pp. 109-114, 2012.
13. Cerdas, F., Kurle, D., Andrew, S., Thiede, S., Hermann, C., Yeo, Z., Low, S. C. J., Song, B., and Kara, S., “Defining Circulation Factories – A Pathway Towards Factories of the Future,” Procedia CIRP , Vol. 29, pp. 627-632, 2015.
14. Rohrmus, D., Doricht, V., and Weinert, N., “Green Factory Supported by Advanced Carbon-based Manufacturing,” Procedia CIRP, Vol. 29, pp. 28-33, 2015.
15. Hermann, C., Blume, S., Kurle, D., Schmidt, C., and Thiede, S., “The Positive Impact Factory – Transition from Eco-efficiency to Eco-effectiveness Strategies in Manufacturing,” Procedia CIRP, Vol. 29, pp. 19-27, 2015.
16. “Raising the Level of Environmental Performance in Factories,” http://www.sharp-world.com/corporate/eco/ssr/environment/operation/plant/ [Access at 2015/12/30]
17. “ Operation Directions for Green Factory Label , ”https://greenfactory.ftis.org.tw/UploadFolder/file/fileUpload/loyer_20141124165850.pdf , [Access at 2015/07/07]
18. “Cleaner Production Assessment Guide for General Industry,” https://greenfactory.ftis.org.tw/contentENG/info/Loyer.aspx?enc=XK+cog6lIk/NC3EieQUh2GNqtXSKqmQgbRUZj/BrRZA, [Access at 2015/07/07]
19. Chen , J . L . , “Factories of the Future: Eco-innovation of Factories”, Proceedings of 3rd International Conference on Final Sink, August 23-26, 2015, Taipei, Taiwan.

International Symposium on Green Manufacturing and Applications (ISGMA 2016) OP058
1. Introduction
Considerable attention has been continuously paid to end-of-life products due to various environmental and economic reasons. When dealing with end-of-life products, disassembly is one of indispensable activities because most of them can be recovered or even disposed of after disassembling them. In other words, disassembly is the first one among product recovery or disposal processes after collecting and inspecting them, i.e. end-of-use/life products must be disassembled before recovered or even disposed of.
Due to the theoretical challenges and practical applications, many previous studies have been done on various disassembly problems. Among them, disassembly process planning is the activity to specify detailed operation instructions to disassemble a product, which has three decision variables: disassembly level on whether more opera-tions are performed or not at each disassembly step; sequence of dis-assembly operations; and end-of-life options on how each component is to be dealt with. For literature reviews, see O’Shea et al. (1998), Lee et al. (2001) and Santoch (2002).
Among the three decisions, this study considers disassembly se-quencing. The previous studies on disassembly sequencing can be classified into the general case without target components and the selective case with target components. Of the two cases, we consider the selective case with multiple target components.
For the selective case with target components, most previous stud-ies were done under the serial disassembly environment in which one component can be obtained from a disassembly operation. The basic approach is to enumerate all feasible solutions that satisfy the con-straints and then select the best one. Srinivasan and Gadh (1998) pro-pose a greedy search algorithm, called the wave propagation method, which searches the shortest path to access the target component with-out violating the precedence relations. Kara et al. (2005, 2006) suggest two-phase heuristic with the winnowing process. Smith and Chen (2011) suggest a rule-based recursive method for the problem with geometric and topological constraints that eliminate unrealistic disas-sembly sequences, and Han et al. (2013) develop a mathematical pro-gramming model using the precedence-constrained asymmetric travel-ing salesman model and then suggested various heurist algorithms.
Unlike the previous studies on selective disassembly sequencing under the serial disassembly, not much research was done on the prob-lem under the parallel disassembly environment. Note that the parallel disassembly is more general than the serial disassembly in that two or more components can be obtained at the same time by a single disas-sembly operation. Chung and Peng (2005) develop an integrated ap-proach that extends the wave propagation method by considering batch disassembly of components, i.e. parallel disassembly, and tool accessibility to fasteners, and later, Chung and Peng (2006) report its implementation in the form of web-based application.
A Branch and Bound Algorithm for Parallel and Selective Disassembly Sequencing with Sequence-Dependent Setups
Hyung-Won Kim1 and Dong-Ho Lee1,# 1 Department of Industrial Engineering, Hanyang University,222, Wangsimni-ro, Seongdong-gu, Seoul, 04763, South Korea
# Corresponding Author / E-mail: [email protected], TEL: +82-2-2220-0475, FAX: +82-2-2297-0475
KEYWORDS : Selective disassembly sequencing, Parallel disassembly, Sequence-dependent setups, Branch and bound
This study considers selective disassembly sequencing to obtain one or more target components of an end-of-use/life product in parallel disassembly environment in which two or more components can be extracted at the same time by a single disassembly operation. The problem is to determine the sequence of disassembly operations while satisfying the precedence relationships among disassembly operations for the objective of minimizing the total disassembly operation cost. As a practical consideration, we consider the sequence-dependent setups in which setup costs depend on the disassembly operations just completed and on the next disassembly operations to be processed. To represent the problem mathematically, we propose an integer programming model after representing the disassembly sequences as an extended process graph. Then, a branch and bound algorithm is suggested that gives the optimal disassembly sequences to obtain one or more target components. To illustrate the algorithm, a simple case study is reported.

International Symposium on Green Manufacturing and Applications (ISGMA 2016)
This study focuses on selective disassembly sequencing in the parallel disassembly environment, which is the problem of determin-ing the disassembly sequence to obtain multiple target components while satisfying the precedence relations among the disassembly oper-ations for the objective of minimizing the sum of setup and operation costs, where the setups are sequence-dependent in that setup costs depend on the disassembly operations just completed and on the oper-ations to be processed. Although there are some previous studies on the parallel and selective disassembly sequencing problem, we addi-tionally consider the sequence-dependent setups that can be found commonly in various practical disassembly processes.
To represent the problem mathematically, we propose an integer programming model. Then, a branch and bound algorithm is suggest-ed that gives the optimal solutions. A case study is reported to illus-trate the algorithm suggested in this study. 2. Problem Description
Before describing the problem, we first explain the extended pro-cess graph that represents disassembly sequences. Then, an integer programming model is presented.
To represent disassembly sequences under the parallel disassem-bly environment, we adopt the extended process graph of Kang et al. (2001), which has four types of nodes: dummy (source or sink), opera-tion, separation and choice nodes. An example of the extended process graph is given in Fig. 1.
Fig. 1 Extended process graph: example As can be seen in the figure, a choice node means that there are
two or more possible ways to disassemble a subassembly, and a sepa-ration node means that two subassemblies are created, each of which contains more than one part and hence can be disassembled further. Also, the extended graph has two types of arcs: solid and dotted arcs. A solid arc represents a precedence relation between two disassembly operations, and the dotted arcs can be classified into unidirectional and bidirectional ones. Unidirectional dotted arcs, which connect opera-tion nodes to the sink node, represent the ends of possible sequences. On the other hand, a bidirectional dotted arc is used to represent pos-sible orders between two operations. In other words, in the case of separation, a subassembly can be disassembled in parallel and there is no precedence relationship between the operations corresponding to the disassembled subassemblies. In this case, the operations corre-
sponding to each subassembly can be carried out in any order. Now, the selective disassembly sequencing problem considered in
this study can be described as follows. For a given product, the prob-lem is to determine the sequence of disassembly operations required to extract one or more target components while satisfying the precedence relations s among disassembly operations for the objective of mini-mizing the sum of setup and operation costs.
The problem has one decision variable: disassembly sequence. Unlike the complete disassembly in which the disassembly level and sequence must be determined at the same time, the disassembly se-quence is the main decision in the selective disassembly since one or more target components are given in advance. The objective is to minimize the sum of setup and operation costs. The setup costs, which are sequence-dependent, imply the fixed costs required for preparing disassembly operations. Note that the setup cost occurs if the corre-sponding disassembly operation is done. The disassembly operation costs, which are assumed to be proportional to the labor or machine processing times, are the variable costs to perform the disassembly operations.
As a beginning study on parallel and selective disassembly se-quencing with sequence-dependent setups, we consider the determin-istic version of the problem, i.e. all problem data are deterministic and given in advance.To describe the problem more clearly, a new integer programming model is proposed. Before explaining the model, the notations used are summarized below. Sets
N set of nodes in the extended process graph, i, j ∈ N A set of arcs in the extended process graph, (i, j) ∈ A T set of target components, t ∈ T OR set of choice nodes
Parameters cij disassembly cost that consists of sequence-dependent setup
and operation costs for operation j directly after operation i is done (It is assumed that the disassembly costs satisfy the triangular inequality, i.e. cij ≤ cik + ckj for all k ≠ i, j.)
PRij = 1 if operation j must be done directly after operation i according to the precedence relation, and 0 otherwise
Decision variables xij = 1 if the disassembly operation j is performed
directly after operation i, and 0 otherwise yi = 1 if the disassembly operation i is performed,
and 0 otherwise zij = 1 if the disassembly operation j is performed
after operation i, and 0 otherwise Now, the integer programming model is given below. (The de-
tailed description of the model is omitted here.)
[P] Minimize ∑ ∈ ⋅Aji ijij xc),(
subject to
jNi ij yx =∑ ∈ for all j ∈ N
iNj ij yx =∑ ∈ for all i ∈ N
1=ty for all t ∈ T
jNi iij yyPR ≥⋅∑ ∈ for all j ∈ N

International Symposium on Green Manufacturing and Applications (ISGMA 2016) OP058
kORj j yy ≤∑ ∈ k is a direct predecessor of j
0=⋅ jiij zPR for PRij = 1, i, j ∈ N
1=+ jiij zz for all i, j ∈ N\0 and i ≠ j
1≤−+ ikjkij zzz for all i ∈ N, j, k ∈ N\0
0≥− ijij xz for all i, j ∈ N
0=iix for all i ∈ N
1,0,, ∈ijiij zyx for all i, j ∈ N
We can see that the problem [P] is NP-hard since it can be reduced
to the well-known asymmetric Hamiltonian path problem with prece-dence constraints, which is proved to be NP-hard. 3. Branch and Bound Algorithm
The branch and bound (B&B) algorithm is explained with the branching scheme that generates all feasible disassembly sequences, i.e. B&B tree, and the bounding scheme that curtails the unnecessary solutions using the lower and upper bounds. Note that each node of the B&B tree can be deleted from further consideration (fathomed) if the lower bound at the node is greater than or equal to the incumbent solution value, i.e. the smallest upper bound obtained so far. 3.1 Branching
In the B&B tree, each node (except for the root node) denotes the disassembly operation. Also, each level corresponds to a position in disassembly sequences. For example, the nodes in the first level of the B&B tree correspond to the candidate operations for the first position of disassembly sequences.
There is a single root node with level number 0 and a parent node of level l has child nodes of level l + 1. Therefore, the level number of leaf node in the B&B tree is the total number of disassembly opera-tions. In fact, the number of all possible sequences is n!, where n is the number of disassembly operations. Also, each node in the B&B tree corresponds to a partial sequence, which can be found by tracing a path from that node to the root node. Each time a new operation is added on a partial sequence, the B&B algorithm proceeds from one level to the next. To eliminate infeasible sequences that violate prece-dence relations, it is needed to find the set of disassembly operations satisfying the precedence relation at each node of the B&B tree. If the node violates the precedence relation, the node can be fathomed. Fig. 2 shows an example of the B&B tree that represents all possible se-quences for an instance with four disassembly operations.
Fig. 2 Brach and bound tree: example
For node selection, the depth-first rule is employed in this study. More specifically, if the current node does not contain all target com-ponents, the next node to be considered is one of its child nodes. Note that the problem is to find the disassembly sequence that minimizes the total disassembly cost from the root node to target components at the same time. 3.2 Bounding
At the root node of the B&B tree, an initial upper bound is ob-tained by specifying the set of feasible disassembly operations that can be performed directly after the last operation of the partial sequence and then adding the one with the minimum disassembly cost until all target components are obtained.
The lower bound is calculated at each node of the B&B tree ex-cept for the leaf nodes. Let PSr denote the set of disassembly opera-tions included in the partial sequence at node r of the B&B tree. The lower bound consists of
CF + CR, where CF denotes the total disassembly cost realized by the disassem-bly operations in the partial sequence and CR denotes the total disas-sembly cost derived from the jobs not in PSr. More specifically, CR consists of two parts: (a) the lengths of the shortest paths from the last operation of the partial sequence to the nodes corresponding to target components; and (b) the minimum among the disassembly costs be-tween all possible pairs of target component nodes. 3.3 Dominance property
Besides the bounding scheme suggested in this paper, we can re-duce the search space by removing all operation regardless of disas-sembly operations required for extracting the target components. In other words, the disassembly operation in disassembly sequence is only considered the precedence operation necessary to extracting the target components.
4. Case Study To illustrated the branch and bound algorithm proposed in study, a
simple case example for a hand-light is shown in this section Fig.3 shows the data, i.e. parts list, precedence relations and costs.
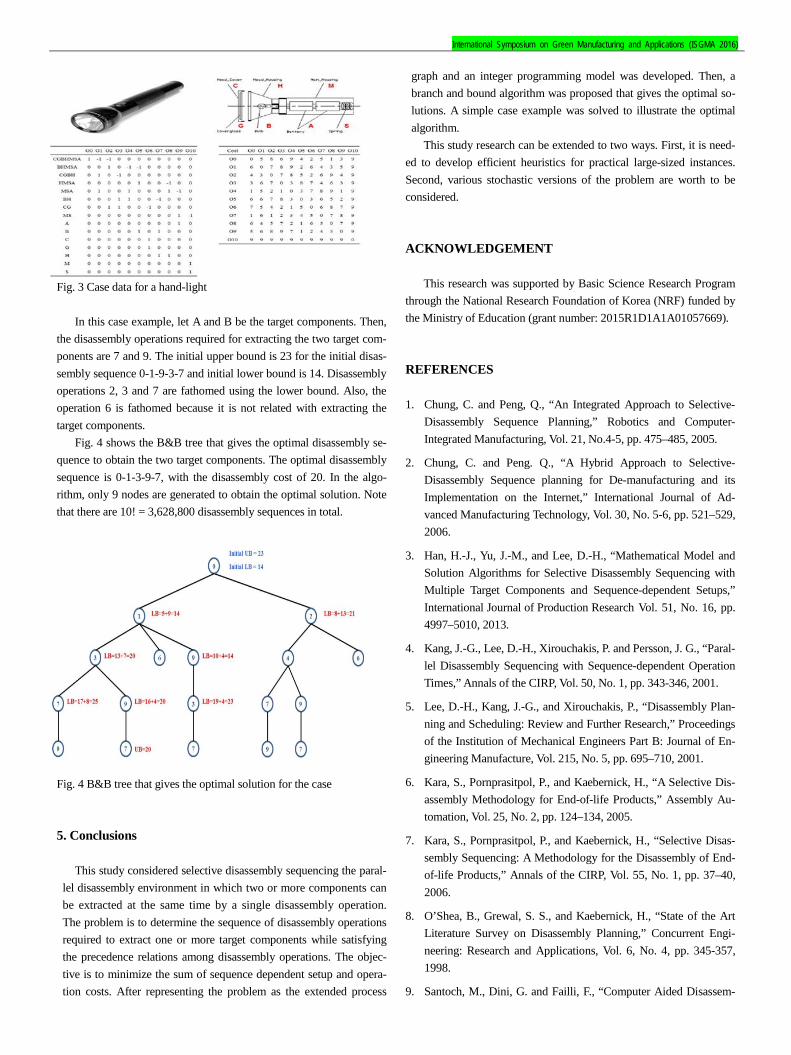
International Symposium on Green Manufacturing and Applications (ISGMA 2016)
Fig. 3 Case data for a hand-light
In this case example, let A and B be the target components. Then, the disassembly operations required for extracting the two target com-ponents are 7 and 9. The initial upper bound is 23 for the initial disas-sembly sequence 0-1-9-3-7 and initial lower bound is 14. Disassembly operations 2, 3 and 7 are fathomed using the lower bound. Also, the operation 6 is fathomed because it is not related with extracting the target components.
Fig. 4 shows the B&B tree that gives the optimal disassembly se-quence to obtain the two target components. The optimal disassembly sequence is 0-1-3-9-7, with the disassembly cost of 20. In the algo-rithm, only 9 nodes are generated to obtain the optimal solution. Note that there are 10! = 3,628,800 disassembly sequences in total.
Fig. 4 B&B tree that gives the optimal solution for the case 5. Conclusions
This study considered selective disassembly sequencing the paral-lel disassembly environment in which two or more components can be extracted at the same time by a single disassembly operation. The problem is to determine the sequence of disassembly operations required to extract one or more target components while satisfying the precedence relations among disassembly operations. The objec-tive is to minimize the sum of sequence dependent setup and opera-tion costs. After representing the problem as the extended process
graph and an integer programming model was developed. Then, a branch and bound algorithm was proposed that gives the optimal so-lutions. A simple case example was solved to illustrate the optimal algorithm.
This study research can be extended to two ways. First, it is need-ed to develop efficient heuristics for practical large-sized instances. Second, various stochastic versions of the problem are worth to be considered.
ACKNOWLEDGEMENT This research was supported by Basic Science Research Program
through the National Research Foundation of Korea (NRF) funded by the Ministry of Education (grant number: 2015R1D1A1A01057669).
REFERENCES 1. Chung, C. and Peng, Q., “An Integrated Approach to Selective-
Disassembly Sequence Planning,” Robotics and Computer-Integrated Manufacturing, Vol. 21, No.4-5, pp. 475–485, 2005.
2. Chung, C. and Peng. Q., “A Hybrid Approach to Selective-Disassembly Sequence planning for De-manufacturing and its Implementation on the Internet,” International Journal of Ad-vanced Manufacturing Technology, Vol. 30, No. 5-6, pp. 521–529, 2006.
3. Han, H.-J., Yu, J.-M., and Lee, D.-H., “Mathematical Model and Solution Algorithms for Selective Disassembly Sequencing with Multiple Target Components and Sequence-dependent Setups,” International Journal of Production Research Vol. 51, No. 16, pp. 4997–5010, 2013.
4. Kang, J.-G., Lee, D.-H., Xirouchakis, P. and Persson, J. G., “Paral-lel Disassembly Sequencing with Sequence-dependent Operation Times,” Annals of the CIRP, Vol. 50, No. 1, pp. 343-346, 2001.
5. Lee, D.-H., Kang, J.-G., and Xirouchakis, P., “Disassembly Plan-ning and Scheduling: Review and Further Research,” Proceedings of the Institution of Mechanical Engineers Part B: Journal of En-gineering Manufacture, Vol. 215, No. 5, pp. 695–710, 2001.
6. Kara, S., Pornprasitpol, P., and Kaebernick, H., “A Selective Dis-assembly Methodology for End-of-life Products,” Assembly Au-tomation, Vol. 25, No. 2, pp. 124–134, 2005.
7. Kara, S., Pornprasitpol, P., and Kaebernick, H., “Selective Disas-sembly Sequencing: A Methodology for the Disassembly of End-of-life Products,” Annals of the CIRP, Vol. 55, No. 1, pp. 37–40, 2006.
8. O’Shea, B., Grewal, S. S., and Kaebernick, H., “State of the Art Literature Survey on Disassembly Planning,” Concurrent Engi-neering: Research and Applications, Vol. 6, No. 4, pp. 345-357, 1998.
9. Santoch, M., Dini, G. and Failli, F., “Computer Aided Disassem-

International Symposium on Green Manufacturing and Applications (ISGMA 2016) OP058
bly Planning: State of the Art and Perspectives,” Annals of the CIRP, Vol. 51, No. 2, pp. 507-529, 2002.
10. Smith, S. and Chen, W. H., “Rule-based Recursive Selective Dis-assembly Sequence Planning for Green Design,” Advanced Engi-neering Informatics, Vol. 25, No. 1, pp. 77–87, 2011.
11. Srinivasan, H. and Gadh R., “A Geometric Algorithm for Single Selective Disassembly using the Wave Propagation Abstraction.,” Computer Aided Design, Vol. 30, No. 8, pp. 603–613, 1998.

International Symposium on Green Manufacturing and Applications (ISGMA 2016) PP032
1. Introduction As recent air transport demands are increasing every year, the
emission gas such as NOx and CO2 from air craft engine has also increased. One of the candidates of reducing the emission gas and enhancing the efficiency of gas turbine engine is to increase the combustion temperature. However, the problem is with lowering the temperature of turbine blades. Therefore, a heat exchanger should be needed to supply cooled cooling air to blades.
Heat exchanger installed on the aircraft engine requires a high technical skill and high stiffness body with light weight and small volume with high efficiency. If the fine tube heat exchanger is employed on the air craft engine, the problem of environmental pollution by exhaust emission and fuel saving would be resolved. Heat exchangers are not yet to be applied to aero gas turbine engines because it is difficult to select an appropriate material, design a lightweight structure that can withstand high temperatures and pressures, and evaluate its reliability.
The object of this study is to design and analyze a heat exchanger with the fine tubes mounted in the air craft engine under engine operating conditions.
2. FE Analysis under Operating Conditions
As shown in Fig.1 (a), it consists of a manifold that serves as a
channel for heated gas, a brazed tube sheet that supports tubes, a case that guides cooled air, and baffles that prevent vibration. The brazing process is applied to join tubes and tube sheet. When meshes are generated on all tube bundle, FE model has complex meshes and many numbers of grid points. It requires much memories and computational time. For this reason, as shown in Fig. 1(b), analysis model employed in this study was simplified by excluding tube bundle. In order to consider the effect of tubes, the calculated equivalent density was applied to baffle and tubesheet. Moreover, to consider the effect of raising tubes, the compensated pressure load was applied to manifold side of tubesheet and inner surface of tubes.
(a) Full 3D modeling (b) FE model Fig. 1 3D modeling of heat exchanger
Displacement boundary conditions were applied to mounting components installed on the core flange considered the engine mounting condition. It is suggested that the heat exchanger to be
Structural Design and Analysis of a Novel Heat Exchanger for Aero Engine
Na-Hyun Kim1, Joo-Hwan Yoon1, Jong-Rae Cho1,# and Sang-Hu Park2 1 Department of Mechanical Engineering, Korea Maritime & Ocean University, 727, Taejong-ro, Yeongdo-gu, Busan, 49112, South Korea
2 Department of Mechanical Engineering, Pusan National University, 2, Busandaehak-ro 63beon-gil, Geumjeong-gu, Busan, 46241, South Korea # Corresponding Author / E-mail: [email protected], TEL: +82-10-410-4298, FAX: +82-10-405-4790
KEYWORDS : Cooled cooling air(CCA), Heat exchanger, Aero engine, Design, Analysis
One of the candidates of enhancing the thermal cycle efficiency and reducing CO2 and NOx in aero engine is to adopt heat exchangers. When aircraft is operating, the heat exchanger receives severe conditions of high temperature, high pressure, and strong vibration. The fine tube heat exchanger to supply cooled cooling air (CCA) to gas turbine blades is suitable for demands that require high stiffness with light weight, and low volume with high efficiency. The objective of this study is to predict structural characteristics of a fine tube heat exchanger under the static and transient loading conditions using thermo-mechanical nonlinear finite element analysis. The transient loading covers the transient temperature distribution of metal and pressure due to take-off condition. The heat exchanger is composed of various components such as manifold, tubesheet, case, flange, baffle, and tube bundle. As a thermo-mechanical analysis results, it is concluded that the major part of heat exchanger has a reasonable safety margin for fatigue strength of Inconel 625 at 1000K, 104 cycle.

International Symposium on Green Manufacturing and Applications (ISGMA 2016) installed on the engine with 3 mounting components to reduce the thermal deformation effect by thermal expansion. In order to allow the rotation and sliding by thermal growth of heat exchanger, one of mounting bracket had a fixed condition and the rest of mounting brackets had a sliding condition in each direction.
The thermo-mechanical analysis was performed to assess the thermo-mechanical integrity under the engine operating condition. The temperature and convection coefficient from CFD analysis was applied to thermal analysis. A uniform pressure of 55 bar applied on the manifold and compensated pressure 76 bar was applied along the manifold side of tubesheet and the inner surface of tube as a mechanical load.
The results of thermo-mechanical analysis are listed in the Table 1, and the stress distribution of each components is shown in Fig. 2.
Table 1 Results of thermo-mechanical analysis
Component Flange Tubesheet Case wall
Von Mises stress (MPa) 388 341 408
Temperature (K) 991 540 720
Component Lug Pin Bracket
Von Mises stress (MPa) 355 389 321
Temperature (K) 685 685 685
Fig. 2 Results of thermo-mechanical analysis 4. FE Analysis for the HP Tube Side
The aim of this study is to assess the structural integrity for the
HP tube side of heat exchanger. In the previous study, we have performed stress assessment for heat exchanger without tube bundle. In this study, we performed stress assessment for the HP tube side under Maximum Take-Off (MTO) condition. We carried out the thermo-mechanical transient analysis for heat exchanger in order to estimate the thermo-mechanical stress as a function of time.
Fig.3 Segment model with tubes for transient analysis
The analysis for full model with tube bundle requires huge amount of memory and computational time. Thus, the segment model of heat exchanger was employed in this study, and is shown in Fig. 3. The displacement boundary condition considered the thermal expansion was applied in the segment model and a symmetry displacement boundary condition was constrained on the longitudinal direction.
The temperature and convection coefficient from CFD analysis was applied to thermal analysis as function of time, and a uniform pressure of 55 bar was applied.
As a result of analysis, Fig. 4 shows the stress on the junction part of tube and tubesheet depending on time. The stress decreased around 10 seconds and increased until 50 seconds. Tensile stress was observed because it was affected by the thermal deformation caused by large temperature gradient in the junction part of tubes between tubes and tubesheet. After 50 seconds, the stress was converged on 157 MPa. Stress of 141 MPa in static analysis with the same loading was observed in the junction part of tubes between tubes.
Fig. 4 Stress results depending on time 5. Conclusion
In this study, to assess the structural integrity of heat
exchanger, the FE analysis was performed under engine operating conditions. The thermal conditions, temperature and convection coefficient, and pressure were applied as thermo-mechanical load.
As analysis results indicate, the stress observed in the main part has safety margin compared to the fatigue strength of the Inconel 625 under 1000K at 104 cycles.
Moreover, the results from the transient thermal analysis, which evaluated the integrity as a function of time, shows that approximately 10 % difference was caused between the transient analysis results and static analysis results. Therefore, it is confirmed that results of the static analysis for full model is reasonable. REFERENCES 1. Schonenborn, H., Ebert, E., Simon, B., Storm, P., June, 2004.“ Thermo-mechanical design of a heat exchanger for a recuperative aero engine”,ASME Turbo Expo, GT-2004-53696, Vol. 6, pp. 187-193. 2.Jeong, J. H., Kim, L. S., Lee, J. K., Ha, M. Y., Kim, K. S., Ahn, Y. C., May, 2007. "Review of heat exchanger studies for high-

International Symposium on Green Manufacturing and Applications (ISGMA 2016) PP032
efficiency gas turbines", ASME Turbo Expo, GT-2007-28071, Vol. 4, pp. 833-840.

International Symposium on Green Manufacturing and Applications (ISGMA 2016) PP051
NOMENCLATURE AH : high speed stage reduction ratio AL : low speed stage reduction ratio Nmi : equivalent mean rotating speed, rpm P : actual gear compressive stress, N/mm2
S : actual gear bending stress, N/mm2 Sab : allowable gear bending stress, N/mm2 Sac : allowable gear compressive stress, N/mm2 Tmi : equivalent mean torque, N∙m
1. Introduction A drilling rig is a machine that creates holes in the sub-surface of the ground. As drilling rigs can be available to adopt massive structures of housing equipment for drilling wells, reverse circulation rig setups usually consist of a support and auxiliary vehicle as well as the rig itself. In general, the hybrid function of rotator system is made of reverse circulation for drilling rig and casing rotator to work for the pilling constructional field. The casing rotator system is being commercialized in works as a group of the indentation equipment/pulling out the casing on such soft ground as soil and sand. However, that can be impossible if a hard lock is encountered during the work. In order to stop and change drilling rod or drill bit to fracture the rock, sometimes inefficient working problems occurred.
The hybrid function rotator system is to aid the reverse circulation drilling rig and casing rotator can be more effective. To develop a two-speed reducer for complex systems, the rotator may work for not only casing press-fit/pull-out operations that are driven by a high torque and low rotational speed; but also adjusting the torque and rotation speed. Alternately, fitting the characteristics of each method can be available for the base of piling construction work efficiently. In other words, implementing the casing press-fit/drawing and rock crushing in different ways may work in one instrument. By dramatically reducing equipment replacement and construction costs, and shortening construction period, it can help lower the cost of construction companies at a competitive power.
Fig. 1 Schematic structure for Rotator system
The Strength Analysis of Planetary Gears of Two Speed Reducer for Rotator System with Hybrid Function for the Piling Construction Work
Myung-Ho Bae1 and Tae-Yeol Bae2,#
1 Department of Aviation Maintenance, Changwon Moonsung University, 91 Chunghon-ro, Changwon-city, 51410, South Korea 2 Department of Mechatronics, Changwon Moonsung University, 91 Chunghon-ro, Changwon-city, 51410, South Korea
# Corresponding Author / E-mail: [email protected], TEL: +82-55-279-5276, FAX: +82-55-279-5132
KEYWORDS : Reverse circulation drilling rig, Casing rotor, Two speed reducer, Gear bending stress, Gear compressive stress
The power train of two speed reducer, for rotator system with hybrid function for the piling construction work, makes use of the complex planetary gears to operate hybrid rotator system including both case rotating and reverse circulation drilling functions. The complex planetary gears are very important parts of reducer for hybrid rotator system because of strength problem. In the present study, calculating the specifications of the complex planetary gears and analyzing the gear bending and compressive stresses of the planetary gears, it is necessary to analyze gear bending and compressive stresses confidently for optimal design of the complex planetary gears in respect of cost and reliability. In this paper, analyze actual gear bending and compressive stresses analysis of the planetary gear system using Lewes & Hertz equation and verifying the calculated specifications of the differential planetary gears by evaluating the results with the data of allowable bending and compressive stress from the Stress - No. of cycles curves of gears are equally significant.
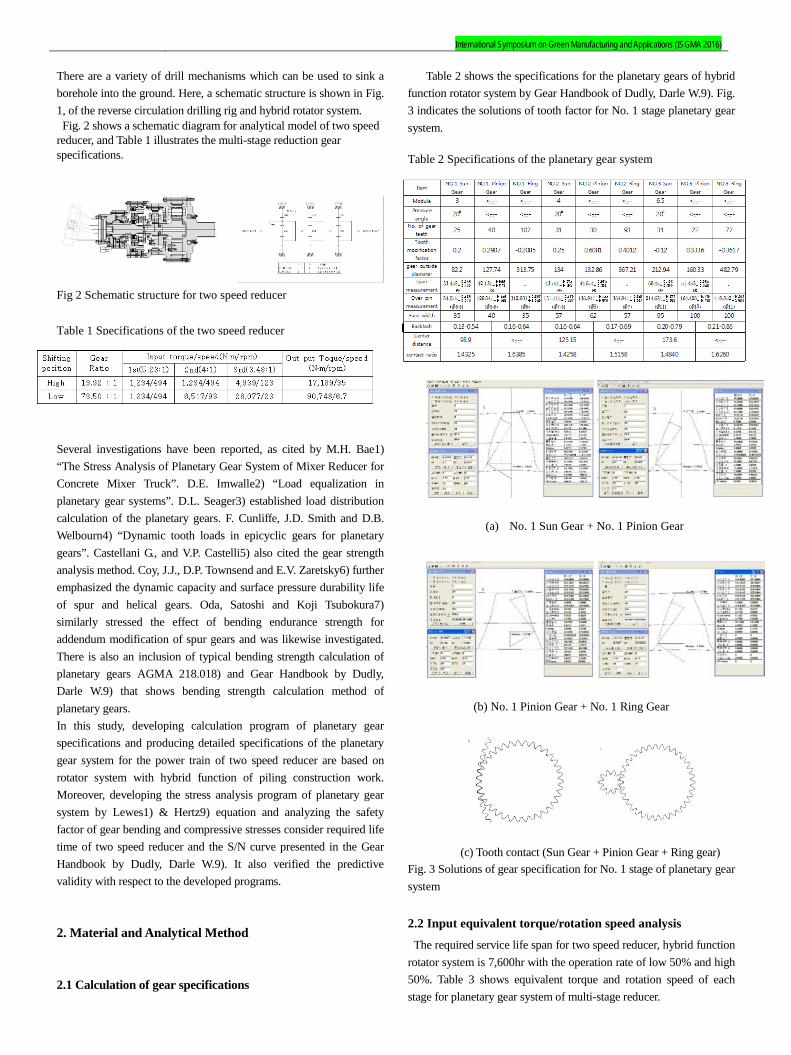
International Symposium on Green Manufacturing and Applications (ISGMA 2016) There are a variety of drill mechanisms which can be used to sink a borehole into the ground. Here, a schematic structure is shown in Fig. 1, of the reverse circulation drilling rig and hybrid rotator system. Fig. 2 shows a schematic diagram for analytical model of two speed reducer, and Table 1 illustrates the multi-stage reduction gear specifications. Fig 2 Schematic structure for two speed reducer
Several investigations have been reported, as cited by M.H. Bae1) “The Stress Analysis of Planetary Gear System of Mixer Reducer for Concrete Mixer Truck”. D.E. Imwalle2) “Load equalization in planetary gear systems”. D.L. Seager3) established load distribution calculation of the planetary gears. F. Cunliffe, J.D. Smith and D.B. Welbourn4) “Dynamic tooth loads in epicyclic gears for planetary gears”. Castellani G., and V.P. Castelli5) also cited the gear strength analysis method. Coy, J.J., D.P. Townsend and E.V. Zaretsky6) further emphasized the dynamic capacity and surface pressure durability life of spur and helical gears. Oda, Satoshi and Koji Tsubokura7) similarly stressed the effect of bending endurance strength for addendum modification of spur gears and was likewise investigated. There is also an inclusion of typical bending strength calculation of planetary gears AGMA 218.018) and Gear Handbook by Dudly, Darle W.9) that shows bending strength calculation method of planetary gears. In this study, developing calculation program of planetary gear specifications and producing detailed specifications of the planetary gear system for the power train of two speed reducer are based on rotator system with hybrid function of piling construction work. Moreover, developing the stress analysis program of planetary gear system by Lewes1) & Hertz9) equation and analyzing the safety factor of gear bending and compressive stresses consider required life time of two speed reducer and the S/N curve presented in the Gear Handbook by Dudly, Darle W.9). It also verified the predictive validity with respect to the developed programs. 2. Material and Analytical Method 2.1 Calculation of gear specifications
Table 2 shows the specifications for the planetary gears of hybrid function rotator system by Gear Handbook of Dudly, Darle W.9). Fig. 3 indicates the solutions of tooth factor for No. 1 stage planetary gear system.
Table 2 Specifications of the planetary gear system
(a) No. 1 Sun Gear + No. 1 Pinion Gear
(b) No. 1 Pinion Gear + No. 1 Ring Gear
(c) Tooth contact (Sun Gear + Pinion Gear + Ring gear) Fig. 3 Solutions of gear specification for No. 1 stage of planetary gear system
2.2 Input equivalent torque/rotation speed analysis
The required service life span for two speed reducer, hybrid function rotator system is 7,600hr with the operation rate of low 50% and high 50%. Table 3 shows equivalent torque and rotation speed of each stage for planetary gear system of multi-stage reducer.
Table 1 Specifications of the two speed reducer

International Symposium on Green Manufacturing and Applications (ISGMA 2016) PP051
Table 3 Input equivalent torque and rotation speed for stage
Equivalent mean torque for the average equivalent load of multi stage reducer, Tmi is as follows:
(1)
whereas Ti is working torque, N is rotating speed, t is working
time and n is power index.
Equivalent mean rotating speed for the average equivalent rotating speed of mixer reducer, Nmi is as follows
(2)
whereas Ni is rotating speed and ti is working time. 2.3 Torque and number of rotation analysis From the schematic diagram in Fig. 2, the gear ratio of two speed reducer calculated by relative speed diagram method10) is as follows:
whereas AH is high speed stage reduction ratio and AL is low speed stage reduction ratio.
The number of rotation for each planetary gear calculated by relative speed diagram method10) is as follows:
whereas is rotation speed No.1, 2, 3 stage of sun gear,
is rotation speed No.1, 2, 3 stage of pinion gear, is rotation speed No.1, 2, 3 stage of ring gear, is number of teeth No.1, 2, 3 stage of sun gear, is number of teeth No.1, 2, 3 stage of pinion gear and is number of teeth No.1, 2, 3 stage of ring gear
From the above equations, the torque and rotation speed is shown in Table 4.
Table 3 Torque and rotation speed(N․m/rpm)
2.4 Gear bending stress analysis The actual gear bending stress equation by Lewes11) formula is as
follows:
(7)
whereas S is actual gear bending stress(N/mm2), T is torque(N∙m),
Na is length of action in the plane of rotation(mm), F is face width(mm), X is Lewes bending factor(mm) and Z is number of teeth.
Allowable gear bending stress equation by Gear Handbook of Dudly, Darle W.9) including gear bending S/N curve is as follows:
(8)
whereas Sab is allowable gear bending stress(N/mm2), NF is No. of cycles and C1 is coefficient. 2.5 Gear compressive stress analysis
The actual gear compressive stress P(N/mm2) applied to the tip of the planetary gears based on contact formula of Hertz9) is as follows:
(9) whereas α is normal pressure angle, Φ is transverse pressure angle, T is torque on driving gear(N·m), Fc is active face width in contact(mm), Z is No. of teeth on driving gear, CD is operating center distance, Na is length of action in the plane of rotation(mm), A = , OR is outside radius of gear and BR is base radius of gear.
Allowable gear compressive stress equation by Gear Handbook of Dudly, Darle W.9) including gear compressive S/N curve is as follows:
(10)
whereas Sac is allowable gear compressive stress(N/mm2), NF is
No. of cycles and C2 is coefficient. 2.6 The results of the gear bending stress analysis
Calculating actual gear bending and compressive stresses of planetary gear system and considering required a service life span of 7,600hr, produce safety factors and verify the problems of gear strength for the calculated specifications of the planetary gear system

International Symposium on Green Manufacturing and Applications (ISGMA 2016) for two speed reducer of hybrid function rotator system.
Fig. 4 shows the results of the gear bending stress analysis and Fig. 5 the results of gear compressive stress analysis of planetary gear system. Planetary gear system of two speed reducer for rotator system with hybrid function consisted of sun gears, pinion gears, and ring gears.(A to I) It can be shown that actual gear bending & compressive
stresses of the planetary gear system are under the allowable gear bending and compressive stresses in these S/N curves. Thus, calculation results are set safely and have been verified as valid
Fig. 4 The results of the gear bending stress analysis
Fig. 5 The results of the gear compressive stress analysis
3. Conclusions 4.1 Fatigue life (1) In this study, analysis of actual gear bending and compressive stresses of the planetary gear system using Lewes & Hertz equation and verifying the calculated specifications of the planetary gear system, evaluate the results with the data of allowable bending and compressive stress from the Stress-No. of cycles curves of gears, based on Gear Handbook of Dudly, Darle W for two-speed reducer rotator system with hybrid function for the piling construction work. (2) In respect of the result of gear bending and compressive stress
analysis of calculated specifications for planetary gear system of two speed reducer rotator system, the strength of planetary gear system and the developed programs have been verified as valid. (3) Reducer is an important component for construction machinery industry of the developed programs and calculating the specifications and analyzing the gear bending and compressive stresses of the planetary gear system for reducer are expected to be effectively utilized.
Future research on more excellent planetary gear system of the various reducers for construction machines is expected to be still performed.
ACKNOWLEDGEMENT
This work has been supported by the Ministry of Trade, Industry & Energy,(project number ; 10051341, Development of the Dia. 4m class Rotator System with Hybrid Function for the Pilling Construction Work) and the authors are gratefully appreciative of the support. REFERENCES 1. Myung Ho Bae, Tae Yeol Bae, Yon Sang Cho, Ho Yeon Son and
Dang Ju Kim, “The Stress Analysis of Planetary Gear System of Mixer Reducer for Concrete Mixer Truck”, Journal of Drive and Control, Vol. 12 No. 4, pp. 77-81, December 2015.
2. D. E. Imwalle, “Load Equalization in Planetary Gear Systems”, ASME publication at the Mechanisms Conference & International Symposium on Gearing and Transmissions, pp. 232-238, 1972
3. D. L. Seager, “Load Sharing Among Planet Gears”, SAE publication No. 700178, pp. 651-656, 1972
4. F. Cunliffe, J. D. Smith and D. B. Welbourn, “Dynamic Tooth Loads in Epicyclic Gears”, Transactions of the ASME Journal of Engineering for Industry, pp. 578 - 584, 1974.
5. Castellani G., and V. P. Castelli, “Rating Gear Strength”, ASME Paper No. 80-C2/DET-88, pp. 37-43, 1980.
6. Coy, J. J., D. P. Townsend, and E. V. Zaretsky, “Dynamic Capacity and Surface Fatigue Life for Spur and Helical Gears”, ASME Paper No. 75-Lub-19, pp. 56-73, 1975.
7. Oda, Satoshi and Koji Tsubokura, “Effects of Addendum Modification on Bending Fatigue Strength of Spur Gears”(3rd Report, Cast Iron and Cast Steel Gears), Bull. JSME, Vol. 24, No. 190, Paper No. 190-15, pp. 24-30, April 1981.
8. American Gear Manufacturers Assoc.: “Rating the Pitting Resistance and Bending Strength of Spur and Helical Involute Gear Teeth", AGMA Standard 218.01, pp. 14-20, 1982
9. D.W. Dudley, “The Handbook of Practical Gear Design”, 2nd Edition, Mcgraw-Hill,pp. 1.27-1.32, 2.1-2.12, 3.1-3.45, 3.78-3.112, 1984.
10. M. H. Bae, S. K. Jang and S. Y. Lee. “Automotive & Continuously Variable Transmission”, 2nd Edition, SunHak publication, pp. 37-44, 2009.
11. Lewes, Wilfred, “Investigation of Strength of Gear Teeth”, Proc. Eng. Club, Philadelphia, 1893.
International Symposium on Green Manufacturing and Applications (ISGMA 2016) PP055
NOMENCLATURE 𝐹𝐹𝑅𝑅 = Required attraction force for opening 𝐹𝐹𝑓𝑓 = Applied force to plunger 𝐹𝐹𝑠𝑠 = Spring force 𝑙𝑙𝑓𝑓 = Free length of spring 𝑙𝑙𝑠𝑠 = Setting length of spring 𝐾𝐾 = Spring constant 𝑐𝑐 = Allowance coefficient 𝑈𝑈 = Magnetomotive force 𝑁𝑁 = Number of turns in a coil 𝐼𝐼 = Current 𝑉𝑉 = Voltage 𝐵𝐵𝑖𝑖 = Inner diameter of coil bobbin 𝑛𝑛𝑐𝑐 = Number of turns along axial direction 𝑚𝑚𝑐𝑐 = Number of layer along radial direction 𝑤𝑤 = Width of coil bobbin ℎ = Height of coil bobbin 𝐶𝐶𝑑𝑑 = Enameled wire diameter 𝑁𝑁𝑑𝑑 = Copper wire diameter 𝜌𝜌 = Specific resistance 𝑙𝑙𝑐𝑐𝑐𝑐 = Mean length of a trun 𝑅𝑅20 = Coil resistance at 20
𝑇𝑇ℎ = Saturation temperature of coil 𝑅𝑅ℎ = Coil resistance at 𝑇𝑇ℎ
1. Introduction
Hydrogen fuel cell vehicle is a type of electric vehicle of which motor is actuated by the electric power produced by electrochemical reaction where hydrogen reacts with oxygen to form water. Pollutants such as CO2, HC, and NOx are not discharged as the actuation principle of the fuel cell does not include any combustion reaction, and the energy conversion efficiency is very high as there is no need for a moving part for reciprocating motion such as a piston in an engine.1
However, to extend the driving range and to secure competitiveness with conventional fuels, the hydrogen gas storage capacity has been increased by compressing the gas at ultrahigh pressure of 700 bar. To store and use the fuel at such ultrahigh pressure, securing the safety of the pressure container and value is more important than anything.
The safety of the pressure container is secured by extruding the inner vessel with high strength aluminum liner and performing an autofrettage process. Subsequently stacking carbon fibers on the
Design of Solenoid Actuator for FCV Cylinder Valve using Electro Magnetic Field Analysis
Dong-Ju Lee1, Hyo Ryeol Lee1, Jung Hwan Ahn1 and Hwa Young Kim1,#
1 School of Mechanical Engineering, Pusan National University, 2, Busandaehak-ro 63beon-gil, Geumjeong-gu, Busan, 46241, South Korea # Corresponding Author / E-mail: [email protected], TEL: +82-10-7778-2861
KEYWORDS : Fuel cell vehicle, Pressure vessel, UltraHigh pressure, Solenoid valve, ElectroMagnetic field analysis
Growing concerns regarding environmental pollution have recently increased the demand for green vehicles. Green vehicles include electric vehicles, natural gas vehicles, fuel cell vehicles(FCV), and the vehicles running with the fuel such as a bio diesel or an ethanol blend. FCV is equipped with the cylinder valve installed in ultrahigh pressure vessel to control the hydrogen flow. For this purpose, the optimum design of solenoid actuator is necessary to secure at driving a FCV. In this study, the electromagnetic field analysis for ensuring the reliable operation of the solenoid actuator was conducted by using a Maxwell V15. The electromagnetic field analysis was performed by magnetostatic technique according to distance between magnetic poles in order to predict the attraction force. Finally, the test of endurance, internal and external leakage test was performed by the regulation to evaluate the air tightness and the safety of solenoid valve. The test results indicate that the leakage of solenoid valve is no leakage at testing conditions.
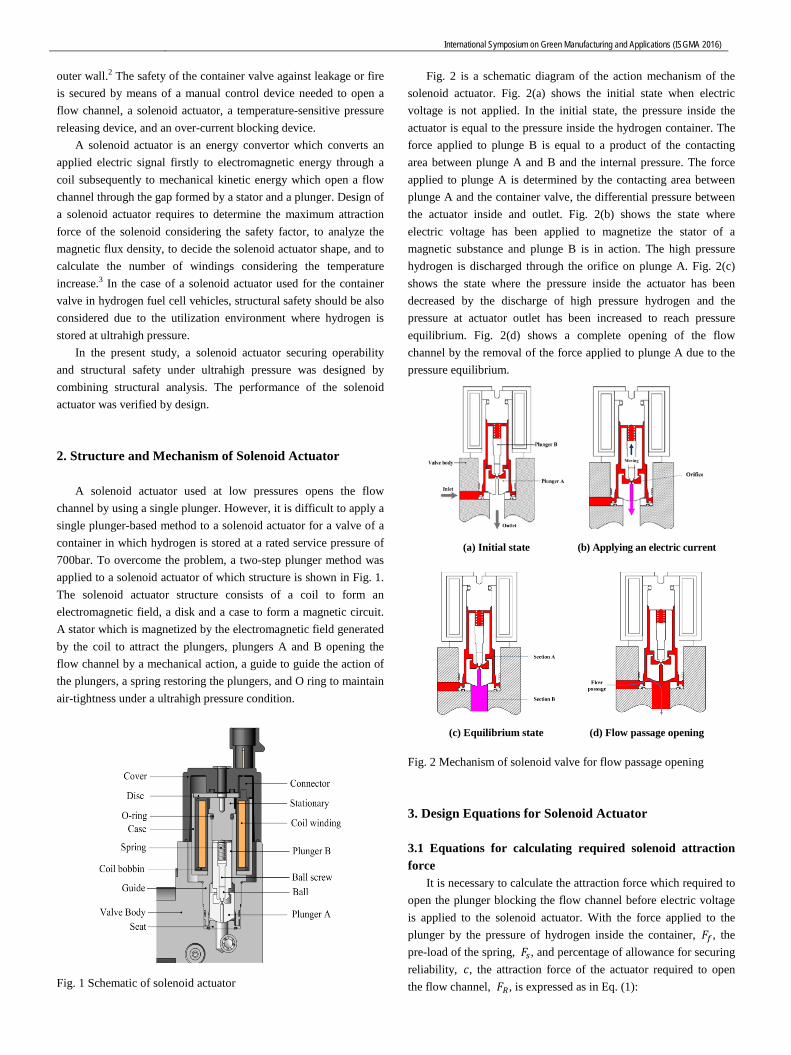
International Symposium on Green Manufacturing and Applications (ISGMA 2016) outer wall.2 The safety of the container valve against leakage or fire is secured by means of a manual control device needed to open a flow channel, a solenoid actuator, a temperature-sensitive pressure releasing device, and an over-current blocking device.
A solenoid actuator is an energy convertor which converts an applied electric signal firstly to electromagnetic energy through a coil subsequently to mechanical kinetic energy which open a flow channel through the gap formed by a stator and a plunger. Design of a solenoid actuator requires to determine the maximum attraction force of the solenoid considering the safety factor, to analyze the magnetic flux density, to decide the solenoid actuator shape, and to calculate the number of windings considering the temperature increase.3 In the case of a solenoid actuator used for the container valve in hydrogen fuel cell vehicles, structural safety should be also considered due to the utilization environment where hydrogen is stored at ultrahigh pressure.
In the present study, a solenoid actuator securing operability and structural safety under ultrahigh pressure was designed by combining structural analysis. The performance of the solenoid actuator was verified by design. 2. Structure and Mechanism of Solenoid Actuator
A solenoid actuator used at low pressures opens the flow channel by using a single plunger. However, it is difficult to apply a single plunger-based method to a solenoid actuator for a valve of a container in which hydrogen is stored at a rated service pressure of 700bar. To overcome the problem, a two-step plunger method was applied to a solenoid actuator of which structure is shown in Fig. 1. The solenoid actuator structure consists of a coil to form an electromagnetic field, a disk and a case to form a magnetic circuit. A stator which is magnetized by the electromagnetic field generated by the coil to attract the plungers, plungers A and B opening the flow channel by a mechanical action, a guide to guide the action of the plungers, a spring restoring the plungers, and O ring to maintain air-tightness under a ultrahigh pressure condition.
Fig. 1 Schematic of solenoid actuator
Fig. 2 is a schematic diagram of the action mechanism of the solenoid actuator. Fig. 2(a) shows the initial state when electric voltage is not applied. In the initial state, the pressure inside the actuator is equal to the pressure inside the hydrogen container. The force applied to plunge B is equal to a product of the contacting area between plunge A and B and the internal pressure. The force applied to plunge A is determined by the contacting area between plunge A and the container valve, the differential pressure between the actuator inside and outlet. Fig. 2(b) shows the state where electric voltage has been applied to magnetize the stator of a magnetic substance and plunge B is in action. The high pressure hydrogen is discharged through the orifice on plunge A. Fig. 2(c) shows the state where the pressure inside the actuator has been decreased by the discharge of high pressure hydrogen and the pressure at actuator outlet has been increased to reach pressure equilibrium. Fig. 2(d) shows a complete opening of the flow channel by the removal of the force applied to plunge A due to the pressure equilibrium.
(a) Initial state (b) Applying an electric current
(c) Equilibrium state (d) Flow passage opening
Fig. 2 Mechanism of solenoid valve for flow passage opening 3. Design Equations for Solenoid Actuator 3.1 Equations for calculating required solenoid attraction force
It is necessary to calculate the attraction force which required to open the plunger blocking the flow channel before electric voltage is applied to the solenoid actuator. With the force applied to the plunger by the pressure of hydrogen inside the container, 𝐹𝐹𝑓𝑓, the pre-load of the spring, 𝐹𝐹𝑠𝑠, and percentage of allowance for securing reliability, 𝑐𝑐, the attraction force of the actuator required to open the flow channel, 𝐹𝐹𝑅𝑅, is expressed as in Eq. (1):

International Symposium on Green Manufacturing and Applications (ISGMA 2016) PP055
𝐹𝐹𝑅𝑅 = 𝑐𝑐[𝐹𝐹𝑓𝑓 + 𝐹𝐹𝑠𝑠] (1) If the free length of the spring is denoted as 𝑙𝑙𝑓𝑓, the setting
length as 𝑙𝑙𝑠𝑠, and the spring constant, 𝐾𝐾, the pre-load on the spring, 𝐹𝐹𝑠𝑠, is expressed as Eq. (2):
𝐹𝐹𝑠𝑠 = (𝑙𝑙𝑓𝑓 − 𝑙𝑙𝑠𝑠)𝐾𝐾 (2)
3.2 Equations for calculating magnetomotive force of solenoid actuator4
The magnetomotive force is expressed as a product of the number of coil windings, 𝑁𝑁 , and the electric current flowing through the coil, 𝐼𝐼, as Eq. (3):
𝑈𝑈 = 𝑁𝑁𝐼𝐼 (3) Fig. 3 is a simple drawing of the solenoid coil bobbin and the
coil winding around the bobbin. With the inner diameter of the coil bobbin, 𝐵𝐵𝑖𝑖, the outer diameter, 𝐵𝐵𝑜𝑜, the height, ℎ, and the diameter of the enamel wire, 𝐶𝐶𝑑𝑑, the number of stacks in the direction of the coil bobbin axis, 𝑛𝑛𝑐𝑐, and the number of stacks in the direction of the radius, 𝑚𝑚𝑐𝑐, are expressed as Eqs. (4) and (5):
𝑛𝑛𝑐𝑐 = ℎ
𝐶𝐶𝑑𝑑 − 1 (4)
𝑚𝑚𝑐𝑐 = 𝑤𝑤
𝐶𝐶𝑑𝑑 (5)
N = 𝑛𝑛𝑐𝑐𝑚𝑚𝑐𝑐 (6)
Fig. 3 Schematic of coil bobbin5
The electric current flowing through the coil is expressed with
the diameter of the copper wire excluding the insulating layer of the enamel wire, 𝑁𝑁𝑑𝑑, specific resistance, 𝜌𝜌, and the average length of one coil winding, 𝑙𝑙𝑐𝑐𝑐𝑐, as Eq. (7):
I = 𝑉𝑉
4𝜌𝜌(𝑙𝑙𝑐𝑐𝑎𝑎𝑁𝑁𝜋𝜋𝑁𝑁𝑑𝑑
2 ) (7)
𝑙𝑙𝑐𝑐𝑐𝑐 = 𝜋𝜋𝐵𝐵𝑖𝑖(1+2𝐶𝐶𝑑𝑑𝑚𝑚𝑐𝑐)𝑉𝑉
2
Generally, when electric current is applied to the coil, the temperature is gradually increased until it reaches a certain saturated value. The increased temperature causes increased coil resistance, resulting in reduction of the solenoid attraction force. Therefore, it is important to compare the required attraction force of the solenoid with the attraction force decrease by the increase of temperature. The increase of the coil resistance by the increase of temperature, 𝑅𝑅ℎ, may be calculated by using the coil resistance at 20, 𝑅𝑅20, and the saturation temperature, 𝑇𝑇ℎ, in Eq. (8):6
𝑅𝑅ℎ = 𝑅𝑅20 × (234.5+𝑇𝑇ℎ
234.5+20) (8)
4. Analysis of solenoid actuator electromagnetic field 4.1 Required attraction force of solenoid actuator
Fig. 4 shows the force applied to the plunger in the initial state where electric voltage has not been applied yet. The force applied the plunger by the high pressure hydrogen in the container was calculated by referring to the EU 406/2010 Annex IV which is the standard firstly suggested for hydrogen fuel cell vehicles in Europe. According to the standard, the rated service pressure and the maximum allowable pressure of the container value are regulated to be 700 bar and 875 bar, respectively, and 𝐹𝐹𝑓𝑓 at the maximum allowable pressure of 875 bar is 6.19 N.7 The spring pre-load, 𝐹𝐹𝑠𝑠, calculated by Eq. (2) is 7.06 N. If the percentage of allowance for securing reliability, 𝑐𝑐, is assumed to be 20%, the attraction force required of the actuator to open the flow channel is determined as 15.9 N by Eq. (1).
Fig. 4 Distribution of pressure at initial status 4.2 Conditions for analysis of solenoid actuator electromagnetic field
The design conditions affecting the attraction force of the actuator includes inner diameter, outer diameter, and height of the coil bobbin, area of the vacant parts, the gap between vacant parts, applied electric voltage, the coil saturation temperature, and diameter of the enamel wire. In the analysis of the actuator electromagnetic field, the diameter of the enamel wire, which is the parameter affecting the magnetomotive force of the coil winding around the bobbin, was decided as a design variable. Other variables such as outer diameter and height of the bobbin, area of
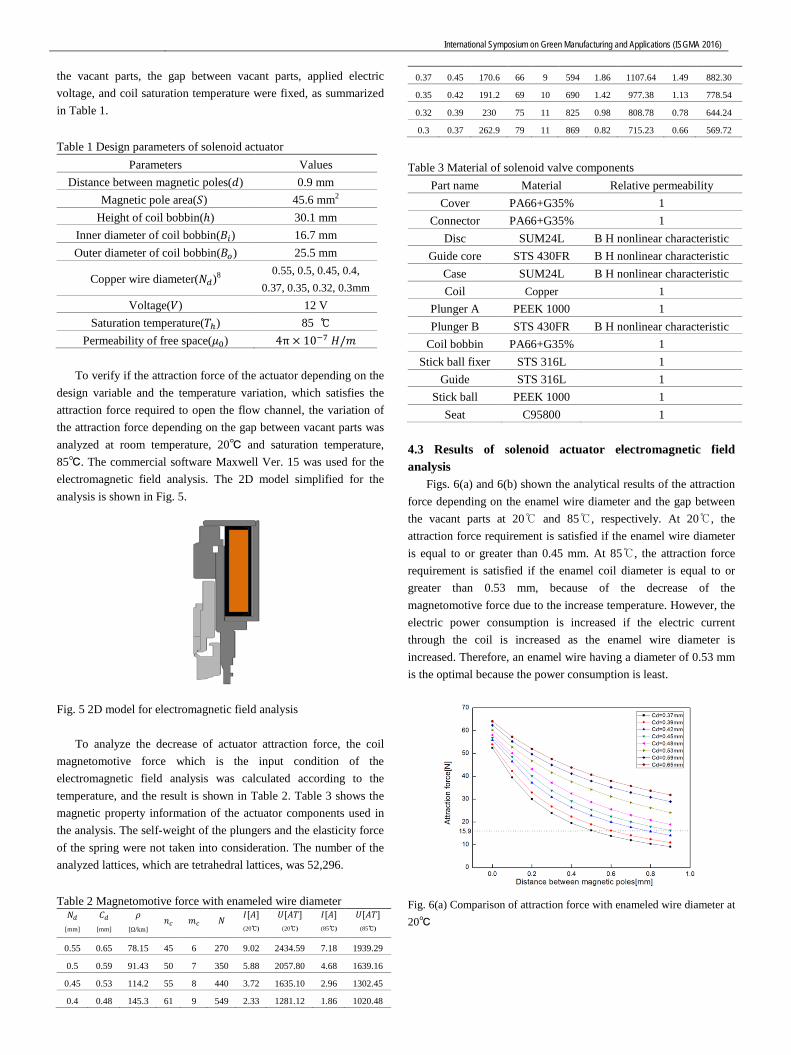
International Symposium on Green Manufacturing and Applications (ISGMA 2016) the vacant parts, the gap between vacant parts, applied electric voltage, and coil saturation temperature were fixed, as summarized in Table 1. Table 1 Design parameters of solenoid actuator
Parameters Values Distance between magnetic poles(𝑑𝑑) 0.9 mm
Magnetic pole area(𝑆𝑆) 45.6 mm2
Height of coil bobbin(ℎ) 30.1 mm Inner diameter of coil bobbin(𝐵𝐵𝑖𝑖) 16.7 mm Outer diameter of coil bobbin(𝐵𝐵𝑜𝑜) 25.5 mm
Copper wire diameter(𝑁𝑁𝑑𝑑)8 0.55, 0.5, 0.45, 0.4, 0.37, 0.35, 0.32, 0.3mm
Voltage(𝑉𝑉) 12 V Saturation temperature(𝑇𝑇ℎ) 85
Permeability of free space(𝜇𝜇0) 4π × 10−7 𝐻𝐻/𝑚𝑚
To verify if the attraction force of the actuator depending on the design variable and the temperature variation, which satisfies the attraction force required to open the flow channel, the variation of the attraction force depending on the gap between vacant parts was analyzed at room temperature, 20 and saturation temperature, 85. The commercial software Maxwell Ver. 15 was used for the electromagnetic field analysis. The 2D model simplified for the analysis is shown in Fig. 5.
Fig. 5 2D model for electromagnetic field analysis To analyze the decrease of actuator attraction force, the coil
magnetomotive force which is the input condition of the electromagnetic field analysis was calculated according to the temperature, and the result is shown in Table 2. Table 3 shows the magnetic property information of the actuator components used in the analysis. The self-weight of the plungers and the elasticity force of the spring were not taken into consideration. The number of the analyzed lattices, which are tetrahedral lattices, was 52,296. Table 2 Magnetomotive force with enameled wire diameter 𝑁𝑁𝑑𝑑
[mm]
𝐶𝐶𝑑𝑑 [mm]
𝜌𝜌 [Ω/km]
𝑛𝑛𝑐𝑐 𝑚𝑚𝑐𝑐 𝑁𝑁 𝐼𝐼[𝐴𝐴] (20)
𝑈𝑈[𝐴𝐴𝑇𝑇] (20)
𝐼𝐼[𝐴𝐴] (85)
𝑈𝑈[𝐴𝐴𝑇𝑇] (85)
0.55 0.65 78.15 45 6 270 9.02 2434.59 7.18 1939.29
0.5 0.59 91.43 50 7 350 5.88 2057.80 4.68 1639.16
0.45 0.53 114.2 55 8 440 3.72 1635.10 2.96 1302.45
0.4 0.48 145.3 61 9 549 2.33 1281.12 1.86 1020.48
0.37 0.45 170.6 66 9 594 1.86 1107.64 1.49 882.30
0.35 0.42 191.2 69 10 690 1.42 977.38 1.13 778.54
0.32 0.39 230 75 11 825 0.98 808.78 0.78 644.24
0.3 0.37 262.9 79 11 869 0.82 715.23 0.66 569.72
Table 3 Material of solenoid valve components
Part name Material Relative permeability Cover PA66+G35% 1
Connector PA66+G35% 1 Disc SUM24L B H nonlinear characteristic
Guide core STS 430FR B H nonlinear characteristic Case SUM24L B H nonlinear characteristic Coil Copper 1
Plunger A PEEK 1000 1 Plunger B STS 430FR B H nonlinear characteristic
Coil bobbin PA66+G35% 1 Stick ball fixer STS 316L 1
Guide STS 316L 1 Stick ball PEEK 1000 1
Seat C95800 1 4.3 Results of solenoid actuator electromagnetic field analysis
Figs. 6(a) and 6(b) shown the analytical results of the attraction force depending on the enamel wire diameter and the gap between the vacant parts at 20 and 85, respectively. At 20, the attraction force requirement is satisfied if the enamel wire diameter is equal to or greater than 0.45 mm. At 85, the attraction force requirement is satisfied if the enamel coil diameter is equal to or greater than 0.53 mm, because of the decrease of the magnetomotive force due to the increase temperature. However, the electric power consumption is increased if the electric current through the coil is increased as the enamel wire diameter is increased. Therefore, an enamel wire having a diameter of 0.53 mm is the optimal because the power consumption is least.
Fig. 6(a) Comparison of attraction force with enameled wire diameter at 20
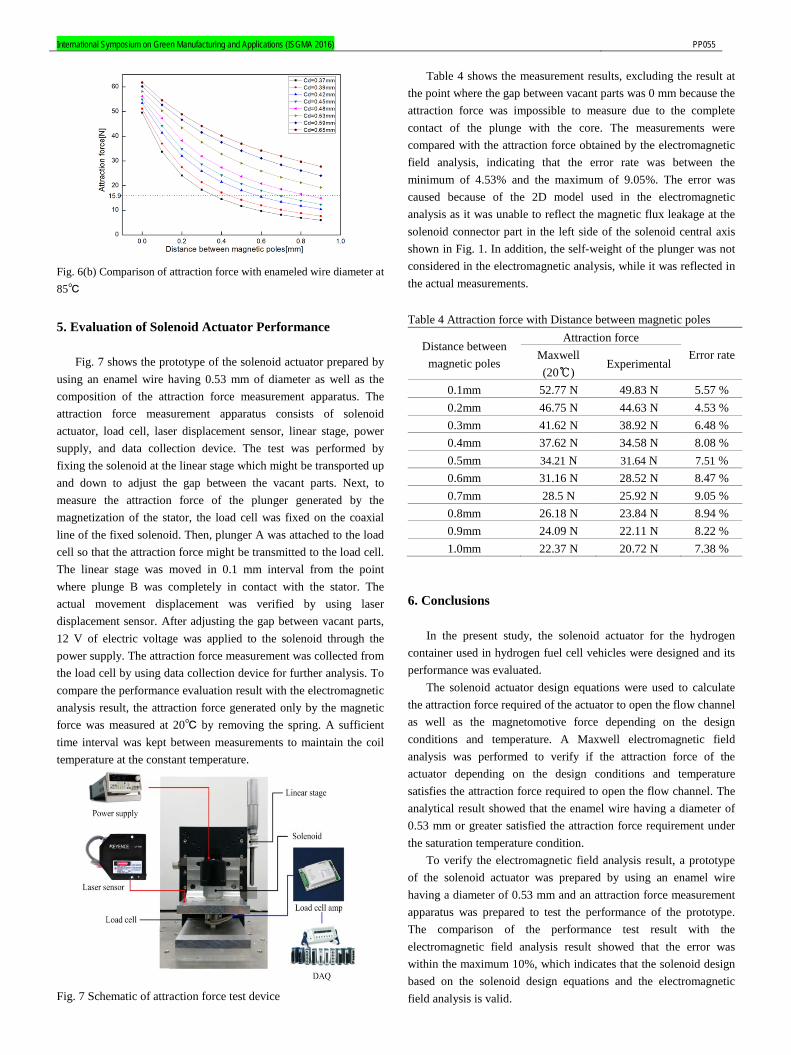
International Symposium on Green Manufacturing and Applications (ISGMA 2016) PP055
Fig. 6(b) Comparison of attraction force with enameled wire diameter at 85
5. Evaluation of Solenoid Actuator Performance
Fig. 7 shows the prototype of the solenoid actuator prepared by using an enamel wire having 0.53 mm of diameter as well as the composition of the attraction force measurement apparatus. The attraction force measurement apparatus consists of solenoid actuator, load cell, laser displacement sensor, linear stage, power supply, and data collection device. The test was performed by fixing the solenoid at the linear stage which might be transported up and down to adjust the gap between the vacant parts. Next, to measure the attraction force of the plunger generated by the magnetization of the stator, the load cell was fixed on the coaxial line of the fixed solenoid. Then, plunger A was attached to the load cell so that the attraction force might be transmitted to the load cell. The linear stage was moved in 0.1 mm interval from the point where plunge B was completely in contact with the stator. The actual movement displacement was verified by using laser displacement sensor. After adjusting the gap between vacant parts, 12 V of electric voltage was applied to the solenoid through the power supply. The attraction force measurement was collected from the load cell by using data collection device for further analysis. To compare the performance evaluation result with the electromagnetic analysis result, the attraction force generated only by the magnetic force was measured at 20 by removing the spring. A sufficient time interval was kept between measurements to maintain the coil temperature at the constant temperature.
Fig. 7 Schematic of attraction force test device
Table 4 shows the measurement results, excluding the result at the point where the gap between vacant parts was 0 mm because the attraction force was impossible to measure due to the complete contact of the plunge with the core. The measurements were compared with the attraction force obtained by the electromagnetic field analysis, indicating that the error rate was between the minimum of 4.53% and the maximum of 9.05%. The error was caused because of the 2D model used in the electromagnetic analysis as it was unable to reflect the magnetic flux leakage at the solenoid connector part in the left side of the solenoid central axis shown in Fig. 1. In addition, the self-weight of the plunger was not considered in the electromagnetic analysis, while it was reflected in the actual measurements. Table 4 Attraction force with Distance between magnetic poles
Distance between magnetic poles
Attraction force Error rate Maxwell
(20) Experimental
0.1mm 52.77 N 49.83 N 5.57 % 0.2mm 46.75 N 44.63 N 4.53 % 0.3mm 41.62 N 38.92 N 6.48 % 0.4mm 37.62 N 34.58 N 8.08 % 0.5mm 34.21 N 31.64 N 7.51 % 0.6mm 31.16 N 28.52 N 8.47 % 0.7mm 28.5 N 25.92 N 9.05 % 0.8mm 26.18 N 23.84 N 8.94 % 0.9mm 24.09 N 22.11 N 8.22 % 1.0mm 22.37 N 20.72 N 7.38 %
6. Conclusions
In the present study, the solenoid actuator for the hydrogen container used in hydrogen fuel cell vehicles were designed and its performance was evaluated.
The solenoid actuator design equations were used to calculate the attraction force required of the actuator to open the flow channel as well as the magnetomotive force depending on the design conditions and temperature. A Maxwell electromagnetic field analysis was performed to verify if the attraction force of the actuator depending on the design conditions and temperature satisfies the attraction force required to open the flow channel. The analytical result showed that the enamel wire having a diameter of 0.53 mm or greater satisfied the attraction force requirement under the saturation temperature condition.
To verify the electromagnetic field analysis result, a prototype of the solenoid actuator was prepared by using an enamel wire having a diameter of 0.53 mm and an attraction force measurement apparatus was prepared to test the performance of the prototype. The comparison of the performance test result with the electromagnetic field analysis result showed that the error was within the maximum 10%, which indicates that the solenoid design based on the solenoid design equations and the electromagnetic field analysis is valid.

International Symposium on Green Manufacturing and Applications (ISGMA 2016) ACKNOWLEDGEMENT
This work was supported by the Human Resource Training
Program for Research Foundation of Korea(No. 2013032233). REFERENCES 1. “The Korean Society of Mechanical Engineers,” J. of the
KSME, Vol. 52, No. 2, pp. 34-38, 2012. <http://ksme.or.kr/board/board.asp?top param=6&sub param=9&b code=1311&Action=content&GotoPage=6&B CATE=BBS9>
2. Kim, C. K. and Kim, D. H., “A Safety Study on the Stress Characteristics of a Composite Pressure Cylinder for a Use of 70MPa Hydrogen Gas Vehicle,” J. of KSMTE, Vol. 21, No. 1, pp. 1-6, 2012.
3. Sung, B. J., “A Design of On/Off Type Solenoid Actuator for Valve Operation,” J. of Drive and Control, Vol. 6, No. 4, pp. 24-32, 2009.
4. Sung, B. J. and Lee, E. W. and Kim, H. E., “Empirical Design of an On and Off Type Solenoid Actuator For Valve Operation,” KIEE International Transactions on EMECS, Vol. 4B, No. 2, pp. 39-46, 2004.
5. Jang, J. H. and Kim, J. H. and Lee, S. J., “Parameter Study on the design of Solenoid to Enhance the Velocity of Coilgun,” J. of the Korean Magnetics Society, Vol. 25, No. 3, pp. 87-91, 2015.
6. Fitzgerald, A. K. and Kingsley, C. Jr. and Umans, S. D., “Electric machinery 6th ed,” McGraw-Hill, New York, USA, 2003.
7. Commission Regulation(European Union), “No 406/2010 of 26 April 2010 implementing Regulation (EC) No 79/2009 of the European Parliament and of the Council on type-approval of hydrogen-powered moto vehicles – ANNEX IV : Requirements for hydrogen components and systems designed to use compressed (gaseous) hydrogen components and systems designed to use compressed (gaseous) hydrogen and their installation on hydrogen powered vehicles,” EU NO 406/2010 – 1:107, European Union, 2010.
8. LS Cable & System LTD., “LS Magent Wire,” viewed 10 Jul. 2015. <http://www.lscns.co.kr/product/catalog4.asp>
International Symposium on Green Manufacturing and Applications (ISGMA 2016) PP075
NOMENCLATURE TTSCL = thickness of transition layer, mm φ = volume ratio of Stellite21 α = thermal expansion coefficient, 10-6K ρ = density, kg/m3 Cp = specific heat, J/kg- k = thermal conductivity, W/m- E = Young’s modulus, GPa ν = Poison’s ratio
1. Introduction
Hard-facing process has been adopted for increasing die life by heat-softening of dies during hot forging process. When hard-facing is applied on the dies, thermal fatigue can occur because of thermal expansion coefficient differences between two materials; base metal and hard-facing material. Park et al. have tried to release the
thermal stress by creating thermal stress control layer (TSCL). Optimal mixing ratio of the base materials and TSCL thickness have been recommended from several cases of finite element analysis for simple model to observe the trend of stress on the interfaces of different regions depending on the mixing ratio and thickness of TSCL.
In this research, we aimed to obtain optimal hard-facing thickness and mixing ratio considering hot forging process for an axle which is now being produced in the field by analyzing thermal stress trend depending on design alternatives. 2. Finite Element Analysis 2.1 Simulation conditions
Final shape of the axle after forming is shown in Fig. 1(a), but analysis model was simplified on the assumption that it’s axi-symmetric (Fig. 1(b)). TSCL is located between base metal region and hard-face region as Fig. 1(c) and formed with the mixture of two materials. To investigate the effect of thickness and mixing ratio of
An Evaluation of Effect on Transition Layer using selective Deposition Technology on Hot Forging Dies
Haichuan Shi1, Gi-Yeol Gwak2, Ho-Jin Lee3, Jong-Rae Cho1,# and Dong-Gyu Ahn3 1 Department of Mechanical Engineering, Korea Maritime & Ocean University, 727, Taejong-ro, Yeongdo-gu, Busan, 49112, South Korea
2 BK21 Plus, Department of Mechanical Engineering, Korea Maritime & Ocean University,727, Taejong-ro, Yeongdo-gu, Busan, 49112, South Korea 3Department of Mechanical Engineering, Chosun University, 309, Pilmun-daero, Dong-gu, Gwangju, 61452, South Korea
# Corresponding Author / E-mail: [email protected], TEL: +82-10-410-4298, FAX: +82-10-405-4790
KEYWORDS :Deposition technology, Transition layer, Thermal crack, Stellite21, Hot forging die
The deposition technology on hot forging dies is adopted to increase the wear resistance of dies. But, the thermal cracks are frequently generated on the deposited area due to thermal stress by different material properties. The metal three-dimensional printing process is to create the desired shape through layer-by-layer deposition of metallic materials. A transition layer between the deposited region and the substrate is applied to reduce thermal stress and to increase fatigue life as a buffer in the interface regions. The proposed technology is applied to the the hot forging die of SKD61 for the axle shaft. The material of deposited region is Stellite21 super-alloy. The transition layers are created on the substrate through the deposition of the mixed power composed of the substrate and the deposited material. The mixed rule is used to find mechanical and thermal properties in order to carry out finite element analysis. The purpose of this paper is to investigate the effect of transition layer focused on the transient thermal stress in the deposited region. In addition, the optimal volume of the transition region is predicted by using this approach.

International Symposium on Green Manufacturing and Applications (ISGMA 2016)
TSCL several alternatives were set as Table 1. Total thickness of hard-face and TSCL is 3 mm. The parameters of the TSCL thickness were set as 1, 1.5 and 2 mm and mixing ratios(volume) of hard-face and base metal were set as 0.25, 0.5 and 0.75. The material properties of base metal, SKD61, and hard-face, Stellite21, are given in Table 2. The material properties of density, thermal expansion coefficient, elastic modulus and Poison’s ratio were obtained by using Mixing law. 2 The specific heat of TSCL material can be yielded in same manner.2 Thermal conductivity after mixing was determined by introducing Maxwell model. 3
(a) (b) (c)
Fig. 1 Axle after hot forging(a), axi-symmetric analysis model(b) and TSCL(c) Table 1 Design alternatives of TSCL
case TTSCL φ case TTSCL φ case TTSCL φ
1 1
0.25 4 1.5
0.25 7 2
0.25 2 0.5 5 0.5 8 0.5 3 0.75 6 0.75 9 0.75
Table 2 Material properties of base metal and hard-face α ρ Cp k E ν SKD61 7,760 10.4 460 25 200 0.29 Stellite21 8,330 14.3 423 17 245 0.30
Fig. 2 Maximum principal stresses on the interface over the forming process
Fig. 3 Comparison of maximum principal stress on the interface
2.2 Results
To observe the thermal stress distributions on the interfaces, hot forging simulation considering heat transfer was conducted for various cases. The initial temperature of the workpiece and dies were set as 1150 and 350, respectively. Fig. 2 shows the maximum principal stress trend over the forging process for one shot at the region where the maximum stress appeared on the interface A and B. The condition that has not considered thermal expansion is calculated with case 0. During the process, the maximum principal stress was observed at 90 % of the process time after starting forming. Principal stresses for all cases at this moment are plotted in Fig. 3. From the data shown in Fig. 3 a trend toward decrease in first principal stress was observed with increase in transition layer thickness and mixing ratio of hard-face material.
3. Conclusions
To define optimal TSCL for hot forging of axle, finite element
analysis has been performed with considering various combinations of the hard-face and TSCL. From the analysis results taking real forming process into account, thermal stress on the interfaces was controlled by changing TSCL thickness and mixing ratio.
For two interface of the transition region, TSCL thickness as 2 mm with mixing ratio of Stellite21 as 75% could be the most effective alternative.
REFERENCES 1. Park N. R.., Ahn D. G., and Oh J. W., “Estimation of the
Thickness and the Material Combination of the Thermal Stress Control Layer(TSCL) fo the Stellite21 Hardfaced STD61 Hot Working Tool Steel Using Three-Dimensional Finite element Analysis,” Trans. Korean Soc. Mech. Eng. A, Vol. 38, No. 8, pp. 857-862, 2014.
2. Jeong, J. S. and Shin, K. H., "Fabrication of Functionally Graded Materials between P21 Tool Steel and Cu by Using Laser-Aided Layered Manufacturing, "Trans. Korean Soc. Mech. Eng. A, Vol. 37, No. 1, pp.61~66, 2013.
3. Jang, S. P. and Choi, S. U. S., "Effects of Various Parameters on Nanofluid Thermal Conductivity," Trans. AMSE Journal of Heat Transfer, Vol. 129, Issue 5, pp.617~623, 2007.
Top die
Pressing direction
Work piece
Bottom die
Hard-face
TSCL Base metal
Forging time, s
Max
imum
prin
cipa
l stre
ss, M
Pa
Max
imum
prin
cipa
l stre
ss, M
Pa
Interface A
Interface B

International Symposium on Green Manufacturing and Applications (ISGMA 2016) PP154
NOMENCLATURE a = directional orientation of the system h = strip thickness with strip thickness and strip thickness strip thickness
1. Introduction
In recent years IoT (Internet of Things) and embedded systems are widely used to control the hardware in various areas, such as (IA) information appliances, control engineering and IE (information equipment). In addition that the development of technology, such as integrated microprocessor also increased needs of embedded system that can perform multiple functions at the same time. As a result, the cooperation and information sharing between the physical object consisting of a variety of machinery and equipment has become closer. However, an embedded system, even if the software has been developed, it’s difficult to verify whether the software control the hardware correctly. Only increased cooperation and information sharing between the physical object consisting of a variety of machinery and equipment, embedded systems are high barriers to entry and there are many things to consider before design the systems.
Design of the system such as described above, the developer can interconnect a virtual environment with the physical process of connection you want.
However, configure the hardware and software together is very difficult in this process. Also, it does not have the system for the verification and management. In order to solve the bottleneck in these procedures, constructing a embedded system simulation in virtual environment is always necessary. If the developer builds a model and predicts the outcome in advance through a simulation, it is possible to verify the initial intent of developers and reduce trial and error before the actual design.
In this study, It has developed a Web-based collaboration framework which can be flexible connection of macroscopically virtual environment and the physical environment. This framework is able to verification and management physical environment that resolve the bottlenecks encountered during base expansion and development process of embedded systems. 2. Current Status of Research
Recently many studies about the configuration of IoT framework have been conducted. These studies include a form of design verification through the management and simulation of IoT
Development of Web-based Simulator for Verifying the Design of Embedded Systems
Jin Yongzhu1, Woong Yang1, Hyun-Tae Hwang1 and Soo-Hong Lee1,#
1 Department of Mechanical Engineering, Yonsei University, 50 Yonsei-Ro, Seodaemun-Gu, Seoul 120-749, South Korea 2 School of Mechanical Engineering, Green Institute of Technology, 23-7, Hana-dong, Dong-gu, Seoul, 23456, South Korea
# Soo-Hong Lee / E-mail: [email protected], TEL: +822-2123-2823, FAX:+822-312-2159
KEYWORDS : Web-based platform , IoT (Internet of Things), Embedded System, Verifying Design, Web-based simulator
The computational engineering design becomes spotlighted and plays an important role in modern society. Recently interactive products and systems are increasing, such as IoT (Internet of things) or embedded systems. Cyber Physical Systems (CPS) is hot object of interest as an extension of the embedded system. The interactive products or systems are controlled by the integrated physical system to the network are increased through the cyber system. Currently, Embedded systems have been widely used in the plant control system that including the portable range of applications smart phones or nuclear power plant control system. However, only increased cooperation and information sharing between the physical object consisting of a variety of machinery and equipment, embedded systems are high barriers to entry and there are many things to consider before design the systems In this research we developed a Web-based Simulator for Verifying the Design of Embedded Systems, which can be solve the bottleneck to face with the base expansion of IoT environment during the development process and flexible connection of virtual environment and the physical environment. It is possible that this framework can lower the barriers entry to the cost of software and use the software without a license. In addition, it can verify and manage the system design more efficiently through obtain the results from virtual environments.

International Symposium on Green Manufacturing and Applications (ISGMA 2016)
environment. Lina Yao and Quan Z. Sheng [1] are provide integrated Web-based interface for managing the IoT environment, and developers are able to make better decisions in environment that they have placed. This system utilizes a hierarchical framework, which can share and manage the information generated by the physical sensor.
Ho Dong Ryu and Soo Yong Jeong [2] provide a method for ensuring the reliability and stability of embedded systems which are used in IoT.
Design and development of embedded systems, is one of the most complex development method. It is not easy to build embedded systems software of virtual execution environment for embedded systems development. Virtual prototyping approach is a method of performing a simulation of embedded systems in physical environment.
Soo Young Jang and Ho dong Ryu [3] propose a virtual prototype framework based on the SWF (Shockwave Flash) format to simulate an embedded system.
IoT environment may be thought of as a combination of a number of embedded systems. It is necessary to understand the nature of the various fields of embedded systems in collaboration between system developers.
In this study, we had developed a Web-based collaboration framework which can resolve the bottlenecks and verify and manage the embedded systems. Table1 comparing the differentiation with related developments. 3. Web-based IoT Framework
This research is focused on developing the embedded system simulation framework. This developed framework is concentrated on computational pre-design by using arduino. It is open-source microcontroller-based kits for building digital devices and interactive objects and software is easily available cross-platform application written in Java, C and C++. This can easily make the simple product combined hardware and software. Fig. 1 shows the system structure of web-based simulation framework and Fig. 2 shows the Web-based
IoT Framework.
Fig. 1 System structure of web-based simulation framework Various components of the framework are composed of various
forms of Application Programming Interface (API) were interconnected via the web. First, user select one of the scenarios they need. And each of the scenarios contains hardware and software necessary for IoT deployment environment. Hardware and software of the virtual environment are linked by Block Diagram Coder. The database server is linked to the main server manages the design constraints, each project dimension of the information and role of the each part. User change the detailed settings (sensor, module design Tool, Verification Tool) from the Block Diagram Coder. Each of the parts are modular informs the user by analyzing the status of the connection in real time.
Based on the each part of the information (design constraints, rule) saved in database server form a rule engine. Rule engines are analyzing diagram code. The first is simply to analyze the accuracy of the connection between hardware and software. Second, although the software and hardware connection is correct, simulation result are different with user selected scenario. Rule engine can analyze the user to select the correct software and hardware.
4. Conclusions
In this paper, it was proposed a web-based simulation framework for the design verification of embedded systems and conducted a study of the programming simulation interfaces and
Fig. 2 Web-based IoT Framework.

International Symposium on Green Manufacturing and Applications (ISGMA 2016) PP154
circuits. This can simulate and control the product via to the web page.
In future research, we envision a capable simulation scenario control of the multiple embedded modules that specializes in IoT environment.
ACKNOWLEDGEMENT
This research was supported by the EDISON Program through
the National Research Foundation of Korea(NRF) funded by the Ministry of Science, ICT & Future Planning (No. 2014M3C1A6038802) REFERENCES 1. Lina Yao, Quan Z. Sheng: Web-Based Management of the
Internet of Things, Internet of Things, People, and Processes, IEEE Internet Computing,2015.
2. Ho Dong Ryu, Soo Yong Jeong, Woo Jin Lee, Hwang Soo Kim: IoT Internet ; Development of Log-Based Testing Framework for Unit Testing of Embedded Software, Korea Information Processing Society, Software and Data Engineering, 4.9 419-424, 2015.
3. Jang, Soo Young, Jihun Kim, and Woo Jin Lee. "Development of SWF Based Virtual Prototyping Framework for Simulating Ubiquitous Systems." Ubiquitous Information Technologies and Applications. Springer Berlin Heidelberg, 2014. 557-565.
4. Hribernik, Karl, et al, Co-creating the Internet of Things—First experiences in the participatory design of Intelligent Products with Arduino, Concurrent Enterprising (ICE), 2011 17th International Conferenceon. IEEE, 2011.
5. Melgar, Enrique Ramos, and Ciriaco Castro Diez, Arduino and Kinect Projects: Design, Build, Blow Their Minds, Apress, 2012.
6. Weichel, C., Lau, M., Kim, D., Villar, N., & Gellersen, H., MixFab: a mixed-reality environment for personal fabrication, In
Proceedings of the 32nd annual ACM conference on Human factors in computing systems, pp. 3855-3864, 2014.
7. Grasshopper, http://www.grasshopper3d.com/, 2015.
8. Nam, T. J, Sketch-based rapid prototyping platform for hardware-software integrated interactive products, in CHI'05 extended abstracts on Human factors in computing systems, pp. 1689-1692, 2005.
9. Arduino hompage, http://arduino.cc. 2015
10. Autodesk 123D Design, http://www.123dapp.com/design
11. Fritzing, http://fritzing.org/home/
Table 1 Comparison with related development
International Symposium on Green Manufacturing and Applications (ISGMA 2016) PP177
NOMENCLATURE µ = viscosity of water D = nozzle diameter 𝑃𝑃 = pump pressure [bar] ma = average abrasive mass flowrate [g/min] 𝑓𝑓 = machining feedrate 𝑢𝑢 = axial velocity along radius [m/s] 𝑈𝑈 = axial centerline velocity [m/s] 𝑉𝑉 = axial average velocity [m/s] 𝑅𝑅𝑅𝑅 = Reynolds number (Re = ρVD/µ) LP = Line of perpendicular crossing along feed rate path
1. Introduction
Abrasive waterjet machining is considered to be evolving in nontraditional technology by increasing of usage in manufacturing sector due to the capability of process any material without any limitations in properties. Abrasive waterjet has various advantages over other nontraditional cutting technologies, such as no thermal effect, versatility in machining, very low stresses on the workpiece, small cutting forces, high flexibility.
An abrasive waterjet is a multiphase mixture which comprises of particles(abrasive) water and air. The mixing is formed by accelerating particles i.e., garnet with the size of 100μm to 300μm which made a contact with high speed of water from the pump. This three phase mixture takes place in focusing tube. The resulting phase
jet plume targets surface, it removes material by erosion.1 Since the introduction of AWJ cutting technology, large number
of research and development has been made to explore its applications and associated field, though many aspects are in this technology are to be covered for getting better machining.2
Generally, surfaces are divided into homogeneous and non-homogeneous surfaces. In particular Abrasive water jet generated surfaces are divided into small, surface height, wavy zone. The analysis of surface profiles generated under different abrasive water jet cutting conditions are conducted in terms of static characteristics and while comparing other methods like slab mill, ground grinding, surface roughness of titanium alloy machined by Abrasive waterjet gives better finishing. In previous works research has been carried out only in generating surface profile and surface roughness. This makes concern on predicting the surface profile of any material, regardless of characteristics.3
There are many methods to predict the depth of cut in the surface. But in predicting surface profile is predominant for targeting material in assuming the quantity of abrasive flow rate, pump pressure and feedrate.
Previous research works are focused on effects of parameters such as pressure, particle size, shape, but mixing up with all input parameters as fluid mixture makes velocity profile through the nozzle and upon exit the atmosphere.4 Depth and width model has been generated.5
The material used in this experiment is Ti6A14V. 2. Scope of the Paper
Prediction of Machined Surface Profile based on Energy Modeling of Abrasive Water-Jet
RakWon Choi1, Annadurai Vimalesh1, Junghwan Ahn1,#, and Hwayoung Kim2
1 Department of Mechanical Engineering, Pusan National University, 2, Busandaehak-ro 63beon-gil, Jangjeon-gu, Busan, 46241,South Korea 2 Research Institute of Mechanical Technology, Pusan National University, 2, Busandaehak-ro 63beon-gil, Jangjeon-gu, Busan, 46241,South Korea
# Corresponding Author / E-mail: [email protected], TEL: +82-10-510-3087
KEYWORDS: waterjet, Gaussian distribution, Power-law, surface profile, mean of residual, titanium
In the present study, using Gaussian distribution and power law velocity profile, mathematical models were developed to predict surface profile in AWJ milling process for titanium. In the development of model, abrasive mass distribution, line of perpendicular and velocity were considered. Different combinations of pump pressure, feed rate, mass flow rate are considered in experiment results. The predicted result is compared with experimental result to find best method to predict surface profile.

International Symposium on Green Manufacturing and Applications (ISGMA 2016)
The scope of this research is to predict surface profile which is based on two conditions.
To reduce experiment time for accurate prediction of AWJ cutting, mathematical model based on Gaussian distribution and velocity profile is being utilized to model the surface profile.
The novelty of the proposed model is comprising of fluid flow property i.e., velocity profile and abrasive waterjet.
3. Model Formulation 3.1 Abrasive mass flowrate based on gaussian distribution
In this Abrasive mass flowrate varies in intervals, but velocity is average.
Gaussian distribution is applied for the distribution function of the abrasive particle kinetic energy. Due to 2-dimensional nonsingular case (k=rank(Σ)=2), the probability density function (PDF) of a vector [x y] is
𝐏𝐏𝐏𝐏𝐏𝐏(𝐱𝐱, 𝐲𝐲)
=𝐀𝐀 × 𝒆𝒆
− 𝟏𝟏𝟐𝟐(𝟏𝟏−𝝆𝝆𝟐𝟐) (𝒙𝒙−𝝁𝝁𝒙𝒙)𝟐𝟐
𝝈𝝈𝒙𝒙𝟐𝟐+𝒚𝒚−𝝈𝝈𝒚𝒚
𝟐𝟐
𝝈𝝈𝒚𝒚𝟐𝟐−𝟐𝟐𝝆𝝆((𝒙𝒙−𝝁𝝁𝒙𝒙)𝒚𝒚−𝝁𝝁𝒚𝒚
𝝈𝝈𝒙𝒙𝝈𝝈𝒚𝒚
𝟐𝟐𝟐𝟐𝛔𝛔𝐱𝐱𝝈𝝈𝒚𝒚𝟏𝟏 − 𝝆𝝆𝟐𝟐
(1)
Where ρ is the correlation between x and y where σx > 0 and σy > 0
𝐏𝐏𝐏𝐏𝐏𝐏(𝐱𝐱, 𝐲𝐲) = 𝐀𝐀
𝟐𝟐𝟐𝟐𝛔𝛔𝟐𝟐 𝒆𝒆−𝒙𝒙𝟐𝟐+𝒚𝒚𝟐𝟐𝟐𝟐𝝈𝝈𝟐𝟐 (2)
The abrasive mass distribution can be found using (r, θ) i.e., flow rate, Eq. (2) can be rearranged as,
𝐏𝐏𝐏𝐏𝐏𝐏(𝐫𝐫,𝛉𝛉) =𝐀𝐀
𝟐𝟐𝟐𝟐𝛔𝛔𝟐𝟐 𝒆𝒆−𝒓𝒓𝟐𝟐𝟐𝟐𝝈𝝈𝟐𝟐 (3)
The function of the Eq. (3) is shown in the Fig. 2 Properties related to mass and area to find flow rate, Eq. (4) is
integrated according to the surface area
𝑷𝑷𝑷𝑷𝑷𝑷(𝒓𝒓,𝜽𝜽) 𝒓𝒓𝒓𝒓𝒓𝒓𝒓𝒓𝜽𝜽𝟐𝟐𝟐𝟐
𝟎𝟎
𝑷𝑷/𝟐𝟐
𝟎𝟎= 𝐦𝐦𝐚𝐚 (4)
A1 − e−(𝐷𝐷/2)22𝜎𝜎2 = 𝑚𝑚𝑎𝑎 (5)
Substituting D=1.016 in Eq. (5)
𝐀𝐀𝟏𝟏 − 𝐞𝐞−𝟎𝟎.𝟏𝟏𝟐𝟐𝟏𝟏𝛔𝛔𝟐𝟐 (6) , where, A is calibration factor.
𝐀𝐀 =𝒇𝒇𝒇𝒇𝒇𝒇𝒇𝒇𝒓𝒓𝒇𝒇𝒇𝒇𝒆𝒆𝟏𝟏 − 𝒆𝒆𝟎𝟎.𝟏𝟏𝟐𝟐𝟏𝟏/𝝈𝝈𝟐𝟐 (7)
Difference between particle distribution at centre and edges is given by,
𝐏𝐏𝐏𝐏𝐏𝐏(𝟎𝟎,𝛉𝛉) − 𝑷𝑷𝑷𝑷𝑷𝑷(𝑷𝑷/𝟐𝟐,𝜽𝜽)
𝑷𝑷𝑷𝑷𝑷𝑷(𝟎𝟎,𝜽𝜽) = 𝒓𝒓𝒇𝒇𝒇𝒇𝒓𝒓𝒇𝒇 (8)
Substituting the condition from Fig. 1 in Eq. (8).
𝑨𝑨/𝟐𝟐𝟐𝟐𝝈𝝈𝟐𝟐 ∙ 𝟏𝟏 − 𝒆𝒆−(𝑷𝑷/𝟐𝟐)𝟐𝟐𝟐𝟐𝝈𝝈𝟐𝟐
𝑨𝑨/(𝟐𝟐𝟐𝟐𝝈𝝈𝟐𝟐) = 𝒓𝒓𝒇𝒇𝒇𝒇𝒓𝒓𝒇𝒇 (9)
1 − e−(D/2)22σ2 = 𝑟𝑟𝑟𝑟𝑟𝑟𝑟𝑟𝑟𝑟 (10)
Above Eq.10 is rearranged as,
𝐞𝐞−(𝐏𝐏/𝟐𝟐)𝟐𝟐/𝟐𝟐𝛔𝛔𝟐𝟐 = 𝟏𝟏 − 𝒓𝒓𝒇𝒇𝒇𝒇𝒓𝒓𝒇𝒇 (11) −(D/2)2/(2𝜎𝜎2) = 𝑙𝑙𝑙𝑙(1 − 𝑟𝑟𝑟𝑟𝑟𝑟𝑟𝑟𝑟𝑟) (12)
σ2 =−(𝐷𝐷/2)2
2𝑙𝑙𝑙𝑙(1 − 𝑟𝑟𝑟𝑟𝑟𝑟𝑟𝑟𝑟𝑟) (13)
σ = −(𝐷𝐷/2)2
2𝑙𝑙𝑙𝑙(1 − 𝑟𝑟𝑟𝑟𝑟𝑟𝑟𝑟𝑟𝑟) (14)
Form of Eq. (5) & Eq. (14) can be shown in Fig. 2. To derive cross line along the feeding path
𝐋𝐋𝐩𝐩(𝒙𝒙) = 𝑪𝑪 ∙ 𝟏𝟏𝟐𝟐𝑷𝑷𝑷𝑷𝑷𝑷
(𝒙𝒙,𝒚𝒚) ∙𝑷𝑷𝒇𝒇 ∙ 𝑽𝑽
𝟐𝟐𝒓𝒓𝒚𝒚𝑷𝑷/𝟐𝟐
−𝑷𝑷/𝟐𝟐 (15)
= C ∙V2
2 ∙𝐷𝐷𝑓𝑓 ∙
√2𝜋𝜋𝐴𝐴2𝜋𝜋𝜎𝜎2 ∙ 𝑅𝑅
−(𝐷𝐷/2)22𝜎𝜎2 erf
𝐷𝐷2√2𝜎𝜎
(16)
Where, C is the compensation error of maximum depth between experimental value and predicted value.
And, we simply assume velocity follow Bernoulli equation, 𝑉𝑉 = 𝑃𝑃/𝜌𝜌
Fig. 1 Explanation of mass distribution between at centerline and edge
PDF(0, θ) =A
2πσ2
PDF(D/2,θ)
=A
2πσ2e−
(𝐷𝐷/2)22𝜎𝜎2
Fig. 2 Explanation of Abrasive mass flowrate
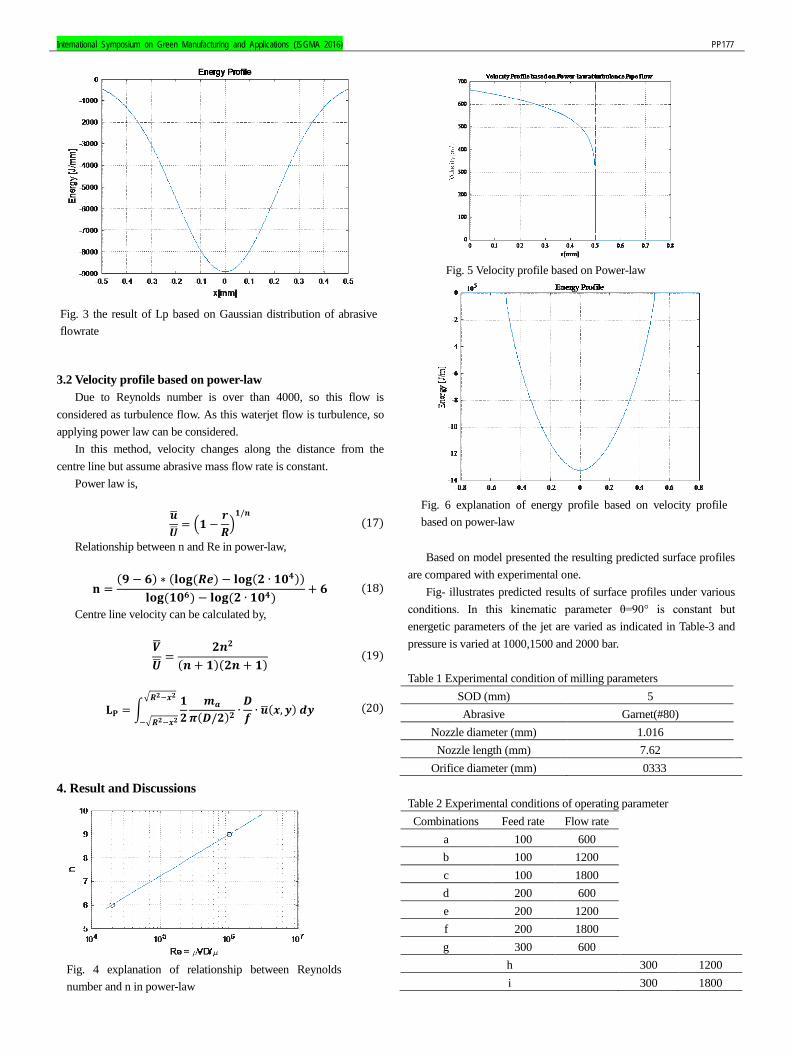
International Symposium on Green Manufacturing and Applications (ISGMA 2016) PP177
3.2 Velocity profile based on power-law Due to Reynolds number is over than 4000, so this flow is
considered as turbulence flow. As this waterjet flow is turbulence, so applying power law can be considered.
In this method, velocity changes along the distance from the centre line but assume abrasive mass flow rate is constant.
Power law is,
𝒖𝒖𝑼𝑼
= 𝟏𝟏 −𝒓𝒓𝑹𝑹
𝟏𝟏/𝒏𝒏 (17)
Relationship between n and Re in power-law,
𝐧𝐧 =(𝟗𝟗 − 𝟔𝟔) ∗ (𝐥𝐥𝐥𝐥𝐥𝐥 (𝑹𝑹𝒆𝒆) − 𝐥𝐥𝐥𝐥𝐥𝐥(𝟐𝟐 ∙ 𝟏𝟏𝟎𝟎𝟒𝟒))
𝐥𝐥𝐥𝐥𝐥𝐥 (𝟏𝟏𝟎𝟎𝟔𝟔) − 𝐥𝐥𝐥𝐥𝐥𝐥 (𝟐𝟐 ∙ 𝟏𝟏𝟎𝟎𝟒𝟒)+ 𝟔𝟔 (18)
Centre line velocity can be calculated by,
𝑽𝑽𝑼𝑼
=𝟐𝟐𝒏𝒏𝟐𝟐
(𝒏𝒏 + 𝟏𝟏)(𝟐𝟐𝒏𝒏 + 𝟏𝟏) (19)
𝐋𝐋𝐏𝐏 = 𝟏𝟏𝟐𝟐
𝒎𝒎𝒇𝒇
𝟐𝟐(𝑷𝑷/𝟐𝟐)𝟐𝟐 ∙𝑷𝑷𝒇𝒇 ∙ 𝒖𝒖
(𝒙𝒙,𝒚𝒚) 𝒓𝒓𝒚𝒚𝑹𝑹𝟐𝟐−𝒙𝒙𝟐𝟐
−𝑹𝑹𝟐𝟐−𝒙𝒙𝟐𝟐 (20)
4. Result and Discussions
Based on model presented the resulting predicted surface profiles
are compared with experimental one. Fig- illustrates predicted results of surface profiles under various
conditions. In this kinematic parameter θ=90° is constant but energetic parameters of the jet are varied as indicated in Table-3 and pressure is varied at 1000,1500 and 2000 bar.
Table 1 Experimental condition of milling parameters
SOD (mm) 5 Abrasive Garnet(#80)
Nozzle diameter (mm) 1.016 Nozzle length (mm) 7.62
Orifice diameter (mm) 0333 Table 2 Experimental conditions of operating parameter Combinations Feed rate Flow rate
a 100 600 b 100 1200 c 100 1800 d 200 600 e 200 1200 f 200 1800 g 300 600
h 300 1200 i 300 1800
Fig. 4 explanation of relationship between Reynolds number and n in power-law
Fig. 3 the result of Lp based on Gaussian distribution of abrasive flowrate
Fig. 5 Velocity profile based on Power-law
Fig. 6 explanation of energy profile based on velocity profile based on power-law

International Symposium on Green Manufacturing and Applications (ISGMA 2016)
Fig. 8 Explanations of mean of residual between based on abrasive mass flowrate based on Gaussian distribution and velocity profile based on power-law
Observing the results presented in Fig. 7 taking into consideration of the variations, the predicted profile is in good agreement with the experimental one in terms of their shape without considering the depth or dimensions.
It is possible that fluid flow i.e., mixture effects during the impact of the jet upon the workpiece and set of 20 intervals with different pump pressure, abrasive mass flow rate and feed rate have been carried out.
Prediction of surface profile is generated by above described methods. Through the comparison as shown in Fig. the error cannot be visualize. So to find the error between two methods to obtain better accuracy, residual plot has been shown in Fig. 8
The result shows, minimum of residual based on power-law velocity is less than maximum of residual based on Gaussian distribution of abrasive mass flowrate. So, we conclude that velocity profile based on power-law gives accurate result comparing Gaussian distribution.
5. Conclusion
The paper presents the modelling approach to predict the surface profile. The velocity profile model is niche in its approach by being applicable for any target material by adjusting some conditions in the parameters. The prediction of surface profile is based on the required process parameters and mathematical model.
0.05
0.10
0.15
0.20a
b
c
d
ef
g
h
i
1000bar1500bar2000bar
a
b
c
d
ef
g
h
i
0.03
0.06
0.09
0.12
1000bar1500bar2000bar
Fig. 7 Comparison of surface profile between experiment (dash line) and predict (above, based on abrasive and bottom, based on velocity)

International Symposium on Green Manufacturing and Applications (ISGMA 2016) PP177 ACKNOWLEDGEMENT
This work was supported by "Advanced Technology Center
Program"(Development of 3D Shape Manufacturing System Technology for difficulty to cut materials with Waterjet, 10048626) funded by the "Ministry of Trade, Industry and Energy"(MTIE, Korea) and "Korea Evaluation Institute of Industrial Technology"(KEIT, Korea) (No.10048626).
REFERENCES 1. A.W. Momber, Energy transfer during the mixing of air and solid
particles into a high-speed waterjet: an impact-force study, Experimental Thermal and Fluid Science Vol.25, pp.31–41,2001.
2. H. Liu, J. Wang, N. Kelson, R.J. Brown, A study of abrasive water jet characteristics by CFD simulation, J. Material Process. Tech., Vol.153-154, pp. 488-493,2011.
3. A.W. Momber, R. Kovacevic, Principles of Abrasive Water Jet Machining, Springer, London, 1998.
4. P. Hale, Multi-modelling of abrasive waterjet machining, McMaster University, Ontario,2012.
5. S. S. Park, H. Y. Kim, J. H. Ahn, Modeling of depth/width of cut for abrasive waterjet milling of titanium, J. Korean. Society of Manuf. Tech. Engineers, Vol.25:1, pp.83-88,2016.

International Symposium on Green Manufacturing and Applications (ISGMA 2016) PP246
1. Introduction
CNT is known to have high electric and thermal conductivity with tensile property amounting to 50GPa.1-3 These characteristics have been used to research CNT in different areas including complex to shield and absorb electromagnetic wave, thermally conductive Composites and high-strength Composites.4-7 Changes in CNT’s diameter also cause the same in crystalizabilty and mechanical, electric and thermal characteristics. Nevertheless, this has been rarely applied to real Composites to analyze the characteristics.
This study analyzes the structure of CNT synthesized in the same manner but with different diameters, and electric and thermal conductivity as well as tensile strength of Composites according to CNT content. 2. Control of CNT Diameter & Production of Composites 2.1 Control of CNT diameter
To control the diameter of CNT, the catalyst was synthesized at 600 using a combustion method. For the composition of catalyst,
Mo-Fe/MgO, Fe was fixed to 0.010mol and 0.020mol while Mo was increased from 0.030mol to 0.100mol by 0.010mol. The catalyst synthesis used magnesium nitrate, iron nitrate, ammonium molybdate, and citric acid, all of which were bought from Samchun Chemical and have purity of 98.5 percent or higher. To synthesize CNT, Thermal-CVD reactor (Atech System) was used. The CVD reactor was heated to 900 of the synthesis temperature under an argon atmosphere. The catalyst was put in the heated reactor and argon was substituted with synthesis gas, hydrogen of 1SLM and methane of 3SLM to synthesize CNT. 2.2 Production of CNT-Polyamide Composites
CNT-Polyamide Composites was produced through solution blending while changing CNT content from 1phr to 50phr to polyamide. The polyamide is Elvamide 8063, which is soluble in ethanol and bought from Dupont. The polyamide solution was produced by adding more polyamide to the ethanol to reach 10wt.% after dissolving for four hours at 60. To minimize CNT's influence on the remaining catalyst and acid, 0.5N hydrochloric-acid aqueous solution was used to remove the used catalyst. And 40g of CNT was added to 3L of water and then ground for two hours using a 6,000 RPM homogenizer. The ground
The Effect of CNT Diameters on Properties of CNT-Polyamide Composites
Joon Hyuk Song1,# ,Youngsoo Park1, Kyung Jae Kim1, Myounghan Yoo1, Minseok Moon1, Jeha Oh1, Shinjae Kang2, and Sung Mo Yang3
1 Korea Institute of Carbon Convergence Technology, South Korea 2 Department of Mechanical Design, Chonbuk National University, 567, Baekje-daero, Deokjin-gu, Jeonju-si, Jeollabuk-do, 54896, South Korea
3 Department of Mechanical System Engineering, Chonbuk National University, 567, Baekje-daero, Deokjin-gu, Jeonju-si, Jeollabuk-do, 54896,South Korea # Corresponding Author / E-mail: [email protected], TEL: +82-63-219-3630, FAX: +82-63-219-3529
KEYWORDS : CNT-polyamide composite, CNT Diameter, Electrical resistivity, Thermal conductivity, Tensile strength
The effect of CNT diameters on properties of CNT-polyamide composites were investigated such as electrical conductivity, tensile strength and thermal conductivity. To get different diameter distributions of CNTs, several portions of Mo and Fe in Mo-Fe/MgO catalysts were synthesized by a combustion method at 600. And all CNTs growed at 900 with 3 SLM methane and 1 SLM hydrogen for 40min. Four kinds of CNTs with different diameter distributions, such as 1~3nm, 3~7nm, 7~13nm, and 10~30nm, were selected to make CNT-polyamide composites. Each composite was manufactured by a solution mixing using bar-type ultra-sonicator in the CNT portions from 1phr to 50 phr. And electrical conductivity, tensile strength, and thermal conductivity were measured. Three properties of CNT-polyamide composite, manufactured with 10nm diameter, were more excellent compared to other composites, with electrical conductivity 10oΩ at 7phr, thermal conductivity 2.4.W/mK at 40phr, tensile strength 60MPa at 30phr. CNTs with diameter 10nm were superior to other diameters for the multi-functional composite such as CNT-polyamide Composites.

International Symposium on Green Manufacturing and Applications (ISGMA 2016) CNT was filtered but not dried to prevent agglomeration due to the drying. Dispersion of CNT and mixing with polyamide were conducted for 60 minutes using 700W bar-type ultrasonic wave. The CNT and polyamide solution was put into cold water to coagulate it and then dried at 100 for 12 hours. The dried CNT-polyamide composite was compressed to 400kgf/cm2 using a hot press of 150-180 according to the CNT's diameter and content to produce a 1mm CNT-polyamide Composites. 2.3 Analysis of CNT & Composites
For the CNT, the diameter distribution was analyzed using TEM (Jeol JEM-2100); the morphology was analyzed using FE-SEM (Hitachi S-4800); and crystalizability was analyzed using Raman (Horiba LabRam-HR). For the Composites, electric conductivity was measured using the resistance meter (Mitsubishi Loresta-GP); tensile strength was measured using UTM(Instron-3382); and thermal conductivity was measured using thermal conductivity meter (Metrotech ThermoCon M100). 3. Conclusions This research analyzed the electric conductivity, tensile strength and thermal conductivity of a CNT-polyamide Composites according to the diameter and content of CNT. Despite a few general gaps, electric conductivity, tensile strength and thermal conductivity increased as CNT content increased. Among them, 10nm CNT Composites recorded 100Ω of electric conductivity at 7phr, 60MPa of tensile strength at 20phr and 2.4W/mK of thermal conductivity, which are better than the other Compositeses using CNTs of different diameters. Therefore, 10nm is an appropriate diameter of CNT for a multifunctional Composites using CNT.
ACKNOWLEDGEMENT This research was supported by Economic Cooperation Region
Support Program (Carbon Valley Development Plan) of the Ministry of Trade, Industry and Energy. REFERENCES 1. Ebbesen, T. W., Lezec, H. J., Hiura, H., Bennett, J. W.,
Ghaemi, H. F., and Thio, T., "Electrical conductivity of individual carbon nanotubes" Nature, Vol. 382, pp. 54~56, 1996.
2. Jianwei, C., Tahir, C. and William, A. G., "Thermal conductivity of carbon nanotubes", Nanotechnology, Vol. 11, pp. 65~69, 2000.
3. Salvetat, J. P., Bonard, J. M., Thomson, N. H., Kulik, A. J., Forro L., Benoit, W., and Zuppiroli, L, "Mechanical properties of carbon nanotubes", Appl. Phys. A, Vol 69, pp. 255~260.,
1999.
4. Fujii, M., Zhang, X., Xie, H., Ago, H., and Takahashi, K., easuring the thermal conductivity of a single carbon nanotube". Phys Rev Lett, Vol. 6, No. 95: pp. 065502~065505, 2005
5. Ma, P. C., Naveed, S., Gad, M., and Kim, J. K., "Dispersion and functionalization of carbon nanotubes for polymer-based nano composites: A review", Composites: Part A, Vol. 41, pp. 1345~1367, 2010.
6. Ha, H. J., Kim, S. C., Kim, and Ha, K. R., "Morphology and Properties of Polyamide/ Multi-walled Carbon Nanotube Composites", Macromolecular Research, Vol. 18, No. 7, pp. 660 ~667, 2010.
7. Sauvajol J. L., Anglaret, E., Rols, S., and Alvarez, L., “Phonons in single wall carbon nanotube bundles”, Carbon, Vol. 40 pp. 1697~1714, 2002.
International Symposium on Green Manufacturing and Applications (ISGMA 2016) PP252
1. Introduction
Various areas, including material and structural design, numerical simulation, and mathematical theory, have increasingly matured with the development of science and technology in recent years. Research in impact and penetration mechanics has alreadyprovided fruitful results. This complex engineering field is still being extensively studied and discussed up to now because of its wide range of applications. It has been over fifty years since ceramic was first used in protective materials. Ceramic was initially widely adopted for bulletproof vests and helicopter seats during the Vietnam War (1). Ceramic has high strength, hardness, abrasion resistance, high-temperature resistance, and mechanical performance. This material is now universally used in the electronics, automotive, nuclear power, aerospace, biomedical science, and protection industries. The impact resistance design of military structures, armored vehicles, bulletproof vests, spacecraft, carriers, and satellites primarily targets low weight, low costs, and easy manufacturing. Therefore, gradient distribution has become a critical consideration in new techniques for material design and structure control. Functionally graded materials (FGMs) are new materials characterized by continuous and monotonic variation in elements (composition and structure) over thickness direction, which results in corresponding changes in material properties and functions. Tests have verified that
the impact resistance performance of the FGM structure is superior to that of the ceramic/metal composite armor (2). Therefore, improvements on the impact resistance performance of materials introduced by a functionally graded design would definitely make FGM one of the futureleading trends.
Z. He et al. (3) employed a simple route of die pressing and pressureless sintering in their study on ceramic/metal FGM to manufacture a five-layered alumina/iron FGM. Analysis has indicated that the FGM, compared with monolithic alumina ceramic, had a significant improvement on fracture toughness and crack deflection at the weak interfaces. Z. Zhang et al. (4) adopted the spark plasma sintering (SPS) method to produce a four-layered TiB/Ti FGM. The results showed that a stable graded temperature field could be reached without cracks on the microstructure's observation surface during the SPS process. Furthermore, the microhardness was relatively high at the interfaces, which indicated good combination between every two layers of the material. M.S. EL-Wazery et al. (5) successfully produced a six-layered (Zirconia/Nickel) FGM and conducted in-depth research and analysis on its linear shrinkage, electrical conductivity, fracture toughness, and Vickers hardness by utilizing the powder metallurgy technique. R. Zhang et al. (6) prepared 3Y-ZrO2/(3Y-ZrO2 + Ni) sandwich ceramics using CIP and pressureless sintering methods. They also conducted a detailed research on porous ZrO2 and ZrO2/(ZrO2 + Ni) sandwich ceramics. The mechanical
Analysis of Ballistic Performance on Varied Content of Alumina/Zirconia FGM
Chin-Yu Huang1,#, Yu-Liang Chen2, and Jun-Jie Shen2
1 School of Defense Science, Chung Cheng Institute of Technology, National Defense University, No.75, Shiyuan Rd., Daxi Dist., Taoyuan City 33551, Taiwan 2 Department of Power Vehicle and Systems Engineering, Chung Cheng Institute of Technology, National Defense University, No.75, Shiyuan Rd., Daxi Dist.,
Taoyuan City 33551, Taiwan # Corresponding Author / E-mail: [email protected], TEL: +886-3-3809257(ext.118), FAX: +886-3-3906385
KEYWORDS : FGM, Ballistic test, ANSYS/LS-DYNA, Microstructure
Functionally Graded Materials (FGMs) are characterized by the continuous variation in composition and structure over thickness or volume; hence, the corresponding changes in properties and functions of the FGMs can be investigated to derive new materials. Protective armor with FGM structure can enhance the impact resistance capability. In this study, 4-layered FGM specimens with three different composition, that is Al2O3/(0, 5, 10, 15%)ZrO2, Al2O3/(0, 10, 20, 30%)ZrO2 and Al2O3/(0, 15, 30, 45%)ZrO2, were designed. The ceramic specimens were hexagonal (length of each side was 60 mm and thickness 11 mm). The sintering temperature of those specimens was 1550 °C. 6061-T6 Al (200 mm × 200 mm × 1 mm) was used as backplane. 0.3" armor-piercing bullets were used in the ballistic test with initial speed 868 ± 15 m/s. Numerical simulation software LS-DYNA was also used to analyze stress transference and fracture of those FGM specimens under impact. It was shown from ballistic test that Al2O3/ (0, 5, 10, 15%) ZrO2 FGM had the best impact resistant performance. Investigation of microstructure through SEM observation, delamination was not found in the interlayer of FGMs after impact and it may increase the abrasion ability between the ceramic and the projectile. The XRD analysis verified the phase transformation of ZrO2 from the tetragonal phase to the monoclinic phase, thereby retarding crack growth and increasing the toughness of the material. Therefore, it promoted the impact resistance capability of FGMs.

International Symposium on Green Manufacturing and Applications (ISGMA 2016) performance of 3Y-ZrO2/(3Y-ZrO2+Ni) sandwich ceramics under the same low thermal conductivity (approximately 0.85 W/m K) condition was better than that of monolithic porous ZrO2 ceramics. This result was attributed to the effects of metal toughening and sintering-induced residual thermal stress on the mechanical performance of the sandwich ceramics. H. Tsukamoto (7) employed the SPS method to make the ZrO2/Ti FGM, and concluded from the tests that a higher ZrO2 content leads to a higher microhardness value.
Many studies have also been conducted on ceramic/ceramic FGM. Accordingly, V. Trombini et al. (8) and F. Meng et al. (9) used the SPS method to sinter nanocomposite materials. V. Trombini et al. added 5 vol% (60–100 nm) zirconia into alumina-based (0.2 μm) materials. Meng et al. also added 5–10 vol% (40 nm) zirconia into the same materials (0.6 μm). Consequently, ceramic hardness or fracture toughness significantly improved. A. Reyes-Rojasa et al. (10) sintered the ceramic material, Al2O3/ZrO2 (1.5 mol%Y2O3), using the hot isostatic pressing (HIP) method. Tests verified that compressive strain could be improved by increasing t-ZrO2 content. F. A.T. Guimarães et al. (11) applied pressureless sintering to produce the nanocomposite material, Al2O3, with 1 vol%, 3 vol%, and 5 vol% m-ZrO2 contents. A microstructural analysis showed that the microhardness, flexural strength, and wear resistance of Al2O3 with 5 vol% m-ZrO2 increased by 8%, 11%, and 23%, respectively, compared with those of the inclusion-free alumina. L. Sun et al. (12) discovered that residual stress was generated during the ceramic sintering process because the sintering temperatures and the thermal expansion coefficients were not close. They also found the optimal shrinking percentage and the sintering curve, and successfully manufactured a three-layered Al2O3/ZrO2 FGM. In 2012, E. M.M. Ewais et al. (13) designed an eleven-layered Al2O3/ZrO2 FGM by employing the reaction sintering method. They further analyzed its microstructure, hardness, and fracture toughness. The optimal sintering temperature and the sintering time were 1650 °C and 6 h, respectively.
The FGM conceptual design has been applied in the field of protective materials with gradually increasing research achievements. A. Pettersson et al. (14) also sintered and produced a TiB2–Ti FGM using the SPS technique. The SPS sintering method adopted 7.62 mm armor-piercing bullets to obtain an FGM with a more superior ballistic resistance than that obtained using the HIP sintering method. The SPS method realized low-temperature sintering in a short period and made the small crystal particles grow to achieve higher densification. X.F. Zhang et al. (15) analyzed the ballistic resistance performance of 95% alumina ceramic and 10% zirconia toughened alumina (ZTA) ceramic under the impact of long-rod projectile using the depth of penetration (DOP) method. They demonstrated that the ballistic resistance could be improved by increasing the ZTA ceramic toughness. N. Gupta et al. (16) used the SPS method to produce TiB2-(10, 20 wt.%)Ti FGM. They subsequently tested the ballistic resistance using small-caliber, armor-piercing projectiles. The results showed that the ballistic efficiencies of composite materials, TiB2-Ti FGM, TiB2-(10 wt.%) Ti, TiB2-(20 wt.%) Ti, and TiB2 (monolithic), η, were in the 5.1–5.9 range. Moreover, the ballistic performance declined if the FGM thickness increased from 5 mm to 7.8 mm. M. Übeyli et al. (17) prepared SiC-(80, 90, 100 wt.%) Al 7075 and SiC-(60, 80, 100 wt.%) Al 7075 FGM using the powder metallurgy technique. The ballistic performance was tested using armor-piercing projectiles. The fracture action of the ceramic microstructures was examined using a scanning electron microscope (SEM). The results
demonstrated that the performance of the FGM with 25 mm thickness could not be improved because its metallic phase was greater than the ceramic phase. Furthermore, the ceramic functions could not be performed.
Literature shows that many researchers have already applied the toughened ceramic composite and ceramic/metal FGM design to the impact resistance field using experiments and simulations. Therefore, the present research manufactures an FGM with different Al2O3 and ZrO2 contents to analyze the impact resistance performance. 2. Experimental Setup and Procedure 2.1Material process
The key point in selecting FGM materials was choosing the pair with similar thermal expansion coefficients and sintering conditions to avoid stress concentration and spallation. Therefore, this study used Al2O3 and 3 mol% Y2O3-stabilized zirconia (3YSZ) ceramics. The thermal expansion coefficients of Al2O3 and 3YSZ were 8.6 10−6/°C and 10.1 10−6/°C, respectively. The powder metallurgy sintering method was adopted to design the four-layered Al2O3/ZrO2 FGM. Specimens with various compositions, including Al2O3/(0, 5, 10, 15%)ZrO2 FGM, Al2O3/(0, 10, 20, 30%)ZrO2 FGM, and Al2O3/(0, 15, 30, 45%)ZrO2 FGM, were sintered at a 1550 °C, with 99.4–99.8% inter-layer relative density. 2.2 Ballistic test
The impact-resistant specimens were hexagons that are 60 mm long in all sides. Accordingly, 6061-T6 Al (200 mm × 200 mm × 1 mm) was used as a backplane. Epoxy resin was used as adhesive for the ceramic and the backplane. The backplane size was unchanged, and the ceramic was 11 mm thick. The FGM impact-resistant specimens with various zirconia percentage contents included Al2O3/(0, 5, 10, 15%)ZrO2 FGM(5%FGM), Al2O3/(0, 10, 20, 30%)ZrO2 FGM(10%FGM), and Al2O3/(0, 15, 30, 45%)ZrO2 FGM(15%FGM) (Fig. 1). The projectiles employed in the ballistic test were 0.3″ armor-piercing bullets (Fig. 2). The test was conducted according to the National Institute of Justice IV standard specifications. The bullet's initial speed was set as 868 ± 15 m/s. The practical initial and residual velocities were measured through speed measurement optical grating (Fig. 3). The energy absorption of the target plate was then calculated according to the law of energy conservation.
(a) 5%FGM.

International Symposium on Green Manufacturing and Applications (ISGMA 2016) PP252
(b) 10%FGM.
(c) 15%FGM.
Fig. 1 Specimen of ballistic test
Fig. 2 Section of 0.30 armor-piercing bullet
Fig. 3 Schematic diagram of the ballistic test
3. ANSYS/LS-DYNA Numerical Simulation
The simulation software used in this study was the ANSYS/LS-DYNA, which was a general finite element software for non-linear dynamic analysis. This software can be utilized to solve the large deformation dynamic responses of various 2D and 3D non-elastic structures, such as high-speed impact, explosion, and molding. The Lagrangian descriptive method was also employed. The Lagrangian
coordinate system was adopted to describe object deformation by fixing the grid node coordinates on the material itself. The coordinates would vary with the displacement speed of the material or mass points. The corresponding coordinate grid had also changed its shape with the volume variation over time when the object deformed, albeit without mass variation of the grid nodes. The advantage of the Lagrangian algorithm was the movement of the grid with the path of the mass particles in the material and the generation of a relative shift for the fixed coordinate system. Therefore, mass, momentum, and energy were simultaneously converted with material movement. The boundary conditions were also directly added on free face and interface (18-21).
The 1/4 model was adopted to model the ceramic composites (Fig. 4). The 3D Solid164 was employed as the computational model. The model dimensions were similar to those of the test specimens. The complexity of the projectile simulation was reduced by replacing the lead material with copper material. The total number of model grids was about 60,000–75,000. Steel and copper were used as the 0.3″ armor-piercing projectile material. The steel part was set as MAT_PLASTIC_KINEMATIC in the LS-DYNA simulation. The copper part was set as MAT_ELASTIC_PLASTIC_HYDRO, which required the Mie–Gruneisen equation of state (EOS_GRUNEISEN). The target plate comprised ceramic and aluminum plate. MAT_JOHNSON_HOLMQUIST_CERAMICS was utilized for ceramics, while MAT_ELASTIC_PLASTIC_HYDRO was adopted for the 6061-T6 aluminum plate also requiring EOS_GRUNEISEN. The contact mode between the projectile and the target plate was defined as the CONTACT_ERODING_SURFACE_TO_SURFACE.
Fig. 4 Model diagram of numerical simulation
4. Results and Discussions
4.1 Energy absorption of experiment and simulation
The experimental results in Table 1 show that the ballistic resistance of the 5%FGM is the optimum. The energy absorption of the 5%FGM increases by 9.6% compared to that of the 15%FGM. The energy absorption of the 10%FGM also increases by 6.7% compared to that of the 15%FGM. The law of energy conservation is applied to calculate the energy absorption of the target plate with the initial and residual velocities obtained

International Symposium on Green Manufacturing and Applications (ISGMA 2016) through test and simulation. Fig. 5 shows that the errors in the comparison between the simulation and experimental results are all within 3%, which verifies the effectiveness of the finite element simulation.
Table 1 Experimental results
Ceramics Ceramics thickness
(mm)
Average initial velocity (m/
s)
Average residual velocity
(m/s)
Average absorptive energy
(J)
5%FGM 11 859 223 3441 10%FGM 11 858 259 3349 15%FGM 11 864 344 3139
Fig. 5 Absorptive energy of experiment and simulation
4.2 Microstructural analysis The SEM technique is employed to observe the ceramic plate
microstructure after high-speed impact. In terms of structural design, FGMs do not have adhesion layers. Therefore, the reflected tensile stress can be reduced. The interface bonding between the layers can also be maintained to significantly decrease the occurrence of the delamination phenomenon. Fig. 6 illustrates that every interface bonding between the layers is integrated after impact without severe cracks or delamination. The addition of ZrO2 to the ceramics for toughness improvement aims to delay the crack growth and the ceramic–cone formation under high-speed impact. The toughening mechanism can be characterized as the generation of strong energy and stress under impact, which leads to the ZrO2 phase variation from the tetragonal phase to the monoclinic phase. An X-ray diffraction (XRD) analysis has proven a stress-induced phase transformation (t→m) (Fig. 7).
(a) 5%FGM
(b) 10%FGM
(c) 15%FGM
Fig. 6 The microstructural of ballistic test of FGM
(a) Before impact
(b) After impact
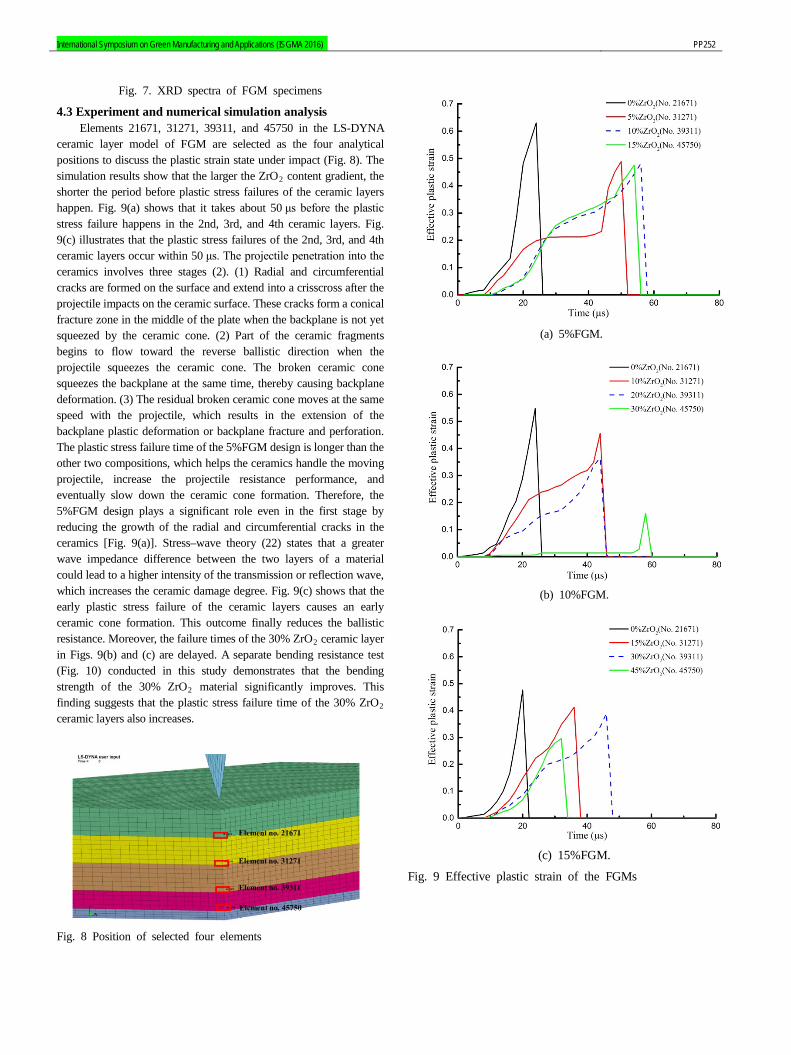
International Symposium on Green Manufacturing and Applications (ISGMA 2016) PP252
Fig. 7. XRD spectra of FGM specimens
4.3 Experiment and numerical simulation analysis Elements 21671, 31271, 39311, and 45750 in the LS-DYNA ceramic layer model of FGM are selected as the four analytical positions to discuss the plastic strain state under impact (Fig. 8). The simulation results show that the larger the ZrO2 content gradient, the shorter the period before plastic stress failures of the ceramic layers happen. Fig. 9(a) shows that it takes about 50 μs before the plastic stress failure happens in the 2nd, 3rd, and 4th ceramic layers. Fig. 9(c) illustrates that the plastic stress failures of the 2nd, 3rd, and 4th ceramic layers occur within 50 μs. The projectile penetration into the ceramics involves three stages (2). (1) Radial and circumferential cracks are formed on the surface and extend into a crisscross after the projectile impacts on the ceramic surface. These cracks form a conical fracture zone in the middle of the plate when the backplane is not yet squeezed by the ceramic cone. (2) Part of the ceramic fragments begins to flow toward the reverse ballistic direction when the projectile squeezes the ceramic cone. The broken ceramic cone squeezes the backplane at the same time, thereby causing backplane deformation. (3) The residual broken ceramic cone moves at the same speed with the projectile, which results in the extension of the backplane plastic deformation or backplane fracture and perforation. The plastic stress failure time of the 5%FGM design is longer than the other two compositions, which helps the ceramics handle the moving projectile, increase the projectile resistance performance, and eventually slow down the ceramic cone formation. Therefore, the 5%FGM design plays a significant role even in the first stage by reducing the growth of the radial and circumferential cracks in the ceramics [Fig. 9(a)]. Stress–wave theory (22) states that a greater wave impedance difference between the two layers of a material could lead to a higher intensity of the transmission or reflection wave, which increases the ceramic damage degree. Fig. 9(c) shows that the early plastic stress failure of the ceramic layers causes an early ceramic cone formation. This outcome finally reduces the ballistic resistance. Moreover, the failure times of the 30% ZrO2 ceramic layer in Figs. 9(b) and (c) are delayed. A separate bending resistance test (Fig. 10) conducted in this study demonstrates that the bending strength of the 30% ZrO2 material significantly improves. This finding suggests that the plastic stress failure time of the 30% ZrO2 ceramic layers also increases.
Fig. 8 Position of selected four elements
(a) 5%FGM.
(b) 10%FGM.
(c) 15%FGM.
Fig. 9 Effective plastic strain of the FGMs

International Symposium on Green Manufacturing and Applications (ISGMA 2016)
Fig. 10 Bending strength of varied ZrO2 contents
The internal energy is defined in the LS-DYNA as the total
stress energy calculated from the strain and stress in six directions of each element. The high-hardness alumina could damage the projectile structure and shape when the projectile impacts the ceramic surface, which could further decrease the projectile penetration performance and change its moving direction. Accordingly, the first pure alumina layer of all the three specimens absorbs the lowest energy (Fig. 11). The stress failure time of the 0% ZrO2 is relatively short (Fig. 9). In other words, the projectile's action time in the ceramics is also relatively short. Fig. 11 shows that all specimens have the highest energy absorption in the second layer. This result is attributed to the advantages of high-toughness zirconia in reducing the crack growth, decreasing the ceramic fracture occurrence, and increasing the abrasion between the projectile and the ceramics. Therefore, zirconia is added into the ceramics starting from the second layer to improve toughness, reduce the ceramic crack growth beyond the second layer, delay the ceramic cone formation, increase the ceramic cone integrity, and improve the ballistic resistance performance. The ZrO2 content gradient of the 5%FGM is the smallest. This small gradient could decrease the wave impedance difference, reduce the tensile wave strength caused by the reflection wave, decrease the ceramic damage, and improve the ceramic energy absorption. On the contrary, the ZrO2 content gradient of the 15%FGM is the largest. This large gradient could increase the wave impedance difference, elevate the tensile wave strength caused by the reflection wave, significantly aggravate the ceramic damage, and degrade the ballistic resistance performance. The simulation results show that Figs. 11(a) ad (c) exhibit the highest and lowest energy absorptions, respectively.
(a) 5%FGM.
(b) 10%FGM.
(c) 15%FGM.
Fig. 11 Internal energy of the FGMs
The experimental results further indicate that the large ZrO2 content gradient could lead to the increase of the wave impedance difference in the interfacing ceramic layers. This large content gradient can also improve the reflected tensile wave strength and enlarge the ceramic cone volume. Fig. 12(c) demonstrates that the FGM with 15% ZrO2 content has the largest ceramic cone volume. Fig. 12(a) exhibits the smallest volume. After the ceramic is impacted, the backplane begins to bear the ceramic impact damage even before the projectile moves to the backplane if the ceramic cone is rapidly formed with an excessively big volume. Therefore, early deformation can happen, and the ballistic resistance performance of the entire structure will be negatively affected. Figs. 10(a) and 12(a) show that the 5%FGM structure delays the ceramic cone deformation and reduces its volume. Therefore, the 5%FGM design has the optimal ballistic resistance performance.

International Symposium on Green Manufacturing and Applications (ISGMA 2016) PP252
(a) 5%FGM.
(b) 10%FGM.
(C) 15%FGM.
Fig. 12 Ceramic cone of the FGMs under impact
5. Conclusions (1) The FGM structural design can apprehend the occurrence of the
delamination phenomenon and enhance the abrasion action of each ceramic layer on projectiles, thereby improving the impact resistance performance.
(2) The plastic stress failure time of the 5%FGM design is longer than that of the other two composition designs. This longer period helps ceramics promote the ballistic resistance performance when facing the moving projectile and improve the impact resistance performance.
(3) The larger the wave impedance difference between the two layers of a material, the greater the penetration strength or reflection wave. This condition increases the degree of ceramic fracture. The early plastic stress failure of the 15%FGM causes an early ceramic cone formation and decreases the material's ballistic resistance performance. On the contrary, the 5%FGM structure could delay the ceramic cone formation, decrease its volume, and increase the optimal ballistic resistance performance.
(4) With a fixed number of layers, the experimental results of this research verify that the ZrO2 content is a major factor affecting the ballistic resistance performance. Future work can focus on thickness variation.
ACKNOWLEDGEMENT We thank all the graduate students in the ballistic laboratory for
their wholehearted support in the experimental tests and material manufacturing process. REFERENCES 1. J.W. McCauley, G. D’Andrea, K. Cho, M.S. Burkins, R.J.
Dowding aWAG, Jr. Status report on SPS TiB2-TiB-Ti functionally graded materials (FGMs) for armor. Report Documentation of US Army Research Laboratory. 2006:1-26. 2. Huang C-Y, Chen Y-L. Design and impact resistant analysis of functionally graded Al2O3–ZrO2 ceramic composite. Materials & Design. 2016;91:294-305. 3. He Z, Ma J, Tan GEB. Fabrication and characteristics of alumina–iron functionally graded materials. Journal of Alloys and Compounds. 2009;486:815-818. 4. Zhang Z, Shen X, Zhang C, Wei S, Lee S, Wang F. A new rapid route to in-situ synthesize TiB–Ti system functionally graded materials using spark plasma sintering method. Materials Science and Engineering: A. 2013;565:326-332. 5. El-Wazery MS, El-Desouky AR, Hamed OA, Fathy A, Mansour NA. Electrical and mechanical performance of zirconia-nickel functionally graded materials. International Journal of Engineering, Transactions A: Basics. 2013;26:375-382. 6. Zhang R, He R, Zhou W, Wang Y, Fang D. Design and fabrication of porous ZrO2/(ZrO2 + Ni) sandwich ceramics with low thermal conductivity and high strength. Materials & Design. 2014;62:1-6. 7. Tsukamoto H. Microstructure and indentation properties of ZrO2/Ti functionally graded materials fabricated by spark plasma sintering. Materials Science and Engineering: A. 2015;640:338-349. 8. Trombini V, Pallone EMJA, Anselmi-Tamburini U, Munir ZA, Tomasi R. Characterization of alumina matrix nanocomposite with ZrO2 inclusions densified by spark plasma sintering. Materials Science and Engineering: A. 2009;501:26-29. 9. Meng F, Liu C, Zhang F, Tian Z, Huang W. Densification and mechanical properties of fine-grained Al2O3–ZrO2 composites consolidated by spark plasma sintering. Journal of Alloys and Compounds. 2012;512:63-67. 10. Reyes-Rojas A, Esparza-Ponce H, De la Torre SD, Torres-Moye E. Compressive strain-dependent bending strength property of Al2O3–ZrO2 (1.5 mol% Y2O3) composites performance by HIP. Materials Chemistry and Physics. 2009;114:756-762. 11. Guimarães FAT, Silva KL, Trombini V, Pierri JJ, Rodrigues JA, Tomasi R, Pallone EMJA. Correlation between microstructure and mechanical properties of Al2O3/ZrO2 nanocomposites. Ceramics International. 2009;35:741-745. 12. Sun L, Sneller A, Kwon P. Fabrication of alumina/zirconia functionally graded material: from optimization of processing parameters to phenomenological constitutive models. Materials Science and Engineering: A. 2008;488:31-38. 13. Ewais EMM, Besisa DHA, Zaki ZI, Kandil AEHT. Tailoring of functionally graded zirconia-mullite/alumina ceramics. Journal of the European Ceramic Society. 2012;32:1561-1573. 14. Pettersson A, Magnusson P, Lundberg P, Nygren M. Titanium-titanium diboride composites as part of a gradient armour material.

International Symposium on Green Manufacturing and Applications (ISGMA 2016) International Journal of Impact Engineering. 2006;32:387-399. 15. Zhang XF, Li YC. On the comparison of the ballistic performance of 10% zirconia toughened alumina and 95% alumina ceramic target. Materials & Design. 2010;31:1945-1952. 16. Gupta N, Bhanu Prasad VV, Madhu V, Basu B. Ballistic studies on TiB2-Ti functionally graded armor ceramics. Defence Science Journal. 2012;62:382-389. 17. Ubeyli M, Balci E, Sarikan B, Oztas MK, Camuscu N, Yildirim RO, Keles O. The ballistic performance of SiC-AA7075 functionally graded composite produced by powder metallurgy. Materials and Design. 2014;56:31-36. 18. Børvik T, Hopperstad OS, Berstad T, Langseth M. A computational model of viscoplasticity and ductile damage for impact and penetration. European Journal of Mechanics-A/Solids. 2001;20:685-712. 19. Børvik T, Hopperstad OS, Berstad T, Langseth M. Perforation of 12 mm thick steel plates by 20 mm diameter projectiles with flat, hemispherical and conical noses:part II: numerical simulations. International Journal of Impact Engineering. 2002;27:37-64. 20. Kurtaran H, Buyuk M, Eskandarian A. Ballistic impact simulation of GT model vehicle door using finite element method. Theoretical and Applied Fracture Mechanics. 2003;40:113-121. 21. Chen YL, Chen HC. The Numerical Method as Applied to Impact Resistance Analysis of Ogival Nose Projectiles on 6061-T651 Aluminum Plates. Journal of Mechanics. 2012;28:715-726. 22. Johnson W. Impact Strength of Materials. Edward Arnold, London. 1972.

International Symposium on Green Manufacturing and Applications (ISGMA 2016) PP274
1. Introduction Currently, electronic devices and control devices of high output
have rapidly advanced, the power consumption is increasing. Then, metal matrix composites have been utilized in many fields, such as a heat sink for the power devices of hybrid vehicles, electric vehicles and diode and a tray component for manufacturing and inspection equipment of the semiconductor, liquid crystal panel and solar battery and a slider and table component of machine tool’s stage and liner component of the milling equipment, as a heat dissipation material. These field materials have higher performance than metal. Carbon fiber reinforced copper composite (C/Cu),1 carbon fiber reinforced aluminum-based composite (C/Al),2 carbon fiber reinforced epoxy resin composite (C/Ep)3 and silicon carbide reinforced aluminum matrix composite (SiC/Al)4 was developed for the heat dissipation material. Typically, the fabrication methods of Metal matrix composites (MMCs) have been widely divided into two routes such as high pressure casting as squeeze casting and powder metallurgy. Those fabrication processes enabled densification of MMCs, but some problems as deformation of reinforcement, size or shape limitation and high cost has remained by using high applied pressure.5,6 On the contrary, the low pressure casting named low pressure infiltration (LPI) process has been known as a useful fabrication method for MMCs, facilitating not only complex/large shape but also by cost-saving using extremely low pressure of some kPa level.7,8 However, solder fracture was occurred by mismatch in thermal expansion coefficient to the semiconductor about C/Cu composite. C/Al, C/Ep and SiC/Al composite have low workability. Objective of this study, development of new manufacturing process of VGCF reinforced aluminum composite. Then, The effect of the additional amount rate of mesophase pitch (MP) powder and VGCF on shape of porous preform is observed. Therefore, influence of pore size of VGCF preform by the size of NaCl powder. Microstructure of VGCF preform with and without nickel coating reinforced aluminum composite was observed.
2. Materials and Experimental Procedures
Vapor-grown carbon fiber has a high thermal conductivity, low coefficient of thermal expansion and low cost as the reinforcement (VGCF, Showa Denko KK), mesophase pitch (MP, JFE Chemical Corporation) powder was used for connecting the VGCFs. MP carbon powder is disclosed with 58% by weight QI or more than 75% by weight TI, an optical anisotropy of less than 87% by volume, a start of softening between 623K and an oxygen content
of more than 0.2% by Fig.1 SEM images of VGCFs, MP Powders and NaCl(180~355,600~700μm)
Development of Carbon Nanotube Reinforced Composite by Low Pressure Casting
Yongbum Choi1,#, Zhefeng Xu1, Kazuhiro Matsugi1, Kenjiro Sugio1, Sangpill Lee2, and Gen Sasaki1 1. Graduate school of engineering, Mechanical Science and Engineering, Hiroshima University, Hiroshima 739-8527, Japan
2. Department of Mechanical Engineering, Dong-Eui University, 176, Eomgwang-ro, Busanjin-gu, Busan, 47227, South Korea # Corresponding Author / E-mail: [email protected], TEL: +81-82-424-5752, FAX: +81-82-424-5752
KEYWORDS : Caron nanotube, Porous, Coating, Low pressure casting, Composites
Abstract A new process is proposed to manufacture carbon nanotube (vapor grown carbon fiber, VGCF) reinforced aluminum matrix composite. Porous preform of VGCFs was fabricated by spacer method to used NaCl powder. In order to improve wettability with aluminum, nickel electroless plating was performed to surface of VGCF preform. Then, VGCF porous preform reinforced Aluminum composite was manufactured by a low-pressure casting method of applied pressure, 0.8MPa. The effect of the additional amount rate of mesophase pitch (MP) powder and VGCF on shape of porous preform is observed. Therefore, influence of pore size of VGCF preform by the size of NaCl powder. Microstructure of VGCF preform with and without nickel coating reinforced aluminum composite was observed.
(a)VGCF (b)MP
5μm 10μm
(c)NaCl(180~355μm) (d)NaCl(600~700μm)
500μm 500μm

International Symposium on Green Manufacturing and Applications (ISGMA 2016) weight. Pure aluminum (Al1070) of high thermal conductivity, high workability and light weight was used as the matrix. NaCl (particle size: 180~355, 600~700μm) as a spacer material was used in this experiment. Fig. 1 shows Scanning Electron Microscope (SEM) images of VGCFs, MP powders and NaCl (180~355,600~700μm). VGCF preform is produced by following four steps. First step, VGCF, MP are mixed by a stirrer machine for 10 min and ultrasonic cleaned for 30 min with acetone solution. Second step, NaCl as a spacer material was added to the mixed powders and stirring for 10 min. Third step, mixed powder (VGCFs, MP, NaCl) was put in a graphite mold and pressed at 75MPa. Heat treatment is performed at a temperature 793K, 1 hour.9 Fourth step, sintered compact is immersed in distilled water to remove NaCl. Table 1 shows the weight fraction of MP and VGCF for manufacturing preform. Table 2 shows the weight fraction of NaCl and Powder (MP+VGCF) for manufacturing preform. Nickel electroless plating is performed to preform surface for
achieving wettability improvement with the molten Al.10 Pretreatment of nickel electroless plating, the preform is in acetone solution for 5 min, and ultrasonic cleaned for 300s with distilled water, and dried for 120s. And then it is in 10% HNO3 solution, Sn solution and Pd solution for 5 min, and ultrasonic cleaned for 300s with distilled water, and dried for 120s carry out for pretreatment. Nickel electroless plating of VGCF preform carry out at a temperature 293K for 300s and 353K for 300s in PH6.5. Finally, VGCF/Al composite is manufacturing at applied pressure of 0.8MPa and molten aluminum of temperature of 973K in Argon gas.
Table 1 Weight fraction of MP and VGCF for manufacturing preform
NaCl:Powder(MP+VGCF) (vol.%) MP:VGCF (vol.%) 7 : 3 10 : 0
7 : 3 5 : 5 3 : 7
Table 2 Weight fraction of NaCl and Powder (MP+VGCF) for manufacturing preform
Preform NaCl : Powder(MP+VGCF) (vol.%)
MP:VGCF (vol.%)
(a) 7 : 3 7:3 (b) 8 : 2
(c) 9 : 1
3. Results and Discussions 3.1 Manufacturing of VGCF preform Fig. 2 shows SEM images of frame of preform of additional amount
rate of MP:VGCF is 10:0, 7:3, 5:5 and 3:7 (vol.%). In the case of only MP powder (Fig. 2 (a)), MP carbon powders was sintering at 793K because of softening temperature is 623K which can be used for binding of VGCF and VGCF fiber. In the case of additional amount rate of MP:VGCF = 7:3 vol.%, cross-linked structure of VGCF and MP was observed. In the case of additional amount rate of MP:VGCF=5:5, 3:7 Vvol.%, cracks and deformations were observed on surface of preform. Because uncross-linked VGCFs occurred by decreasing the addition amount of MP carbon powder. Fig. 3 shows SEM images of preform with NaCl:Powder=7:3 vol.%, MP : VGCF = 7:3 vol.% condition. Defects and cracks in the preform was not observed. From Fig. 3(b), the pores of the square shape and 180~355μm size were observed. It is the same size and shape of NaCl powder of spacer material. The result of the enlarged portion of a
Fig. 2 SEM images of preform after spacer method, MP:VGCF is 10:0, 7:3, 5:5 and 3:7 (vol.%) frame of preform is shown in Fig. 3(c) and (d). cross-linked structure of VGCF and MP was observed. This cross-linked structure can be expected to improve of flowing of heat. Fig. 3 OM and SEM images of preform after spacer method, MP:VGCF is 7:3 (vol.%) In the case of changing the addition amount of NaCl, spacer material
(NaCl:Powder=7:3, 8:2, 9:1 vol.%). After the spacer process, the shape of the preform by increasing the addition amount of the spacer material in NaCl : Powder =8:2,9:1 vol.% collapsed and were not be maintained. As this cause, volume ratio of MP carbon power and VGCF decreased between the pores and the pores by increasing the addition of spacer material, the frame of preform was thinner and the shape of preform was weak. Thus the optimal condition for the preform which is suitable for the composite was NaCl:Powder=7:3 vol.%, MP: VGCF=7:3 vol.% in this experiment.
3.2 Nickel electroless plating of VGCF preform
Fig. 3 OM and SEM images of preform after spacer method, MP:VGCF is 7:3 (vol.%)
MP
(a)MP:VGCF=10:0
5μmVGCF
MP
5μm
VGCF
5μmMP
VGCF
MP5μm
(b)MP:VGCF=7:3
(c)MP:VGCF=5:5 (d)MP:VGCF=3:7Fracture
1 μm100nm
VGCFMP
500μm
(b)
Pore
1mm
(a)OM
(c)(d)
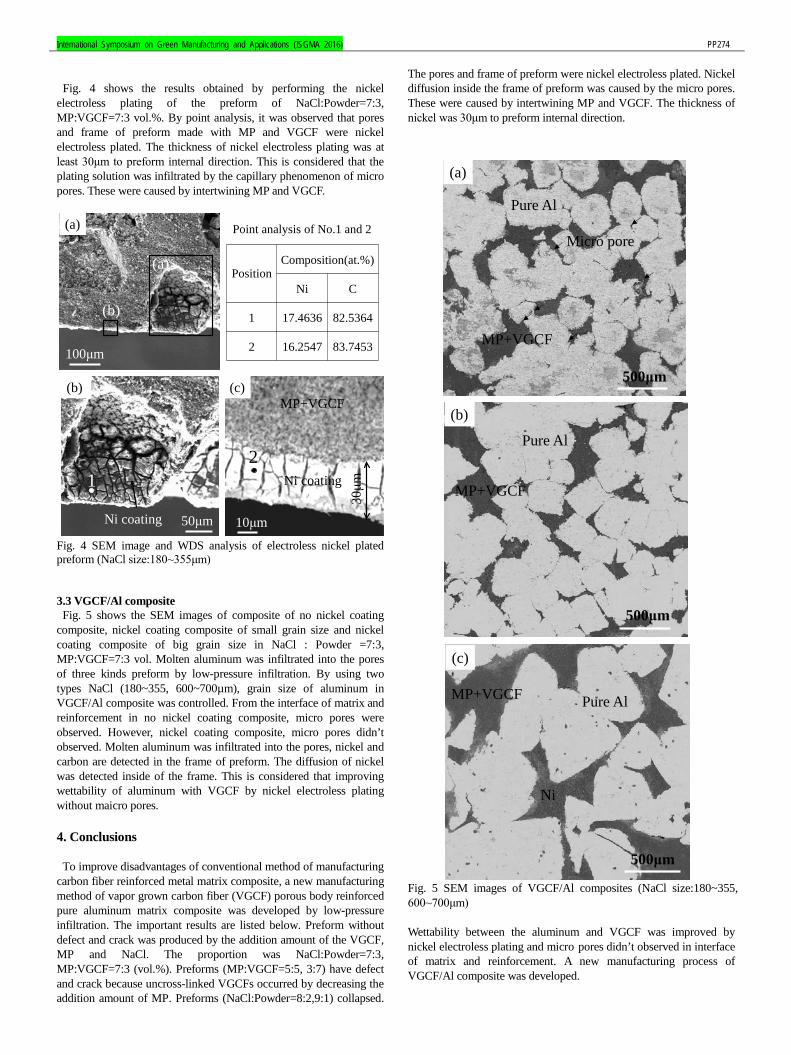
International Symposium on Green Manufacturing and Applications (ISGMA 2016) PP274 Fig. 4 shows the results obtained by performing the nickel
electroless plating of the preform of NaCl:Powder=7:3, MP:VGCF=7:3 vol.%. By point analysis, it was observed that pores and frame of preform made with MP and VGCF were nickel electroless plated. The thickness of nickel electroless plating was at least 30μm to preform internal direction. This is considered that the plating solution was infiltrated by the capillary phenomenon of micro pores. These were caused by intertwining MP and VGCF.
Fig. 4 SEM image and WDS analysis of electroless nickel plated preform (NaCl size:180~355μm) 3.3 VGCF/Al composite Fig. 5 shows the SEM images of composite of no nickel coating
composite, nickel coating composite of small grain size and nickel coating composite of big grain size in NaCl : Powder =7:3, MP:VGCF=7:3 vol. Molten aluminum was infiltrated into the pores of three kinds preform by low-pressure infiltration. By using two types NaCl (180~355, 600~700µm), grain size of aluminum in VGCF/Al composite was controlled. From the interface of matrix and reinforcement in no nickel coating composite, micro pores were observed. However, nickel coating composite, micro pores didn’t observed. Molten aluminum was infiltrated into the pores, nickel and carbon are detected in the frame of preform. The diffusion of nickel was detected inside of the frame. This is considered that improving wettability of aluminum with VGCF by nickel electroless plating without maicro pores.
4. Conclusions To improve disadvantages of conventional method of manufacturing
carbon fiber reinforced metal matrix composite, a new manufacturing method of vapor grown carbon fiber (VGCF) porous body reinforced pure aluminum matrix composite was developed by low-pressure infiltration. The important results are listed below. Preform without defect and crack was produced by the addition amount of the VGCF, MP and NaCl. The proportion was NaCl:Powder=7:3, MP:VGCF=7:3 (vol.%). Preforms (MP:VGCF=5:5, 3:7) have defect and crack because uncross-linked VGCFs occurred by decreasing the addition amount of MP. Preforms (NaCl:Powder=8:2,9:1) collapsed.
The pores and frame of preform were nickel electroless plated. Nickel diffusion inside the frame of preform was caused by the micro pores. These were caused by intertwining MP and VGCF. The thickness of nickel was 30μm to preform internal direction.
Fig. 5 SEM images of VGCF/Al composites (NaCl size:180~355,600~700μm) Wettability between the aluminum and VGCF was improved by nickel electroless plating and micro pores didn’t observed in interface of matrix and reinforcement. A new manufacturing process of VGCF/Al composite was developed.
(a)
(b)
(b)
Ni coating
Ni coating
MP+VGCF
30μm
(a)
1
100μm
50μm 10μm
(c)
PositionComposition(at.%)
Ni C
1 17.4636 82.5364
2 16.2547 83.7453
2
Point analysis of No.1 and 2
MP+VGCF
Pure Al
(a)
500μm
Micro pore
MP+VGCF
Pure Al
(b)
500μm
500μm
MP+VGCF Pure Al
(c)
Ni

International Symposium on Green Manufacturing and Applications (ISGMA 2016)
ACKNOWLEDGEMENT
This work was supported by JSPS KAKENHI Grant Number15K05678 REFERENCES 1. Yiping, T., Hezhou, L., Haijun, Z., Lei, L., Yating, W., “Friction
and wear properties of copper matrix composites reinforced with short carbon fibers,” Mater. Design., Vol. 29, Issue 1, pp. 257-261, 2008.
2. MoonHee, L., Yyongbum, C., Kenjiro, S., Kazuhiro, M., Gen, S., “Effect of aluminum carbide on thermal conductivity of the unidirectional CF/Al composites fabricated by low pressure infiltration process,” Compos. Sci. and Technol., Vol. 97, pp. 1-5, 2014.
3. Weidong, N., Jie, L., Wenbin, L., Jun, W., Tao, T., “Decomposition of waste carbon fiber reinforced epoxy resin composites in molten potassium hydroxide,” Polym. Degrad. Stabil., Vol. 111, pp. 247-256, 2015.
4. Shisheng, L., Yishi, S., Qiubao, O., Di, Z., “In-situ carbon nanotube-covered silicon carbide particle reinforced aluminum matrix composites fabricated by powder metallurgy,” Mater. Letters, Vol. 167, pp.118-121, 2016.
5. Clyne, T. W., Mason, J. F., “The squeeze infiltration process for fabrication of metal matrix composites,” Metall. Trans. A, 18, pp. 1519-1530, 1987.
6. Carren˜o-Morelli, E., Cutard, T., Schaller, R., Bonjour, C., “Processing and characterization of aluminum based MMCs produced by gas pressure infiltration,” Mater. Sci. Eng. A, 251, pp. 48-57, 1998.
7. Yongbum, C., Gen, S., Kazuhiro, M., Osamu, Y., “Effect of ultrasonic vibration on infiltration of nickel porous preform with molten aluminum alloy,” Mater. Trans., Vol.46, No.10, pp.2156-2158, 2005.
8. Yongbum, C., Kazuhiro, M., Gen, S., Kazushi, A., Osamu, Y., “Analysis of manufacturing process for metal fiber reinforced aluminum alloy composite fabricated by low pressure casting,” Mater. Trans., Vol. 47, No.4 1227-1231, 2006.
9. Okyoung, L., Moonhee, L., Yongbum, C., Kenjiro, S., Kazuhiro, M., Gen, S., “Microstructure Observation of Preform for High Performance VGCF / Aluminum Composites”, Mater. Trans., 55(5): pp.827-830, 2014
10. Esmaeil, H., Mehdi, D., Alireza, M. “The Study of electroless coating of nickel on carbon fibers,” Iranian J. of Mater. Sci. & Eng., Vol. 1, No. 1, pp.43-48, 2004.